Abstract
The number of investigations relevant to the study of geomagnetic activity, solar events, and cosmic rays, i.e., space weather phenomena, and their impact on human health has increased dramatically over the past few years. Numerous studies examine the reaction of the cardiovascular, nervous, and other functional systems to variations observed in geospace. These studies examine the behavior of human physiological parameters not only during different levels of activity of the Sun and in the interplanetary space (from no activity to remarkably intense activity) but also through geomagnetic activity storms and Forbush decreases. Here, individuals from the Hippocratio General Hospital in Athens, the cardiology clinics of Nikaia General Hospital in Piraeus, and the Heraklion University Hospital in Crete, Greece, were assessed during the time period from 2011 until 2018. The heart rate of the individuals was recorded every hour via the Holter electrocardiogram method. Data were analyzed using the analysis of variance (ANOVA) and the method of superimposed epochs. The investigation covers not only the ascending but also the descending phase of the solar cycle 24 (lasting until 2019 and with its maximum in the year 2014).
1. Introduction
Space weather refers to any phenomena observed on the Sun, in the solar wind, within the magnetosphere, or in the ionosphere and thermosphere of the Earth that can affect the performance and credibility of technological systems located both in space and on the ground and can threaten human health and/or life [1,2,3,4,5].
Over the last decades, the potential impact of the activity of the Sun, geospace, and cosmic rays on human health has been widely discussed. Initially, the possibility of sun–geophysical changes affecting the state of the human body had encountered skepticism from the scientific community [6,7,8]. However, since human populations’ constant interaction with and influence by their environment has grown larger, and the need to thoroughly study space weather phenomena in relation to variations in the human physiological state has become imperative, many investigations have been conducted with irrefutable results [9,10,11,12,13,14,15,16].
In the context of the above, the Athens Cosmic Ray Group of the National and Kapodistrian University of Athens (NKUA) recognized early on the importance of this multi-disciplinary heliobiological and biometeorological research and consequently focused on implementing scientific studies which could shed light on this contemporary field of science. That, which started as a local investigation, soon developed into an international collaboration with scientific teams from different countries and similar research interests and, finally, has resulted in a significant number of projects and related scientific publications. In the following, all the heliobiological projects that the Athens Cosmic Ray Group was involved in are presented and sufficiently described.
In [17], the diurnal fluctuations of cosmic ray intensity (CRI), recorded by the Athens Neutron Monitor Station of the NKUA, were analyzed in relation to the mean heart rate (HR) variations (on a daily and hourly basis) of individuals that had no symptoms and were not admitted to the hospital. Heart rate was measured using a Holter electrocardiogram. The data were obtained from the cardiological clinic of the KAT Hospital located in Athens and included the period from 4 December 2006 to 24 December 2006, i.e., a period of major solar events and intense geomagnetic activity (GMA). During this period, successive Forbush decreases were recorded starting from 6 December; moreover, a ground level enhancement of CRI, as a result of a strong solar proton event, was also registered on 13 December. Furthermore, on 15 December, the Athens Neutron Monitor Station registered an abrupt CRI decrease with 4% amplitude, along with a geomagnetic storm. The study concluded that HR and CRI fluctuations had a positive correlation on days with no geomagnetic activity. Additionally, CRI and HR decreased to a minimum value and their changes were also correlated during extreme fluctuations of cosmic rays, such as Forbush decreases and relativistic proton events caused by intense events taking place on the Sun.
In [18,19], digitally registered medical data of healthy individuals, obtained from the Laboratory of Heliobiology in the Medical Centre INAM (Baku, Azerbaijan), were analyzed during various intensities of cosmic radiation and GMA. A total of 1673 HR values (i.e., daily data) and a time series of beat-to-beat HR intervals (RR intervals) were acquired from 15 July 2006 until 31 March 2008. This time period covered extreme events of cosmic rays and GMA, i.e., December 2006. An estimation of the statistical significance of the effects of GMA intensities and CRI fluctuations on HR and RR intervals was presented. These studies concluded that intense geomagnetic activity fluctuations and CRI variations were related to HR increase and notable RR interval variation. On the contrary, HR dynamics were not influenced by minor or minimal CRI fluctuations. Additionally, an increase in HR values was observed on the days prior to, during, and after major geomagnetic storms and on the days prior to and after CRI decreases.
The exposure of air crews to cosmic rays and their impact on the biological state of the human body is a contemporary field of research. In another investigation, the Athens Cosmic Ray Group cooperated with scientific groups from Slovakia and Bulgaria and analyzed the cardiovascular functionality of Slovak aviators in relation to geophysical variations. A total of 4018 aviators (men in good health aged 18 to 60 years old) were medically monitored from 1 January 1994 until 31 December 2002. As a result, daily mean arterial diastolic and systolic blood pressure values were studied in relation to daily fluctuations in GMA (expressed through the Dst and Ap geomagnetic indices) and daily variations in CRI. CRI was provided by the Neutron Monitor Station on Lomnicky Stit. In order to examine the statistical significance (p-values) of the impact of CRI variations on arterial blood pressure on the day of the events but also on the days prior to and after these events, the statistical method of analysis of variance (ANOVA) and the method of superimposed epochs were applied, respectively. The investigation concluded that variations in cosmic radiation may have an effect on diastolic and systolic blood pressure, and geomagnetic changes are connected to variations in human physiological parameters [19,20,21].
In another study conducted by the University of Athens in collaboration with the National Astrophysical Observatory in Tbilisi, Georgia, the possible relationship between geomagnetic and cosmic ray activity and the occurrence of various kinds of cardiac arrhythmias was examined [22]. Data was collected regarding 1902 patients in Tbilisi, Georgia and include the years 1983–1992. In order to investigate the potential impact of various parameters related to solar, geomagnetic, and cosmic ray activity on several kinds of arrhythmias, the smoothing method and the Pearson r-coefficient were used. The analysis was performed for two separate time periods in order to examine the effect of the solar magnetic field’s polarity reversal, recorded in the years 1989–1990. Consequently, both the aforementioned physical parameters as well as the various kinds of arrhythmias behaved differently for the two time periods. Moreover, the sign of the correlation coefficient describing the relationship between the occurrence of arrhythmias and the geophysical parameters was also affected by alterations in the solar magnetic field’s polarity sign. Furthermore, several kinds of arrhythmias presented a primary and secondary maximum, as did the solar parameters during the solar cycle 22, with a delay of almost 5 months [19].
In [19,23] the number of individuals who developed cardiac arrhythmias (particularly the ones diagnosed with atrial fibrillation) was investigated in relation to the following: first, the sunspots number Rz, solar flares, and coronal mass ejections (i.e., solar activity); and second, the fluctuations in cosmic rays. In total, 4741 patients aged 15 to 98 years old with cardiac arrhythmias, 2548 of whom were diagnosed with atrial fibrillation, were assessed. The data were collected from the second cardiological clinic of the General Hospital of Nikaia, ‘St. Panteleimon’, in Piraeus, Greece and cover solar cycle 23 (spanning from 1997 until 2009).
In [24], space weather phenomena and their possible effect on HR variations were studied. Initially, hourly HR data, recorded by a Holter electrocardiogram, from 482 individuals (July 2011–April 2013) were analyzed. The data were provided by the Hippocratio General Hospital in Athens, the cardiology clinics of Nikaia General Hospital in Piraeus, and the Heraklion University Hospital in Crete, Greece. Moreover, CRI data and geomagnetic Dst index data were derived from the Athens Neutron Monitor Station of the NKUA and the Kyoto Observatory, respectively. The data were processed using the analysis of variance (ANOVA) and the multiple linear regression analysis. It was concluded that space weather variations may be related to HR variations, since the analysis showed a statistically significant effect of cosmic radiation as well as GMA on HR.
In continuation of the above-mentioned investigation, more data were included in the analysis and new results were presented in [25]. In this second stage of the analysis, HR data from 1318 individuals were evaluated from 2011 to 2018. Once again, the data were provided by the same three hospitals as above. In this analysis, it was argued that HR variations were connected to environmental physical activity and, more precisely, both cosmic ray variations and GMA events affect HR with statistical significance. It was revealed that the mean HR had a maximum value during the period with strong geomagnetic activity and the highest level of CRI variation. Moreover, data were also analyzed on a daily basis separately for every volunteer. Daily mean HR variations were studied in relation to daily CRI variations (CRI has a minimum and a maximum value around 6 a.m. and 6 p.m., respectively).
Finally, this work describes the third and most complete stage of the aforementioned study. Heart rate data (1353 measurements) from the Hippocratio General Hospital in Athens, the cardiology clinics of Nikaia General Hospital in Piraeus, and the Heraklion University Hospital in Crete, Greece, were examined for the time period of April 2011–January 2018. The hourly mean HR of the individuals was obtained using a Holter electrocardiogram. The two methods used to analyze the data were the analysis of variance (ANOVA) and the superimposed epochs method. The investigation consisted of two time intervals (i.e., the ascending and the descending phases of the solar cycle 24, which lasted until 2019 and presented a maximum in the year 2014).
2. Data and Methods
2.1. Medical Data
In this study, the HR data were collected from the Hippocratio General Hospital in Athens, the cardiology clinics of Nikaia General Hospital in Piraeus and the Heraklion University Hospital in Crete, Greece. The time period under consideration was April 2011 to January 2018. This time period includes both the ascending phase (December 2008–April 2014) and the descending phase (May 2014–December 2019) of solar cycle 24. A total of 1353 individuals with mean HR 71.3 ± 0.4 bpm were examined. The database included 534 females (39%) with mean HR 72.5 ± 0.8 bpm and 687 males (51%) with mean HR 70.3 ± 0.6 bpm. For 132 individuals (10%), data concerning their gender were not obtained. The Holter electrocardiogram method was used for obtaining the hourly mean HR of the group of individuals (for more details on the Holter method see [25]).
2.2. Geomagnetic Data
The impact of GMA on HR data was examined by using two geomagnetic indices, i.e., Dst and Ap. Concerning the Dst index, the data were obtained from the World Data Centre for Geomagnetism, Kyoto, https://wdc.kugi.kyoto-u.ac.jp/dstae/index.html (accessed on 21 January 2024).
Table 1 shows the four levels (I0, I, II, III) the GMA was divided into, in accordance with the average daily Dst index values. Moreover, the corresponding number of measurements for each GMA level is also displayed. It should be noted that for the time period under investigation, many days were characterized by a positive Dst index, i.e., minor GMA. Consequently, Level I0 was established. It is important to include these very low levels of GMA in the study, since it is mentioned that minor or even no variations in the geomagnetic field can have consequences for the physiological state of human health [26,27].

Table 1.
Dst and Ap index levels and the number of measurements.
The same classification (Levels: I0, I, II, III, IV) was performed for the Ap index, as shown in Table 1. These data were obtained from the German Research Center for Geosciences, GFZ https://www.gfz-potsdam.de/en/section/geomagnetism/data-products-services/geomagnetic-kp-index (accessed on 21 January 2024).
The number of measurements for the ascending phase of solar cycle 24 was 19 for Dst index level III and no measurements for Dst index level IV and for the descending phase of solar cycle 24 the number of measurements was 31 for Dst index level III and 3 for Dst index level IV.
Moreover, for the Ap index, the number of measurements for the ascending phase of solar cycle 24 was 19 for Ap index level III and 2 for Ap index level IV and for the descending phase of solar cycle 24 the measurements were 47 and 12 respectively.
2.3. Cosmic Ray Intensity Data
Furthermore, the hourly pressure- and efficiency-corrected data of the hadronic component of CRI were derived from the Athens Neutron Monitor Station (A.Ne.Mo.S.) of the Faculty of Physics of the NKUA. This is a modern station (Super 6NM-64) which provides real-time data of excellent quality through the internet (http://cosray.phys.uoa.gr, accessed on 21 January 2024) and has been operational since November 2000. It is characterized by cut-off rigidity of 8.53 GV, altitude 260 m above sea level, and geographical coordinates 37°58′ N, 23°47′ E. The provided data have a statistical error of less than 0.30% on hourly data and time resolution of 1 h, 1 min, and 1 s, which is a unique across datasets worldwide [28,29]. Moreover, these data are moved every 1 min to the European high-resolution Neutron Monitor Database—NMDB (http://www.nmdb.eu, accessed on 21 January 2024).
For normalizing the CRI data, the following function was used:, where is the observed CRI value and is the mean value calculated for the time period under examination. CRI variations ranged from −6% decreases up to +3% increases. CRI variations along with the corresponding number of days are presented in Table 2. It should be mentioned at this point that in cases such as this one when there is a short range of CRI variations (e.g., from −6% to +3%), these variations are not grouped into levels. Instead, the values are rounded up and organized with a step of 1% (same analysis in [18]). In cases where the CRI variations cover a wider range, they are grouped into different levels [21].

Table 2.
CRI % variations and the corresponding number of measurements.
2.4. Statistical Method
The analysis of variance statistical method (ANOVA) [30] and the statistical package STATISTICA (ver. 6, StatSoft Inc., Tulsa, OK, USA, 2001) were used in order to establish the statistical significance levels (p-values) of the relationships between Dst and Ap index levels and cosmic ray fluctuations and HR. Moreover, ANOVA along with the method of superimposed epochs were used to study the impact of Dst and Ap index levels and cosmic ray fluctuations on HR up to three days prior to and three days after particular events (either geomagnetic storms or CRI variations).
In the ANOVA method, the Dst level, the Ap level, and the percentage decrease in CRI (CRI, %) were regarded as independent variables, i.e., ‘factors’, whereas the physiological parameter HR was considered a dependent variable. The ANOVA method tests the effect of the factors on the dependent variable under analysis. Each time it is assumed that the mean values of HR are the same for every level of the independent variables, e.g., Dst level.
The used data analysis software system STATISTICA sets the level for statistical significance at p < 0.05, and the conclusions were derived using this value [18,20,21].
Consequently, the null hypothesis is correct for p-level greater than 0.05. On the other hand, if p is less than 0.05, then the alternative hypothesis is correct; therefore, the null hypothesis is not accepted. In other words, the parameter under analysis, in this case HR, was affected by the factor’s variations (e.g., Dst level).
At this point it should be mentioned that before applying the ANOVA method, the Shapiro–Wilk test of normality that assesses whether a sample is likely to originate from a normal distribution was performed for the data under investigation. This test did not show evidence of non-normality of the data (W = 0.981303), which means that they follow a more or less normal distribution.
Furthermore, the impact of every factor (e.g., Dst level; Ap level; CRI, %) on the parameter (i.e., HR) was examined not only during the event, but additionally three days prior to (−) and three days after (+) the event. Thus, the effects not only during but also prior to or after a geomagnetic disturbance or CRI variation were investigated. Table 3 presents the p-level values from the ANOVA analysis for this study (there is a * in all cases with p < 0.05).

Table 3.
Significance levels (p-values) of the potential effect of GMA and CRI on HR on the days before (−), during (0) and after (+) GMA and CRI variations.
3. Results
The time period under investigation (April 2011–December 2018) covers both the ascending phase (December 2008–April 2014) of solar cycle 24 and the descending phase (May 2014–December 2019) of the same solar cycle. Its maximum was reached in April 2014. Consequently, it was considered appropriate to carry out research first for the complete time interval under investigation and second for the ascending and the descending phases of the solar cycle separately. Herein, the results concerning this analysis are presented.
During the considered period, major space weather events were recorded on several days. Figure 1 presents the Dst index and CRI variations for the time interval under investigation. On the other hand, the monthly distribution of the solar activity (sunspot number) and the number of measurements under examination for the time period from April 2011 to January 2018 are shown in Figure 2.
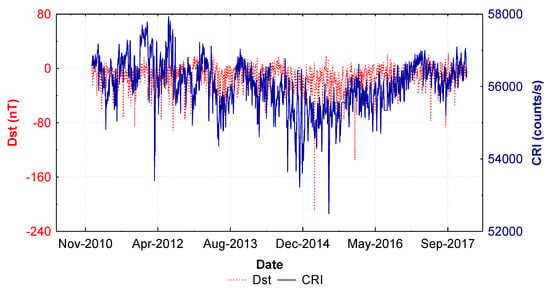
Figure 1.
Daily Dst–index (nT) variations (red line) and daily CRI variations (blue line) during the time period from April 2011 to January 2018.
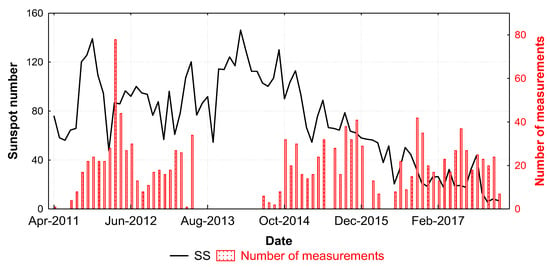
Figure 2.
Monthly distribution of the sunspot number (black line) and the number of measurements (red bars) during the time period from April 2011 to January 2018.
The results from the analysis include a significant number of figures. However, due to limited space not all of them are presented in this paper. And even though all of the figures were used for reaching a conclusion, only a selection of the most descriptive and typical ones is displayed below.
Each HR measurement is related to the corresponding Dst index value, Ap index value, and CRI variation for the exact date of the measurement. Moreover, each HR measurement is also related to the corresponding Dst index level and Ap index level for the exact date of the measurement. This is the day of the geomagnetic storm or the CRI event according to the classifications presented in Table 1 and Table 2. Furthermore, using the superimposed method, the effect of Dst level, Ap level and CRI, % on HR is examined not only during the event, but additionally three days prior to (−) and three days after (+) the event.
The significance levels (p) of the impact of GMA level and the percentage of CRI variations on HR were obtained through an ANOVA. This analysis was performed for the days prior to (−3rd, −2nd, and −1st day), during (0), and after (+1st, +2nd, and +3rd day) events of geomagnetic and cosmic ray activity. Table 3 shows p-values for the potential effects of CRI and GMA on HR for the days prior to, during, and after CRI and GMA fluctuations for all data, for the ascending phase, and for the descending phase. For all data, no statistically significant results were obtained for CRI variations. However, for GMA and the geomagnetic indices Dst and Ap, the results were statistically significant for the −1st, −1st, and +2nd days, respectively.
Figure 3 shows an example of HR dynamics in relation to GMA through the Dst index (Figure 3a) and Ap index (Figure 3b) levels (as they were divided in Table 2) and CRI (Figure 3c) variations (as they were divided in Table 3). As shown in Figure 3a,b, intense GMA (i.e., increase and decrease in Ap index values and Dst index values, respectively) was accompanied by an increase in mean HR. Moreover, for larger CRI decreases (−6% decreases), HR values were higher. However, the results presented in Table 3 show that these effects were not statistically significant (p > 0.05).
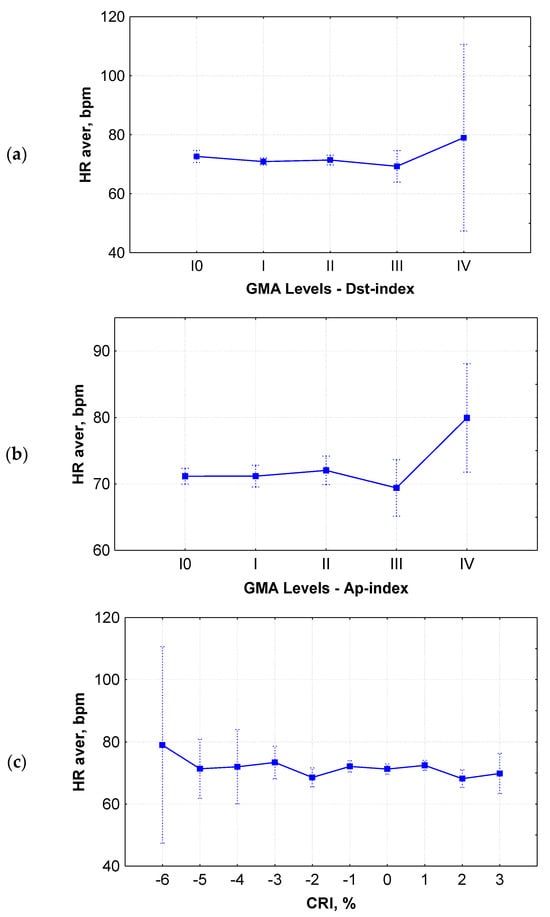
Figure 3.
HR variations for different levels of GMA, estimated by Dst–index (a), Ap–index (b), and CRI variations (c). The vertical bars denote a 0.95 confidence interval.
The study of the variations in HR prior to (−), during (0), and after (+) fluctuations in GMA and CRI of various intensities concluded that high levels of GMA (Figure 4a,b) and strong CRI decreases (Figure 4c) are related to significant HR variations and peak values. Figure 4 is plotted so as to reveal the behavior of HR in relation to time (during the evolution of an event: initial phase, main phase, and recovery phase). Every trend, even a minor one, is important. Either small variations or peak values (maximum or minimum) that are observed during these three different phases are important for understanding the response of HR to physical events.
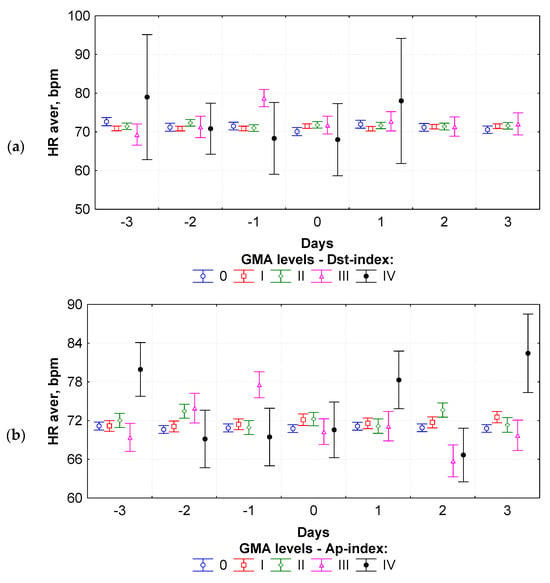
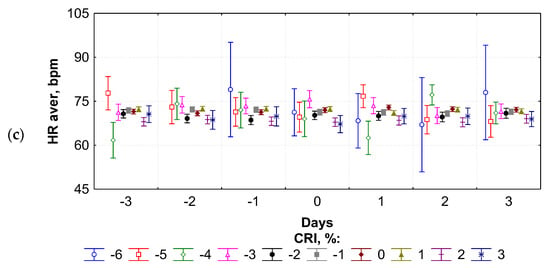
Figure 4.
HR variations for different levels of GMA, estimated by Dst–index (a), Ap–index (b), and CRI variations (c) for the days before (−), during (0) and after (+) the corresponding variations.
Notably, as can be seen in Figure 4a, for Dst index level IV, HR decreased from the −3rd day to day 0 and increased until the +1st day after major geomagnetic storms. For level III of the Dst index classification, HR reached its maximum value on the −1st day before a moderate storm occurred. For levels I0, I, and II of the GMA, according to the Dst index classification, no important fluctuations were recorded. Concerning the Ap index, for the highest registered GMA level (level IV), there were peak increases in HR on the −3rd, +1st, and +3rd days and a decrease on the +2nd day (Figure 4b). For level III of the Ap index classification, HR decreased from the −1st day until the +2nd day after a moderate geomagnetic storm. For low and very low GMA, as estimated by the Ap index (levels I0, I, II), HR did not show any significant variation on any of the days. Furthermore, as presented in Figure 4c, HR varies significantly during strong CRI decreases (from −6 to −3%). For CRI decreases of −6% and −5%, peak increases in the mean HR on some of the days prior to or after the CRI decrease were noticed, while for a CRI decrease of −4%, HR reached a minimum value on the −3rd day before the event, and for a CRI decrease of −3%, HR maximized on day 0.
3.1. Ascending Phase of Solar Cycle 24
A total of 482 individuals were examined from April 2011 until April 2014, of whom 276 (57%) were men, 198 (41%) were women, and 8 (2%) appeared with no information about their gender. The mean HR value for the men during this period was 68.6 ± 0.7 bpm, while the mean HR value for the women was 71.1 ± 0.9 bpm. At this point it should be mentioned that the initial mean HR values that were entered in the database present small differences between men and women (as it was noticed for all data, the ascending phase, and the descending phase that follows). Previous studies [17,31,32] have shown that HR exhibits different behavior between men and women and in connection to GMA and CRI variations.
Once again, ANOVA was used for obtaining the significance levels (p) of the effect of GMA level and the percentage of CRI variations on HR for the days prior to (−3rd, −2nd, and −1st day), during (0), and after (+1st, +2nd, and +3rd day) fluctuations in geomagnetic or cosmic ray activity. Table 3 shows p-values for the potential effect of CRI and GMA on HR for the days prior to, during, and after CRI and GMA variations for the ascending phase of solar cycle 24. It should be mentioned that for the ascending phase of the solar cycle there are more statistically significant results in comparison to all data. More precisely, p-values were less than 0.05 for the Dst and Ap indices on the −1st day and for CRI on day 0 and the +1st and +2nd days, which means that the variations in the GMA and CRI had an effect on the parameter of HR.
HR dynamics in relation to GMA through Dst index and Ap index levels and CRI variations are presented in Figure 5a–c, respectively. Once more, the maximum value of the parameter HR was noted for the highest GMA levels (i.e., Dst and Ap index level III). Furthermore, HR value was higher for largest CRI decreases (−5%).
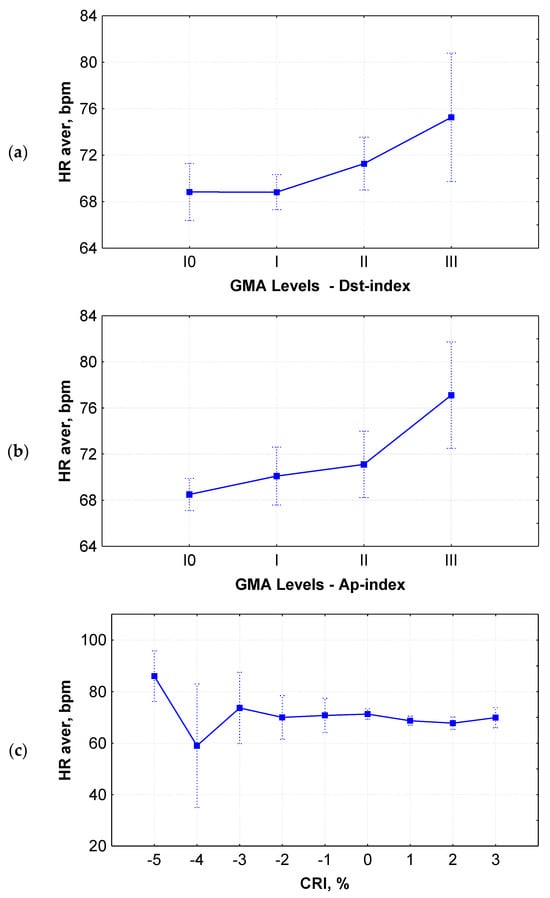
Figure 5.
HR variations for different levels of GMA, estimated by Dst–index (a), Ap–index (b), and CRI variations (c). The vertical bars denote a 0.95 confidence interval.
HR variations were analyzed for the time period prior to (−), during (0), and after (+) geomagnetic storms of various intensities and CRI variations. It is concluded that major geomagnetic storms (Figure 6a,b) and strong CRI decreases (Figure 6c) are related to HR variations and peak values. Furthermore, for the highest level of GMA, i.e., level III according to the Dst index classification, HR increased from the −3rd day to the −1st day and decreased until the +3rd day after moderate geomagnetic storms (Figure 6a). No significant variations were registered for levels I0, I, and II (lower GMA). It should be noted that no measurements were included for Dst index level IV during the ascending phase of solar cycle 24. That is why the line corresponding to Dst index level IV is absent. Regarding the Ap index, for the highest registered GMA level (level IV), maximum and minimum values of HR were recorded on the −2nd and +3rd days, respectively (Figure 6b). HR decreased from the maximum value on the −1st day to the minimum value on the +2nd day after a moderate geomagnetic storm (i.e., level III according to the Ap index classification). As before, for low and very low GMA (levels I0, I, II), HR presented no important variation on any of the days. Finally, for CRI decreases of amplitude −5% and −4%, HR increased on the +1st and +2nd days, respectively, whereas for a moderate CRI decrease of −3%, peak values were recorded on the days before the event. Another interesting behavior is for a CRI decrease of −2%, where recorded HR peak values on the days before and during the CRI decrease. For 0% CRI variations or CRI increases, HR did not vary significantly (Figure 6c).
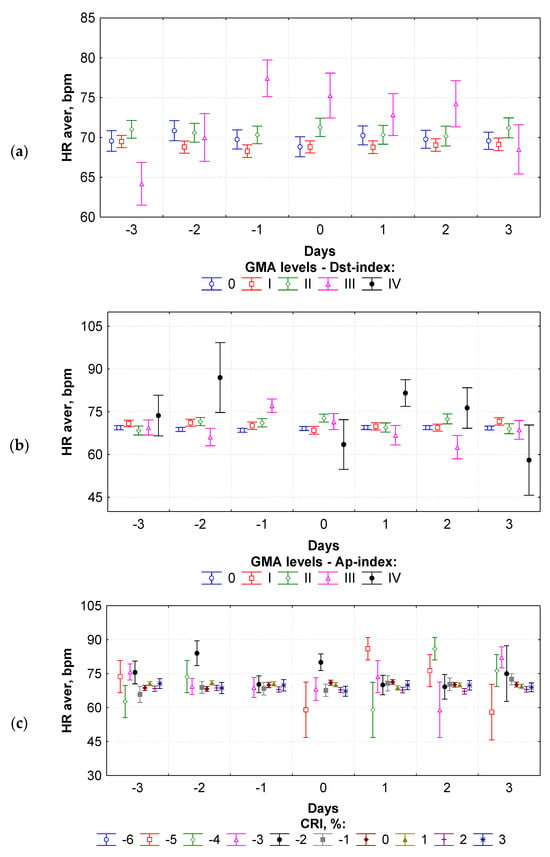
Figure 6.
HR variations for different levels of GMA, estimated by Dst–index (a), Ap–index (b), and CRI variations (c) for the days before (−), during (0), and after (+) the corresponding variations.
3.2. Descending Phase of Solar Cycle 24
In total, 871 individuals were examined from May 2014 until January 2018. According to the recordings, 411 (47%) were men, 336 (39%) were women, and 124 (14%) had no information available. The mean HR value for the men during this period was 71.3 ± 0.8 bpm, while the mean HR value for the women was 73.4 ± 1.1 bpm.
The effects of GMA level and the percentage of CRI variations on HR for the days prior to (−3rd, −2nd, and −1st day), during (0), and after (+1st, +2nd, and +3rd day) geomagnetic storms and CRI variations during the descending phase of solar cycle 24 were examined using an ANOVA. The significance levels (p) are presented in Table 3. As can be noticed, no statistically significant results for any factor on any day were registered.
Figure 7a–c shows the HR dynamics in relation to GMA through the Dst index and Ap index levels and CRI variations for the descending phase of the solar cycle 24, respectively. In this case, for the Dst index classification (Figure 7a), the HR did not experience any significant peak values (maximum or minimum values). On the other hand, for the highest GMA level, according to the Ap index, the maximum value of the parameter HR was noted (Figure 7b). Finally, for CRI variations (Figure 7c), HR value experienced fluctuations.
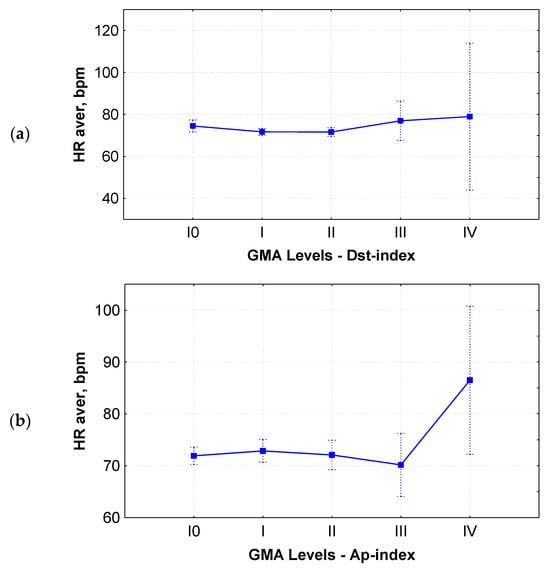
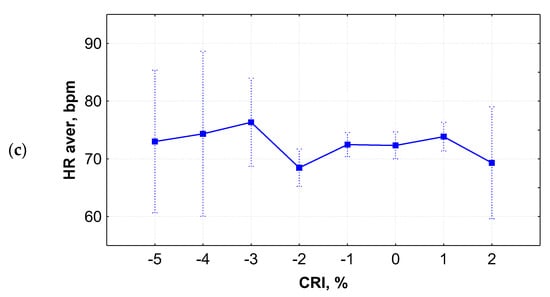
Figure 7.
HR variations for different levels of GMA, estimated by Dst–index (a), Ap–index (b), and CRI variations (c). The vertical bars denote a 0.95 confidence interval.
Figure 8a–c shows the HR variations three days prior to (−), during (0), and after (+) GMA variations of various intensities and CRI decreases and increases. For major geomagnetic storms, i.e., level IV according to the Dst index classification, HR decreased from the −3rd day to day 0 and increased until the +1st day, while for moderate geomagnetic storms, i.e., level III according to the Dst index classification, fluctuations in HR were recorded (Figure 8a). Similar fluctuations in HR were also registered for the highest registered GMA level (levels III and IV) according to the Ap index (Figure 8b). In the case of CRI decreases (−6% to −3%), HR had peak values (increases or decreases) on the days before or after the event (Figure 8c).
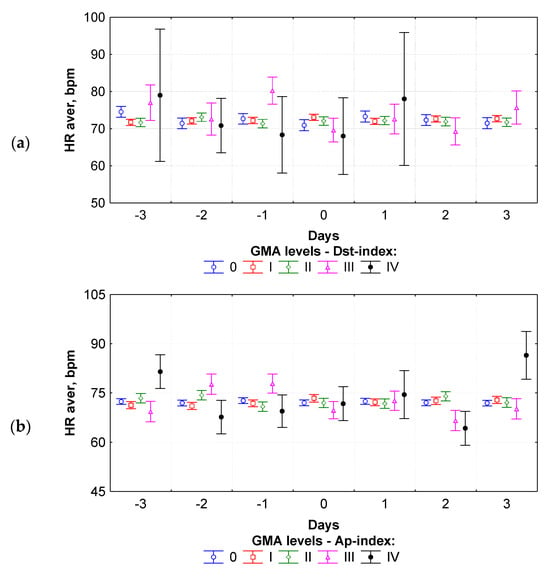
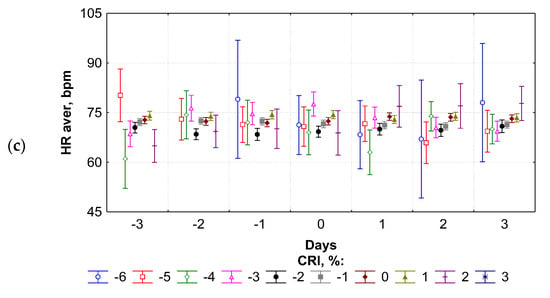
Figure 8.
HR variations for different levels of GMA, estimated by Dst–index (a), Ap–index (b), and CRI variations (c) for the days before (−), during (0), and after (+) the corresponding variations.
4. Conclusions and Discussion
It is known that the human physiological state is influenced by many factors, either endogenous or exogenous [33]. Anxiety, the nature of everyday life, diet, work environment, etc. are factors that could have an impact on the physiological state of human health, affecting parameters such as heart rate, pulse, and arterial blood pressure. Moreover, season, meteorological conditions [34], demographic factors, exposure to radiation or chemical substances, etc. may also disturb the physiological state of human health. Along with the aforementioned factors, a new scientific field that has emerged in the last few decades, i.e., space weather and its phenomena, can also affect human health in a crucial way. As expected, the effect that each of these parameters may have on human health differs, and separating these effects is a difficult problem to solve. That is why [26] proposed direct and indirect indicators, so as to help differentiate the effect of physical activity on human health.
Physiological parameters, such as heart rate, arterial blood pressure, reaction time, etc., that can be obtained either via laboratory diagnostics, tissue investigations, or directly from the volunteer are considered to be direct indicators. On the other hand, epidemiological data that refer to, e.g., the temporal distribution of hospital admission, the frequency of traffic or work accidents, the spatial and temporal distribution of defined events, etc., are defined as indirect indicators. These data mainly refer to a significant number of measurements over a wide period of time that are analyzed in retrospective studies [26].
This study presents the analysis of HR data from 1353 individuals who were assessed in the Hippocratio General Hospital in Athens, the cardiology clinics of Nikaia General Hospital in Piraeus, and the Heraklion University Hospital in Crete, Greece (April 2011–January 2018). The hourly HR of the individuals was measured using the a Holter electrocardiogram. Data were analyzed using the analysis of variance (ANOVA) and the method of superimposed epochs. Both the ascending (December 2008–April 2014) phase and the descending (May 2014–December 2019) phase of the solar cycle 24 were included in the analysis.
The results that have been obtained by this investigation are summarized in the following:
- -
- The highest level of GMA (level IV of the Dst index classification) is related to an increase in the physiological HR parameter. Moreover, the maximum value is observed at level IV (Dst ≤ −100 nT) for all data and the ascending phase, whereas for the descending phase no significant variation between the different levels was noticed.
- -
- The highest level of GMA (level IV of the Ap index classification) is related to an increase in the physiological HR parameter. Furthermore, for Ap ≥ 50, the maximum value of HR is observed. It is interesting to note the different behavior of HR for level III (i.e., HR takes its minimum value for all data and during the descending phase, but not for the ascending phase).
- -
- Strong decreases in cosmic ray activity are related to higher values of the mean HR. These values are observed mostly for decreases from −6% to −3%. More intense fluctuations are recorded during the descending phase.
- -
- The physiological parameters of HR vary on the days prior to (−), during (0), and after (+) major geomagnetic storms and CRI variations. Moreover, these variations are especially noticeable for levels III and IV of the GMA and more intense for decreases of −6% to −3% of the CRI.
- -
- As revealed by the p-values concerning the GMA variations’ impact on HR, for the days before the geomagnetic event, the results are statistically significant, whereas for CRI variations, the statistically significant results concern the day of the event and the days after that.
- -
- As shown by the p-values, the GMA and CRI variations’ impact on HR is more statistically significant for all data and during the ascending phase, while no statistically significant results were obtained for the descending phase.
Geomagnetic disturbances and variations in cosmic ray activity can have an impact on the human physiological state and affect the variability of HR. The results obtained in this study are in accordance with results from similar studies [18,19,25], where it was concluded that intense geomagnetic activity and strong CRI decreases are connected to an HR increase. The novelty of this study is that HR data were analyzed during different phases of the solar cycle 24. The results showed that there is a difference in HR response to geophysical variations during the ascending and the descending phase, i.e., HR is more sensitive to these variations during the ascending phase. A possible reason for that may be that for solar cycle 24, the ascending phase was characterized by more intense solar activity than the descending phase, but this is yet to be examined.
Author Contributions
Data curation, A.T.; Supervision, H.M.; Writing—original draft, M.-C.P.; Writing—review & editing, M.-C.P., S.I., A.T. and H.M. All authors have read and agreed to the published version of the manuscript.
Funding
This research received no external funding.
Institutional Review Board Statement
Not applicable.
Informed Consent Statement
Not applicable.
Data Availability Statement
The medical databases under investigation are not publicly available.
Acknowledgments
The authors would like to thank the Cosmic Ray Group of the National and Kapodistrian University of Athens for kindly providing Athens cosmic ray data and the solar, geomagnetic, and interplanetary data providers. Moreover, special thanks are due to all the medical personnel from the collaborating hospitals and clinics for providing the medical data and to all volunteers who participated in these studies.
Conflicts of Interest
The authors declare that there are no conflicts of interest.
References
- U.S. National Space Weather Programme, The Strategic Plan; FCM-P-30-1995; National Space Weather Program Council: Washington, DC, USA, 1995.
- Schwenn, R. Space weather: The solar perspective. Living Rev. Solar Phys. 2006, 3, 2. [Google Scholar] [CrossRef]
- Babayev, E.S.; Allahverdiyeva, A.A.; Mustafa, F.R.; Shustarev, P.N. An influence of changes of heliogeophysical conditions on biological systems: Some results of studies conducted in the Azerbaijan National Academy of Sciences. Sun Geosph. 2007, 2, 48–52. [Google Scholar]
- Dimitrova, S. Possible heliogeophysical effects on human physiological state. Proc. IAU Symp. 2008, 257, 65–67. [Google Scholar] [CrossRef]
- Dimitrova, S.; Mustafa, F.R.; Stoilova, I.; Babayev, E.S.; Kazimov, E.A. Possible influence of solar extreme events and related geomagnetic disturbances on human cardio-vascular state: Results of collaborative Bulgarian-Azerbaijani studies. Adv. Space Res. 2009, 43, 641–648. [Google Scholar] [CrossRef]
- Feinleib, M.; Rogot, E.; Sturrock, P.A. Solar activity and mortality in the United States. Int. J. Epidemiol. 1975, 4, 227–229. [Google Scholar] [CrossRef] [PubMed]
- Malin, S.R.; Srivastava, B.J. Correlation between heart attacks and magnetic activity—A retraction. Nature 1980, 283, 111. [Google Scholar] [CrossRef] [PubMed]
- Messner, T.; Haggstrom, I.; Sandahl, I.; Lundberg, V. No covariation between the geomagnetic activity and the incidence of acute myocardial infraction in the polar area of northern Sweden. Int. J. Biometeorol. 2002, 46, 90–94. [Google Scholar] [CrossRef] [PubMed]
- Breus, T.K.; Ozheredov, V.A.; Syutkina, E.V.; Rogoza, A.N. Some aspects of the biological effects of space weather. J. Atmos. Sol.-Terr. Phys. 2008, 70, 436–441. [Google Scholar] [CrossRef]
- Diaz-Sandoval, R.; Erdélyi, R.; Maheswaran, R. Could periodic patterns in human mortality be sensitive to solar activity? Ann. Geophys. 2011, 29, 1113–1120. [Google Scholar] [CrossRef]
- Podolská, K. The Impact of Ionospheric and Geomagnetic Changes on Mortality from Diseases of the Circulatory System. J Stroke Cerebrovasc. Dis. 2018, 27, 404. [Google Scholar] [CrossRef]
- Podolská, K. Changes of Circulatory and Nervous Diseases Mortality Patterns during Periods of Exceptional Solar Events. Atmosphere 2021, 12, 203. [Google Scholar] [CrossRef]
- Vieira, C.; Alvares, D.; Blomberg, A.; Schwartz, J.; Coull, B.; Huang, S.; Koutrakis, P. Geomagnetic disturbances driven by solar activity enhance total and cardiovascular mortality risk in 263 U.S. cities. Environ. Health 2019, 18, 83. [Google Scholar] [CrossRef]
- Zenchenko, T.A.; Breus, T.K. The Possible Effect of Space Weather Factors on Various Physiological Systems of the Human Organism. Atmosphere 2021, 12, 346. [Google Scholar] [CrossRef]
- Vaiciulis, V.; Vencloviene, J.; Tamošiunas, A.; Kiznys, D.; Lukšiene, D.; Kranciukaite-Butylkiniene, D.; Radišauskas, R. Associations between Space Weather Events and the Incidence of Acute Myocardial Infarction and Deaths from Ischemic Heart Disease. Atmosphere 2021, 12, 306. [Google Scholar] [CrossRef]
- Vencloviene, J.; Radisauskas, R.; Tamosiunas, A.; Luksiene, D.; Sileikiene, L.; Milinaviciene, E.; Rastenyte, D. Possible Associations between Space Weather and the Incidence of Stroke. Atmosphere 2021, 12, 334. [Google Scholar] [CrossRef]
- Papailiou, M.; Mavromichalaki, H.; Vassilaki, A.; Kelesidis, K.M.; Mertzanos, G.A.; Petropoulos, B. Cosmic ray variations of solar origin in relation to human physiological state during December 2006 solar extreme events. Adv. Space Res. 2009, 43, 523–529. [Google Scholar] [CrossRef]
- Mavromichalaki, H.; Papailiou, M.; Dimitrova, S.; Babayev, E.S.; Loucas, P. Space weather hazards and their impact on human cardio-health state parameters on Earth. Nat. Hazards 2012, 64, 1447–1459. [Google Scholar] [CrossRef]
- Mavromichalaki, H.; Papailiou, M.; Gerontidou, M.; Dimitrova, S.; Kudela, K. Human Physiological Parameters Related to Solar and Geomagnetic Disturbances: Data from Different Geographic Regions. Atmosphere 2021, 12, 1613. [Google Scholar] [CrossRef]
- Papailiou, M.; Mavromichalaki, H.; Kudela, K.; Stetiarova, J.; Dimitrova, S. The effect of cosmic ray intensity variations and geomagnetic disturbances on the physiological state of aviators. ASTRA 2011, 7, 373–377. [Google Scholar] [CrossRef]
- Papailiou, M.; Mavromichalaki, H.; Kudela, K.; Stetiarova, J.; Dimitrova, S. Cosmic radiation influence on the physiological state of aviators. Nat. Hazards 2012, 61, 719–727. [Google Scholar] [CrossRef]
- Giannaropoulou, E.; Papailiou, M.; Mavromichalaki, H.; Gigolashvili, M.; Tvildiani, L.; Janashia, K.; Preka-Papadema, P.; Papadima, T. A study on the various types of arrhythmias in relation to the polarity reversal of the solar magnetic field. Nat. Hazards 2014, 70, 1575–1587. [Google Scholar] [CrossRef]
- Mavromichalaki, H.; Preka-Papadema, P.; Theodoropoulou, A.; Paouris, E.; Apostolou, T. A study of the possible relation of the cardiac arrhythmias occurrence to the polarity reversal of the solar magnetic field. Adv. Space Res. 2017, 59, 366–378. [Google Scholar] [CrossRef]
- Galata, E.; Ioannidou, S.; Papailiou, M.; Mavromichalaki, H.; Paravolidakis, K.; Kouremeti, M.; Rentifis, L.; Simantirakis, E.; Trachanas, K. Impact of space weather on human heart rate during the years 2011–2013. Astrophys. Space Sci. 2017, 362, 138. [Google Scholar] [CrossRef]
- Papailiou, M.; Ioannidou, S.; Tezari, A.; Lingri, D.; Konstantaki, M.; Mavromichalaki, H.; Dimitrova, S. Space weather phenomena on heart rate: A study in the Greek region. Int. J. Biometeorol. 2023, 67, 37–45. [Google Scholar] [CrossRef] [PubMed]
- Palmer, S.J.; Rycroft, M.J.; Cermack, M. Solar and Geomagnetic Activity, Extremely Low Frequency Magnetic and Electric Fields and Human Health at the Earth’s Surface. Surv. Geophys. 2006, 27, 557–595. [Google Scholar] [CrossRef]
- Stoupel, E.; Babayev, E.S.; Mustafa, F.R.; Abramson, E.; Israelevich, P.; Sulkes, J. Acute Myocardial Infarction Occurrence: Environmental Links-Baku 2003–2005 Data. Med. Sci. Monit. 2007, 13, 175–179. [Google Scholar]
- Mavromichalaki, H.; Sarlanis, C.; Souvatzoglou, G.; Tatsis, S.; Belov, A.; Eroshenko, E.; Yanke, V.; Pchelkin, A. Athens Neutron Monitor and its aspects in the cosmic-ray variations. In Proceedings of the 27th International Cosmic Ray Conference, Hamburg, Germany, 7–15 August 2001; Volume 10, pp. 4099–4102. [Google Scholar]
- Mavromichalaki, H.; Souvatzoglou, G.; Sarlanis, C.; Mariatos, G.; Gerontidou, M.; Papaioannou, A.; Plainaki, C.; Tatsis, S.; Belov, A.; Eroshenko, E.; et al. The new Athens Center on data processing from the Neutron Monitor Network in real time. Ann. Geophys. 2005, 23, 1. [Google Scholar] [CrossRef][Green Version]
- Iacobucci, D. Analysis of Variance (ANOVA); CreateSpace Independent Publishing Platform: Scotts Valley, CA, USA, 2016; ISBN 13 978-1530332021. [Google Scholar]
- Stoupel, E.; Domarkiene, S.; Radishauskas, R.; Israelevich, P.; Abramson, E.; Sulkes, J. In women myocardial infraction occurrence is much stronger related to environmental physical activity than in men-a gender or an advanced age effect? J. Clin. Basic Cardiol. 2005, 8, 59–60. [Google Scholar]
- Dimitrova, S. Different geomagnetic indices as an indicator for geo-effective solar storms and human physiological state. J. Atmos. Sol.-Terr. Phys. 2008, 70, 420–427. [Google Scholar] [CrossRef]
- Unger, S. The impact of space weather on human health. Biomed. J. Sci. Tech. Res. 2019, 22, 16442–16443. [Google Scholar] [CrossRef]
- Khabarova, O.V.; Dimitrova, S. On the nature of people’s reaction to space weather and meteorological weather changes. Sun Geosph. 2009, 4, 60–71. [Google Scholar]
Disclaimer/Publisher’s Note: The statements, opinions and data contained in all publications are solely those of the individual author(s) and contributor(s) and not of MDPI and/or the editor(s). MDPI and/or the editor(s) disclaim responsibility for any injury to people or property resulting from any ideas, methods, instructions or products referred to in the content. |
© 2024 by the authors. Licensee MDPI, Basel, Switzerland. This article is an open access article distributed under the terms and conditions of the Creative Commons Attribution (CC BY) license (https://creativecommons.org/licenses/by/4.0/).