Article

A Modeling Framework of Atmospheric CO2 in the Mediterranean Marseille Coastal City Area, France

1
Institut Méditerranéen de Biodiversité et d’Ecologie Marine et Continentale, Aix-Marseille Univ, Avignon Univ, CNRS, IRD, 13397 Marseille, France
2
Groupe de Spectrométrie Moléculaire et Atmosphérique, Université de Reims Champagne-Ardenne, 51100 Reims, France
3
OSU Institut PYTHEAS, Service Informatique Pytheas, 13009 Marseille, France
4
AtmoSud, 13006 Marseille, France
5
Mediterranean Institute of Oceanography (MIO), Université du Sud Toulon, 83130 Toulon, France
6
Earth from Space Institute, Universities Space Research Association (USRA), Washington, DC 20024, USA
7
Department of Atmospheric and Oceanic Science, University of Maryland, College Park, MD 20742, USA
8
Mediterranean Institute of Oceanography (MIO), Aix-Marseille Université, Campus de Luminy, 13009 Marseille, France
9
Department of Meteorology and Atmospheric Science, The Pennsylvania State University, University Park, PA 16802, USA
10
National Oceanography Centre, Southampton SO14 3ZH, UK
*
Author to whom correspondence should be addressed.
Atmosphere 2024, 15(10), 1193; https://doi.org/10.3390/atmos15101193
Submission received: 8 May 2024 / Revised: 13 September 2024 / Accepted: 25 September 2024 / Published: 5 October 2024
(This article belongs to the Section Atmospheric Techniques, Instruments, and Modeling)

Abstract

:
As atmospheric CO2 emissions and the trend of urbanization both increase, the ability to accurately assess the CO2 budget from urban environments becomes more important for effective CO2 mitigation efforts. This task can be difficult for complex areas such as the urban–coastal Mediterranean region near Marseille, France, which contains the second most populous city in France as well as a broad coastline and nearby mountainous terrain. In this study, we establish a CO2 modeling framework for this region for the first time using WRF-Chem and demonstrate its efficacy through comparisons against cavity-ringdown spectrometer measurements recorded at three sites: one 75 km north of the city in a forested area, one in the city center, and one at the urban/coastal border. A seasonal CO2 analysis compares Summertime 2016 and Wintertime 2017, to which Springtime 2017 is also added due to its noticeably larger vegetation uptake values compared to Summertime. We find that there is a large biogenic signal, even in and around Marseille itself, though this may be a consequence of having limited fine-scale information on vegetation parameterization in the region. We further find that simulations without the urban heat island module had total CO2 values 0.46 ppm closer to the measured enhancement value at the coastal Endoume site during the Summertime 2016 period than with the module turned on. This may indicate that the boundary layer on the coast is less sensitive to urban influences than it is to sea-breeze interactions, which is consistent with previous studies of the region. A back-trajectory analysis with the Lagrangian Particle Dispersion Model found 99.83% of emissions above 100 mol km−2 month−1 captured in Summer 2016 by the three measurement towers, providing evidence of the receptors’ ability to constrain the domain. Finally, a case study showcases the model’s ability to capture the rapid change in CO2 when transitioning between land-breeze and sea-breeze conditions as well as the recirculation of air from the industrial Fos region towards the Marseille metroplex. In total, the presented modeling framework should open the door to future CO2 investigations in the region, which can inform policymakers carrying out CO2 mitigation strategies.

1. Introduction

Atmospheric CO2 concentrations are increasing at their fastest observed decadal rate as a result of growing anthropogenic CO2 emissions [1,2]. There is a near-linear relationship between CO2 emissions and resultant global warming effects [3]. About 70% of these emissions originate from urban areas, which is expected to increase as urbanization continues, with forecasts predicting an additional 2.5–3 billion people relocating to urban areas by 2050 [4,5]. Thus, to aid policymakers in their mitigation strategies, it is essential to undertake emission quantification and monitoring efforts near urban areas (e.g., [6,7]).
Currently, urban emission quantification efforts rely heavily on self-reported estimates following one of a few standard protocols, such as those laid out in, e.g., Carney and Shackley [8], Ewing-Thiel and Manarolla [9], Fong et al. [10,11], with only a few scientifically intensive investigations undertaken for a handful of cities, e.g., [12]. While it is difficult to quantify the uncertainty in any inventory estimate (e.g., [13]), those with a heavy reliance on self-reported data may be particularly susceptible to biases and errors [14,15]. Therefore, an independent quantification method is extremely useful for analysis and attempted verification. Atmospheric methods, including direct measurement and model-based approaches, can provide additional constraints on anthropogenic carbon emissions to better inform policymakers about their decisions (e.g., [16,17,18,19]).
Mesoscale urban-related CO2 quantification has been conducted using a combination of atmospheric transport models and in situ observations in “mega-city” regions such as Paris [18,19,20,21,22] and Los Angeles [23,24,25,26], in regions with smaller cities around varying terrain such as Salt Lake City [27,28], Boston [29], and Indianapolis (e.g., [30,31]), and in regions such as the Korean Peninsula [32]. The advent of satellite measurements has also allowed for some comparisons using total-column XCO2, including in Berlin [33] and Réunion island [34]. These investigations have been able to address a wide range of complicating issues around CO2 emission validation, as each geographic region brings its own challenges. Coastal regions bring unique difficulties as well, and there have not been many CO2 analyses in such areas. Los Angeles, a coastal city that has been well-studied, has complex air transport because of regional effects, for instance “Catalina” eddies induced by the shape of the Southern California Bight [35,36,37]. The surrounding mountain ranges and large number of daily emitters lead to a persistent urban dome where CO2 builds up [23], while sea-breeze conditions that are strong enough to truly flush the basin are only episodic [26]. In a study of the coastal region of Valencia, Spain, Pérez-Landa et al. [38] found it challenging to quantitatively match modeled CO2 to observations due to modeling limitations and the complexity of the territory, in particular the land–sea breezes. Despite these difficulties, they were able to reproduce proper transport processes during their period of observation, including a CO2 vertical depletion between 500–2000 km with permanent buildup below. Addressing the paucity of CO2 studies in other urban/coastal regions with complex terrain is a major aim of the present study.
The SUD-PACA (Provence-Alpes-Côte d’Azur) Region in southeastern France presents a unique opportunity in Europe to assess the formation and variability of atmospheric CO2 over a large coastal metropolitan area, namely, Marseille. Marseille is the second-largest city of France by population, with over 869,000 inhabitants as of 2015 [39]. It is situated on hilly terrain along the coast of the Mediterranean Sea. Significant and varying CO2 enhancement from Marseille has been recorded in measurements taken in and around Marseille as well as further north at the Obervatoire Haute-Provence (OHP) dating back to 2016 [19,40,41] Additionally, an intensive campaign with the acronym ESCOMPTE was undertaken in the early 2000s to map out some of the atmospheric dynamics in the Marseille region, particularly wind dynamics and pollutant transport, for the purpose of gaining a deeper understanding of the atmospheric behaviors in this complex terrain for use in future regional emission transport studies [42,43,44]. While ESCOMPTE focused some of its efforts on pollutant transport, there has not yet been a CO2-specific study in the region, which is an additional motivation behind the present study. Furthermore, ESCOMPTE focused only on the summer season, whereas here we include seasonal comparisons.
Forward-model comparisons have proven to be sufficiently accurate for regional constraining of CO2 emissions, and often serve as a crucial first step towards the implementation of inverse atmospheric methods [22]. In this study, we establish a CO2 modeling framework in the complex urban–coastal SUD-PACA region of France and assess its effectiveness in replicating contemporaneous CO2 mixing ratio measurements. The Weather Research and Forecasting Model with Chemistry (WRF-CHEM) atmospheric transport model is adapted to include the most complete and accurate available emissions estimates for all CO2 components in the region. We analyze and discuss the capacity of the model to reproduce the observations at different spatial and temporal scales, including testing the effectiveness of the Urban Heat Island (UHI) module. We couple the Lagrangian Particle Dispersion Model (LPDM) as an adjoint to assess the capacity of the utilized measurement towers to constrain emissions within the model domain. Finally, we finish with a case study focusing on two consecutive days with opposing wind conditions to test the sensitivity of the model and measurement to the regional flow dynamics.

2. Materials and Methods

2.1. Study Area

Our investigation focuses on the Aix-Marseille metroplex and the surrounding region, which provides a unique urban–coastal makeup. According to the Köppen–Trewartha Climate Classification, this region falls under the category of Subtropical summer—dry (Cs), also known as the “Mediterranean climate”, which is characterized by 8–12 months above 10 degrees Celsius, annual rainfall less than 89 cm, and a dry summer [45]. The climate in Marseille itself is becoming warmer and drier as a result of climate change [5]. Occasional high-speed winds called the “mistral” originate from the Rhone Valley to the north, where the air is funneled between Massif Central to the northwest and the Alps to the east and northeast [46]. Marseille, being situated on the water, also experiences the expected regular land and sea breezes. In addition to CO2 emissions originating from anthropogenic sources within the city, there may be substantial additional emissions from off-shore ships and the industrial area of Fos/La Mède to the immediate west of Marseille. Therefore, we undertake this study to explore how the air transport conditions impact the local CO2 concentrations.

2.2. Modeling Framework

2.2.1. Model Configuration

We implement the Weather Research and Forecasting (WRF) model [47] with Chemistry [48], following the setup used in the INFLUX project by [49,50]. This allows for independent simulation of each CO2 component in a passive tracer mode, which can be useful for comparison against in situ observations. Simulations were run using WRF-Chem Version 3.7. For the land surface model (LSM), the default Noah LSM scheme was used [51,52], which accounts for vegetation categories and fractions and includes information such as plant roots, evapotranspiration, soil runoff, and snow/ice cover. With respect to the boundary layer physics, the MYNN 2.5-level TKE scheme was used along with the corresponding built-in urban canopy model, which is compatible with the Noah LSM scheme. For comparison, an additional set of simulations was run with this urban canopy model turned off. In our investigation, we used three nested domains at 9 km, 3 km, and 1 km, as shown in Figure 1. The meteorological driver data were supplied by the European Centre for Medium-Range Weather Forecasts (ECMWF) (https://www.ecmwf.int, accessed on 7 May 2024), from which we used the reanalysis product.
We configured the WRF system to run simulations spanning three one-month periods: July 2016, which we call “Summertime 2016”, 27 January–27 February 2017, which we call “Wintertime 2017”, and 22 April–22 May 2017, which we call “Springtime 2017”. This was to allow for seasonal comparisons, as typically more CO2 uptake is expected in the summer after the plants have bloomed. Springtime 2017 was included because most of the CO2 uptake in the region was found to occur during this period rather than during the summer. Following [49], each month of simulations was created in segments of 5 d with an additional 12 h overlapping time window to allow the meteorology to spin up. In addition, an extra segment of 5.5 d was run before the period of interest to spin up the CO2 mixing ratios in the region from the boundary conditions, i.e., to allow enough time for the domain to be filled with ambient background values.
The model was adapted to include multiple CO2 components which could run simultaneously and be combined post-simulation for direct comparison against other models and in situ measurements taken at the sampling sites. For this study, the relevant components included the Open-source Data Inventory for Anthropogenic CO2 (ODIAC2017) product for anthropogenic emissions [53,54], the European Centre for Medium-Range Weather Forecasts (ECMWF)-based C-TESSEL model estimates for biogenic emissions (gross primary production (GPP), net ecosystem emissions (NEE), respiration (including both autotrophic and heterotrophic) [55,56], Fire INventory from NCAR (FINN), consisting of the version 1.5 model estimates for fire emissions [57], a manually-created ocean flux product, and Carbon Tracker Europe for boundary conditions [58,59]. Each of these components are explained in further detail in the following subsection.

2.2.2. Model CO2 Flux Components

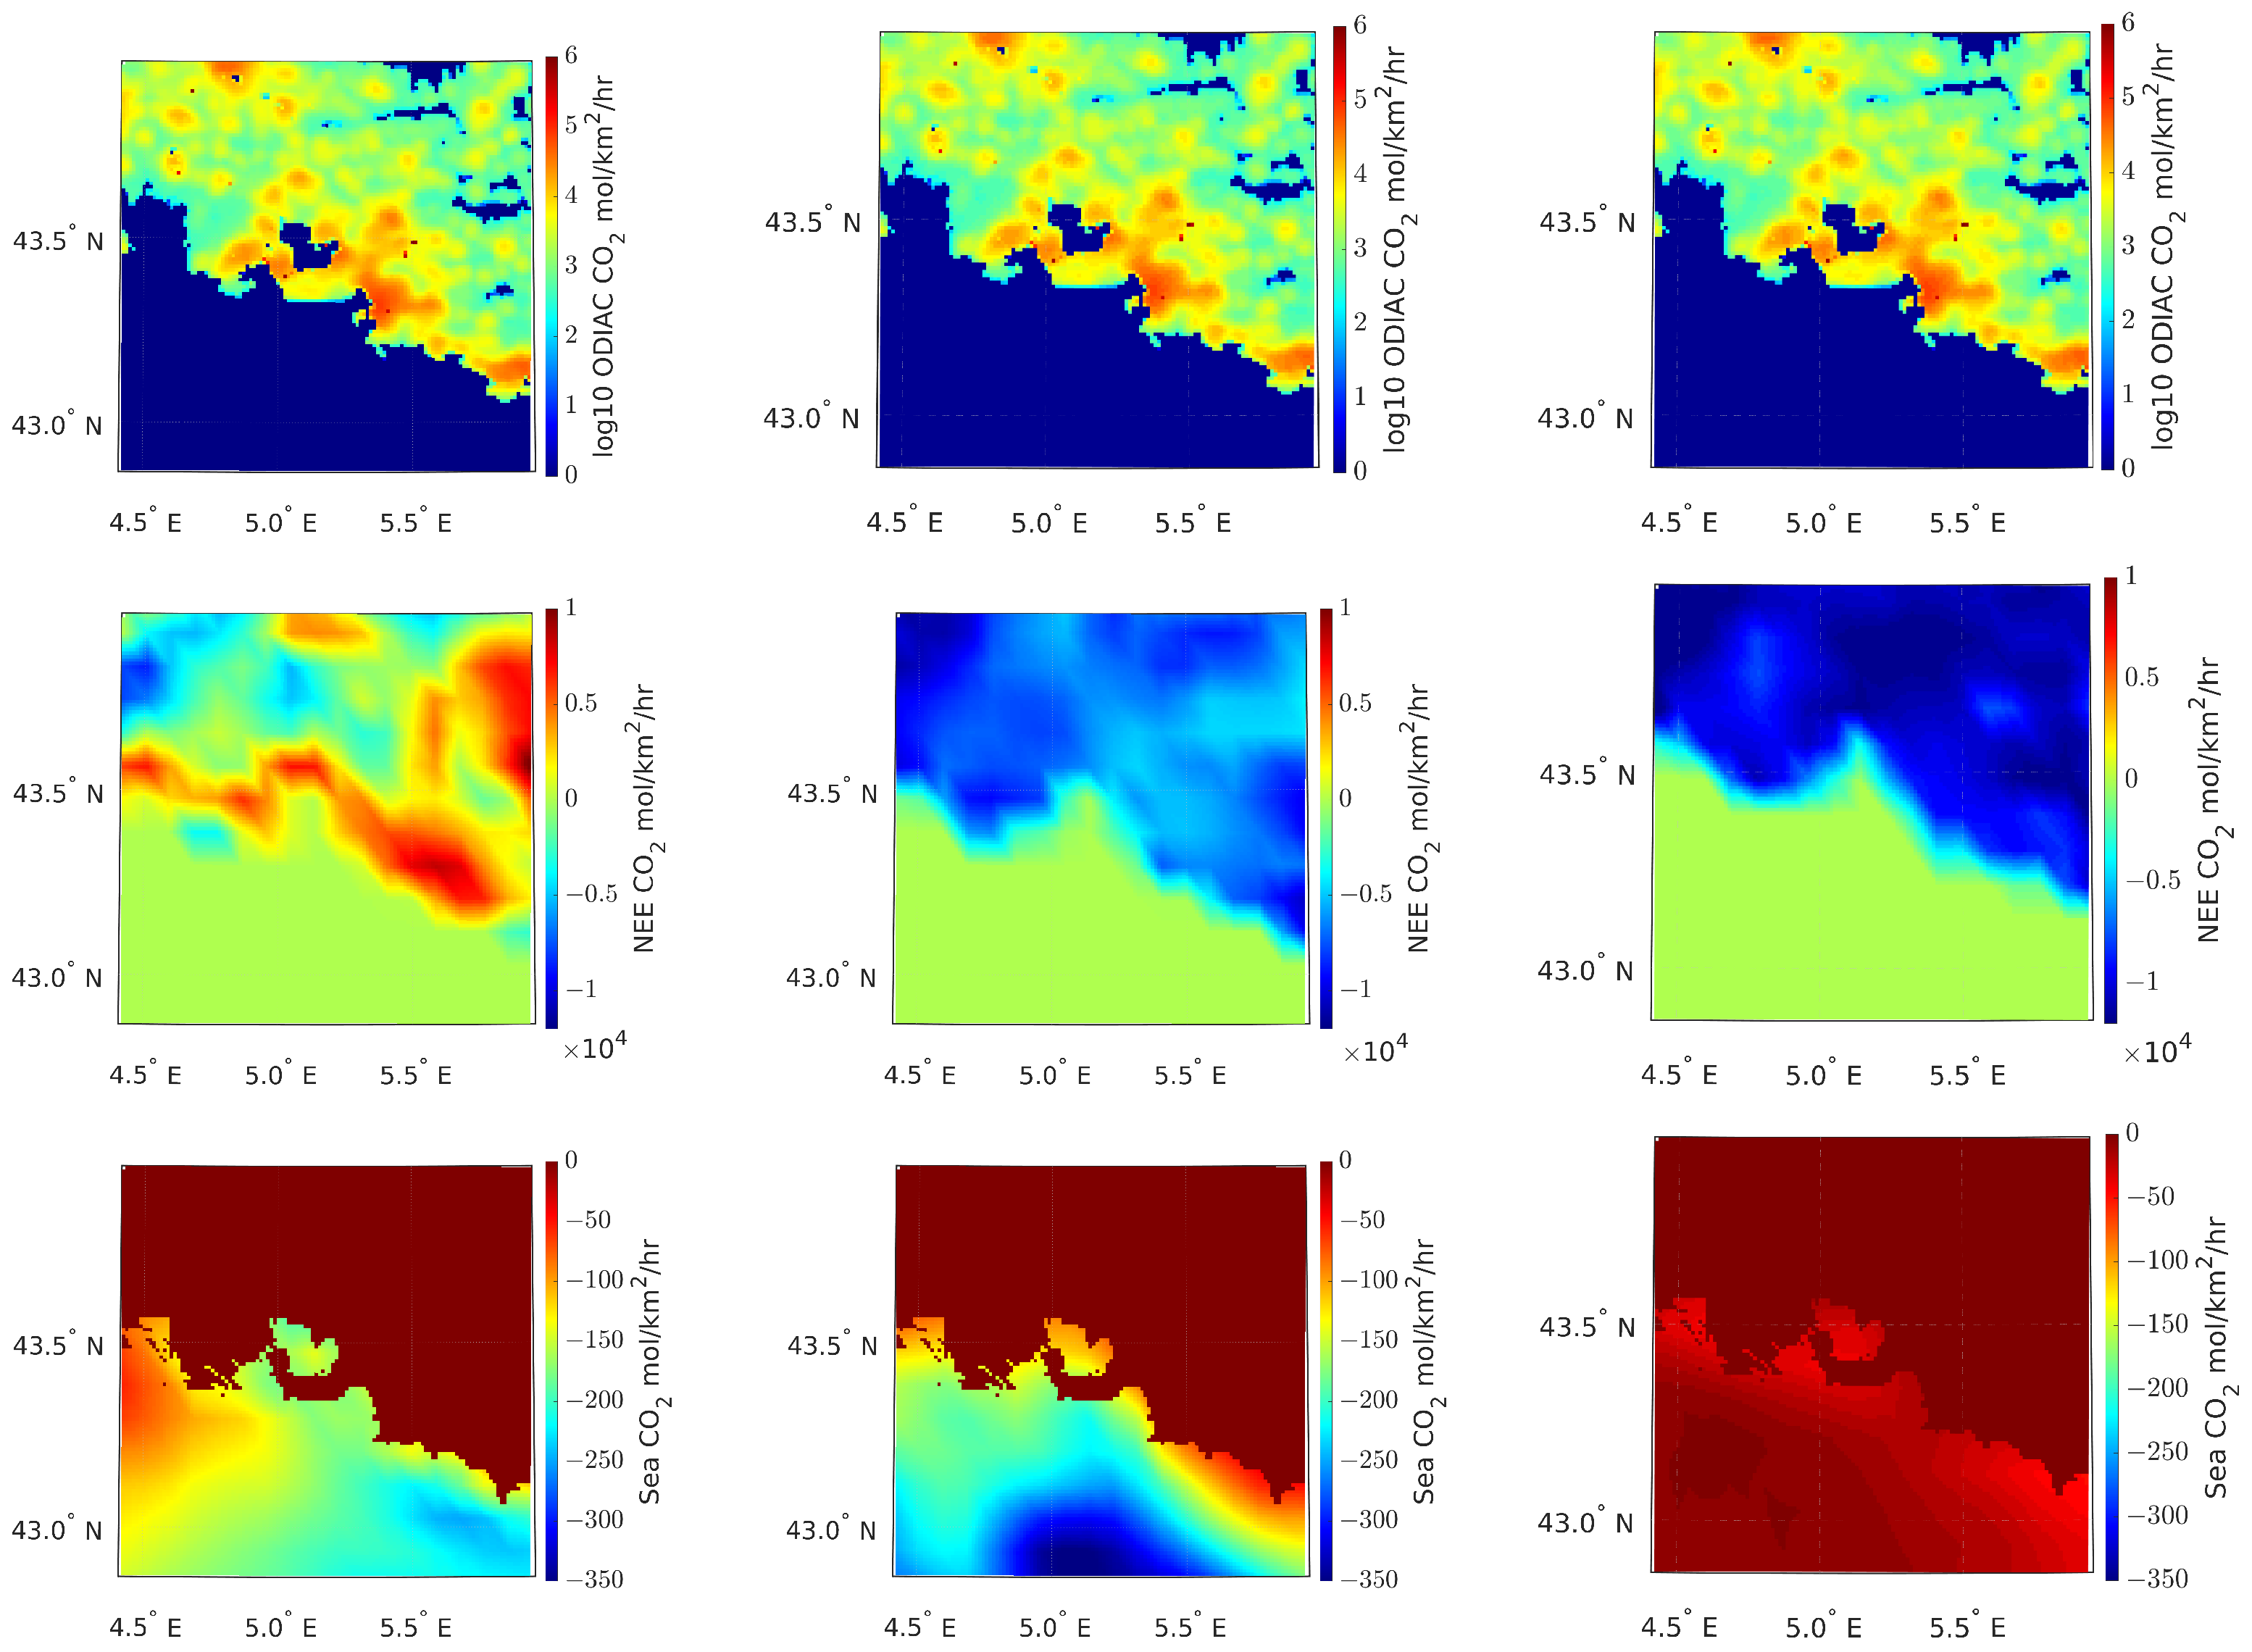
For the anthropogenic component, ODIAC estimates from the 2017 version were used, hereinafter referred to as ODIAC2017. ODIAC is a satellite-based product that uses nighttime light data to estimate population, which is then used as a proxy for CO2 emissions [53,54]. Although it lacks the sector-specific nature of more traditional bottom-up inventory assessment, it provides a global product, allowing for estimates in regions where trustworthy bottom-up products may not yet be available. In comparisons, it has been shown to match well with other inventory flux estimates [50,60]. For our study, the ODIAC2017 estimates were taken at 1 km resolution and then interpolated onto the 9 km, 3 km, and 1 km simulation domains, as shown in Figure 1. Figure 2 shows three example hourly flux maps for the innermost domain for 3 July 2016 at 14:00 UTC, 3 February 2017 at 14:00 UTC, and 3 May 2017 at 14:00 UTC. The emissions are plotted on a log-10 scale to allow the spatial variations to be seen, otherwise the very strong point sources would wash out the colorscale.
The ODIAC2017 files are provided as monthly totals for the years 2015 and 2016 [61]. For this analysis, we used the files from 2016 for each of our July 2016, Wintertime 2017, and Springtime 2017 periods of interest, as 2017 files were not yet available at the time of this analysis. In order to convert these emissions files to the hourly resolution needed to match our WRF model, the emissions were first divided equally among all the hours of the month. We then imposed a diurnal cycle on the model based on the one used by corresponding emission files provided by AtmoSud (formerly AirPACA), the local Air Quality institute in the region. The diurnal cycle was extracted and imposed in an hourly fashion by calculating a scaling factor
S h r = j = 1 J X j , h r j = 1 J X j , d a y ¯ ,
where J indicates the total number of pixels in the domain, j specifies an individual pixel, hr is the subscript denoting a particular hour, X j , h r is the AtmoSud estimated flux at a given pixel at this hour, and X j , d a y ¯ is the mean AtmoSud estimated flux at this pixel for the whole day. The sum of emissions for all hours in a day is then preserved at the same value irrespective of whether or not this scaling factor is used. Pixels with emissions greater than 4 × 10 5 mol/km2/h are assumed to contain a plant with emissions that are not expected to follow a normal diurnal cycle, and as such are excluded from this scaling factor treatment.
For the biogenic CO2 flux estimates, we use the ECMWF land–surface model known as C-TESSEL [55], which offers global coverage of natural land CO2 fluxes that are especially useful in atmospheric-model-based CO2 emissions analyses (e.g., [18,20,62]). C-TESSEL provides estimates of GPP, NEE, and Respiration (including both autotrophic and heterotrophic) at a resolution of approximately 0.09° latitude and longitude. These are then interpolated onto our relevant WRF grid using linear triangulation, as was done with the other CO2 component estimates. Figure 2 includes example flux maps of NEE on the innermost 1 km domain for 3 July 2016 (middle row, left column), 3 February 2017 (middle row, middle column), and 3 May 2017 (middle row, right column), all at 14:00 UTC.
Fire estimates are obtained through the Fire Inventory from NCAR (FINN) version 1.5 [57], which provides global fire emissions estimates at ∼1 km2 resolution. There are multiple speciation options; for this study, we chose the product based on the MOZART-4 chemical mechanism [63]. To create the flux maps for the WRF simulations, the emissions were assigned to the relevant WRF domain and scaled appropriately to suit the pixel size. For example, a fire burning in a space of approximately 1 km2 would have its emissions scaled down by 1/9 when assigned to the domain with (3 km)2 resolution.
We calculated the ocean fluxes manually using the sea surface temperature (SST), surface pressure, and 10 m u and v wind speed component values provided in the ECMWF model files used to drive WRF. With these values, we incorporated measured pCO2 values from the Bay of Marseille along with background atmospheric CO2 mixing ratios measured at the ICOS station at Cap Corse. These were combined to solve the following formula:
F l u x = k · K 0 ( p C O 2 _ w a t e r p C O 2 _ a i r ) = k · ( K 0 · p C O 2 _ w a t e r F · X C O 2 _ a i r )
where p C O 2 _ w a t e r is the measured partial pressure of CO2 in the water, X C O 2 _ a i r is the measured dry air mole fraction of CO2, K0 is the solubility, F is the solubility function, and k is the gas transfer velocity. For p C O 2 _ w a t e r , we used values measured in the Bay of Marseille during the same period [64]. For X C O 2 _ a i r , we used the monthly mean observed CO2 dry air mixing ratio values from ERSA, except for the Springtime 2017 period, when such measurements were not available. For this period, measurements from the SME site were used as a background instead (see Figure 1), a change which is expected to have a minimal impact on the resulting flux values [64], particularly considering how low these values are compared to the other CO2 flux components. The calculation of the other parts of the oceanic flux equation is complex; here, we follow recommendations from [65,66] and the detailed explanation in [67]. As with the other flux variables, a positive value here indicates that the oceanic reservoir is acting as a source, while a negative value indicates that it is acting as a sink.
By using the six-hourly ECMWF maps for the u and v wind components, surface pressure, and SST to solve Equation (2), we obtained ocean flux maps for every 6 h. These were linearly interpolated to create hourly ocean flux maps and appropriately converted to units of mol/km2/h for use in our WRF-Chem simulations. Figure 2 includes example sea flux maps on the bottom row, where the left-hand map shows the fluxes for 3 July 2016 at 14:00 UTC, the middle map shows the fluxes for 3 February 2017 at 14:00 UTC, and the right-hand map shows the fluxes for 3 May 2017 at 14:00 UTC.
We also maintained a tracer strictly to set the boundary conditions. This was achieved by providing blank (i.e., zero-emission) flux maps for the three domains. The boundary conditions of the outer ((9-km)2) domain were defined based on the output of a global CO2 model. For this study, these boundary condition values were provided by the latest available output from CarbonTracker Europe [58,59] (specifically, CTE2017-FT), which was originally an offshoot of the CarbonTracker CO2 data assimilation system developed at the National Oceanic and Atmospheric Administration (NOAA) [68,69]. This latest version of CarbonTracker Europe implements a gridded state vector for improved accuracy of ecosystem emission regional estimates [59]. Newer versions of the CarbonTracker Europe results have been used in studies of various regions and fields of research, including Amazon carbon balance (e.g., [70]), China/Asia CO2 balance (e.g., [71]), global methane inversions (e.g., [72]), and more.
The provided CarbonTracker Europe files come with 1° latitude and longitude spatial resolution and three-hourly temporal resolution. They are 3D molefraction files, which were converted from the forward run’s molefraction files with the optimized fluxes from CTE2017-FT. As previously suggested by Díaz-Isaac et al. [73], strong vertical gradients affecting near-surface mixing ratios in the first two vertical levels of CarbonTracker were smoothed by averaging over the first three levels weighted by thickness of each vertical level. This approach conserves the mass and removes excessive accumulation or depletion caused by incorrect representation of vertical mixing in the first levels above the surface. The CTE2017-FT three-hourly simulated mixing ratios were then interpolated onto our WRF boundaries and continuously advected into the domain. The interpolation of pressure levels and mass balance conservation was achieved using the algorithm described in Butler et al. [74], which has been adapted from a script originally developed by Rainer Schmitz (University of Chile, Santiago, Chile) and Steven Peckham (NOAA/ESRL/GSD, Boulder, CO, USA), and has adaptations specifically suited to a WRF-Chem setup using multiple tracers.
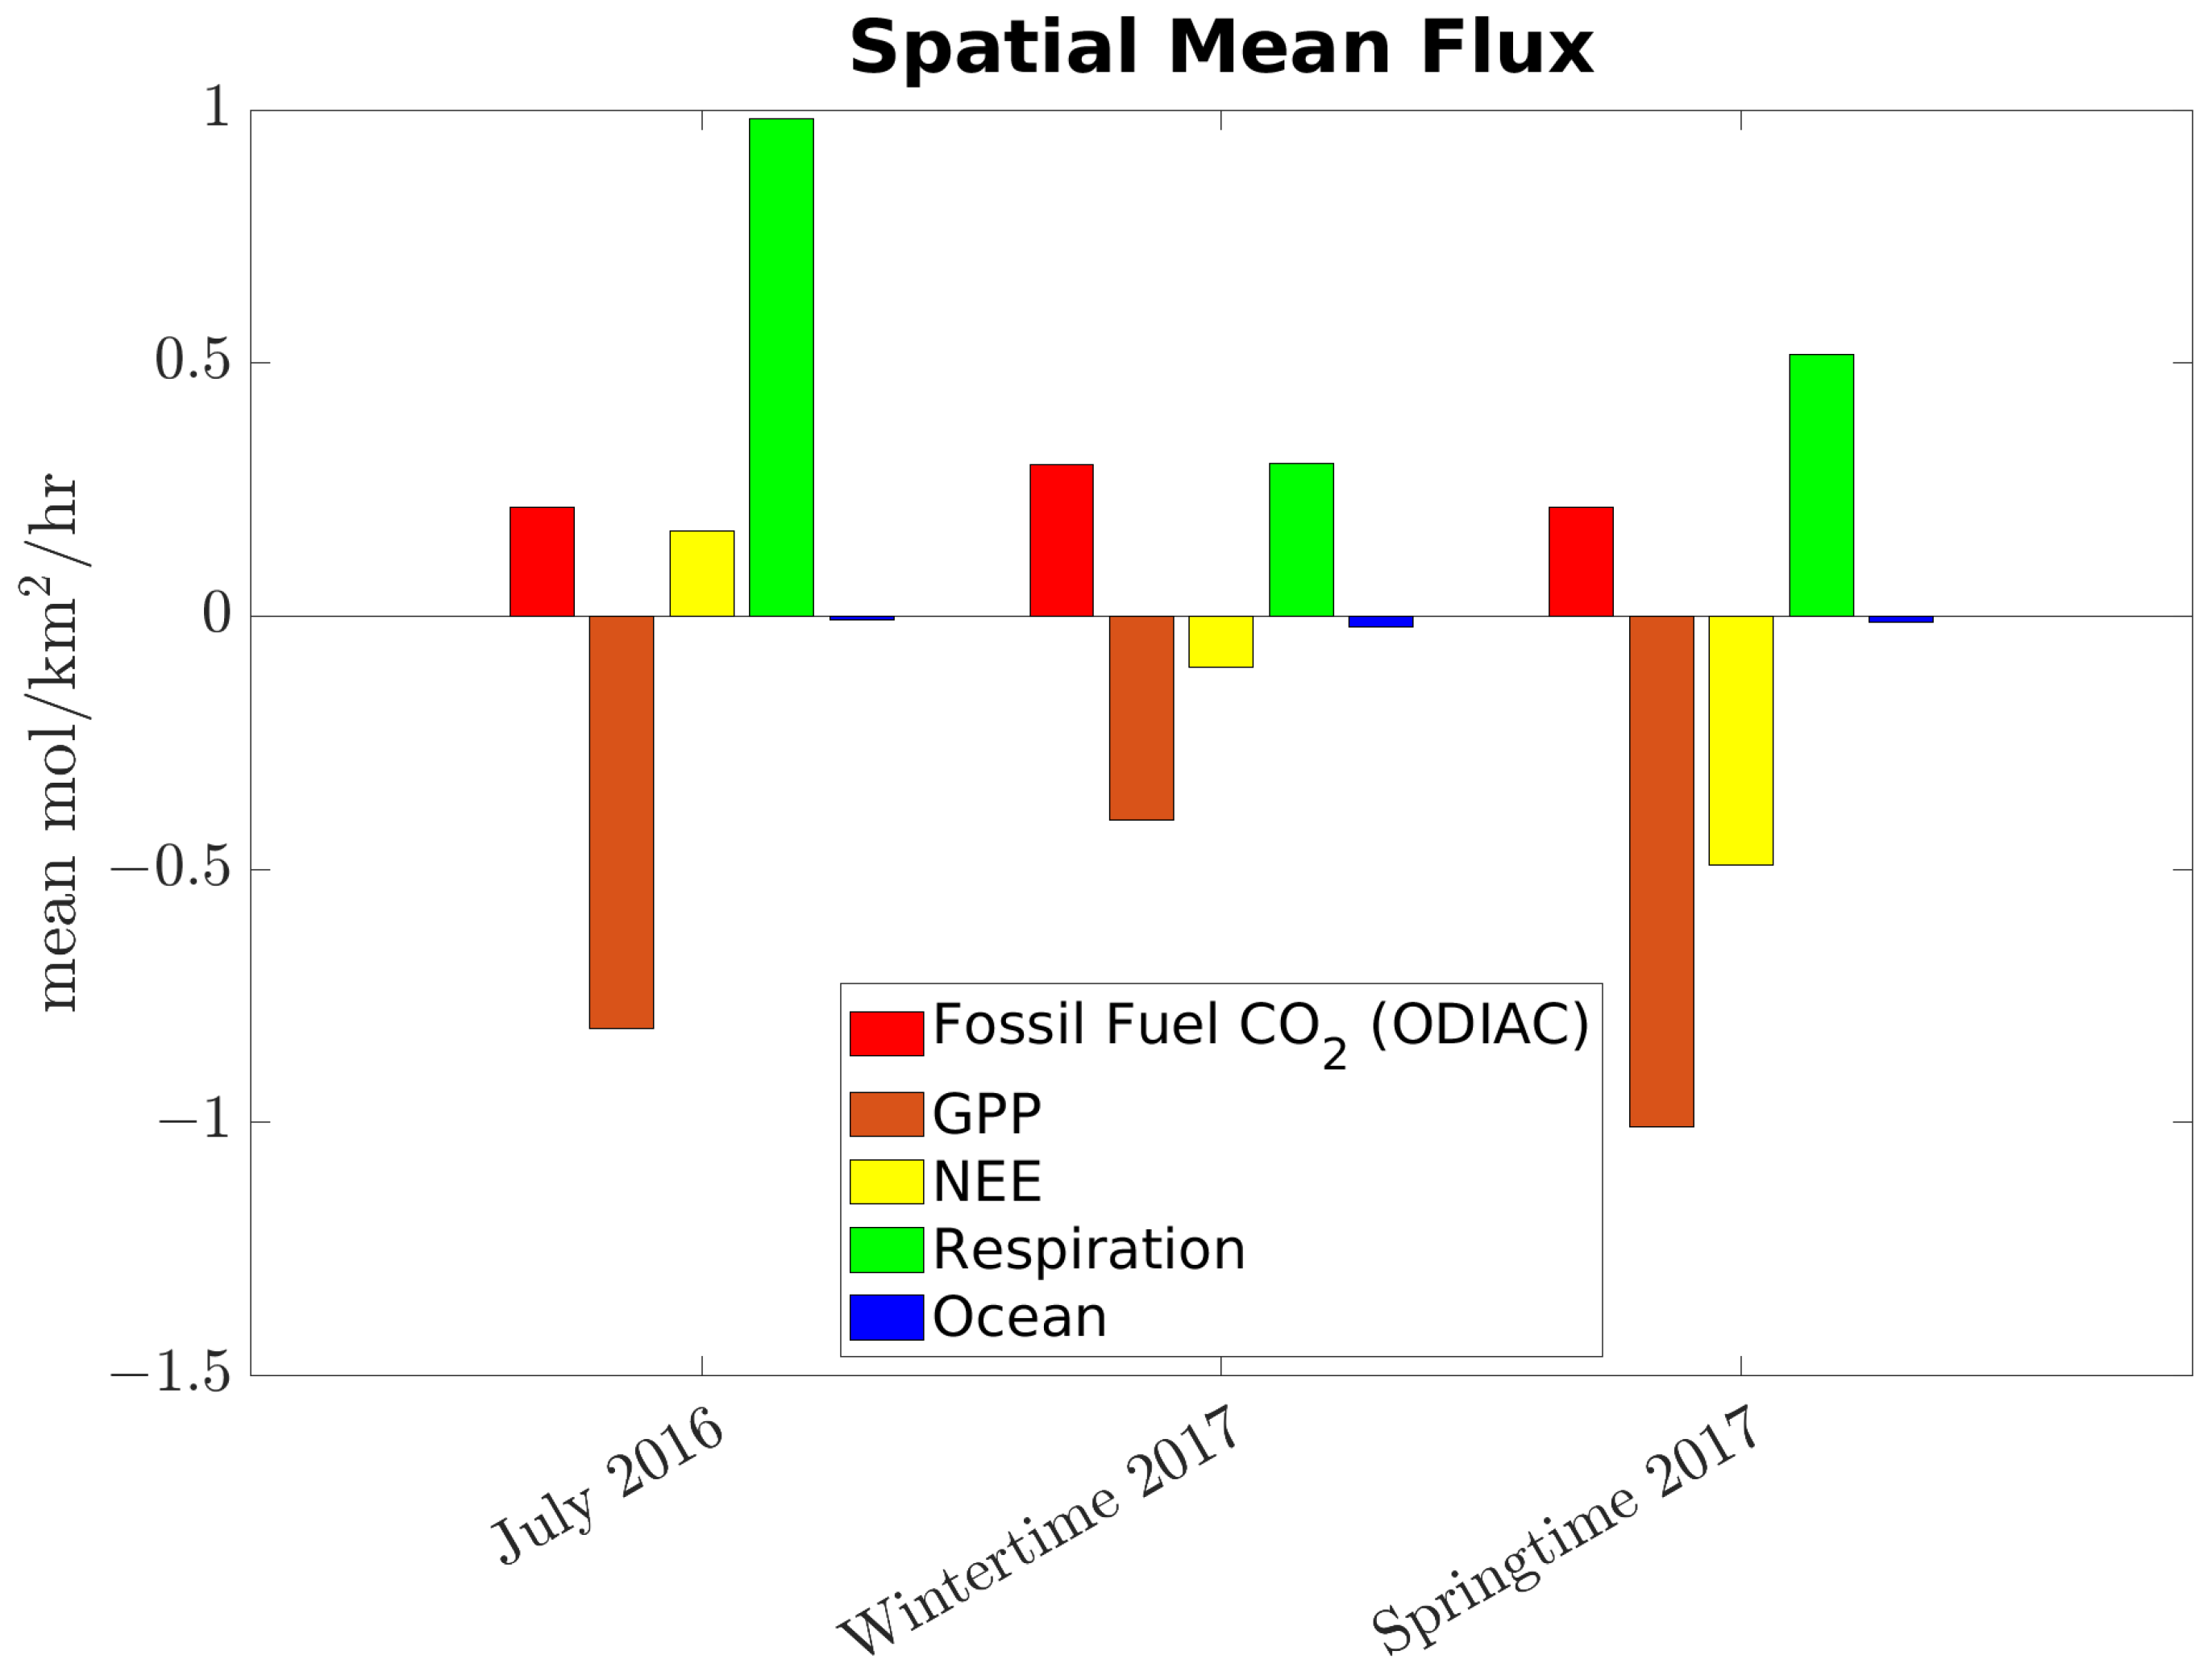
The mean CO2 fluxes emitted from each of the respective components are shown in Figure 3 for the innermost 1 km WRF domain, showing both the spatial and temporal means. Spatially, the means are taken across every land pixel for the land-based fluxes and across every ocean pixel for the ocean flux. Temporally, the mean is taken across all hours in the three periods of interest: Summertime 2016, Wintertime 2017, and Springtime 2017. We chose to include all three biogenic components here, namely, GPP, NEE, and Respiration, for illustrative/comparative purposes. Fire emissions were left out because they are point sources, meaning that the spatial average over the whole domain is effectively zero even during emission events.
The summertime fluxes are the most dynamic, as was expected. The magnitudes of both the GPP and Respiration are significantly higher in summer than in winter. The dryness of the Marseille cityscape explains the respiration; however, the region around Marseille is well forested (in fact, forests represent almost half of the PACA territory [75,76]), which accounts for the increased GPP. Unlike many regions, NEE is positive in the summertime and negative in the winter. This is a known feature of this climate (e.g., [77]) and is primarily driven the hot and dry the summers are, which lead to increased respiration, while the winters are relatively mild and wet. Because of how unusual this feature is, we include the Springtime 2017 period for comparison. During the spring, there is significantly more GPP with a moderate amount of respiration, leading to a significantly more negative NEE than during the winter, as would be expected.

2.2.3. Coupling a Dispersion Model

Lagrangian models simulate random pathways through the turbulent flows that fluid elements carve [78], which makes them especially adept at simulating tracer paths through atmospheric turbulent flow. When used in the context of atmospheric dispersion models, trajectories are created for a large number (often tens of thousands) of particles over the course of hours, which can trace out the atmosphere’s mean flow and turbulence as well as account for subgrid-scale transport processes. By contrast, in Eulerian simulations a point source is instantly averaged out into its corresponding grid box, resulting in loss of resolution. In Lagrangian models, each air parcel can be assigned a mass and a loss process to match the limitations of the particular investigation. Although their stochastic differential equations may lead to some numerical errors [79], in general Lagrangian models have less numerical diffusion than their Eulerian or semi-Lagrangian counterparts [80,81]. When factoring in that Lagrangian models can simulate backwards in time, allowing them to act as reliable tracers to source regions, they become especially useful in investigating emission regions and making comparisons against in situ measurements [82].
Here, we couple the Lagrangian Particle Dispersion Model (LPDM) defined in [83] as an adjoint to the WRF forward model to create influence functions from current CO2 measurement sites in the Aix-Marseille region. The influence functions are used to understand the footprint of the airmass before its arrival at the observation site in order to understand the fluxes that influence atmospheric CO2 concentrations at the location. The LPDM is provided with the u, v, and w wind components, the temperature, and the Turbulent Kinetic Energy (TKE) from the WRF output files for our innermost (1 km × 1 km) domain at hourly resolution. Then, at the desired receptor spots and altitudes corresponding to the aforementioned real or potential future measurement sites (see Table 1), 35 particles are released backwards in time every 30 s, advecting through the WRF-generated wind fields. Files are saved every 2 min; these files are then used to create hourly influence function files by integrating along all particles within the lowest 400 m, following the procedure laid out in [84]. This height was chosen to account for the difficulties LPDM has with sudden terrain height changes, which are present within our domain. Following the procedure set out in [50], 12 hours of influence function files are used to create a single influence function (footprint) for a receptor site of interest at a given time of interest in order to allow enough time for all particles to sufficiently traverse the domain.
In our study, influence functions were generated from the three receptor positions outlined in Table 1: Observatoire Haute-Provence (OHP), Marseille Longchamp (CAV), and Endoume (SME). These were the sites for which measurements were available during our period of interest. Their respective positions in the 1 km domain can be seen in Figure 1. These influence functions are used in Section 3.4 to showcase the differences in potential source regions during the different seasons as well as during particular distinct wind condition events, as demonstrated with a case study of 24 July 2016.

2.3. Observations

Observations were available from up to four measurement sites for the three periods of interest in this study. These were the only available CO2 monitoring sites in the region at the time of the analysis [41]. Three of these sites fall within the boundaries of our highest-resolution (1 km)2 WRF domain, as shown in Figure 1: Observatoire Haute Provence (OHP), Marseille Longchamp (CAV), and Endoume (SME). The fourth site, Cap Corse (ERSA), lies within our outermost (9 km)2 domain, and is included in this study as a background site for the other stations. These ERSA observations were subtracted off of the measurements at the other three sites to yield enhancement values, which were then used for comparison against the concentration fields output from the modeled emissions at the three sites. Technical information on the four stations and the datasets, including calibration and maintenance of the instruments, can be found in Xueref-Remy et al. [41]. Data for the springtime period were not available from either the ERSA or SME stations. The precision of the CO2 datasets was lower than 0.1 ppm for all stations. The accuracy was less than 0.1 ppm at OHP, ERSA, and CAV and was equal to −0.2 ppm at SME, as described in [41].
Figure 4 shows the time series observations for the dry air mole fractions of CO2 at the different sites for the periods of interest. The wintertime mole fractions are elevated over the summertime values, as would be expected, and the values recorded at the inner-city CAV station are predictably larger than those in more arboreous regions (e.g., OHP) or along the coast (e.g., SME). A deeper analysis of the observations and the observation network can be found in Xueref-Remy et al. [40] and Xueref-Remy et al. [41].

2.4. Comparison Statistics

Several statistical metrics were utilized to facilitate the analysis of the results, including the Mean Error (ME) and Mean Absolute Error (MAE). We compared the transport model against in situ observations and conducted percentage difference comparisons when assessing differences in the modules of the model.
The Mean Error serves as an assessment of the bias between the model and observations, and can be defined as follows:
ME = 1 n i = 1 n y ^ i y i
where i iterates through individual observations, n indicates the total number of observations being compared, y ^ denotes the modeled values, and y i denotes the corresponding observed values.
The Mean Absolute Error serves as an assessment of the corresponding uncertainty, and can be defined similarly:
MAE = 1 n i = 1 n y ^ i y i
where the same variable definitions are used as in the ME equation.
Later, we assess the percent difference between the output from different model modules, for which the equation is
Percent Difference = y ¯ y ¯ y ¯ × 100 ,
where y ¯ is the mean output from the original model and y ¯ is the mean output from the adjusted model.

3. Results and Discussion

3.1. WRF-Chem Meteorological Performance Evaluation

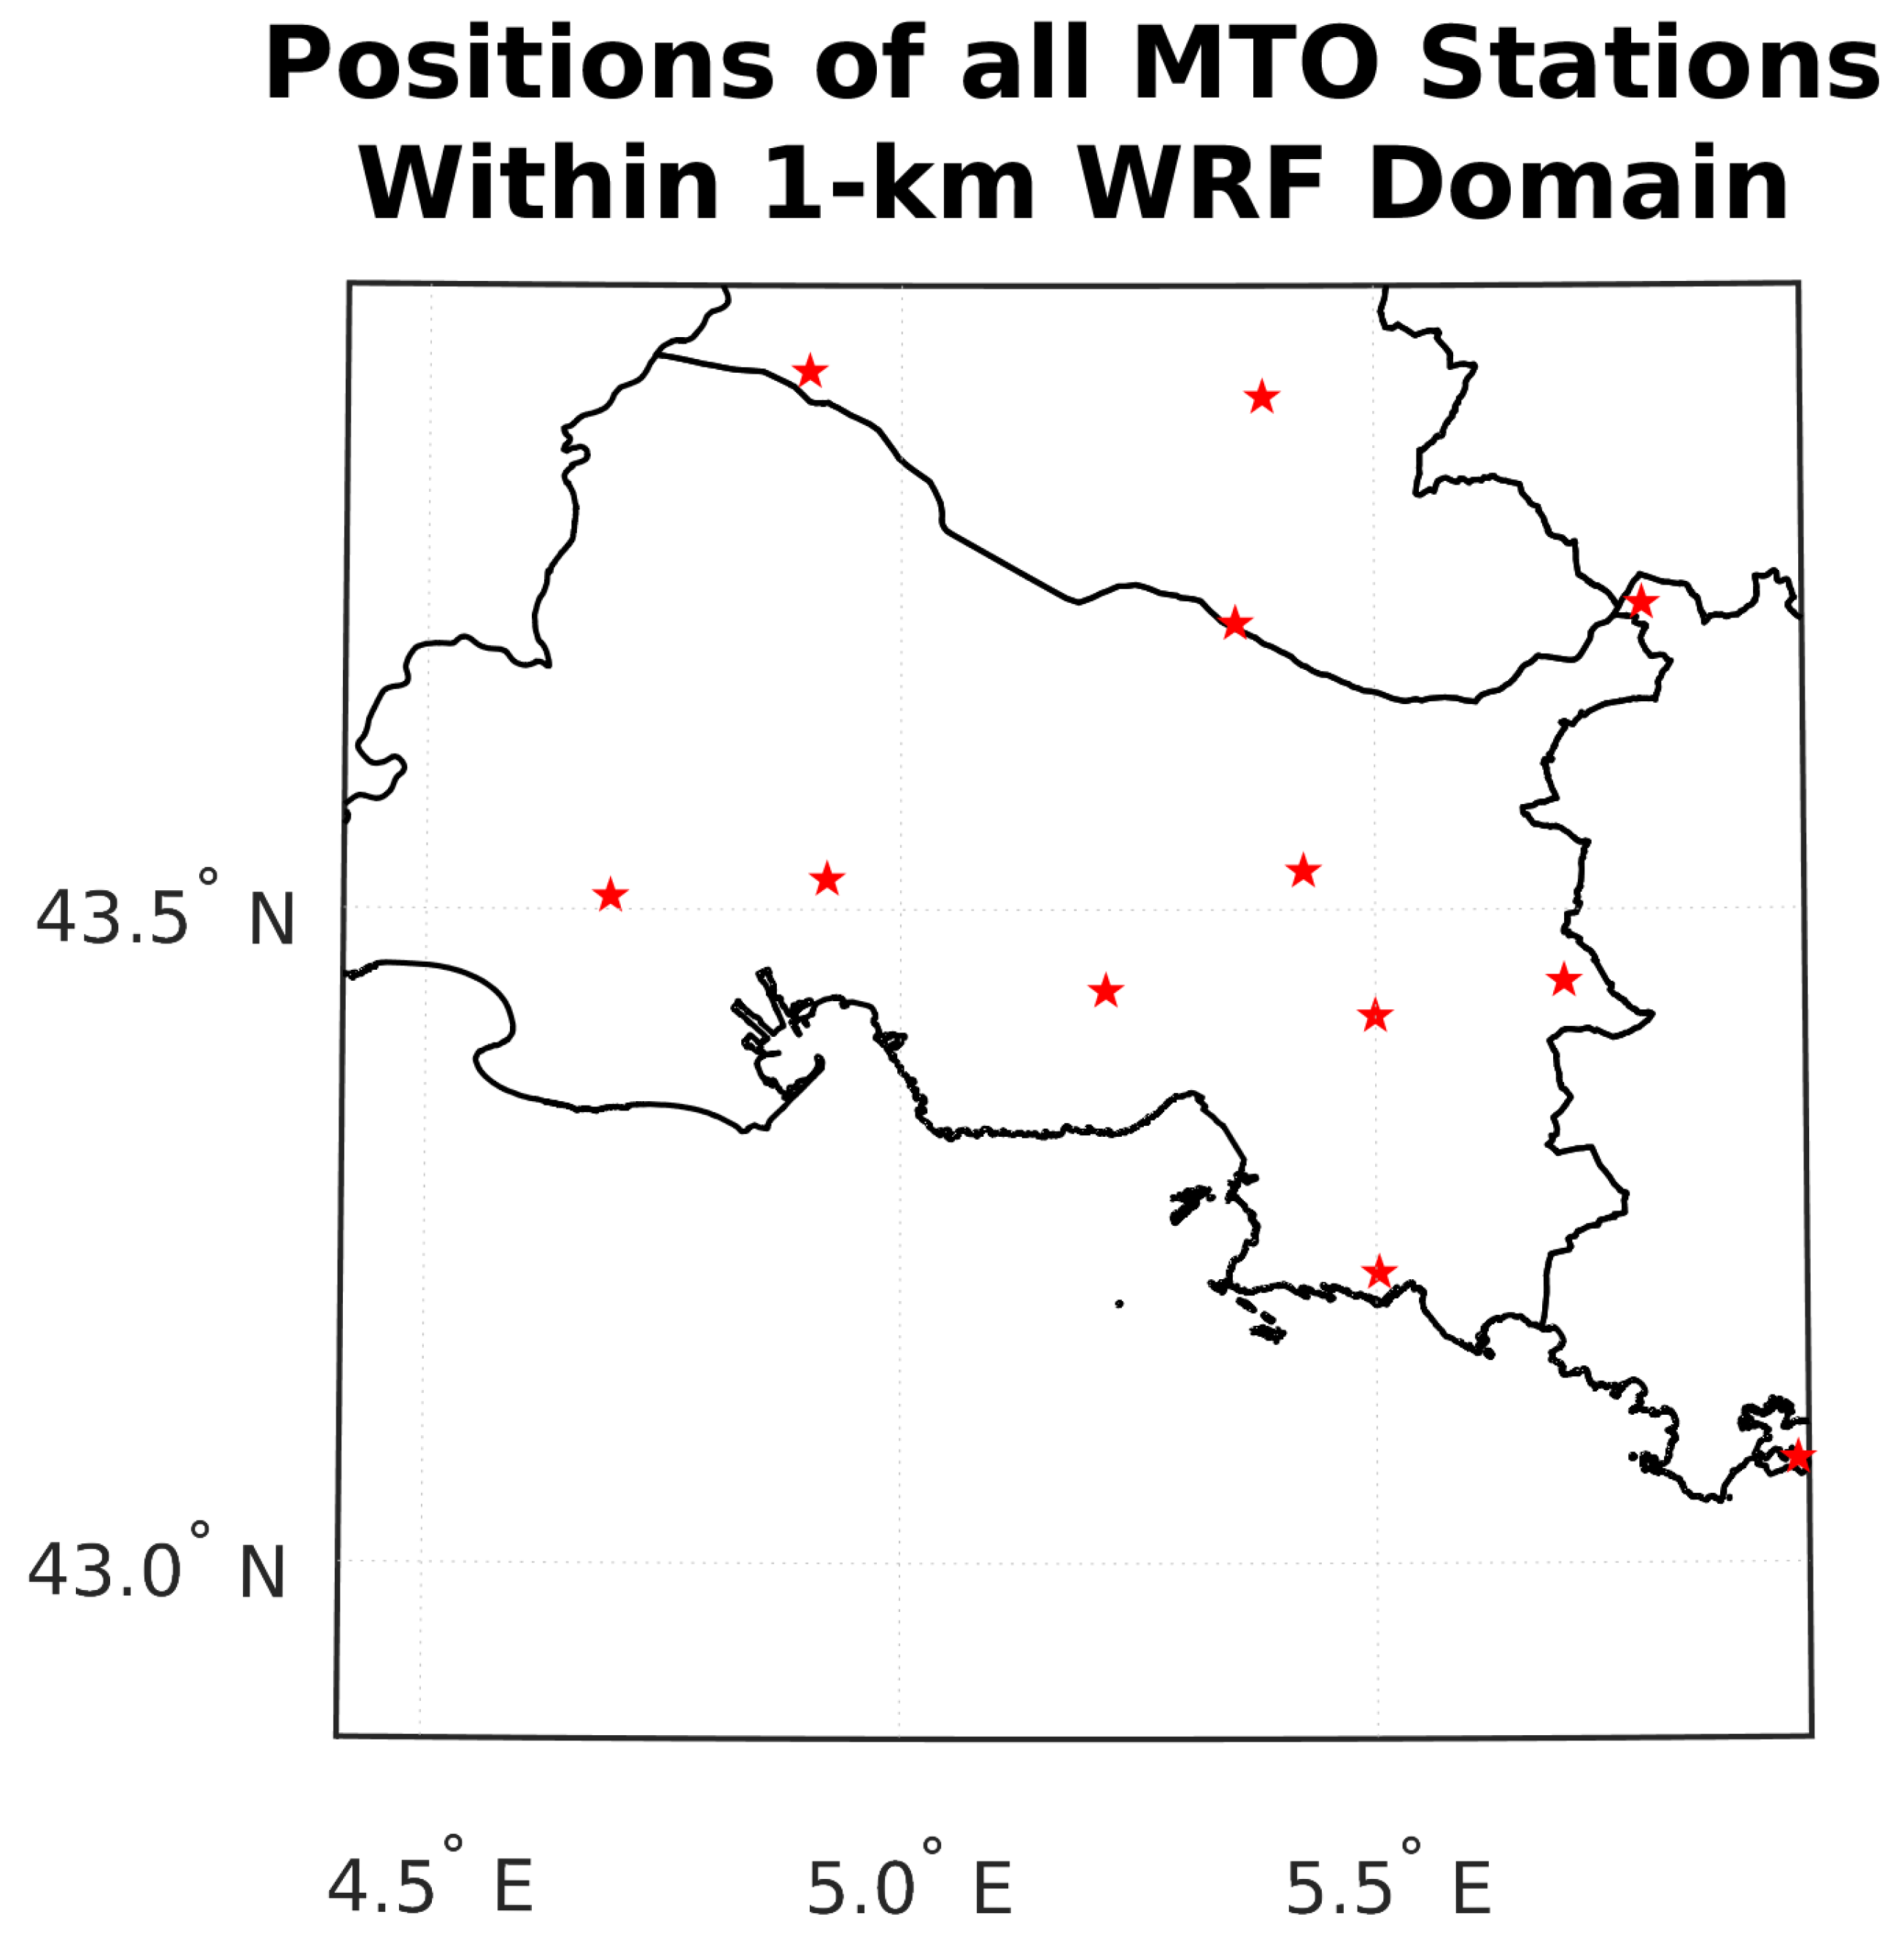
The French National Weather Service (Meteo France) [85] maintains a network of meteorological stations throughout France that continuously monitor standard meteorological variables as part of the World Meteorological Organization network. Twelve of their stations fit within the bounds of our 1 km WRF domain, as shown in Figure A1 in Appendix A. We obtained corresponding measurements of temperature, wind speed, wind direction, and relative humidity. To help validate the WRF-Chem model, we compared the simulated values from the corresponding pixels, including the relevant pressure level, against the simultaneous measurements. Following the methodology of [49], a calm wind threshold of 1 ms−1 was set such that wind values at or below that threshold were excluded from the analysis, as the wind direction for calm conditions is undefined. This filtered out 526 of 2604 (20.4%) of the summertime measurements, 197 of 2688 (7.3%) of the wintertime measurements, and 31 of 2604 (1.2%) of the springtime measurements. The exclusion of these undefined measurement values allows for a more robust comparison with the model, making the agreement more evident. For example, without this filtering the MAE values for Summertime 2016 wind speed and direction would have been 35% and 21% larger, respectively. The ME and MAE values were calculated for each station and for each variable, following the equations in Section 2.4, then the mean was taken across all stations.
Table 2 shows the results of the ME and MAE analyses for the daytime hours (12–18 UTC) of the Summertime 2016, Wintertime 2017, and Springtime 2017 periods. The model performs especially well in the Wintertime and Springtime periods. When compared against Deng et al. [49], whose model setup we emulated, we find our values to be comparable to theirs for the 1 km domain of Indianapolis in the WRF-Chem simulation without Four-Dimensional Data Assimilation, which had MAE numbers of 30 degrees and 1 ms−1 and ME numbers of 6 degrees and 0.2 ms−1, respectively. The Summertime 2016 values show a wider range of disagreement, which is most likely a result of the model having difficulty accurately capturing specific features of atmospheric dynamics of this coastal area, e.g., sea and land breeze processes. Further studies may want to address whether the worse agreement in the model during summertime is a recurrent event, and if so whether CO2 studies in this region should account for the increased uncertainty during this period of the year. Overall, the observed values are considered to be within the expected range for model performance for an analysis of this type in a region with such complex terrain.

3.2. Impact of the Urban Heat Island Effect

The Urban Heat Island (UHI) effect describes the additional heat that becomes trapped in urban areas compared to adjacent rural areas as a result of human activities [86]. These activities include anthropogenic heat emissions, topographical changes (especially to land cover, where permeable moist ground is replaced by impermeable dry pavement and concrete [87]), buildings and their surroundings [88], lowered wind speeds, and generally diminished evaporative surfaces [89,90,91]. In cities with a population of over one million, the mean yearly air temperature can be 1–3 degrees Celsius higher than in adjacent rural areas [92], and the effect tends to scale with city size [89]. While this effect is more pronounced at night, it is still present during the day, and the warmer air promotes turbulent mixing of pollutants [93].
An analysis was performed to test the differences in model performance compared to observations when the UHI effect is not simulated. As stated in Section 2.2.1, the WRF-Chem configuration for this investigation uses the Noah LSM scheme land surface model, the MYNN 2.5 level TKE boundary layer model, and the built-in urban canopy model that was intended for use with the Noah LSM. Additional runs were performed with the UHI module turned off. In order to achieve this, the Noah LSM was replaced by a simple thermal diffusion scheme that only uses five layers of soil temperature for its calculations, and no urban canopy model was assigned.
Simulations were run without the UHI module for each of the Summertime 2016, Wintertime 2017, and Springtime 2017 periods. Figure 5 shows a comparison of the time series of the simulated boundary layer heights with and without the UHI effect for each of the three stations (OHP, CAV, and SME) recording CO2 measurements. These time series include only the daytime hours of 12:00–18:00 UTC.
Overall, Figure 5 shows that there is an enhanced Planetary Boundary Layer (PBL) when the UHI is included in the model, as is to be expected. This difference is the greatest in Summertime 2016, the warmest season. The differences in simulated total CO2 will be touched upon in the succeeding section. The figure also seems to indicate that the boundary layer heights track well with each other. In order to better quantify the boundary layer height difference with and without the UHI module, we calculated the percentage difference of the mean values across the three analysis periods for each of the three sites, with the results presented in Table 3.
Table 3 shows that the simulations with and without the UHI module agree rather well in the wintertime and springtime periods, which is potentially a result of the PBL having less variability compared to the summertime. Additionally, they agree best at the urban station, CAV. The disagreement at SME, which is at the ocean–land border, may result from difficulties with accurately capturing the PBL along this boundary. The site/period combination with the highest amount of disagreement is the SME station during Summertime 2016. To gain more insight into how these differences might influence model CO2 estimates in the region during common summertime wind events, Section 3.4.2 examines a wind shift from land-breeze conditions (at 23 July 2016 16:00 UTC) to sea-breeze conditions (at 24 July 2016 16:00 UTC). Additionally, we note that there were significant differences at OHP during the Summertime 2016 period, which was not expected, as this is not an urban area. We hypothesize that this may be evidence of terrain influence, as the WRF urban heat island scheme was optimized over the United States.

3.3. CO2: WRF-Chem vs. Observations

To assess the efficacy of the WRF-chem model-based CO2 values, we compared them against the observations at particular CO2 instrument sites. As stated in Section 2.3, observations during our Summertime 2016, Wintertime 2017, and Springtime 2017 periods of interest were available from four sites: OHP, CAV, SME, and ERSA. Of these, three sites are within the innermost highest-resolution 1 km WRF domain. The enhancement values shown here are calculated as described in the Methods section. Hours when the wind was blowing from the NE at ERSA were considered to be potentially contaminated by urban and industrial plumes coming off of Italy, and were consequently left out of the analysis [40].
Table 4 shows a comparison of the background values from the model and from the observations (mean and one standard deviation) for Summer 2016 and Winter 2017; note that no background observations were available for Springtime 2017. For each season, the model background value is similar at the three stations, showing that the modeling framework has very little regional background variability. This point is expanded upon in the next section. In Summertime 2016, the model background is 3 to 3.2 ppm above the observation background and is less variable by about 40%. In Wintertime 2017, the model background is lower than the ERSA background value by about 3.5 ppm and is less variable by about 70%. These differences are taken into account when comparing the modeled and observed enhancements.
The remaining enhancement values were then compared against the WRF-based mixing ratio values, which are composed of a combination of four CO2 components: ODIAC2017 as the anthropogenic component, NEE as the biogenic component, our manually-derived ECMWF-based ocean product for the sea component, and the FINN fire component. The values are taken from the latitude/longitude/altitude pixel which encompasses the measurement site in question at the appropriate sampling height. Although (1 km)2 is high-resolution, these sites are significantly smaller than the pixels, which will necessarily introduce some unknown amount of uncertainty due to representation error (e.g., [94]).
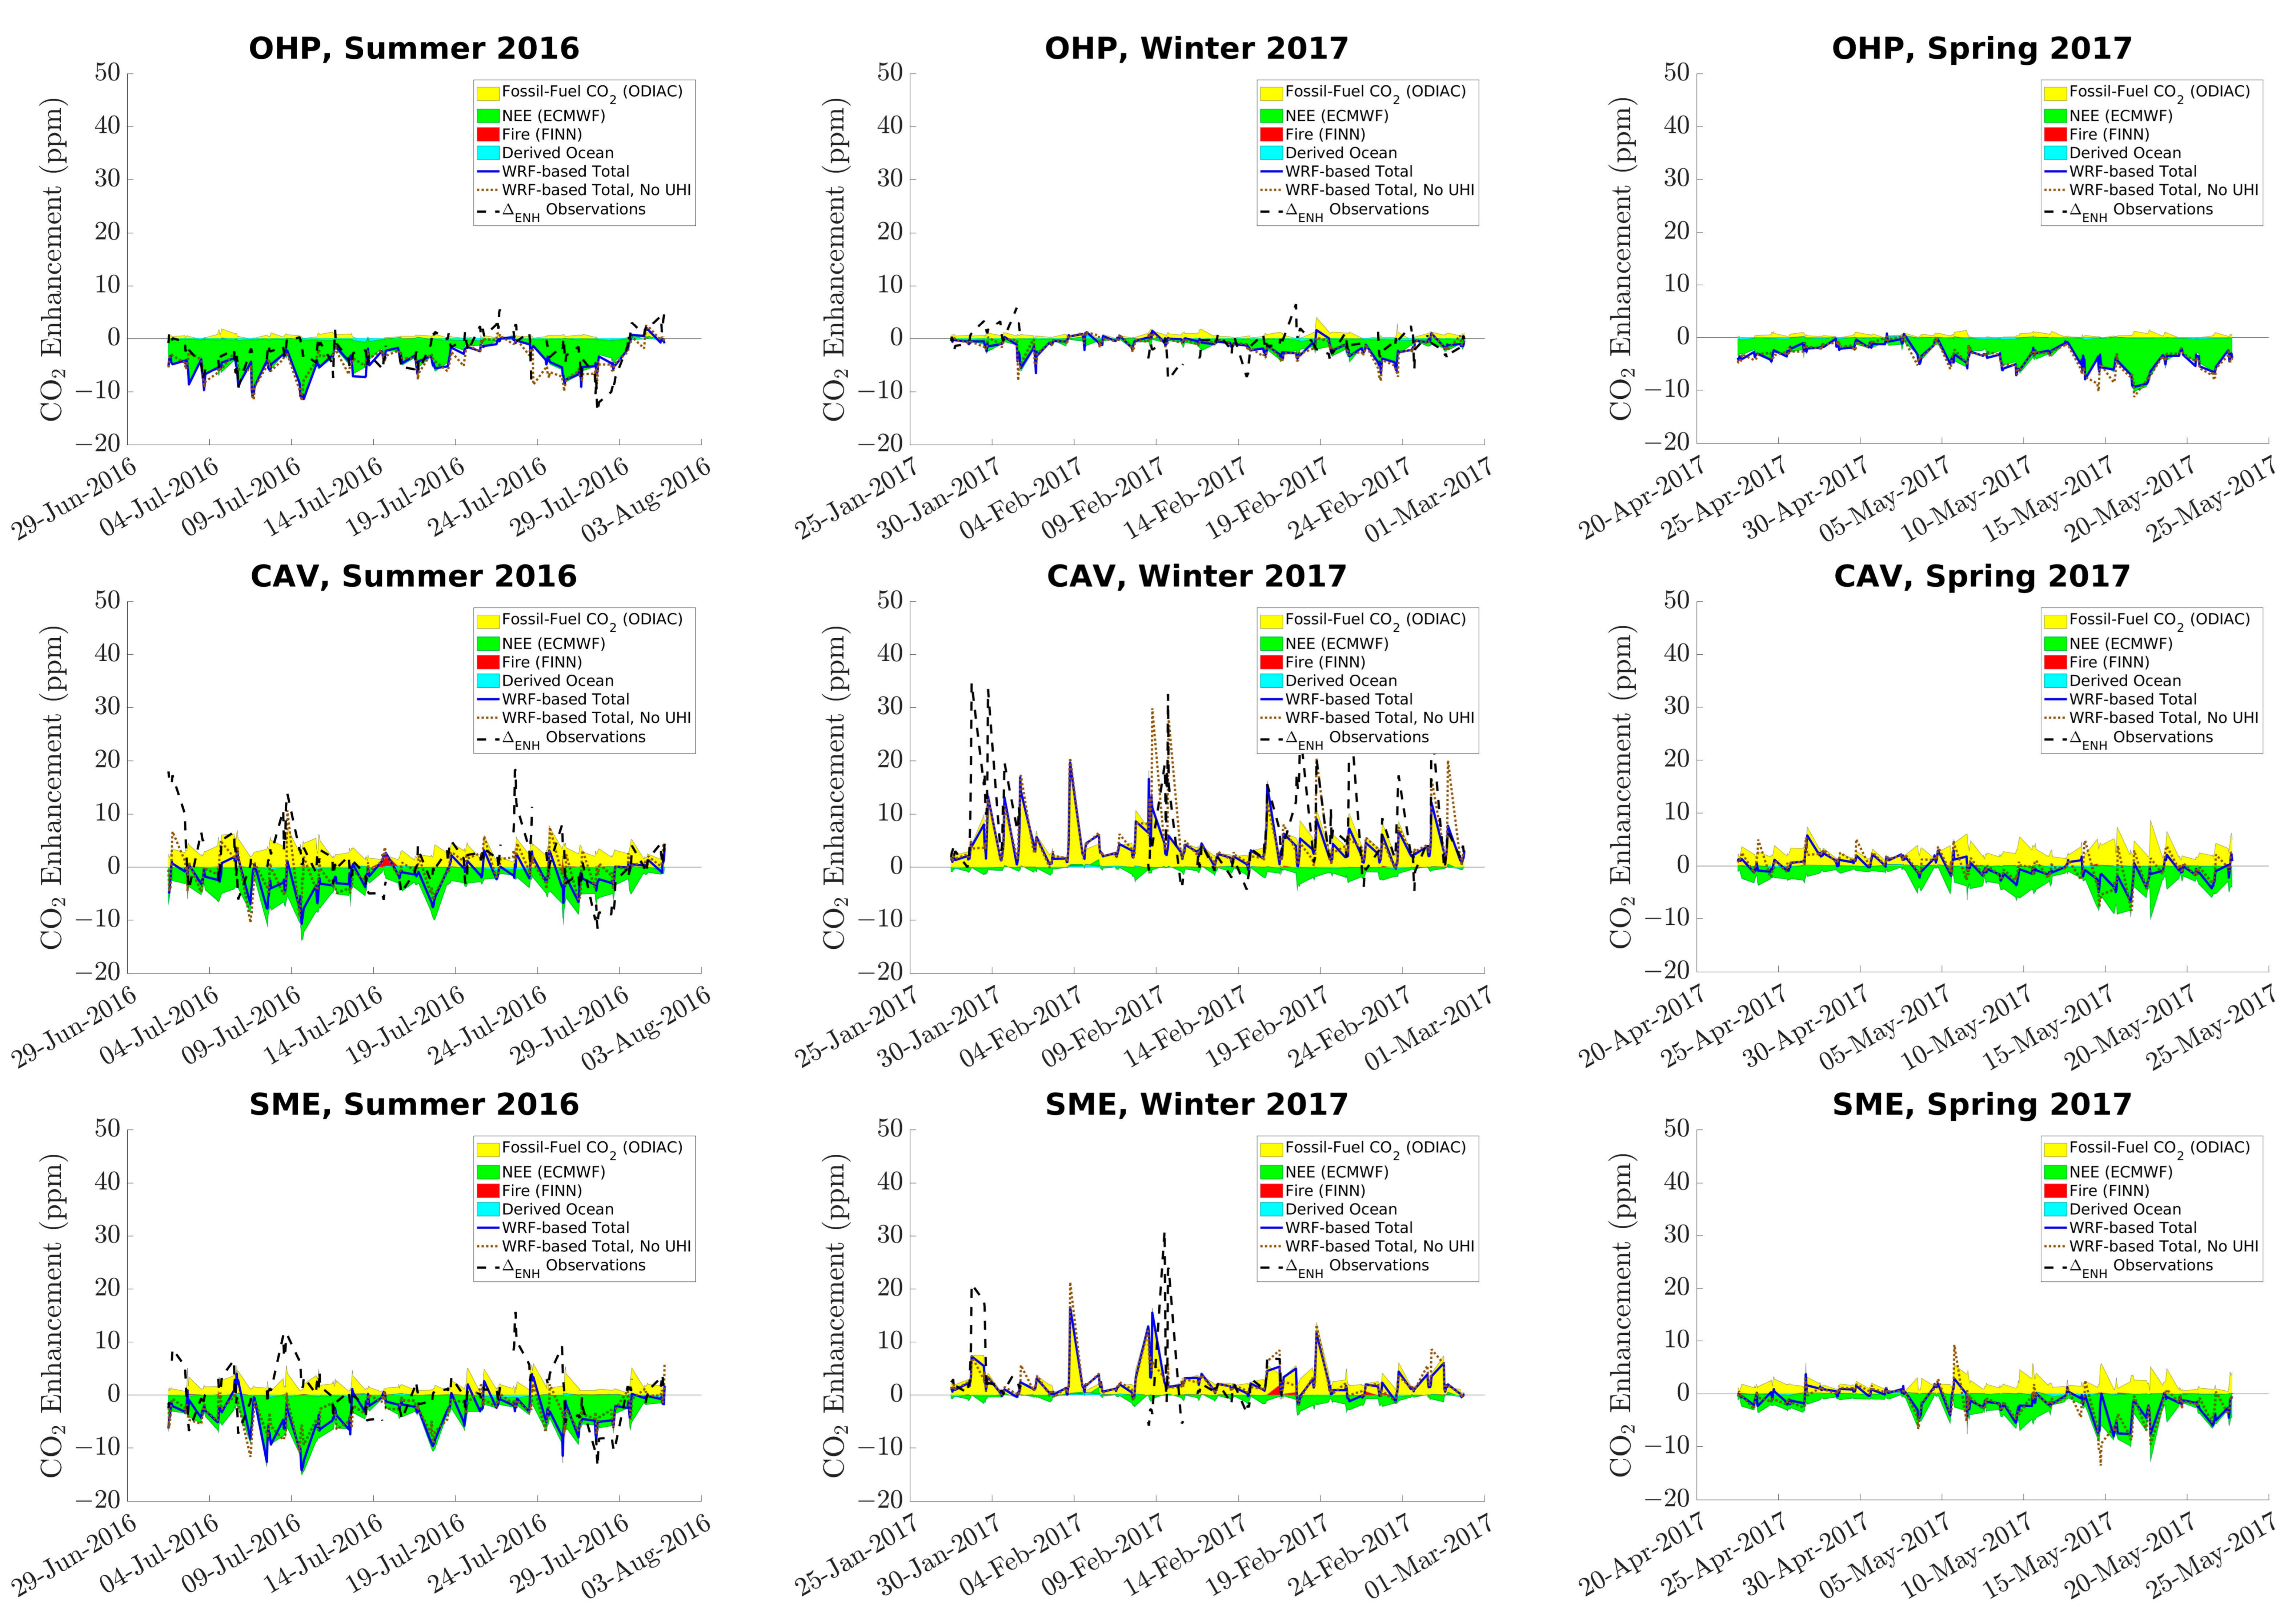
Figure 6 shows this comparison with the component breakdown for three of the sites: OHP at 100 m sampling height in the top row, CAV in the middle row, and SME in the bottom row. The left-hand column shows the Summertime 2016 comparisons, the middle column contains the Wintertime 2017 comparisons, and the right-hand column shows the Springtime 2017 comparisons. The total simulated CO2 value is included as a blue line. We also include the total CO2 value for the simulations that did not include the urban heat island effect, shown as a dotted brown line, although the component breakdowns are left out of the figure. We limit our comparison to only the daytime hours of between 12:00 and 18:00 UTC, where the model’s boundary layer is expected to be sufficiently developed and well-mixed to provide reasonable results. We note that because of the lack of data at ERSA in the Springtime 2017 period, no measurement enhancement time series is available, as this was the designated background site. However, the figures are included to show the component breakdown from the simulations and to allow for comparison against the simulation when the urban heat island module was turned off.
Table 5 shows the mean and one standard deviation of the modeled and observed enhancements for Summertime 2016 and Wintertime 2017. Lauvaux et al. [50] found wintertime enhancements in a similar range for Indianapolis, which has a comparable population. Their winter modeled values were −0.52 ppm compared to their measured enhancements, which is broadly consistent with what we find here. Their analysis did not extend to the summer. Los Angeles has a much stronger CO2 enhancement that can range from 2–8 ppm [95], which during the day is almost entirely due to fossil fuel emissions [25]. Although the former is to be expected due to the larger population and number of emission sources, which work with the local geography to create a persistent urban dome [23], the latter point is consistent across all three seasons, as seen in Figure 6.
First, we note that the modeled and measured enhancement values at OHP are negative and are even stronger in the summertime than in the wintertime. This is because of increased biogenic CO2 uptake, which is logical because OHP is mostly surrounded by vegetation. The modeled enhancement is 74% more pronounced than the observed value, and almost matches the NEE component. As Table 4 shows, the model provides a background value that is 3 ppm higher than the measured marine background. This is not expected, as the biosphere signal in the summer would normally bring the continental background value below that of the marine background. This difference in background values between the model and the observations is partially compensated for by the larger negative enhancement provided by the model. However, the observations do not perfectly follow the NEE component, indicating that the site is likely partly influenced by anthropogenic fluxes, as we be analyzed further below. We note that in Figure 6 the model provides FF fluxes at OHP that are about ten times lower than the NEE ones during the summer (top left-hand panel). In the winter, the enhancement values provided by the model and the observations agree quite well, although the background value is 3.6 ppm lower in the model than in the ERSA data. This is also somewhat surprising, as the continental background would be expected to be higher than the marine background in the winter, when vegetation is dormant and anthropogenic emissions are at their maximum. Here too the modeled enhancement at OHP mostly follows the NEE variations (Figure 6, top middle panel), while the observations show some peaks that are likely due to the influence of anthropogenic emissions, as analyzed further below.
The enhancement values in the city (CAV, in the heart of Marseille) have much stronger anthropogenic CO2 emissions compared to OHP. At CAV, the model indicates that the FF emissions signal is quite similar in winter and in summer, while the biospheric fluxes are five to ten times higher in summer than in winter, and are quite small in the latter period. Depending on wind speed and wind direction, peaks of several ppm can be seen in the observations (in the 20–30 ppm range in wintertime and 5–15 ppm in summertime), which is likely due to the contribution of FF emissions, as analyzed further below. The temporal variation pattern is quite different between the model and the observation, with a higher variability in the observations in both seasons. In wintertime, the modeled CO2 signal mostly follows the FF emissions’ temporal variations and the pattern is closer to the observations; however, the model framework seems to underestimate the contribution of FF emissions, as the modeled peaks only reach the 10–15 ppm range. In summertime, the modeled CO2 signal results from a combination of biospheric and FF fluxes, but again underestimates the observed peaks. Thus, the model seems to underestimate the FF emissions at CAV in both seasons (Figure 6, middle left and middle central panels, respectively), but could also overestimate the biospheric fluxes in summertime or mix too much. This could partly arise from limitations in the modeling framework’s accuracy and spatial and temporal resolution with regard to local urban vegetation. There is a need to establish a detailed database providing this information and the associated biogenic parameters required as inputs in C-TESSEL. Additional field work is needed to further address these questions, including: (i) the use of C14 isotope analysis, potentially with CO measurements, to separate out biogenic and anthropogenic signals (e.g., [96]); (ii) the use of background measurements closer to the city, which would pick up much of the same vegetation signal advected by synoptic airmasses as well as the spatial variability of the background (e.g., [19,97]); and (iii) monitoring of the boundary layer height to infer the correctness of the mixing in the model.
The SME station, which is located where the edge of Marseille meets the coast, shows an observed mean enhancement in the summertime that, while almost zero, is still quite variable as a function of the wind conditions (Figure 6, bottom middle panel). The pattern is similar to that at CAV, but with less apparent influence from anthropogenic emissions evident in both the model and the observations. The model enhancement is more than 3 ppm lower than the observed value, which is compensated for by the higher background value of the model. The model mostly follows the variation in NEE fluxes, but is partly influenced by the FF fluxes. It underestimates the peaks seen in the observations and the observed variability. In the wintertime, the NEE fluxes are much lower than in the summertime, while the FF fluxes are quite similar in both seasons. The modeled enhancement is lower and less variable than the observed one, mostly because the model is not able to reproduce the amplitude of the observed peaks that reach 30 ppm and models them at about half of their observed values. This could be due to an underestimation of the contribution of FF emissions in the model, but might also be due to overly strong mixing. The prevailing winds at this site may play a large role in this issue, as noted in Xueref-Remy et al. [40]; we explore this possibility in further detail in Section 3.4.2.
While the total simulated CO2 line without the urban heat island generally follows the corresponding line in the model that included the urban heat island effect, the match is not perfect. Table 6 shows a series of comparisons at each site for each analysis period to determine how well their performance compares to each other relative to the measured enhancements. This was achieved by first taking the mean value of the magnitudes (i.e., the absolute values) of the differences between either simulation and the measured enhancement value at a particular hour. The value in any given cell in Table 6 is the mean difference value from the simulation with the urban heat island effect minus the mean difference value from the simulation without the urban heat island effect. Because there were no viable data from the ERSA background station during Springtime 2017, this comparison cannot be made for that period.
The results in Table 6 indicate that the simulation with the urban heat island turned off was generally better able to match the measured enhancements, i.e., there are more positive values. In both summer and winter, the simulation without UHI performed significantly better at the coastal SME station (by almost half of a ppm of CO2 in the Summertime 2016 period); this may be due to the coastal position of that station and to the complexities of atmospheric dynamics, particularly in the evolution of the boundary layer caused by the unique topography of Marseille and its interaction with the different sea breeze conditions. This was detailed by Lemonsu et al. [98], who found that the daytime evolution of the boundary layer over Marseille can become dominated by influences from the sea breezes rather than urban effects, such that a UHI module might be overemphasizing these dynamics and causing a mismatch with measurements. Additionally, it is worth noting that the site/period combinations with the most disagreement and the most agreement with respect to each other (SME in Summertime 2016 and CAV in Winter 2017, respectively) correspond with the worst and best site/period combinations for PBL agreement in Table 3.

3.4. Back-Trajectory Footprints

3.4.1. Cumulative Footprints

To showcase how the wind conditions may have changed generally over the course of the different analysis periods, Figure 7 includes maps showing the cumulative footprints from each of the three stations. Following the method described in Section 2.2.3, these footprints are computed only for the daytime hours that match the rest of the analyses, i.e., 12:00–18:00 UTC.
In Figure 7, each season’s footprints mostly follow the terrain, with the Pre-Alps to the North and the Cévennes mountains to the West of the domain. The prevailing wind direction is typically from the west, as would be expected, which is also consistent with previous studies using long-term footprints such as these to qualitatively assess CO2 source regions in Europe (e.g., [99,100]). Similarly, Levin et al. [101]’s aggregated footprints for a station in Paris for October 2017 (only including footprints from 13 h, a mid-afternoon time with well-mixed conditions, consistent with what we present here) show the wind mainly coming from the west except during times when it followed the terrain between the mountains.
Our long-term footprints show that even with only three measurement stations in the area, the footprints are able to reach nearly every part of the domain over the course of the ∼month of each period. Generally speaking, emissions are shown to come from a wider range of areas during the summertime due to more variable synoptic conditions. The wintertime shows a dominant wind direction directly from the east which then traces from the southeast, which is consistent with regular sea breezes that occur in Marseille; however, the direction of these breezes can be complicated by the geometry of the local coastline [43]. The wintertime footprint also shows an increase in air coming from the northwest, indicative of the Mistral wind driven by anticyclonic conditions in the Bay of Biscay, along with an area of low pressure over the Mediterranean Sea. This is as expected, because under these conditions cold air from the north flows between the two pressure systems at lower elevations between the Alps and the Cevennes mountains (see [102,103]), and is consistent with previous wind analyses of the region (e.g., [42,43] ).
We quantified the fraction of anthropogenic emissions constrained by our three-site network by convolving the site footprints with the ODIAC2017 fossil fuel emissions. Using the Summertime 2016 period as an example, we filtered out pixels with relatively small contributions, technically removing pixels where the corresponding flux value was below 1000 mol km−2 month−1. Site footprints cover about 43% of the domain but capture 95.20% of emissions. Similarly, if the threshold is set at 100 mol km−2 month−1, the footprints cover 55.87% of the domain and capture 99.83% of emissions.
While this analysis shows that the emissions in the region appear to be well-constrained, it is worth acknowledging several sources of uncertainty. Our wind analysis shows that there may be significant offset between the modeled and the observed wind direction at any particular point, even if the model’s performance overall is deemed to be good. With enough resources, one way to address this would be to run an ensemble of simulations and generate the corresponding footprints to find the most probable mean footprint of the region for conducting this coverage assessment. Additionally, the uncertainty in the distribution of bottom-up emissions, which can be large, may affect the coverage analysis. A similar approach involving increasing the number of estimates and creating an ensemble analysis would be ideal; however, it is often difficult to find multiple emissions estimates for the same region. Even with these sources of uncertainty, we can conclude from our analysis that the current network is sufficient to constrain a significant fraction of the regional fossil fuel emissions.

3.4.2. Sea Breeze Case Study: 23–24 July 2016

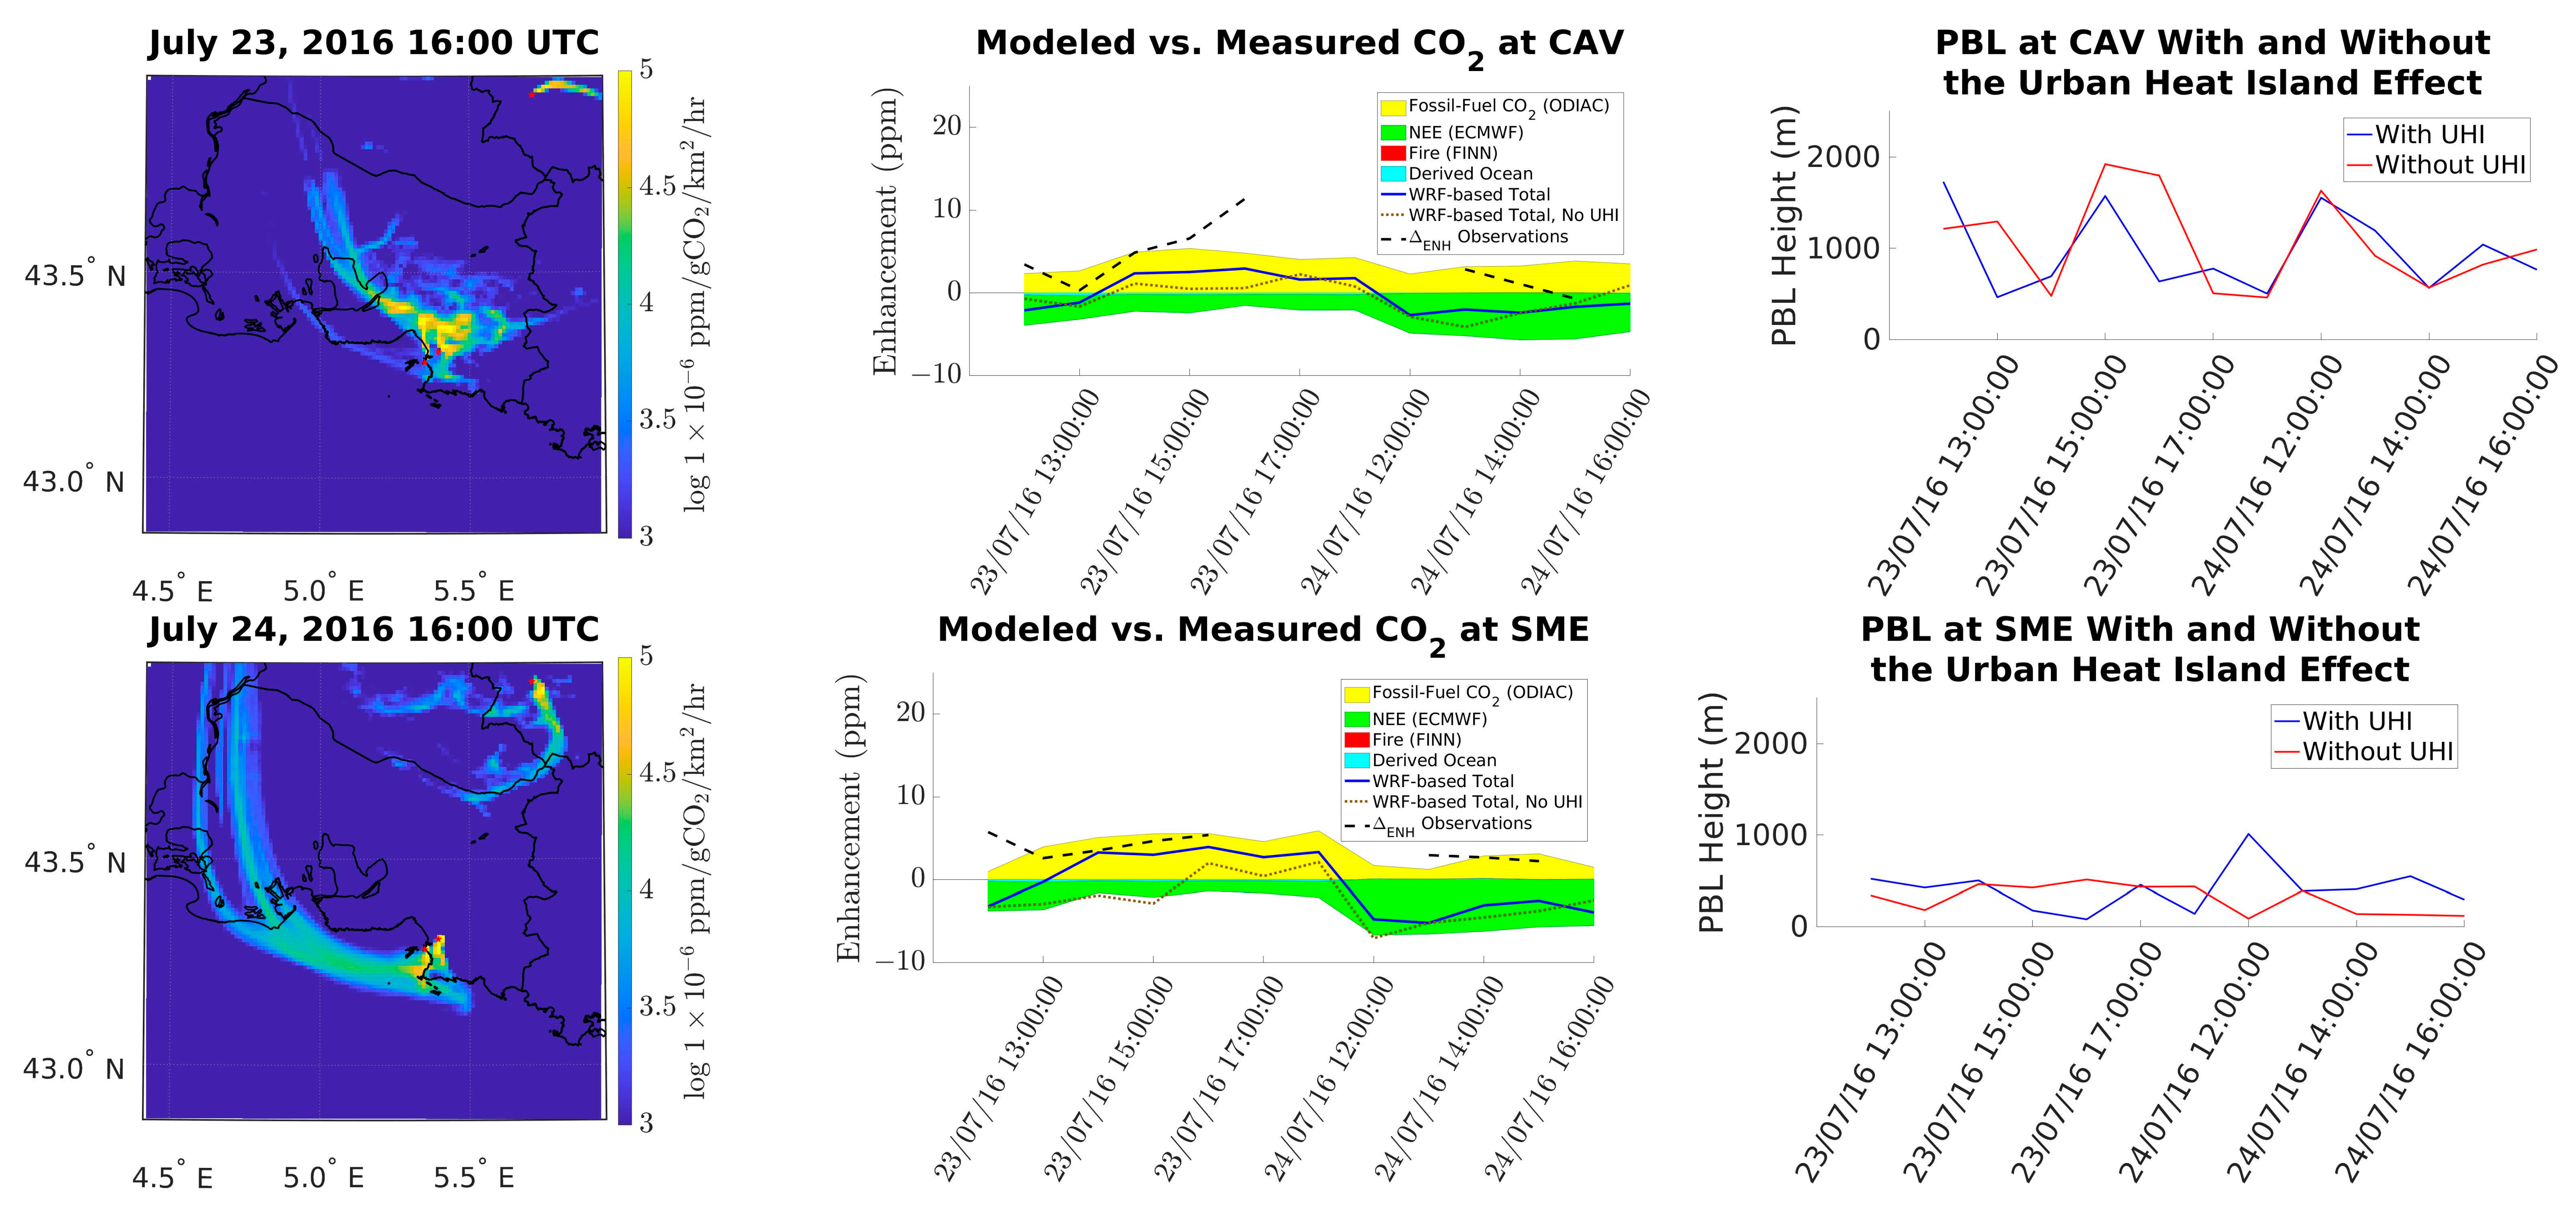
In Figure 5 and Figure 6, we focus on one particular event observed at SME in the summertime, corresponding to a large PBL height mismatch between 23 July 2016 at 16:00 UTC and 24 July 2016 at 16:00 UTC. This 24 h period includes an uncharacteristically significant mismatch in the PBL height for the simulations with and without UHI. The corresponding simulated total CO2 value drops sharply, from 3.94 ppm to −3.94 ppm in the simulation including UHI and from 3.00 ppm to 1.08 ppm in the simulation without UHI, as evidenced in the lower-left panel of Figure 6. A zoomed-in look at this period for these figures is included as the middle and right-hand images along the bottom row of Figure 8.
The corresponding CO2 enhancements from WRF and those observed at the CAV station are shown in Figure 8 (middle panels), while the simulated PBL heights are shown on the right-hand side of the top row. To compare the wind conditions at these hours, the 12 h footprints corresponding to the measurements recorded at each of the OHP, CAV, and SME stations at these times are shown in the left-hand column of Figure 8. These figures are plotted on a log-scale because of the high density of released particles. The footprints for 23 July 2016 16:00 UTC are on the top and those from 24 July 2016 16:00 UTC are on the bottom.
Looking at the footprints on 23 July 2016 at 16:00 UTC, it can be seen that the CO2 enhancement values were higher and that the model captured this better at SME than at CAV. Using data from AtmoSud measured at the CAV site, the wind for the 16:00 UTC hour was 3.9 ms−1 at 10°, coming from the northwest between 3:00 and 16:00 UTC and from the northeast before that, which compares well with the corresponding footprint figure. In the course of the 12 h of the footprints from CAV and SME, the airmasses traveled for about 200 km, but the wind direction was not very stable (NW–NE) and CAV mostly received emissions from the Marseille agglomeration and Berre l’Etang, an industrialized area region near Berre Pond in the central part of the domain (https://cigale.atmosud.org/, accessed on 7 May 2024). The middle panel shows that the observations captured an enhancement that the model does not reproduce. The enhancement is less pronounced at SME, and the model matches the observed enhancement reasonably well when using the UHI module.
The footprints from 24 July 2016 at 16:00 UTC show some distinct differences from those of the previous day at the same time. In particular, we focus on the footprints from CAV and SME stations. The AtmoSud wind data at the CAV site at the 16:00 UTC hour was 4.5 ms−1 at 260°. This seems to indicate a higher wind speed; however, over the course of the 12 h of the footprints the mean hourly wind speed shifted between 0.6 ms−1 and 6.0 ms−1, compared to a range of 0.2 ms−1 to 5.9 ms−1. In effect, the wind speeds across the footprint periods between these two days were very similar. In contrast, the wind direction data for the footprints on 24 July was more stable, starting north and then heading west. The sources seem to have originated north of Montélimar in the Rhone Valley, after which the footprint passed over Fos/La Mède, where there are large industrial sites, then passed over the Bay of Marseille, which should not contain any major sources. The westerly wind observed at CAV and SME corresponds to typical summertime sea-breeze conditions, with a strong influence from the industrialized Rhone valley. Biogenic signals remain dominant in the observed CO2 mixing ratio enhancements, originating from active cropland in the Rhone valley. Here, the model does a poorer job reproducing the observed enhancements at SME but a decent job at CAV.
Overall, this case study demonstrates the differences in CO2 mixing ratio values in the region during land breeze versus sea breeze events. In addition, it showcases the differences in the captured and simulated values between the CAV site near the city center and the SME site on the coast. For example, independent of the land breeze/sea breeze wind conditions, the CAV site captures enhancements that are much more variable compared to the SME site, with the enhancements at SME being more stable throughout. The model tends to underestimate the CO2 enhancement seen at one of the sites under both land-breeze and sea-breeze conditions. On 23 July, under land-breeze conditions, the underestimation happened at CAV, while on 24 July, during sea-breeze conditions, the underestimation happened at SME. There may be several reasons for this mismatch, including underestimation of emissions, overestimation of the biogenic fluxes, misrepresentation of the mixing, etc. The forthcoming ANR COoL-AMmetropolis project aims to use CO, 14C, Volatile Organic Compounds, and Black Carbon measurements to partition fossil fuel signals from biogenic sources, along with LIDAR measurements for better PBL characterization.

4. Conclusions

In this paper, we demonstrate the feasibility of a CO2 modeling framework for the urban–coastal Mediterranean region around Marseille, France. The setup includes emissions maps from anthropogenic, net ecosystem emissions, fire, and ocean components. A seasonal analysis and case study of two specific days are used to showcase the model’s ability to accurately characterize CO2 enhancement events under a variety of conditions unique to the area, although there remains room for improvement in future investigations. We tested the benefits of including or excluding an urban heat island module in the simulation. Additional optimizations of the model for this specific region might include a better accounting of the terrain height and boundary layer dynamics as well as improvements taking into account the specificity of local urban vegetation and the urban background, potentially leading to better model–observation agreement in future investigations of this region. Further studies might also look into improving model performance by incorporating more accurate emission inventories, enhancing model resolution, or using Bayesian methods to estimate emission totals.
Our investigation has confirmed a previously-observed result that there is a positive NEE in the region during summertime; thus, we included a springtime period in our seasonal analysis to allow for a more comprehensive comparison. Our model results seem to indicate that the vegetation signal in the region can be strong compared to the anthropogenic signal, even at the CAV and SME measurement sites situated within and along the coast of the city, respectively. Only in the wintertime was the anthropogenic signal dominant over the vegetation signal, and only at these two sites; this may at least partially be due to the characterization of the local urban vegetation not having sufficiently high accurate and resolution, which is a limitation of the presented modeling framework. We conclude that there is a need to build such databases as inputs to the C-TESSEL model in order to aid future studies. Furthermore, any analysis looking to constrain the fossil fuel CO2 signal for the region will need to use additional methods to accurately account for the local vegetation signal, including using a continental background site closer to the city borders (instead of a marine one) to capture the regional biogenic signal and including the use of measurements such as those from C14 and CO to help distinguish between the fossil fuel and biogenic signals.
In addition, we analyzed the effects of including or excluding an urban heat island module. We found that the choice of inclusion had an effect on the boundary layer height, changing it by as much as ∼35% at SME in Summertime 2016 and by as little as ∼10% at CAV in Wintertime 2017. This amount of change in the boundary layer height can significantly affect the CO2 mixing. We extended the comparison to the CO2 analysis, where the simulation with the UHI module turned off performed better in almost every case we tested, presenting average values that were closer to the measured enhancements than its counterpart with the UHI module turned on. The disconnect in performance was most evident at the coastal SME site, where it was almost half a ppm of CO2 closer to the measured enhancements on average for the Summertime 2016 period. We suspect that these disagreements between the model and measurements may be related to the coastal position of the SME site as well as to the previously identified interrelationship between the Marseille boundary layer and the daytime sea breeze [98,104]. This implies a minimal impact on the ABL evolution from urban influences, such that the inclusion of the UHI module overemphasized this feature. We conclude that sites in this region should be equipped with atmospheric profiles such as those obtained from LIDAR instruments in order to properly constrain PBL simulations with real measurements in future studies.
An additional analysis using back-trajectory footprints was used to illustrate the complex local dynamics over Marseille, which may require specific network designs. Notably, a greater area of the region contributes to measurements more often during the summertime period than during the wintertime or springtime periods. A case study looking at the wind conditions between 23 July 2016 at 16:00 UTC and 24 July 2016 at 16:00 UTC demonstrated the nuanced ability of the model to capture short-term sea-breeze conditions with a low mixing ratio versus land-breeze events with a high mixing ratio at the coastal SME station. In the case study, it was again found that simulations with and without the UHI module were sensitive to these conditions with respect to how the boundary layer is affected and, correspondingly, the CO2. Future studies may want to use these back-trajectories to create influence functions for use in a Bayesian analysis of optimized emissions estimates.
The establishment of this CO2 modeling framework in the urban–coastal Aix-Marseille region can be useful for policy and practical applications. Our model can be used in conjunction with continuously monitoring CO2 measurement sites to track pollution events to their most probable source sectors, assess the effectiveness of mitigation efforts over time, and inform decision-makers about the best areas to implement new mitigation strategies. The results from this and future studies could be used to better constrain emissions in other urban–coastal regions. With such a system in place, urban planners, environmental agencies, and decision-makers will be better positioned to implement plans with long-term rewards for improving air quality and combating climate change.

Author Contributions

Conceptualization, B.N., I.X.-R. and T.L.; methodology, B.N., I.X.-R. and T.L.; software, C.Y. and M.H.; validation, B.N., I.X.-R. and T.L.; formal analysis, B.N. and I.X.-R.; investigation, B.N. and I.X.-R.; resources, I.X.-R., C.Y. and J.P.; data curation, I.X.-R., D.P., A.A., T.O., M.M. and C.W.-R.; writing—original draft preparation, B.N., I.X.-R. and T.L.; writing—review and editing, B.N., I.X.-R., T.L., C.W.-R., T.O. and M.H.; visualization, B.N. and I.X.-R.; supervision, I.X.-R.; project administration, I.X.-R.; funding acquisition, I.X.-R. and J.P. All authors have read and agreed to the published version of the manuscript.

Funding

This study is part of the AMC project (Aix-Marseille Carbon Pilot program) through the A*MIDEX project ANR-11-IDEX-0001-02, funded by the French National Research Agency (ANR).

Institutional Review Board Statement

Not applicable.

Informed Consent Statement

Not applicable.

Data Availability Statement

The data presented in this study are available on request from the corresponding author due to technical and security limitations.

Acknowledgments

We acknowledge the ICOS-Fr National Observation Service for support in acquisition and validation of the OHP and ERSA datasets. We thank the ICOS-France team for their technical support, in particular Pierre-Eric Blanc, Marc Delmotte, Delphine Combaz, and Michel Ramonet, and for providing us with the ERSA data. CarbonTracker Europe results were provided by the Wageningen University and Research Center (Wageningen, NL) http://www.carbontracker.eu, accessed on 27 September 2024. This work was supported by the French research program Make Our Planet Great Again (Project CIUDAD). We thank Dominique Lefèvre and Thibaut Wagener for their contributions to the acquisition of the pCO2 data gathered in the Bay of Marseille. The ODIAC data product is available from the Global Environmental Database hosted by the Center for Global Environmental Research at Japan’s National Institute for Environmental Studies (NIES) (https://db.cger.nies.go.jp/dataset/ODIAC/, accessed on 27 September 2024).

Conflicts of Interest

The authors declare no conflicts of interest.

Appendix A

Here, we include some figures and explanations that add further context to the body of the manuscript.
Figure A1. Positions of the twelve stations recording meteorological measurements that were within our 1 km domain boundaries.
Atmosphere 15 01193 g0a1

References

  1. IPCC. Climate Change 2014: Synthesis Report. In Contribution of Working Groups I, II and III to the Fifth Assessment Report of the Intergovernmental Panel on Climate Change; Core Writing Team, Pachauri, R.K., Meyer, L.A., Eds.; IPCC: Geneva, Switzerland, 2014; 151p, pp. 1–112. [Google Scholar] [CrossRef]
  2. Le Quéré, C.; Andrew, R.M.; Friedlingstein, P.; Sitch, S.; Pongratz, J.; Manning, A.C.; Korsbakken, J.I.; Peters, G.P.; Canadell, J.G.; Jackson, R.B.; et al. Global Carbon Budget 2017. Earth Syst. Sci. Data Discuss. 2017, 10, 405–448. [Google Scholar] [CrossRef]
  3. Masson-Delmotte, V.; Zhai, P.; Pirani, A.; Connors, S.L.; Péan, C.; Berger, S.; Caud, N.; Chen, Y.; Goldfarb, L.; Gomis, M.; et al. Climate change 2021: The physical science basis. Contrib. Work. Group I Sixth Assess. Rep. Intergov. Panel Clim. Chang. 2021, 2, 2391. [Google Scholar]
  4. Seto, K.C.; Dhakal, S.; Bigio, A.; Blanco, H.; Delgado, G.C.; Dewar, D.; Huang, L.; Inaba, A.; Kansal, A.; Lwasa, S.; et al. Human Settlements, Infrastructure, and Spatial Planning. In Climate Change 2014: Mitigation of Climate Change. Contribution of Working Group III to the Fifth Assessment Report of the Intergovernmental Panel on Climate Change; Edenhofer, O., Pichs-Madruga, R., Sokona, Y., Farahani, E., Kadner, S., Seyboth, K., Adler, A., Baum, I., Brunner, S., Eickemeier, P., et al., Eds.; Cambridge University Press: Cambridge, UK; New York, NY, USA, 2014; pp. 923–1000. [Google Scholar] [CrossRef]
  5. MedECC. Climate and Environmental Change in the Mediterranean Basin—Current Situation and Risks for the Future. First Mediterranean Assessment Report; Technical report; Version Number: 1; Zenodo: Marseille, France, 2020; ISBN 9782957741618. [Google Scholar] [CrossRef]
  6. Ciais, P.; Dolman, A.J.; Bombelli, A.; Duren, R.; Peregon, A.; Rayner, P.J.; Miller, C.; Gobron, N.; Kinderman, G.; Marland, G.; et al. Current systematic carbon-cycle observations and the need for implementing a policy-relevant carbon observing system. Biogeosciences 2014, 11, 3547–3602. [Google Scholar] [CrossRef]
  7. Lauvaux, T.; Gurney, K.R.; Miles, N.L.; Davis, K.J.; Richardson, S.J.; Deng, A.; Nathan, B.J.; Oda, T.; Wang, J.A.; Hutyra, L.; et al. Policy-relevant assessment of urban CO2 emissions. Environ. Sci. Technol. 2020, 54, 10237–10245. [Google Scholar] [CrossRef]
  8. Carney, S.; Shackley, S. The greenhouse gas regional inventory project (GRIP): Designing and employing a regional greenhouse gas measurement tool for stakeholder use. Energy Policy 2009, 37, 4293–4302. [Google Scholar] [CrossRef]
  9. Ewing-Thiel, J.; Manarolla, X. Policy Update: ICLEI USA draft framework for measuring and reporting community GHG emissions. Carbon Manag. 2011, 2, 371–375. [Google Scholar] [CrossRef]
  10. Fong, K.W.; Sotos, M.; Doust, M.; Schultz, S.; Marques, A.; Deng-Beck, C. Global Protocol for Community-Scale Greenhouse Gas Emission Inventories: An Accounting and Reporting Standard for Cities; Technical Report; World Resources Institute: New York, NY, USA, 2015. [Google Scholar]
  11. WRI/WBCSD. The GHG Protocol for Project Accounting; Rev. ed.; WRI: Washington, DC, USA; WBCSD: Geneva, Switzerland, 2004. [Google Scholar]
  12. Gurney, K.R.; Razlivanov, I.; Song, Y.; Zhou, Y.; Benes, B.; Abdul-Massih, M. Quantification of Fossil Fuel CO2 Emissions on the Building/Street Scale for a Large U.S. City. Environ. Sci. Technol. 2012, 46, 12194–12202. [Google Scholar] [CrossRef]
  13. Gurney, K.R.; Liang, J.; Patarasuk, R.; O’Keeffe, D.; Huang, J.; Hutchins, M.; Lauvaux, T.; Turnbull, J.C.; Shepson, P.B. Reconciling the differences between a bottom-up and inverse-estimated FFCO2 emissions estimate in a large US urban area. Elem. Sci. Anthr. 2017, 5, 44. [Google Scholar] [CrossRef]
  14. Committee on Development of a Framework for Evaluating Global Greenhouse Gas Emissions Information for Decision Making; Board on Atmospheric Sciences and Climate; Division on Earth and Life Studies; National Academies of Sciences, Engineering, and Medicine. Greenhouse Gas Emissions Information for Decision Making: A Framework Going Forward; National Academies Press: Washington, DC, USA, 2022. [Google Scholar] [CrossRef]
  15. IPCC. 2019 Refinement to the 2006 IPCC Guidelines for National Greenhouse Gas Inventories; Calvo Buendia, E., Tanabe, K., Kranjc, A., Baasansuren, J., Fukuda, M., Ngarize, S., Osako, A., Pyrozhenko, Y., Shermanau, P., Federici, S., Eds.; IPCC: Geneva, Switzerland, 2019. [Google Scholar]
  16. Nisbet, E.; Weiss, R. Top-Down Versus Bottom-Up. Science 2010, 328, 1241–1243. [Google Scholar] [CrossRef]
  17. Hutyra, L.R.; Duren, R.; Gurney, K.R.; Grimm, N.; Kort, E.A.; Larson, E.; Shrestha, G. Urbanization and the carbon cycle: Current capabilities and research outlook from the natural sciences perspective. Earth’s Future 2014, 2, 473–495. [Google Scholar] [CrossRef]
  18. Staufer, J.; Broquet, G.; Bréon, F.M.; Puygrenier, V.; Chevallier, F.; Xueref-Rémy, I.; Dieudonné, E.; Lopez, M.; Schmidt, M.; Ramonet, M.; et al. The first 1-year-long estimate of the Paris region fossil fuel CO2 emissions based on atmospheric inversion. Atmos. Chem. Phys. 2016, 16, 14703–14726. [Google Scholar] [CrossRef]
  19. Xueref-Remy, I.; Dieudonné, E.; Vuillemin, C.; Lopez, M.; Lac, C.; Schmidt, M.; Delmotte, M.; Chevallier, F.; Ravetta, F.; Perrussel, O.; et al. Diurnal, synoptic and seasonal variability of atmospheric CO2 in the Paris megacity area. Atmos. Chem. Phys. 2018, 18, 3335–3362. [Google Scholar] [CrossRef]
  20. Breón, F.M.; Broquet, G.; Puygrenier, V.; Chevallier, F.; Xueref-Remy, I.; Ramonet, M.; Dieudonné, E.; Lopez, M.; Schmidt, M.; Perrussel, O.; et al. An attempt at estimating Paris area CO2 emissions from atmospheric concentration measurements. Atmos. Chem. Phys. 2015, 15, 1707–1724. [Google Scholar] [CrossRef]
  21. Ammoura, L.; Xueref-Remy, I.; Gros, V.; Baudic, A.; Bonsang, B.; Petit, J.E.; Perrussel, O.; Bonnaire, N.; Sciare, J.; Chevallier, F. Atmospheric measurements of ratios between CO2 and co-emitted species from traffic: A tunnel study in the Paris megacity. Atmos. Chem. Phys. 2014, 14, 12871–12882. [Google Scholar] [CrossRef]
  22. Lac, C.; Donnelly, R.P.; Masson, V.; Pal, S.; Riette, S.; Donier, S.; Queguiner, S.; Tanguy, G.; Ammoura, L.; Xueref-Remy, I. CO2 dispersion modelling over Paris region within the CO2-MEGAPARIS project. Atmos. Chem. Phys. 2013, 13, 4941–4961. [Google Scholar] [CrossRef]
  23. Kort, E.A.; Frankenberg, C.; Miller, C.E.; Oda, T. Space-based observations of megacity carbon dioxide. Geophys. Res. Lett. 2012, 39, 17. [Google Scholar] [CrossRef]
  24. Brioude, J.; Angevine, W.M.; Ahmadov, R.; Kim, S.W.; Evan, S.; McKeen, S.A.; Hsie, E.Y.; Frost, G.J.; Neuman, J.A.; Pollack, I.B.; et al. Top-down estimate of surface flux in the Los Angeles Basin using a mesoscale inverse modeling technique: Assessing anthropogenic emissions of CO, NOx and CO2 and their impacts. Atmos. Chem. Phys. 2013, 13, 3661–3677. [Google Scholar] [CrossRef]
  25. Newman, S.; Jeong, S.; Fischer, M.L.; Xu, X.; Haman, C.L.; Lefer, B.; Alvarez, S.; Rappenglueck, B.; Kort, E.A.; Andrews, A.E.; et al. Diurnal tracking of anthropogenic CO2 emissions in the Los Angeles basin megacity during spring 2010. Atmos. Chem. Phys. 2013, 13, 4359–4372. [Google Scholar] [CrossRef]
  26. Feng, S.; Lauvaux, T.; Newman, S.; Rao, P.; Ahmadov, R.; Deng, A.; Díaz-Isaac, L.I.; Duren, R.M.; Fischer, M.L.; Gerbig, C.; et al. Los Angeles megacity: A high-resolution land-atmosphere modelling system for urban CO2 emissions. Atmos. Chem. Phys. 2016, 16, 9019–9045. [Google Scholar] [CrossRef]
  27. Strong, C.; Stwertka, C.; Bowling, D.; Stephens, B.; Ehleringer, J. Urban carbon dioxide cycles within the Salt Lake Valley: A multiple-box model validated by observations. J. Geophys. Res. 2011, 116, D15. [Google Scholar] [CrossRef]
  28. Nehrkorn, T.; Henderson, J.; Leidner, M.; Mountain, M.; Eluszkiewicz, J.; McKain, K.; Wofsy, S. WRF simulations of the urban circulation in the salt lake city area for CO2 modeling. J. Appl. Meteorol. Climatol. 2013, 52, 323–340. [Google Scholar] [CrossRef]
  29. McKain, K.; Wofsy, S.C.; Nehrkorn, T.; Eluszkiewicz, J.; Ehleringer, J.R.; Stephens, B.B. Assessment of ground-based atmospheric observations for verification of greenhouse gas emissions from an urban region. Proc. Natl. Acad. Sci. USA 2012, 109, 8423–8428. [Google Scholar] [CrossRef] [PubMed]
  30. Miles, N.; Richardson, S.; Davis, K.; Lauvaux, T.; Deng, A.; Turnbull, J.; Sweeney, C.; Gurney, K.; Patarasuk, R.; Razlivanov, I.; et al. Quantification of urban atmospheric boundary layer greenhouse gas dry mole fraction enhancements: Results from the Indianapolis Flux Experiment (INFLUX). Elem. Sci. Anthr. 2017, 5, 27. [Google Scholar] [CrossRef]
  31. Davis, K.J.; Deng, A.; Lauvaux, T.; Miles, N.L.; Richardson, S.J.; Sarmiento, D.P.; Gurney, K.R.; Hardesty, R.M.; Bonin, T.A.; Brewer, W.A.; et al. The Indianapolis Flux Experiment (INFLUX): A test-bed for developing urban greenhouse gas emission measurements. Elem. Sci. Anthr. 2017, 5, 21. [Google Scholar] [CrossRef] [PubMed]
  32. Park, C.; Park, S.Y.; Gurney, K.R.; Gerbig, C.; DiGangi, J.P.; Choi, Y.; Lee, H.W. Numerical simulation of atmospheric CO2 concentration and flux over the Korean Peninsula using WRF-VPRM model during Korus-AQ 2016 campaign. PLoS ONE 2020, 15, e0228106. [Google Scholar] [CrossRef] [PubMed]
  33. Zhao, X.; Marshall, J.; Hachinger, S.; Gerbig, C.; Frey, M.; Hase, F.; Chen, J. Analysis of total column CO2 and CH4 measurements in Berlin with WRF-GHG. Atmos. Chem. Phys. 2019, 19, 11279–11302. [Google Scholar] [CrossRef]
  34. Callewaert, S.; Brioude, J.; Langerock, B.; Duflot, V.; Fonteyn, D.; Müller, J.F.; Metzger, J.M.; Hermans, C.; Kumps, N.; Ramonet, M.; et al. Analysis of CO2, CH4, and CO surface and column concentrations observed at Réunion Island by assessing WRF-Chem simulations. Atmos. Chem. Phys. 2022, 22, 7763–7792. [Google Scholar] [CrossRef]
  35. Angevine, W.M.; Eddington, L.; Durkee, K.; Fairall, C.; Bianco, L.; Brioude, J. Meteorological model evaluation for CalNex 2010. Mon. Weather Rev. 2012, 140, 3885–3906. [Google Scholar] [CrossRef]
  36. Conil, S.; Hall, A. Local regimes of atmospheric variability: A case study of Southern California. J. Clim. 2006, 19, 4308–4325. [Google Scholar] [CrossRef]
  37. Ulrickson, B.L.; Mass, C.F. Numerical investigation of mesoscale circulations over the Los Angeles Basin. Part II: Synoptic influences and pollutant transport. Mon. Weather Rev. 1990, 118, 2162–2184. [Google Scholar] [CrossRef]
  38. Pérez-Landa, G.; Ciais, P.; Gangoiti, G.; Palau, J.; Carrara, A.; Gioli, B.; Miglietta, F.; Schumacher, M.; Millán, M.; Sanz, M. Mesoscale circulations over complex terrain in the Valencia coastal region, Spain—Part 2: Modeling CO2 transport using idealized surface fluxes. Atmos. Chem. Phys. 2007, 7, 1851–1868. [Google Scholar] [CrossRef]
  39. INSEE. Résultats du Recensement de la Population; INSEE: Paris, France, 2018.
  40. Xueref-Remy, I.; Milne, M.; Zoghbi, N.; Yohia, C.; Armengaud, A.; Blanc, P.E.; Delmotte, M.; Piazzola, J.; Nathan, B.; Ramonet, M.; et al. Assessing atmospheric CO2 variability in the Aix-Marseille metropolis area (France) and its coastal Mediterranean Sea at different time scales within the AMC Project. In Proceedings of the The 3rd ICOS Scientific Conference, Prague, Czech Republic, 11–13 September 2018. [Google Scholar]
  41. Xueref-Remy, I.; Milne, M.; Zoghbi, N.; Lelandais, L.; Riandet, A.; Armengaud, A.; Gille, G.; Lanzi, L.; Oppo, S.; Brégonzio-Rozier, L.; et al. Analysis of atmospheric CO2 variability in the Marseille city area and the north-west Mediterranean basin at different time scales. Atmos. Environ. X 2023, 17, 100208. [Google Scholar] [CrossRef]
  42. Cros, B.; Durand, P.; Cachier, H.; Drobinski, P.; Fréjafon, E.; Kottmeier, C.; Perros, P.E.; Peuch, V.H.; Ponche, J.L.; Robin, D.; et al. The ESCOMPTE program: An overview. Atmos. Res. 2004, 69, 241–279. [Google Scholar] [CrossRef]
  43. Grimmond, C.; Salmond, J.; Oke, T.R.; Offerle, B.; Lemonsu, A. Flux and turbulence measurements at a densely built-up site in Marseille: Heat, mass (water and carbon dioxide), and momentum. J. Geophys. Res. Atmos. 2004, 109, D24. [Google Scholar] [CrossRef]
  44. Mestayer, P.G.; Durand, P.; Augustin, P.; Bastin, S.; Bonnefond, J.M.; Bénech, B.; Campistron, B.; Coppalle, A.; Delbarre, H.; Dousset, B.; et al. The urban boundary-layer field campaign in Marseille (UBL/CLU-ESCOMPTE): Set-up and first results. Bound.-Layer Meteorol. 2005, 114, 315–365. [Google Scholar] [CrossRef]
  45. Gallardo, C.; Gil, V.; Hagel, E.; Tejeda, C.; de Castro, M. Assessment of climate change in Europe from an ensemble of regional climate models by the use of Köppen-Trewartha classification. Int. J. Climatol. 2013, 33, 2157–2166. [Google Scholar] [CrossRef]
  46. Givon, Y.; Keller, D., Jr.; Silverman, V.; Pennel, R.; Drobinski, P.; Raveh-Rubin, S. Large-scale drivers of the mistral wind: Link to Rossby wave life cycles and seasonal variability. Weather Clim. Dyn. 2021, 2, 609–630. [Google Scholar] [CrossRef]
  47. Skamarock, W.C.; Klemp, J.B. A time-split nonhydrostatic atmospheric model for weather research and forecasting applications. J. Comput. Phys. 2008, 227, 3465–3485. [Google Scholar] [CrossRef]
  48. Grell, G.A.; Peckham, S.E.; Schmitz, R.; McKeen, S.A.; Frost, G.; Skamarock, W.C.; Eder, B. Fully coupled “online” chemistry within the WRF model. Atmos. Environ. 2005, 39, 6957–6975. [Google Scholar] [CrossRef]
  49. Deng, A.; Lauvaux, T.; Davis, K.J.; Gaudet, B.J.; Milkes, N.; Richardson, S.J.; Wu, K.; Sarmiento, D.P.; Hardesty, R.M.; Bonin, T.A.; et al. Toward Reduced Transport Errors in a High Resolution Urban CO2 Inversion System. Elem. Sci. Anthr. 2017, 5, 20. [Google Scholar] [CrossRef]
  50. Lauvaux, T.; Miles, N.L.; Deng, A.; Richardson, S.J.; Cambaliza, M.O.; Davis, K.J.; Gaudet, B.; Gurney, K.R.; Huang, J.; O’Keefe, D.; et al. High resolution atmospheric inversion of urban CO2 emissions during the dormant season of the Indianapolis Flux Experiment (INFLUX). J. Geophys. Res. Atmos. 2016, 121, 5213–5236. [Google Scholar] [CrossRef] [PubMed]
  51. Chen, F.; Dudhia, J. Coupling an Advanced Land Surface–Hydrology Model with the Penn State–NCAR MM5 Modeling System. Part I: Model Implementation and Sensitivity. Mon. Weather Rev. 2001, 129, 569–585. [Google Scholar] [CrossRef]
  52. Tewari, M.; Chen, F.; Wang, W.; Dudhia, J.; LeMone, M.; Mitchell, K.; Ek, M.; Gayno, G.; Wegiel, J.; Cuenca, R. Implementation and verification of the unified NOAH land surface model in the WRF model. In Proceedings of the 20th Conference on Weather Analysis and Forecasting/16th Conference on Numerical Weather Prediction, Seattle, WA, USA, 12–16 January 2004; Volume 1115. [Google Scholar]
  53. Oda, T.; Maksyutov, S. A very high-resolution (1kmx1 km) global fossil fuel CO2 emission inventory derived using a point source database and satellite observations of nighttime lights. Atmos. Chem. Phys. 2011, 11, 543–556. [Google Scholar] [CrossRef]
  54. Oda, T.; Maksyutov, S.; Andres, R.J. The Open-source Data Inventory for Anthropogenic CO2, version 2016 (ODIAC2016): A global monthly fossil fuel CO2; gridded emissions data product for tracer transport simulations and surface flux inversions. Earth Syst. Sci. Data 2018, 10, 87–107. [Google Scholar] [CrossRef]
  55. Boussetta, S.; Balsamo, G.; Beljaars, A.; Panareda, A.A.; Calvet, J.C.; Jacobs, C.; Van Den Hurk, B.; Viterbo, P.; Lafont, S.; Dutra, E.; et al. Natural land carbon dioxide exchanges in the ECMWF integrated forecasting system: Implementation and offline validation. J. Geophys. Res. Atmos. 2013, 118, 5923–5946. [Google Scholar] [CrossRef]
  56. ECMWF. IFS Documentation—Cy37r2 Operational implementation 18 May 2011 Part IV: Physical Processes. In ECMWF IFS Documentation; ECMWF: Reading, UK, 2011. [Google Scholar]
  57. Wiedinmyer, C.; Akagi, S.K.; Yokelson, R.J.; Emmons, L.K.; Al-Saadi, J.A.; Orlando, J.J.; Soja, A.J. Geoscientific Model Development Discussions The Fire INventory from NCAR (FINN)—A high resolution global model to estimate the emissions from open burning. Geosci. Model Dev. Discuss 2010, 3, 2439–2476. [Google Scholar] [CrossRef]
  58. Peters, W.; Krol, M.C.; van der Werf, G.R.; Houweling, S.; Jones, C.D.; Hughes, J.; Schaefer, K.; Masarie, K.A.; Jacobson, A.R.; Miller, J.B.; et al. Seven years of recent European net terrestrial carbon dioxide exchange constrained by atmospheric observations. Glob. Chang. Biol. 2010, 16, 1317–1337. [Google Scholar] [CrossRef]
  59. Van Der Laan-Luijkx, I.T.; Van Der Velde, I.R.; Van Der Veen, E.; Tsuruta, A.; Stanislawska, K.; Babenhauserheide, A.; Fang Zhang, H.; Liu, Y.; He, W.; Chen, H.; et al. The CarbonTracker Data Assimilation Shell (CTDAS) v1.0: Implementation and global carbon balance 2001–2015. Geosci. Model Dev. 2017, 10, 2785–2800. [Google Scholar] [CrossRef]
  60. Oda, T.; Lauvaux, T.; Lu, D.; Rao, P.; Miles, N.L.; Richardson, S.J.; Gurney, K.R. On the impact of granularity of space-based urban CO2 emissions in urban atmospheric inversions: A case study for Indianapolis, IN. Elem. Sci. Anthr. 2017, 5, 28. [Google Scholar] [CrossRef]
  61. Oda, T.; Maksyutov, S. ODIAC Fossil Fuel CO2 Emissions Dataset (ODIAC2017); Center for Global Environmental Research, National Institute for Environmental Studies: Tsukuba, Japan, 2015. [CrossRef]
  62. Pugliese, S.C.; Murphy, J.G.; Vogel, F.R.; Moran, M.D.; Zhang, J.; Zheng, Q.; Stroud, C.A.; Ren, S.; Worthy, D.; Broquet, G. High-resolution quantification of atmospheric CO2 mixing ratios in the Greater Toronto Area, Canada. Atmos. Chem. Phys. 2018, 18, 3387–3401. [Google Scholar] [CrossRef]
  63. Emmons, L.K.; Walters, S.; Hess, P.G.; Lamarque, J.F.; Pfister, G.G.; Fillmore, D.; Granier, C.; Guenther, A.; Kinnison, D.; Laepple, T.; et al. Description and evaluation of the Model for Ozone and Related chemical Tracers, version 4 (MOZART-4). Geosci. Model Dev. 2010, 3, 43–67. [Google Scholar] [CrossRef]
  64. Wimart-Rousseau, C.; Lajaunie-Salla, K.; Marrec, P.; Wagener, T.; Raimbault, P.; Lagadec, V.; Lafont, M.; Garcia, N.; Diaz, F.; Pinazo, C.; et al. Temporal variability of the carbonate system and air-sea CO2 exchanges in a Mediterranean human-impacted coastal site. Estuar. Coast. Shelf Sci. 2020, 236, 106641. [Google Scholar] [CrossRef]
  65. Weiss, R.F.; Price, B.A. Nitrous oxide solubility in water and seawater. Mar. Chem. 1980, 8, 347–359. [Google Scholar] [CrossRef]
  66. Wanninkhof, R. Relationship between wind speed and gas exchange over the ocean revisited. Limnol. Oceanogr. Methods 2014, 12, 351–362. [Google Scholar] [CrossRef]
  67. Najjar, R.G.; Herrmann, M.; Alexander, R.; Boyer, E.W.; Burdige, D.J.; Butman, D.; Cai, W.; Canuel, E.A.; Chen, R.F.; Friedrichs, M.A.M.; et al. Carbon Budget of Tidal Wetlands, Estuaries, and Shelf Waters of Eastern North America. Glob. Biogeochem. Cycles 2018, 32, 389–416. [Google Scholar] [CrossRef]
  68. Peters, W.; Miller, J.B.; Whitaker, J.; Denning, A.S.; Hirsch, A.; Krol, M.C.; Zupanski, D.; Bruhwiler, L.; Tans, P.P. An ensemble data assimilation system to estimate CO2 surface fluxes from atmospheric trace gas observations. J. Geophys. Res. Atmos. 2005, 110, D24. [Google Scholar] [CrossRef]
  69. Peters, W.; Jacobson, A.R.; Sweeney, C.; Andrews, A.E.; Conway, T.J.; Masarie, K.; Miller, J.B.; Bruhwiler, L.M.P.; Petron, G.; Hirsch, A.I.; et al. An atmospheric perspective on North American carbon dioxide exchange: CarbonTracker. Proc. Natl. Acad. Sci. USA 2007, 104, 18925–18930. [Google Scholar] [CrossRef]
  70. van der Laan-Luijkx, I.T.; Krol, M.C.; Gatti, L.V.; Domingues, L.G.; Correia, C.S.C.; Miller, J.B.; Gloor, M.; Leeuwen, T.T.; Kaiser, J.W.; Wiedinmyer, C.; et al. Response of the Amazon carbon balance to the 2010 drought derived with CarbonTracker South America. Glob. Biogeochem. Cycles 2015, 29, 1092–1108. [Google Scholar] [CrossRef]
  71. Thompson, R.L.; Patra, P.K.; Chevallier, F.; Maksyutov, S.; Law, R.M.; Ziehn, T.; Van Der Laan-Luijkx, I.T.; Peters, W.; Ganshin, A.; Zhuravlev, R.; et al. Top-down assessment of the Asian carbon budget since the mid 1990s. Nat. Commun. 2016, 7, 10724. [Google Scholar] [CrossRef]
  72. Tsuruta, A.; Aalto, T.; Backman, L.; Hakkarainen, J.; Van Der Laan-Luijkx, I.T.; Krol, M.C.; Spahni, R.; Houweling, S.; Laine, M.; Dlugokencky, E.; et al. Global methane emission estimates for 2000–2012 from CarbonTracker Europe-CH4 v1.0. Geosci. Model Dev. 2017, 10, 1261–1289. [Google Scholar] [CrossRef]
  73. Díaz-Isaac, L.I.; Lauvaux, T.; Davis, K.J.; Miles, N.L.; Richardson, S.J.; Jacobson, A.R.; Andrews, A.E. Model-data comparison of MCI field campaign atmospheric CO2 mole fractions. J. Geophys. Res. Atmos. 2014, 119, 10536–10551. [Google Scholar] [CrossRef]
  74. Butler, M.P.; Lauvaux, T.; Feng, S.; Liu, J.; Bowman, K.W.; Davis, K.J. Mass-conserving coupling of total column CO2 (XCO2) from global to mesoscale models: Case study with CMS-Flux inversion system and WRF-Chem (v3.6.1). Geosci. Model Dev. Discuss. 2019, 2019, 1–35. [Google Scholar] [CrossRef]
  75. Préfet de la Région Provence-Alpes-Côte D’Azur. Diagnostic du Profil Environnemental Régional, 2015. Available online: http://www.paca.developpement-durable.gouv.fr/IMG/pdf/PER_2015_Foret.pdf (accessed on 27 September 2024).
  76. Région SUD Provence-Alpes-Côte D’Azur. DataSud: La Plateforme Règionale de Donnèes, 2015. Available online: https://www.datasud.fr/ (accessed on 27 September 2024).
  77. Allard, V.; Ourcival, J.; Rambal, S.; Joffre, R.; Rocheteau, A. Seasonal and annual variation of carbon exchange in an evergreen Mediterranean forest in southern France. Glob. Chang. Biol. 2008, 14, 714–725. [Google Scholar] [CrossRef]
  78. Thomson, D.; Wilson, J. History of Lagrangian stochastic models for turbulent dispersion. Lagrangian Model. Atmos. 2012, 200, 19–36. [Google Scholar]
  79. Ramli, H.M.; Esler, J.G. Quantitative evaluation of numerical integration schemes for Lagrangian particle dispersion models. Geosci. Model Dev. 2016, 9, 2441–2457. [Google Scholar] [CrossRef]
  80. Reithmeier, C.; Sausen, R. ATTILA: Atmospheric tracer transport in a Lagrangian model. Tellus B Chem. Phys. Meteorol. 2002, 54, 278–299. [Google Scholar] [CrossRef]
  81. Cassiani, M.; Stohl, A.; Olivié, D.; Seland, Ø.; Bethke, I.; Pisso, I.; Iversen, T. The offline Lagrangian particle model FLEXPART–NorESM/CAM (v1): Model description and comparisons with the online NorESM transport scheme and with the reference FLEXPART model. Geosci. Model Dev. 2016, 9, 4029–4048. [Google Scholar] [CrossRef]
  82. Pisso, I.; Sollum, E.; Grythe, H.; Kristiansen, N.I.; Cassiani, M.; Eckhardt, S.; Arnold, D.; Morton, D.; Thompson, R.L.; Groot Zwaaftink, C.D.; et al. The Lagrangian particle dispersion model FLEXPART version 10.4. Geosci. Model Dev. 2019, 12, 4955–4997. [Google Scholar] [CrossRef]
  83. Uliasz, M. Lagrangian Particle Modeling in Mesoscale Applications; Computational Mechanics Publications: Chicago, IL, USA, 1994. [Google Scholar]
  84. Seibert, P.; Frank, A. Source-receptor matrix calculation with a Lagrangian particle dispersion model in backward mode. Atmos. Chem. Phys. 2004, 4, 51–63. [Google Scholar] [CrossRef]
  85. Météo France. Données Publiques de Météo-France. 2023. Available online: https://donneespubliques.meteofrance.fr/ (accessed on 27 September 2024).
  86. Santamouris, M. On the energy impact of urban heat island and global warming on buildings. Energy Build. 2014, 82, 100–113. [Google Scholar] [CrossRef]
  87. U.S. Environmental Protection Agency. Reducing Urban Heat Islands: Compendium of Strategies; Draft; U.S. Environmental Protection Agency: Washington, DC, USA, 2008.
  88. Arnfield, A.J. Two decades of urban climate research: A review of turbulence, exchanges of energy and water, and the urban heat island. Int. J. Climatol. 2003, 23, 1–26. [Google Scholar] [CrossRef]
  89. Oke, T.R. The energetic basis of the urban heat island. Q. J. R. Meteorol. Soc. 1982, 108, 1–24. [Google Scholar] [CrossRef]
  90. Oke, T.R.; Johnson, G.; Steyn, D.; Watson, I. Simulation of surface urban heat islands under ‘ideal’conditions at night part 2: Diagnosis of causation. Bound.-Layer Meteorol. 1991, 56, 339–358. [Google Scholar] [CrossRef]
  91. Kim, H.; Gu, D.; Kim, H.Y. Effects of Urban Heat Island mitigation in various climate zones in the United States. Sustain. Cities Soc. 2018, 41, 841–852. [Google Scholar] [CrossRef]
  92. Oke, T. Boundary Layer Climates, 2nd ed.; The University Press: Cambridge, UK, 1987. [Google Scholar]
  93. Sarrat, C.; Lemonsu, A.; Masson, V.; Guedalia, D. Impact of urban heat island on regional atmospheric pollution. Atmos. Environ. 2006, 40, 1743–1758. [Google Scholar] [CrossRef]
  94. Gerbig, C.; Lin, J.C.; Wofsy, S.C.; Daube, B.C.; Andrews, A.E.; Stephens, B.B.; Bakwin, P.S.; Grainger, C.A. Toward constraining regional-scale fluxes of CO2 with atmospheric observations over a continent: 1. Observed spatial variability from airborne platforms. J. Geophys. Res. Atmos. 2003, 108, D24. [Google Scholar] [CrossRef]
  95. Wunch, D.; Wennberg, P.O.; Toon, G.C.; Keppel-Aleks, G.; Yavin, Y.G. Emissions of greenhouse gases from a North American megacity. Geophys. Res. Lett. 2009, 36, 15. [Google Scholar] [CrossRef]
  96. Lopez, M.; Schmidt, M.; Delmotte, M.; Colomb, A.; Gros, V.; Janssen, C.; Lehman, S.J.; Mondelain, D.; Perrussel, O.; Ramonet, M.; et al. CO, NOx and 13CO2 as tracers for fossil fuel CO2: Results from a pilot study in Paris during winter 2010. Atmos. Chem. Phys. 2013, 13, 7343–7358. [Google Scholar] [CrossRef]
  97. Turnbull, J.C.; Sweeney, C.; Karion, A.; Newberger, T.; Lehman, S.J.; Tans, P.P.; Davis, K.J.; Lauvaux, T.; Miles, N.L.; Richardson, S.J.; et al. Toward quantification and source sector identification of fossil fuel CO2 emissions from an urban area: Results from the INFLUX experiment. J. Geophys. Res. Atmos. 2015, 120, 292–312. [Google Scholar] [CrossRef]
  98. Lemonsu, A.; Bastin, S.; Masson, V.; Drobinski, P. Vertical structure of the urban boundary layer over Marseille under sea-breeze conditions. Bound.-Layer Meteorol. 2006, 118, 477–501. [Google Scholar] [CrossRef]
  99. Reimann, S.; Vollmer, M.; Folini, D.; Steinbacher, M.; Hill, M.; Buchmann, B.; Zander, R.; Mahieu, E. Observations of long-lived anthropogenic halocarbons at the high-Alpine site of Jungfraujoch (Switzerland) for assessment of trends and European sources. Sci. Total Environ. 2008, 391, 224–231. [Google Scholar] [CrossRef] [PubMed]
  100. Uglietti, C.; Leuenberger, M.; Brunner, D. European source and sink areas of CO2 retrieved from Lagrangian transport model interpretation of combined O2 and CO2 measurements at the high alpine research station Jungfraujoch. Atmos. Chem. Phys. 2011, 11, 8017–8036. [Google Scholar] [CrossRef]
  101. Levin, I.; Karstens, U.; Eritt, M.; Maier, F.; Arnold, S.; Rzesanke, D.; Hammer, S.; Ramonet, M.; Vítková, G.; Conil, S.; et al. A dedicated flask sampling strategy developed for Integrated Carbon Observation System (ICOS) stations based on CO2 and CO measurements and Stochastic Time-Inverted Lagrangian Transport (STILT) footprint modelling. Atmos. Chem. Phys. 2020, 20, 11161–11180. [Google Scholar] [CrossRef]
  102. Guenard, V.; Drobinski, P.; Caccia, J.L.; Campistron, B.; Bench, B. An observational study of the mesoscale mistral dynamics. Bound.-Layer Meteorol. 2005, 115, 263–288. [Google Scholar] [CrossRef]
  103. Drobinski, P.; Bastin, S.; Guenard, V.; Caccia, J.L.; Dabas, A.M.; Delville, P.; Protat, A.; Reitebuch, O.; Werner, C. Summer mistral at the exit of the Rhône valley. Q. J. R. Meteorol. Soc. 2005, 131, 353–375. [Google Scholar] [CrossRef]
  104. Drobinski, P.; Saïd, F.; Ancellet, G.; Arteta, J.; Augustin, P.; Bastin, S.; Brut, A.; Caccia, J.L.; Campistron, B.; Cautenet, S.; et al. Regional transport and dilution during high-pollution episodes in southern France: Summary of findings from the Field Experiment to Constraint Models of Atmospheric Pollution and Emissions Transport (ESCOMPTE). J. Geophys. Res. Atmos. 2007, 112, D13. [Google Scholar] [CrossRef]
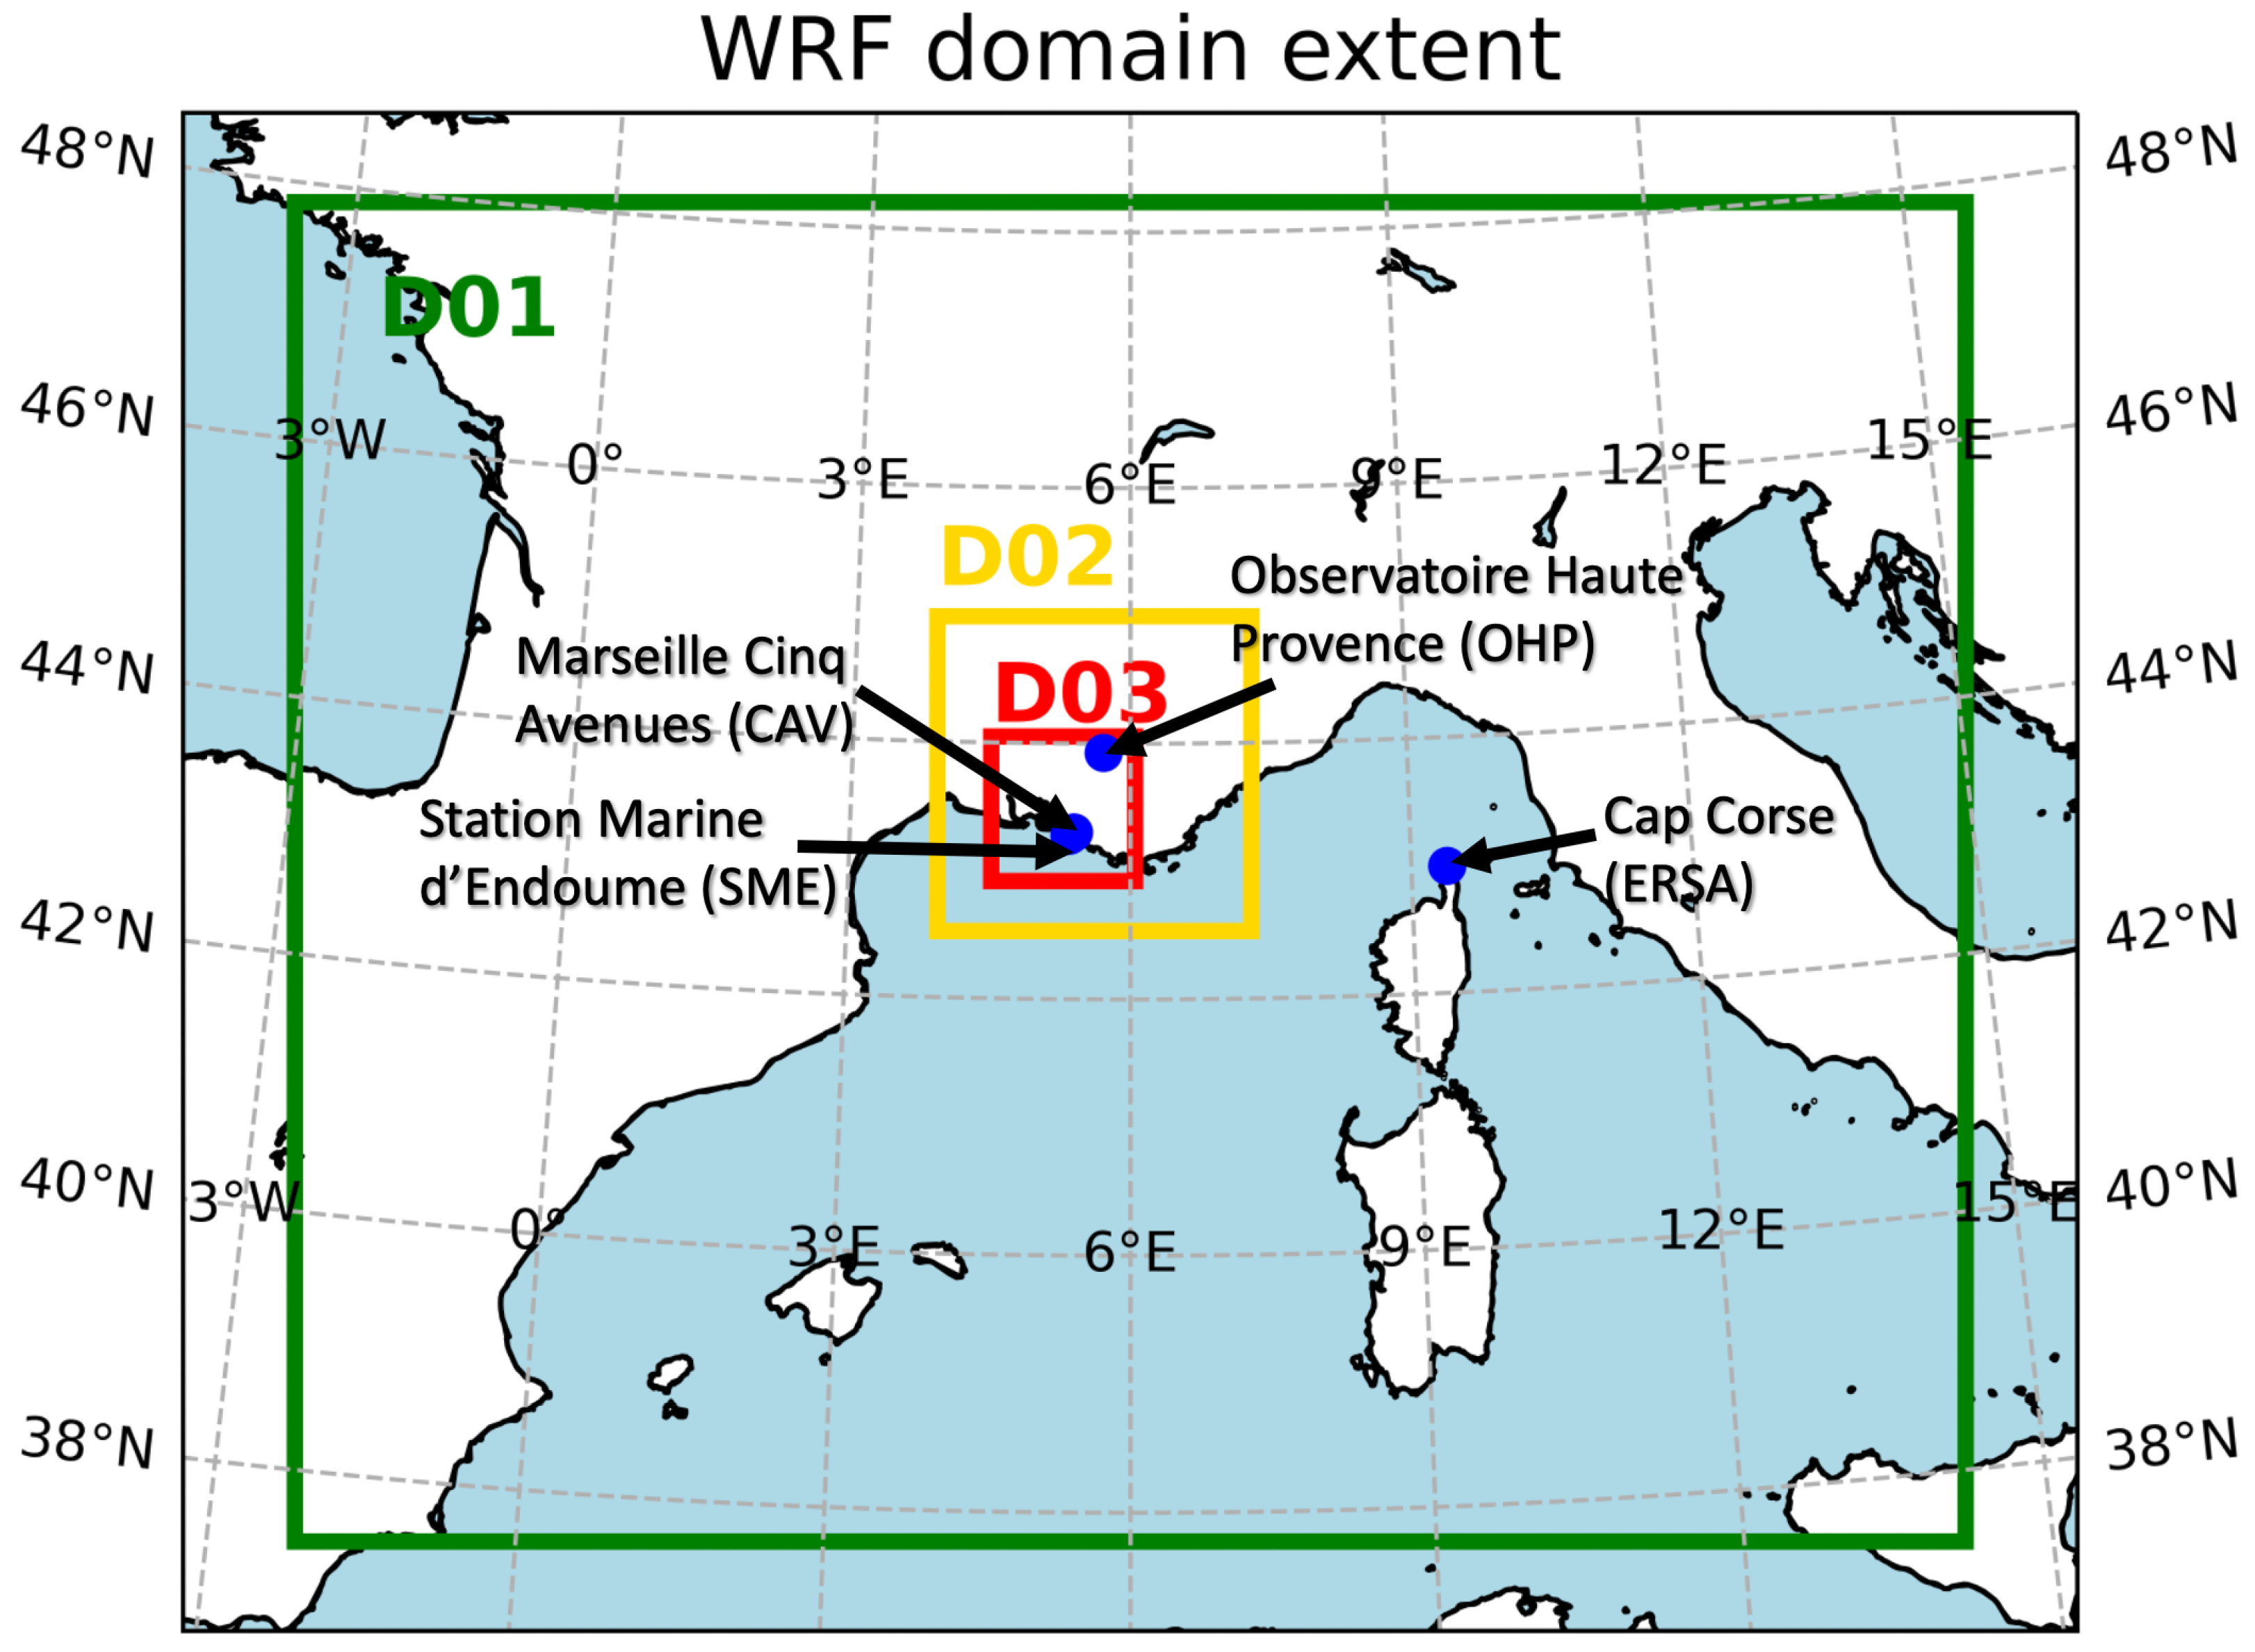
Figure 1. Extent of the 9 km, 3 km, and 1 km domains, shown in green, yellow, and red, respectively, along with labels in blue for measurement sites where CO2 is recorded. The Cap Corse station (ERSA), is used here as the observation background station, is beyond the boundaries of the 3 km and 1 km domains.
Atmosphere 15 01193 g001
Figure 2. Flux maps for several of the tracers included in the model. From top to bottom: ODIAC2017 anthropogenic emissions, ECMWF NEE, and derived sea flux (using ECMWF SST and 10-m winds). The left column is for 3 July 2016 at 14:00 UTC, the middle column is for 3 February 2017 at 14:00 UTC, and the right column is for 3 May 2017 at 14:00 UTC, chosen as arbitrary demonstrative examples from each seasonal period. Units are all in mol/km2/h, while ODIAC2017 is plotted on a log-10 scale because of the large spatial emission variations.
Atmosphere 15 01193 g002
Figure 3. Comparison of the CO2 flux amounts from the different components for the different time periods of the model in the 1 km domain.
Atmosphere 15 01193 g003
Figure 4. CO2 mixing ratio measurements for July 2016 (left), part of Winter 2017 (center), and part of Spring 2017 (right) across the four sites: OHP, CAV, SME, and ERSA. Adapted from Xueref-Remy et al. [19]. Data from the SME and ERSA stations were not available for the springtime period.
Atmosphere 15 01193 g004
Figure 5. Boundary layer height comparison for WRF-Chem simulations with and without the urban heat island effect. The top, middle, and bottom row are the three stations: OHP, CAV, and SME, respectively, while the first, second, and third column are the Summertime 2016, Wintertime 2017, and Springtime 2017 periods, respectively.
Atmosphere 15 01193 g005
Figure 6. A comparison of WRF-based CO2 enhancement values, including a component breakdown, compared against a measured enhancement, subtracting off the ERSA station. The left column is July 2016, the middle is Wintertime 2017, and the right is Springtime 2017. The top row is the OHP station at 100 m sampling height, the middle is the CAV station, and the bottom is the SME station.
Atmosphere 15 01193 g006
Figure 7. Log-scale maps showing the long-term footprints from each of the CO2 measurement sites for the full Summertime 2016 (left), Wintertime 2017 (middle), and Springtime 2017 (right) periods.
Atmosphere 15 01193 g007
Figure 8. The left column shows log-scaled maps of the 12 h footprints from each of the CO2 measurement sites on 23 July 2016 at 16:00 UTC (top) and 24 July 2016 at 16:00 UTC (bottom). The middle column shows a zoomed-in view of the CO2 model/data comparison from Figure 3 during the period of this case study for CAV (top) and SME (bottom). The right column shows a zoomed-in view of the PBL comparison from Figure 5 during the period of the case study for CAV (top) and SME (bottom).
Atmosphere 15 01193 g008
Table 1. Names, locations, and measurement heights in meters above ground level (mAGL) for the CO2 instrument sites from which influence functions were created using the LPDM.
StationLatitude (°N)Longitude (°E)Z (mAGL)
OHP43.93155.7134100
CAV43.30605.39505
SME43.28065.34993
Table 2. The mean error (ME) and mean absolute error (MAE) for wind speed (ws) and wind direction (wd) across all 12 meteorological stations in Figure A1 for the analyzed hours of the Summertime 2016, Wintertime 2017, and Springtime 2017 periods.
Summertime 2016Wintertime 2017Springtime 2017
MEws1.0 ms−11.4 ms−10.7 ms−1
wd−10.78°8.1°6.6°
MAEws2.4 ms−12.3 ms−11.8 ms−1
wd58.36°29.3°28.5°
Table 3. Mean difference in boundary layer height between simulations with and without the urban heat island effect module, expressed as percentages, at each of the measurement sites across each of the periods.
StationSummertime 2016Wintertime 2017Springtime 2017
OHP19.85%8.49%7.59%
CAV5.01%5.68%6.41%
SME22.02%4.24%9.55%
Table 4. Mean modeled and observed background values and one standard deviation of the mean for Summertime 2016 and Wintertime 2017 in the simulations with the urban heat island module.
StationSummer ModelSummer ObsWinter ModelWinter Obs
OHP (ppm)403.6 ± 1.6400.4 ± 2.7409.3 ± 0.7412.8 ± 2.5
CAV (ppm)403.4 ± 1.8400.4 ± 2.7409.5 ± 0.7412.8 ± 2.5
SME (ppm)403.4 ± 1.6400.4 ± 2.7409.5 ± 0.7412.8 ± 2.5
Table 5. Mean and one standard deviation of the enhancement values provided by the model framework and the observations for Summertime 2016 and Wintertime 2017.
StationSummer ModelSummer ObsWinter ModelWinter Obs
OHP (ppm)−4.0 ± 2.8−2.3 ± 3.5−1.4 ± 1.5−1.1 ± 2.3
CAV (ppm)−1.6 ± 2.71.2 ± 5.53.3 ± 3.25.7 ± 7.5
SME (ppm)−3.3 ± 3.40.1 ± 4.71.7 ± 2.42.5 ± 6.3
Table 6. Difference values showing the similarity between the simulation with UHI and the average measured enhancement value relative to the simulation without UHI, along with the corresponding standard deviations. This value was calculated at each of the three sites during each of the three analysis periods, matching Figure 6.
StationSummertime 2016Wintertime 2017Springtime 2017
OHP (ppm)0.01−0.17N/A 1
CAV (ppm)0.294.5 × 10 3 N/A 1
SME (ppm)0.460.15N/A 1
1 N/A denotes where measured enhancement data was not available to make the comparison.
Disclaimer/Publisher’s Note: The statements, opinions and data contained in all publications are solely those of the individual author(s) and contributor(s) and not of MDPI and/or the editor(s). MDPI and/or the editor(s) disclaim responsibility for any injury to people or property resulting from any ideas, methods, instructions or products referred to in the content.