Article

Comprehensive Comparison of Seven Widely-Used Planetary Boundary Layer Parameterizations in Typhoon Mangkhut Intensification Simulation

1
Jiangsu Maritime Institute, Nanjing 211170, China
2
Collaborative Innovation Center on Forecast and Evaluation of Meteorological Disasters, Key Laboratory for Aerosol-Cloud-Precipitation of China Meteorological Administration, School of Atmospheric Physics, Nanjing University of Information Science and Technology, Nanjing 210044, China
3
Department of Earth and Environment, Florida International University, Miami, FL 33199, USA
4
State Key Laboratory of Atmospheric Boundary Layer Physics and Atmospheric Chemistry, Institute of Atmospheric Physics, Chinese Academy of Sciences, Beijing 100029, China
5
Shanghai Typhoon Institute, China Meteorological Administration, Shanghai 200030, China
*
Author to whom correspondence should be addressed.
Atmosphere 2024, 15(10), 1182; https://doi.org/10.3390/atmos15101182
Submission received: 3 September 2024 / Accepted: 27 September 2024 / Published: 30 September 2024

Abstract

:
Numerical experiments using the WRF model were conducted to analyze the sensitivity of Typhoon Mangkhut intensification simulations to seven widely used planetary boundary layer (PBL) parameterization schemes, including YSU, MYJ, QNSE, MYNN2, MYNN3, ACM2, and BouLac. The results showed that all simulations generally reproduced the tropical cyclone (TC) track and intensity, with YSU, QNSE, and BouLac schemes better capturing intensification processes and closely matching observed TC intensity. In terms of surface layer parameterization, the QNSE scheme produced the highest Ck/Cd ratio, resulting in stronger TC intensity based on Emanuel’s potential intensity theory. In terms of PBL parameterization, the YSU and BouLac schemes, with the same revised MM5 surface layer scheme, simulated weaker turbulent diffusivity Km and shallower mixing height, leading to stronger TC intensity. During the intensification period, the BouLac, YSU, and QNSE PBL schemes exhibited stronger tangential wind, radial inflow within the boundary layer, and updraft around the eye wall, consistent with TC intensity results. Both PBL and surface layer parameterization significantly influenced simulated TC intensity. The QNSE scheme, with the largest Ck/Cd ratio, and the YSU and BouLac schemes, with weaker turbulent diffusivity, generated stronger radial inflow, updraft, and warm core structures, contributing to higher storm intensity.

1. Introduction

Tropical cyclones (TCs) are devastating natural disasters, causing significant loss of life and property damage [1,2,3]. In recent decades, advances in numerical weather prediction (NWP) models have improved TC forecasts [4,5], but accurately predicting TC intensification, especially rapid intensification (RI), remains challenging [6,7,8,9].
TC formation and intensification depend on various large-scale environmental conditions, including vertical wind shear, upper-tropospheric divergence, sea surface temperature, ocean heat content, and moisture supply [10]. Under these favorable conditions, TCs intensify through internal interactions among microphysical, cumulus, and planetary boundary layer (PBL) processes [11]. PBL turbulence plays a dual role in TC energetics. On one hand, turbulent enthalpy fluxes from the ocean provide energy to the storms, while on the other hand, turbulence-induced friction dissipates turbulence kinetic energy (TKE), acting as a primary energy sink for TCs. The ratio between these two processes strongly influences the rate of TC intensification [12,13,14], emphasizing the crucial role of the PBL in TC dynamics [13]. Theories explaining TC intensification, such as the conditional instability of the second kind (CISK) [15], the cooperative intensification mechanism [16,17], the wind-induced surface heat exchange (WISHE) [18], and the 3D rotating convective updraft paradigm [19], all recognize the significance of the PBL. Numerical studies have also demonstrated the essential role of turbulent processes in the PBL during TC intensification [20,21,22,23,24].
Numerous studies have demonstrated the sensitivity of TC simulations to the choice of PBL parameterization schemes, resulting in variations in simulated TC intensity and structure. For example, Li and Pu [25], Sateesh et al. [26], Dong et al. [27], and Kumari et al. [28] utilized the Weather Research and Forecasting (WRF) model to simulate TC track and intensity, revealing differences in the simulated minimum central sea level pressure (MSLP) when different PBL schemes were utilized. Nolan et al. [29,30] evaluated the impact of different PBL schemes on simulated maximum wind speed, outer/inner-core, and eyewall structures using the WRF models. Coronel et al. [31] and Smith et al. [32] investigated the sensitivity of TC simulations to the surface exchange coefficient in PBL schemes and highlighted the significance of PBL dynamics for TC intensity forecasting. Liu et al. [33] and Wen et al. [34] focused on the impact of surface flux on TC simulations. Tang et al. [35] investigated the sensitivity of simulated hurricane intensity and structure to two PBL schemes in idealized experiments using the operational Hurricane WRF model. Kepert et al. [12] and Zhu et al. [36] demonstrated and emphasized the influences of vertical turbulent mixing in the PBL parameterization on TC intensity and structure. Based on recent observations and theoretical grounds, Kepert et al. [12] provided a thorough summary of the methodologies for parametrizing the vertical turbulent fluxes in TC simulations and emphasized the significant influences of PBL vertical mixing parameterization on TC intensity and structure. Zhu et al. [36] designed numerical experiments to examine the sensitivity of hurricane simulations to vertical turbulent mixing schemes and investigated how different vertical turbulent mixing schemes affect the eyewall asymmetric structures and dynamics and the formation of eyewall mesovortices. Recently, using the large eddy simulation technique, Liu et al. [37] and Kumar et al. [38] investigated the TC-scale and fine-scale structures in the TC boundary layer and turbulent kinetic energy in the convective boundary layer.
In recent studies, Chen and Bryan [39] conducted idealized numerical simulations using the Mellor–Yamada–Nakanishi–Niino (MYNN) PBL scheme, showing that the inclusion of TKE advection led to slightly stronger TCs and smaller inner-core sizes. Chen et al. [40] examined the impact of the scale-aware Shin–Hong (SH) scheme and the non-scale-aware YSU scheme on TC intensification and structural changes, finding that the SH scheme produced a stronger TC with a more compact inner core compared to the YSU scheme. Chen [41] utilized a newly developed TC boundary layer modeling framework based on large eddy simulation (LES) to evaluate K-profile parameterization (KPP) and high-order PBL schemes in hurricane conditions, revealing significantly different eddy viscosity and inflow layers when using different KPP schemes such as the Global Forecast System (GFS) scheme and YSU scheme, but also highlighting the potential enhancement of both schemes through adjustment of the “shape parameter” of viscosity. Additionally, Wang and Tan [42] assessed the uncertainty associated with the combined effects of cumulus, microphysics, and PBL schemes on TC simulations, determining that the Kain–Fritsch cumulus scheme, Lin microphysics scheme, and Bougeault–Lacarrere (BouLac) PBL scheme exhibited the best performance among the evaluated schemes for TC intensity forecasts.
Previous studies have primarily focused on a limited number of PBL schemes, limiting our comprehensive understanding of the sensitivity of TC simulations to the various PBL schemes available in models. This study aims to address this gap by utilizing the numerical simulations of Typhoon Mangkhut (2018) with the WRF model. This study assesses the performance of seven widely used PBL schemes in simulating the track, intensity, and structure of Typhoon Mangkhut (2018). Additionally, it examines the associated surface momentum and heat exchanges and PBL diffusion generated by these PBL schemes. This study also explores the possible causes and physical mechanisms underlying the sensitivities. The ultimate goal of this study is to provide valuable guidance for future improvements in PBL schemes and the selection of appropriate schemes for TC simulations.
The remainder of the paper is organized as follows. Section 2 introduces Typhoon Mangkhut, the model setup, and the experimental design. Section 3 presents the simulation results and analyses of the underlying mechanisms. The summary and conclusions are presented in Section 4.

2. Numerical Simulations of Typhoon Mangkhut (2018)

2.1. Overview of Typhoon Mangkhut

Typhoon Mangkhut, the 22nd named TC of the 2018 Pacific typhoon season [43], was one of the most powerful typhoons in recent years. It caused widespread devastation with its extremely strong winds and heavy rainfall [44]. Originating in the western North Pacific on 7 September 2018, approximately 2330 km east of Guam [43,45], Mangkhut moved westward over the next six days, undergoing continuous intensification. The maximum sustained winds reached up to 250 km h−1. It first made landfall on the northern Luzon Island of the Philippines on September 14th and subsequently made a second landfall in South China on September 16th. To assess the impact of different PBL parameterizations on the Typhoon Mangkhut intensification simulation, our analysis will focus on the period from 0000 Universal Time Coordinated (UTC) on September 7th to 0000 UTC on 13 September 2018. The track and intensity of Typhoon Mangkhut from the Joint Typhoon Warning Center (JTWC) (https://www.metoc.navy.mil/jtwc/jtwc.html, accessed on 6 May 2020) during this period are illustrated in Figure 1.

2.2. Experimental Design

In this study, we utilized the WRF model Version 4.0, developed by the US National Center for Atmospheric Research (NCAR), to simulate Typhoon Mangkhut (2018). As depicted in Figure 1, our simulation employed two-way interactive and three-level vortex-following moving-nests. The three domains had grid-meshes of 342 × 153, 856 × 292, and 433 × 424, with horizontal grid spacing of 27 km, 9 km, and 3 km, respectively. We used a total of 33 vertical levels, with the uppermost layer set at 50 hPa. The initial and lateral boundary conditions were provided by the fifth-generation European Centre for Medium-Range Weather Forecasts (ECMWF) atmospheric reanalysis of the global climate (ERA5) dataset with a resolution of 0.25° × 0.25° (https://cds.climate.copernicus.eu/#!/home, accessed on 16 May 2020). ERA5 is produced using 4D-Var data assimilation and model forecasts in CY41R2 of the ECMWF Integrated Forecast System (IFS) (https://confluence.ecmwf.int/display/CKB/ERA5%3A+data+documentation#ERA5:datadocumentation-Introduction, accessed on 16 May 2020), and IFS documentation shows that the Eddy-Diffusivity Mass-Flux (EDMF) approach is used to compute the exchange coefficients within the well-mixed part of unstable (convective) boundary layers (https://www.ecmwf.int/en/elibrary/79697-ifs-documentation-cy41r2-part-iv-physical-processes, accessed on 16 May 2020). The simulation period spanned from 0000 UTC on September 7th to 0000 UTC on 13 September 2018, covering the intensification period of Typhoon Mangkhut. The first three hours (0000 UTC to 0300 UTC on 7 September 2018) were considered as a spin-up period for the numerical simulation. All three domains employed the same model physics options, including the Rapid Radiative Transfer longwave radiation scheme (RRTM) [46], the Dudhia shortwave radiation scheme [47], the Eta (Ferrier) microphysics scheme [48], and the Unified Noah land surface model [49]. However, the Kain–Fritsch cumulus parameterization scheme [50] was only activated in the outermost domain with a 27 km resolution.
Based on the results from the WRF Physics Use Survey (August 2015) regarding PBL choices (https://www2.mmm.ucar.edu/wrf/users/physics/wrf_physics_survey.pdf, accessed on 16 May 2020), we selected the seven most widely used PBL schemes for this study, including YSU [51], MYJ [52], Quasi-normal Scale Elimination (QNSE) [53], MYNN Level 2.5 (MYNN2) and MYNN Level 3 (MYNN3) [54,55], Asymmetric Convection Model 2 (ACM2) [56], and BouLac [57]. The YSU, MYNN2, MYNN3, ACM2, and BouLac PBL schemes were coupled with the Revised MM5 surface layer scheme, while the MYJ PBL scheme was used with the Eta Similarity surface layer scheme, and the QNSE PBL scheme was used with the QNSE surface layer scheme. All the selected schemes have been validated by measurements in non-TC conditions.

2.3. Description of PBL Parameterization Schemes

PBL schemes are utilized to parameterize the exchanges of moisture, heat, and momentum through mixing associated with turbulent eddies [58]. Throughout the years, a multitude of PBL schemes with varying complexities have been developed for use in numerical simulations. These schemes can be categorized into the following several groups based on their formulations:
(a) K-closure (or first-order closure) vs. high-order closure schemes. In K-closure schemes, vertical turbulent fluxes of a scalar are linearly related to the vertical gradient of the scalar using eddy exchange coefficients. High-order closure schemes, however, involve one or more prognostically determined high-order turbulent moments governed by complex equations. The simplest high-order closure scheme is the TKE scheme, also known as 1.5-order scheme, where turbulent eddy exchange coefficients are parameterized in terms of prognostically or diagnostically determined TKE.
(b) Local vs. nonlocal closure schemes. Local closure schemes assume that all turbulent fluxes are associated with down-gradient transport, similar to molecular diffusion. All K-closure and high-order closure schemes fall under the category of local closure schemes since they are formulated based on vertical gradient of variables. However, not all turbulent transport can be represented by local down-gradient diffusion. Large turbulent eddies, such as convective plumes, cells, or roll vortices, can induce non-local mixing that cannot be captured by traditional methods involving vertical gradient of variables.
(c) “Dry” vs. “moist” closure schemes. “Dry” closure schemes are formulated with the non-conservative thermodynamic variables, such as potential temperature, virtual potential temperature, and water vapor mixing ratio. In contrast, “moist” closure schemes are formulated with the thermodynamic variables that conserve moisture during moist adiabatic processes, including liquid water potential temperature and total water mixing ratio.
Furthermore, PBL closure schemes can be categorized based on their closure levels: first-, second-, or 1.5-order closure. First-order closure directly parameterizes the fluxes using the mean variables resolved by the model, employing the gradient transport or K-theory where the second moments are parameterized. The second-order closure, on the other hand, starts with the parameterization of third-order fluctuations [59,60,61]. Due to the large computational requirements of full second-order closure, some approximations are made to reduce the number of prediction equations, resulting in schemes categorized as 1.5-order [59,60]. Please refer to Table 1 for a summary of the evaluated PBL schemes in this study.

3. Results

3.1. Track and Intensity

Figure 2a compares the tracks of Typhoon Mangkhut from JTWC best track data, ERA5 reanalysis data, and numerical experiments. Overall, all the numerical simulations reproduce the westward movement of Typhoon Mangkhut. However, the simulated tracks generally depict slightly slower and less northward movement compared to the best track from 0000 UTC on September 8th to 0600 UTC on September 9th, and a less southward track from 0600 UTC on September 9th to 1200 UTC on September 11th (except for MYJ). While the best track and ERA5 track show an S-shaped curvature, the simulated tracks appear straighter with some bending. For Figure 2, it is evident that ERA5 reproduces the TC track very well. However, this is likely because the reanalysis includes information about the observed pressure field and thus about the typhoon’s position.
Figure 2b displays the track errors of the simulated tracks compared to the best track. It can be observed that before 0000 UTC on September 8th, the track errors of all simulations consistently decreased, and at 0000 UTC on September 8th, the simulated TC tracks closely matched the best track. After that, the magnitude of the track errors gradually increased over time. The error of the BouLac scheme reduced slightly after September 10th, while the other simulations continued to increase. After 1200 UTC on September 11th, the track errors of all simulations fluctuated, with the BouLac scheme producing the smallest track error and the MYNN3 scheme yielding the largest track error by the end of the simulation period.
Figure 2c,d further compare the time series of MSLP and the maximum sustained wind speed (VMAX) from the JTWC best track data, ERA5 reanalysis data, and the numerical simulations. According to the best track, at 0600 UTC on September 7th, the MSLP was 1004 hPa and VMAX was 12.86 m s−1. Subsequently, Mangkhut underwent several RI processes from 1800 UTC on September 9th to 0600 UTC on September 12th, reaching a minimum MSLP of 896 hPa and a maximum VMAX of 79.74 m s−1. Afterward, the MSLP and VMAX leveled off, reaching values of 902 hPa and 77.17 m s−1, respectively, at 0000 UTC on September 13th.
All simulations captured the trends in MSLP and VMAX variations, although there were significant differences among the simulations with different PBL schemes. The intensification in these simulations was generally slower and weaker than indicated by the best track. In the first two days until 0000 UTC on September 9th, the differences in MSLP or VMAX between the simulations were small. However, differences started to emerge after that time. Looking at the MSLP, the YSU, QNSE, and BouLac schemes generally captured the RI processes from 1800 UTC on September 9th to 0600 UTC on September 11th, while MYJ, MYNN2, MYNN3, and ACM2 showed lower intensification rates.
When examining the VMAX, a similar pattern emerges. During the RI processes from 1800 UTC on September 9th to 0600 UTC on September 11th, among the seven simulations, YSU, QNSE, and BouLac exhibited the largest VMAX values, while MYJ, MYNN2, MYNN3, and ACM2 were closely grouped together and approximately 30 m s−1 smaller than best track’s VMAX. By the end of the simulation, BouLac had the closest values of MSLP and VMAX to the best track, followed by YSU. The other schemes underestimated both parameters to varying degrees, with QNSE’s intensity decreasing. Furthermore, more recent reanalysis datasets with finer horizontal grid spacings have shown a notable reduction in errors related to TC position and intensity [62]. Therefore, the significant underestimation of MSLP and VMAX in the ERA5 reanalysis might be partly attributed to its relatively coarse resolution.
In summary, among the seven simulations of TC intensification, YSU, QNSE, and BouLac demonstrated faster and stronger intensification, particularly during the RI period. Conversely, MYJ, MYNN2, and MYNN3 exhibited lower intensification rate, while ACM2 showed the lowest intensification rates during that period.

3.2. Surface Layer Flux and Exchange Coefficient
The differences in the tracks and intensities of TCs observed in the simulations can be attributed to variations in PBL parameterizations and corresponding surface layer parameterizations, which generate different surface fluxes and sub-grid turbulence mixing. This subsection aims to analyze the surface fluxes and surface exchange coefficients to gain insights into the underlying factors that contribute to these differences.
The surface enthalpy flux, which is crucial for TC development, consists of latent heat flux and sensible heat flux, with latent heat flux being more dominant during the mature TC. The surface momentum flux acts as the main sink of energy for TC. These surface fluxes are weakest at the TC center and gradually increase outward along the radius, reaching their maximum near the eye wall. Figure 3 illustrates the temporal evolution of area-averaged surface enthalpy flux and momentum flux from the TC center to a 200 km radius, comparing numerical simulations and ERA5 data.
The 10 m wind plays a key role in calculating surface fluxes, and its changes are closely related to the temporal trends in the surface fluxes, as shown in Figure 2d and Figure 3. During TC intensification, especially during the RI period, significant variations in surface flux values are observed among different simulations. When the TC intensity reaches its peak at 1200 UTC 12th, the QNSE scheme exhibits a rapid rate of change and generates an exaggerated enthalpy flux value of nearly 2000 W m−2, which is much higher than that of other schemes. The MYJ (around 1000 W m−2) and BouLac schemes (around 800 W m−2) also have larger enthalpy fluxes compared to other schemes. These larger enthalpy fluxes contribute to a stronger TC intensity through thermo-dynamical interactions [63], which may explain why these three schemes also exhibit higher intensification rates. Additionally, at 1200 UTC 12th, the QNSE scheme produces significantly larger momentum fluxes of 3.4 kg m−1 s−2, followed by the BouLac (2.4 kg m−1 s−2) and MYJ schemes (2.1 kg m−1 s−2).
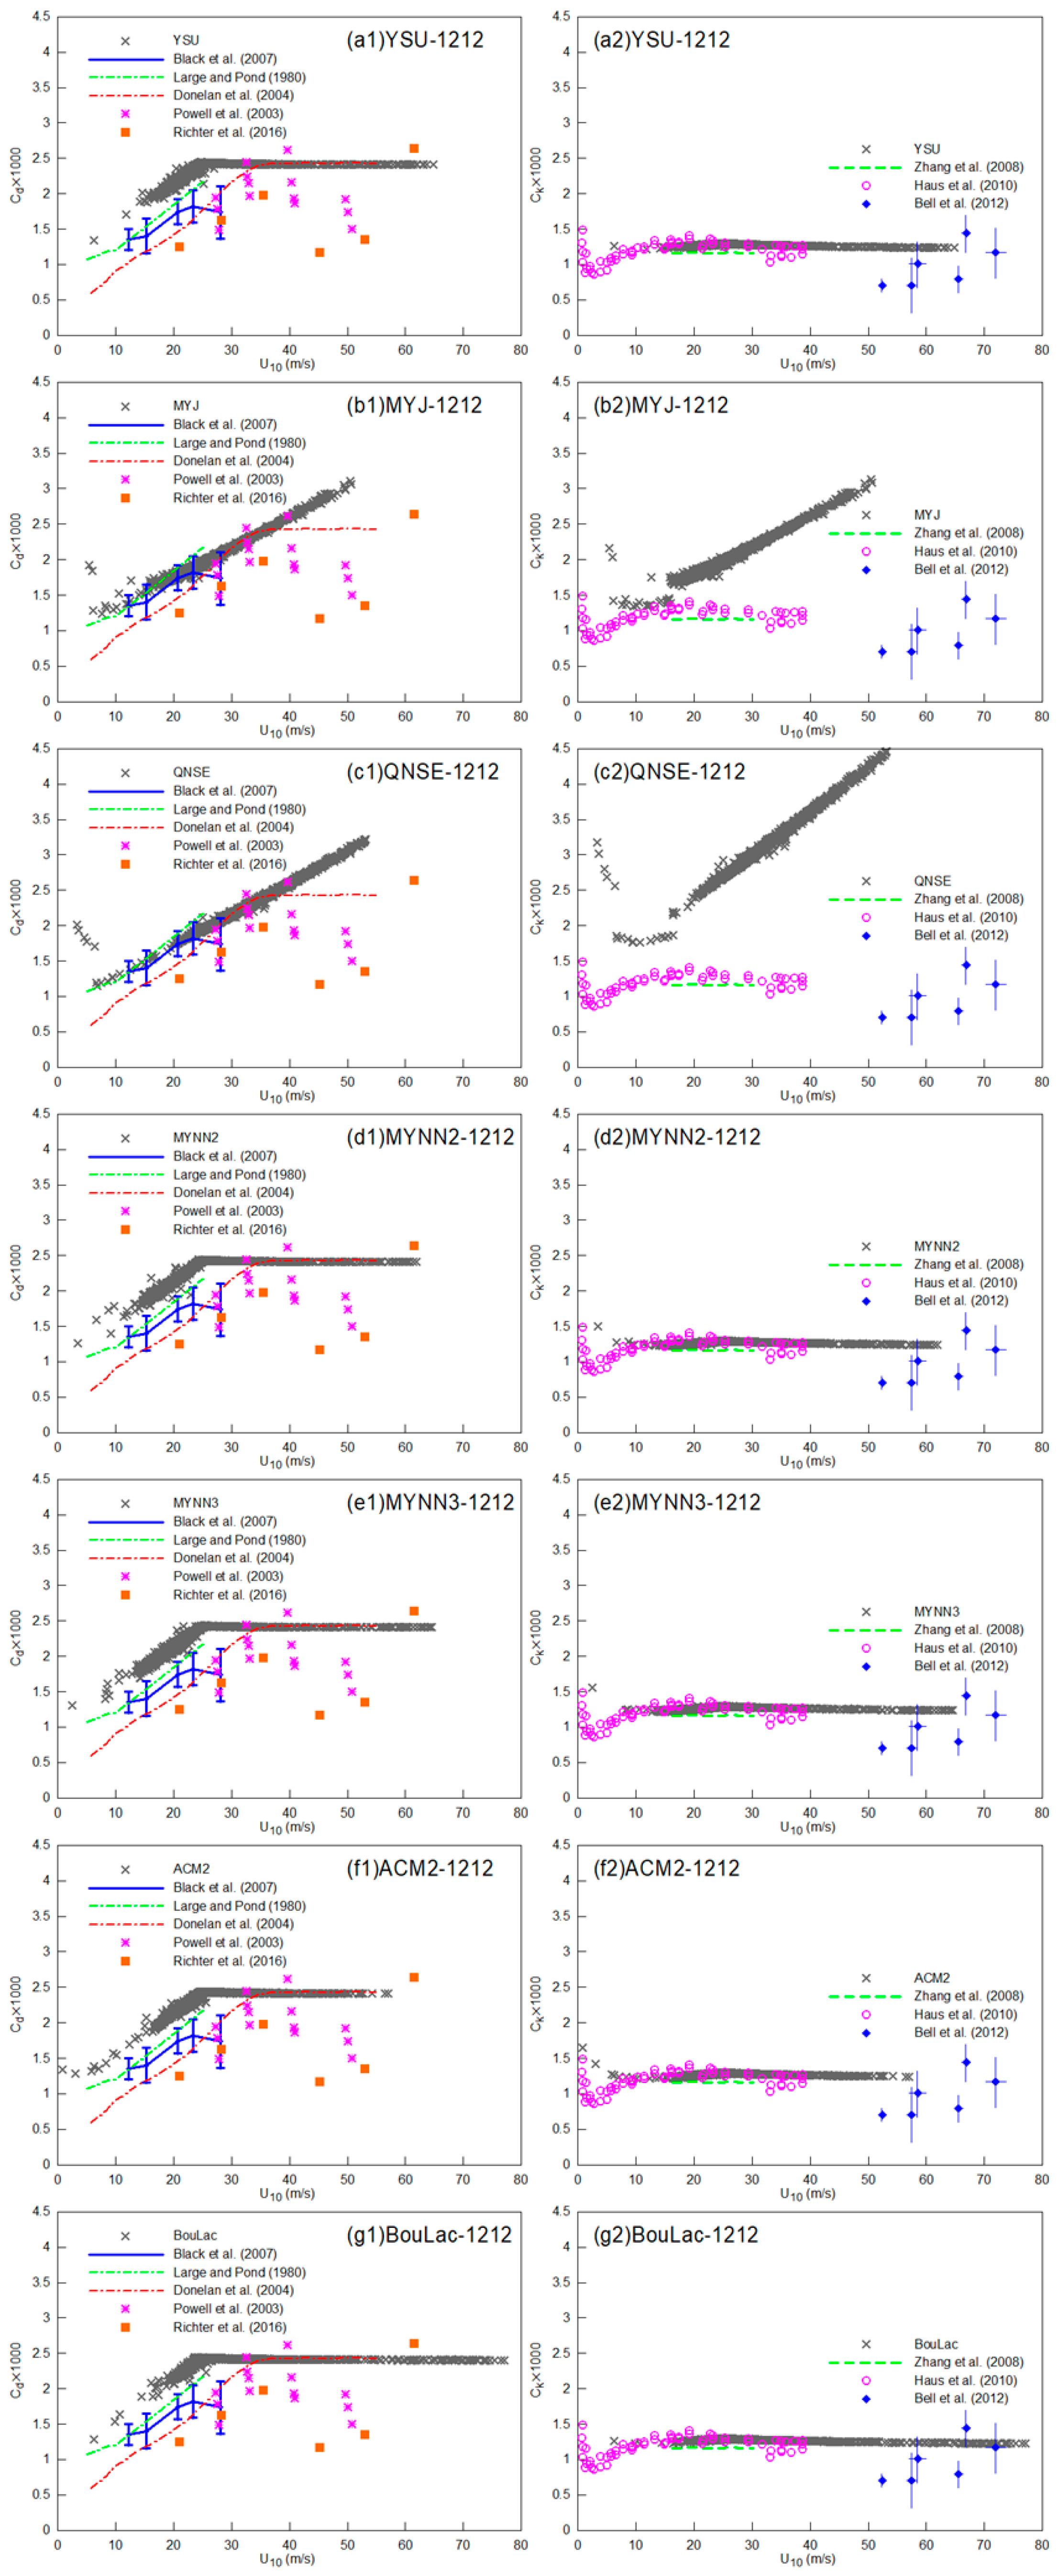
The surface enthalpy flux and momentum flux are determined by the surface enthalpy exchange coefficient (Ck) and the drag coefficient (Cd), respectively [64]. Different surface layer schemes yield varying Cd and Ck values. Figure 4 illustrates the relationship between the surface exchange coefficient and the 10 m wind speed from different simulations at 1200 UTC 12th of the mature TC. In the QNSE and MYJ schemes, both Cd and Ck increase linearly with increasing wind speed. For the other simulations using the same revised MM5 surface layer scheme (YSU, MYNN2, MYNN3, ACM2, and BouLac), Cd remains constant at high wind speeds (above approximately 33 m s−1), while Ck remains relatively stable and unchanged at high wind speeds (beyond approximately 20 m s−1).
It is worth noting that the QNSE PBL and surface layer scheme was developed based on the MYJ scheme and aimed to improve stably stratified boundary layers [53]. The unrealistic large flux and exchange coefficient values in the MYJ and QNSE schemes can be attributed to Charnock’s relationship of aerodynamic roughness used by these schemes [65]. According to Charnock’s relationship, the aerodynamic roughness increases quadratically with friction velocity, which is highly dependent on wind speed. Consequently, higher wind speeds lead to larger aerodynamic roughness, resulting in larger exchange coefficients and fluxes. In contrast, the other five simulations that employ the revised MM5 surface layer scheme and the COARE 3.5 algorithm [66] impose an upper limit of 0.00285 on the aerodynamic roughness, helping to suppress unrealistically large exchange coefficients and fluxes at high wind speeds.
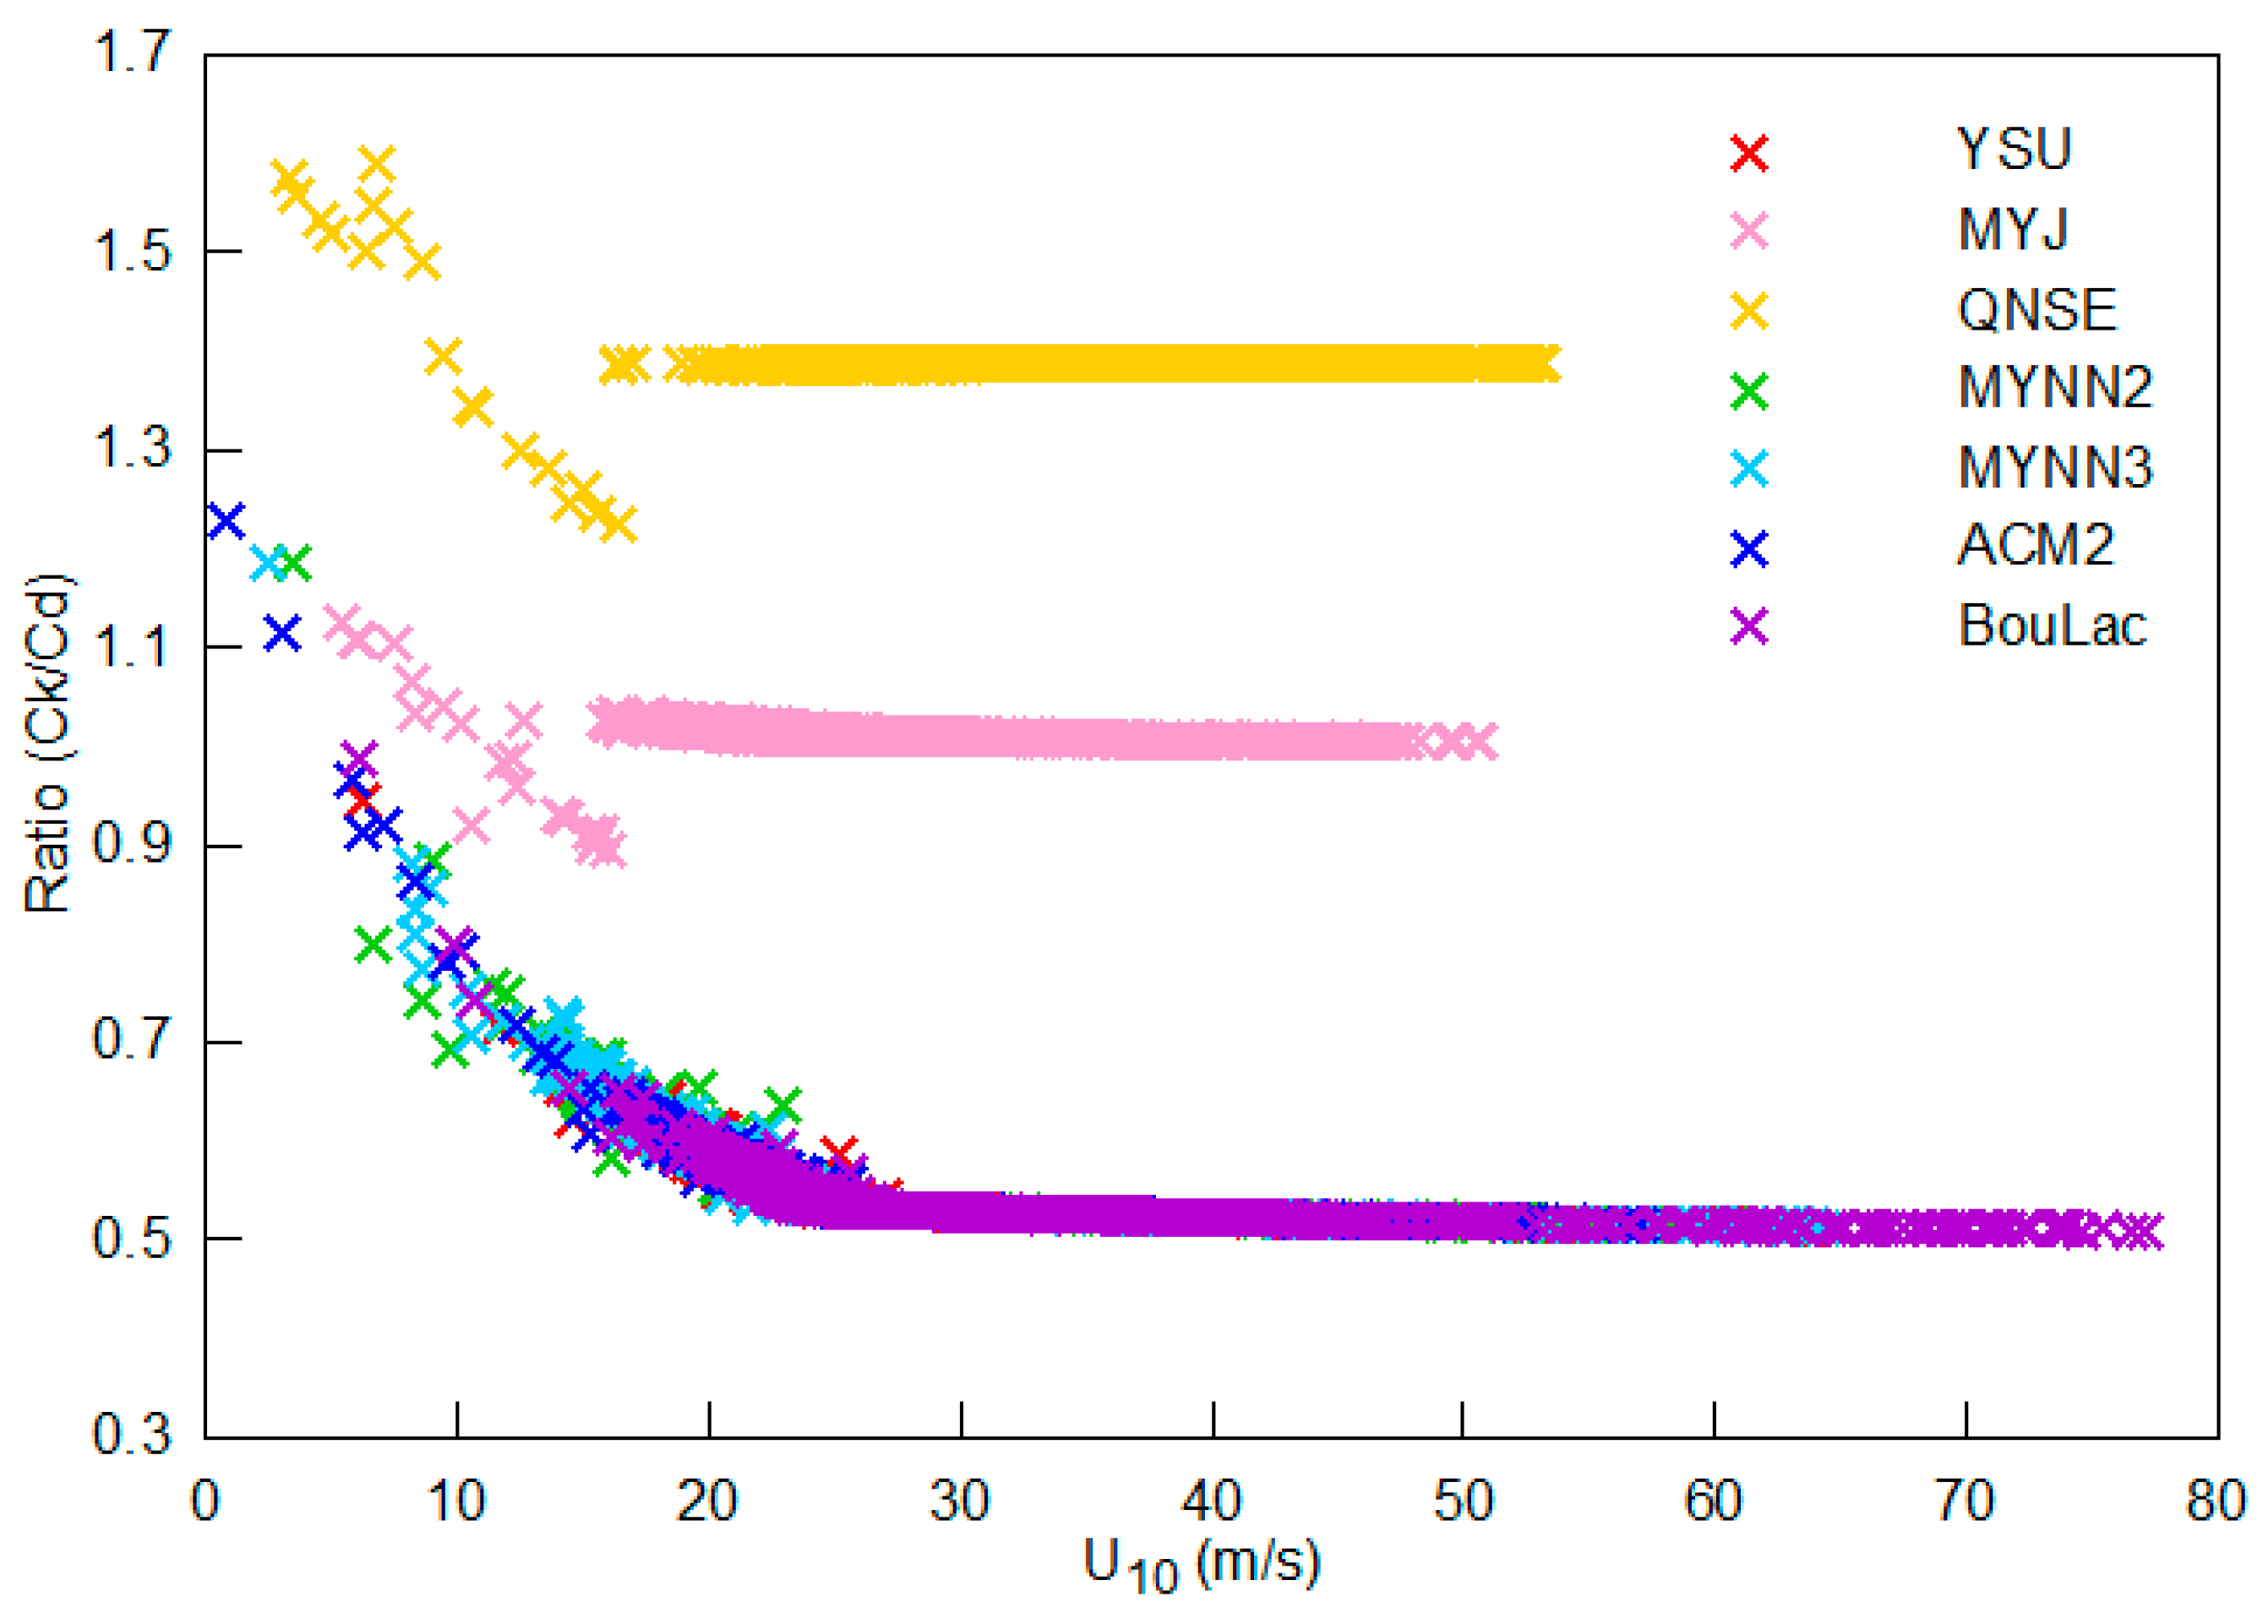
According to Emanuel’s well-known maximum potential intensity (MPI) theory [67,68], the ratio of the surface coefficient (Ck/Cd) determines the intensity for a mature TC. Figure 5 shows the relationship between Ck/Cd and wind speed. The QNSE scheme exhibits the largest Ck/Cd ratio, followed by the MYJ scheme, while the other PBL schemes with the same revised MM5 surface layer scheme share a relatively small Ck/Cd ratio.
Figure 4. The variation of surface exchange coefficients for (a1g1) momentum Cd and (a2g2) heat Ck with 10 m wind speed at 1200 UTC 12 September 2018; numerical simulations (thick gray dots) compared with data from Large and Pond [69], Powell et al. [70], Donelan et al. [71], Black et al. [72], Zhang et al. [73], Haus et al. [74], Bell et al. [75], and Richter et al. [76].
Atmosphere 15 01182 g004
As a result, the significantly large Ck/Cd ratio in the QNSE scheme leads to the fastest intensification before 0000 UTC 11th. Additionally, although the YSU, MYNN2, MYNN3, ACM2, and BouLac PBL schemes employ the same surface layer schemes and have similar Ck/Cd ratios, they generate different TC intensity simulations. The subsequent analysis of mixing layer turbulent diffusion in the upcoming subsection will further investigate this inconsistency.

3.3. PBL Turbulent Diffusivity

Turbulent diffusivity, which represents turbulent mixing, is a key factor in PBL parameterization schemes [21,36]. It consists of turbulent diffusivity for heat (Kh) and momentum (Km), with Kh calculated from Km using the Prandtl number relationship [64]. The distribution of turbulent diffusivity can help explain the behavior of PBL schemes [77].
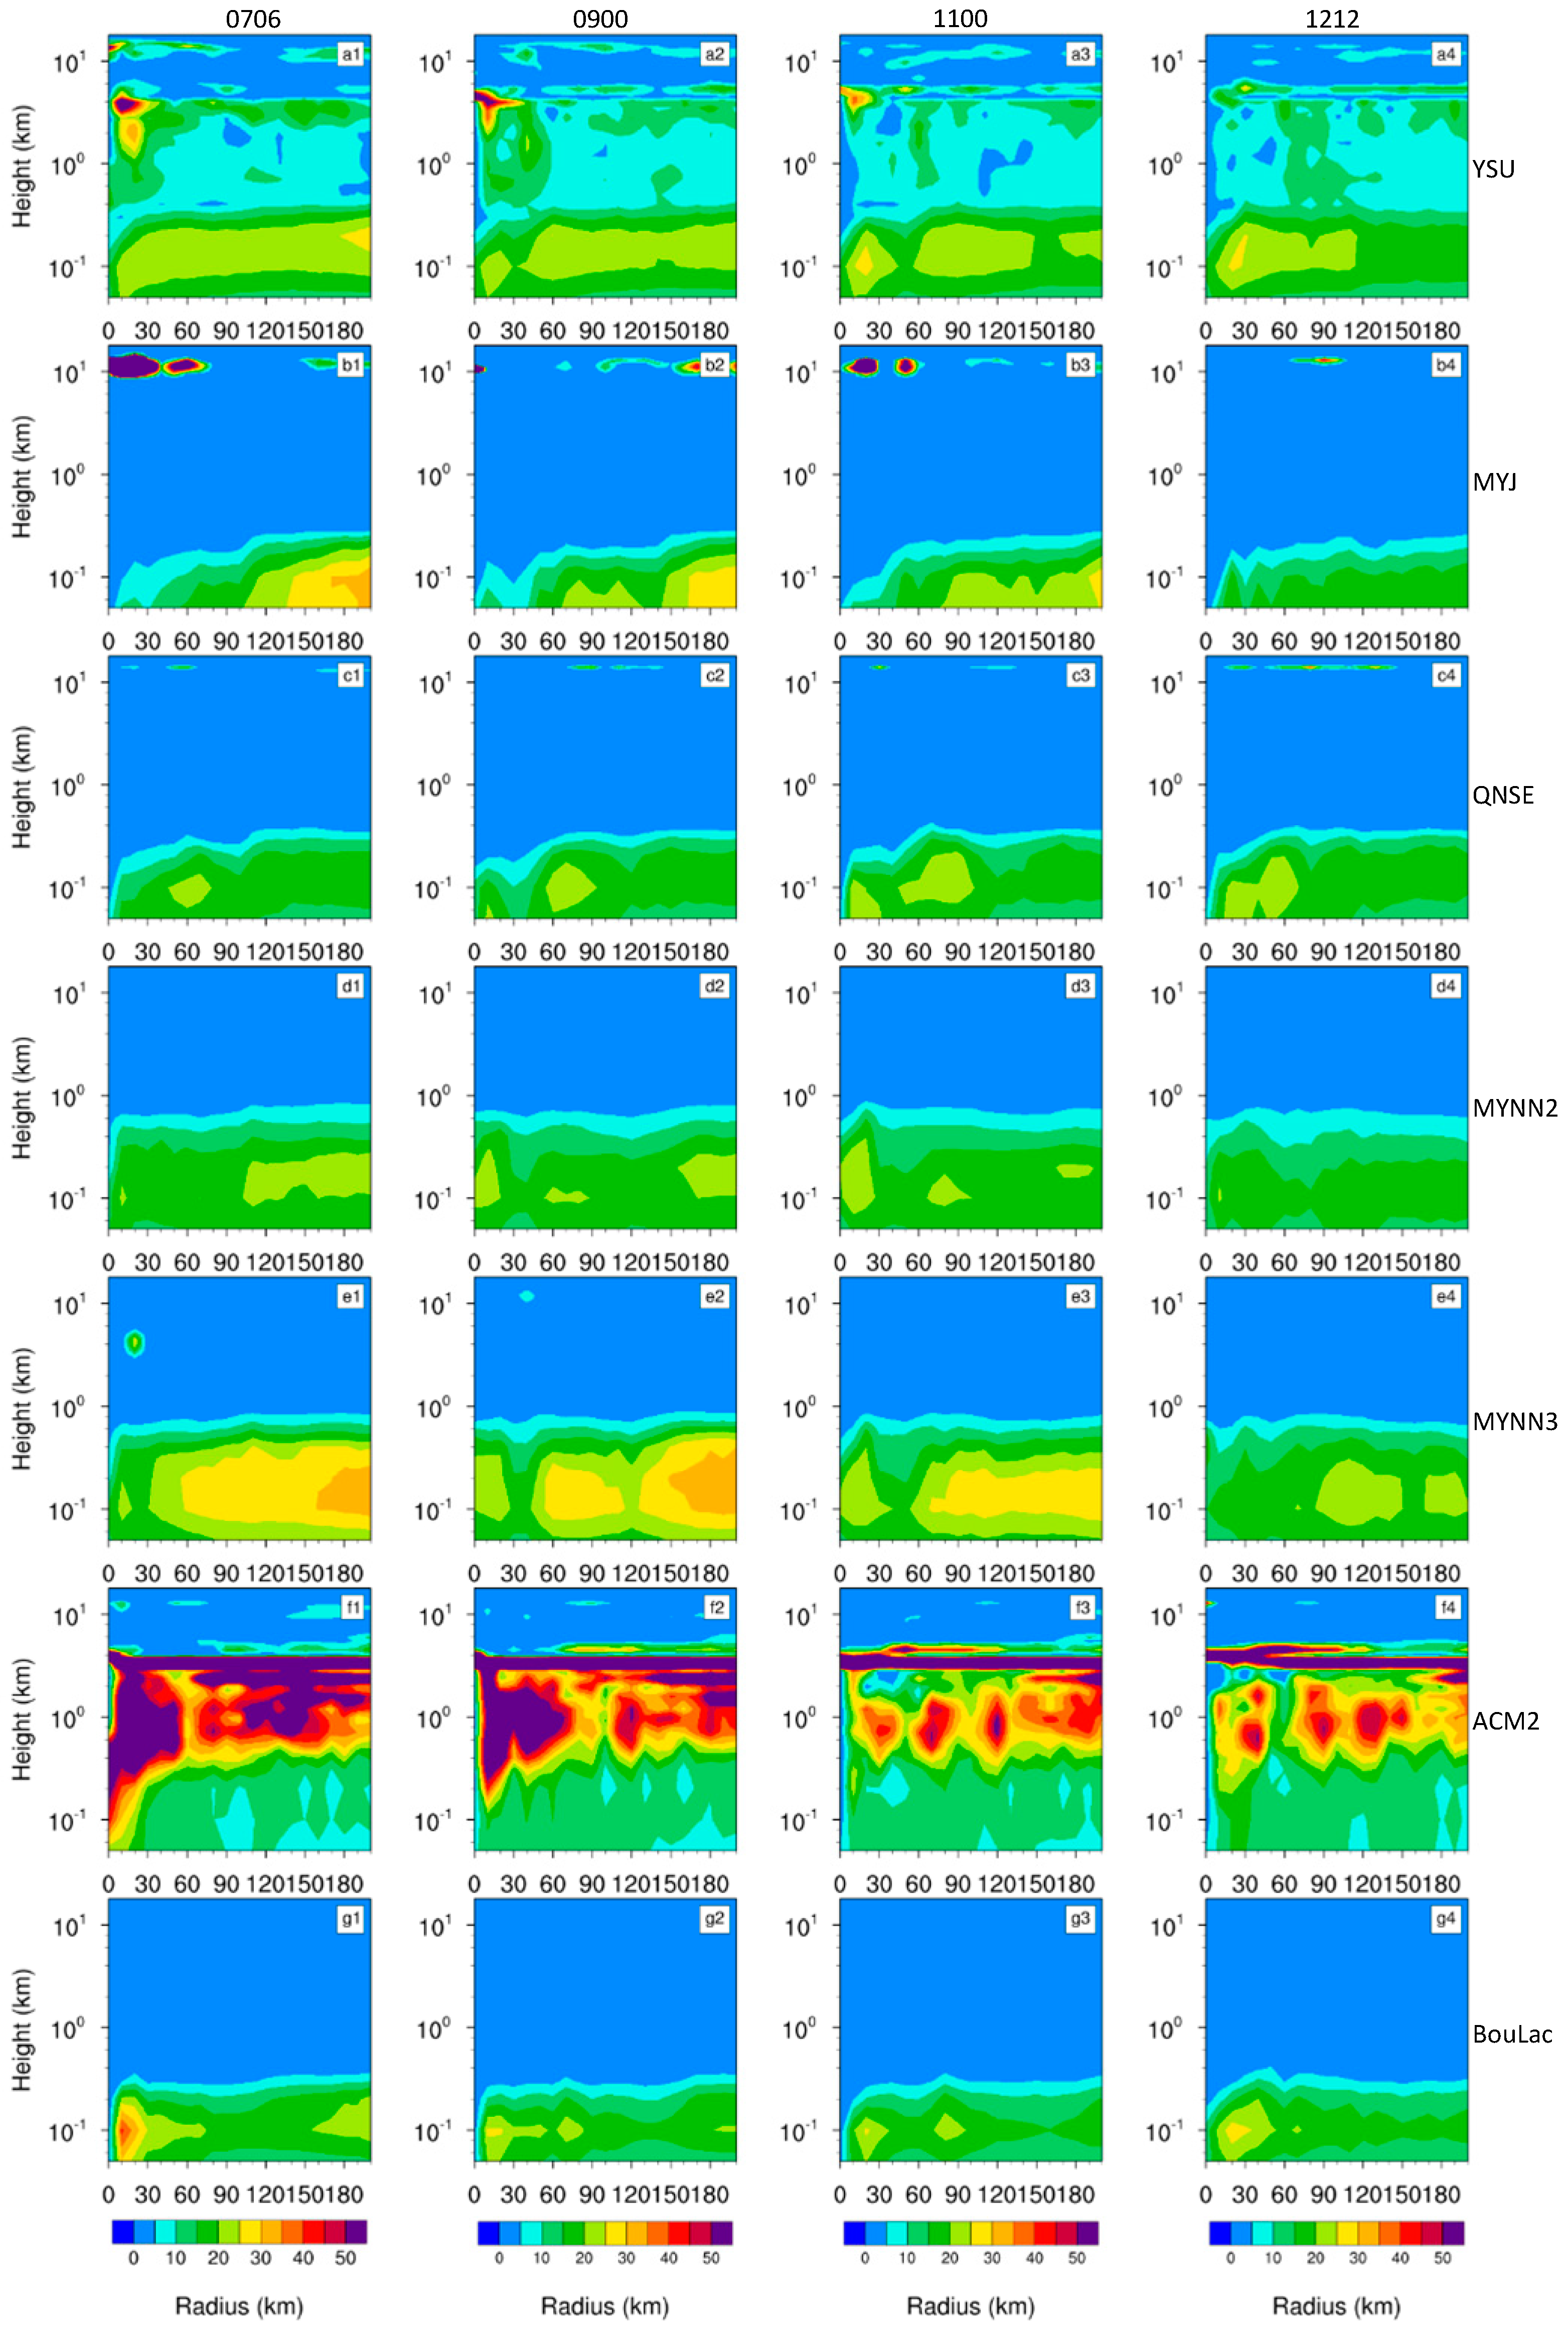
Four time points (0600 UTC 7th, 0000 UTC 9th, 0000 UTC 11th, and 1200 UTC 12th September 2018) representing four stages of TC intensification are selected for analysis. These stages include the initial stage (stage 1), prelude of RI (stage 2), middle of RI (stage 3), and end of the intensification (stage 4). The height–radius distribution of azimuthally averaged PBL turbulent diffusivity Km during these stages is examined (Figure 6). Since Kh is calculated from Km, and their distributions and variations are similar, the focus here is mainly on Km.
The nonlocal KPP YSU and the hybrid local–nonlocal ACM2 scheme incorporate turbulence in the free atmosphere above the boundary layer [56,78], resulting in an extension of diffusivity Km (and Kh) to the upper level. In contrast, the local TKE schemes, including MYJ, QNSE, MYNN2, MYNN3, and BouLac scheme, exhibit a concentration of Km within the boundary layer below 1 km in height, except for MYJ and QNSE, which have a small fraction of Km at the upper level.
At the initial stage, when the TC is still in its early development with low wind speeds, the ACM2 scheme shows significantly higher Km compared to other schemes. This strong turbulence mixing influences the TC’s development, resulting in a relatively weak TC from the ACM2 scheme. For the other schemes, their simulated Km values are relatively similar and primarily exist within the boundary layer below 1 km, except for YSU, which extends into the free atmosphere above the boundary layer. As the TC intensifies in subsequent stages, the simulated turbulent diffusion within the boundary layer for each scheme gradually increases with wind speed until reaching its maximum peak at the final stage. At the end of intensification (1200 UTC 12th), BouLac exhibits the highest diffusivity (peak Km of 637.2) within the boundary layer, followed by QNSE (peak Km of 134.7) and ACM2 (peak Km of 129.7). The diffusivity above the boundary layer in ACM2 is much higher compared to within the boundary layer. On the other hand, YSU produces the lowest diffusivity within the boundary layer, which is lower than that above the boundary layer.
To compare the simulated diffusivity of various PBL schemes under similar wind conditions, we analyzed the height–radius distribution of the azimuthally averaged Km during the early stage of the simulation (from 0300 UTC to 0600 UTC on 7th of September) in Figure 7. The distributions and variations of Kh were similar to Km in each corresponding numerical simulation.
During this early period (i.e., 0300 UTC 7th to 0600 UTC 7th), when wind speeds were similar, different PBL schemes exhibited variations in turbulent diffusion within the boundary layer (below 1 km). The MYNN3 scheme had a large range of Km, approximately 25–35 m2 s−1, while the MYNN2 scheme had a large range of Km about 20–25 m2 s−1. Both schemes had boundary layer mixing heights around 0.6–0.8 km. The YSU scheme showed a large range of Km mainly around 20–25 m2 s−1, with a boundary layer mixing height of about 0.4 km. The BouLac scheme had a large range of Km mainly around 15–25 m2 s−1, and a boundary layer mixing height of about 0.3 km. Smaller Km values and shallower boundary layer mixing heights indicate weaker turbulent diffusion, which contributes to stronger TC intensity in the BouLac and YSU schemes [79]. Conversely, larger Km values and deeper boundary layer mixing heights imply stronger turbulent diffusion, resulting in weaker TC intensity for the ACM2 scheme.
Regarding the MYJ and QNSE schemes with different surface layer schemes, although MYJ produced larger Ck/Cd ratios and surface enthalpy fluxes, its stronger turbulent diffusion with larger Km tended to suppress the TC intensity simulation.
Gopalakrishnan et al. [64] concluded that larger diffusion negates the gradients between the surface layer and the PBL, leading to weaker frictional forces and inflow. Conversely, smaller diffusion reduces the dissipation of angular momentum in the PBL, resulting in enhanced PBL inflow, enhanced spin-up and convergence of moisture in the PBL, enhanced convection in the eyewall, and subsequently, enhanced feedback to the PBL inflow and a stronger hurricane. Zhang et al. [79] further suggested that smaller vertical diffusion in the boundary layer leads to the simulated storms with stronger intensity and smaller size, shallower boundary layer, stronger inflow in the boundary layer, stronger outflow above the boundary layer, stronger updrafts in the eyewall, and a stronger warm core.
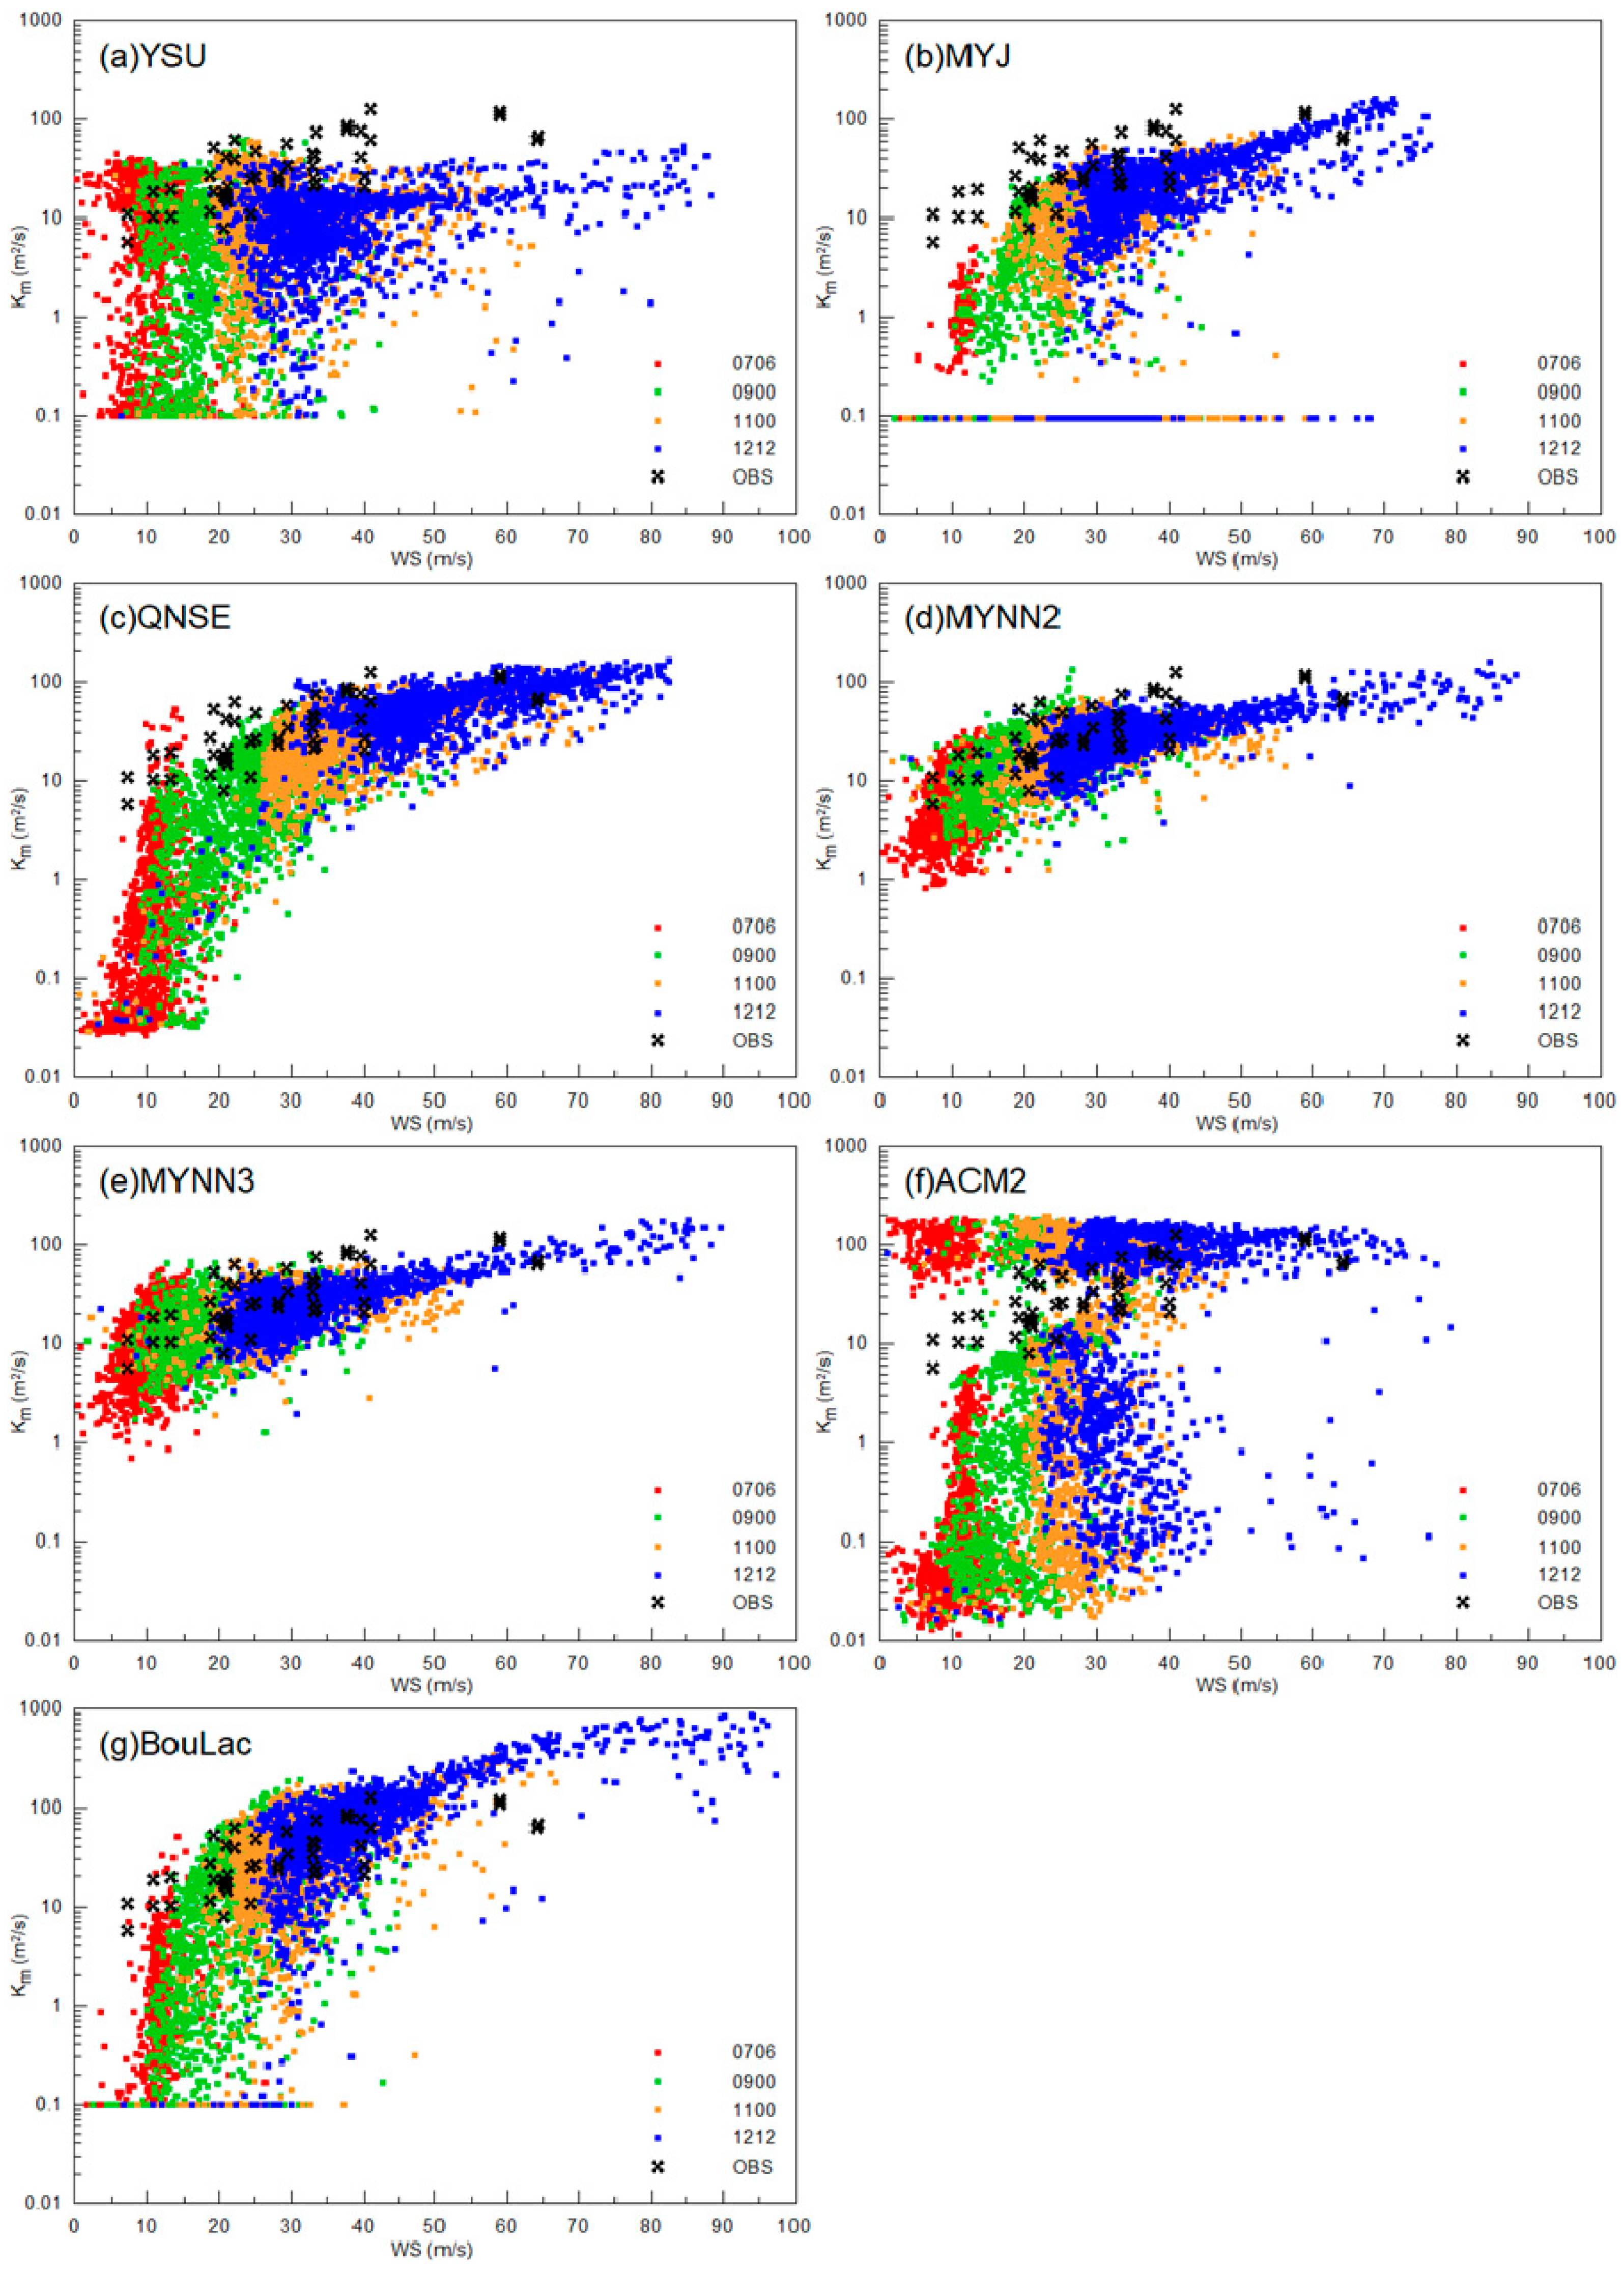
Figure 8 presents the relationship between diffusivity and wind speed at an altitude of 450 m during four stages of TC intensification simulation (0600 UTC 7th, 0000 UTC 9th, 0000 UTC 11th, and 1200 UTC 12 September 2018), compared with the observations from Zhang et al. [80]. Figure 8 shows that as the TC intensifies, the diffusivities corresponding to wind speed increase and shift toward higher wind speeds. However, there are some differences in the simulated Km values among various PBL schemes when comparing them with the observations. MYNN2 and MYNN3 schemes produce similar relationships between Km and wind speed, except for some differences under high wind conditions. On the other hand, YSU and ACM2 schemes tend to produce different Km values to some extent. In the KPP closures, the flux is not solely determined by turbulent diffusivity; rather, large contributions arise from plumes and entrainment, which are parameterized differently. Consequently, it is expected that Km is smaller in YSU and ACM2 schemes compared to the observed values. Other PBL schemes including MYJ, QNSE, and BouLac schemes also have some differences to some degree. Therefore, future research should focus on improving the PBL diffusivity parameterization by incorporating more observation data. Regarding the simulation results, considering that Km (and Cd) depends on stability, smaller values of Km (and Cd) in Figure 8 (and Figure 4 and Figure 5) may be due to less unstable conditions. Additionally, it should be noted that Km and Cd values in this study provide only initial insights for further research and highlight the significant differences between the PBL schemes. Considering factors such as the magnitude of enthalpy flux and spatial variability of diffusivity, more detailed work is needed on turbulence simulation and observation in the TC center and outer regions.
The primary difference among PBL schemes lies in the representation of vertical mixing through turbulent diffusivity [58]. On the one hand, Smith et al. [32] and Smith and Thomsen [77] found that the PBL schemes with smaller vertical turbulent diffusivity have larger inflow speeds and tangential winds. Similarly, Gopalakrishnan et al. [64] and Zhang et al. [79] concluded that smaller vertical diffusion within the boundary layer leads to stronger storms with stronger inflow within the boundary layer and stronger updrafts around the eyewall. On the other hand, Liu et al. [33] indicated that during the TC development and intensification process, the positive feedback between vertical mixing and surface fluxes eventually results in a stronger hurricane vortex.
Therefore, both surface flux and vertical turbulent diffusion play a role in determining TC intensity. In other words, both surface layer parameterization and PBL parameterization contribute to TC intensity. YSU and BouLac, with smaller turbulent diffusivity in the boundary layer, produce stronger storm intensity. QNSE, with smaller turbulent diffusivity in the boundary layer and a much larger Ck/Cd ratio and surface enthalpy flux, produces stronger storm intensity.

3.4. TC Structure

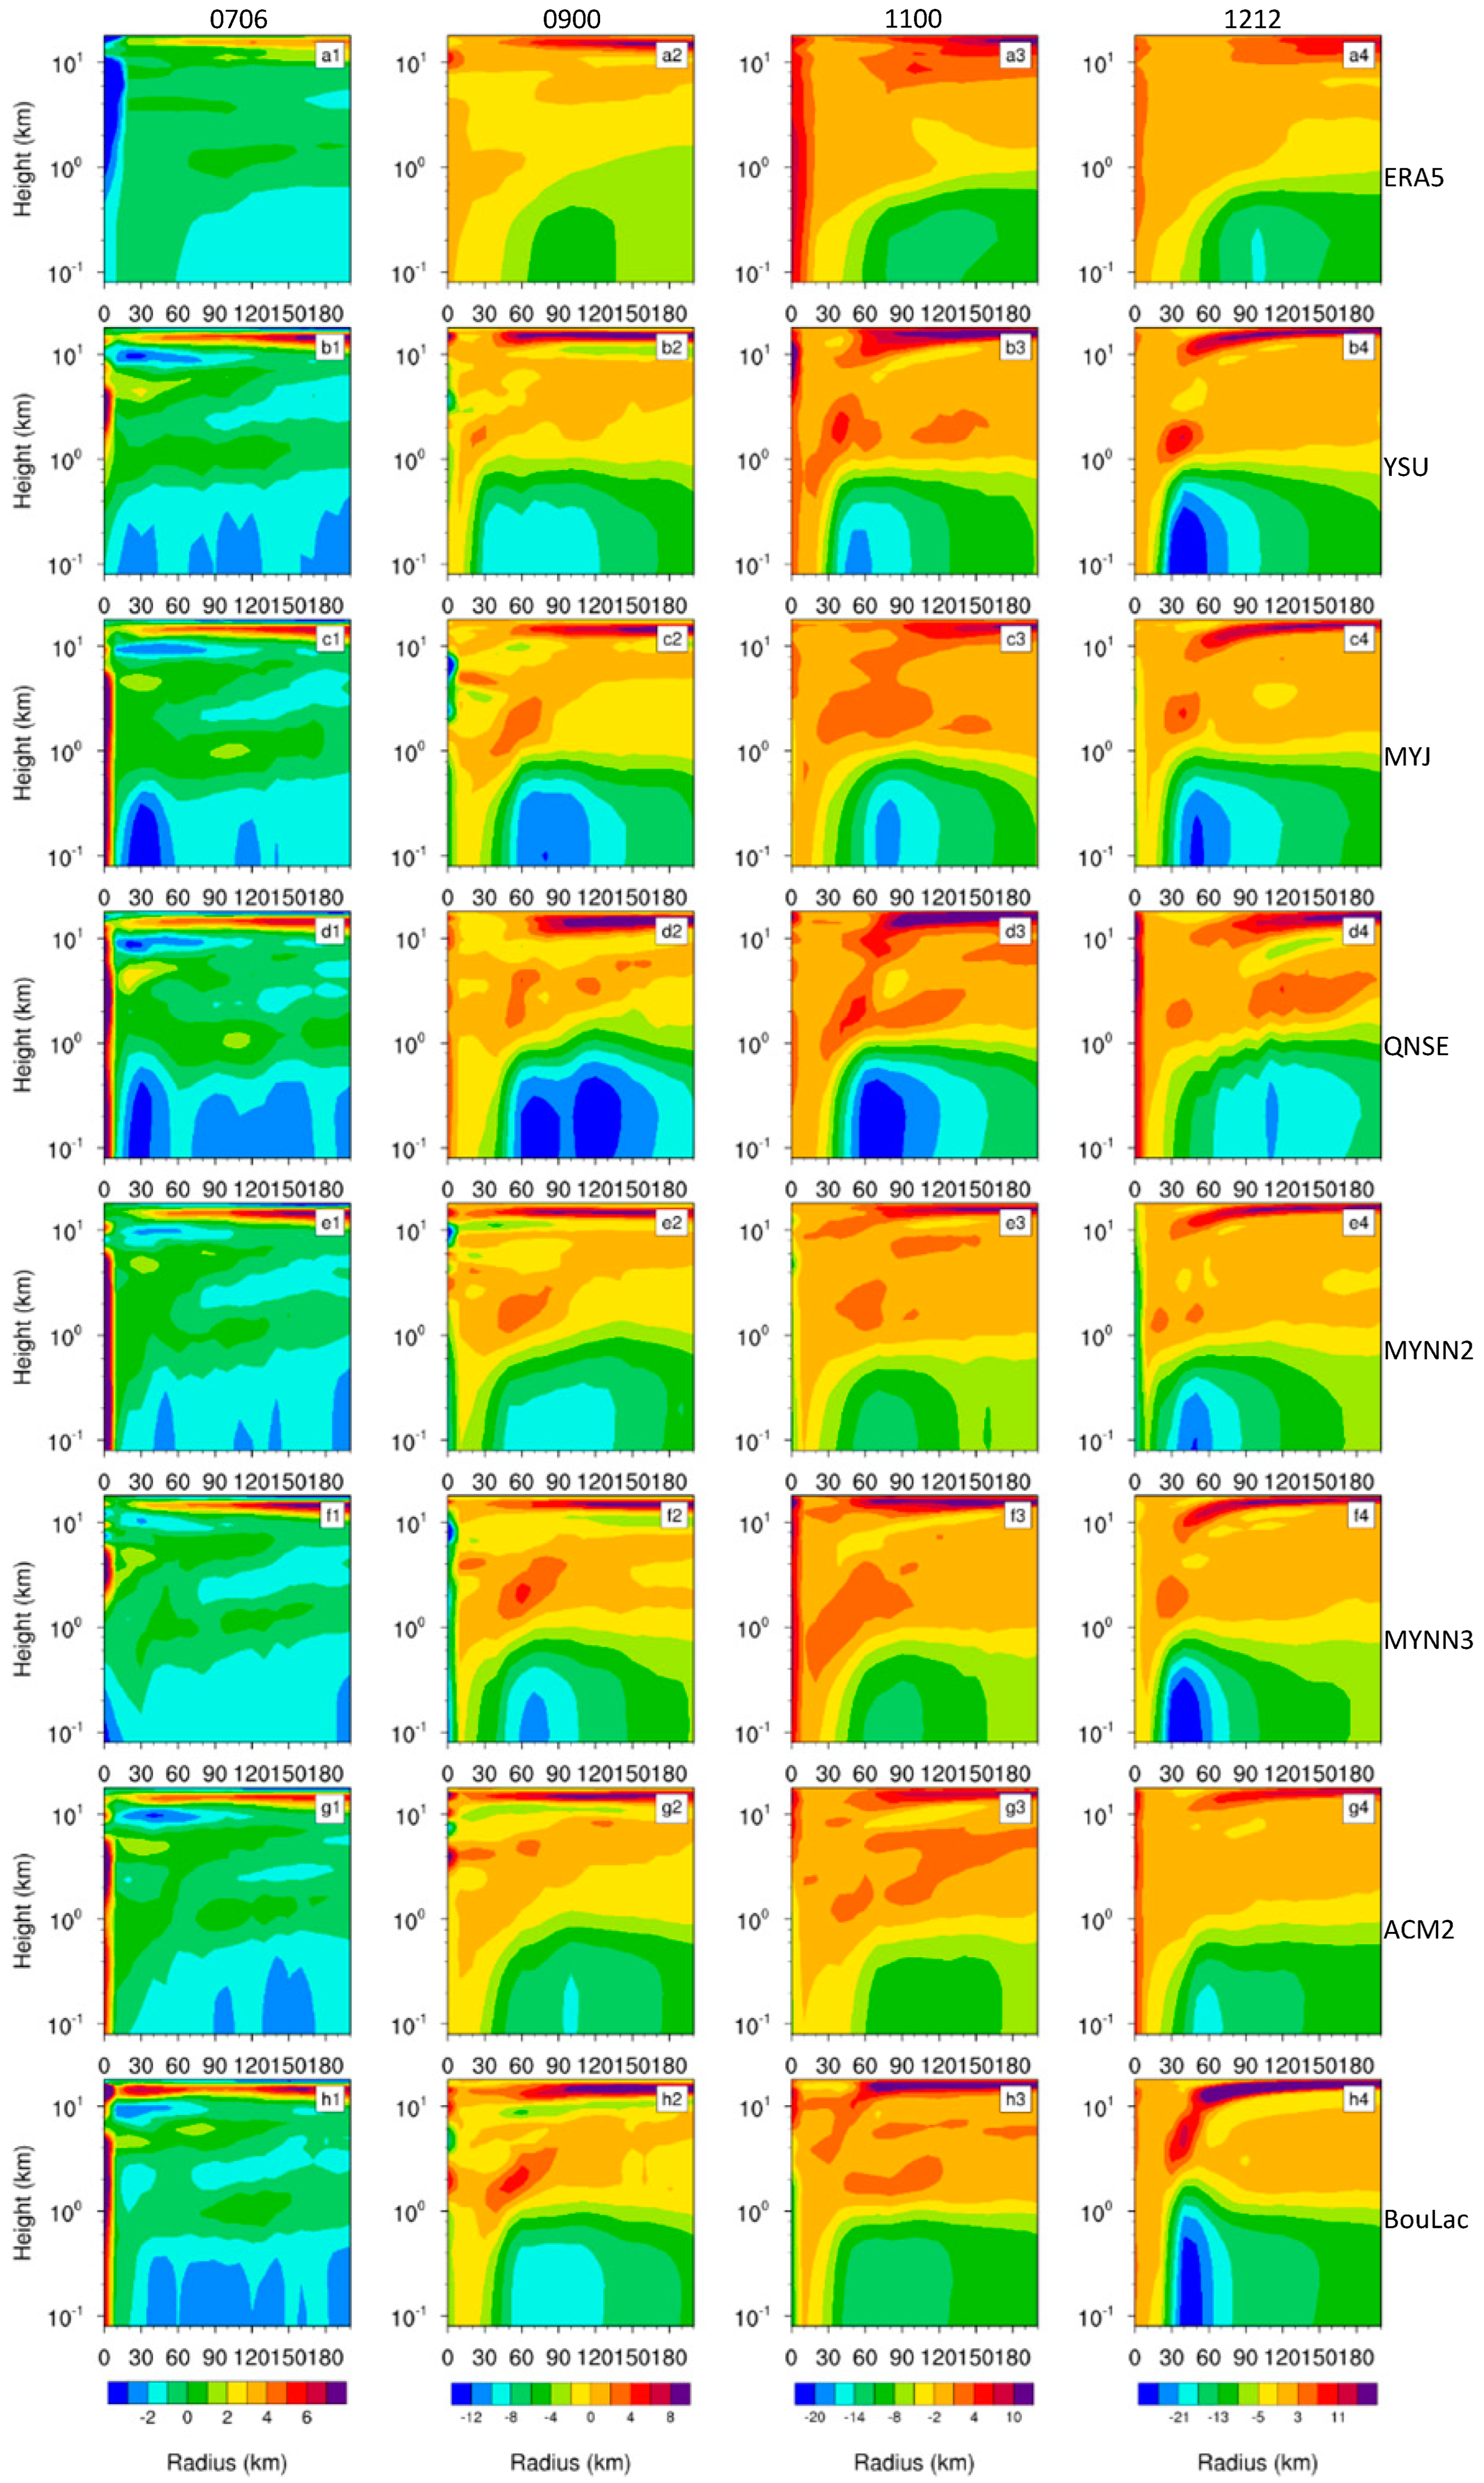
In this subsection, we further analyze the simulated TC structure using various PBL schemes during intensification. Similarly, four moments (0600 UTC 7th, 0000 UTC 9th, 0000 UTC 11th, and 1200 UTC 12 September 2018) representing different stages of intensification are chosen for analysis. Figure 9, Figure 10, Figure 11 and Figure 12 shows the height–radius distribution of azimuthally averaged tangential wind speed, radial wind speed, vertical wind speed, and equivalent potential temperature from the simulations at each stage. Here, we use ERA5 reanalysis data as a reference to compare the simulation results. Although ERA5 generally underestimates the TC intensity, it provides an effective reference for TC size [62].
ERA5 reanalysis combines model data with observations using assimilation techniques to produce a globally complete and consistent dataset. It provides hourly estimates for a wide range of atmospheric, ocean-wave, and land-surface quantities. Due to its high resolution and extensive temporal coverage, ERA5 data are widely used in numerous studies, offering a consistent and reliable meteorological analysis background. For example, ERA5 data have been employed in comparative analyses by Li et al. [81], Rajeswari et al. [82], Wang et al. [83], and Shen et al. [84]. Therefore, we used the ERA5 reanalysis data as a reference in our study, employing it to supplement and replace the observational data.
In this study, horizontal resolution of the ERA5 reanalysis data is 0.25° × 0.25°, and the horizontal resolutions of the simulated results are 27 km, 9 km, and 3 km for the three simulated domains, respectively. The resolution among the different PBL parameterization schemes remains consistent, and when in comparison with ERA5 data, our focus is primarily on comparing distribution patterns rather than exact quantities. Therefore, ensuring that the comparative areas are of the same size is sufficient, making the comparisons more valid and compelling.
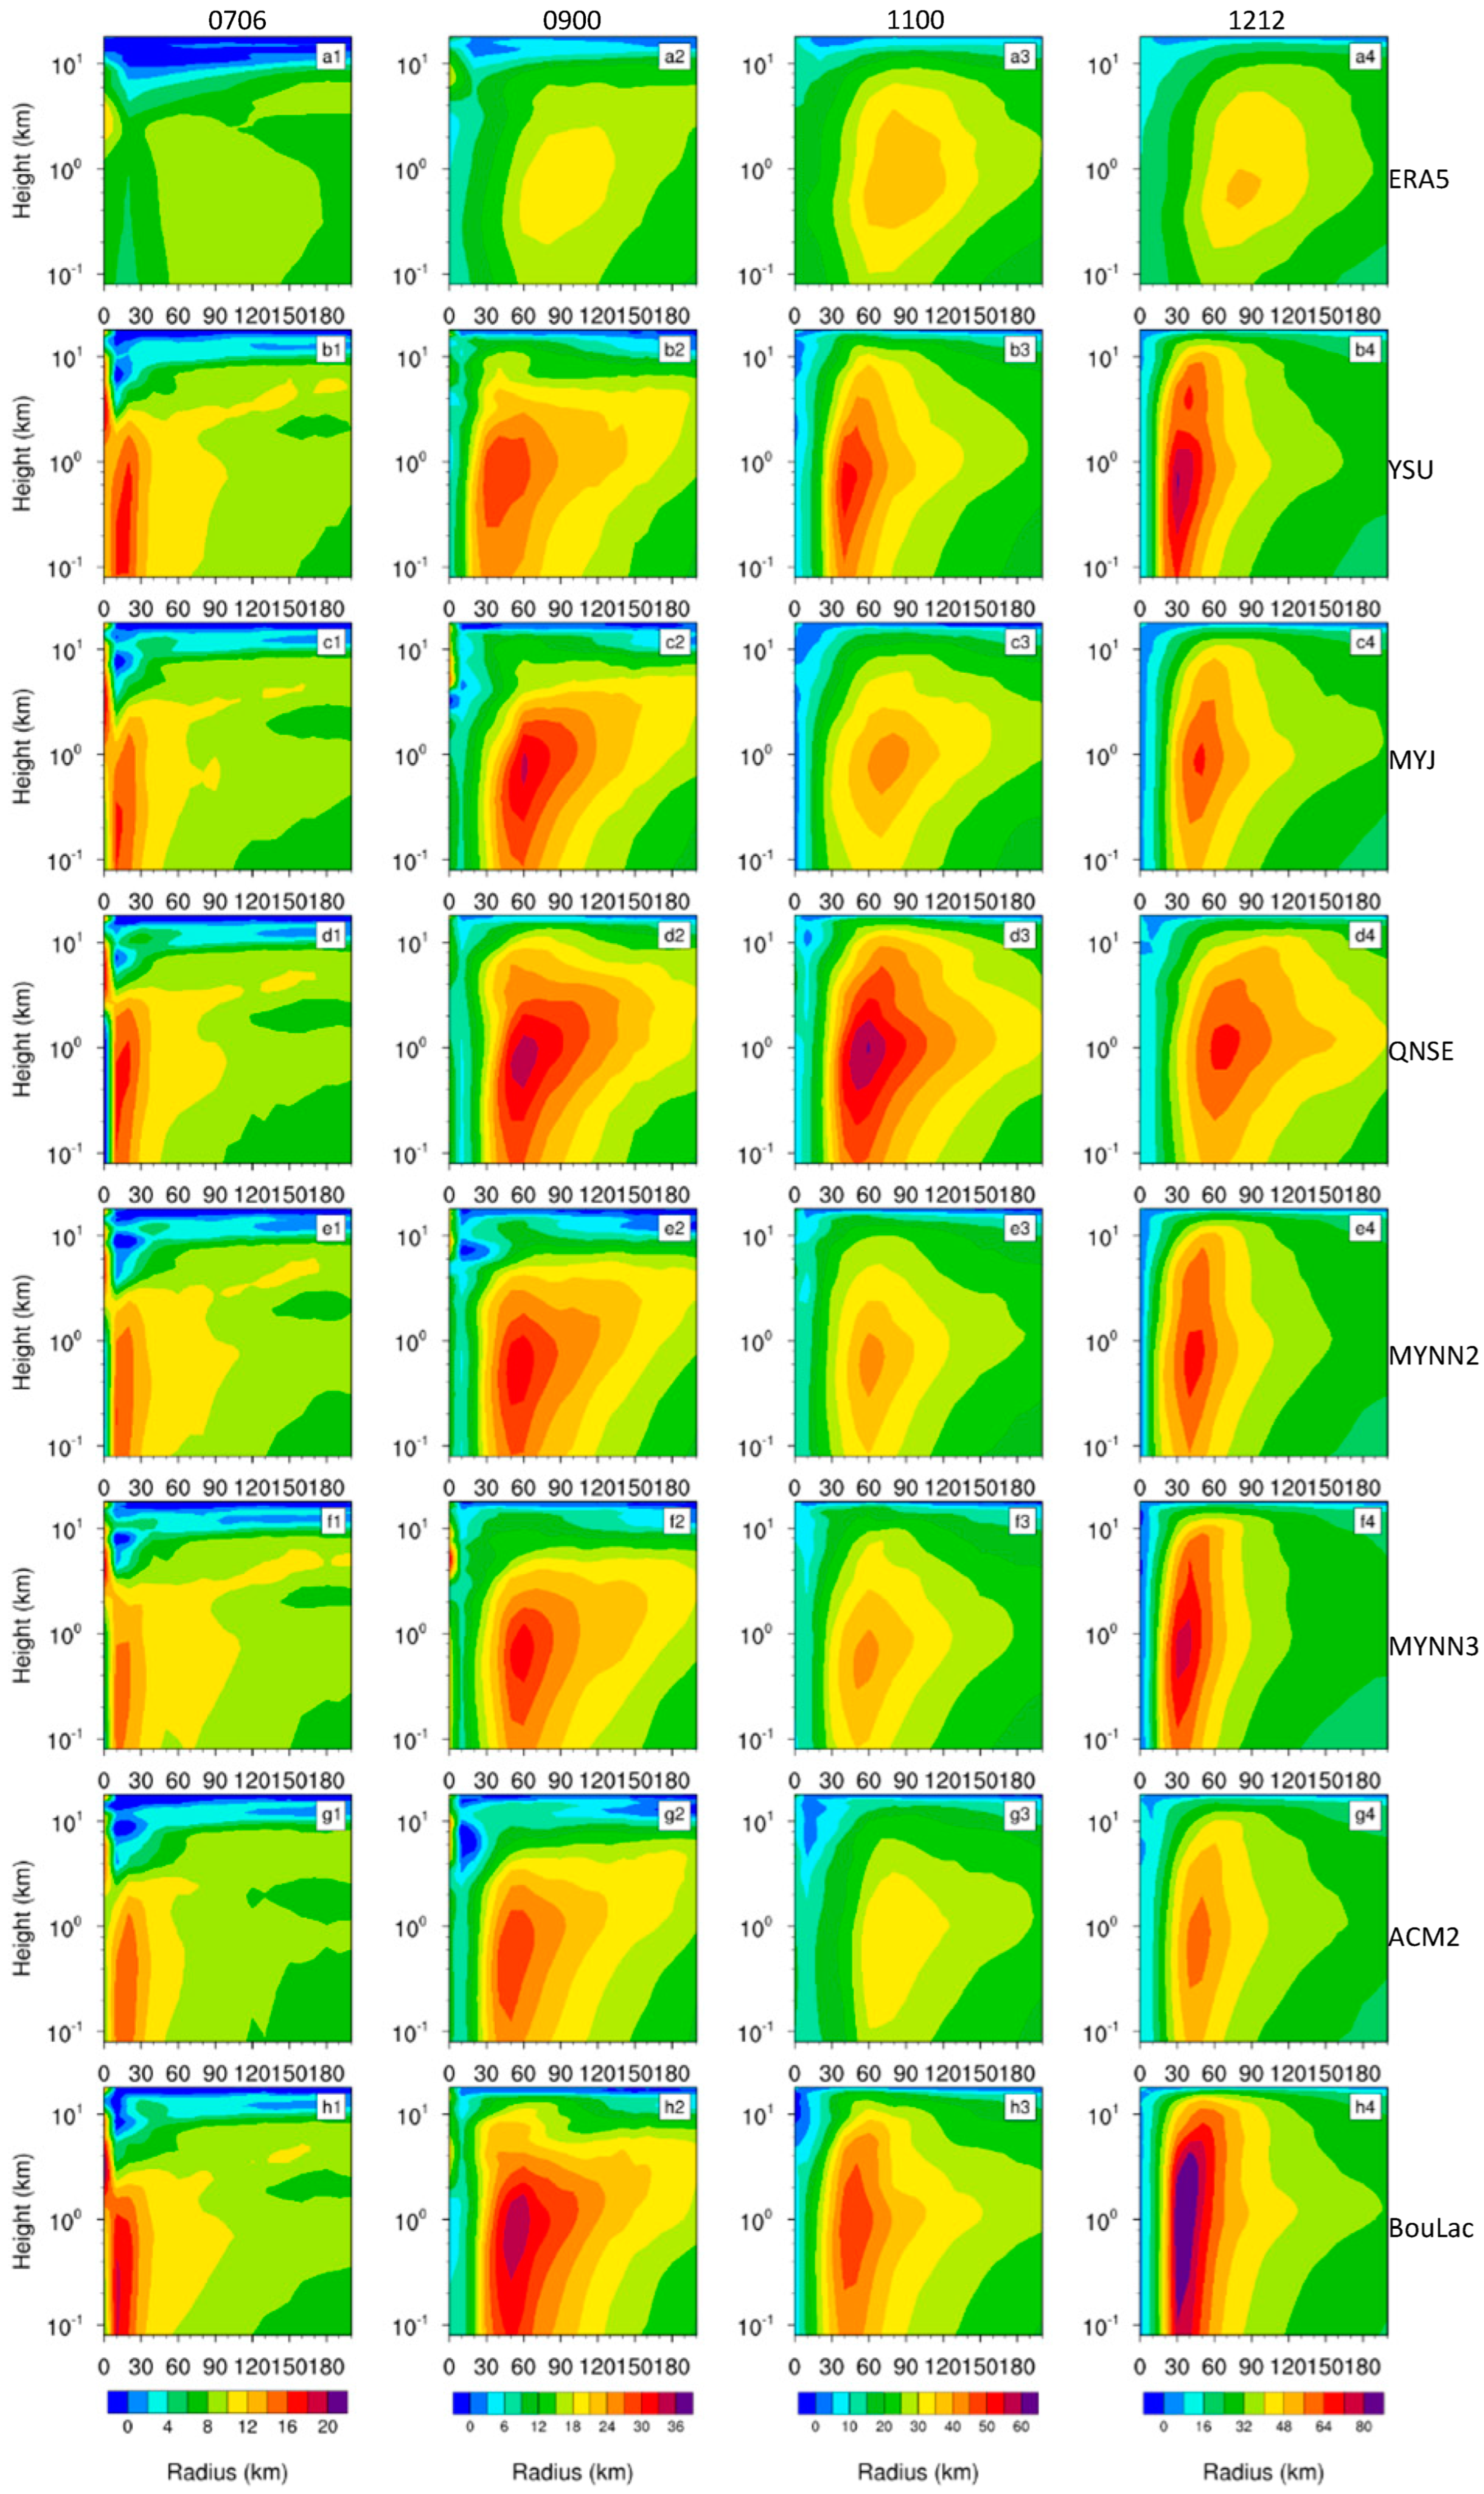
Tangential wind reflects the primary circulation of a TC. In Figure 9, in stage 1 (0600 UTC 7th), the simulated tangential wind speeds from different PBL schemes are relatively close. The BouLac scheme produces the largest tangential wind, exceeding 18 m s−1, followed by the YSU, MYJ, and QNSE schemes, all above 16 m s−1. However, the simulated TC size, indicated by the maximum tangential wind radius (RMTW), is smaller than what is observed in the ERA5 data. As the intensification progresses in stage 2 (0000 UTC 9th), the tangential wind speeds of the BouLac and QNSE schemes remain higher compared to other simulations. The RMTW expands for all simulations (about 50–60 km, except for YSU with about 40 km) but is still smaller than the ERA5 data (about 90 km). In stage 3 (0000 UTC 11th), the QNSE scheme simulates the strongest tangential winds, followed by the YSU and BouLac schemes. The RMTW of the MYJ and ACM2 schemes increases (about 60–70 km), while the variation in TC size for other simulations is small. The RMTW of the ERA5 data also shrinks (about 60–70 km). In stage 4 (1200 UTC 12th), the BouLac scheme exhibits the largest tangential wind speed, peaking at 85 m s−1, followed by YSU with a peak value of about 80 m s−1. The QNSE scheme shows a reduction in tangential wind, but its TC size (RMTW of about 60–70 km) remains closer to the ERA5 data. The RMTWs of other schemes are decreased (about 30–40 km). Overall, the simulated tangential wind magnitude corresponds to TC intensity indicators (MSLP and VMAX). Additionally, the TC size gradually decreases as the TC intensity increases.
The distribution of radial wind in Figure 10 reflects the inflow at the low level and outflow at the high level in TC, while the upward vertical velocity in Figure 11 reflects the updrafts in TC. In stage 1, the magnitude of radial and upward vertical wind in different simulations is relatively small, indicating that TC intensification has not yet started. The MYJ, QNSE, BouLac, and YSU schemes show slightly stronger radial inflow within the boundary layer, while the BouLac scheme exhibits slightly stronger updrafts around the eyewall. As intensification begins in stage 2, the radial inflow strengthens, and all simulations show clear radial inflow within the boundary layer as well as the appearance of updrafts around the eyewall. The QNSE scheme produces the greatest radial inflow and updrafts. In stage 3, the QNSE scheme produces the strongest radial inflow (peak of about 20 m s−1), followed by the YSU and MYJ schemes. Additionally, the YSU, QNSE, and BouLac schemes exhibit stronger updrafts near the eyewall. In stage 4, the YSU (peak of 33.2 m s−1), MYNN3 (peak of 32.0 m s−1), and BouLac (peak of 28.6 m s−1) schemes produce the strongest radial inflow. And the BouLac scheme also produces the largest peak ascending velocity (peak of 7.0 m s−1), followed by YSU (peak of 3.7 m s−1) and MYNN3 (peak of 2.9 m s−1), while the ACM2 scheme shows the smallest ascending velocity (peak of 1.7 m s−1). The BouLac scheme simulates stronger radial inflows within the boundary layer and updrafts around the eyewall, resulting in its intense storm intensity. The updrafts of the QNSE scheme are weakened compared to stage 3, which affects the storm intensity at stage 4.
These results suggest that the simulated TC intensity is related to the magnitude of radial inflow and ascending velocity from the simulations. The turbulent mixing process may also influence the magnitude of radial inflow and ascending velocity. Previous studies [32,77,79] have shown that PBL schemes with small turbulent diffusivity produce large inflow and ascending velocity. In the initial stage, when the TC wind speed is relatively small and close, the BouLac and YSU schemes, with small turbulent diffusivity, promote the development of radial inflow and ascending velocity, especially BouLac, leading to the development of storm intensity and thus producing a stronger TC storm.
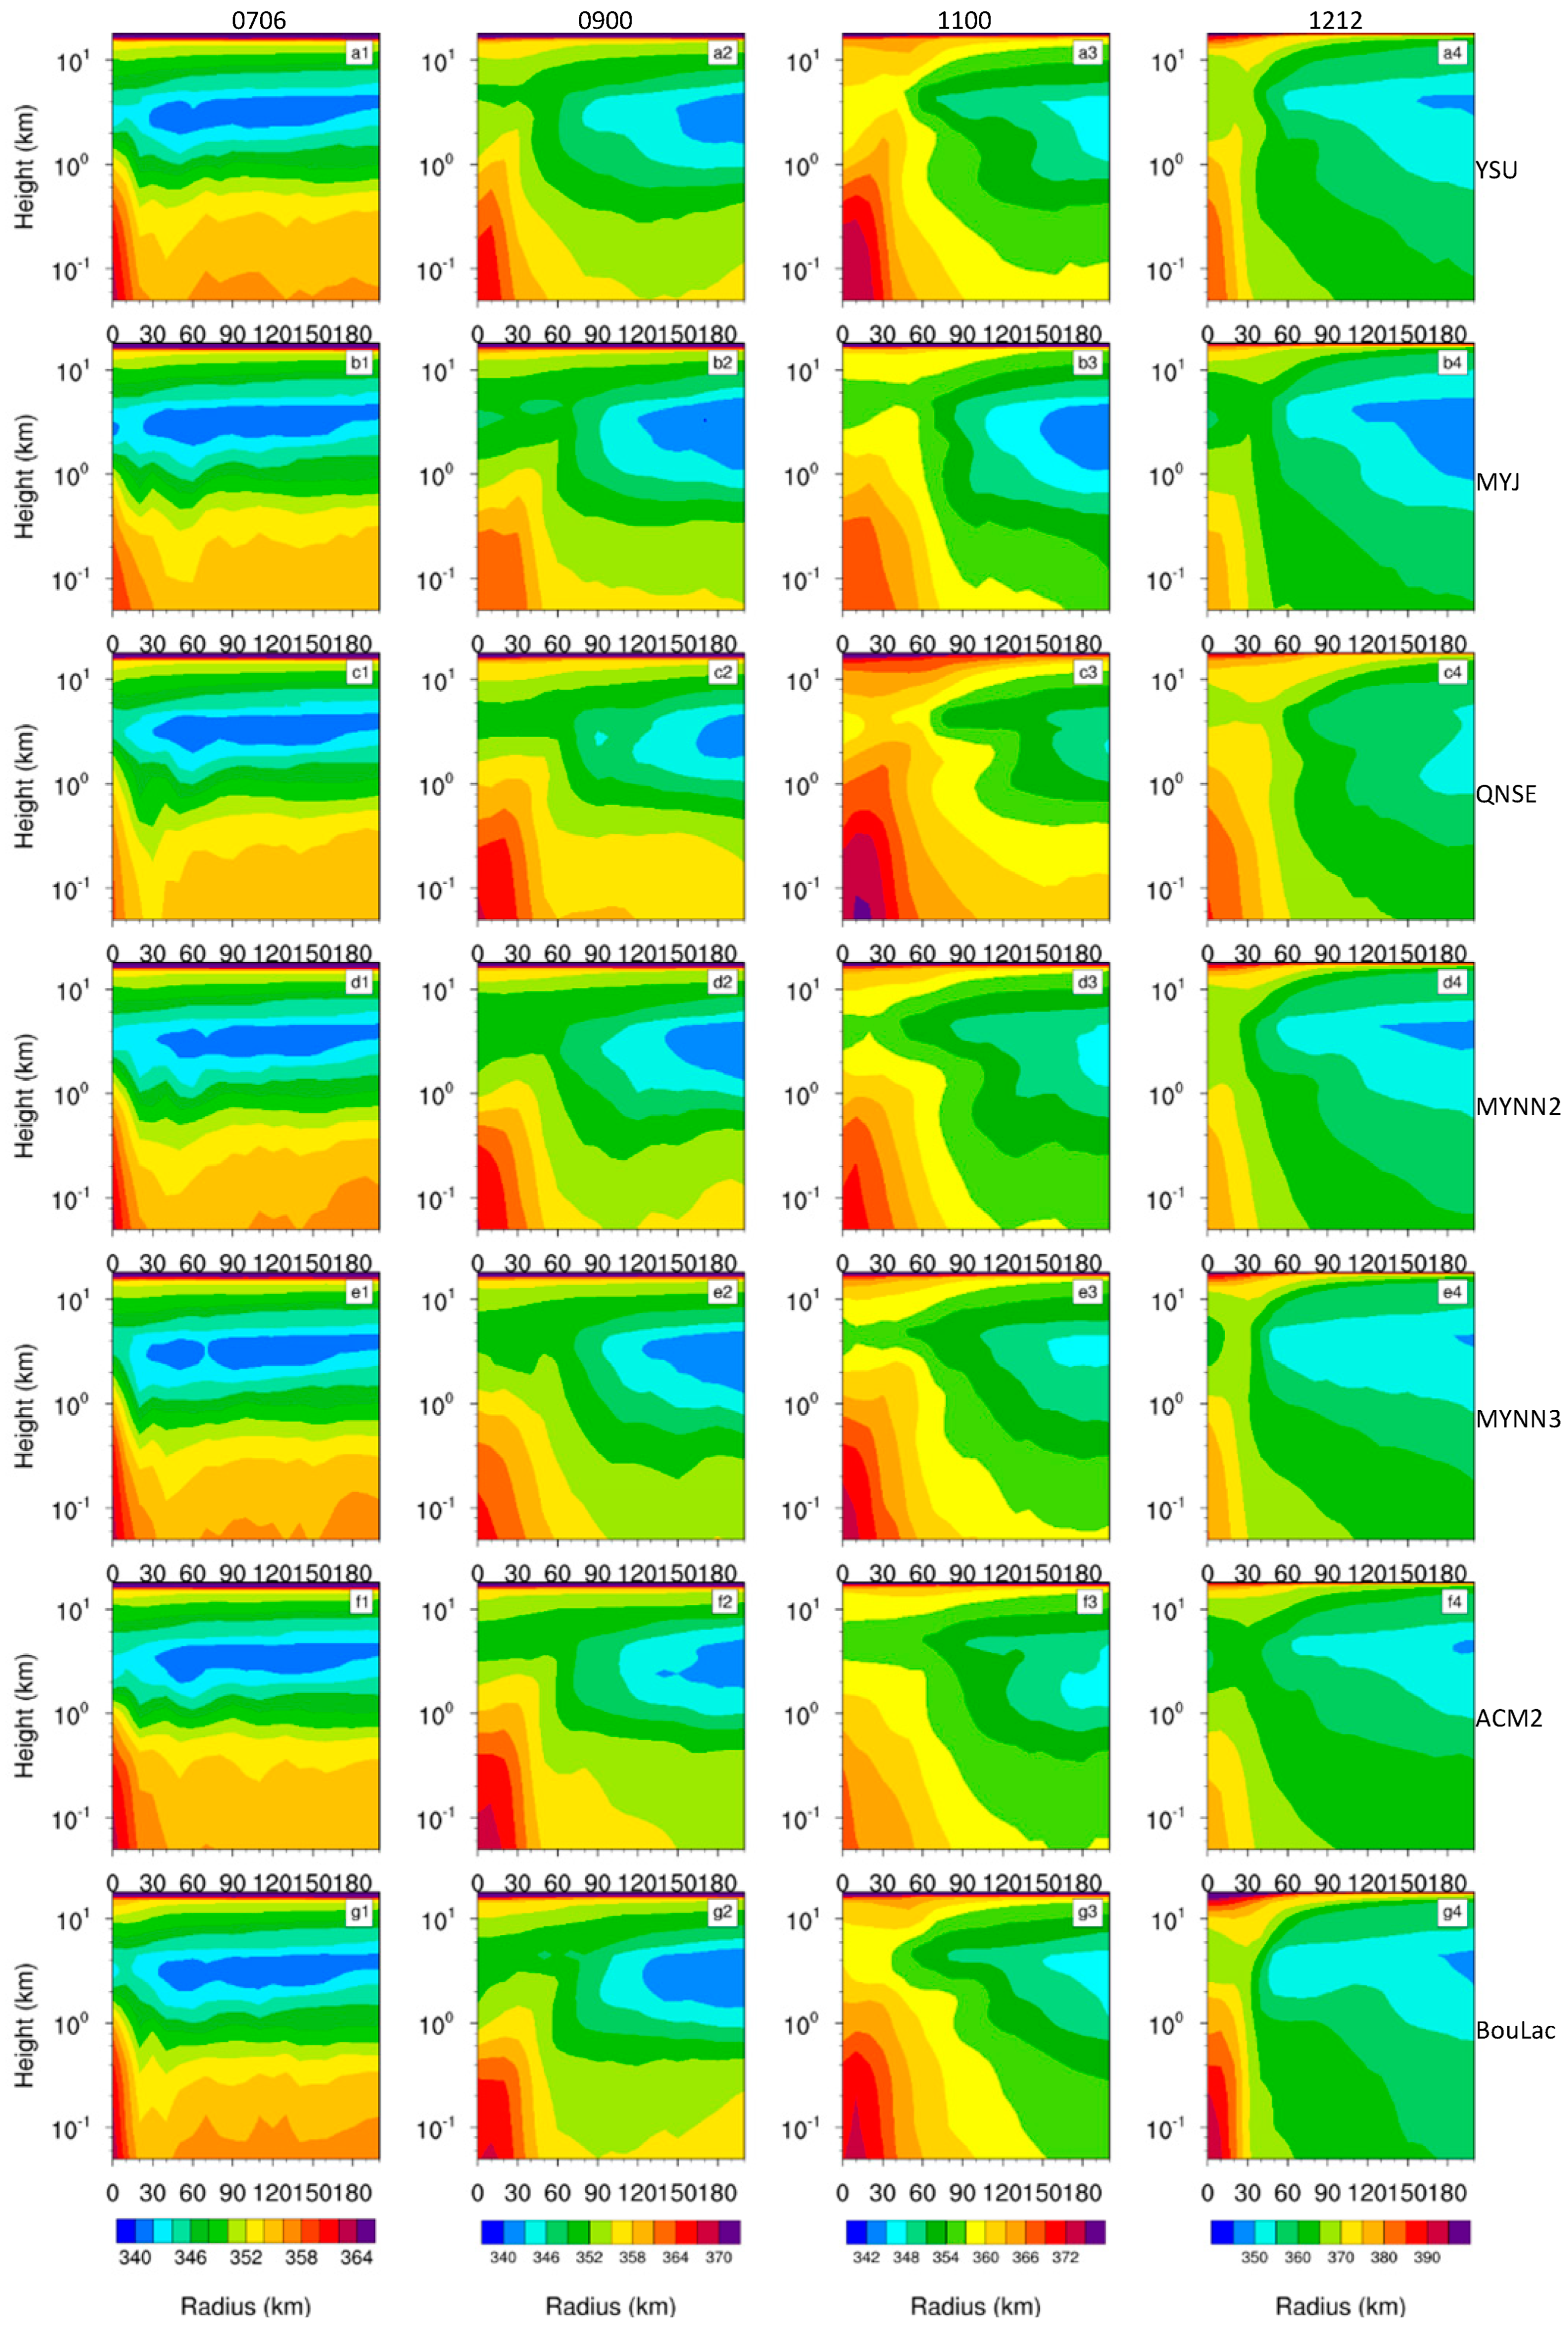
The equivalent potential temperature is a useful tool for diagnosing the TC thermal structure, and lower values indicate dry and cold air, while higher values indicate warm and moist air [85,86]. Zhang et al. [85]’s Figure 9 and Zhang and Pu [86]’s Figure 11 both plotted the distribution and variation of azimuthally averaged equivalent potential temperature during the evolution of hurricane cases. In our study, Figure 12 shows the distribution of equivalent potential temperatures from simulations. In stage 1, the differences in simulated equivalent temperatures among the various PBL schemes are relatively small. The BouLac and YSU schemes show slightly higher equivalent potential temperatures near the surface. As intensification begins in stage 2, the equivalent potential temperatures near the TC center in all simulations significantly exceed those in the surrounding environment, indicating the formation of a warm moist core structure. In stage 3, the YSU, QNSE, and BouLac schemes simulate higher equivalent potential temperatures at the TC center compared to other schemes. In stage 4, the peak equivalent potential temperature of the BouLac scheme exceeds 385 K, while the peak equivalent potential temperatures of the QNSE and YSU schemes exceed 380 K. The peak equivalent potential temperatures in other simulations remain below 380 K. This suggests that the BouLac, QNSE, and YSU schemes generate a stronger warm core during TC intensification, resulting in warmer and moister air for TC development and intensification.
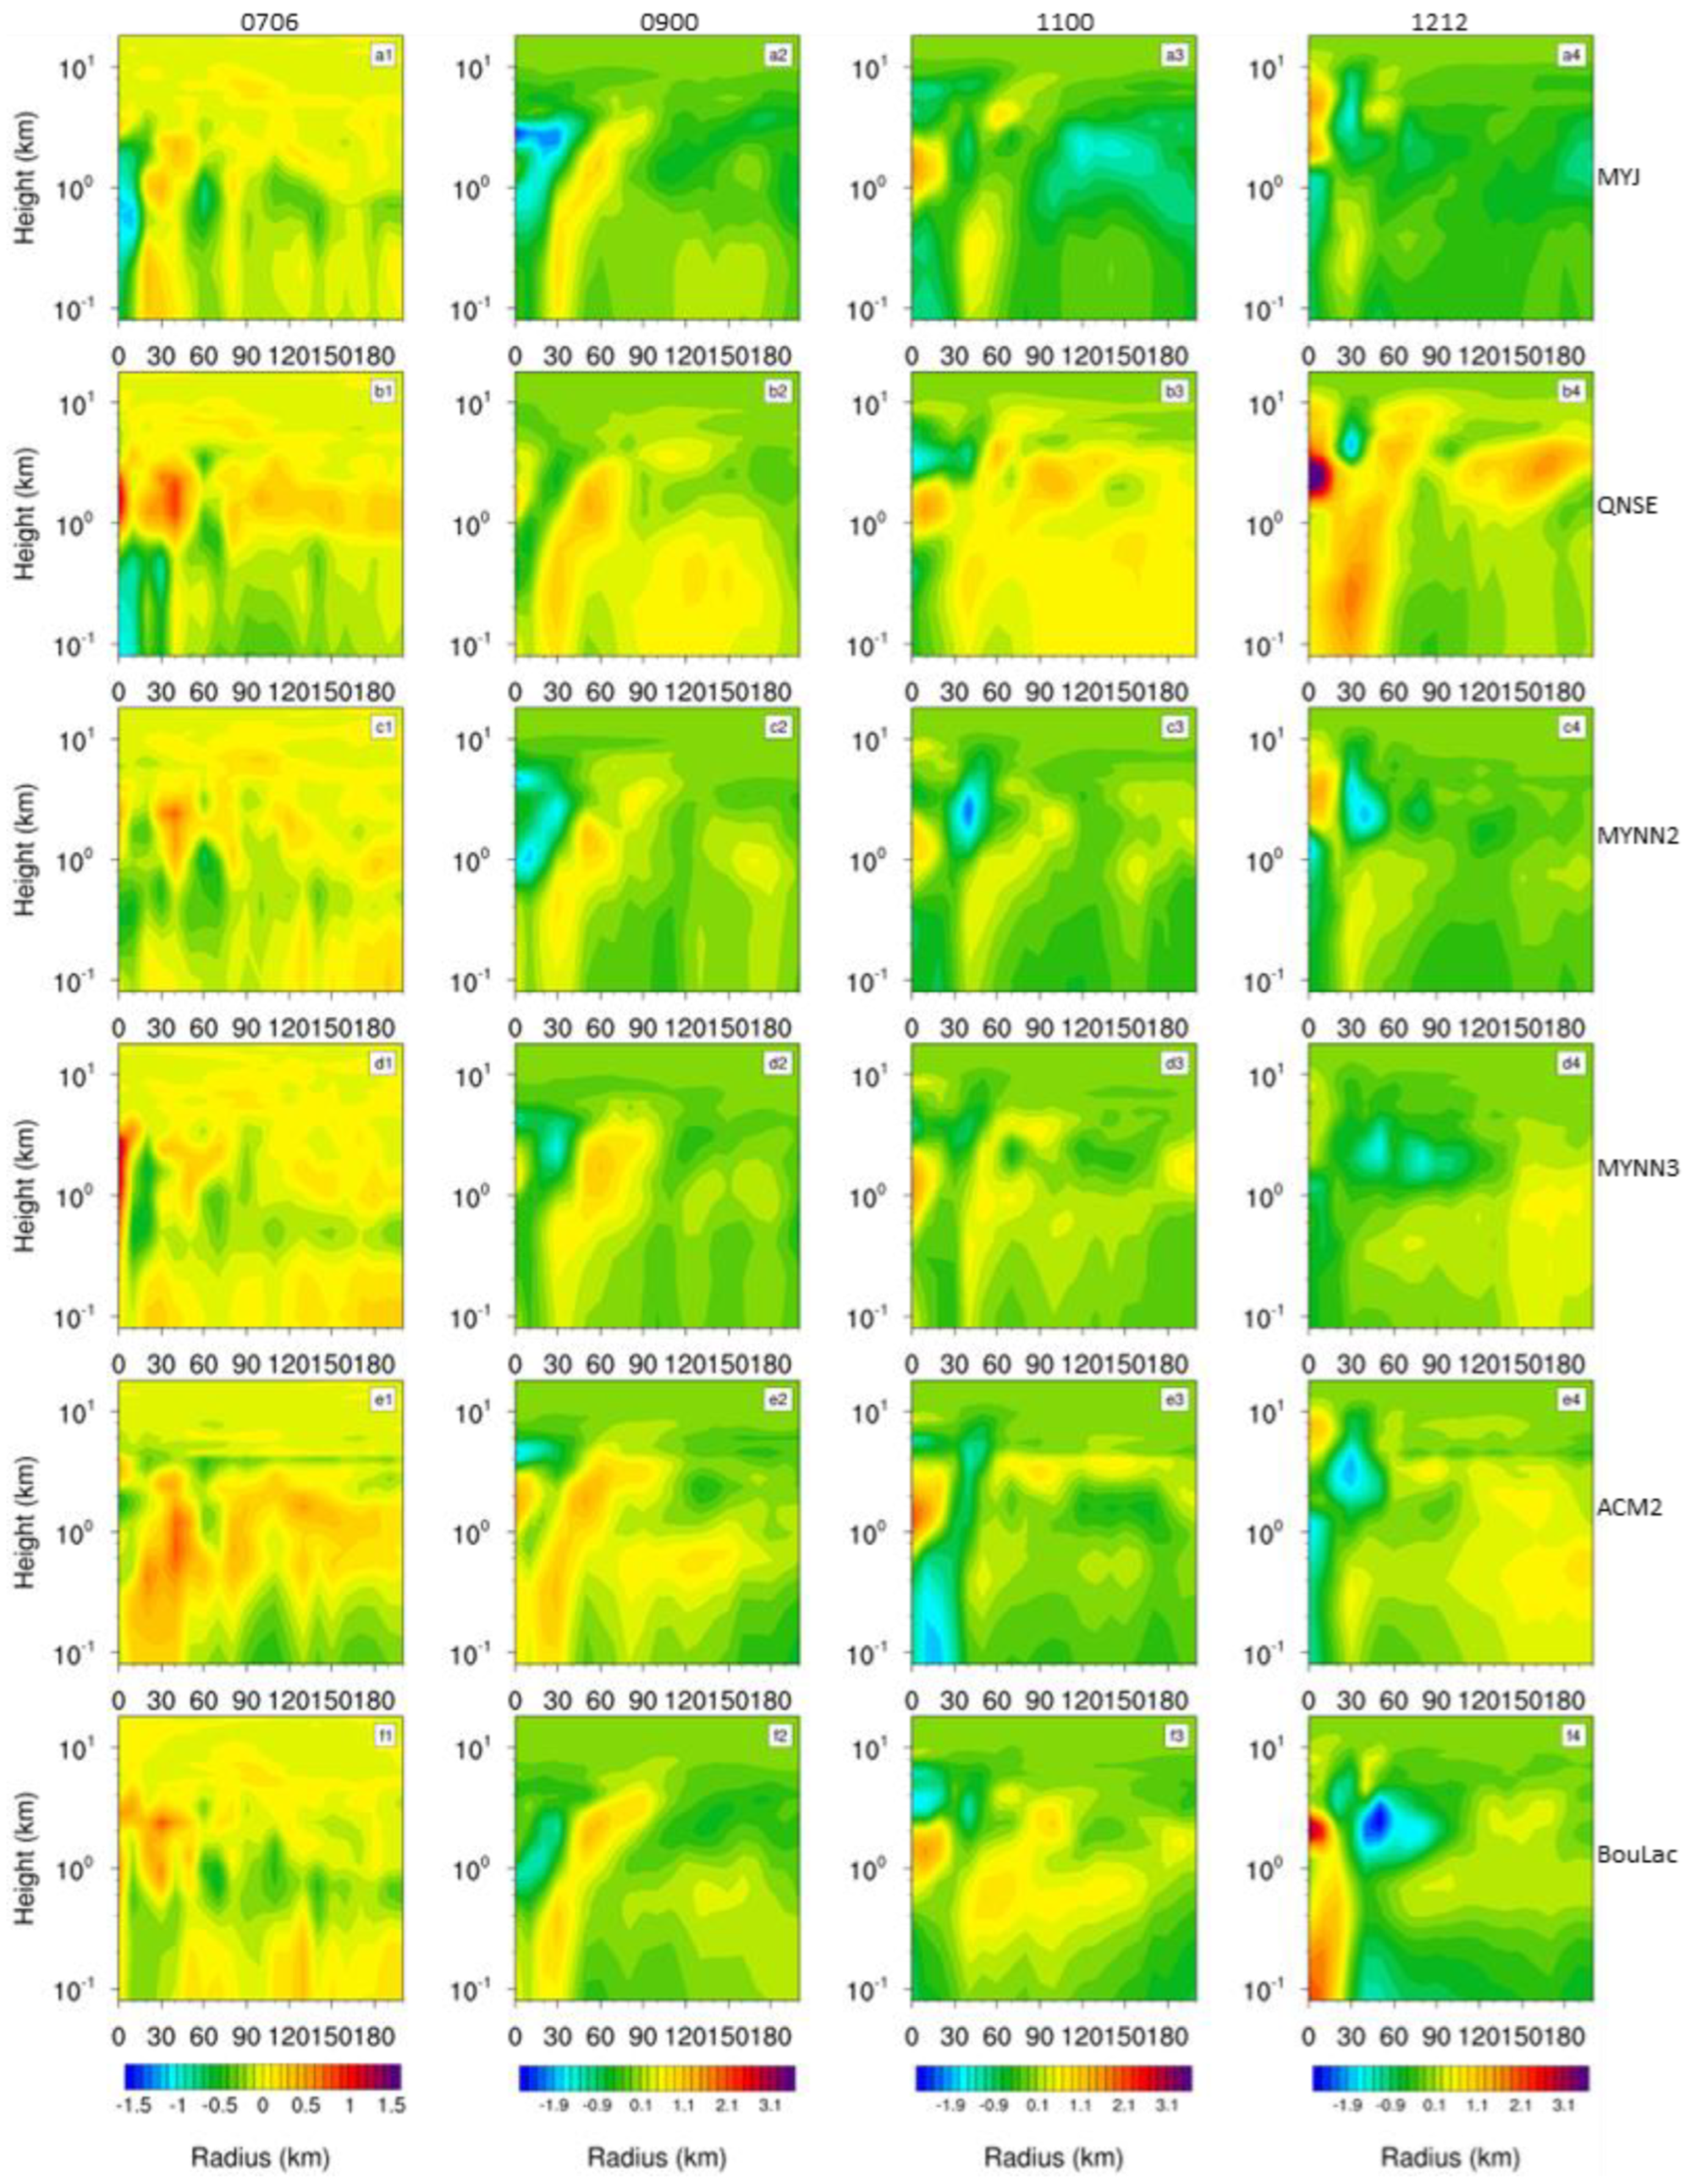
In addition, to better compare and analyze the simulated hydrometeor results, Figure 13 depicted the difference in specific humidity between YSU and other schemes. Corresponding to the water vapor conditions indicated by the equivalent potential temperature of Figure 12, in stage 4 when the TC intensity reached its maximum, BouLac and QNSE showed higher positive values near the TC center compared to other simulation results. This indicates that QNSE, BouLac, and YSU had stronger water vapor conditions near the TC center, which was more conducive to generating greater TC intensity with these three PBL schemes.
Overall, both surface layer parameterization and PBL parameterization affect TC intensification, particularly parameters Cd, Ck, Km, and Kh [64]. Among the seven simulations, YSU, QNSE, and BouLac demonstrate better simulated TC intensification. BouLac and YSU exhibit stronger tangential wind due to smaller turbulent diffusion in the initial period, along with stronger radial inflow within the boundary layer and updrafts around the eye wall. QNSE has a much larger Ck/Cd ratio and surface latent heat (enthalpy) flux. Therefore, YSU, QNSE, and BouLac produce strong radial inflow, updrafts, and warm cores, leading to greater TC intensity. In other words, different PBL parameterizations produce varying turbulent diffusivity and surface flux, which have larger effects on TC intensification to some extent.

4. Summary and Conclusions

In this study, we conducted a series of numerical experiments using the ARW-WRF V4.0 model to investigate the sensitivity of TC intensification simulation to seven widely-used PBL parameterization schemes, including YSU, MYJ, QNSE, MYNN2, MYNN3, ACM2, and BouLac. In our experiments, YSU, MYNN2, MYNN3, ACM2, and BouLac schemes were coupled with the revised MM5 surface layer scheme, while the MYJ scheme used the Eta Similarity surface layer scheme and the QNSE scheme used the QNSE surface layer scheme. We compared the simulated TC track, intensity, and structure with observations and analyzed the simulated surface flux exchange and PBL turbulent diffusion. The major findings are as follows:
All simulations generally reproduced the TC track and intensity compared to the best track. Notably, YSU, QNSE, and BouLac schemes captured the rapid intensification processes, and closely matched the observed TC intensity.
In terms of surface layer parameterization, with the QNSE surface layer scheme, the QNSE PBL scheme produced the largest Ck/Cd ratio among the simulations, which contributed to its stronger TC intensity based on Emanuel’s MPI theory.
In terms of PBL parameterization, among the PBL schemes using the same surface layer, YSU and BouLac exhibited weaker PBL turbulent diffusion with smaller Km and shallower boundary layer mixing height, which led to their stronger TC intensity.
During the intensification period, YSU, QNSE, and BouLac schemes generally exhibited stronger radial inflow within the boundary layer, stronger updrafts around the eye wall, and stronger warm core structures, which led to their stronger TC intensity.
In addition, although MYNN2 and MYNN3 schemes produce similar Km, other PBL schemes have some differences in Km to some degree. In fact, there is no definitive PBL scheme for TC simulations, and future research should focus on it. Overall, different PBL parameterizations produce varying turbulent diffusivity and surface flux, which have larger effects on TC intensification to some extent.
Considering the limited resolution in our study and the complexity of the physical process involved in TC intensification, further research involving simulations and observations is needed in the future.

Author Contributions

Conceptualization, L.Y. and Y.L.; methodology, L.Y.; software, L.Y.; validation, L.Y.; formal analysis, L.Y. and Y.L.; investigation, L.Y. and Y.L.; resources, L.Y.; data curation, L.Y.; writing—original draft preparation, L.Y.; writing—review and editing, L.Y., Y.L. and P.Z.; visualization, L.Y.; supervision, Y.L., P.Z. and Z.G.; project administration, Y.L., Z.G. and Z.Z.; funding acquisition, Y.L. All authors have read and agreed to the published version of the manuscript.

Funding

This study is supported by the National Natural Science Foundation of China (42075072, 41975067), and Doctoral Start-up Fund of Jiangsu Maritime Institute (2024BSKY02).

Institutional Review Board Statement

Not applicable.

Informed Consent Statement

Not applicable.

Data Availability Statement

Data is contained within the article.

Conflicts of Interest

The authors declare no conflicts of interest.

References

  1. Sun, X.; Barros, A.P. High resolution simulation of tropical storm Ivan (2004) in the Southern Appalachians: Role of planetary boundary-layer schemes and cumulus parametrization. Q. J. R. Meteorol. Soc. 2014, 140, 1847–1865. [Google Scholar] [CrossRef]
  2. Chen, S.; Qian, Y.; Peng, S. Effects of various combinations of boundary layer schemes and microphysics schemes on the track forecasts of tropical cyclones over the South China Sea. Nat. Hazards. 2015, 78, 61–74. [Google Scholar] [CrossRef]
  3. Nystrom, R.G.; Chen, X.; Zhang, F.; Davis, C.A. Nonlinear Impacts of Surface Exchange Coefficient Uncertainty on Tropical Cyclone Intensity and Air-Sea Interactions. Geophys. Res. Lett. 2020, 47, e2019GL085783. [Google Scholar] [CrossRef]
  4. Ma, Z.; Fei, J.; Huang, X.; Cheng, X. Sensitivity of the simulated tropical cyclone intensification to the boundary-layer height based on a K-profile boundary-layer parameterization scheme. J. Adv. Model. Earth Syst. 2018, 10, 2912–2932. [Google Scholar] [CrossRef]
  5. Sun, J.; He, H.; Hu, X.; Wang, D.; Gao, C.; Song, J. Numerical Simulations of Typhoon Hagupit (2008) Using WRF. Weather Forecast. 2019, 34, 999–1015. [Google Scholar] [CrossRef]
  6. Wang, H.; Wang, Y. A Numerical Study of Typhoon Megi (2010). Part I: Rapid Intensification. Mon. Weather Rev. 2014, 142, 29–48. [Google Scholar] [CrossRef]
  7. Zhang, J.A.; Rogers, R.F.; Tallapragada, V. Impact of Parameterized Boundary Layer Structure on Tropical Cyclone Rapid Intensification Forecasts in HWRF. Mon. Weather Rev. 2017, 145, 1413–1426. [Google Scholar] [CrossRef]
  8. Fox, K.R.; Judt, F. A Numerical Study on the Extreme Intensification of Hurricane Patricia (2015). Weather Forecast. 2018, 33, 989–999. [Google Scholar] [CrossRef]
  9. Chang, Y.; Yang, S.; Lin, K.; Lien, G.; Wu, C. Impact of Tropical Cyclone Initialization on Its Convection Development and Intensity: A Case Study of Typhoon Megi (2010). J. Atmos. Sci. 2020, 77, 443–464. [Google Scholar] [CrossRef]
  10. Kaplan, J.; Rozoff, C.M.; DeMaria, M.; Sampson, C.R.; Kossin, J.P.; Velden, C.S.; Cione, J.J.; Dunion, J.P.; Knaff, J.A.; Zhang, J.A.; et al. Evaluating environmental impacts on tropical cyclone rapid intensification predictability utilizing statistical models. Weather Forecast. 2015, 30, 1374–1396. [Google Scholar] [CrossRef]
  11. Lee, J.; Wu, C. The Role of Polygonal Eyewalls in Rapid Intensification of Typhoon Megi (2010). J. Atmos. Sci. 2018, 75, 4175–4199. [Google Scholar] [CrossRef]
  12. Kepert, J.D. Choosing a Boundary Layer Parameterization for Tropical Cyclone Modeling. Mon. Weather Rev. 2012, 140, 1427–1445. [Google Scholar] [CrossRef]
  13. Emanuel, K. 100 Years of Progress in Tropical Cyclone Research. Meteorol. Monogr. 2018, 59, 15.1–15.68. [Google Scholar]
  14. Ming, J.; Zhang, J.A. Direct Measurements of Momentum Flux and Dissipative Heating in the Surface Layer of Tropical Cyclones During Landfalls. J. Geophys. Res. 2018, 123, 4926–4938. [Google Scholar] [CrossRef]
  15. Charney, J.G.; Eliassen, A. On the growth of the hurricane depression. J. Atmos. Sci. 1964, 21, 68–75. [Google Scholar] [CrossRef]
  16. Ooyama, K. A dynamical model for the study of tropical cyclone development. Geofis. Int. 1964, 4, 187–198. [Google Scholar] [CrossRef]
  17. Ooyama, K. Conceptual evolution of the theory and modeling of the tropical cyclone. J. Meteorol. Soc. Jpn. 1982, 60, 369–380. [Google Scholar] [CrossRef]
  18. Emanuel, K. Tropical cyclone. Annu. Rev. Earth Planet. Sci. 2003, 31, 75–104. [Google Scholar] [CrossRef]
  19. Montgomery, M.T.; Smith, R.K. Paradigms for tropical cyclone intensification. Aust. Meteorol. Ocean. J. 2014, 64, 37–66. [Google Scholar] [CrossRef]
  20. Zhang, J.A.; Rogers, R.F. Effects of Parameterized Boundary Layer Structure on Hurricane Rapid Intensification in Shear. Mon. Weather Rev. 2019, 147, 853–871. [Google Scholar] [CrossRef]
  21. Zhu, P.; Tyner, B.; Zhang, J.A.; Aligo, E.; Gopalakrishnan, S.; Marks, F.D.; Mehra, A.; Tallapragada, V. Role of eyewall and rainband eddy forcing in tropical cyclone intensification. Atmos. Chem. Phys. 2019, 19, 14289–14310. [Google Scholar] [CrossRef]
  22. Zhu, P.; Hazelton, A.; Zhang, Z.; Marks, F.D.; Tallapragada, V. The role of eyewall turbulent transport in the pathway to intensification of tropical cyclones. J. Geophys. Res. Atmos. 2021, 126, e2021JD034983. [Google Scholar] [CrossRef]
  23. Li, T.H.; Wang, Y. The role of boundary layer dynamics in tropical cyclone intensification. Part I: Sensitivity to surface drag coefficient. J. Meteorol. Soc. Jpn. 2021, 99, 537–554. [Google Scholar] [CrossRef]
  24. Li, T.H.; Wang, Y. The role of boundary layer dynamics in tropical cyclone intensification. Part II: Sensitivity to initial vortex structure. J. Meteorol. Soc. Jpn. 2021, 99, 555–573. [Google Scholar] [CrossRef]
  25. Li, X.; Pu, Z. Sensitivity of Numerical Simulation of Early Rapid Intensification of Hurricane Emily (2005) to Cloud Microphysical and Planetary Boundary Layer Parameterizations. Mon. Weather Rev. 2008, 136, 4819–4838. [Google Scholar] [CrossRef]
  26. Sateesh, M.; Srinivas, C.V.; Raju, P.V. Numerical simulation of tropical cyclone thane: Role of boundary layer and surface drag parameterization schemes. Nat. Hazards. 2017, 89, 1255–1271. [Google Scholar] [CrossRef]
  27. Dong, M.; Ji, C.; Chen, F.; Wang, Y. Numerical Study of Boundary Layer Structure and Rainfall after Landfall of Typhoon Fitow (2013): Sensitivity to Planetary Boundary Layer Parameterization. Adv. Atmos. Sci. 2019, 36, 431–450. [Google Scholar] [CrossRef]
  28. Kumari, K.V.; Sagar, S.K.; Viswanadhapalli, Y.; Dasari, H.P.; Rao, S.V.B. Role of Planetary Boundary Layer Processes in the Simulation of Tropical Cyclones Over the Bay of Bengal. Pure Appl. Geophys. 2019, 176, 951–977. [Google Scholar] [CrossRef]
  29. Nolan, D.S.; Zhang, J.A.; Stern, D.P. Evaluation of planetary boundary layer parameterizations in tropical cyclones by comparison of in situ observations and high-resolution simulations of Hurricane Isabel (2003). Part I: Initialization, maximum winds, and the outer-core boundary layer. Mon. Weather Rev. 2009, 137, 3675–3698. [Google Scholar] [CrossRef]
  30. Nolan, D.S.; Zhang, J.A.; Stern, D.P. Evaluation of planetary boundary layer parameterizations in tropical cyclones by comparison of in situ observations and high-resolution simulations of Hurricane Isabel (2003). Part II: Inner-Core Boundary Layer and Eyewall Structure. Mon. Weather Rev. 2009, 137, 3651–3674. [Google Scholar] [CrossRef]
  31. Coronel, R.; Sawada, M.; Iwasaki, T. Impacts of Surface Drag Coefficient and Planetary Boundary Layer Schemes on the Structure and Energetics of Typhoon Megi (2010) during Intensification. J. Meteorol. Soc. Jpn. 2016, 94, 55–73. [Google Scholar] [CrossRef]
  32. Smith, R.K.; Montgomery, M.T.; Thomsen, G.L. Sensitivity of tropical-cyclone models to the surface drag coefficient in different boundary-layer schemes. Q. J. R. Meteorol. Soc. 2010, 140, 792–804. [Google Scholar] [CrossRef]
  33. Liu, J.; Zhang, F.; Pu, Z. Numerical Simulation of the Rapid Intensification of Hurricane Katrina (2005): Sensitivity to Boundary Layer Parameterization Schemes. Adv. Atmos. Sci. 2017, 34, 482–496. [Google Scholar] [CrossRef]
  34. Wen, X.; Long, X.; Zhang, S.; Li, D. Numerical studies of planetary boundary layer parameterization schemes on Super Typhoon Sanba (2012) during its initial stage. J. Trop. Meteorol. 2018, 24, 288–299. [Google Scholar]
  35. Tang, J.; Zhang, J.A.; Kieu, C.; Marks, F.D. Sensitivity of Hurricane Intensity and Structure to Two Types of Planetary Boundary Layer Parameterization Schemes in Idealized HWRF Simulations. Trop. Cyclone Res. Rev. 2018, 7, 201–211. [Google Scholar]
  36. Zhu, P.; Menelaou, K.; Zhu, Z. Impact of subgrid-scale vertical turbulent mixing on eyewall asymmetric structures and mesovortices of hurricanes. Q. J. R. Meteorol. Soc. 2014, 140, 416–438. [Google Scholar] [CrossRef]
  37. Liu, Q.; Wu, L.; Qin, N.; Li, Y. Storm-scale and fine-scale boundary layer structures of tropical cyclones simulated with the WRF-LES framework. J. Geophys. Res. Atmos. 2021, 126, e2021JD035511. [Google Scholar] [CrossRef]
  38. Kumar, M.; Jonko, A.; Lassman, W.; Mirocha, J.D.; Kosović, B.; Banerjee, T. Impact of momentum perturbation on convective boundary layer turbulence. J. Adv. Model. Earth Syst. 2024, 16, e2023MS003643. [Google Scholar] [CrossRef]
  39. Chen, X.; Bryan, G.H. Role of advection of parameterized turbulence kinetic energy in idealized tropical cyclone simulations. J. Atmos. Sci. 2021, 78, 3559–3574. [Google Scholar] [CrossRef]
  40. Chen, X.; Xue, M.; Zhou, B.; Fang, J.; Zhang, J.A.; Marks, F.D. Effect of scale-aware planetary boundary layer schemes on tropical cyclone intensification and structural changes in the gray zone. Mon. Weather Rev. 2021, 149, 2079–2095. [Google Scholar] [CrossRef]
  41. Chen, X. How do planetary boundary layer schemes perform in hurricane conditions: A comparison with large-eddy simulations. J. Adv. Model. Earth Syst. 2022, 14, e2022MS003088. [Google Scholar] [CrossRef]
  42. Wang, X.; Tan, Z. On the combination of physical parameterization schemes for tropical cyclone track and intensity forecasts in the context of uncertainty. J. Adv. Model. Earth Syst. 2023, 15, e2022MS003381. [Google Scholar] [CrossRef]
  43. He, Y.C.; He, J.Y.; Chen, W.C.; Chan, P.W.; Fu, J.Y.; Li, Q. Insights from Super Typhoon Mangkhut (1822) for wind engineering practices. J. Wind Eng. Ind. Aerodyn. 2020, 203, 104238. [Google Scholar] [CrossRef]
  44. Yang, J.; Li, L.; Zhao, K.; Wang, P.; Wang, D.; Sou, I.M.; Yang, Z.; Hu, J.; Tang, X.; Mok, K.M.; et al. A Comparative Study of Typhoon Hato (2017) and Typhoon Mangkhut (2018)—Their Impacts on Coastal Inundation in Macau. J. Geophys. Res. Oceans. 2019, 124, 9590–9619. [Google Scholar] [CrossRef]
  45. He, Q.; Zhang, K.; Wu, S.; Zhao, Q.; Wang, X.; Shen, Z.; Li, L.; Wan, M.; Liu, X. Real-Time GNSS-Derived PWV for Typhoon Characterizations: A Case Study for Super Typhoon Mangkhut in Hong Kong. Remote Sens. 2020, 12, 104. [Google Scholar] [CrossRef]
  46. Mlawer, E.J.; Taubman, S.J.; Brown, P.D.; Iacono, M.J.; Clough, S.A. Radiative transfer for inhomogeneous atmospheres: RRTM, a validated correlated–k model for the longwave. J. Geophys. Res. 1997, 102, 16663–16682. [Google Scholar] [CrossRef]
  47. Dudhia, J. Numerical study of convection observed during the Winter Monsoon Experiment using a mesoscale two–dimensional model. J. Atmos. Sci. 1989, 46, 3077–3107. [Google Scholar] [CrossRef]
  48. Rogers, E.; Black, T.; Ferrier, B.; Lin, Y.; Parrish, D.; DiMego, G. Changes to the NCEP Meso Eta analysis and forecast system: Increase in resolution, new cloud microphysics, modified precipitation assimilation, and modified 3DVAR analysis. NWS Tech. Proced. Bull. 2001, 488, 15. [Google Scholar]
  49. Tewari, M.; Chen, F.; Wang, W.; Dudhia, J.; LeMone, M.A.; Mitchell, K.; Ek, M.; Gayno, G.; Wegiel, J.; Cuenca, R.H. Implementation and verification of the unified NOAH land surface model in the WRF model. In Proceedings of the 20th Conference on Weather Analysis and Forecasting/16th Conference on Numerical Weather Prediction, Seattle, WA, USA, 12–16 January 2004; pp. 11–15. [Google Scholar]
  50. Kain, J.S. The Kain–Fritsch convective parameterization: An update. J. Appl. Meteorol. 2004, 43, 170–181. [Google Scholar] [CrossRef]
  51. Hong, S.Y.; Noh, Y.; Dudhia, J. A new vertical diffusion package with an explicit treatment of entrainment processes. Mon. Weather Rev. 2006, 134, 2318–2341. [Google Scholar] [CrossRef]
  52. Janjic, Z.I. The Step–Mountain Eta Coordinate Model: Further developments of the convection, viscous sublayer, and turbulence closure schemes. Mon. Weather Rev. 1994, 122, 927–945. [Google Scholar] [CrossRef]
  53. Sukoriansky, S.; Galperin, B.; Perov, V. Application of a new spectral model of stratified turbulence to the atmospheric boundary layer over sea ice. Bound.-Layer. Meteorol. 2005, 117, 231–257. [Google Scholar] [CrossRef]
  54. Nakanishi, M.; Niino, H. An improved Mellor–Yamada level 3 model: Its numerical stability and application to a regional prediction of advecting fog. Bound.-Layer. Meteorol. 2006, 119, 397–407. [Google Scholar] [CrossRef]
  55. Nakanishi, M.; Niino, H. Development of an improved turbulence closure model for the atmospheric boundary layer. J. Meteorol. Soc. Jpn. 2009, 87, 895–912. [Google Scholar] [CrossRef]
  56. Pleim, J.E. A Combined Local and Nonlocal Closure Model for the Atmospheric Boundary Layer. Part I: Model Description and Testing. J. Appl. Meteorol. Climatol. 2007, 46, 1383–1395. [Google Scholar] [CrossRef]
  57. Bougeault, P.; Lacarrere, P. Parameterization of Orography–Induced Turbulence in a Mesobeta-Scale Model. Mon. Weather Rev. 1989, 117, 1872–1890. [Google Scholar] [CrossRef]
  58. Cohen, A.E.; Cavallo, S.M.; Coniglio, M.C.; Brooks, H. A review of planetary boundary layer parameterization schemes and their sensitivity in simulating a Southeast U.S. cold season severe weather environment. Weather Forecast. 2015, 30, 591–612. [Google Scholar] [CrossRef]
  59. Stull, R.B. An Introduction to Boundary Layer Meteorology; Kluwer Academic: Boston, MA, USA, 1988; p. 666. [Google Scholar]
  60. Stensrud, D.J. Parameterization Schemes: Keys to Understanding Numerical Weather Prediction Models; Cambridge University Press: Cambridge, UK, 2007; p. 459. [Google Scholar]
  61. Hariprasad, K.B.R.R.; Srinivas, C.V.; Singh, A.B.; Rao, S.V.B.; Baskaran, R.; Venkatraman, B. Numerical simulation and intercomparison of boundary layer structure with different PBL schemes in WRF using experimental observations at a tropical site. Atmos. Res. 2014, 145–146, 27–44. [Google Scholar] [CrossRef]
  62. Bian, G.F.; Nie, G.Z.; Qiu, X. How well is outer tropical cyclone size represented in the era5 reanalysis dataset? Atmos. Res. 2021, 249, 105339. [Google Scholar] [CrossRef]
  63. Nellipudi, N.R.; Yesubabu, V.; Srinivas, C.V.; Vissa, N.K.; Sabique, L. Impact of surface roughness parameterizations on tropical cyclone simulations over the Bay of Bengal using WRF-OML model. Atmos. Res. 2021, 262, 105779. [Google Scholar] [CrossRef]
  64. Gopalakrishnan, S.G.; Marks, F.; Zhang, J.A.; Zhang, X.; Bao, J.W.; Tallapragada, V. A study of the impacts of vertical diffusion on the structure and intensity of the tropical cyclones using the high-resolution HWRF system. J. Atmos. Sci. 2013, 70, 524–541. [Google Scholar] [CrossRef]
  65. Charnock, H. Wind stress on a water surface. Q. J. R. Meteorol. Soc. 1955, 81, 639–640. [Google Scholar] [CrossRef]
  66. Edson, J.B.; Jampana, V.; Weller, R.A.; Bigorre, S.P.; Plueddemann, A.J.; Fairall, C.W.; Hersbach, H. On the exchange of momentum over the open ocean. J. Phys. Oceanogr. 2013, 43, 1589–1610. [Google Scholar] [CrossRef]
  67. Emanuel, K. An air-sea interaction theory for tropical cyclones. Part I: Steady-state maintenance. J. Atmos. Sci. 1986, 43, 585–604. [Google Scholar] [CrossRef]
  68. Emanuel, K. Sensitivity of tropical cyclones to surface exchange coefficients and a revised steady-state model incorporating eye dynamics. J. Atmos. Sci. 1995, 52, 3969–3976. [Google Scholar] [CrossRef]
  69. Large, W.G.; Pond, S. Open Ocean momentum flux measurements in moderate to strong winds. J. Phys. Oceanogr. 1981, 11, 324–336. [Google Scholar] [CrossRef]
  70. Powell, M.D.; Vickery, P.J.; Reinhold, T. Reduced drag coefficient for high wind speeds in tropical cyclones. Nature 2003, 422, 279–283. [Google Scholar] [CrossRef] [PubMed]
  71. Donelan, M.A.; Haus, B.K.; Reul, N.; Plant, W.J.; Stiassnie, M.; Graber, H.C.; Brown, O.B.; Saltzman, E.S. On the limiting aerodynamic roughness of the ocean in very strong winds. Geophys. Res. Lett. 2004, 31, L18306. [Google Scholar] [CrossRef]
  72. Black, P.G.; D’Asaro, E.A.; Drennan, W.M.; French, J.R.; Niiler, P.P.; Sanford, T.B.; Terrill, E.J.; Walsh, E.J.; Zhang, J.A. Air–sea exchange in hurricanes: Synthesis of observations from the Coupled Boundary Layer Air–Sea Transfer experiment. Bull. Am. Meteorol. Soc. 2007, 88, 357–374. [Google Scholar] [CrossRef]
  73. Zhang, J.A.; Black, P.G.; French, J.R.; Drennan, W.M. First direct measurements of enthalpy flux in the hurricane boundary layer: The CBLAST results. Geophys. Res. Lett. 2008, 35, L14813. [Google Scholar] [CrossRef]
  74. Haus, B.K.; Jeong, D.; Donelan, M.A.; Zhang, J.A.; Savelyev, I. Relative rates of sea-air heat transfer and frictional drag in very high winds. Geophys. Res. Lett. 2010, 37, L07802. [Google Scholar] [CrossRef]
  75. Bell, M.M.; Montgomery, M.T.; Emanuel, K.A. Air–sea enthalpy and momentum exchange at major hurricane wind speeds observed during CBLAST. J. Atmos. Sci. 2012, 69, 3197–3222. [Google Scholar] [CrossRef]
  76. Richter, D.H.; Bohac, R.; Stern, D.P. An Assessment of the Flux Profile Method for Determining Air-Sea Momentum and Enthalpy Fluxes from Dropsonde Data in Tropical Cyclones. J. Atmos. Sci. 2016, 73, 2665–2682. [Google Scholar] [CrossRef]
  77. Smith, R.K.; Thomsen, G.L. Dependence of tropical-cyclone intensification on the boundary-layer representation in a numerical model. Q. J. R. Meteorol. Soc. 2014, 136, 1671–1685. [Google Scholar] [CrossRef]
  78. Hong, S.Y.; Pan, H.L. Nonlocal boundary layer vertical diffusion in a Medium-Range Forecast model. Mon. Weather Rev. 1996, 124, 2322–2339. [Google Scholar] [CrossRef]
  79. Zhang, J.A.; Nolan, D.S.; Rogers, R.F.; Tallapragada, V. Evaluating the Impact of Improvements in the Boundary Layer Parameterization on Hurricane Intensity and Structure Forecasts in HWRF. Mon. Weather Rev. 2015, 143, 3136–3155. [Google Scholar] [CrossRef]
  80. Zhang, J.A.; Marks, F.D.; Montgomery, M.T.; Lorsolo, S. An estimation of turbulent characteristics in the low-level region of intense Hurricanes Allen (1980) and Hugo (1989). Mon. Weather Rev. 2011, 139, 1447–1462. [Google Scholar] [CrossRef]
  81. Li, Y.; Tam, C.Y.; Huang, W.R.; Cheung, K.K.W.; Gao, Z. Evaluating the impacts of cumulus, land surface and ocean surface schemes on summertime rainfall simulations over East-to-southeast Asia and the western north Pacific by RegCM4. Clim. Dyn. 2016, 46, 2487–2505. [Google Scholar] [CrossRef]
  82. Wang, R.; Zhu, Y.; Qiao, F.; Liang, X.Z.; Zhang, H.; Ding, Y. High-resolution simulation of an extreme heavy rainfall event in Shanghai using the Weather Research and Forecasting model: Sensitivity to planetary boundary layer parameterization. Adv. Atmos. Sci. 2021, 38, 98–115. [Google Scholar] [CrossRef]
  83. Shen, W.; Lu, Z.; Ye, G.; Zhang, Y.; Chen, S.; Xu, J. Exploring the Impact of Planetary Boundary Layer Schemes on Rainfall Forecasts for Typhoon Mujigae, 2015. Atmosphere 2022, 13, 220. [Google Scholar] [CrossRef]
  84. Rajeswari, J.R.; Srinivas, C.V.; Mohan, P.R.; Venkatraman, B. Impact of Boundary Layer Physics on Tropical Cyclone Simulations in the Bay of Bengal Using the WRF Model. Pure Appl. Geophys. 2020, 177, 5523–5550. [Google Scholar] [CrossRef]
  85. Zhang, F.; Pu, Z.; Wang, C. Effects of Boundary Layer Vertical Mixing on the Evolution of Hurricanes over Land. Mon. Weather Rev. 2017, 145, 2343–2361. [Google Scholar] [CrossRef]
  86. Zhang, F.; Pu, Z. Effects of Vertical Eddy Diffusivity Parameterization on the Evolution of Landfalling Hurricanes. J. Atmos. Sci. 2017, 74, 1879–1905. [Google Scholar] [CrossRef]
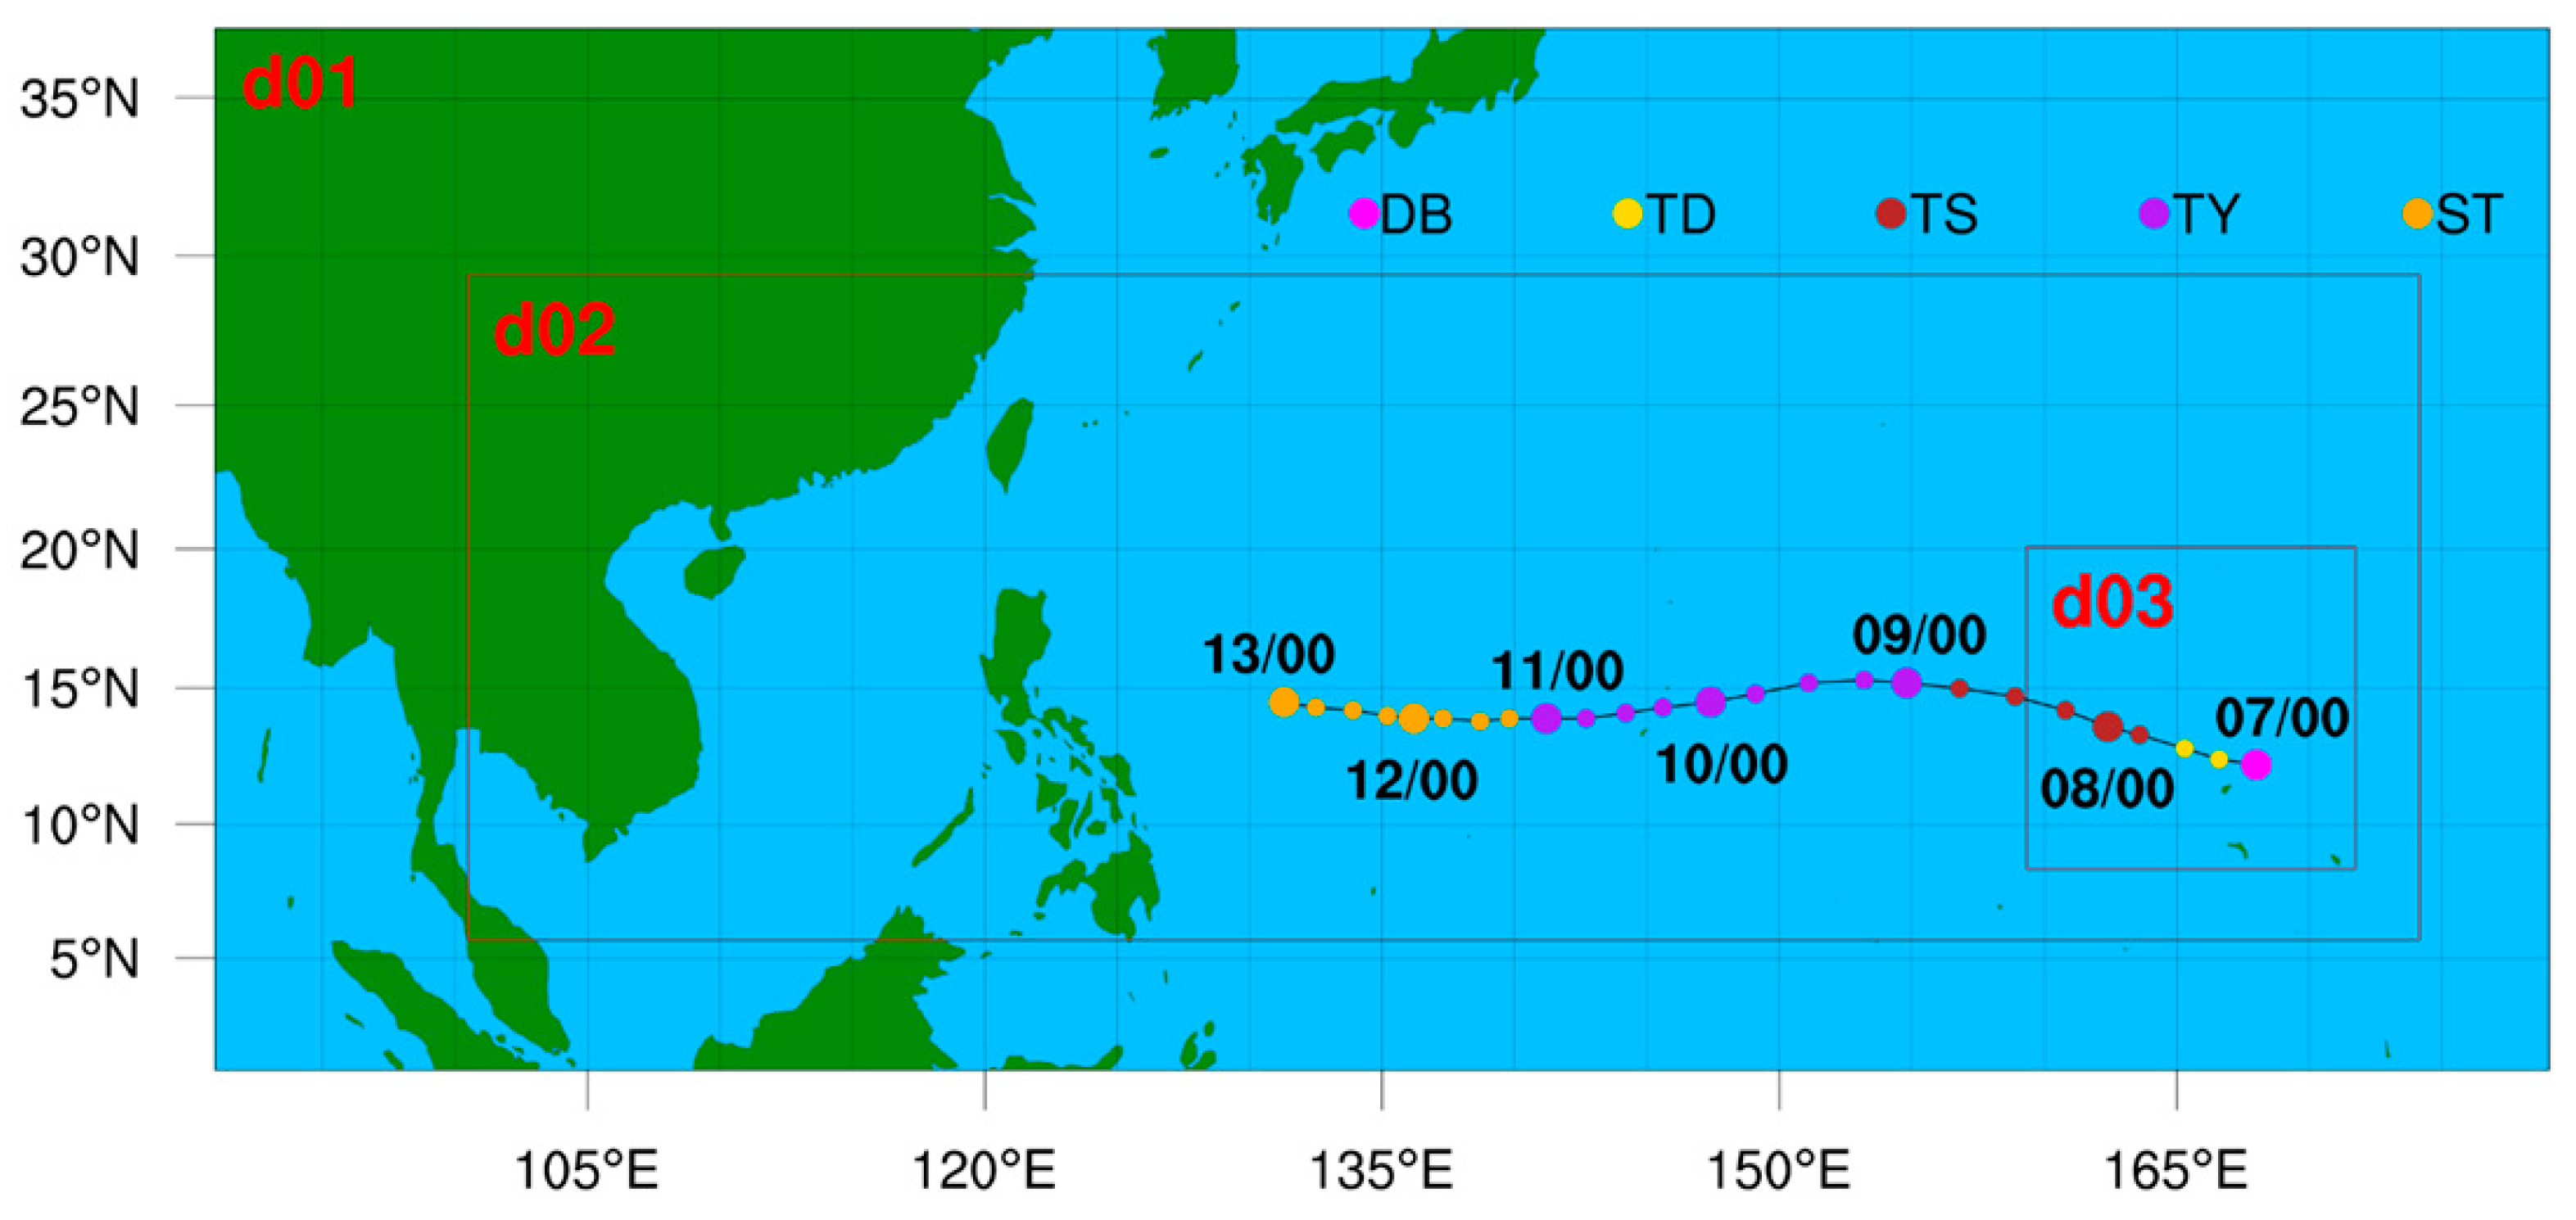
Figure 1. Model domain configuration and the best track of Mangkhut from JTWC during 0000 UTC 7th to 0000 UTC 13 September 2018. Colored dots indicate the 6 hourly TC track, and colors indicate the categories of TC intensity (DB: disturbance; TD: tropical depression; TS: tropical storm; TY: typhoon; ST: super typhoon). And d01, d02, and d03 represent the domain 01, 02, and 03, respectively.
Atmosphere 15 01182 g001
Figure 2. (a) TC track, (b) time series of track error (unit: km), (c) minimum central sea level pressure (MSLP) (unit: hPa), and (d) maximum sustained wind speed (VMAX) (unit: m s−1) from the JTWC best track data, ERA5 reanalysis data, and the numerical simulations from 0600 UTC 7th to 0000 UTC 13 September 2018.
Atmosphere 15 01182 g002
Figure 3. Time series of area-averaged (a) surface enthalpy flux (unit: W m−2) and (b) surface momentum flux (unit: kg m−1 s−2) from TC center to 200 km radius from 0600 UTC 7th to 0000 UTC 13 September 2018.
Atmosphere 15 01182 g003
Figure 5. The variation of surface exchange coefficient ratio (ratio of Ck/Cd) with 10 m wind speed at 1200 UTC 12 September 2018 from different numerical simulations.
Atmosphere 15 01182 g005
Figure 6. Height–radius distribution of azimuthally averaged turbulent diffusivity for momentum (unit: m2 s−1) from (a1a4) YSU, (b1b4) MYJ, (c1c4) QNSE, (d1d4) MYNN2, (e1e4) MYNN3, (f1f4) ACM2, and (g1g4) BouLac, at (a1g1) 0600 UTC 7th, (a2g2) 0000 UTC 9th, (a3g3) 0000 UTC 11th, and (a4g4) 1200 UTC 12 September 2018.
Atmosphere 15 01182 g006
Figure 7. Height–radius distribution of azimuthally averaged turbulent diffusivity for momentum (unit: m2 s−1) from (a1a4) YSU, (b1b4) MYJ, (c1c4) QNSE, (d1d4) MYNN2, (e1e4) MYNN3, (f1f4) ACM2, and (g1g4) BouLac, at (a1g1) 0300 UTC 7th, (a2g2) 0400 UTC 7th, (a3g3) 0500 UTC 7th, and (a4g4) 0600 UTC 7 September 2018.
Atmosphere 15 01182 g007
Figure 8. Comparison of turbulent diffusivity for momentum (Km) between numerical simulations and observations at 0600 UTC 7th (in red), 0000 UTC 9th (in green), 0000 UTC 11th (in yellow), and 1200 UTC 12th (in blue) September 2018. In (ag), OBS (in black) represents observations from Zhang et al. [80], which are based on in situ data at 450 m altitude.
Atmosphere 15 01182 g008
Figure 9. Height–radius distribution of azimuthally averaged tangential wind (unit: m s−1) from (a1a4) ERA5, (b1b4) YSU, (c1c4) MYJ, (d1d4) QNSE, (e1e4) MYNN2, (f1f4) MYNN3, (g1g4) ACM2, and (h1h4) BouLac at (a1h1) 0600 UTC 7th, (a2h2) 0000 UTC 9th, (a3h3) 0000 UTC 11th, and (a4h4) 1200 UTC 12 September 2018.
Atmosphere 15 01182 g009
Figure 10. As in Figure 9 but for radial wind (unit: m s−1), with (a1a4) ERA5, (b1b4) YSU, (c1c4) MYJ, (d1d4) QNSE, (e1e4) MYNN2, (f1f4) MYNN3, (g1g4) ACM2, and (h1h4) BouLac at (a1h1) 0600 UTC 7th, (a2h2) 0000 UTC 9th, (a3h3) 0000 UTC 11th, and (a4h4) 1200 UTC 12 September 2018.
Atmosphere 15 01182 g010
Figure 11. As in Figure 9 but for upward vertical wind (unit: m s−1), with (a1a4) ERA5, (b1b4) YSU, (c1c4) MYJ, (d1d4) QNSE, (e1e4) MYNN2, (f1f4) MYNN3, (g1g4) ACM2, and (h1h4) BouLac at (a1h1) 0600 UTC 7th, (a2h2) 0000 UTC 9th, (a3h3) 0000 UTC 11th, and (a4h4) 1200 UTC 12 September 2018.
Atmosphere 15 01182 g011
Figure 12. Height–radius distribution of azimuthally averaged equivalent potential temperature (unit: K) from (a1a4) YSU, (b1b4) MYJ, (c1c4) QNSE, (d1d4) MYNN2, (e1e4) MYNN3, (f1f4) ACM2, and (g1g4) BouLac, at (a1g1) 0000 UTC 11th, (a2g2) 1200 UTC 11th, (a3g3) 0000 UTC 12th, and (a4g4) 1200 UTC 12 September 2018.
Atmosphere 15 01182 g012
Figure 13. Height–radius distribution of azimuthally averaged specific humidity difference (unit: g kg−1) between YSU and (a) MYJ, (b) QNSE, (c) MYNN2.5, (d) MYNN3, (e) ACM2, and (f) BouLac at (1) 0600 UTC 7, (2) 0000 UTC 9, (3) 0000 UTC 11, and (4) 1200 UTC 12, September 2018.
Atmosphere 15 01182 g013
Table 1. Summary of the PBL schemes evaluated in this study.
PBL SchemeOrder of ClosureLocal/NonlocalDry/Moist
YSUFirst-orderNonlocalDry
MYJ1.5-order (Mellor and Yamada, turbulent model level-2.5 approximation)LocalDry
QNSE1.5-order (Mellor and Yamada, turbulent model level-2.5 approximation)LocalDry
MYNN21.5-order (Mellor and Yamada, turbulent model level-3.0 approximation)LocalMoist
MYNN31.5-order (Mellor and Yamada, turbulent model level-3.0 approximation, but also includes the local changes of second-order turbulent moments)LocalMoist
ACM2First-orderHybrid local–nonlocalDry
BouLac1.5-order (Mellor and Yamada, turbulent model level-2.5 approximation)LocalDry
Disclaimer/Publisher’s Note: The statements, opinions and data contained in all publications are solely those of the individual author(s) and contributor(s) and not of MDPI and/or the editor(s). MDPI and/or the editor(s) disclaim responsibility for any injury to people or property resulting from any ideas, methods, instructions or products referred to in the content.