Abstract
This work concerns the Taylor formula for the turbulence kinetic energy dissipation rate in the stable atmospheric boundary layer. The formula relates the turbulence kinetic energy dissipation rate to statistics at large scales, namely, the turbulence kinetic energy and the integral length scale. In parameterization schemes for atmospheric turbulence, it is usually assumed that the dissipation coefficient in the Taylor formula is constant. However, a series of recent theoretical works and laboratory experiments showed that depends on the local Reynolds number. We calculate turbulence statistics, including the dissipation rate, the standard deviation of fluctuating velocities and integral length scales, using observational data from the MOSAiC (Multidisciplinary drifting Observatory for the Study of Arctic Climate) expedition. We show that the dissipation coefficient varies considerably and is a function of the Reynolds number, however, the functional form of this dependency in the stably stratified atmospheric boundary layer is different than in previous studies.
1. Introduction
The prediction of the turbulence kinetic energy dissipation rate is a key element in parameterization schemes for turbulence in the atmospheric boundary layer (ABL). The dissipation rate determines how fast the energy produced due to shear and positive buoyancy is transformed into heat at the smallest scales. These scales are on the order of millimeters in atmospheric turbulence and are difficult to measure directly. Hence, indirect methods based on the Kolmogorov assumption of equilibrium are used to estimate . One of them is the Taylor formula [1], the cornerstone assumption of turbulence theory, which relates the small-scale process of dissipation to statistics at large scales, namely, the characteristic velocity scale of turbulent eddies, defined as , where k is the turbulence kinetic energy, and the integral length scale :
where is the dissipation coefficient. Typically, the main focus of ABL dissipation models is on finding the appropriate expression for the length scale (cf. Ref. [2] for a review). When close enough to the surface, can be related to the height z and to the Obukhov length [3]. At higher altitudes, is approximated with the use of the ratio of the geostrophic velocity and the Coriolis parameter [4], or the “center of mass” of the vertical profile of the turbulence kinetic energy [5].
In the context of atmospheric turbulence, much less attention has been paid to determining the value of the dissipation constant in Equation (1). Until recently, it was commonly assumed that the dissipation coefficient is constant. However, a series of recent laboratory experiments and theoretical works [6,7,8,9,10,11,12,13] showed that, under certain conditions, becomes a function of the Reynolds number:
where is a scaling coefficient, the Reynolds number is defined as , is the kinematic viscosity, and
is the Taylor microscale. Relation (2) was tested in laboratory experiments for various canonical flows. For example, it was shown by Goto and Vassilicos [9] that, in the early stages of turbulence decay, the coefficient 1. The same scaling was observed in a region of the axisymmetric wakes and was followed by subregions of 0.77 and 0.5 further downstream, cf. [8]. In Ref. [12], energy dissipation scaling in uniformly sheared turbulence was considered. Therein, it was found that the scaling coefficient 0.6 for a low Reynolds number and that the scaling was reversed to for a higher and finally became close to zero as further increased.
A non-constant in the ABL was reported in Ref. [14] based on in situ measurements taken by instruments mounted on a helicopter platform. Turbulent boundary layer flows were investigated in the laboratory in [13,15]. Therein, a region with 1 was found, and a small subregion with could be identified at larger . Finally, became close to zero. In yet another work [16], the dependence of on turbulence anisotropy was studied.
The above works are of particular importance for the present study, which focuses on the stable atmospheric boundary layer. Such layers form mostly overnight due to surface radiative cooling, and they also prevail in the snow-covered polar regions. Under stable stratification, the air near the surface is cooler than the air above it, inhibiting vertical mixing. Turbulence within the stably stratified boundary layer is produced by shear; however, due to the negative buoyancy flux, turbulent motions can be locally suppressed or significantly reduced [17]. The characteristic features of the stably stratified ABL are intermittency, non-stationarity and the presence of gravity wave motions [18,19]. These additional complexities make turbulence parameterization challenging.
In this work, we determined the dissipation rate, the variances of all three components of velocity and the corresponding integral length scales using observational data from the MOSAiC (Multidisciplinary drifting Observatory for the Study of Arctic Climate) expedition, available in an open database [20]. We calculated the dissipation rate coefficient in Equation (1) and studied its dependence on the Reynolds number under varying conditions and on the stratification.
This paper is structured as follows. Section 2 presents the theory of the equilibrium energy cascade and addresses deviations from equilibrium, which result in the non-constancy of the parameter. The data and methods used in this study are described in Section 3. Section 4 presents the results, followed by the discussion in Section 5.
2. Theory
The turbulence kinetic energy dissipation rate is defined as
where
denotes the i-th component of the fluctuating velocity vector, and is the ensemble average operator. The energy dissipation rate is the sink term in the budget equation for the mean turbulence kinetic energy:
and its proper representation is key to predicting k and to computing the eddy viscosity used in many weather and climate models [21]. The direct calculation of from Equation (4) is possible only if high-frequency time series, which resolve turbulence down to the smallest eddies, are available. This is usually not the case in atmospheric measurements. As an example, the MOSAiC time series used in this study have a resolution of Hz. If the mean wind speed equals m/s, eddies of size m or larger can be measured by the sensors. This is still two orders of magnitude larger than the smallest turbulence structures, which are of millimeter size.
2.1. Equilibrium Scaling
If the direct calculation of from its definition is not possible, indirect methods based on the Kolmogorov hypotheses are used. According to the second hypothesis, under the assumption of local isotropy, there exists an inertial range of scales where statistics are not affected by viscosity and are uniquely determined by [22]. As a consequence, the turbulence kinetic energy spectrum reads
where is the Kolmogorov constant and is the wavenumber. When analyzing time series of single components of velocity, it is more convenient to consider the one-dimensional spectra of the velocity components. Under the assumption of isotropy, they read
where and denote the one-dimensional spectra of the longitudinal (i.e., along the mean flow direction) and transverse (i.e., perpendicular to the mean flow direction) velocity components. The constants and . Here, a note of caution is needed, as the Kolmogorov assumptions might be violated even at small scales [16]. In spite of this, relation (7) still remains the basis of data analyses in atmospheric turbulence.
Equation (7) holds only at scales much smaller than the characteristic length scale of large eddies and much larger than the size of the smallest viscosity-affected vortices. In typical ABL turbulence parameterization schemes, the resolution is not sufficient for the direct use of Equation (8). In this case, an assumption of the Richardson–Kolmogorov equilibrium cascade is used. In this classical picture, the energy supplied at the largest scales by mechanisms of turbulence generation, such as shear and positive buoyancy, is transferred in the scale space toward the smallest structures and dissipated as heat. As a consequence, is directly related to statistics at the largest scales, i.e., the characteristic velocity scale and the integral length scale , through Equation (1). In homogeneous and isotropic turbulence, these scales are defined as
where
is the two-point correlation coefficient, is the fluctuation of the longitudinal velocity component, x denotes the direction of the mean flow and r is the distance between points. The standard deviation .
The statistics , k (kinetic energy) and can also be determined from the turbulence kinetic energy spectrum as follows [11]:
It can be assumed that for high-Reynolds-number flows, this spectrum takes the form of (7) between wavenumbers and , where and is zero otherwise. Here, denotes the wavenumber corresponding to the smallest dissipative eddies, and corresponds to large eddies [22]. Under such assumptions and using the definitions in (11), k, and equal [11]
where , and are neglected. The second formula in (12) provides the relation for , that is, . After substituting it into the first equation in (12), we obtain
which is the Taylor law in Equation (1), with the proportionality constant . This shows that is directly related to the inertial subrange, and hence, Equation (1) establishes a connection between energy-containing and inertial subrange eddies. An analogous relation can be derived, in the Lagrangian framework, between and the Kolmogorov constant of the Lagrangian structure function [23]. The third relation in (12) provides the formula for .
Equation (1) is commonly used in turbulence parameterization schemes in the ABL. However, while the turbulence kinetic energy k is available from the solution of the system of equations, the two-point correlation coefficient is unknown, and either an algebraic formula for the length scale must be provided or a diagnostic equation for should be solved. Close to the surface and in near-neutral conditions, is a natural choice, where is the von Kármán constant. In place of Equation (1), Mellor and Yamada [5] used
where , and B is a constant. Different values of B have been reported in the literature; e.g., was found in [5], and the value was used in Ref. [24]. It follows from (1) and (14) that the integral length scale
In Refs. [21,25], alternative parameterization based on the vertical velocity component w was used:
where and .
Further away from the surface, the characteristic length scale is believed to level off; hence, e.g., Mellor and Yamada [26] proposed a formula with the “center of mass” of the velocity variance profile
In stratified flows, stability affects the length scale and should be taken into account in turbulence models. Parameterizations based on the Obukhov length [3] were considered in Refs. [24,25,27]:
where was estimated in Ref. [24], , and the Obukhov length is defined as
where and denote the fluctuations of the vertical velocity and potential temperature, respectively, g is the gravitational acceleration and is the reference temperature. In near-neutral conditions, is small and is proportional to . On the other hand, in the case of strong stratification (large ), the limit value is obtained. Alternative parameterization of the length scale based on the Richardson number was proposed in Ref. [28] and considered in [29].
In order to verify the validity of the parameterization schemes using atmospheric data, typically, the kinetic energy or vertical velocity variance is calculated from the time series, and is estimated from Equation (8). Next, Equation (14) or (16) is tested with different definitions of the length scale l.
2.2. Non-Equilibrium Scaling
The assumptions behind Equation (1) are true only in fully developed, stationary and homogeneous turbulence. These criteria are not satisfied in the ABL, where the conditions may change abruptly due to changes in forcing, particularly in the stable ABL, where turbulence may locally vanish due to stratification. In this case, transiency effects become important and should be included in the parameterization schemes [30].
If turbulence is non-stationary, the dissipation coefficients and B vary and become dependent on the local Reynolds number and the initial conditions or the global Reynolds number; see Refs. [7,9,11]. This dependence can be linked to the deviations from the Kolmogorov scaling (7). For the case of decaying turbulence, Yoshizawa [31] proposed decomposing the spectra into a Kolmogorov equilibrium part (7), further denoted by , and the non-equilibrium correction . This idea was further elaborated in Ref. [11], where the following form of the energy spectrum in isotropic, decaying turbulence was considered:
The non-equilibrium correction scales as , and the energy spectrum is affected by the non-equilibrium correction mainly at large scales, because decreases to zero faster than for large . At smaller scales, classical Kolmogorov equilibrium is still observed. As a result of the non-equilibrium correction, is no longer constant but becomes a function of the local Reynolds number and the initial conditions; see the discussion in Ref. [11].
As far as the anisotropic, near-surface flows are concerned, it was shown in Ref. [32] that, also in this case, the dissipation coefficient varies in time and is inversely proportional to the local Reynolds number at small . In the turbulent boundary layer considered in Ref. [13], varied in the streamwise direction. The authors of Ref. [13] concluded that depends on the conditions under which the dominant structures of a flow evolve. Subregions of different coefficients in Equation (2) were found in Ref. [13].
It follows directly from Equations (1) and (2) that the ratio of the Taylor to the integral length scale reads
Hence, the presence of non-equilibrium scaling can be detected by investigating the dependence of both and on ; see also [14]. To the best of the authors’ knowledge, the dependence of dissipation coefficients, in Equation (1) and B in Equation (14) or (16), on the Reynolds number in the stable ABL has not been considered so far. Hence, this problem is the focus of our study.
2.3. Dependence of on
In stationary near-wall turbulence under neutral conditions, the shear production is, to the leading order, balanced by the dissipation . Using the eddy-viscosity hypothesis, the production can be expressed as , where is the vertical gradient of velocity and . This balance, together with Equation (1), implies
If the shear and remain constant, the velocity scale becomes proportional to the length scale :
Equation (23) is expected to hold in equilibrium, neutral turbulence close to the surface. As the second limiting case, one can consider decaying turbulence, where
The common k– turbulence models predict that, while k decreases with time, the integral length scale increases [33]; hence, in this case,
where the coefficient . In non-equilibrium decaying turbulence, the length scale may initially decrease with time and next start to increase [33]. Such tendencies were also observed in atmospheric turbulence during the decay of the convective layer [34]. Generally, the non-constancy of the coefficient will indicate changes in the leading-order balances in the kinetic energy equation. We can expect that will tend toward unity in the stationary case.
3. Data and Methods
3.1. MOSAiC Observations
The MOSAiC expedition was conducted between October 2019 and October 2020 by an international team, which involved more than 80 institutions from 20 countries [35]. Continuous observations of the surface energy budget and meteorology were performed on and around the icebreaker RV Polarstern. The icebreaker entered the Siberian sector of the Arctic in late summer 2019 under thin sea ice conditions and drifted with the natural ice drift across the polar cap toward the Atlantic during winter, reaching 88°36′ North.
A large set of measurement data was collected during the expedition by monitoring stations. This includes high-frequency observations of wind velocity and temperature at a sampling rate of 10 Hz, used in the present study. The 10 m meteorological tower was instrumented at three levels, 2, 6 and 10 m above the initial snow/ice surface, with meteorological instruments and sonic anemometers.
The processed data are archived in daily files in an open database [20]. The data has been used to test the performance of various turbulence parameterization schemes, see e.g., [36]. In this study, we used quality-controlled Level 2 data, downloaded from the database, for wind velocity and temperature from the meteorological tower. We performed analyses for the period from 1 December 2019 to 31 January 2020.
3.2. Turbulence Statistics
To estimate turbulence statistics, we used a coordinate system aligned with the mean flow direction and calculated the longitudinal, horizontal transverse and vertical velocity components , and w, respectively. The processing of the data was performed using Matlab tools. We detrended the data using a 1 min moving average. This window was estimated as optimal for the stable ABL in Ref. [37]. It acts as a high-pass filter and removes part of non-turbulent, low-frequency submeso motions in the stable ABL. As discussed in Ref. [21], these motions are related to phenomena such as gravity waves, inertial oscillations and drainage flow and lead to the overprediction of the energy dissipation rate and the lack of universality of the parameterization schemes. However, as further argued in [21], high-pass filtering does not fully resolve the problem, as, often, a clear separation between small-scale turbulence and submeso motions does not exist. We note here that a larger averaging time of 10 min was used in Ref. [38], where a detailed study of the turbulence kinetic energy budget was performed. The standard deviations of velocity components , and , fluxes , fluxes , and the two-point correlation functions and the frequency spectra were calculated with the use of detrended data and additional averaging over 20 min blocks. This longer averaging time can reduce the statistical error, which is of particular importance for estimates.
We calculated the turbulence intensity, defined as , where is the standard deviation of the longitudinal velocity component. The I coefficient should be much smaller than unity for the “frozen eddy” hypothesis to be applicable. This hypothesis allows the transformation of the measured time series into spatial structures. In the case of large values of I, frequency spectra become affected, and the use of the Kolmogorov hypothesis to estimate is questionable. As discussed in [39], the frozen eddy hypothesis is reliable for . Hence, we used the threshold and disregarded all data with .
We expect that at the highest frequencies, the frequency spectra are close to the Kolmogorov predictions, even if non-equilibrium effects are present. The results in [38] suggest that, in this range, the scaling is close to −5/3. The calculated frequency spectra were fitted to the following equilibrium form, which follows from Equation (8):
in the range from Hz to Hz, using the least-squares algorithm. The constant for the longitudinal velocity component, and for the horizontal transverse and vertical components [40]. The energy dissipation rate was calculated from the intercept in the log–log scale; see [41] for details of the procedure. Additionally, we required that the slope in the subrange Hz be −5/3 with a 10% error margin. All other data were rejected.
At smaller frequencies, the frequency spectra can deviate from the Kolmogorov equilibrium predictions, particularly under changing flow conditions. In the ABL, such deviations were observed during the decay of the ABL before sunset in [34]. In order to investigate whether changes in the slopes of the frequency spectra are related to changes in , we estimated the slopes using the least-squares algorithm in the interval Hz. As the slopes also differ among velocity components, we calculated them for the frequency spectra of , and w separately, and they are denoted by , and , respectively.
To compute the two-point correlation functions, we estimated the distance between points as . We assumed that the longitudinal two-point correlation coefficient takes approximately the exponential form
The integral of the above exponent from 0 to ∞ is equal to the length scale ; see Equation (9). The longitudinal length scale was estimated by integrating the calculated from 0 to its first zero-crossing point :
In the isotropic turbulence, the following relation between the longitudinal and transverse correlation coefficients holds [22]:
where, in isotropic turbulence, and
The integral of the above formula from 0 to its first zero-crossing equals approximately 0.6 , and we used this procedure to estimate the transverse and vertical length scales and .
where denotes the smallest value of r where the function under the integral crosses zero.
It should be noted here that turbulence in the stable ABL is anisotropic at large scales, and formula (29) does not hold. However, we treat Equation (31) as approximations of the characteristic transverse and vertical length scales and assume that these approximations are sufficient to investigate the tendencies, while the proportionality constant might, in fact, be different from . The predictions could possibly be improved by taking into account the anisotropy tensor [16,37]; this task is left for future work.
4. Results
Even though the data were averaged over 20 min blocks, they are still time-dependent, as the flow conditions change with time. This is visible in Figure 1, where the time series of , and at m for January 2020 are presented.

Figure 1.
Time series of , and for January 2020.
The integral length scales , and as functions of the corresponding standard deviations of the longitudinal , transverse (cross-stream) and vertical velocity components are presented in Figure 2. As can be seen, and are much larger than the corresponding statistics of the horizontal transverse and vertical components, which indicates that the flow is still strongly anisotropic at m. Apart from the surface vicinity, the anisotropy could be caused by the presence of submeso motions, which affect mostly the horizontal components [21]. The scatter of the results is also much larger for the longitudinal component. This is to be expected, as larger length scales require larger averaging windows. On the other hand, when the averaging windows are too large, information on the time variability of the statistics is lost. We chose an averaging window of 20 min as the best compromise. It enables the calculation of the length scales of the transverse and vertical components with satisfactory accuracy.
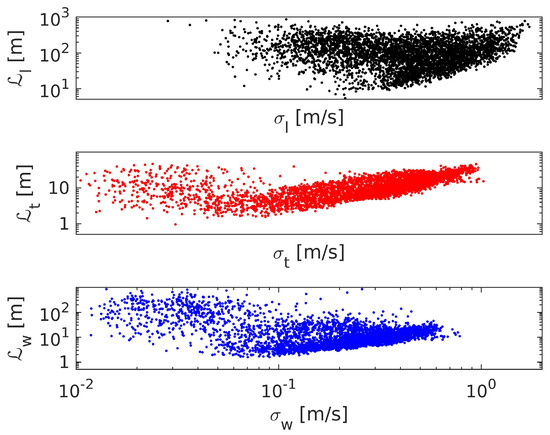
As seen in Figure 2, for large values of , and , the length scales are proportional to the corresponding standard deviations, as expected for the balanced, shear-driven turbulence; see Equation (23). However, for smaller , subregions of inverse proportionality can be identified in all plots. They correspond to weak decaying turbulence or developing turbulence; see Equation (25). These results show that the leading-order balance of the kinetic energy equation changes over time.
We next investigated how and depend on the stability parameter , defined in Equation (19). During the measurements, both positive and negative values were recorded. However, as the latter corresponds to unstable conditions, and the focus of this study is on the stable BL, we present the results only for . The standard deviations presented in Figure 3 decrease with increasing , where turbulence becomes weaker. The longitudinal component is the largest, and the vertical one, , the smallest.
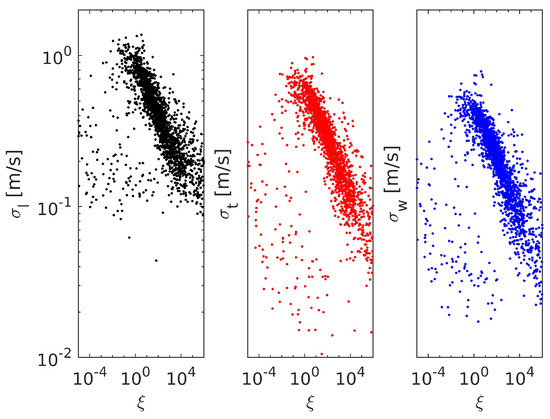
Figure 3.
Standard deviations of fluctuating velocity as functions of the stability parameter , estimated from the time series measured at m.
The integral length scales as functions of and the estimates that follow from Equation (18) are presented in Figure 4. The solid lines in Figure 4 are the predictions
with , and the proportionality constant was set to 10 in the case of the longitudinal and 1 for the transverse and vertical components.
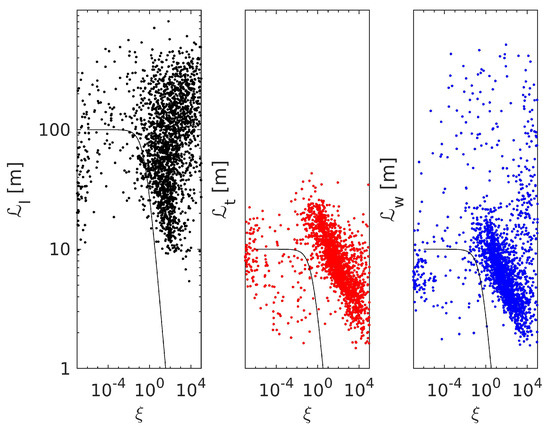
The estimates based on the longitudinal velocity components are much larger than and and considerably scattered. The length scales decrease with increasing , although more slowly than predicted by the parameterization schemes (33), which could be more suitable for weaker stratification.
The energy dissipation rate as a function of is presented in Figure 5. Data for are scarce due to deviations from the Kolmogorov scaling. Possibly, the range was not optimal for this velocity component; in fact, for smaller f, the slopes of longitudinal spectra become closer to −5/3. However, we decided to use the same range for all three components. In contrast to standard deviations and length scales, the values of estimated from the frequency spectra of the longitudinal, transverse and vertical components are comparable. This indicates that at small scales, turbulence is much closer to equilibrium for the selected data.
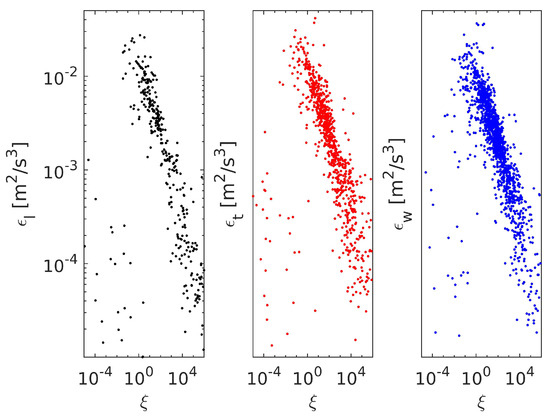
Figure 5.
The energy dissipation rate as a function of the stability parameter (cf. Equation (19)), estimated from the time series measured at m.
Having , and , we next calculated the dissipation coefficient from formula (1). For this, we used the longitudinal, horizontal transverse and vertical components separately; i.e., we calculated three estimates:
They are presented in Figure 6 as a function of . Even though , and depend strongly on , there is no clear dependence of on , which could support the assumption . However, as will be shown further, clearly depends on . Data for in Figure 6 are scattered, possibly due to large uncertainties in estimates. is, on average, larger than . The differences between estimates from the three velocity components might follow from the anisotropy of the flow; this dependence was analyzed in Ref. [16].
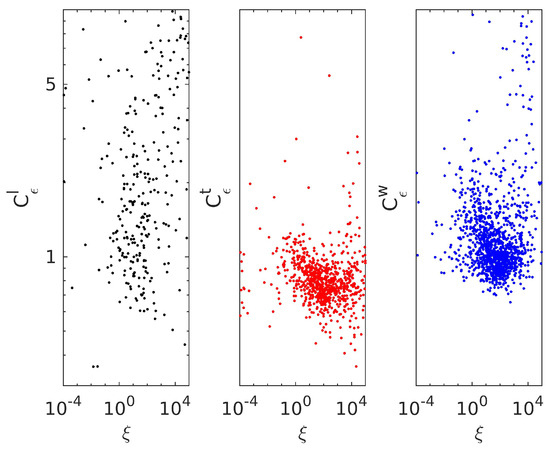
Figure 6.
estimated from Equation (1) as a function of the stability parameter . Calculations were based on the time series of the longitudinal, horizontal transverse and vertical velocity measured at m.
Refs. [11,31,42] suggested that deviations from follow from deviations from the Kolmogorov scaling at the low-wavenumber part of the spectra; see also Equation (20). To test this hypothesis, we assumed the following form of frequency spectra of the three velocity components:
and estimated , and using the least-squares algorithm in the low-wavenumber interval Hz. The results are presented in Figure 7. In the selected range of f, the scaling of the longitudinal velocity component was still close to the Kolmogorov 1.7 and hence, no dependence of on was observed. Possibly, the spectra start to deviate from the equilibrium predictions at smaller f. increases with increasing , in line with predictions of [11,42]. Such dependence is also observed for , although it is weaker than for . estimation is generally better for the transverse and vertical components, because the corresponding length scales are smaller and the averaging window of 20 min is sufficient to calculate and with good accuracy. Interestingly, the authors of Ref. [21] found that parameterizations of the energy dissipation rate based on the vertical velocity are more robust than parameterizations based on the turbulence kinetic energy, because the former is less affected by submeso motions. Following this idea, we further focus on the statistics of the horizontal transverse and vertical velocity components.
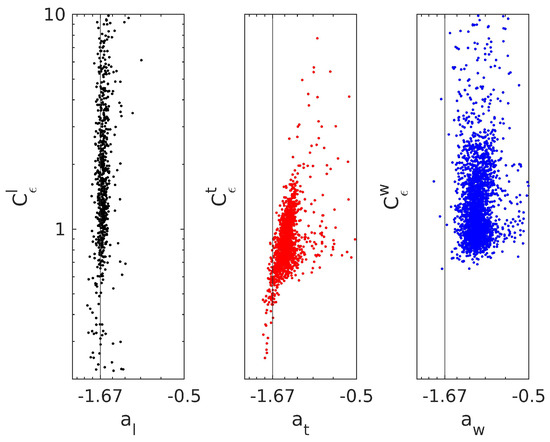
Figure 7.
Slopes of frequency spectra for the interval Hz. Calculations were based on the time series of longitudinal (left panel), horizontal transverse (middle panel) and vertical (right panel) velocity measured at m.
and as a function of the Reynolds number are presented in Figure 8 and Figure 9. A subregion of the classical scaling with in Equation (2) is visible only at a restricted range of . For a high , clearly .
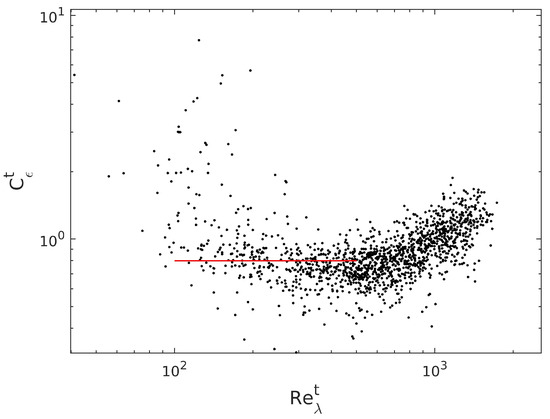
Figure 8.
as a function of the Reynolds number . Classical scaling is denoted by the red line.
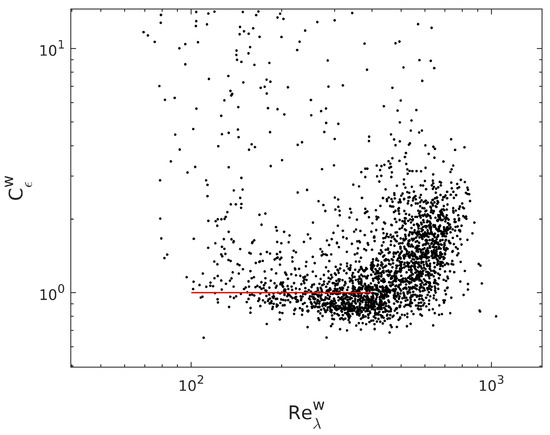
Figure 9.
as a function of the Reynolds number . Classical scaling is denoted by the red line.
The ratios of the length scales and as a function of are presented in Figure 10 and Figure 11. At the smallest , the scatter of the results is considerable. The maximum of is observed at ; next, the ratio decreases with increasing . The slope also changes and becomes steeper than the −1 equilibrium prediction at the largest .
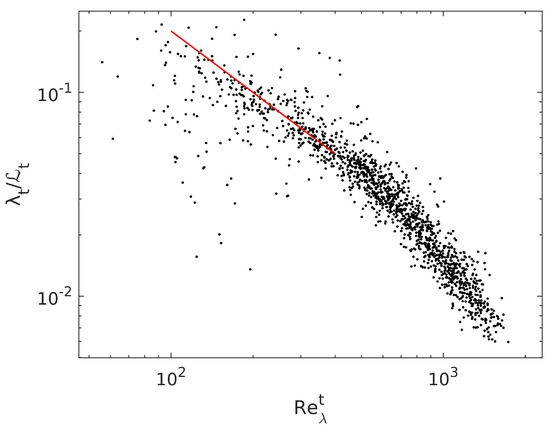
Figure 10.
The ratio as a function of the Reynolds number . Classical scaling is denoted by the red line.

Figure 11.
The ratio as a function of the Reynolds number . Classical scaling is denoted by the red line.
5. Discussion
In this work, we investigated the dissipation law (1) without assuming the constancy of the dissipation coefficient . We analyzed times series of stably stratified turbulence from the MOSAiC expedition and calculated the standard deviations of velocity components, energy dissipation rates and integral length scales. After substituting them into formula (1), we found that and the ratio depend on the local Reynolds number . This variability can easily be included in turbulence parameterization schemes for a stable ABL. The dependence was found in previous studies in various laboratory experiments [7,12,13,42] and in the ABL, above the surface layer [14]. In those previous studies, 1 was found in certain regions of the flow, indicating the presence of non-equilibrium turbulence. We found the inverse relation between and only at the smallest Reynolds numbers; however, the scatter of the results was too large to draw any definite conclusions. At intermediate Reynolds numbers, , the coefficient , and next, it became positive; see Figure 8 and Figure 9. In contrast to previous laboratory experiments with near-wall turbulence [13], we could not identify a region where at very large . This fact is intriguing and could possibly indicate that, in atmospheric turbulence, the fully developed, stationary state is never reached.
Author Contributions
Conceptualization, M.W. and S.P.M.; methodology, M.W.; software, M.W., J.N. and P.J.; formal analysis, M.W. and J.S.; writing—original draft preparation, M.W.; supervision, M.W. and S.P.M.; funding acquisition, M.W. All authors have read and agreed to the published version of the manuscript.
Funding
This research was funded by the National Science Centre, Poland grant number 2020/37/B/ST10/03695, through the OPUS 19 program.
Institutional Review Board Statement
Not applicable.
Informed Consent Statement
Not applicable.
Data Availability Statement
No new data were created during this study.
Acknowledgments
The data used in this manuscript were produced as part of the international Multidisciplinary drifting Observatory for the Study of Arctic Climate (MOSAiC) expedition with tag MOSAiC20192020. We also thank all persons involved in the expedition of the Research Vessel Polarstern during MOSAiC in 2019–2020 (AWI_PS122_00), as listed in Ref. [43].
Conflicts of Interest
The authors declare no conflicts of interest.
Abbreviations
The following abbreviations are used in this manuscript:
| ABL | Atmospheric boundary layer |
| MOSAiC | Multidisciplinary drifting Observatory for the Study of Arctic Climate |
References
- Taylor, G.I. Statistical theory of turbulence. Proc. Roy. Soc. London 1935, A151, 421–444. [Google Scholar] [CrossRef]
- Lv, Y.; Muñoz-Esparza, D.; Chen, X.; Zhang, C.; Luo, M.; Wang, R.; Zhou, B. Stability dependence of the turbulent dissipation rate in the convective atmospheric boundary layer. Geophys. Res. Lett. 2023, 50, e2023GL103326. [Google Scholar] [CrossRef]
- Monin, A.S.; Obukhov, A.M. Basic laws of turbulent mixing in the surface layer of the atmosphere. Tr. Nauk. SSSR Geophiz. Inst. 1954, 24, 163–187. [Google Scholar]
- Blackadar, A.K. The vertical distribution of wind and turbulent exchange in a neutral atmosphere. J. Geophys. Res. 1962, 67, 3095–3102. [Google Scholar] [CrossRef]
- Mellor, G.; Yamada, T. Hierarchy of turbulence closure models for planetary boundary-layers. J. Atmos. Sci. 1974, 31, 1791–1806. [Google Scholar] [CrossRef]
- Valente, P.; Vassilicos, J.C. Universal dissipation scaling for non-equilibrium turbulence. Phys. Rev. Lett. 2012, 108, 214503. [Google Scholar] [CrossRef]
- Vassilicos, J.C. Dissipation in turbulent flows. Annu. Rev. Fluid Mech. 2015, 47, 95–114. [Google Scholar] [CrossRef]
- Dairay, T.; Obligado, M.; Vassilicos, J.C. Non-equilibrium scaling laws in axisymmetric turbulent wakes. J. Fluid Mech. 2015, 781, 166–195. [Google Scholar] [CrossRef]
- Goto, S.; Vassilicos, J.C. Local equilibrium hypothesis and Taylor’s dissipation law. Fluid Dyn. Res. 2016, 48, 021402. [Google Scholar] [CrossRef]
- Goto, S.; Vassilicos, J.C. Unsteady turbulence cascades. Phys. Rev. E 2016, 94, 053108. [Google Scholar] [CrossRef]
- Bos, W.J.T.; Rubinstein, R. Dissipation in unsteady turbulence. Phys. Rev. Fluids 2017, 2, 022601. [Google Scholar] [CrossRef]
- Nedić, J.; Tavoularis, S. Energy dissipation scaling in uniformly sheared turbulence. Phys. Rev. E 2016, 93, 033115. [Google Scholar] [CrossRef] [PubMed]
- Nedić, J.; Tavoularis, S.; Marusic, I. Dissipation scaling in constant–pressure turbulent boundary layers. Phys. Rev. Fluids 2017, 2, 032601. [Google Scholar] [CrossRef]
- Wacławczyk, M.; Nowak, J.L.; Siebert, H.; Malinowski, S.P. Detecting Nonequilibrium States in Atmospheric Turbulence. J. Atmos. Sci. 2022, 79, 2757–2772. [Google Scholar] [CrossRef]
- Obligado, M.; Brun, C.; Silvestrini, J.H.; Schettini, E. Dissipation Scalings in the Turbulent Boundary Layer at Moderate Reθ. Flow Turb. Comb. 2022, 108, 105–122. [Google Scholar] [CrossRef]
- Chowdhuri, S.; Banerjee, T. Quantifying small-scale anisotropy in turbulent flows. Phys. Rev. Fluids 2024, 9, 074604. [Google Scholar] [CrossRef]
- Sorbjan, Z. Local Structure of Turbulence in Stably Stratified Boundary Layers. J. Atmos. Sci. 2006, 63, 1526–1537. [Google Scholar] [CrossRef]
- Mahrt, L. Stably Stratified Atmospheric Boundary Layers. Annu. Rev. Fluid Mech. 2014, 46, 23–45. [Google Scholar] [CrossRef]
- Heisel, M.; Sullivan, P.P.; Katul, G.G.; Chamecki, M. Turbulence Organization and Mean Profile Shapes in the Stably Stratified Boundary Layer: Zones of Uniform Momentum and Air Temperature. Bound.-Layer Meteorol. 2023, 186, 533–565. [Google Scholar] [CrossRef]
- Cox, C.; Gallagher, M.; Shupe, M.; Persson, O.; Blomquist, B.; Grachev, A.; Riihimaki, L.; Kutchenreiter, M.; Morris, V.; Solomon, A. Met City Meteorological and Surface Flux Measurements (Level 3 Final), Multidisciplinary Drifting Observatory for the Study of Arctic Climate (MOSAiC), Central Artic, October 2019–September 2020 [Dataset]. NSF Arctic Data Center. 2023. Available online: https://arcticdata.io/catalog/view/doi:10.18739/A2TM7227K (accessed on 28 December 2024). [CrossRef]
- Schiavon, M.; Barbano, F.; Brogno, L.; Leo, L.S.; Tampieri, F.; Di Sabatino, S. On the parametrizations for the dissipation rate of the turbulence kinetic energy in stable conditions. Bull. Atmos. Sci. Technol. 2023, 4, 3. [Google Scholar] [CrossRef]
- Pope, S.B. Turbulent Flows; Cambridge University Press: Cambridge, UK, 2000. [Google Scholar]
- Du, S.; Sawford, B.L.; Wilson, J.D.; Wilson, D.J. Estimation of the Kolmogorov constant (C0) for the Lagrangian structure function, using a second-order Lagrangian model of grid turbulence. Phys. Fluids 1995, 7, 3083–3090. [Google Scholar] [CrossRef]
- Nakanishi, M. Improvement of the Mellor–Yamada turbulence closure model based on large-eddy simulation data. Bound.-Layer Meteorol. 2001, 99, 349–378. [Google Scholar] [CrossRef]
- Basu, S.; He, P.; DeMarco, A.W. Parametrizing the Energy Dissipation Rate in Stably Stratified Flows. Bound.-Layer Meteorol. 2021, 178, 167–184. [Google Scholar] [CrossRef]
- Mellor, G.L.; Yamada, T. Development of a turbulence closure model for geophysical fluid problems. Rev. Geophys. Space 1982, 20, 851–875. [Google Scholar] [CrossRef]
- Zilitinkevich, S.; Druzhinin, O.; Glazunov, A.; Kadantsev, E.; Mortikov, E.; Repina, I.; Troitskay, Y. Dissipation rate of turbulent kinetic energy in stably stratified sheared flows. Atmos. Chem. Phys. 2019, 19, 2489–2496. [Google Scholar] [CrossRef]
- Sorbjan, Z. Similarity scaling systems for stably stratified turbulent flows. Q. J. R. Meteorol. Soc. 2016, 142, 805–810. [Google Scholar] [CrossRef]
- Łobocki, L.; Porretta-Tomaszewska, P. Prediction of gradient-based similarity functions from the Mellor–Yamada model. Q. J. R. Meteorol. Soc. 2021, 147, 3922–3939. [Google Scholar] [CrossRef]
- Wacławczyk, M.; Yano, J.I.; Florczyk, G.M. Local Similarity Theory as the Invariant Solution of the Governing Equations. Bound.-Layer Meteorol. 2024, 190, 23. [Google Scholar] [CrossRef]
- Yoshizawa, A. Nonequilibrium effect of the turbulent-energy-production process on the inertial-range energy spectrum. Phys. Rev. E 1994, 49, 4065–4071. [Google Scholar] [CrossRef]
- Apostolidis, A.; Laval, J.P.; Vassilicos, J.C. Scalings of turbulence dissipation in space and time for turbulent channel flow. J. Fluid Mech. 2022, 946, A41. [Google Scholar] [CrossRef]
- Steiros, K. Turbulence near initial conditions. Phys. Rev. Fluids 2022, 7, 104607. [Google Scholar] [CrossRef]
- Karasewicz, M.; Wacławczyk, M.; Ortiz-Amezcua, P.; Janicka, Ł.; Poczta, P.; Kassar Borges, C.; Stachlewska, I.S. Investigation of non-equilibrium turbulence decay in the atmospheric boundary layer using Doppler lidar measurements. Atmos. Chem. Phys. 2024, 24, 13231–13251. [Google Scholar] [CrossRef]
- Cox, C.J.; Gallagher, M.R.; Shupe, M.D.; Persson, P.O.G.; Solomon, A.; Fairall, C.W.; Ayers, T.; Blomquist, B.; Brooks, I.M.; Costa, D.; et al. Continuous observations of the surface energy budget and meteorology over the Arctic sea ice during MOSAiC. Sci. Data 2023, 10, 519. [Google Scholar] [CrossRef] [PubMed]
- Cummins, D.P.; Guemas, V.; Cox, C.J.; Gallagher, M.R.; Shupe, M.D. Surface turbulent fluxes from the MOSAiC campaign predicted by machine learning. Geophys. Res. Lett. 2023, 50, e2023GL105698. [Google Scholar] [CrossRef]
- Stiperski, I.; Calaf, M. Generalizing Monin-Obukhov Similarity Theory (1954) for Complex Atmospheric Turbulence. Phys. Rev. Lett. 2023, 130, 124001. [Google Scholar] [CrossRef]
- Peng, S.; Yang, Q.; Shupe, M.D.; Han, B.; Chen, D.; Liu, C. The vertical structure of turbulence kinetic energy near the Arctic sea-ice surface. Geophys. Res. Lett. 2024, 51, e2024GL110792. [Google Scholar] [CrossRef]
- Schröder, M.; Bätge, T.; Bodenschatz, E.; Wilczek, M.; Bagheri, G. Estimating the turbulent kinetic energy dissipation rate from one-dimensional velocity measurements in time. Atmos. Meas. Tech. 2024, 17, 627–657. [Google Scholar] [CrossRef]
- Nowak, J.L.; Lothon, M.; Lenschow, D.H.; Malinowski, S.P. The ratio of transverse to longitudinal turbulent velocity statistics for aircraft measurements. Atmos. Meas. Tech. 2025, 18, 93–114. [Google Scholar] [CrossRef]
- Wacławczyk, M.; Gozingan, A.S.; Nzotungishaka, J.; Mohammadi, M.; P. Malinowski, S.P. Comparison of Different Techniques to Calculate Properties of Atmospheric Turbulence from Low-Resolution Data. Atmosphere 2020, 11, 199. [Google Scholar] [CrossRef]
- Obligado, M.; Vassilicos, J.C. The non-equilibrium part of the inertial range in decaying homogeneous turbulence. Europhys. Lett. 2019, 127, 64004. [Google Scholar] [CrossRef]
- Nixdorf, U.; Dethloff, K.; Rex, M.; Shupe, M.; Sommerfeld, A.; Perovich, D.; Nicolaus, M.; Heuze, C.; Rabe, B.; Loose, B.; et al. MOSAiC Extended Acknowledgement. Zenodo. 2021. Available online: https://zenodo.org/records/5541624 (accessed on 28 December 2024). [CrossRef]
Disclaimer/Publisher’s Note: The statements, opinions and data contained in all publications are solely those of the individual author(s) and contributor(s) and not of MDPI and/or the editor(s). MDPI and/or the editor(s) disclaim responsibility for any injury to people or property resulting from any ideas, methods, instructions or products referred to in the content. |
© 2025 by the authors. Licensee MDPI, Basel, Switzerland. This article is an open access article distributed under the terms and conditions of the Creative Commons Attribution (CC BY) license (https://creativecommons.org/licenses/by/4.0/).