Article

Teleconnections of Atmospheric Circulations to Meteorological Drought in the Lancang-Mekong River Basin

1
School of Water Resources and Hydropower Engineering, North China Electric Power University, Beijing 102206, China
2
Key Laboratory of Watershed Geographic Sciences Nanjing, Institute of Geography and Limnology, Chinese Academy of Sciences, Nanjing 210008, China
3
Key Laboratory of Coastal Zone Exploitation and Protection, Ministry of Natural Resources, Nanjing 210024, China
*
Author to whom correspondence should be addressed.
Atmosphere 2024, 15(1), 89; https://doi.org/10.3390/atmos15010089
Submission received: 10 November 2023 / Revised: 19 December 2023 / Accepted: 20 December 2023 / Published: 10 January 2024
(This article belongs to the Special Issue Drought Monitoring, Prediction and Impacts)

Abstract

:
The Lancang-Mekong River Basin (LMRB) is one of the major transboundary basins globally, facing ongoing challenges due to flood and drought disasters. Particularly in the past two decades, the basin has experienced an increased frequency of meteorological drought events, posing serious threats to the local socio-economic structures and ecological systems. Thus, this study aimed to analyze the meteorological drought characteristics in the LMRB and identify the impact and correlation of atmospheric circulation on the meteorological drought in the basin. Specifically, the different levels of meteorological drought events were defined using the Run Theory based on the seasonal and annual SPEI from 1980 to 2018. The time lag correlation between meteorological drought events and the EI Nino-Southern Oscillation (ENSO), Arctic Oscillation (AO), North Atlantic Oscillation (NAO), and Pacific Decadal Oscillation (PDO), were analyzed in the LMRB. Our results indicated that, from a temporal perspective, the period from November to April of the following year was particularly prone to meteorological droughts in the basin. In terms of spatial distribution, the primary agricultural regions within the basin, including Thailand, Eastern Cambodia, and Vietnam, were highly susceptible to meteorological droughts. Further analysis revealed a teleconnection between drought events in the LMRB and atmospheric circulation factors. The sensitivity of the basin’s drought timing to its response decreased in the order of the ENSO > AO > NAO > PDO. In general, the ENSO had the most substantial influence on drought events in the basin, with the strongest response relationship, while the upper reaches of the basin displayed the most significant response to the AO; the occurrence and progression of meteorological droughts in this area synchronized with the AO. These findings enhance our understanding of drought-prone areas in the LMRB, including the meteorological factors and driving mechanisms involved. This information is valuable for effectively mitigating and managing drought risks in the region.

1. Introduction

A meteorological drought refers to an imbalance in the water balance caused by evaporation exceeding precipitation over a certain period, typically indicated by a shortage of precipitation [1]. The world is currently undergoing climate change, manifested by a rise in temperatures [2]. This temperature increase has led to a reinforcement of the water cycle, subsequently impacting precipitation, evaporation, and runoff [3]. Anomalous variations in ocean temperatures or atmospheric circulations are increasingly impacting regional climates [4]. This has amplified the frequency and severity of meteorological droughts, disrupting and posing threats to the economic development and ecological systems within the basin [5,6]. Therefore, it is imperative to delve into the spatio-temporal characteristics of meteorological droughts in the basin and unravel the intricate patterns governing their evolution [7]. These efforts are crucial for enhancing the basin’s resilience against drought risks.
In terms of drought quantification, assessment, and monitoring, drought indices serve as crucial parameters for investigating drought characteristics [8]. Currently, the Palmer Drought Severity Index (PDSI) and the Standardized Precipitation Index (SPI) are widely employed as drought indices for monitoring and analyzing global and regional drought phenomena [9,10]. Nonetheless, in the backdrop of global change, the escalation in temperature has emerged as a significant factor intensifying the drought process. Consequently, an objective depiction of the drought situation necessitates the combined impact of alterations in precipitation and temperature [11]. The Standardized Precipitation Evapotranspiration Index (SPEI) provides an enhanced approach to evaluating drought conditions as it effectively incorporates the impacts of both precipitation patterns and potential evapotranspiration fluctuations. This comprehensive index seamlessly integrates the sensitivity of the PDSI to variations in evaporation demand, induced by temperature oscillations and trends. Additionally, it harnesses the simplicity of the computation associated with the SPI, while simultaneously leveraging its inherent multi-temporal and spatial characteristics [12]. This makes it an ideal instrument for monitoring desertification and studying the impact of warming on the desertification process [13,14]. The World Meteorological Organization (WMO) currently recognizes and endorses the SPEI as the primary meteorological indicator for monitoring meteorological droughts [14]. It is now widely employed across various global regions [13,15] and has demonstrated considerable applicability within the LMRB [16].
In terms of the mechanisms of drought formation, past research has primarily focused on issues such as the relative contribution of local land–atmosphere interactions to drought formation [17]. However, it is now recognized that atmospheric circulation factors, including the ENSO, NAO, AO, and PDO, can have a significant impact on drought formation over longer periods of time [18,19]. As a large-scale atmospheric phenomenon on a global scale, anomalies in atmospheric circulation can lead to sudden changes in temperature and evapotranspiration, altering the spatio-temporal distribution of precipitation and resulting in regional drought events. This climatic phenomenon is also known as teleconnection [20]. At the same time, atmospheric circulation has proven to have stable periodicity and persistence, and its impact on regional climate has a lag effect [21]. Therefore, the use of atmospheric circulation factors to predict meteorological drought events has become one of the hotspots, and has been used in China [19], Africa [18], Iran [22], and other countries [16], as well as in the Pearl Lake Basin [21], and the Yangtze River Basin [23]. Consequently, establishing a robust response relationship between atmospheric circulation patterns and meteorological drought indices within a basin can significantly contribute to a profound analysis of the mechanisms underlying drought occurrence and progression. This, in turn, facilitates effective intervention strategies and preventive measures against recurrent drought events in the basin [24].
The LMRB is globally recognized as one of the most crucial transboundary basins, offering invaluable water and energy resources, freshwater resources, and ecological resources to the countries within the basin [25,26]. It not only serves as the pillar of fishery development and food production in the riparian countries, but also acts as the economic link among the countries in the basin [27]. However, in recent years, the LMRB has been experiencing a worrisome escalation in both the frequency and severity of drought events, primarily attributed to the pervasive influence of global climate change. This distressing trend has resulted in far-reaching consequences for various sectors, including domestic water consumption, agricultural irrigation, ecological balance, and navigational activities across the countries encompassing the basin [28,29]. Thus, this study aimed to analyze the meteorological drought characteristics in the LMRB and identify the impact and correlation of atmospheric circulations on the meteorological drought in the basin. The specific research was as follows: (1) We analyzed the spatio-temporal variation characteristics of SPEI through the Run Theory and Mann-Kendall test to clarify the spatio-temporal evolution characteristics and changing trends of meteorological droughts in the LMRB. (2) By examining the time-lag correlation between atmospheric circulation indices and SPEI, we established a reliable basis for monitoring and predicting meteorological drought in the LMRB.
In comparison to previous research, the novelty of this manuscript is reflected in the following aspects. Firstly, this study diverges from the conventional approach of utilizing a 6-month time scale of SPEI. Instead, it takes into consideration the distinct wet and dry seasons in the LMRB, calculating the SPEI separately for the dry season (November to April) and the rainy season (May to October). This approach provides a more accurate depiction of the characteristics and trends of meteorological drought during both the dry and rainy seasons. Secondly, this study analyzed the teleconnections between atmospheric circulation patterns and drought and provided insights for predicting meteorological droughts in the LMRB. Furthermore, the research findings enable real-time monitoring of the synchronicity or lagged effects between the ENSO, AO, NAO, PDO, and meteorological drought. This allows for the implementation of effective measures in preventing and mitigating meteorological drought events within the basin. Ultimately, these findings serve as valuable scientific foundations for water resource management in the LMRB.

2. Materials and Methods

2.1. Research Area

The Lancang-Mekong River originates in Qinghai Province, China, traverses the Tibet Autonomous Region and Yunnan Province, and meanders through Myanmar, Laos, Thailand, Cambodia, and Vietnam, ultimately converging with the South China Sea to the west of Ho Chi Minh City, Figure 1a [30].
The LMRB covers an area of approximately 812,400 km2, with a main stream that stretches about 4880 km in length, making it the first longest river in Southeast Asia [31]. Figure 1 illustrates the geographic location, water system distribution, elevation, and land use types. The rainy season (May to October) in the LMRB is dominated by the southwest monsoon from the ocean, resulting in a humid and rainy climate [32]. Conversely, during the dry season (November to April of the subsequent year), the basin is influenced by the northeast monsoon from the continent, leading to dry and less rainy conditions [7]. Generally, the annual precipitation upstream of the Lancang River is less than 1000 mm, while it is approximately 1500 mm downstream. The average annual precipitation in the Mekong River basin, on the other hand, exceeds 1500 mm [27]. The climate in the Lancang River basin exhibits a variety of climate types, with an annual average temperature range of 21 °C to 4.7 °C. In contrast, the temperature in the Mekong River basin shows a relatively uniform variation, with an annual average temperature ranging from around 25 °C to 27 °C [33]. The average annual runoff is approximately 4.75 × 10¹¹ m3 of the LMRB, and the land utilization status in the LMRB exhibits regional variations, as depicted in Figure 1b,c. The Mekong Delta, Khorat Plateau, and Tonle Sap Lake Basin are the predominant agricultural cultivation areas in the region (Figure 1b,c) [34]. Owing to its unique geographical location, diverse climate types, and high sensitivity to climate change, the LMRB has become a focal point for global climate change research [27].

2.2. Materials and Methods

2.2.1. Meteorological Data

This study utilized meteorological data, including precipitation and temperature, obtained from the Climatic Research Unit TS v.4.03 (CRU) database (https://crudata.uea.ac.uk/cru/data/hrg/cru_ts_4.03/ accessed on 1 January 2021). The CRU database provides monthly-scale data with a spatial resolution of 0.5° × 0.5°. The advantage of using the CRU dataset to calculate SPEI is that the CRU dataset is obtained based on a large number of site data, with excellent data quality, comprehensive coverage, and continuous time series [35]. Considering that calculating the SPEI index requires at least 30 years of meteorological data, the CRU database has sufficient data support in this regard [4].
The bias in the CRU data has been corrected using data from meteorological stations in the LMRB. Our approach entails interpolating CRU data to specific meteorological observation stations within the study area with data sourced from the China Meteorological Data Network. When choosing interpolation methods, we employed two prevalent techniques: inverse distance weighted interpolation and bilinear interpolation. The calculation methods or basic principles of the two interpolation methods selected in this study were as follows.
Specifically, the calculation method employed the inverse distance weighted interpolation as:
z ^ = i = 1 n 1 ( D i ) P Z i i = 1 n 1 ( D i ) P
In the equation above, z ^ represents the estimated value, Z i represents the i (i = 1, …, n) sample, and D i represents the power of distance. P is a weighting factor that has a significant influence on the interpolation results. The selection criterion is based on the minimum average absolute error. Generally, higher powers result in a smoother interpolation effect. In this specific context, P was chosen as 2, which corresponded to the inverse squared distance.
The bilinear interpolation algorithm geometric operation is generally defined as follows:
g x , y = f x , y = f a x , y , b x , y
In the equation above, g x , y represents the output image, f x , y represents the input image, and the function a x , y ,   b x , y describes the spatial relationship between the two in the Cartesian coordinate system.
To evaluate the accuracy of these methods, we conducted an analysis based on statistical measures including the correlation coefficient I, mean absolute error (MAE), and root mean square error (RMSE). The specific calculation methods are as follows:
R = i = 1 T y i y ¯ i 2 i = 1 T y i y ¯ i 2
MAE = y i y ¯ i T
RMSE = 1 T i = 1 T y i y ¯ i 2
In this context, “R” symbolizes the correlation coefficient, while “n” represents the sample size, and y i and y ¯ i , respectively, allude to the CRU data and the site data. The domain of “R” is [0,1], whereby values closer to 1 signify heightened data consistency. The range of MAE is [0,−∞], with an optimal value of 0. Similarly, the range of RMSE is [0,−∞], with an optimal value of 0.
These metrics were derived from the validation results and are presented in Table 1 to provide a comprehensive overview. The bilinear interpolation results were found to align more closely with the actual measurements (Table 1), leading us to select bilinear interpolation for calibrating anomalous values in this study.

2.2.2. Atmospheric Circulation Indices

Based on the current understanding of important teleconnections of atmospheric circulations to regional climate variability, this study selected the most commonly used four atmospheric circulation factors (Table 2). The monthly time series (1980–2018) for all these four atmospheric circulations were obtained from different sources and they are given in Table 2.

2.2.3. Standardized Precipitation Evapotranspiration Index

The LMRB exhibits well-defined seasonal variations, characterized by distinct dry and wet seasons. The wet season spans from May to October, while the dry season extends from November to the subsequent April. However, due to climate and environmental changes, meteorological droughts have become increasingly frequent in the region, affecting both the rainy and dry seasons and exacerbating the overall impact of drought [7]. The SPEI is suitable for monitoring the characteristics of meteorological droughts under global warming [36], due to the advantageous feature of SPEI encompassing multiple time scales [32]. Therefore, this paper calculated the SPEI on different time scales of 1 month, 6 months, and 12 months for 38 years, respectively. A one-month SPEI (SPEI-1) can indicate the occurrence of drought on a monthly basis. A three-month SPEI (SPEI-3) can depict the seasonal moisture conditions. A six-month SPEI for both the wet and dry seasons can, respectively, represent the moisture conditions of the basin during these periods. A twelve-month SPEI (SPEI-12) can demonstrate the persistence of interannual moisture conditions.
The SPEI index calculation method in this paper is based on Vicente-Serrano [37]. Given that the Thornthwaite method is more practical in the absence of complete and high-quality meteorological data [38], this paper utilized the Thornthwaite method to compute the potential transpiration (PET) for the LMRB.
Subsequently, the disparity between monthly precipitation and potential evapotranspiration was computed:
D m = P m ET 0 m
where, m is the number of months, P m is the monthly precipitation, and ET 0 m is the potential evapotranspiration.
Third, D m is aggregated and normalized according to different time scales:
D m , n i = j = 13 i + n 12 D m 1 + j = 1 n D m , j , n < i D m , n i = j = n i + 1 n D m , j , n i
Then, fitting D m using log-logistics:
F D = 1 + α D γ β 1
where, the parameter α , β , and γ denote the scale, shape, and position parameters estimated by linearity, respectively.
Finally, we can normalize the cumulative probability density:
SPEI = W c 1 + c 2 w + c 3 w 1 + t 1 w + t 2 w 2 + c 3 w 3 W = 2 ln p
In the equation, when p 0.5 , p = 1 p ; and when p > 0.5 , p = 1 p , c1 = 2.515517, c2 = 0.802853, c3 = 0.010328, t1 = 1.432 788, t2 = 0.189269, t3 = 0.001308 [10].
Considering the geographical attributes of the LMRB along with relevant research, the drought conditions prevailing in this region are categorized into five distinct levels based on the SPEI, as presented in Table 3.

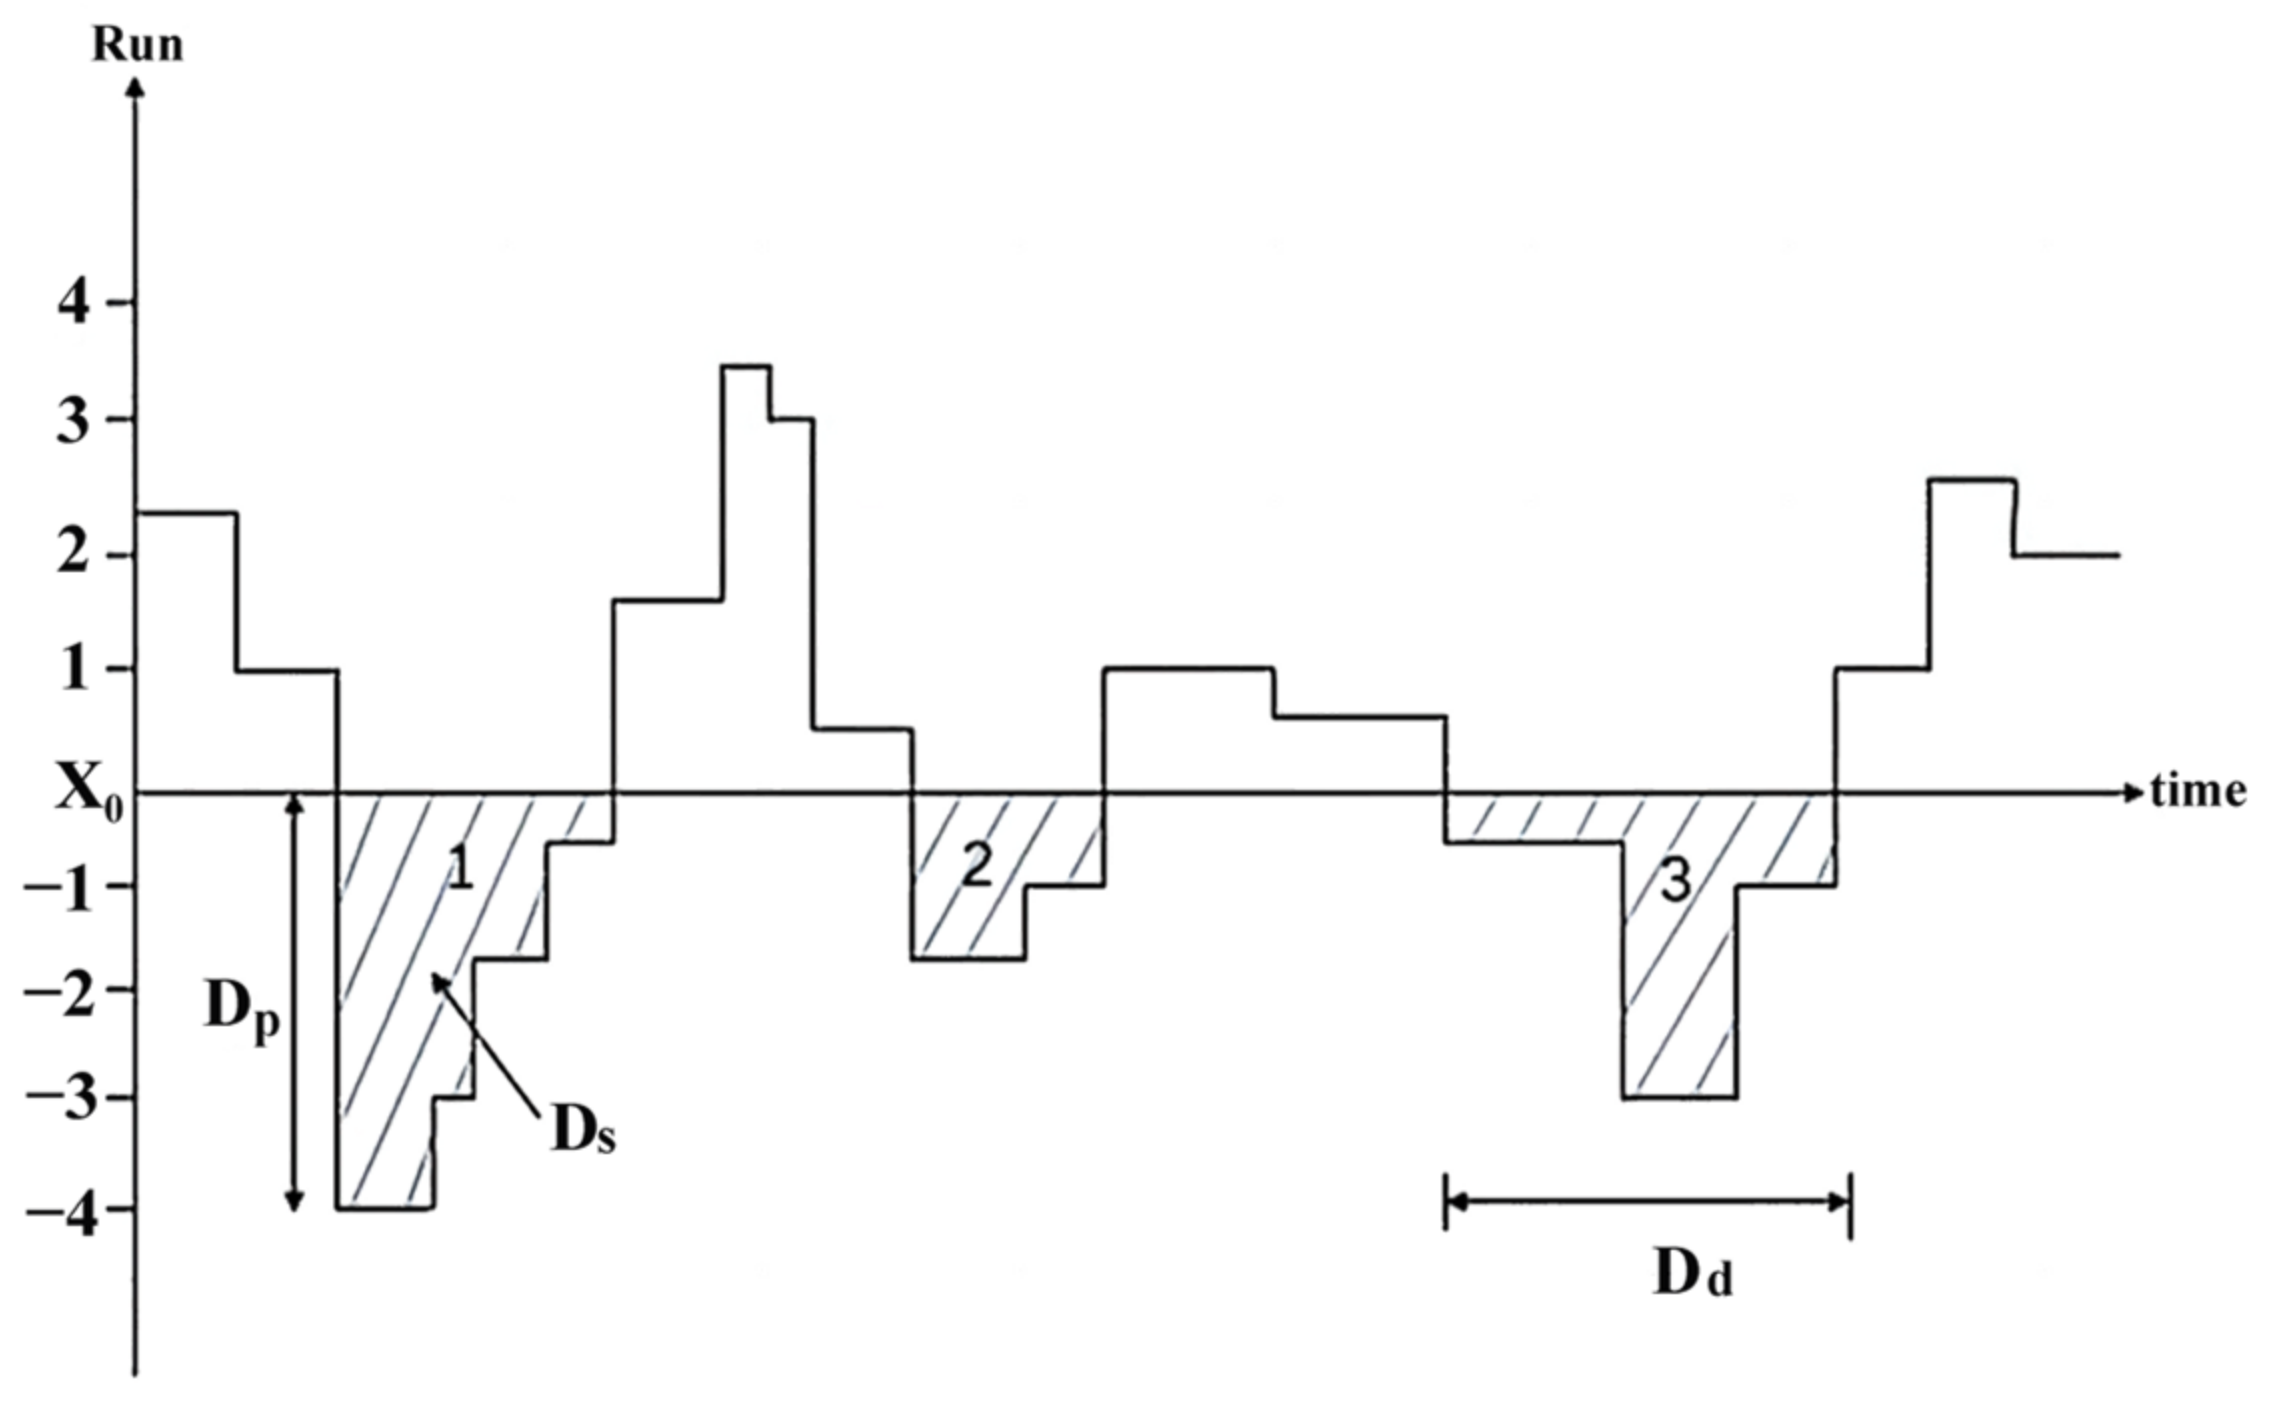
2.2.4. The Run Theory

The Run Theory, initially introduced by Yevjevich [39], has gained widespread acceptance in the identification and characterization of drought events. In this study, a drought event is defined based on three predetermined criteria: (1) a persistent SPEI < 0, (2) a duration of at least 2 months during the period of negative SPEI values, and (3) a minimum SPEI < −1 [40]. According to the run theory, the severity of a drought is determined by summing the SPEI values that fall below the specified threshold level [41,42].
Drought duration refers to the consecutive period during which the SPEI value remains below the specified threshold level. The frequency of drought is determined by counting the occurrences when the SPEI falls below the threshold level. The Run theory is a widely recognized approach for identifying drought events. In this study, particular attention was given to three essential factors for drought risk analysis: drought duration (Dd), drought severity (Ds), and drought peak (Dp) [7]. Figure 2 depicts the three meteorological drought events and their key features, as identified through the application of the Run Theory.

2.2.5. Mann-Kendall Trend Test

The non-parametric Mann–Kendall (M–K) test, initially introduced by Mann and Kendall, is widely endorsed and recommended by the WMO [43]. This test is valuable for evaluating trends or changes in meteorological time series, as it does not rely on specific distribution assumptions for the samples [16]. This study employs the M–K trend testing method to compute and analyze the trend of the SPEI in the LMRB, calculated as follows [44]:
Q = j = i n 1 k = j + 1 n sgn x k x j
Var Q = n n 1 2 n + 5 i = 1 p t i ( t i 1 ) 2 t i + 5 18
Z = Q 1 Var T           Q > 0           0                   Q = 0 Q + 1 Var Q           Q < 0
The test statistic used in this study is denoted as ‘Q’, representing the number of tied groups in the data, which indicates the frequency of data repetition. The length of the data series is represented by ‘n’, and ‘x, j’ refers to the data values at times ‘i’ and ‘j’. The standardized statistic for the Mann–Kendall test is denoted as ‘Z’, with positive and negative values indicating upward and downward trends, respectively. The trend is deemed statistically significant at the 0.05 (or 0.01) significance level when the absolute value of the Z-score, denoted as |Z|, exceeds or equals 1.96 (or 2.33) respectively [36].

2.2.6. Frequency of Meteorological Drought

In this study, we first identified drought events based on the Run Theory for the time scales of rainy season, dry season, and interannually using the SPEI. Secondly, using the results obtained, we calculated the occurrence frequencies of drought events for different severity levels according to Equation (13).
P i = n i N × 100 %
In the above equation, P i is used to evaluate the frequency of drought occurrence at a specific grid point in the study area from 1980 to 2018. “N” represents the total number of years considered which is N = 39. “ n i ” represents the number of years when drought occurred at the “i-th” grid point. The occurrence frequencies for each drought severity level are calculated based on the number of years of occurrence for each level.

2.2.7. Cross-Correlation Function

The Cross-correlation Function (CCF) is a valuable tool for assessing the resemblance between two variables at various time lags [45]. This method enables the determination of correlation coefficients between variables and previous occurrences [10]. One notable advantage of the cross-correlation approach is its ability to assess correlation coefficients at various lags, including positive and negative lags [46]. In this study, the CCF coefficient was used to examine asynchronous relationships between variables, considering lag times from 0 to 12 months. The significance of these correlations was determined using a t-test at a confidence level of 95%. Specifically, CCF was utilized to examine the lagged impact of ocean-atmospheric oscillation patterns on drought indices. The CCF can be formulated as follows [47]:
r a = Č a x , y δ ˇ x δ ˇ y + a
whereas the covariance and standard deviation of the sample are expressed as follows, respectively:
Č a = 1 n a i = 1 n a ( x i x ¯ ) ( y i + a y ¯ i + a ) δ ˇ x = 1 n k i = 1 n a ( x i x ¯ i ) 2 1 2 δ ˇ y + a = 1 n a i = 1 n a ( y i + a x ¯ i + a ) 2 1 2
Additionally, the mean value is:
x i = 1 n a i = 1 n a x i y ¯ i + a = 1 n a i = 1 n a y ¯ i + a
where, x i is the number of sample sequences and y ¯ i denotes the time lag with a unit of month. As a rule of thumb, the absolute value of the time delay ‘a’ should be less than n / 4 . It is noteworthy that this paper employs Python to conduct a 0–12 month lag cross-correlation analysis on the SPEI-1 of each grid point within the study area from 1980 to 2018 and the monthly atmospheric circulation data. Owing to the extensive data set, the range of correlation coefficient values was somewhat reduced. Studies indicate that although the correlation coefficients are low, their ability to pass the significance test means that we can discount results that are due to chance [24,44]. Thus, affirming the meaningfulness of the relationship between drought events and atmospheric circulation factors.

3. Results

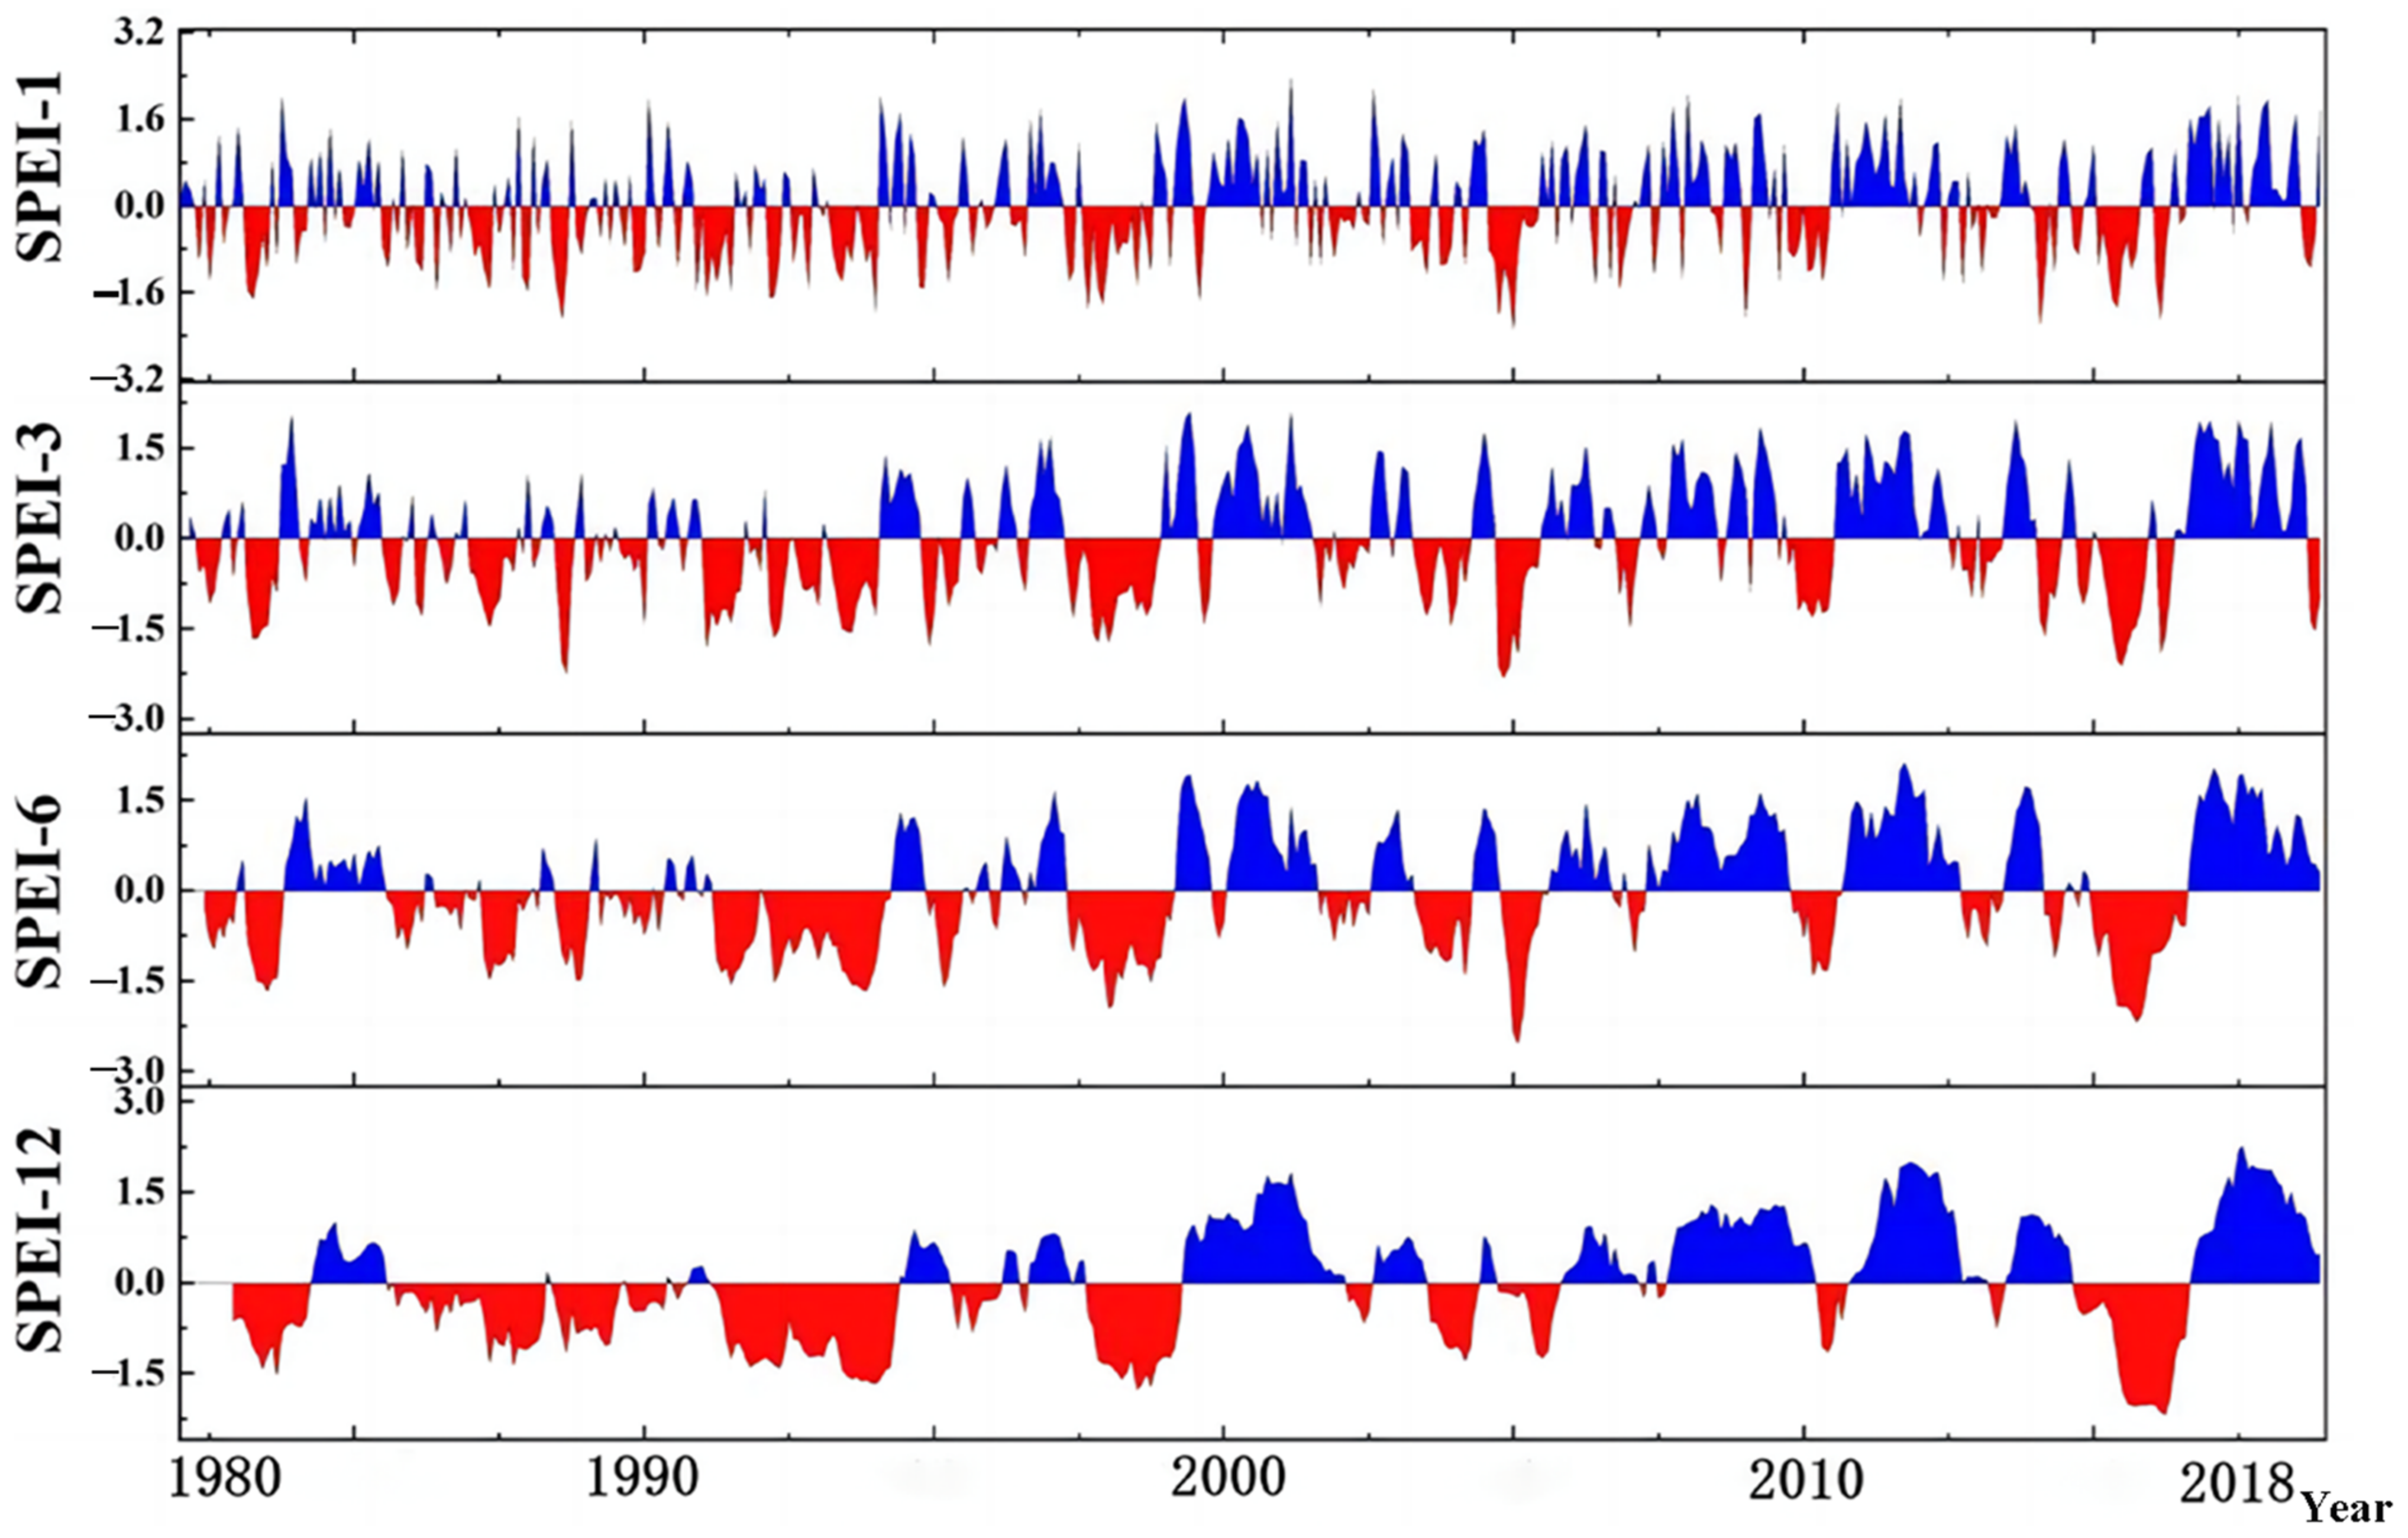
3.1. Temporal Variation Characteristics of LMRB Drought

This study identified meteorological drought events and their characteristics in the LMRB using the Run Theory. Figure 3 illustrates the variations in SPEI at 1, 3, 6, and 12 months throughout the study period (1980–2018).
As illustrated in the figure, the SPEI showcased distinct oscillations between positive and negative values, particularly on the temporal scales of 1 month and 3 months. Generally, with an increase in the time scales, the cumulative effects of the SPEI became more obvious with longer wet and dry periods. This observation implies that the LMRB undergoes frequent transitions between periods of dryness and wetness, both on a monthly and seasonal timeframe. From November to April of the subsequent year, the SPEI consistently showed negative values, indicating a period that was susceptible to meteorological drought. Moreover, it is evident that since 1990, there is a potential for meteorological drought events to occur in all months of the year, and the risk of meteorological drought in summer and autumn has escalated. From SPEI-6 and -12, it is apparent that the basin had significant and continuous negative values in 1983, 1987–1989, 1991–1993, 1998, 2004, 2005, 2009–2010, 2012–2013, and 2015–2016. This suggests that meteorological drought events may have transpired in these years. Furthermore, we have statistically analyzed the duration, severity, and intensity of drought across different SPEI time scales, culminating in the results presented in Table 4. Our findings indicate that with the extension of the SPEI time scale, both the duration and severity of meteorological drought events in the LMRB tend to increase. The average durations of SPEI-1, SPEI-3, SPEI-6, and SPEI-12 are 6, 10, 13, and 18 months, respectively. By classifying meteorological drought levels based on the SPEI (as shown in Table 3), and considering the temporal variability of SPEI-6 and SPEI-12 as depicted in Figure 3, it was revealed that for the meteorological drought events occurring in the LMRB during the periods of 1991–1993, 1998, and 2015–2016 (Table 4), the severity of these drought events surpassed the average level of previous years.

3.2. Spatial Variation Trend of LMRB Drought

In light of the distinct wet and dry seasons characteristic of the LMRB, this study proceeded to calculate the SPEI for both seasons within the basin, with a temporal resolution of May to October (wet season) and November to April of the following year (dry season), each spanning a 6-month period. To differentiate from the previously mentioned SPEI-6, the SPEI values for the dry and wet seasons in this study are denoted as SPEI-dry and SPEI-wet, respectively. Based on the drought classification criteria, this study categorized the drought events in the LMRB between 1980 and 2018 into various levels of drought severity. In particular, a drought event is categorized as mild when the SPEI value drops below −0.5 but remains above −1.0. A moderate drought is identified when the SPEI value is less than −1.0 but more than −1.5. A severe drought is recognized when the SPEI value is less than −1.5 but more than −2.0, and an extreme drought event is characterized by an SPEI value below −2.0. This section calculates and analyzes the spatial variations of SPEI-dry, SPEI-wet, and SPPEI-12 during the period of 1980–2018. The objective of this research was to portray the frequency of drought occurrences in the LMRB from 1980 to 2018 by evaluating the proportion of drought events across different levels of severity during the specified study period. Figure 4 visually demonstrates the spatial distribution of drought frequency at various severity levels within the LMRB.
By analyzing the occurrence frequencies of different levels of meteorological droughts during different time periods (rainy season, dry season, and interannual), it can be observed that the frequency of mild meteorological drought was the highest in this basin, followed by moderate, severe, and extreme meteorological drought events. Furthermore, the dry season served as the peak period for meteorological drought events. The frequencies of mild, moderate, severe, and extreme meteorological drought occurrences were 17.94% to 51.28%, 0% to 25.64%, 0% to 20.51%, and 0% to 10.25%, respectively (Figure 4e–h).
It is worth noting that the occurrence frequency of meteorological droughts was higher during the rainy season. The frequencies of mild, moderate, severe, and extreme meteorological drought occurrences during this period were 12.84% to 41.08%, 0% to 23.07%, 0% to 17.94%, and 0% to 10.25%, respectively, as shown in Figure 4a–d. Further statistical analysis and comparison of the different levels of meteorological drought occurring during the rainy season and dry season within the basin revealed the following patterns: After further statistical comparison of different levels of meteorological drought occurring during the wet and dry seasons within the basin, we found that during the wet season, the Three Rivers Source Region, the lower of the Lancang River, the Northern Plateau, and the Tonle Sap Lake Basin were high-incidence areas for mild meteorological drought; the Khorat Plateau was a high-incidence area for severe meteorological drought events, with a low frequency of extreme drought during the wet season, and occasional occurrences of extreme meteorological drought in the Long Mountains area, as shown in Figure 4a–d.
However, the spatial differentiation of different levels of meteorological drought events was more pronounced during the dry season. As can be seen from Figure 4e–h, the western parts of the Lancang River Basin, the Northern Plateau, and the Khorat Plateau were high-incidence areas for mild meteorological drought (Figure 4e) and severe meteorological drought (Figure 4f); the high-incidence area for severe meteorological drought events was the eastern part of the Northern Plateau (Figure 4g). Compared to the rainy season and dry season, at the annual scale within the basin, the occurrence frequency of different levels of meteorological drought was relatively average. The high-frequency zone for mild meteorological drought was located in the western parts of the Khorat Plateau and the Tonle Sap Lake Basin, as shown in Figure 4i. The western part of the Northern Plateau was the high-frequency zone for moderate meteorological drought (Figure 4j), while the lower reaches of the Lancang River were the high-frequency zone for severe meteorological drought (Figure 4k). By comparing the occurrence frequencies of meteorological drought in the same region at different time scales, we obtained the following information. Whether during the rainy season or dry season, the occurrence frequency of mild meteorological drought in the Lancang River basin was higher than in other areas of the basin, with an average occurrence rate of approximately 25%. The occurrence frequencies of moderate and severe meteorological droughts in the downstream area of the basin were higher than in the upstream area, primarily concentrated in the western parts of the Northern Plateau, Khorat Plateau, and Tonle Sap Lake Basin, as shown in Figure 4c,f,g.
It is worth noting that the upper reaches of the Lancang River basin, Khorat Plateau, Mekong Delta, and the central part of the Tonle Sap Lake Basin were high-frequency zones for extreme meteorological drought events. We observed that extreme meteorological drought events primarily occurred in the Khorat Plateau, Tonle Sap Lake Basin, and Mekong Delta during the rainy season, with occurrence frequencies that ranged from 2.5% to 10.25%, as shown in Figure 4d. On an annual scale, the upper reaches of the Lancang River Basin, and the northern and eastern parts of the Khorat Plateau, had a frequency of extreme meteorological drought events ranging from 2.5% to 10.25%, which was higher than other areas, as shown in Figure 4i. In summary, the LMRB has the highest frequency of mild meteorological drought, with nearly the entire basin experiencing such events from 1980 to 2018. At the same time, the high-incidence areas for moderate and severe meteorological drought were concentrated in the Northern Plateau and the Khorat Plateau. Extreme meteorological drought events (SPEI < −2) occurred throughout the basin between 1980 and 2018, with a frequency of 0 to 10.26%, and the incidence of extreme drought events (SPEI < −2) was notably prevalent in the upper reaches of the Lancang River, Khorat plateau, Tonle Sap Lake Basin, and the Mekong Delta (Figure 4c,f,j,k). It is noteworthy that despite the LMRB being situated in the heart of the Asian tropical monsoon region, and being influenced by the southwest monsoon from May to the end of September characterized by high humidity and heavy rainfall, meteorological drought events still persisted (Figure 4a–h).

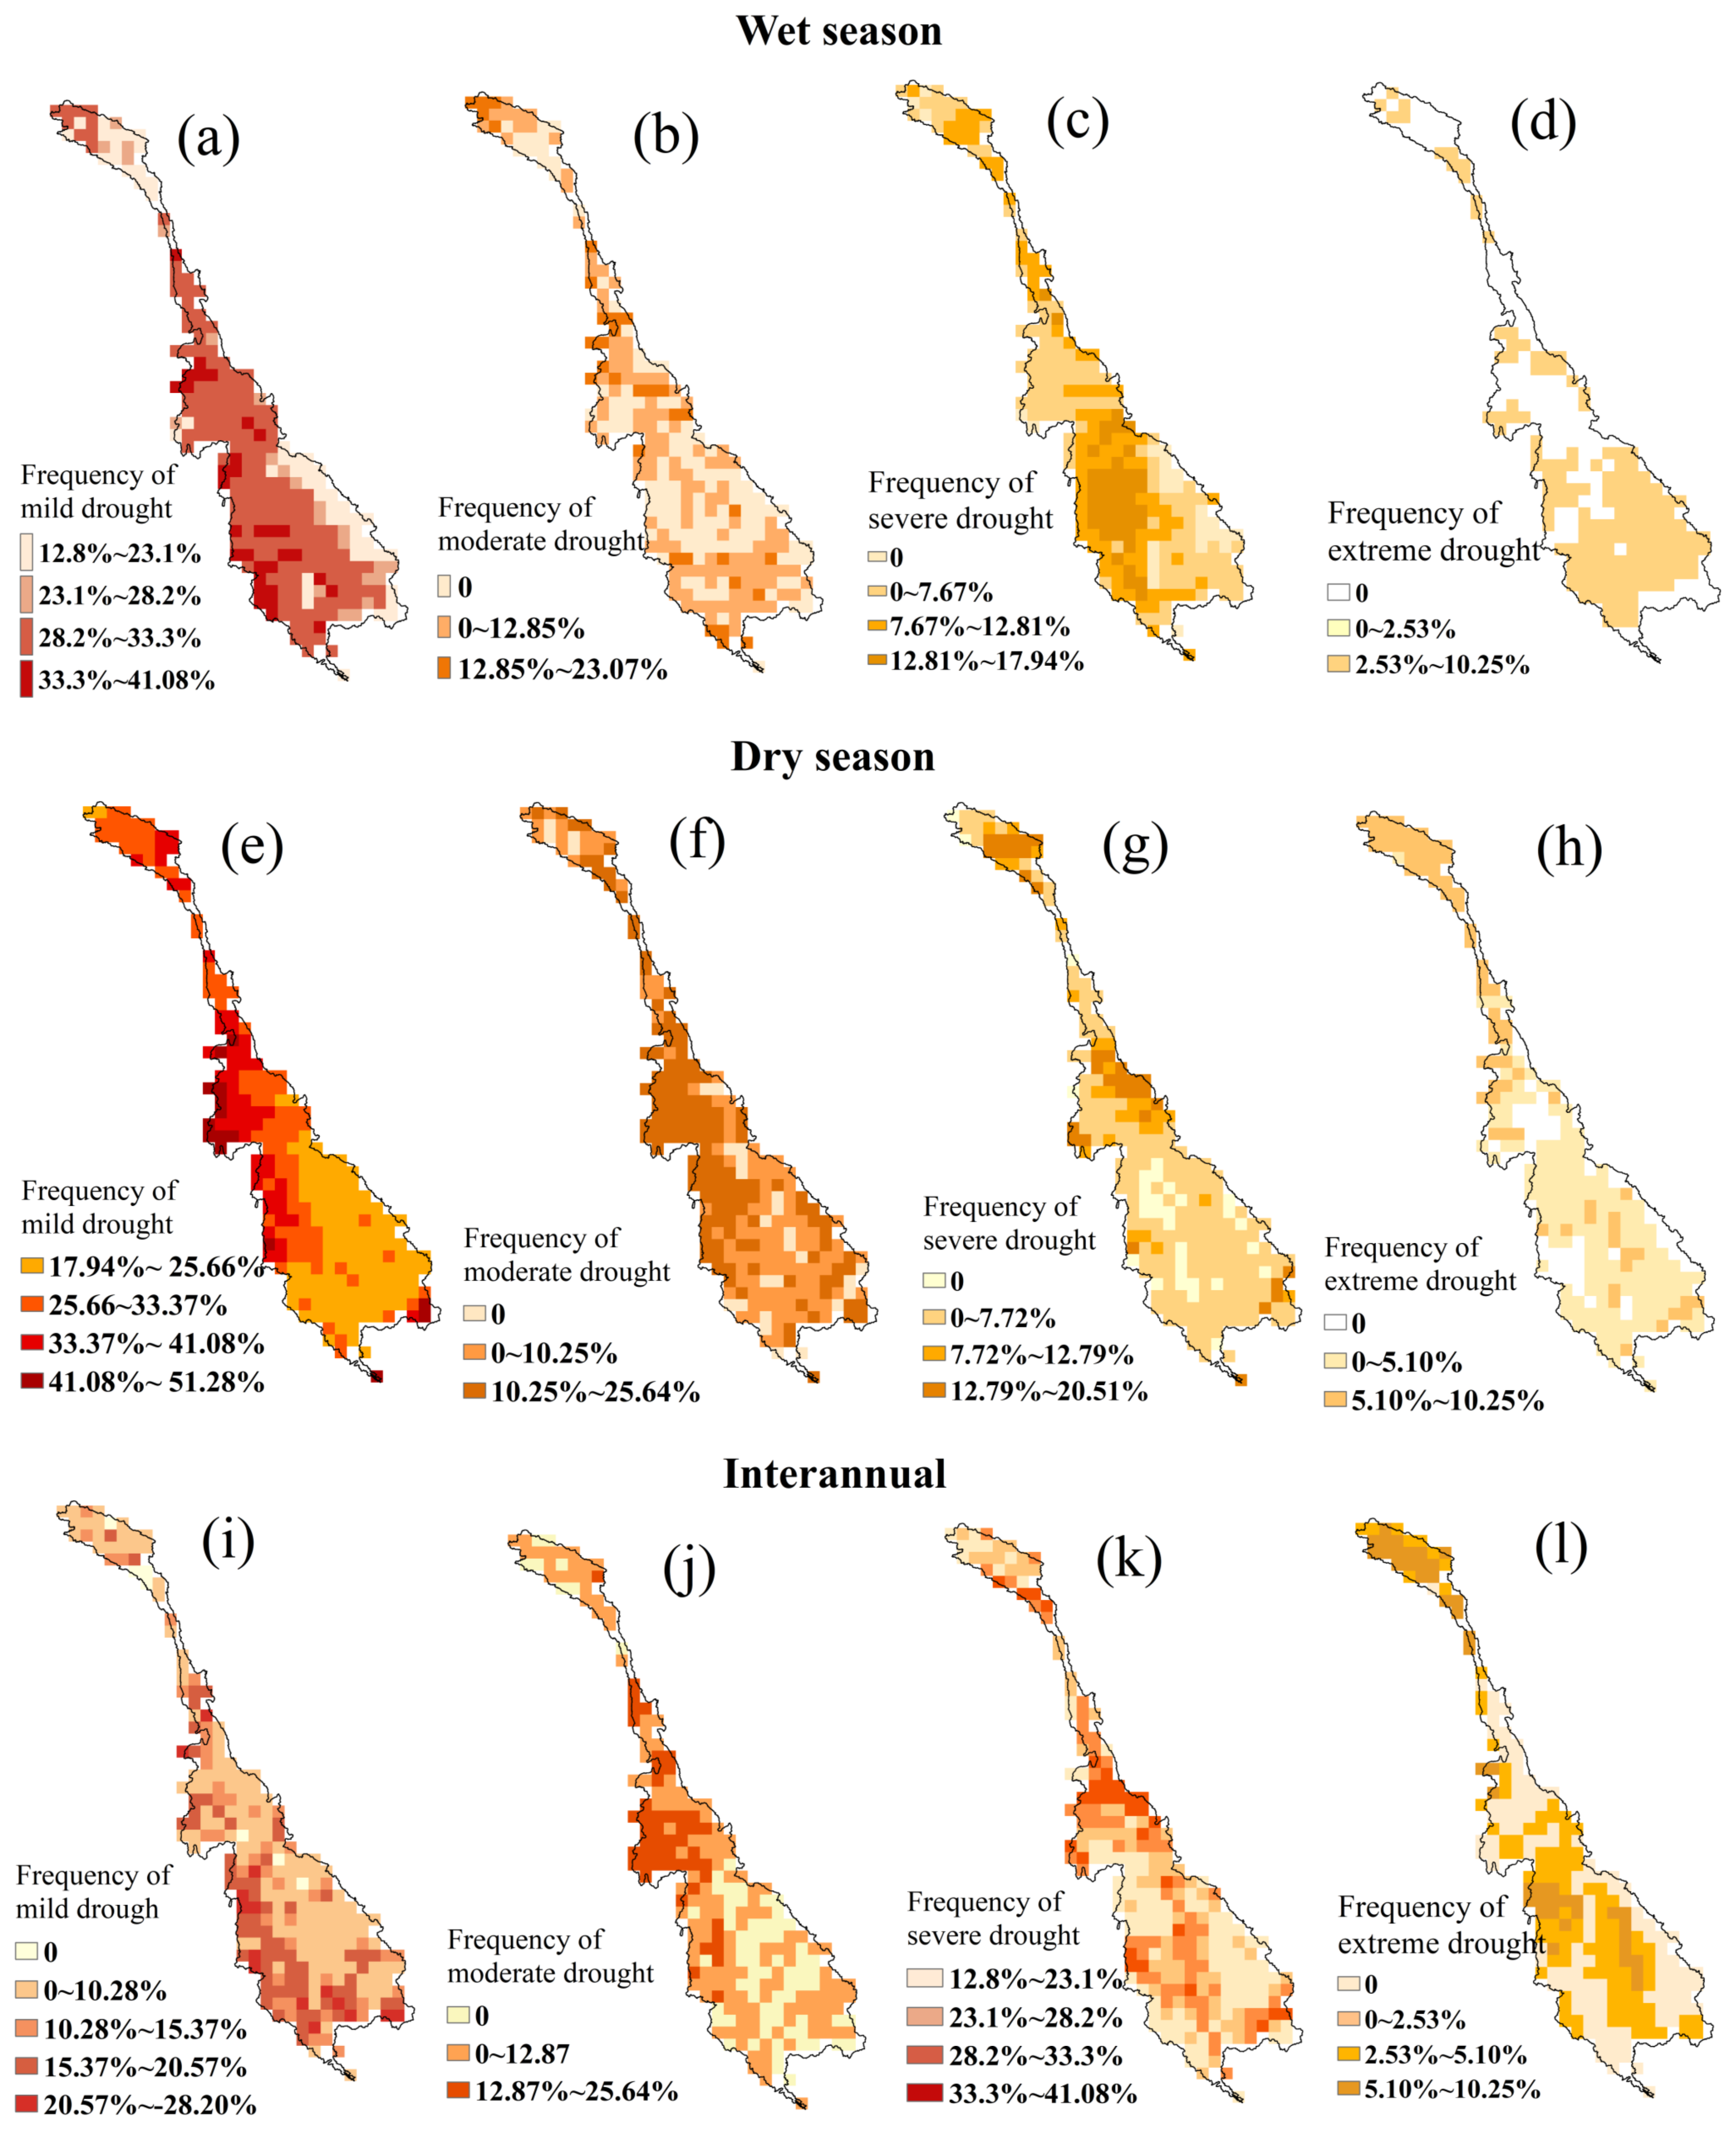
3.3. Spatial Variation of Drought Trends in Dry and Wet Season

Based on the aforementioned analysis, it is evident that meteorological drought occurrences are apparent in the LMRB, even during the rainy season. Therefore, we calculated and analyzed the trends of SPEI-dry, SPEI-wet, and SPEI-12 using the Mann–Kendall trend test. This study further analyzed the dry-wet trend in the basin during the dry season and rainy season, and annually (Figure 5).
From the preceding analysis, it was evident that meteorological drought events transpired in the LMRB even during the rainy season. Therefore, this study further analyzed the dry-wet changes in the basin during the dry season and rainy season, and annually (Figure 5a,b). During the rainy season, the drought trends in the Long Mountains region of the basin, as well as in the Tonle Sap Lake Basin and Mekong Delta, were statistically significant (p < 0.01), while the Northern Plateau region showed a significant moistening trend (p < 0.05), as shown in Figure 5a. During the dry season, the upper reaches of the LMRB, as well as the Khorat Plateau and the central part of the Tonle Sap Lake Basin, exhibited a drying trend, while the Northern Plateau showed a moistening trend, although not statistically significant, as shown in Figure 5b. This also indicated that the changes in wetness during the rainy season were more pronounced in the LMRB, as shown in Figure 5a. Further investigation showed that, regardless of the season, the northern plains within the basin (encompassing Myanmar, southern Laos, and southern Thailand) demonstrated a significant trend towards wetter conditions, as shown in Figure 5a,b. On an annual scale, the dry-wet changes in the LMRB aligned closely with those observed during the wet season, as shown in Figure 5c. The middle and lower reaches of the Lancang River, the eastern segment of the Khorat Plateau, the Tonle Sap Lake Basin, and the Mekong Delta revealed a discernible propensity towards drought (p < 0.01), while the northern plateau exhibited a pronounced trend towards wetter conditions (p < 0.01). The dry-wet change trends in other areas were not significant, as shown in Figure 5c. Therefore, overall, the changes in dryness and wetness in the basin showed spatial heterogeneity. The northern region has abundant precipitation and large river flow, and the trend of wet changes is becoming more significant. Nevertheless, during both the dry and rainy seasons, key areas with elevated water demand, such as fisheries and agriculture, exhibit a noteworthy trend towards desertification, such as the Mekong Delta. Therefore, in these regions where there is a significant differentiation between dryness and wetness, the possibility of suffering from drought/flood disasters will increase.

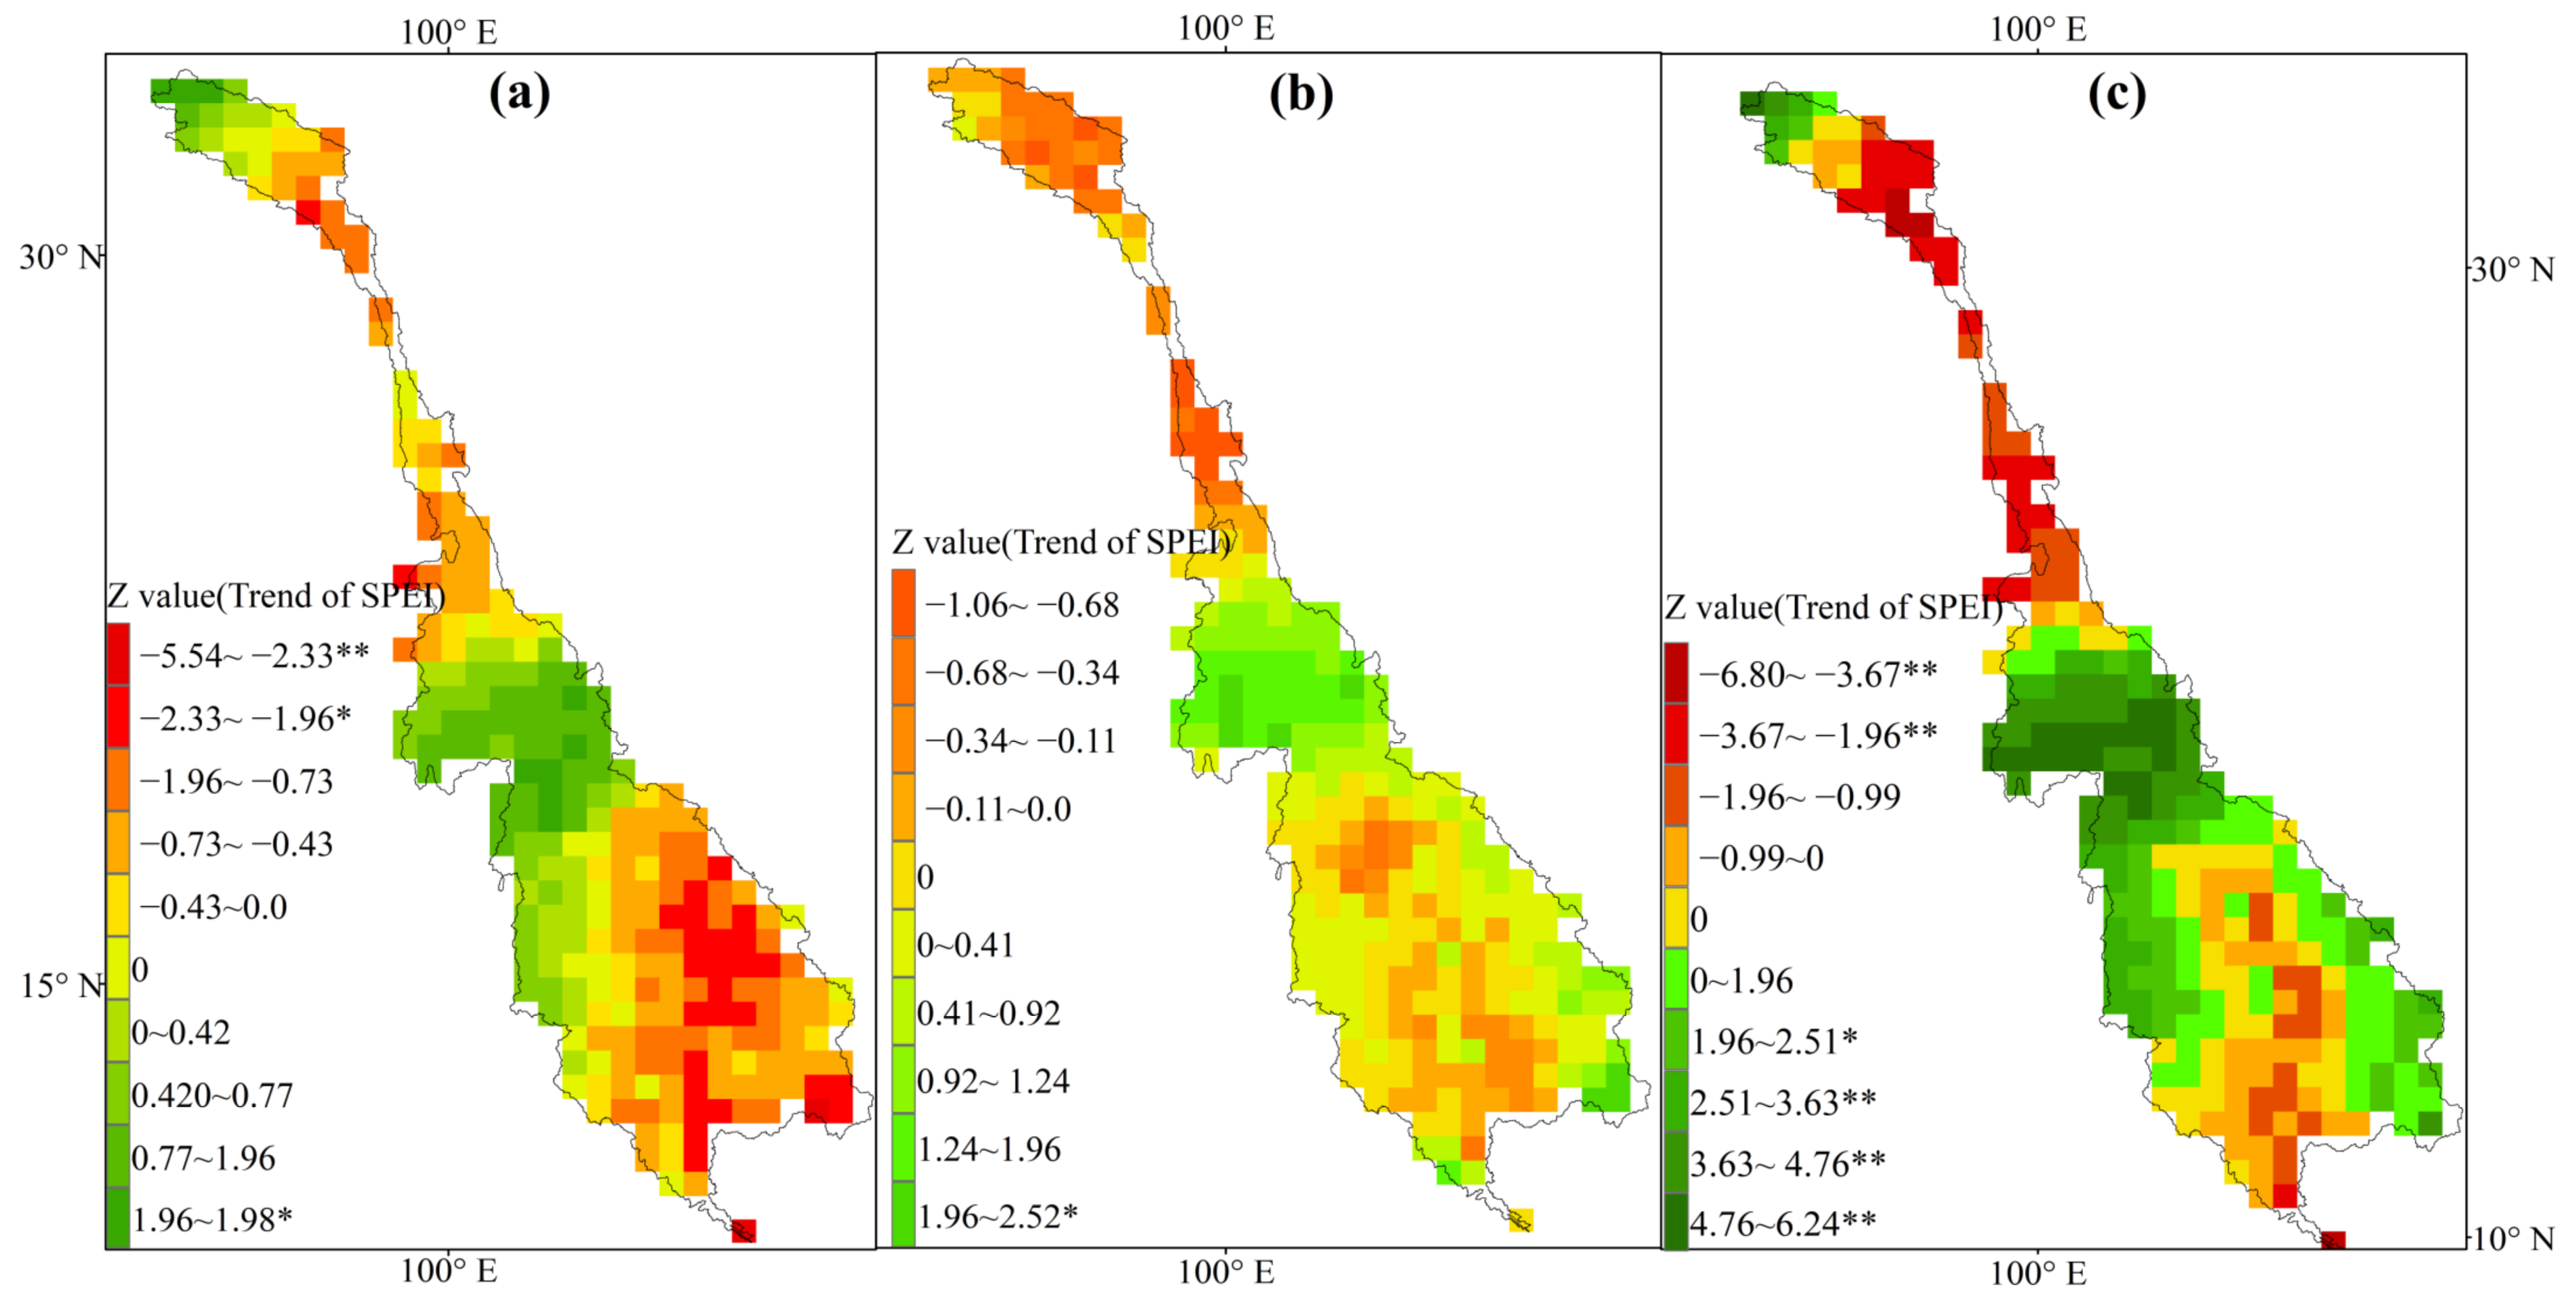
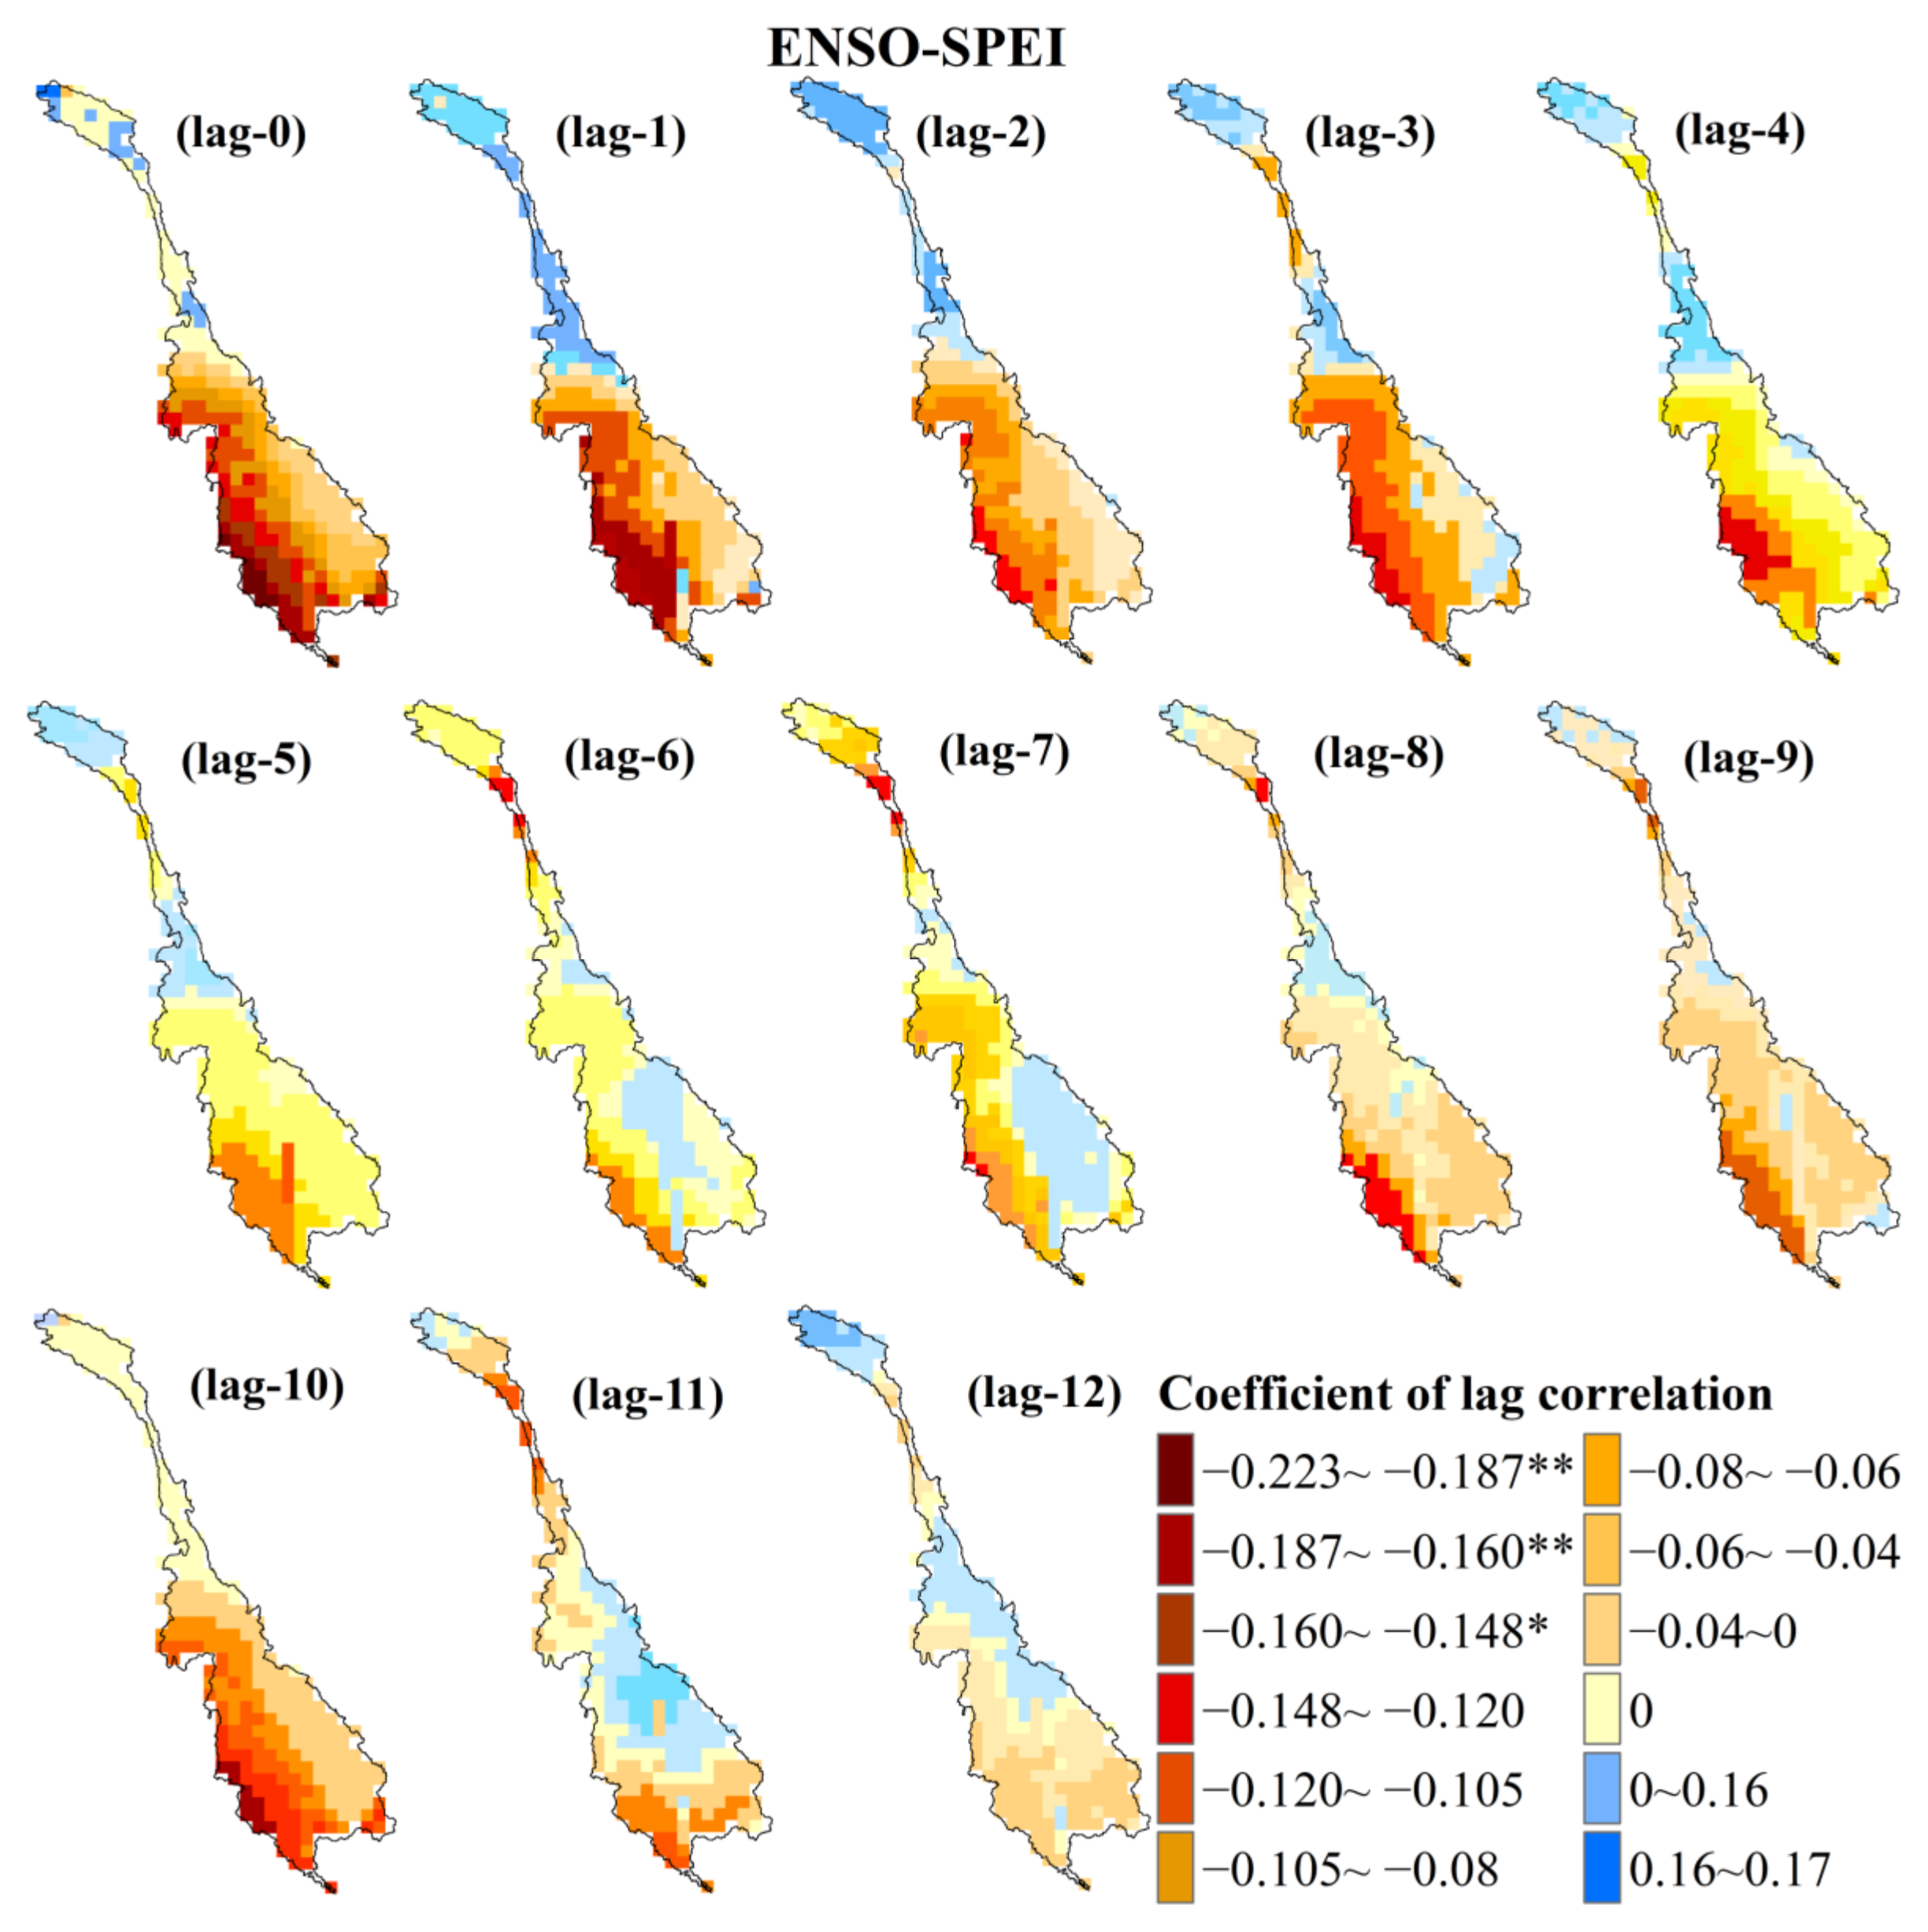
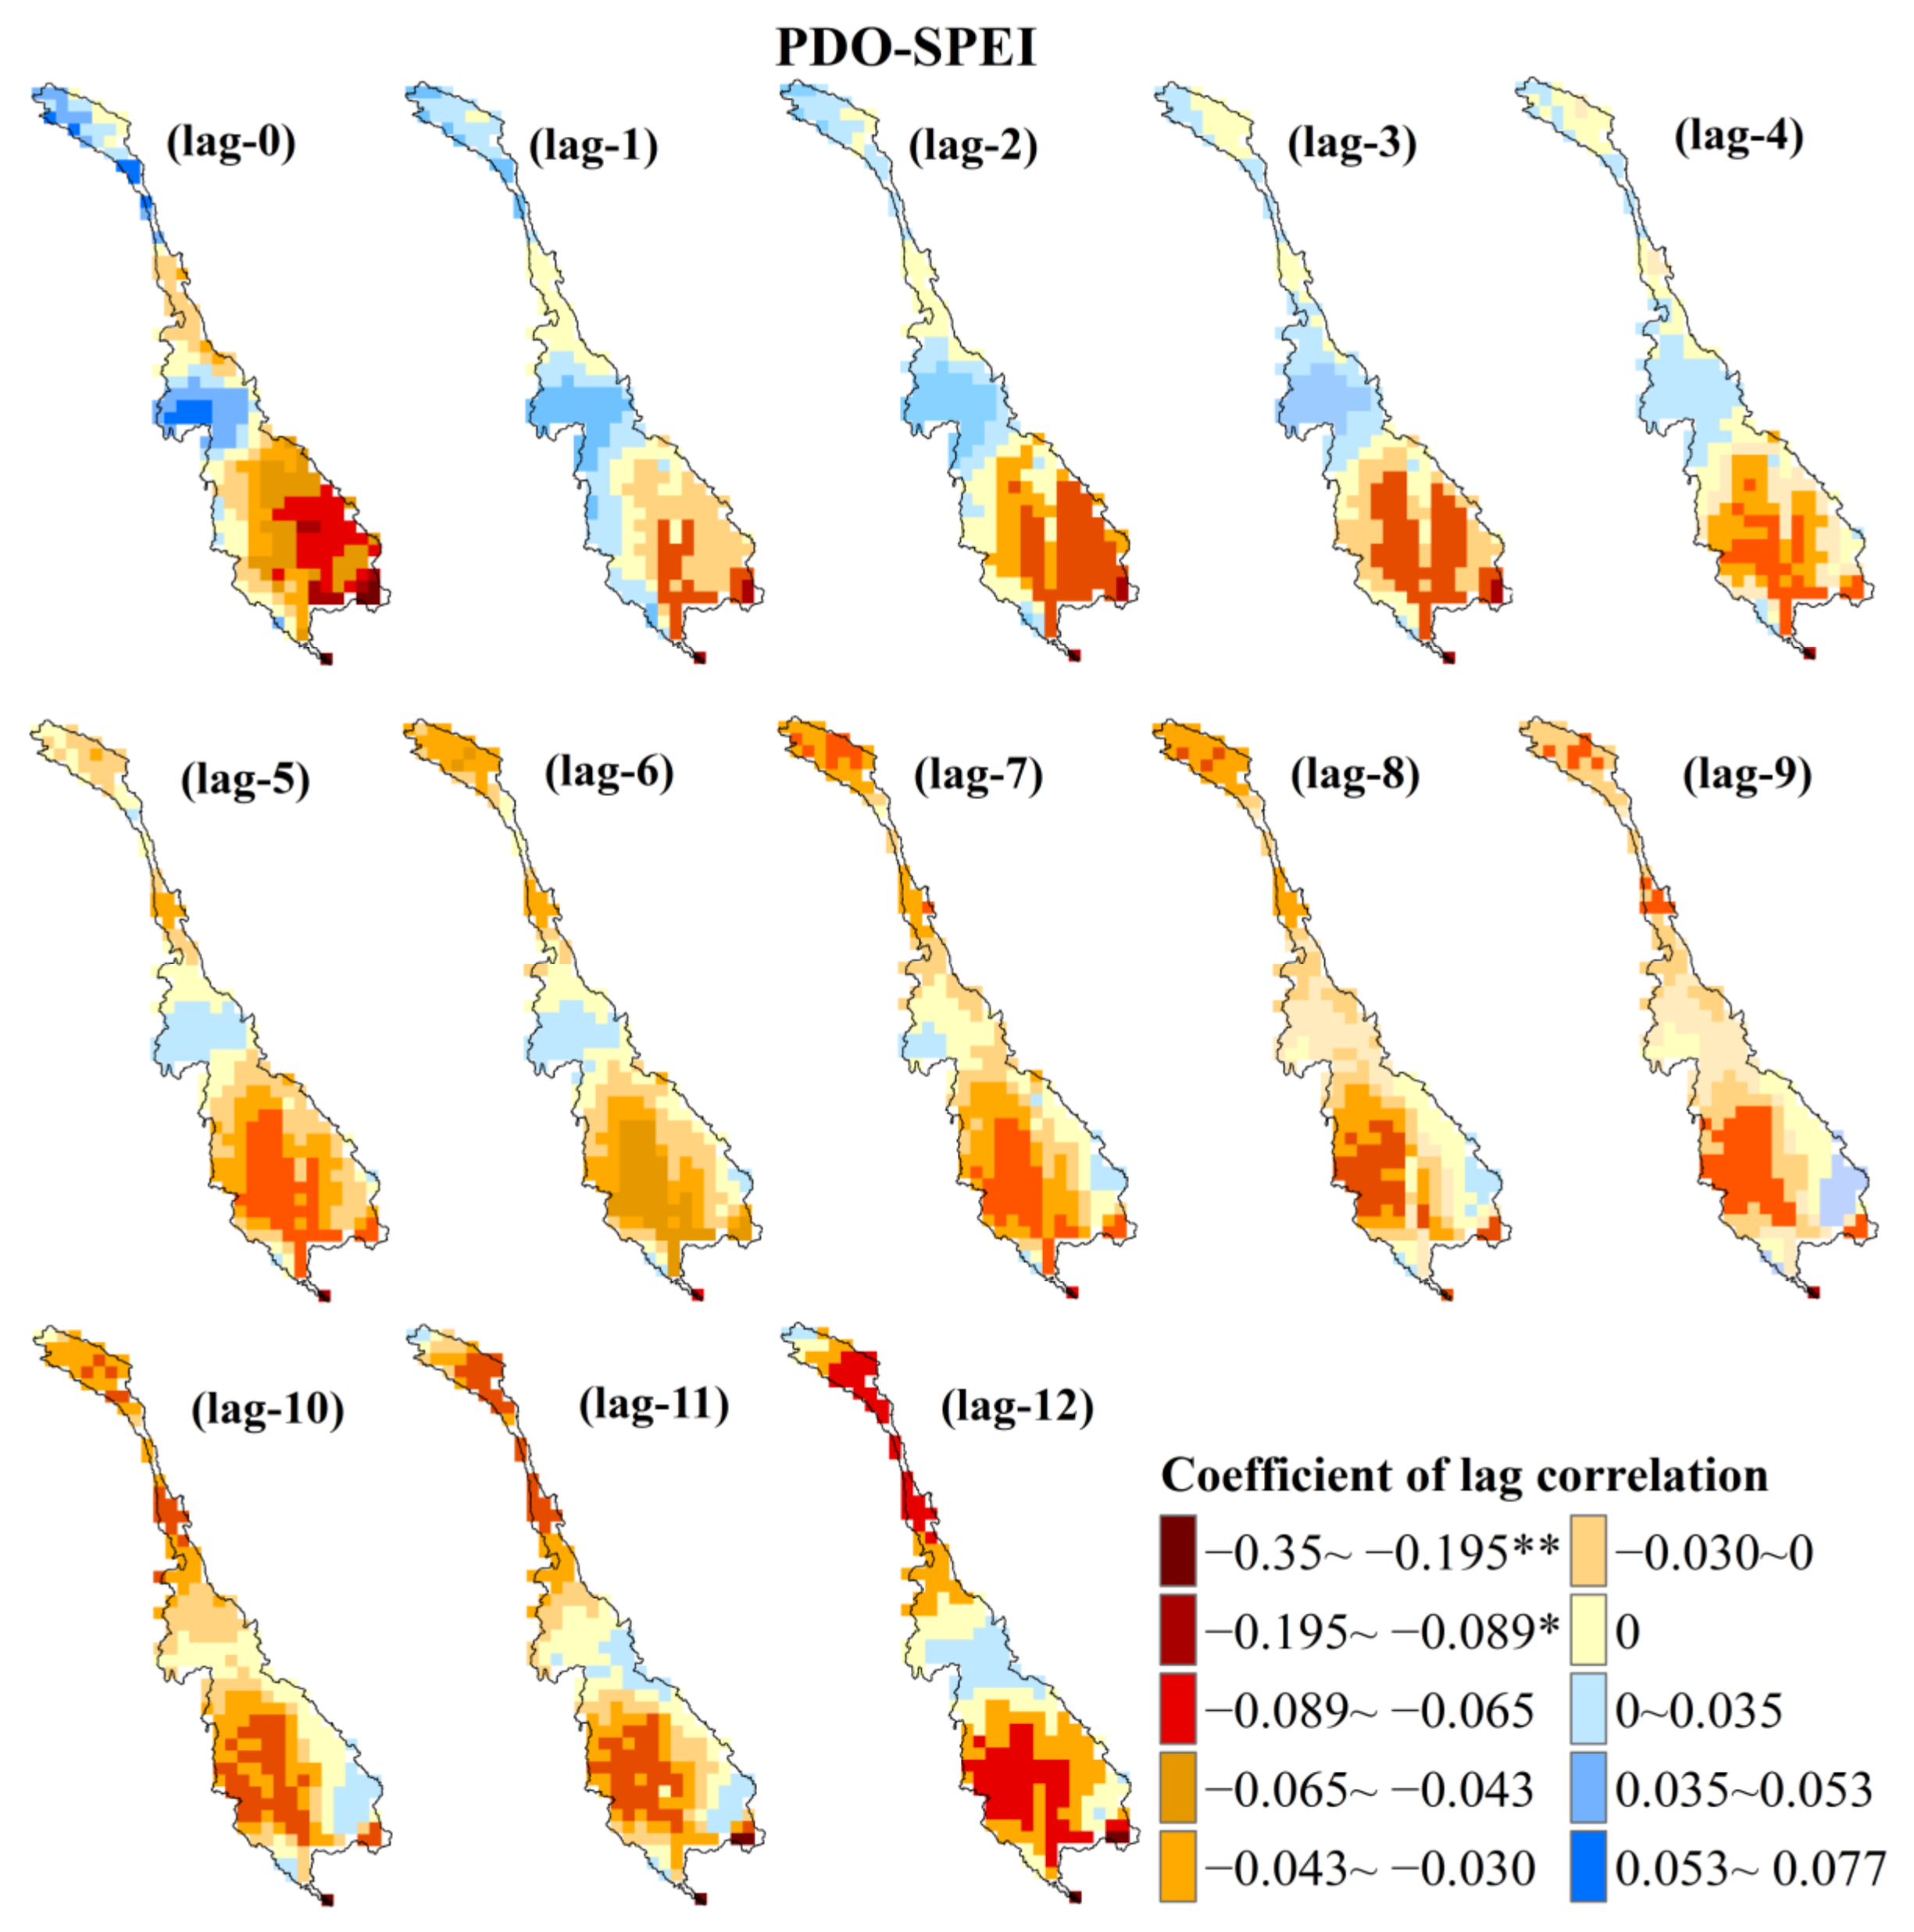
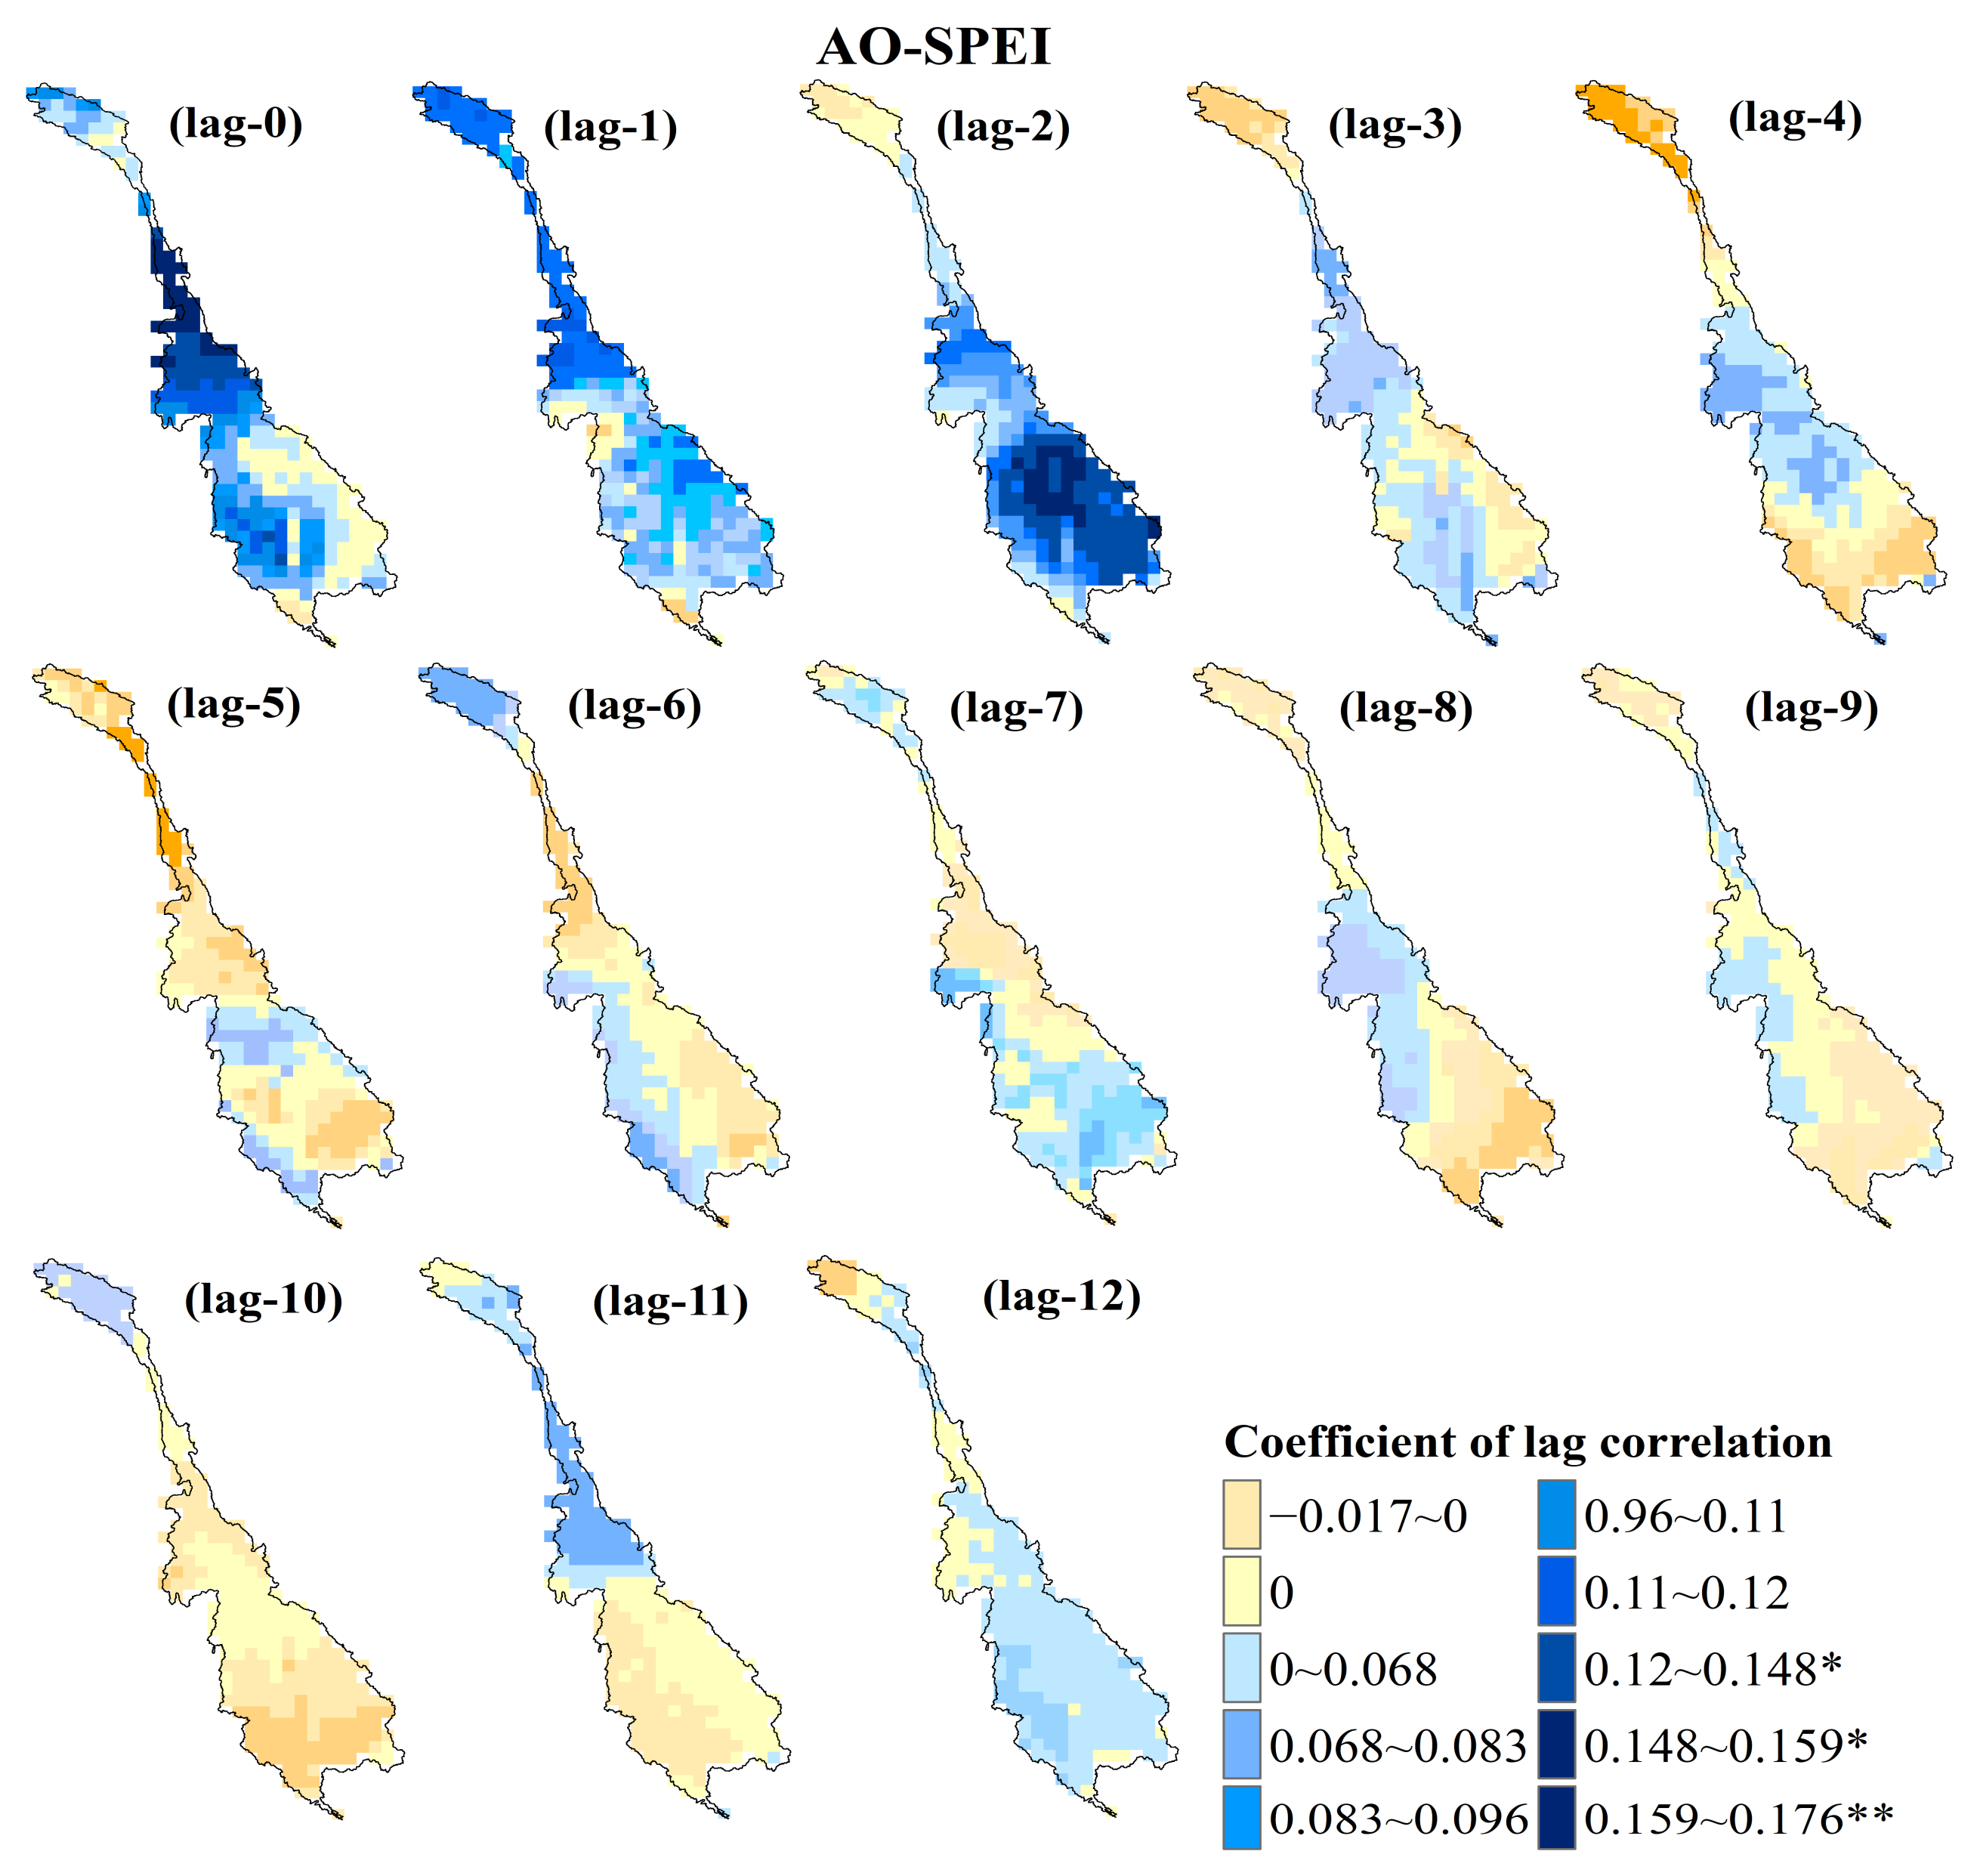
3.4. Response of the Meteorological Drought to Atmospheric Circulations

The influence of atmospheric circulation factors on meteorological elements such as precipitation and temperature is a continuous process. It requires a certain amount of time to culminate in a meteorological drought event, a phenomenon referred to as “lag response” [24]. Therefore, this study aimed to explore the long-distance connection between the changes in monthly atmospheric circulation factors (ENSO, NAO, AO, and PDO) and meteorological drought events (SPEI-1) in the LMRB. This was achieved by establishing the lag correlation between these factors and meteorological drought events and visualizing the spatial distribution using GIS.
As depicted in Figure 6, Figure 7, Figure 8 and Figure 9 the lag correlation between atmospheric circulation factors and meteorological drought events in the LMRB demonstrated a descending order of response strength from the ENSO, AO, and NAO to PDO. Specifically, the meteorological drought events in the LMRB were most sensitive to the ENSO, as shown in Figure 6. In particular, the western regions of the Mekong River basin (western Northern Plateau, western Khorat Plateau, western Tonle Sap Lake Basin, and Mekong Delta) exhibited synchronous meteorological drought events with the ENSO, showing a negative correlation (p < 0.05), as shown in Figure 6 (lag-0). From the spatial distribution of the lagged cross-correlation between the ENSO and meteorological drought, we observed that meteorological drought in the Lancang River basin exhibited a positive lagged correlation with the ENSO. On the other hand, meteorological drought in the Mekong River basin showed a negative lagged correlation with the ENSO.
Specifically, the strongest negative lagged correlation was observed on the western bank of the Mekong River, and the lagged correlation gradually decreased from west to east along the western bank of the Mekong River, as shown in Figure 6 (lag-0–lag-5). As the lag time between the ENSO and meteorological drought increased, the area exhibiting a positive lagged correlation between the two gradually expanded. However, the significance level did not pass the statistical test, as shown in Figure 6 (lag-0–lag-12).
The lagged positive correlation between the AO, NAO, and the meteorological drought events in the LMRB was more significant, as shown in Figure 7 and Figure 8. The meteorological drought in the LMRB exhibited the strongest positive correlation with the AO at a lag of 0–2 months, as depicted in Figure 7 (lag-0–lag-2). As the lag time between meteorological drought and the AO increased, the lagged negative correlation between the two decreased, as shown in Figure 7 (lag-3–lag-12). In the lower regions of the Lancang River basin, meteorological drought events exhibited synchronous behavior with the AO at a significant level (p < 0.01), as illustrated in Figure 7 (lag-0). Conversely, in the Khorat Plateau, Long Mountains, and Tonle Sap Lake Basin of the Mekong River basin, meteorological drought events displayed a significant correlation with a lag of 2 months to the AO (p < 0.01), as depicted in Figure 7 (lag-2).
In contrast to the AO, although meteorological drought in the LMRB exhibited a relatively strong positive correlation with the NAO at a lag of 0–2 months, the area demonstrating significantly lagged cross-correlation was smaller, as shown in Figure 7 (lag-0–lag-2) and Figure 8 (lag-0–lag-2). Notably, a significant positive lagged correlation was observed between meteorological drought occurrences in the lower regions of the Lancang River basin and the southern Long Mountains with the NAO, with respective lag times of 1 and 2 months, as depicted in Figure 8 (lag-1–lag-2). As the lag time increased, the area within the basin exhibiting a positive correlation between meteorological drought and the NAO gradually expanded. When the lag time reached 10 months, the region with a positive correlation between the two variables was maximized, although it did not pass the significance test, Figure 8 (lag-0–lag-10). The lagged negative correlation between the PDO and the meteorological drought events in the LMRB was more significant. In meteorological drought events in the lower reaches of the Mekong River, particularly in the northern part of the Long Mountains, there was synchrony with the PAO, displaying a significant negative correlation (p < 0.01), as illustrated in Figure 9. Based on the research results, monitoring the ENSO, AO, NAO, and PDO, and their synchronization or lag with meteorological drought can help in proactively intervening and preventing drought events in the basin.

4. Discussion

This study utilized CRU data and applied the multi-time scale SPEI (1-, 3-, 6-, 12-month) and run theory to analyze the spatio-temporal variation characteristics of meteorological drought in the LMRB. The findings revealed that meteorological drought events occurred frequently in the basin in recent years, particularly during the periods of 2004–2005, 2009–2010, 2012–2013, and 2015–2016, with long durations and severe drought conditions. These results are consistent with the historical natural disaster records of the LMRB in the international disaster database (https://public.emdat.be/data/ accessed on 1 October 2023) and with the results of previous studies [27,29]. In addition, by comparing the frequency and spatial distribution characteristics of meteorological drought events in the rainy season and dry season, and interannually in the LMRB, it was observed that even during the rainy season, meteorological drought events still occurred in the basin. During the dry season, the frequency of meteorological droughts increased, particularly impacting the upstream areas of the basin, such as Thailand, eastern Cambodia, and Vietnam. These findings are consistent with previous results [31,48], and they also verify the applicability of the research methods and data used in this study in the LMRB.
The LMRB is a crucial transboundary river, and the socio-economic development of the riparian countries is heavily reliant on its water resources, with agricultural usage comprising over 80% of the total water consumption [4,42]. However, due to uneven water resource distribution and differences in technological levels, the overall development level of water resources in the basin is not high [28,49]. Meanwhile, the uneven distribution of precipitation in the LMRB, compounded by the impact of climate change, has led to frequent meteorological drought events in the basin. These events pose severe threats and have significant impacts on socio-economic development and production activities within the basin [25,30]. According to the land use situation in the LMRB (Figure 1c), and the spatial characteristics of the frequency of meteorological drought events of different severities (Figure 4), it can be seen that the Khorat Plateau and the Tonle Sap Lake Basin, as part of the Mekong Delta region, are agricultural planting areas. However, these areas frequently experience meteorological drought events, especially the Mekong Delta region, which shows a significant trend of aridification (Figure 5), increasing the risk of agricultural planting.
According to the irrigation water use in the dry and rainy seasons in 2018 (Table 5), it can be seen that in 2018, the irrigation water used in the dry season accounted for the majority of the total water use in all basin countries except Thailand. However, the water production within each basin country can support the current irrigation demand for crop development so far (Table 5). Although Laos has abundant surface water resources, there are few agricultural irrigation projects. Currently, there are over 700,000 hectares of arable land, with a maximum irrigation area of 150,000 hectares during the wet season and only 4% of the arable land can be irrigated during the dry season. Thailand has an existing irrigation area of about 500,000 hectares, with an actual irrigation rate of less than 6% for arable land. Vietnam’s Mekong River Basin, within its territory, has rich water energy reserves. Due to the serious problem of seawater intrusion in Vietnam, a large amount of freshwater resources need to be consumed, leaving a small amount of water available for use. Therefore, Vietnam mainly utilizes the water resources of the Mekong River for agricultural irrigation, with about 2.4 million hectares of arable land and only 500,000 hectares of irrigable area. These are issues that deserve attention, especially during meteorological droughts, which can pose greater risks. Vietnam’s water use in the dry season has already exceeded its capacity. Considering that the dry season is the peak period for agricultural water use in the Mekong River Basin [25,32], and our research has found that the main areas with high water demand for fisheries and agriculture in the basin in recent years have shown a significant trend of drought, these areas are more likely to be affected and threatened when a meteorological drought occurs in the basin. Therefore, it is recommended that all regions in the basin properly manage the seasonal allocation of water resources to ensure the agricultural production and water resource security of each community and improve their ability to cope with Meteorological drought [50,51].
The prediction of meteorological drought occurrence and development is of great significance for implementing drought mitigation measures and ensuring the sustainable development of water resources and ecosystems in the LMRB [33]. The ENSO phenomenon is the most important predictable source of drought in many areas worldwide, characterized by its stable cycle and strong persistence [52]. Our results also indicate that the meteorological drought in the LMRB is most sensitive to the ENSO, showing synchronicity. Therefore, the ENSO can serve as a crucial early warning signal for meteorological drought in the basin, effectively forecasting and intervening in meteorological drought, thereby providing support for drought assessment, drought prediction, and early warning in this region [53,54]. It is recommended to fully utilize the synchronicity between meteorological drought in the LMRB and the ENSO for effective monitoring and forecasting of meteorological drought [55]. Long-term drought forecasts are crucial for proactive measures, including adjusting and optimizing crop planting strategies. For regions at high drought risk, planting drought-resistant crops is recommended [56]. In areas with medium to low drought risk, it is advisable to consider planting crops with higher water demand [42]. Additionally, it is important to expedite the selection and cultivation of drought-resistant crops with specific genes [57,58]. Modern technologies such as seawater irrigation and seawater crop cultivation can also be employed in agricultural drought prevention and control [51,59], and can also be a topic worthy of in-depth research.

5. Conclusions

The present study determined variations and the trends of SPEI throughout the LMRB during 1980–2018 in the rainy season, dry season, and annual scale. The annual variations of SPEI were related to four atmospheric circulation factors. The major conclusions were:
(1)
During the research period (1980–2018), the LMRB experienced frequent dry and wet changes on a monthly and seasonal scale. November to April of the following year is a period prone to meteorological drought. Especially after 1990, the distinction between dry and wet years became more pronounced. The risk of meteorological drought events increased annually, especially in 2015 with greater intensity than in previous years, posing a significant threat to the basin.
(2)
The LMRB has well-defined dry and wet seasons, with the southwest monsoon bringing humidity and rainfall from May until the end of September. However, meteorological drought events continue to persist, particularly in the western region of the Khorat Plateau, the Tonle Sap Lake Basin, where a drought trend has been observed. These areas correspond to the main agricultural areas in the basin. The frequency of severe and extreme meteorological droughts during the dry season has significantly risen, particularly in the upper reaches of the Lancang River and western Khorat Plateau. In comparison to other regions, this area experiences a higher frequency of severe meteorological droughts, accounting for approximately 10% of occurrences.
(3)
There are differences in the response relationship between meteorological drought events in the LMRB and different atmospheric circulations (ENSO, AO, NAO, and PAO), with the strongest response being observed between the ENSO and meteorological drought events in the basin. Specifically, meteorological drought events occurring in the Northern Plateau, western parts of the Khorat Plateau, western parts of the Tonle Sap Lake Basin, and the Mekong Delta exhibit synchronicity with the ENSO. Meteorological drought events in the lower regions of the Lancang River basin show synchronicity with the AO, and there is a significant correlation between meteorological drought events in the Long Mountains and a lag of 2 months in the AO.
This study provides valuable insights for predicting meteorological drought in the LMRB by analyzing the teleconnections between atmospheric circulation and drought. Especially, the areas prone to meteorological drought and high-risk areas in the LMRB coincide with the main agricultural areas in the basin, increasing the risk of agricultural planting and production activities. Based on the above results, we can monitor the ENSO, AO, NAO, and PDO and their synchronicity or lag with meteorological drought, intervene and prevent meteorological drought events in the basin in advance, and provide beneficial scientific support for effective water resource management in the basin.

Author Contributions

Conceptualization, L.F. and Y.W.; methodology, L.F.; validation, L.F. and Y.W.; formal analysis, L.F.; investigation, L.F.; resources, L.F.; data curation, L.F.; writing—original draft preparation, L.F. and Y.W.; writing—review and editing, L.F., Y.W. and C.C.; project administration, Y.W. and W.C. All authors have read and agreed to the published version of the manuscript.

Funding

This research was funded by the Jiangsu Province Natural resources Science and Technology Project, grant number 2022016; Jiangsu Natural Resources Development Special Fund for Marine Science and Technology Innovation, grant number JSZRHYKJ202205; the National Natural Science Foundation of China, grant number 42177065; the Key R&D Project of Guangdong Province, grant number 2020B1111530001; and Guangdong Foundation for Program of Science and Technology Research, grant numbers 2019B121201004, 2019QN01L682, the National Key Research and Development Project, grant number 2023YFC3205701, and the GDAS Special Project of Science and Technology Development, grant number 2020GDASYL-20200102013.

Institutional Review Board Statement

Not applicable.

Informed Consent Statement

Not applicable.

Data Availability Statement

Publicly available datasets were analyzed in this study. This data can be found here: Climatic Research Unit TS v.4.03 (CRU) database (https://crudata.uea.ac.uk/cru/data/hrg/cru_ts_4.03/ accessed on 1 January 2021), the international disaster database (https://public.emdat.be/data/ accessed on 1 October 2023).

Acknowledgments

We are thankful to authors for their helpful discussions and feedback throughout the research process. We extend our appreciation to the anonymous reviewers for their constructive comments that greatly improved the quality of this manuscript.

Conflicts of Interest

The authors declare no conflict of interest.

References

  1. Ayugi, B.; Tan, G.; Niu, R.; Dong, Z.; Ojara, M.; Mumo, L.; Babaousmail, H.; Ongoma, V. Evaluation of Meteorological Drought and Flood Scenarios over Kenya, East Africa. Atmosphere 2020, 11, 307. [Google Scholar] [CrossRef]
  2. Wang, F.; Lai, H.; Li, Y.; Feng, K.; Zhang, Z.; Tian, Q.; Zhu, X.; Yang, H. Dynamic variation of meteorological drought and its relationships with agricultural drought across China. Agric. Water Manag. 2022, 261, 107301. [Google Scholar] [CrossRef]
  3. Tan, Y.X.; Ng, J.L.; Huang, Y.F. Quantitative analysis of input data uncertainty for SPI and SPEI in Peninsular Malaysia based on the bootstrap method. Hydrol. Sci. J. 2023, 68, 1724–1737. [Google Scholar] [CrossRef]
  4. Li, Q.; Zeng, T.; Chen, Q.; Han, X.; Weng, X.; He, P.; Zhou, Z.; Du, Y. Spatio-temporal changes in daily extreme precipitation for the Lancang–Mekong River Basin. Nat. Hazards 2022, 115, 641–672. [Google Scholar] [CrossRef]
  5. Lehner, B.; Döll, P.; Alcamo, J.; Henrichs, T.; Kaspar, F. Estimating the Impact of Global Change on Flood and Drought Risks in Europe: A Continental, Integrated Analysis. Clim. Chang. 2006, 75, 273–299. [Google Scholar] [CrossRef]
  6. Stagge, J.H.; Kohn, I.; Tallaksen, L.M.; Stahl, K. Modeling drought impact occurrence based on meteorological drought indices in Europe. J. Hydrol. 2015, 530, 37–50. [Google Scholar] [CrossRef]
  7. Luo, X.; Luo, X.; Ji, X.; Ming, W.; Wang, L.; Xiao, X.; Xu, J.; Liu, Y.; Li, Y. Meteorological and hydrological droughts in the Lancang-Mekong River Basin: Spatiotemporal patterns and propagation. Atmos. Res. 2023, 293, 106913. [Google Scholar] [CrossRef]
  8. Hao, Z.; Singh, V.P. Drought characterization from a multivariate perspective: A review. J. Hydrol. 2015, 527, 668–678. [Google Scholar] [CrossRef]
  9. Won, J.; Choi, J.; Lee, O.; Kim, S. Copula-based Joint Drought Index using SPI and EDDI and its application to climate change. Sci. Total Environ. 2020, 744, 140701. [Google Scholar] [CrossRef]
  10. Zhao, H.; Gao, G.; An, W.; Zou, X.; Li, H.; Hou, M. Timescale differences between SC-PDSI and SPEI for drought monitoring in China. Phys. Chem. Earth Parts A/B/C 2017, 102, 48–58. [Google Scholar] [CrossRef]
  11. Stagge, J.H.; Tallaksen, L.M.; Gudmundsson, L.; Van Loon, A.F.; Stahl, K. Candidate Distributions for Climatological Drought Indices (SPI and SPEI). Int. J. Climatol. 2015, 35, 4027–4040. [Google Scholar] [CrossRef]
  12. Spinoni, J.; Barbosa, P.; De Jager, A.; McCormick, N.; Naumann, G.; Vogt, J.V.; Magni, D.; Masante, D.; Mazzeschi, M. A new global database of meteorological drought events from 1951 to 2016. J. Hydrol. Reg. Stud. 2019, 22, 100593. [Google Scholar] [CrossRef] [PubMed]
  13. Ling, M.; Han, H.; Hu, X.; Xia, Q.; Guo, X. Drought characteristics and causes during summer maize growth period on Huang-Huai-Hai Plain based on daily scale SPEI. Agric. Water Manag. 2023, 280, 108198. [Google Scholar] [CrossRef]
  14. Li, L.; She, D.; Zheng, H.; Lin, P.; Yang, Z.-L. Elucidating Diverse Drought Characteristics from Two Meteorological Drought Indices (SPI and SPEI) in China. J. Hydrometeorol. 2020, 21, 1513–1530. [Google Scholar] [CrossRef]
  15. Mohammed, S.; Alsafadi, K.; Enaruvbe, G.O.; Bashir, B.; Elbeltagi, A.; Szeles, A.; Alsalman, A.; Harsanyi, E. Assessing the impacts of agricultural drought (SPI/SPEI) on maize and wheat yields across Hungary. Sci. Rep. 2022, 12, 8838. [Google Scholar] [CrossRef] [PubMed]
  16. Manzano, A.; Clemente, M.A.; Morata, A.; Luna, M.Y.; Beguería, S.; Vicente-Serrano, S.M.; Martín, M.L. Analysis of the atmospheric circulation pattern effects over SPEI drought index in Spain. Atmos. Res. 2019, 230, 104630. [Google Scholar] [CrossRef]
  17. Wang, W.; Zhu, Y.; Xu, R.; Liu, J. Drought severity change in China during 1961–2012 indicated by SPI and SPEI. Nat. Hazards 2014, 75, 2437–2451. [Google Scholar] [CrossRef]
  18. Meque, A.; Abiodun, B.J. Simulating the link between ENSO and summer drought in Southern Africa using regional climate models. Clim. Dyn. 2014, 44, 1881–1900. [Google Scholar] [CrossRef]
  19. Zhou, L.; Wang, S.; Du, M.; Chen, Q.; He, C.; Zhang, J.; Zhu, Y.; Gong, Y. The Influence of ENSO and MJO on Drought in Different Ecological Geographic Regions in China. Remote Sens. 2021, 13, 875. [Google Scholar] [CrossRef]
  20. Chandrasekara, S.S.K.; Kwon, H.-H.; Vithanage, M.; Obeysekera, J.; Kim, T.-W. Drought in South Asia: A Review of Drought Assessment and Prediction in South Asian Countries. Atmosphere 2021, 12, 369. [Google Scholar] [CrossRef]
  21. Xing, Z.; Yu, Z.; Wei, J.; Zhang, X.; Ma, M.; Yi, P.; Ju, Q.; Wang, J.; Laux, P.; Kunstmann, H. Lagged influence of ENSO regimes on droughts over the Poyang Lake basin, China. Atmos. Res. 2022, 275, 106218. [Google Scholar] [CrossRef]
  22. Rezaei, A. Ocean-atmosphere circulation controls on integrated meteorological and agricultural drought over Iran. J. Hydrol. 2021, 603, 126928. [Google Scholar] [CrossRef]
  23. Li, X.; Sha, J.; Wang, Z.-L. Influence of the Three Gorges Reservoir on climate drought in the Yangtze River Basin. Environ. Sci. Pollut. Res. 2021, 28, 29755–29772. [Google Scholar] [CrossRef] [PubMed]
  24. Lv, A.; Fan, L.; Zhang, W. Impact of ENSO Events on Droughts in China. Atmosphere 2022, 13, 1764. [Google Scholar] [CrossRef]
  25. Zhang, B.; Li, Y.; Zhang, C.; Hu, C.; Fu, G.; Cai, X. Dual water-electricity cooperation improves economic benefits and water equality in the Lancang-Mekong River Basin. Nat. Commun. 2023, 14, 6228. [Google Scholar] [CrossRef] [PubMed]
  26. Vicente-Serrano, S.M.; Beguería, S.; López-Moreno, J.I. A Multiscalar Drought Index Sensitive to Global Warming: The Standardized Precipitation Evapotranspiration Index. J. Clim. 2010, 23, 1696–1718. [Google Scholar] [CrossRef]
  27. Sun, C.; Xiao, Z.-N.; Nguyen, M. Projection on precipitation frequency of different intensities and precipitation amount in the Lancang-Mekong River basin in the 21st century. Adv. Clim. Chang. Res. 2021, 12, 162–171. [Google Scholar] [CrossRef]
  28. Do, P.; Tian, F.; Zhu, T.; Zohidov, B.; Ni, G.; Lu, H.; Liu, H. Exploring synergies in the water-food-energy nexus by using an integrated hydro-economic optimization model for the Lancang-Mekong River basin. Sci. Total Environ. 2020, 728, 137996. [Google Scholar] [CrossRef]
  29. Luo, X.; Wang, Y.; Li, Y. Responses of ecosystem water use efficiency to drought in the Lancang–Mekong River Basin. Front. Ecol. Evol. 2023, 11, 1203725. [Google Scholar] [CrossRef]
  30. Ty, T.V.; Lavane, K.; Nguyen, P.C.; Downes, N.K.; Nam, N.D.G.; Minh, H.V.T.; Kumar, P. Assessment of Relationship between Climate Change, Drought, and Land Use and Land Cover Changes in a Semi-Mountainous Area of the Vietnamese Mekong Delta. Land 2022, 11, 2175. [Google Scholar] [CrossRef]
  31. Kang, H.; Sridhar, V.; Ali, S.A. Climate change impacts on conventional and flash droughts in the Mekong River Basin. Sci. Total Environ. 2022, 838, 155845. [Google Scholar] [CrossRef]
  32. Ming, W.; Luo, X.; Luo, X.; Long, Y.; Xiao, X.; Ji, X.; Li, Y. Quantitative Assessment of Cropland Exposure to Agricultural Drought in the Greater Mekong Subregion. Remote Sens. 2023, 15, 2737. [Google Scholar] [CrossRef]
  33. Han, X.; Li, Q.; Yang, X.; Xu, S.; Zou, Z.; Deng, M.; Wang, W. The influence of anthropogenic climate change on meteorological drought in the Lancang-Mekong River basin. J. Hydrol. 2023, 626, 130334. [Google Scholar] [CrossRef]
  34. Wang, S.; Zhang, L.; She, D.; Wang, G.; Zhang, Q. Future projections of flooding characteristics in the Lancang-Mekong River Basin under climate change. J. Hydrol. 2021, 602, 126778. [Google Scholar] [CrossRef]
  35. Ullah, S.; You, Q.; Sachindra, D.A.; Nowosad, M.; Ullah, W.; Bhatti, A.S.; Jin, Z.; Ali, A. Spatiotemporal changes in global aridity in terms of multiple aridity indices: An assessment based on the CRU data. Atmos. Res. 2022, 268, 105998. [Google Scholar] [CrossRef]
  36. Beguería, S.; Vicente-Serrano, S.M.; Reig, F.; Latorre, B. Standardized precipitation evapotranspiration index (SPEI) revisited: Parameter fitting, evapotranspiration models, tools, datasets and drought monitoring. Int. J. Climatol. 2014, 34, 3001–3023. [Google Scholar] [CrossRef]
  37. Vicente-Serrano, S.M.; López-Moreno, J.I.; Gimeno, L.; Nieto, R.; Morán-Tejeda, E.; Lorenzo-Lacruz, J.; Beguería, S.; Azorin-Molina, C. A multiscalar global evaluation of the impact of ENSO on droughts. J. Geophys. Res. 2011, 23, 1696. [Google Scholar] [CrossRef]
  38. Luo, N.; Mao, D.; Wen, B.; Liu, X. Climate Change Affected Vegetation Dynamics in the Northern Xinjiang of China: Evaluation by SPEI and NDVI. Land 2020, 9, 90. [Google Scholar] [CrossRef]
  39. Wu, R.; Zhang, J.; Bao, Y.; Guo, E. Run Theory and Copula-Based Drought Risk Analysis for Songnen Grassland in Northeastern China. Sustainability 2019, 11, 6032. [Google Scholar] [CrossRef]
  40. Pei, Z.; Fang, S.; Wang, L.; Yang, W. Comparative Analysis of Drought Indicated by the SPI and SPEI at Various Timescales in Inner Mongolia, China. Water 2020, 12, 1925. [Google Scholar] [CrossRef]
  41. Moradi, H.R.; Rajabi, M.; Faragzadeh, M. Investigation of meteorological drought characteristics in Fars province, Iran. Catena 2011, 84, 35–46. [Google Scholar] [CrossRef]
  42. Senatilleke, U.; Sirisena, J.; Gunathilake, M.B.; Muttil, N.; Rathnayake, U. Monitoring the Meteorological and Hydrological Droughts in the Largest River Basin (Mahaweli River) in Sri Lanka. Climate 2023, 11, 57. [Google Scholar] [CrossRef]
  43. Cao, S.; Zhang, L.; He, Y.; Zhang, Y.; Chen, Y.; Yao, S.; Yang, W.; Sun, Q. Effects and contributions of meteorological drought on agricultural drought under different climatic zones and vegetation types in Northwest China. Sci. Total Environ. 2022, 821, 153270. [Google Scholar] [CrossRef] [PubMed]
  44. Sharma, A.; Goyal, M.K. Assessment of drought trend and variability in India using wavelet transform. Hydrol. Sci. J. 2020, 65, 1539–1554. [Google Scholar] [CrossRef]
  45. Kingston, D.G.; Stagge, J.H.; Tallaksen, L.M.; Hannah, D.M. European-Scale Drought: Understanding Connections between Atmospheric Circulation and Meteorological Drought Indices. J. Clim. 2015, 28, 505–516. [Google Scholar] [CrossRef]
  46. Rahmani, F.; Fattahi, M.H. A multifractal cross-correlation investigation into sensitivity and dependence of meteorological and hydrological droughts on precipitation and temperature. Nat. Hazards 2021, 109, 2197–2219. [Google Scholar] [CrossRef]
  47. Zhang, R.; Chen, Z.Y.; Xu, L.J.; Ou, C.Q. Meteorological drought forecasting based on a statistical model with machine learning techniques in Shaanxi province, China. Sci. Total Environ. 2019, 665, 338–346. [Google Scholar] [CrossRef]
  48. Dong, Z.; Liu, H.; Baiyinbaoligao; Hu, H.; Khan, M.Y.A.; Wen, J.; Chen, L.; Tian, F. Future projection of seasonal drought characteristics using CMIP6 in the Lancang-Mekong River Basin. J. Hydrol. 2022, 610, 127815. [Google Scholar] [CrossRef]
  49. Yun, X.; Tang, Q.; Li, J.; Lu, H.; Zhang, L.; Chen, D. Can reservoir regulation mitigate future climate change induced hydrological extremes in the Lancang-Mekong River Basin? Sci. Total Environ. 2021, 785, 147322. [Google Scholar] [CrossRef]
  50. Li, D.; Zhao, J.; Govindaraju, R.S. Water benefits sharing under transboundary cooperation in the Lancang-Mekong River Basin. J. Hydrol. 2019, 577, 123989. [Google Scholar] [CrossRef]
  51. Minh, H.V.T.; Lavane, K.; Ty, T.V.; Downes, N.K.; Hong, T.T.K.; Kumar, P. Evaluation of the Impact of Drought and Saline Water Intrusion on Rice Yields in the Mekong Delta, Vietnam. Water 2022, 14, 3499. [Google Scholar] [CrossRef]
  52. Nguyen, T.T.; Li, M.H.; Vu, T.M.; Chen, P.Y. Multiple drought indices and their teleconnections with ENSO in various spatiotemporal scales over the Mekong River Basin. Sci. Total Environ. 2023, 854, 158589. [Google Scholar] [CrossRef]
  53. Zhang, Y.; Hao, Z.; Feng, S.; Zhang, X.; Xu, Y.; Hao, F. Agricultural drought prediction in China based on drought propagation and large-scale drivers. Agric. Water Manag. 2021, 255, 107028. [Google Scholar] [CrossRef]
  54. Feng, P.; Wang, B.; Luo, J.J.; Liu, L.; Waters, C.; Ji, F.; Ruan, H.; Xiao, D.; Shi, L.; Yu, Q. Using large-scale climate drivers to forecast meteorological drought condition in growing season across the Australian wheatbelt. Sci. Total Environ. 2020, 724, 138162. [Google Scholar] [CrossRef] [PubMed]
  55. Venkatappa, M.; Sasaki, N.; Han, P.; Abe, I. Impacts of droughts and floods on croplands and crop production in Southeast Asia—An application of Google Earth Engine. Sci. Total Environ. 2021, 795, 148829. [Google Scholar] [CrossRef] [PubMed]
  56. Minh, H.V.T.; Van Ty, T.; Avtar, R.; Kumar, P.; Le, K.N.; Ngan, N.V.C.; Khanh, L.H.; Nguyen, N.C.; Downes, N.K. Implications of climate change and drought on water requirements in a semi-mountainous region of the Vietnamese Mekong Delta. Environ. Monit. Assess. 2022, 194, 766. [Google Scholar] [CrossRef] [PubMed]
  57. Liu, J.; Chen, D.; Mao, G.; Irannezhad, M.; Pokhrel, Y. Past and Future Changes in Climate and Water Resources in the Lancang–Mekong River Basin: Current Understanding and Future Research Directions. Engineering 2022, 13, 144–152. [Google Scholar] [CrossRef]
  58. Zhang, L.; Song, W.; Song, W. Assessment of Agricultural Drought Risk in the Lancang-Mekong Region, South East Asia. Int. J. Environ. Res. Public Health 2020, 17, 6153. [Google Scholar] [CrossRef] [PubMed]
  59. Lavane, K.; Kumar, P.; Meraj, G.; Han, T.G.; Ngan, L.H.B.; Lien, B.T.B.; Van Ty, T.; Thanh, N.T.; Downes, N.K.; Nam, N.D.G.; et al. Assessing the Effects of Drought on Rice Yields in the Mekong Delta. Climate 2023, 11, 13. [Google Scholar] [CrossRef]
Figure 1. Location of the LMRB. (a) Location and water system distribution, (b) Elevation, (c) Land use types, (d) Climate type, (e) Average precipitation.
Atmosphere 15 00089 g001
Figure 2. Run Theory identifies meteorological drought variables (1, 2, 3 respectively represent three distinct meteorological drought events identified using the Run Theory).
Atmosphere 15 00089 g002
Figure 3. Temporal variation of SPEI at different time scales in the LMRB-based Run Theory (Blue represents positive values of SPEI, while red represents negative values of SPEI).
Atmosphere 15 00089 g003
Figure 4. The spatial variation of meteorological drought frequency at different severity levels in the Lancang-Mekong River Basin ((ad): variation of meteorological drought frequency during the wet season, (eh): variation of meteorological drought frequency during the dry season, (il): variation of meteorological drought frequency in interannual).
Atmosphere 15 00089 g004
Figure 5. Spatial variation of meteorological drought and wetness trends in the LMRB (a) wet season (b) dry season (c) annual, * represents that the trend of SPEI has passed the significance test at the 0.05 level. ** represents that the trend of the SPEI has passed the significance test at the 0.01 level.
Atmosphere 15 00089 g005
Figure 6. Distribution of correlation coefficients between the meteorological drought and NAO in the LMRB (Lag-0, lag-1, lag-3, … lag12 represents lagged 0, 1, 2, 3 … 12 months between meteorological drought and ENSO, * represents that correlation coefficient has passed the significance test at the 0.05 level, ** represents that correlation coefficient has passed the significance test at the 0.01 level).
Atmosphere 15 00089 g006
Figure 7. Distribution of correlation coefficients between the meteorological drought and AO in the LMRB (Lag-0, lag-1, lag-3, … lag12 represents lagged 0, 1, 2, 3 … 12 months between meteorological drought and AO, * represents that correlation coefficient has passed the significance test at the 0.05 level, ** represents that correlation coefficient has passed the significance test at the 0.01 level).
Atmosphere 15 00089 g007
Figure 8. Distribution of correlation coefficients between the meteorological drought and NAO in the LMRB (Lag-0, lag-1, lag-3, … lag12 represents lagged 0, 1, 2, 3 … 12 months between meteorological drought and NAO, * represents that correlation coefficient has passed the significance test at the 0.05 level).
Atmosphere 15 00089 g008
Figure 9. Distribution of correlation coefficients between the meteorological drought and PDO in the LMRB (Lag-0, lag-1, lag-3, … lag12 represents lagged 0, 1, 2, 3 … 12 months between meteorological drought and PDO, * represents that correlation coefficient has passed the significance test at the 0.05 level, ** represents that correlation coefficient has passed the significance test at the 0.01 level).
Atmosphere 15 00089 g009
Table 1. Verification of the bias correction results for the meteorological station data in the study area compared to the corresponding CRU precipitation and temperature data.
MethodData TypeRMAERMSE
Distance weighted interpolationTemperature0.7568.2110.56
Precipitation0.8646.347.69
The bilinear interpolationTemperature0.9512.324.82
Precipitation0.9353.034.18
Table 2. Summary of atmospheric circulation indices used.
NOAtmospheric CirculationIDData Source
1EI Nino-Southern OscillationENSONOAA Physical Sciences Division (PSD)
2North Atlantic OscillationNAONOAA Climate Prediction Centre (CPC)
3Arctic OscillationAONOAA Physical Sciences Division (PSD)
4Pacific Decadal OscillationPDONational Centre for Atmospheric Research (NCAR)
Table 3. The classification of meteorological drought and wetness grade based on SPEI.
LevelTypeSPEI Value
1Normal/Wetness−0.5 < SPEI
2Mild drought−1.0 < SPEI ≤ −0.5
3Moderate drought−1.5 < SPEI ≤ −1.0
4Severe drought−2.0 < SPEI ≤ −1.5
5Extreme droughtSPEI ≤ −2.0
Table 4. Historical drought characteristics of SPEI at 1-, 3-, 6- and 12-month time scales.
Time ScaleNumber of EventsAverage DurationAverage SeverityAverage Intensity
18264.571.33
350108.061.43
6291310.451.67
12171813.561.45
Table 5. The water resource and irrigation water of countries along the LMRB in 2018.
TypeTimeChinaMyanmarLaosThailandCambodiaVietnam
Basin area (104 km2)/16.52.420.218.415.56.5
average water yield (m3/s)/24103005270256028601660
Irrigated area (104 hm2)/42705058240
Irrigation water consumption (108 m3)Dry season20.4834.463.2379.59193.75
Rainy season5.1211.4794.8434.1168.07
/: nothing —: no data
Disclaimer/Publisher’s Note: The statements, opinions and data contained in all publications are solely those of the individual author(s) and contributor(s) and not of MDPI and/or the editor(s). MDPI and/or the editor(s) disclaim responsibility for any injury to people or property resulting from any ideas, methods, instructions or products referred to in the content.

