Article

Prediction of the Concentration and Source Contributions of PM2.5 and Gas-Phase Pollutants in an Urban Area with the SmartAQ Forecasting System

by
Evangelia Siouti
1,2,
Ksakousti Skyllakou
2,
Ioannis Kioutsioukis
3,
David Patoulias
2,
Ioannis D. Apostolopoulos
2,
George Fouskas
2 and
Spyros N. Pandis
1,2,*
1
Department of Chemical Engineering, University of Patras, 26504 Patras, Greece
2
Institute of Chemical Engineering Sciences (ICE-HT), Foundation for Research and Technology Hellas (FORTH), 26504 Patras, Greece
3
Department of Physics, University of Patras, 26504 Patras, Greece
*
Author to whom correspondence should be addressed.
Atmosphere 2024, 15(1), 8; https://doi.org/10.3390/atmos15010008
Submission received: 22 October 2023 / Revised: 10 November 2023 / Accepted: 7 December 2023 / Published: 21 December 2023
(This article belongs to the Special Issue Urban Air Quality Modelling)

Abstract

:
The SmartAQ (Smart Air Quality) forecasting system produces high-resolution (1 × 1 km2) air quality predictions in an urban area for the next three days using advanced chemical transport modeling. In this study, we evaluated the SmartAQ performance for the urban area of Patras, Greece, for four months (July 2021, September 2021, December 2021, and March 2022), covering all seasons. In this work, we assess the system’s ability to forecast PM2.5 levels and the major gas-phase pollutants during periods with different meteorological conditions and local emissions, but also in areas of the city with different characteristics (urban, suburban, and background sites). We take advantage of this SmartAQ application to also quantify the main sources of the pollutants at each site. During the summertime, PM2.5 model performance was excellent (Fbias < 15%, Ferror < 30%) for all sites both in the city center and suburbs. For the city center, the model reproduced well (MB = −0.9 μg m−3, ME = 2.5 μg m−3) the overall measured PM2.5 behavior and the high nighttime peaks due to cooking activity, as well as the transported PM pollution in the suburbs. During the fall, the SmartAQ PM2.5 performance was good (Fbias < 42%, Ferror < 45%) for the city center and the suburban core, while it was average (Fbias < 50%, Ferror < 54%, MB, ME < 3.3 μg m−3) for the suburbs because the model overpredicted the long-range transport of pollution. For wintertime, the system reproduced well (MB = −2 μg m−3, ME = 6.5 μg m−3) the PM2.5 concentration in the high-biomass-burning emission area with an excellent model performance (Fbias = −4%, Ferror = 33%) and reproduced well (MB < 1.1 μg m−3, ME < 3 μg m−3) the background PM2.5 levels. SmartAQ reproduced well the PM2.5 concentrations in the urban and suburban core during the spring (Fbias < 40%, Ferror < 50%, MB < 8.5 μg m−3, ME < 10 μg m−3), while it tended to slightly overestimate the regional pollution. The main local source of fine PM during summer and autumn was cooking, but most of the PM was transported to the city. Residential biomass burning was the dominant particle source of pollution during winter and early spring. For gas-phase pollutants, the system reproduced well the daily nitrogen oxides (NOx) concentrations during the summertime. Predicted NOx concentrations during the winter were consistent with measurements at night but underestimated the observations during the rest of the day. SmartAQ achieved the US EPA modeling goals for hourly O3 concentrations indicating good model performance.

1. Introduction

Atmospheric pollution has negative effects on human heath, causing serious respiratory and cardiovascular diseases [1]. Air pollution is responsible for around 7 million premature deaths worldwide according to the World Health Organization [2]. PM2.5 (particles with a diameter lower than 2.5 μm) pose the highest health risk, but also can damage the environment and structures [3]. The prediction of the future status of the atmosphere can help reduce human health risks if appropriate measurements are taken.
Several air quality forecasting models have been developed and their performance has been evaluated on an hourly, daily, or seasonal basis. The CAMS (Copernicus Atmosphere Monitoring Service) system can predict seasonal O3 concentrations in Europe during summer quite well, using the ensemble median of seven individual chemical transport models (CTMs), while it tended to underestimate wintertime PM10 (particles with diameter lower than 10 μm). Modified normalized mean bias and fractional gross error were 0.14 and 0.3, respectively, for O3 on average, while the corresponding values for PM10 were −0.1 and 0.52 [4]. For the PREV’ AIR (Prevision de la qualité de l’air) system, there is an underprediction of daily PM10 concentrations up to 3.5 μg m−3 in the urban sites of Europe during summer and up to 5.7 μg m−3 during winter [5]. An underprediction is also reported for daily nitrogen dioxide (NO2) for both urban and suburban areas of up to 4 and 6 μg m−3 in summer, respectively, and up to 12 and 13 μg m−3 during wintertime, respectively. The system shows better O3 daily forecast ability for suburban and rural areas during the summertime, with an absolute bias of −0.4 to 3.6 μg m−3. The MarcoPolo-Panda system that is applied in eastern China tended to underpredict the hourly concentrations of O3 and NO2 and to overpredict PM2.5, with mean bias equal to −14.7, −3 and 3.7 μg m−3, respectively, using the ensemble mean forecasts [6]. The NAM/CMAQ (North America Mesoscale/Community Multiscale Air Quality) model tends to overpredict both O3 and NO2 annual and daily concentrations over the United States, especially in summer, with O3 overestimation being more intense in the morning and NO2 overestimation in the nighttime [7].
Weaknesses of most existing forecasting systems include low horizontal spatial resolution when simulating urban areas, oversimplified primary and secondary organic aerosol treatment, difficulties in estimations of non-conventional sources of pollution, and uncertainties in meteorology. The CAMS system uses moderate spatial resolution (10–20 km) and does not focus on urban areas, while uncertainties related to secondary organic aerosol (SOA) simulation pose additional problems [4,8]. Lack of high spatial resolution in the PREV’AIR system that uses a moderate 10 × 10 km2 resolution, errors in its meteorological predictions, and neglecting the semivolatile nature of primary organic aerosol (POA) lead to uncertainties in its air pollution forecasts [5]. The Marco-Polo forecasting system uses moderate to low spatial resolution from 6 to 40 km to simulate air pollution, while 5 out of 6 individual CTMs used do not treat POA emissions as semivolatile [6]. The MM5-CAMx system uses high spatial resolution (2 × 2 km2) to predict urban air quality in Athens and Thessaloniki, but the simplified treatment of SOA formation and the lack of a cooking source from the corresponding emission inventory leads to uncertain forecasts [9].
The moderate spatial resolution used for urban areas may limit the model ability to represent the concentration variations, while the treatment of POA as semivolatile and reactive provides more accurate OA (organic aerosol) forecasts. Field measurements have suggested that as the traditional sources of transportation and industry have been successfully controlled, cooking and residential wood burning emissions are becoming dominant local sources in urban areas [10,11,12,13,14], posing additional forecasting challenges. These non-conventional sources are difficult to include in the simulations due to their uncertain spatiotemporal patterns and total emissions. In addition, questions related to local and regional contributions to air pollution in major urban areas are yet to be elucidated. Dense measurement networks in the urban core of cities and in their outskirts are useful tools to estimate the local and transported pollution, but also to better evaluate the prediction ability of forecasting systems in high resolution.
The air quality forecasting system SmartAQ predicts the status of the atmosphere for the next 3-day period for the urban area of interest at a spatial resolution of 1 × 1 km2 [15]. In this study, the city of Patras in Greece was used to evaluate its performance. Unique features of SmartAQ include the prediction of pollutant source contributions in addition to the total pollutant concentrations using the Particulate Source Apportionment Technology (PSAT) algorithm, as well as the separation of pollution to local and regional. POA emissions are treated as semivolatile, and subsequent reactions are considered. Bottom-up inventories for residential biomass burning and cooking emissions have also been developed and are used in this study [16,17]. The system can be easily extended to other urban areas of Europe to forecast the air pollution levels at high spatial resolution in different cities at the same time. In addition, information about the dominant sources can be provided by SmartAQ and, therefore, appropriate measures could be taken to control them. Limitations of such systems include technical issues such as high computational time and complexity, while the forecast period is limited to the next few days. Prediction of future emissions of several sources (e.g., biomass burning) are challenging and pose additional limitations in the forecasting ability of systems like SmartAQ.
The SmartAQ performance of PM2.5, NOx, and O3 was evaluated comparing hourly and daily predictions against the corresponding measurements for July, September, December 2021, and March 2022 for several urban, suburban, and background sites in Patras.

2. Model Description and Application

SmartAQ consists of six main models that predict weather conditions, anthropogenic, biogenic, and marine emissions, air pollutant concentrations, and their corresponding sources. The mesoscale numerical weather prediction model WRF (Weather Research and Forecasting) provides the necessary meteorological fields for predicting air pollution [18]. Traditional anthropogenic emissions such as industry, agriculture, mining, shipping, and transportation are based on the TNO emission inventory [19]. A bottom-up inventory of 1 × 1 km2 resolution for commercial cooking and residential biomass burning emissions is used [16,17]. Biogenic emissions are produced by MEGAN3 (Model of Emissions of Gases and Aerosols from Nature) [20,21] and marine emissions that include sea salt and organics are estimated using the O’Dowd et al. [22] and Monahan et al. [23] algorithms in combination with WRF outputs. The CTM PMCAMx (Particulate Matter Comprehensive Air quality Model with extensions) is used to simulate the air pollution in Europe, focusing gradually with increasing resolution on the area of interest that covers a region of 36 × 36 km2 and providing the corresponding air pollutant concentrations in the urban area at 1 × 1 km2 resolution [24]. The PSAT algorithm runs in parallel with PMCAMx to predict the sources of air pollutants [25]. PSAT takes advantage of the fact that the probability of a molecule from a specific source being transported, reacting, or depositing is independent of its source. The current implementation includes seven emission categories, plus initial and boundary conditions, which are tracked separately by the model as different sources.
The SmartAQ system operates daily producing concentration forecasts of gas-phase (NO2, NO, SO2, CO, O3, volatile organic compounds, etc.) and size-resolved particle-phase atmospheric pollutants (PM1, PM2.5, and PM10) as well as their chemical composition.
The urban area of Patras was used for the first application and evaluation of the system due to the dense low-cost sensor network that is available the city [26]. PMCAMx uses four two-way grids with increasing spatial resolution focusing on the urban area of interest. The outer grid covers a European region of 5400 × 5832 km2 with a 36 × 36 km2 resolution. The three nested grids have 12 × 12, 3 × 3, and 1 × 1 km2 resolutions. The urban domain has the high resolution of 1 × 1 km2, covering a region of 36 × 36 km2. Emissions were prepared for the European and urban domain at 36 and 1 km resolutions, respectively. For the nested grids with 12 and 3 km resolutions, emissions are the result of interpolation. For the vertical, 14 layers up to 6 km were used for all domains.
Details about the SmartAQ and its application can be found in Siouti et al. [15]. Emissions for the European domain and the domain of Patras are described in Siouti et al. [15]. Cooking and residential biomass burning emissions for Patras are explicitly described in Siouti et al. [16,17].

2.1. Particle and Gas-Phase Measurements

The measurement sites and the corresponding instruments used in this work are summarized in Table 1. For the evaluation of PM2.5 predictions of SmartAQ, we use measurements from four stations located in the urban core (Trion Navarchon Square, Georgiou Square, Agia, and Drosopoulou Square), four suburban stations (Kypseli, Koukouli, Demenika, Kastelokampos), and two background stations (University of Patras and Platani). The locations of the corresponding low-cost sensors are shown in Figure 1. Urban sites are affected by local sources such as transportation, while the sites defined as urban-city center are also affected by commercial cooking. The suburban sites (Kypseli, Koukouli, Demenika) are of primary importance, especially in winter, as they are highly populated and are strongly affected by biomass burning emissions from fireplaces. The selected background sites capture the pollution transported from outside the modeling domain as they are characterized by negligible local emission sources.
Low-cost sensors (Purple Air Model PA-II, PurpleAir, Inc., Draper, UT, USA) are used to measure the PM2.5 concentrations in the city of Patras. A dense network of about 30 low-cost sensors is available for the city of Patras. Kosmopoulos et al. [26] evaluated their performance in this area and proposed the following correction for their PM2.5 measurements in this area: PM2.5 = 0.42 PAir2.5 + 0.26 (μg m−3), where PM2.5 is the corrected concentration and PAir2.5 is the measured. In addition, Kosmopoulos et al. [26] found that meteorological conditions (temperature, relative humidity) had a minor effect on the measured PM2.5 concentrations by the low-cost sensors in Patras.
For gas-phase measurements, we used the regulatory monitors of the Region of Western Greece located in Drosopoulou Square next to the city center.

2.2. Evaluation

2.2.1. Evaluation Metrics

Mean bias (MB), fractional bias (Fbias), mean error (ME), and fractional error (Ferror) were used in this study to evaluate the model performance of PM2.5 in each site as described in Morris et al. [27]. For O3, mean normalized bias (MNB) and mean normalized error (MNE) were used for the evaluation of model performance based on Morris et al. [28]. For NOx, fractional bias (or mean fractional bias) and fractional gross error (FGE) were used for the evaluation of model performance based on Morris et al. [28]. The evaluation metrics are given by the following equations:
MB = 1 N i = 1 N P i O i
ME = 1 N i = 1 N P i O i
Fbias = 2 N i = 1 N ( P i O i ) ( P i + O i )
Ferror = 2 N i = 1 N P i O i ( P i + O i )
MNB = 1 N i = 1 N ( P i O i ) O i
MNE = 1 N i = 1 N | P i O i | O i
FGE = 2 N i = 1 N P i O i | P i + O i |
where, N is the total number of measurements, Pi is the predicted concentration, and Oi is the corresponding observed concentration of the evaluated species.
PM2.5 model performance for daily average values is considered excellent for Fbias ≤ ±15 and Ferror ≤ ±35%, good for Fbias ≤ ±30% and Ferror ≤ ±50%, average for Fbias ≤ ±60% and Ferror ≤ ±75%, while there are fundamental problems in modeling system above these values [27]. O3 model performance for hourly average values is considered good for MNB ≤ ±15% and MNE ≤ ±35% [28]. NOx model performance for hourly average values is considered good for Fbias ≤ ±15% and FGE ≤ ±35% [28].

2.2.2. European Air Quality Index

The European Environment Agency (EEA) has proposed an air quality index for PM2.5 based on human health risks of short-term exposure according to the World Health Organization [29]. For PM2.5, good air quality is defined as daily average PM2.5 concentration from 0 to 10 μg m−3, fair from 10 to 20 μg m−3, moderate from 20 to 25 μg m−3, poor from 25 to 50 μg m−3, very poor from 50 to 75 μg m−3, and extremely poor from 75 to 800 μg m−3 (Table 2).
The ability of SmartAQ to predict the corresponding air quality index value for the next few days will also be evaluated.

3. Results

3.1. ΡΜ2.5 Predictions

3.1.1. Prediction of Air Quality Levels

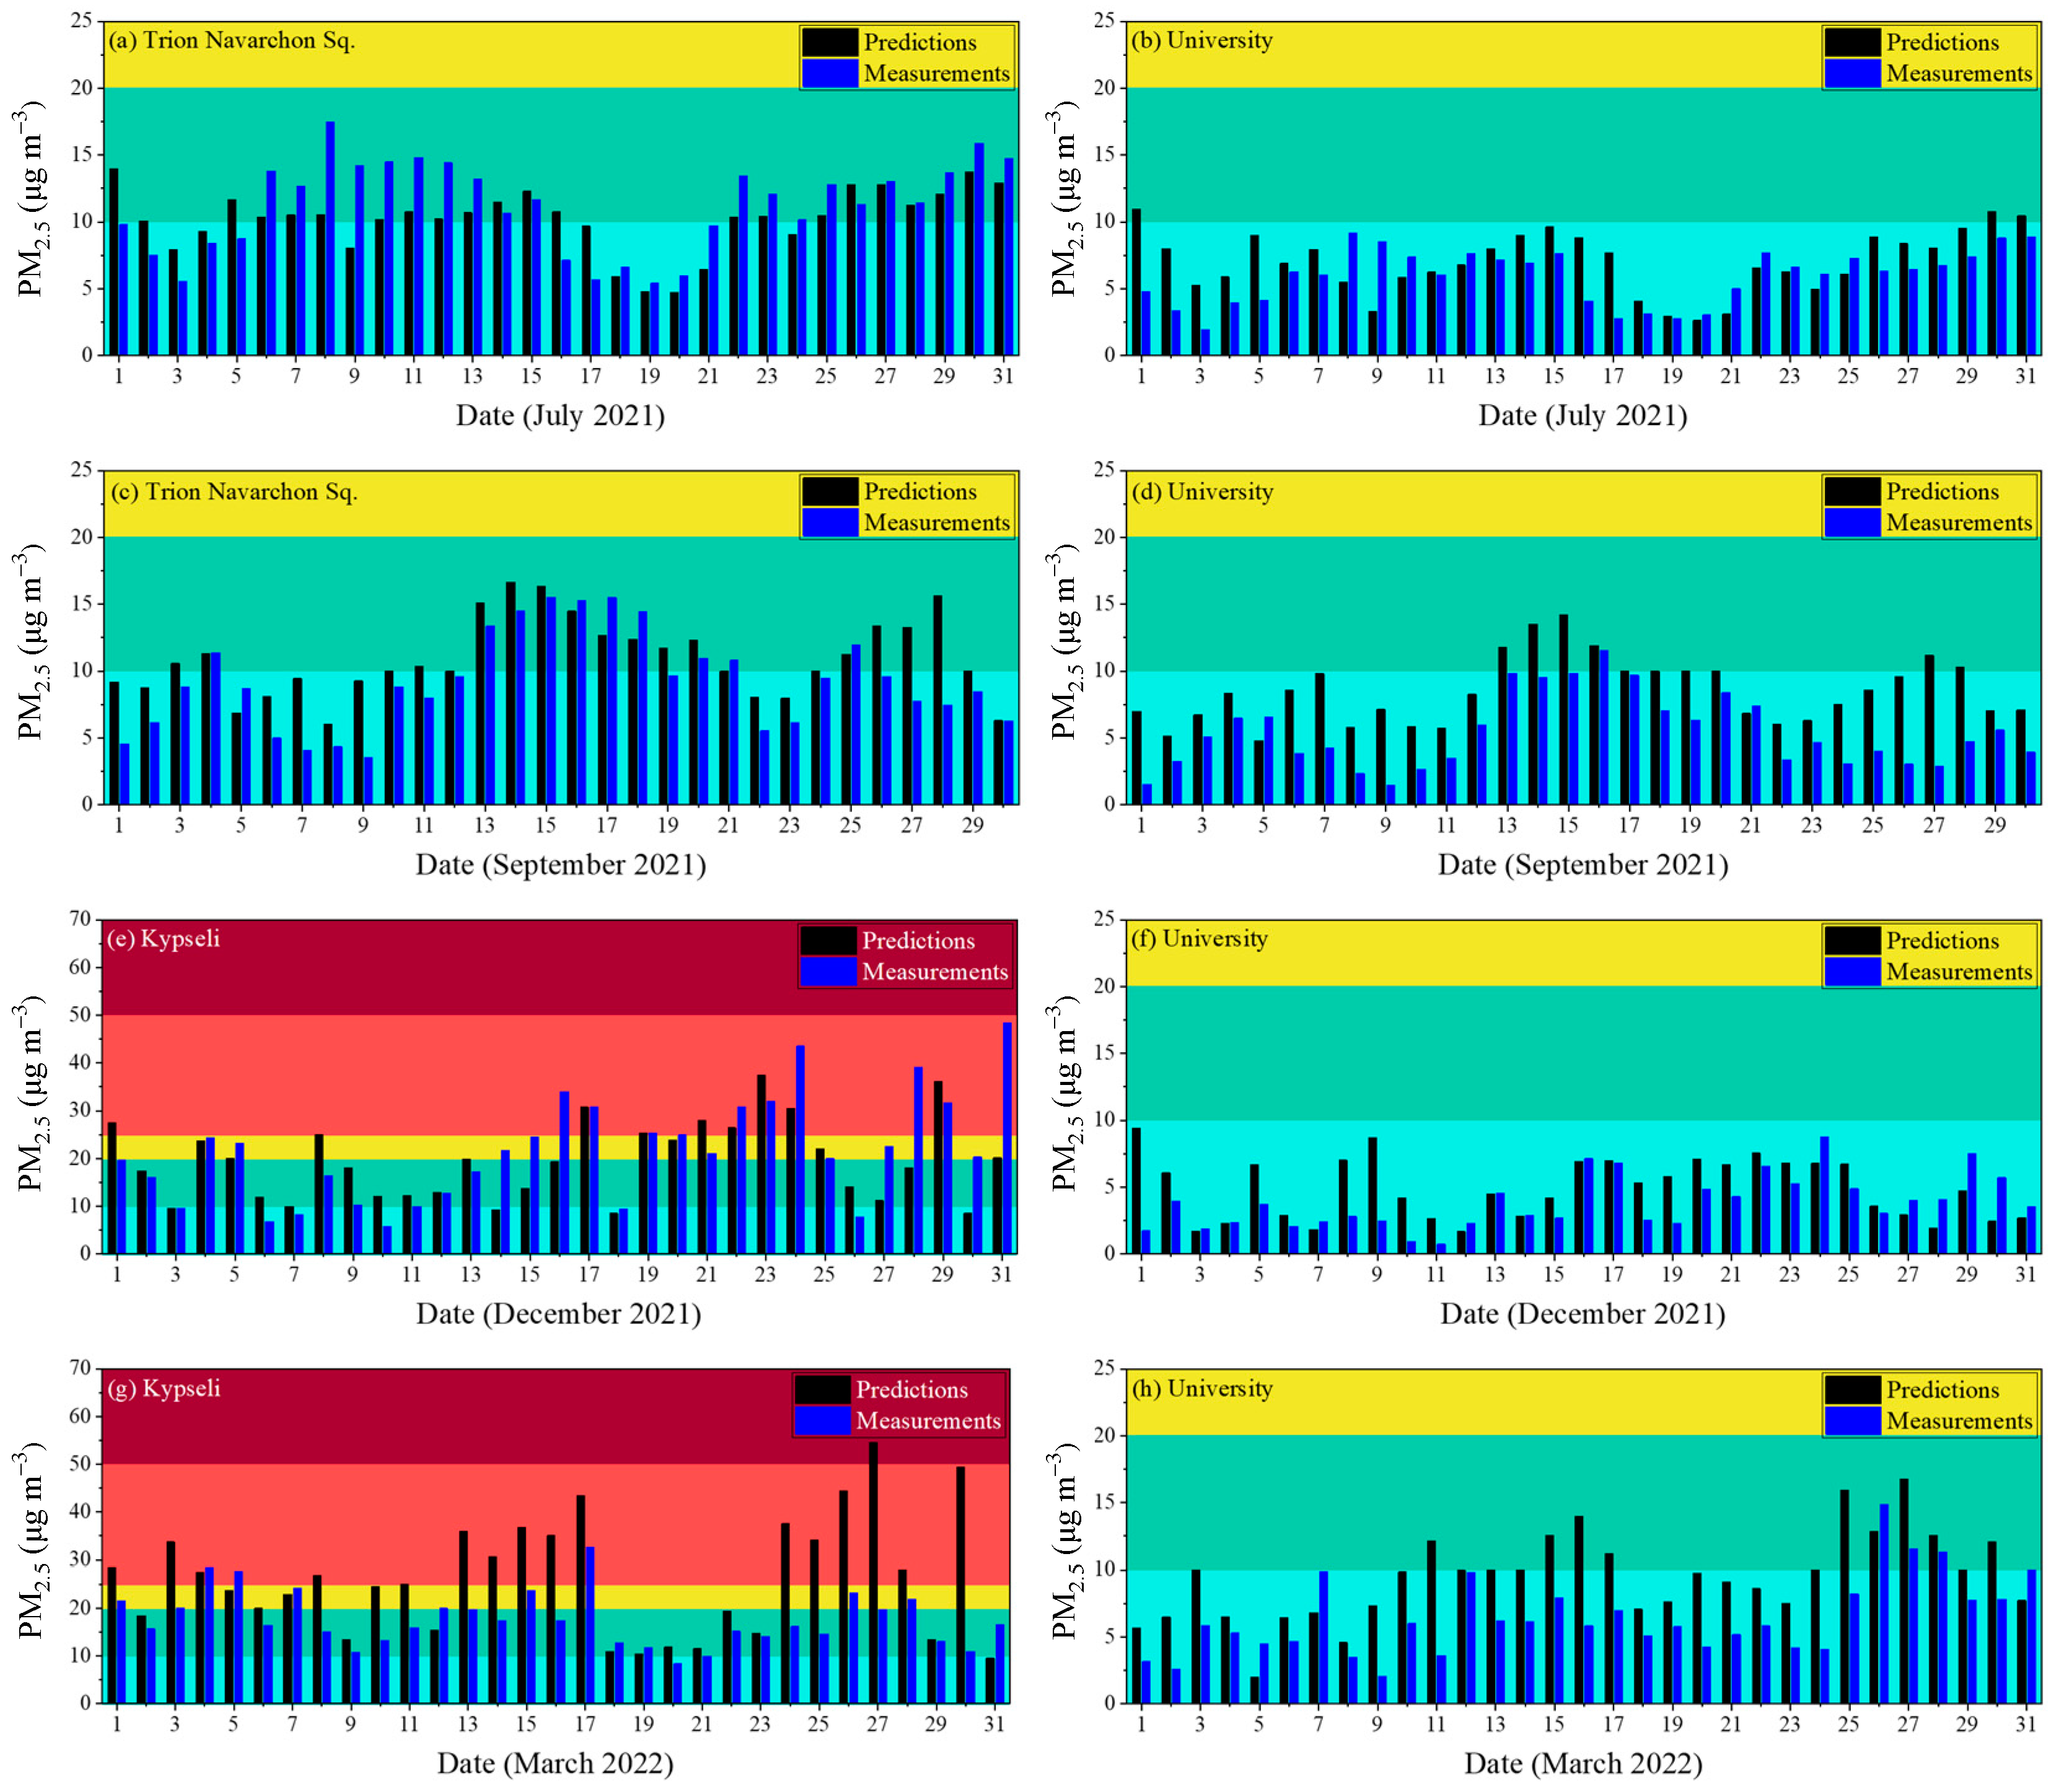
The ability of the system to predict daily air quality was first assessed for PM2.5 based on the European air quality index for a typical urban/suburban and a background site in Patras (Figure 2). For the summertime, we selected the urban Trion Navarchon Square site located in the city center in a high-restaurant density area. For the wintertime, the suburban site of Kypseli located next to the city center was selected for the evaluation of the system due to the high-biomass-burning activity in that area. The background site was the University of Patras for both periods. The performance of the model for the rest of the sites was similar to these examples (Figures S1–S4).
For July 2021, SmartAQ correctly predicted the air quality value in the city center, in Trion Navarchon Square, for 28 out of the 31 days. This corresponds to a 90.3% success rate based on the average daily PM2.5 concentrations (Figure 2a). The same success rate of 90.3% was also obtained for the suburban site of the University of Patras (Figure 2b). During summertime, in the city center, cooking was according to SmartAQ the most important local PM2.5 source [15,16]. In the outskirts of the city, the pollution is mostly regional [15].
During September, the system predicted the air quality index in Trion Navarchon Square for 26 out of the 30 days, with a success rate of 86.7%. Most of the days, the air quality was good, with average daily predicted and measured PM2.5 concentrations lower than 10 μg m−3 (Figure 2c). For the background area, the model predicted the air quality with a success rate of 86.7% also (Figure 2d).
For December, the success rate in the high-biomass-burning-emission area of Kypseli was approximately 60%, mainly due to uncertainties in the meteorological inputs (Figure 2e). At the background University site, SmartAQ predicted the air quality index for all days with a 100% success rate (Figure 2f).
During the spring, the model predicted the PM2.5 air quality index with a success rate of 45% for Kypseli and 81% for the background (Figure 2g,h).

3.1.2. Mean Measured and Predicted Concentrations

Mean predicted and measured PM2.5 concentrations during the studied months are shown in Table 3 and the corresponding SmartAQ mean bias and mean error are shown in Table 4. In July, the highest average PM2.5 concentration was predicted in Trion Navarchon Square, and was close to 10 μg m−3, a behavior consistent with measurements that indicated that the average concentration at this site was 11.2 μg m−3. MB and ME were −0.9 and 2.5 μg m−3, respectively, for this area. The high PM2.5 levels in Trion Navarchon Square were related to local cooking activity due to the high density of restaurants at this site [15,16]. For Georgiou and Drosopoulou Squares that are located in the urban core, PM2.5 was lower than Trion Navarchon Square as these sites are less affected by restaurant emissions. For the suburban sites of Demenika and Koukouli, average PM2.5 concentrations were lower than in the urban core. The lowest mean PM2.5 concentration was predicted and measured in the suburbs of the city. In Platani, the measured and predicted PM2.5 values were 5.8 and 6.5 μg m−3, respectively, with ΜΒ equal to 0.6 μg m−3 and ME 1.9 μg m−3. Similar concentrations were predicted and measured for the University—close to 6 and 7 μg m−3, respectively. In these background sites, local PM2.5 sources were negligible during the summertime and the corresponding PM2.5 was transported from other areas.
During September, a similar behavior to July was observed. The highest mean PM2.5 concentration, close to 9 μg m−3, was observed in Trion Navarchon Square and the lowest of approximately 5 μg m−3 in the city suburbs, at the University of Patras and Platani. The mean bias in Trion Navarchon Square was 1.7 μg m−3 and the mean error 2.3 μg m−3, while at the University 3.2 and 3.3 μg m−3, respectively.
During the wintertime, the highest average PM2.5 concentration of 19.5 μg m−3 was predicted for Kypseli. The highest observed average concentration of 21.5 μg m−3 was also measured in this site. ΜΒ and ME were equal to −2 and 6.6 μg m−3, respectively. The high average concentrations according to SmartAQ were due to wood burning in fireplaces for residential heating. At the University of Patras, predictions and measurements were much lower than Kypseli with mean PM2.5 values of 4.8 and 3.8 μg m−3, respectively. MB was equal to 1 μg m−3 and ME equal to 1.9 μg m−3. These indicate that the system had the ability to predict well the background PM pollution during the winter.
During March, high PM concentrations were observed in Kypseli and Demenika with measured values of 17.7 and 16.6 μg m−3, respectively. The corresponding predicted concentrations were higher and equal to 26.2 and 18.7 μg m−3.

3.1.3. Average Diurnal Patterns

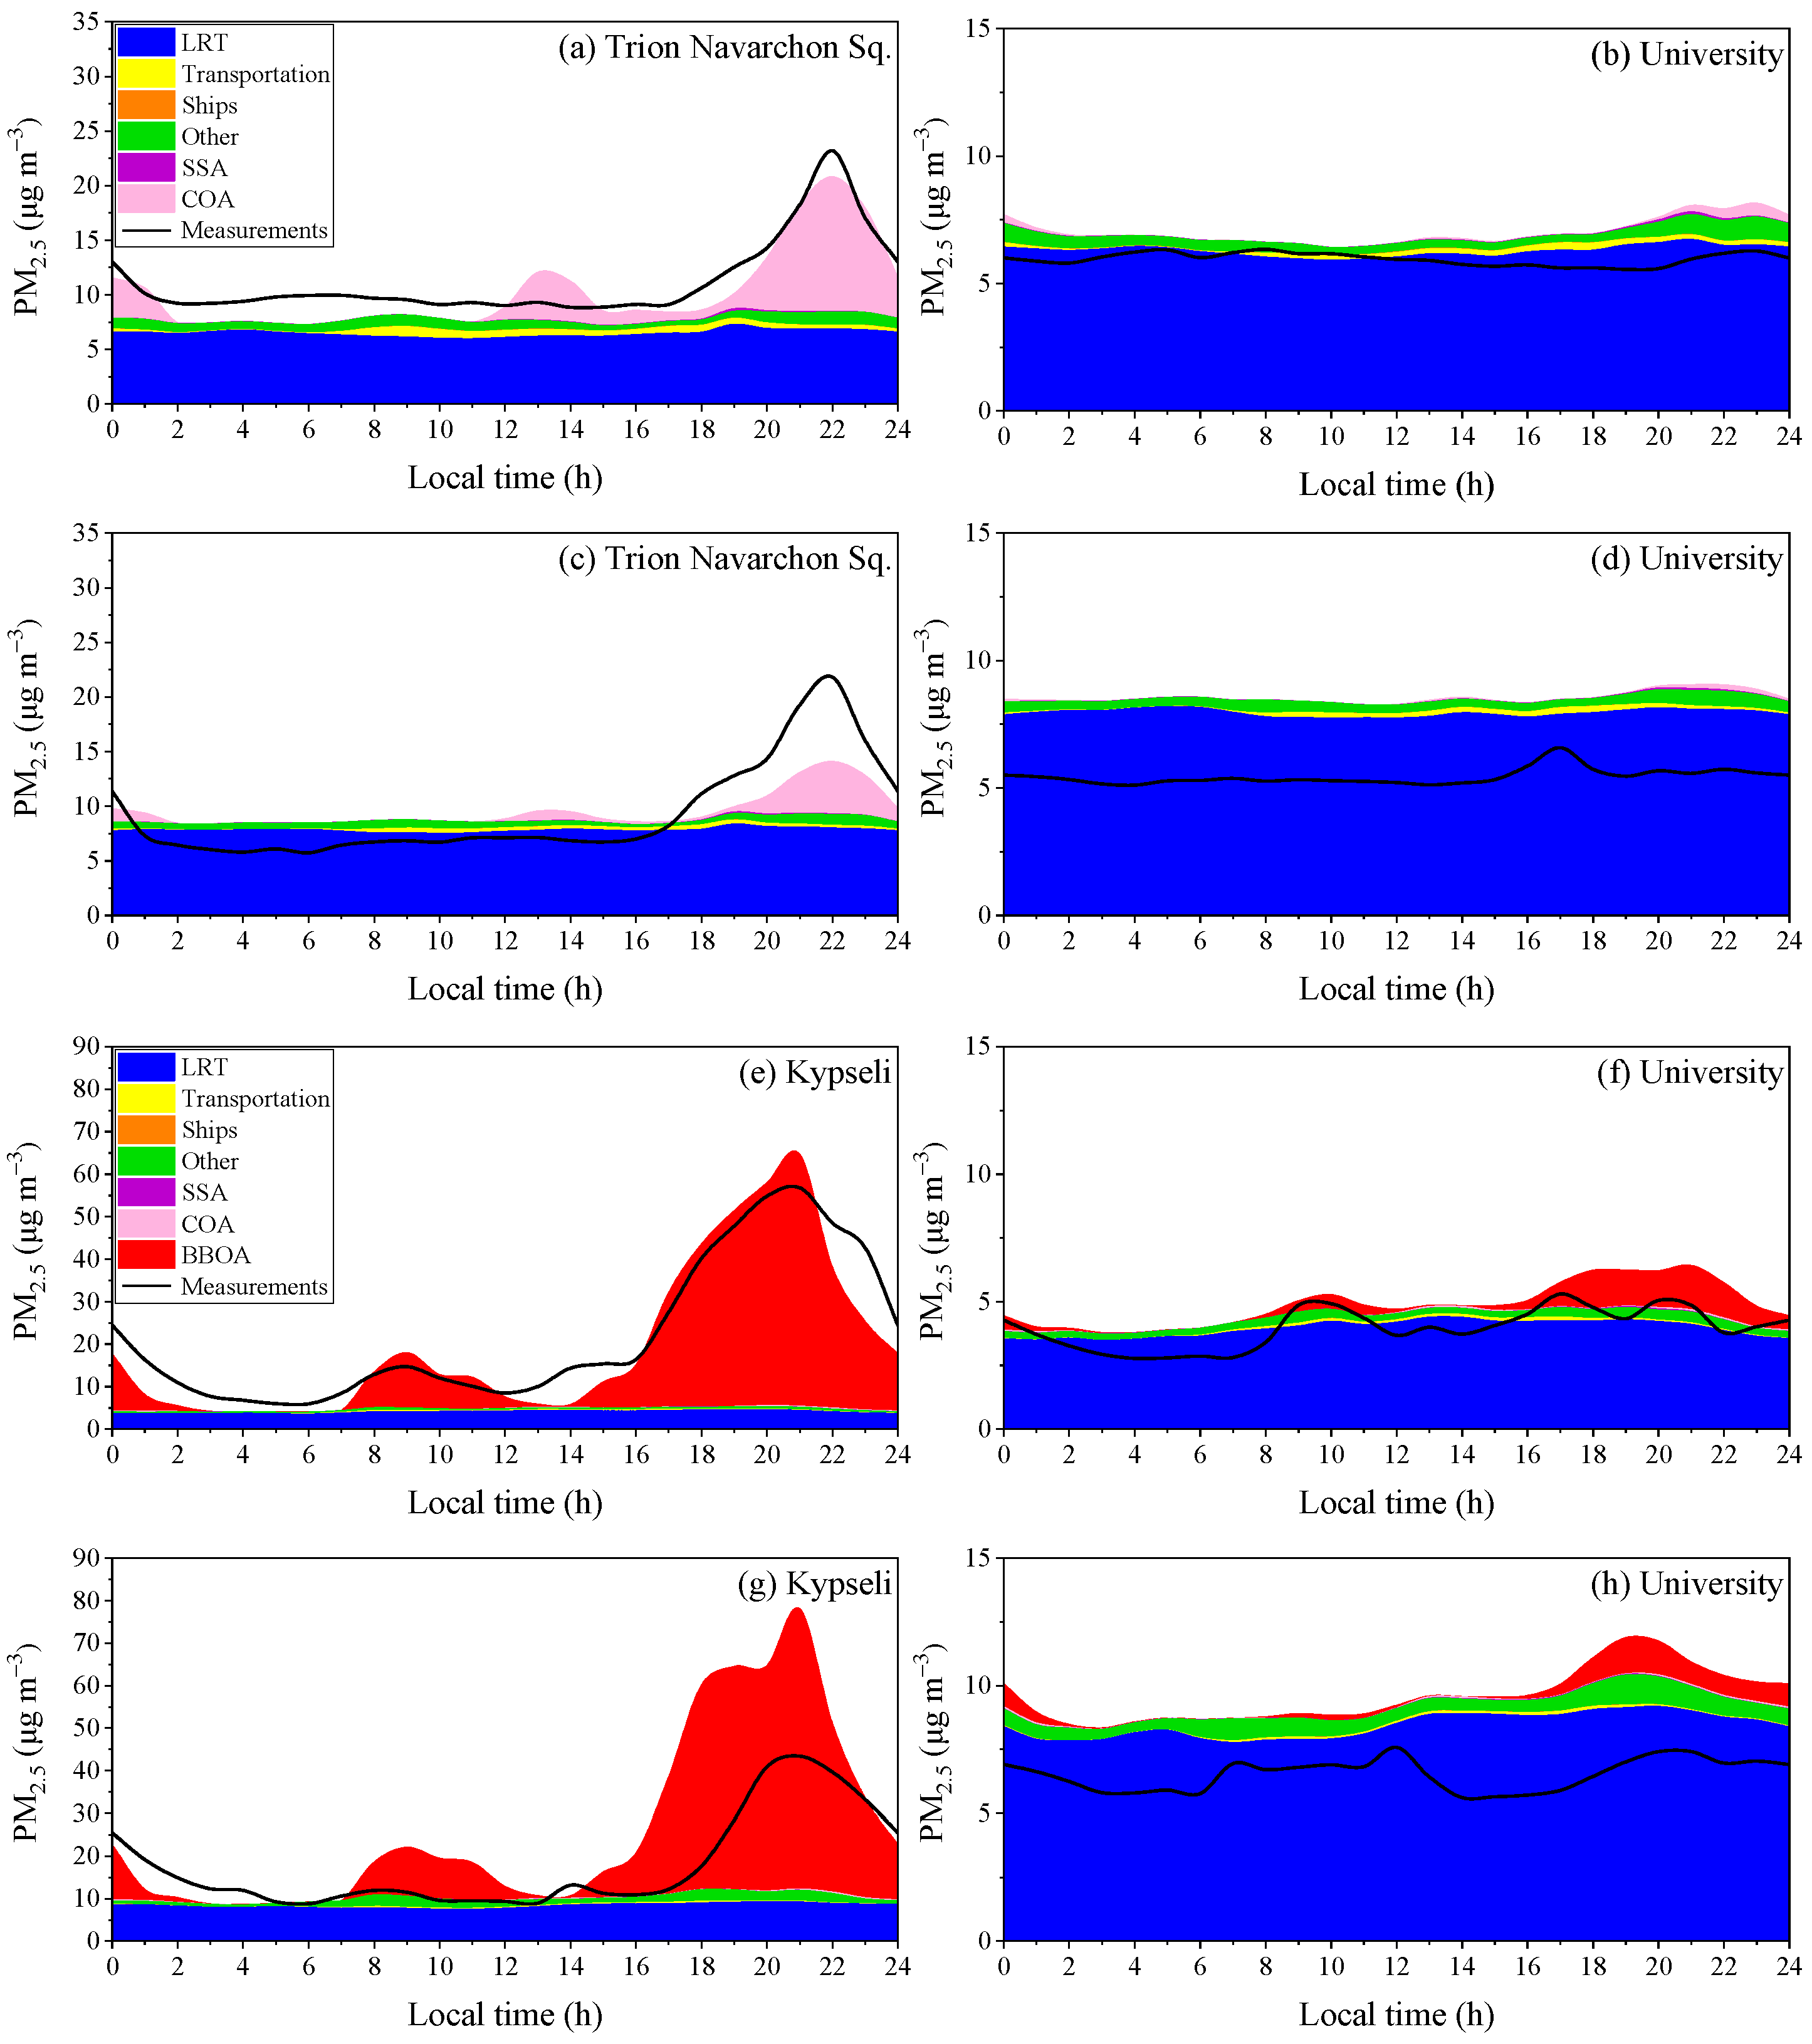
The average predicted diurnal profiles of PM2.5 sources and the measured PM2.5 during the four months are depicted in Figure 3 for an urban/suburban and a background site in Patras. The studied PM sources include both primary and secondary material. During July, the average measured diurnal PM2.5 profile in the city center had a peak during the night from 21:00 to 23:00 LT up to 23 μg m−3 (Figure 3a). The model reproduced the measured nighttime peak related to cooking activity these hours as predicted by PSAT. The cooking source according to SmartAQ contributed 54% to PM2.5 at 21:00 LT. The model predicted another peak from 13:00 to 14:00 LT due to cooking, but there appears to be a tendency towards overestimation. At the University, both measured and predicted average diurnal profiles are similar and flat (Figure 3b). The local PM sources were not significant during summer at this site, while long-range transport was the dominant source of PM2.5 with a contribution of 90% on average. The long-range transport source includes PM emitted or produced outside the 1 × 1 km2 modeling domain and transported into the study area as secondary PM.
During early autumn, the measured PM2.5 profile in the urban core (Trion Navarchon Square) was similar to the summer one (Figure 3c). Both measured and predicted PM2.5 peaks during the night were due to local cooking as PSAT predicted, but there was a tendency towards underestimation. Both predictions and measurements had a lower PM2.5 peak at noon due to cooking. In the suburbs, there was an overprediction mainly due to overestimation of long-range transport. A peak was measured at 17:00 LT, probably due to local emissions (Figure 3d).
For December, in the high-biomass-burning-emission area of Kypseli, SmartAQ reproduced well the measured high peak from 19:00 to 22:00 LT as well as the morning one due to wood burning in fireplaces, but also the overall behavior of measured PM2.5 (Figure 3e). The contribution of residential biomass burning to PM2.5 was predicted to be 76% on average. At the background site of the University, both measurements and predictions indicated a small peak of 5 μg m−3 from 9:00 to 10:00 LT mainly due to residential biomass burning. Another peak was measured at 20:00 LT. This peak was predicted by the model, but it was 1 h later and it was related to wood burning (Figure 3f). The main source of fine PM at the suburbs was regional pollution at 81% on average and residential wood burning contributed 11%.
During springtime, in the suburban area of Kypseli, there was an overprediction of the nighttime biomass burning peak (Figure 3g). During the morning, from 8:00 to 11:00 LT, the predicted PM2.5 was higher than the measured, probably due to the assumed biomass burning OA emissions. The rest of the day SmartAQ reproduced well the measured average profile. For the University site, there was also a small overprediction of PM2.5 concentrations, probably due to overestimation of long-range transport of pollution (Figure 3h). The measured peaks in the morning were not predicted by the model. This could be due to underestimation of wood burning emissions in this site or meteorological errors. During the evening, the model predicted one peak at 19:00 LT mainly due to wood burning in fireplaces and non-road transport, while the measurements indicated that the peak was 1 h later.

3.1.4. Detailed Temporal Variations

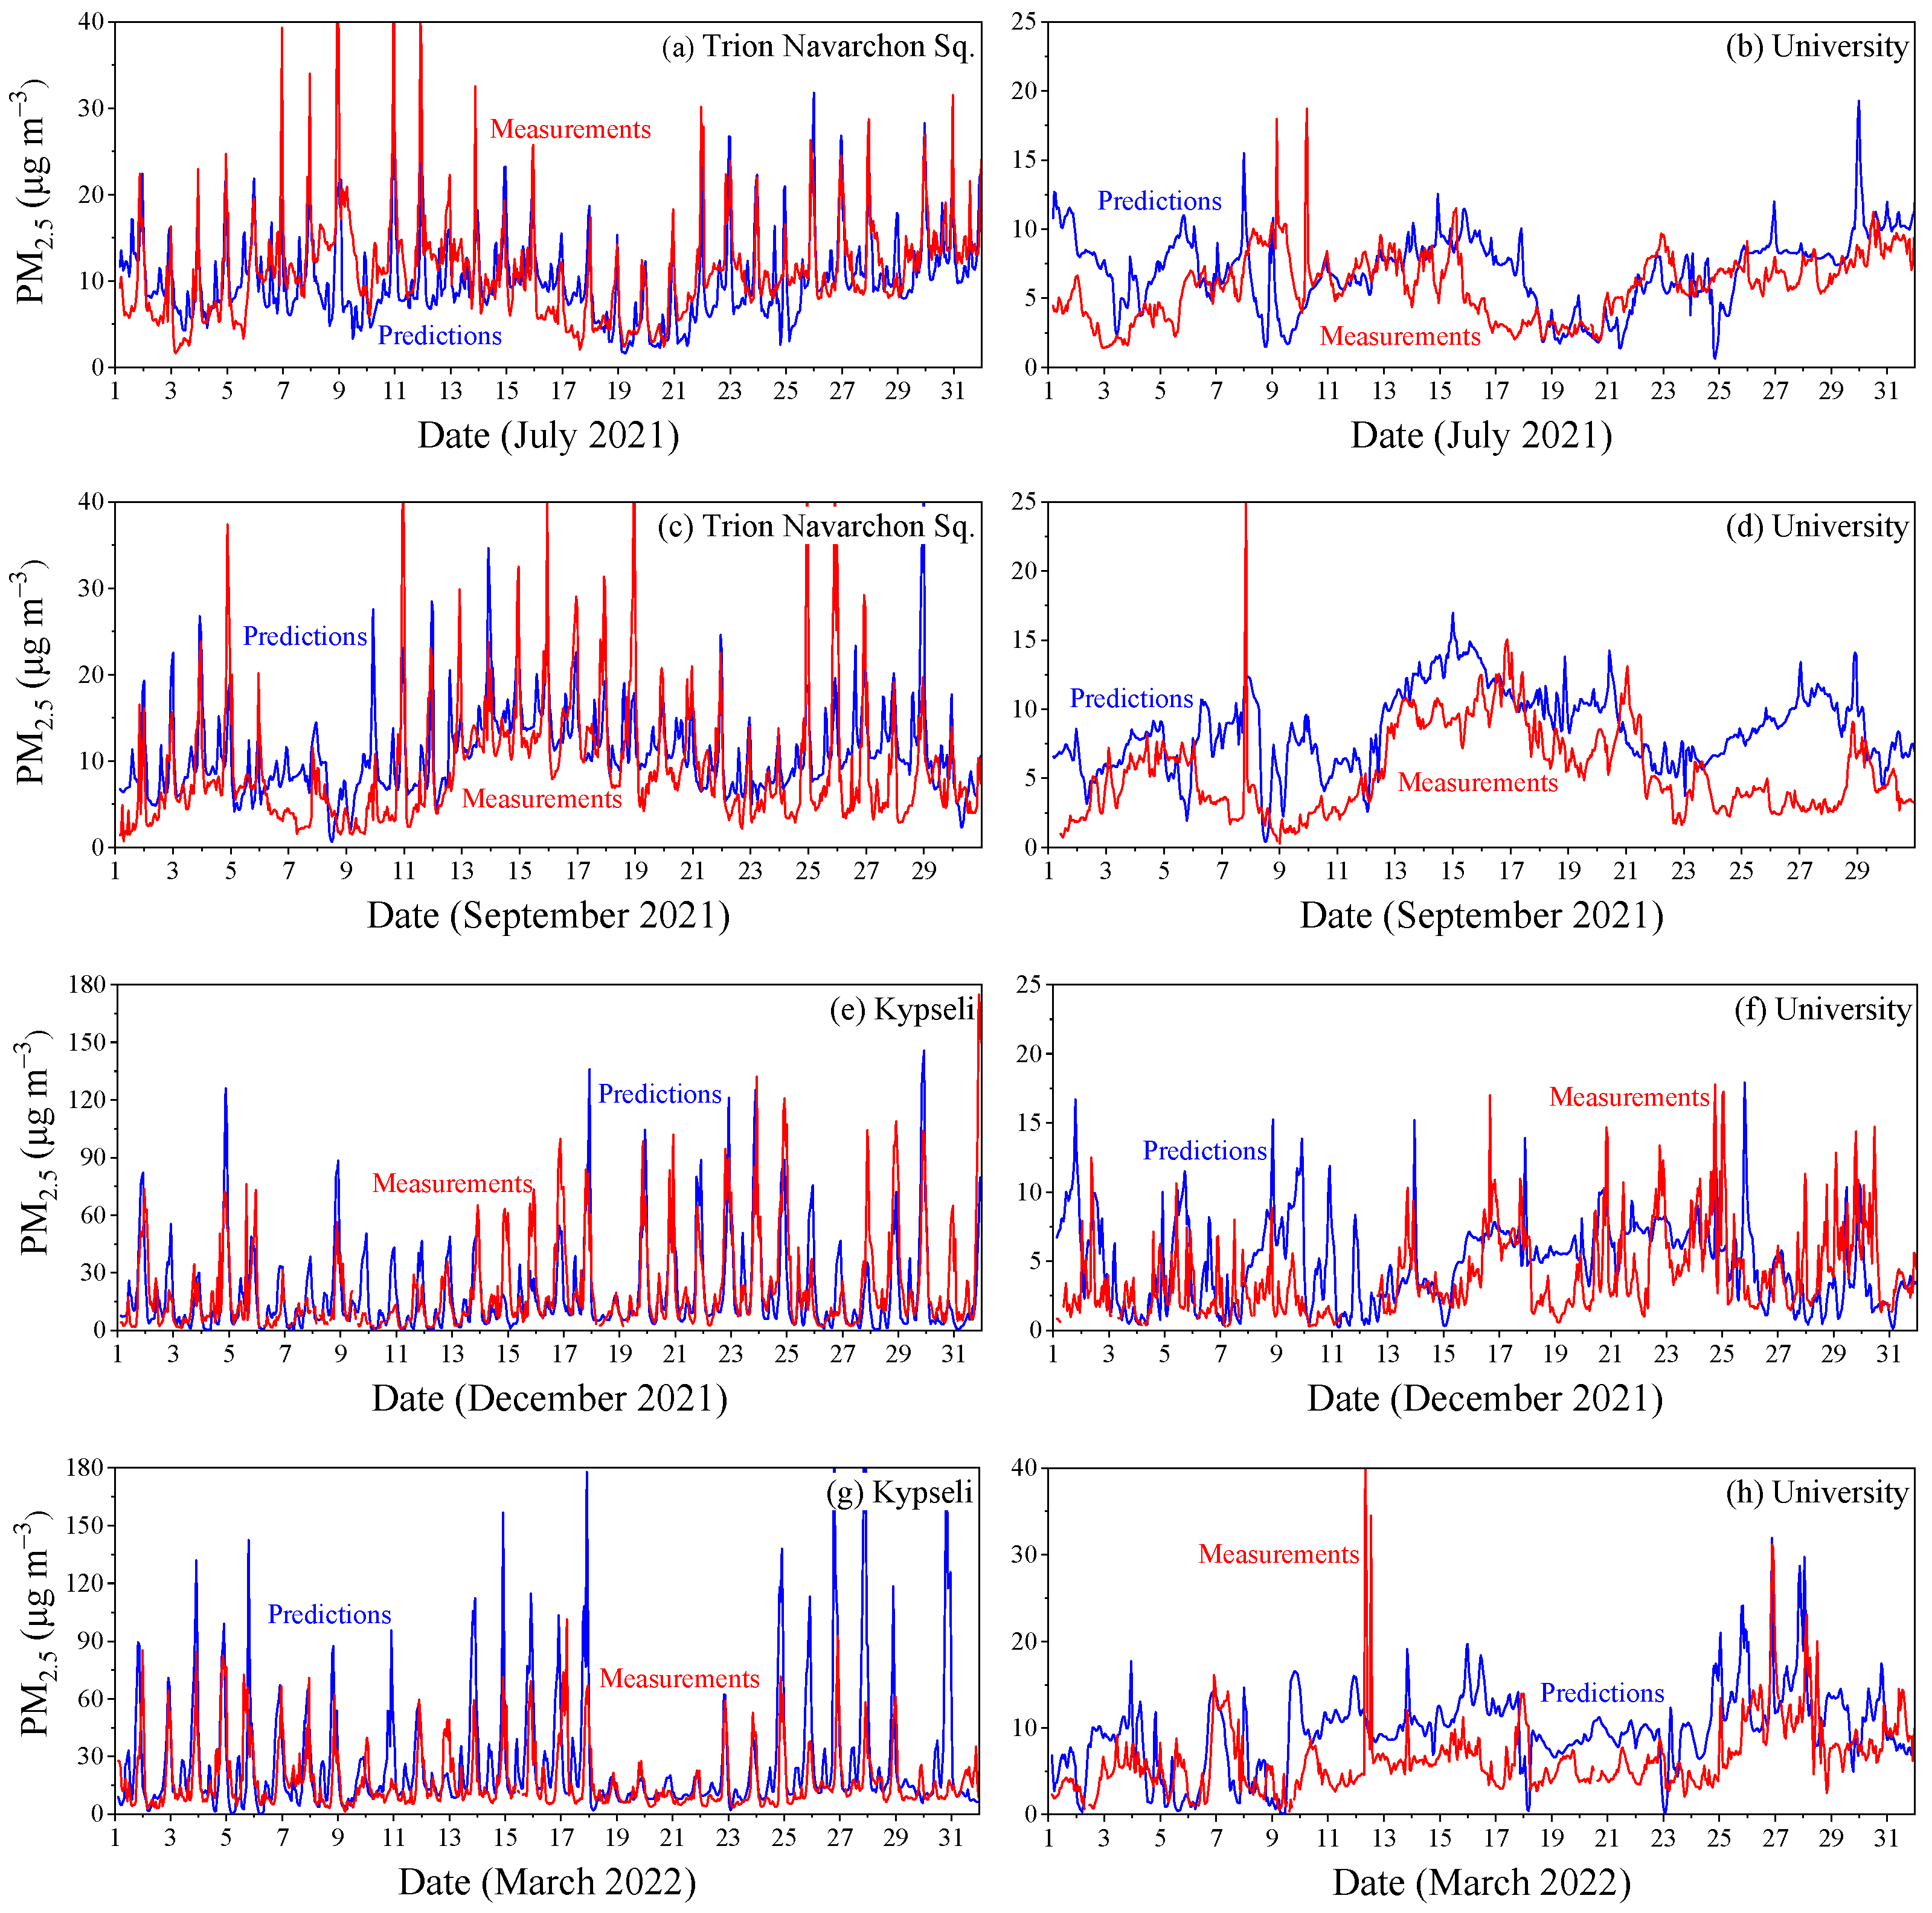
Timeseries of hourly predicted and measured PM2.5 concentrations are shown in Figure 4 for an urban and a background site for all studied months. For July, in Trion Navarchon Square, high PM2.5 levels were measured during most nights reaching up tο 40 μg m−3 (Figure 4a). PMCAMx reproduced the high measured peaks during the nighttime and the smaller peaks during noon due mainly to cooking. At the University, there were no high PM2.5 peaks and concentrations had a relatively flat profile (Figure 4b). The PM2.5 at this site was due to long-range transport and not due to emissions from local sources.
For autumn, PM2.5 concentrations in the city center were as high as the summer ones. The model reproduced the high nighttime peaks that were related to cooking. PM2.5 levels during most nights were higher than 30 μg m−3 (Figure 4c). In the outskirts of the city, the corresponding concentrations were lower due to minor PM sources in this site. There was an overprediction of PM2.5 concentrations during the simulated period (Figure 4d).
During December, high PM2.5 levels were measured in Kypseli from early in the afternoon until midnight (Figure 4e). The model reproduced most of the high peaks during the nighttime due to intense wood burning, but also the overall behavior of measured PM2.5. In the suburbs of the city, the low wood burning emissions led to lower PM2.5 concentrations (Figure 4f).
During springtime, SmartAQ reproduced the high PM2.5 peaks in Kypseli, but there was a tendency towards overprediction (Figure 4g). PM2.5 values up to 90 μg m−3 were predicted for most nights. In the outskirts of the city, the corresponding concentrations were much lower during the whole month (Figure 4h).

3.1.5. Model Performance

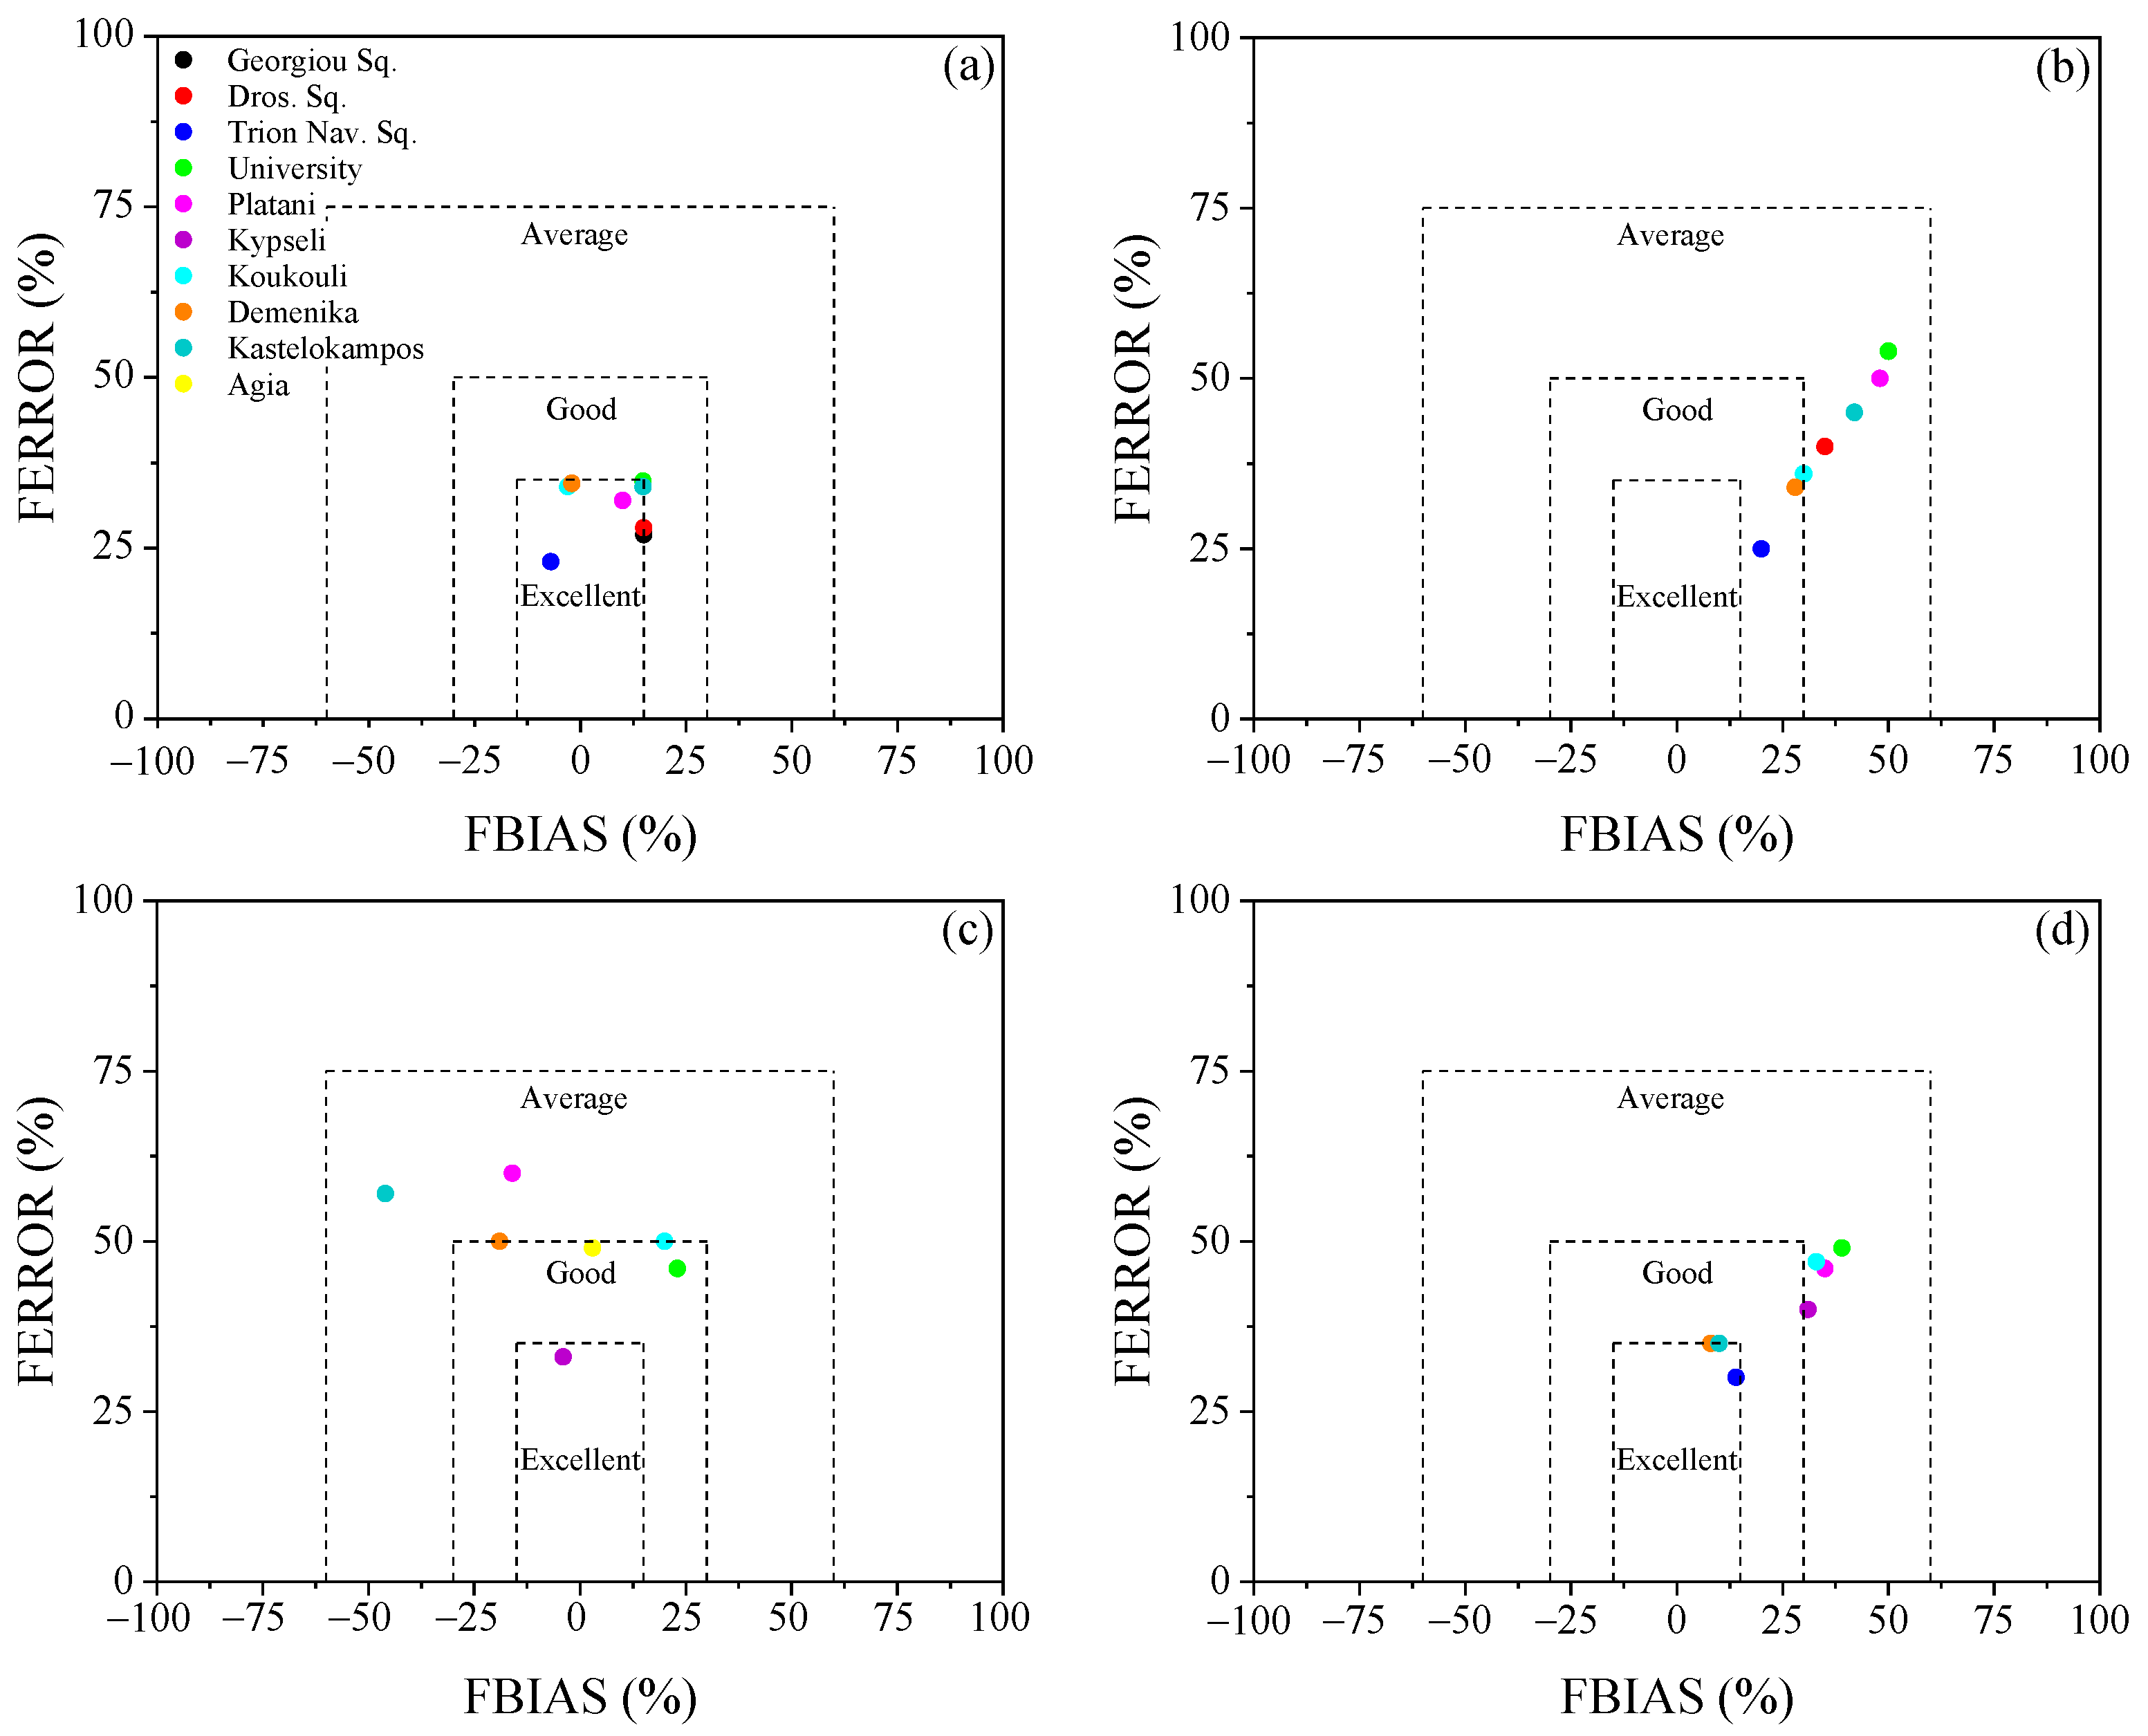
PM2.5 model performance was evaluated for the 10 sites in Patras using first daily temporal resolution. Soccer plots showing fractional bias as a function of fractional error are used to illustrate this performance (Figure 5). During the summer, the model performance was excellent for all sites (Fbias < 15% and Ferror < 35%) (Figure 5a). During September, the SmartAQ performance was good for Trion Navarchon Square, Demenika, and Koukouli, while it was average for Drosopoulou Square, Kastelokampos, and for the background (University and Platani) (Figure 5b). For December, PM2.5 model performance was excellent for the high biomass burning emissions area of Kypseli, good for Agia, Demenika, Koukouli, and University, and average for Platani and Kastelokampos (Figure 5c). During the spring, SmartAQ performance was excellent for Trion Navarchon Square and Demenika, good for Kypseli and Koukouli, and average for the background sites of the University and Platani (Figure 5d).

3.2. NOx Predictions

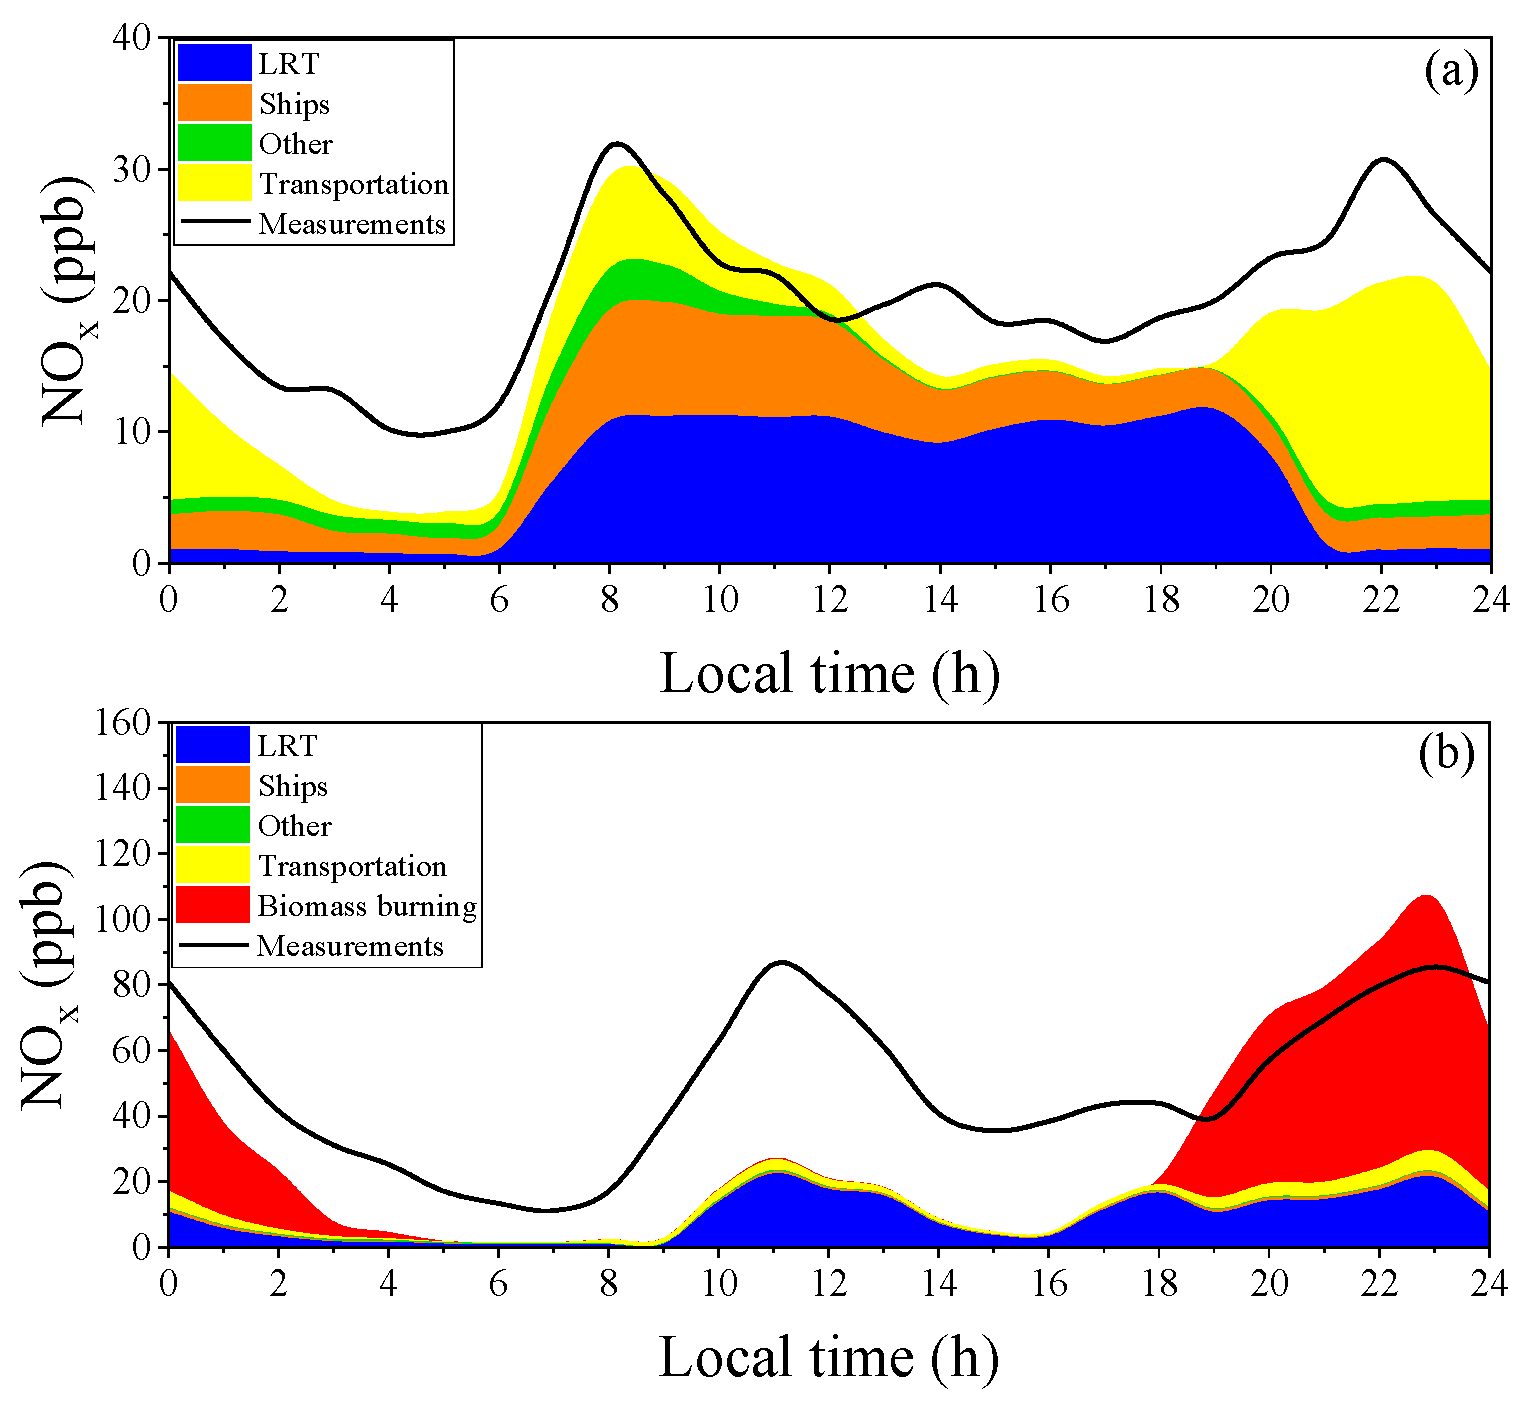
The average predicted diurnal profile of NOx sources and the measured NOx diurnal profile for Drosopoulou Square during July and December 2021 is depicted in Figure 6. During summer, SmartAQ reproduced the high measured NOx peak early in the morning (8:00 LT) and at night, from 22:00 to 23:00 LT. This is mainly due to local transportation according to PSAT (Figure 6a), which was responsible for 30% of the NOx on average. During the night, the local traffic contribution to the predicted NOx increases to 80% at 22:00 LT. In addition, the model reproduced well the average overall behavior of measured NOx for the rest of the day. The average predicted NOx concentration was about 16 ppb and the measured was 20 ppb. Mean bias for daily averaged NOx concentrations was −3.8 ppb and mean error was equal to 5.2 ppb, while Fbias and Ferror were −23% and 30%, respectively. For the wintertime, the system reproduced the high measured NOx peak during the nighttime, which is mainly due to residential biomass burning according to PSAT (Figure 6b). During the rest of the day, SmartAQ underpredicted the measured NOx values mainly due to uncertainties in the corresponding domestic biomass burning and transport emissions during winter. Mean bias for daily averaged NOx concentrations was −19 ppb and mean error was equal to 26 ppb, while Fbias and Ferror were −55% and 70%, respectively.
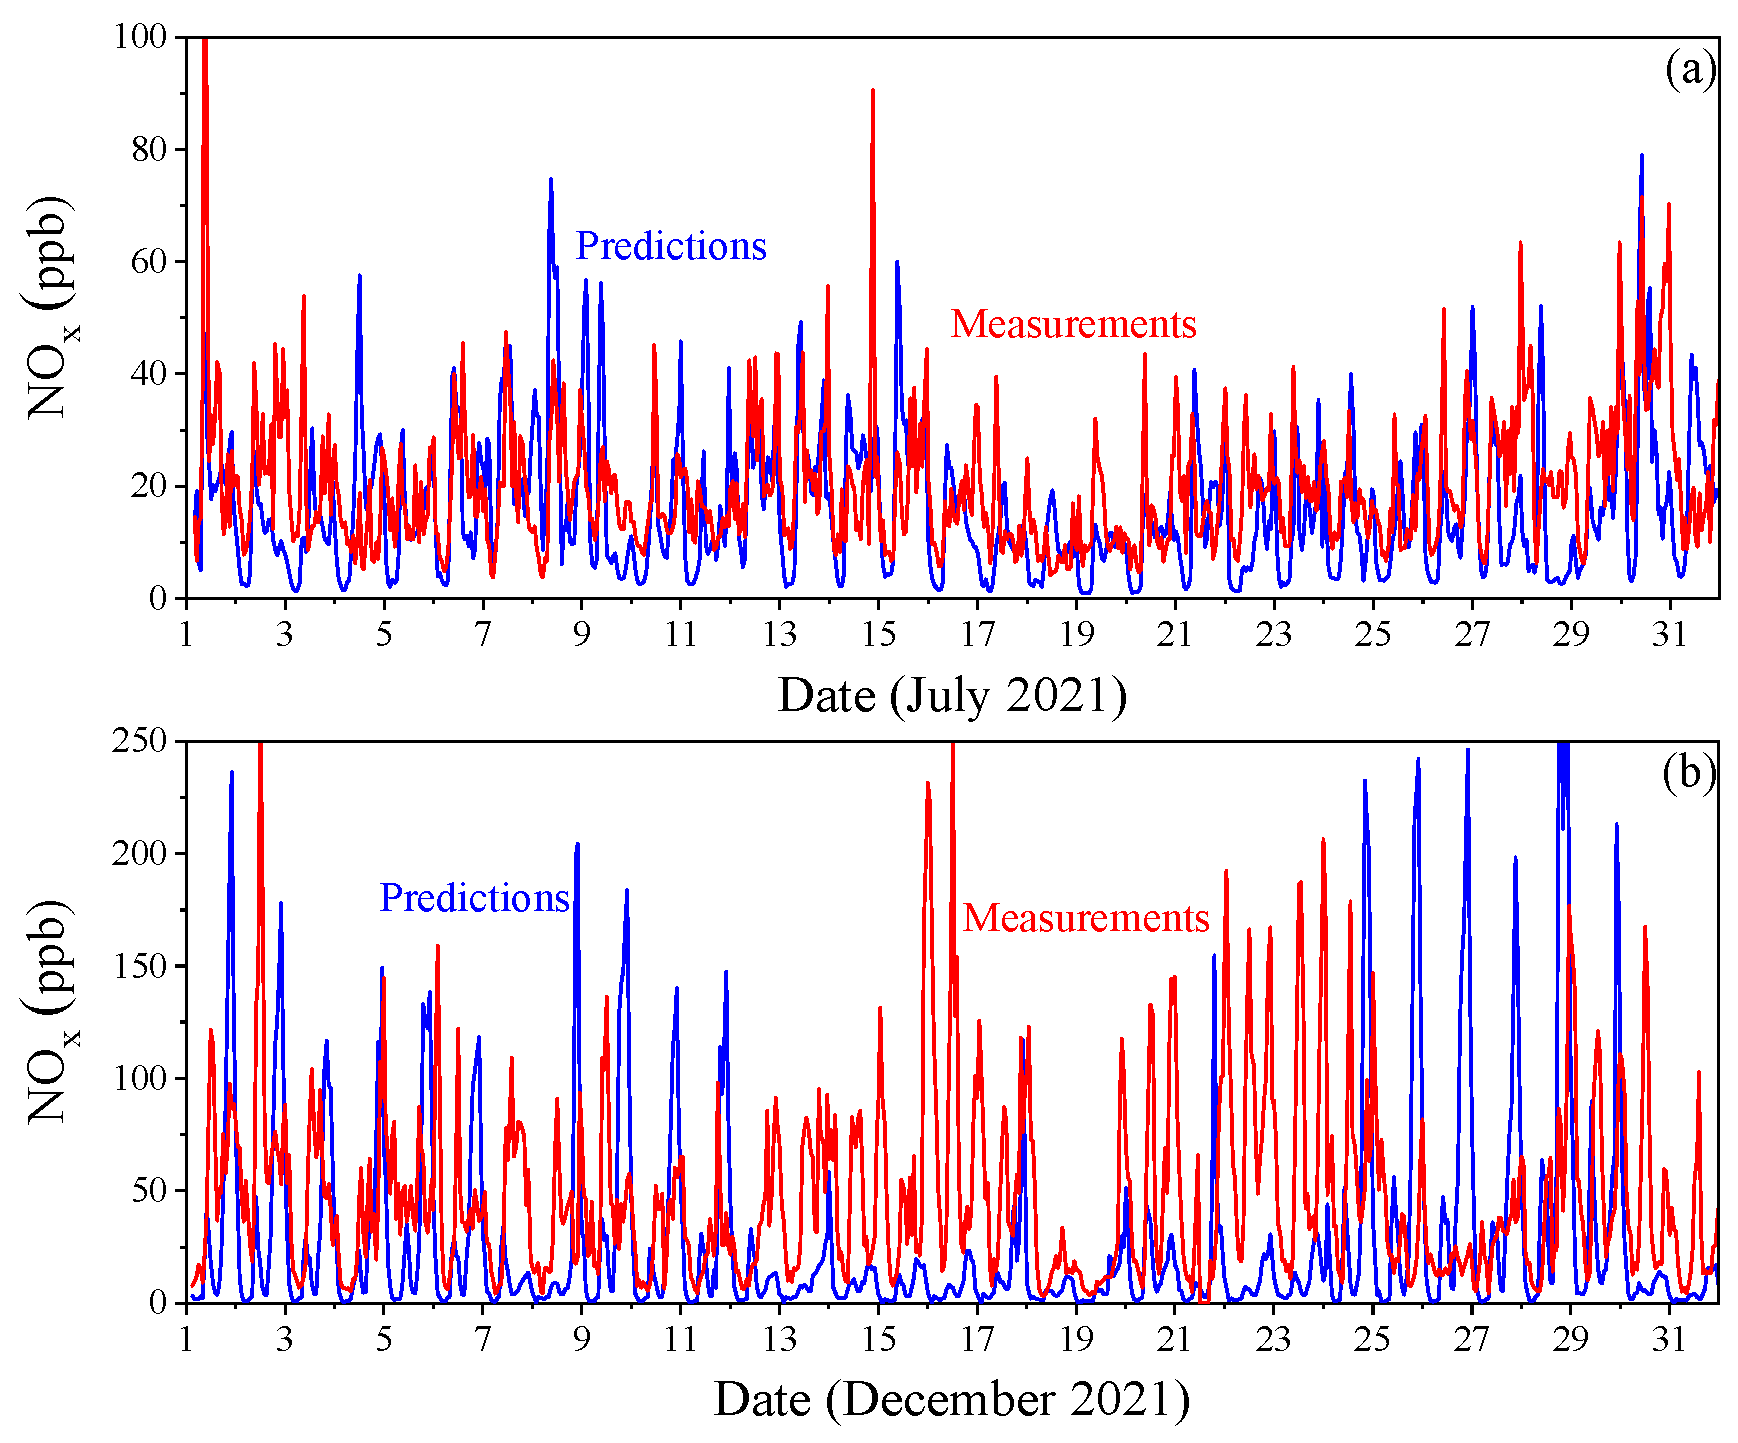
Predicted and measured NOx hourly variations for July and December 2021 are shown in Figure 7. During the summer month, in Drosopoulou Square, both SmartAQ and measurements indicate high NOx levels early in the morning and during the nighttime. NOx is emitted mainly from transportation and peaks during rush hours. For wintertime, the SmartAQ reproduced most of the measured NOx peaks, but there are days (12–17/12 and 22–24/12) that it seriously underpredicted the corresponding values due to uncertainties in residential biomass burning emissions and meteorology.
For July, the model performance of hourly NOx was average for Drosopoulou Square with fractional bias and fractional gross error of −35% and 60%. For December, NOx model performance had fundamental problems that need to be corrected in future work (Fbias = −80% and FGE = 100%).

3.3. O3 Predictions

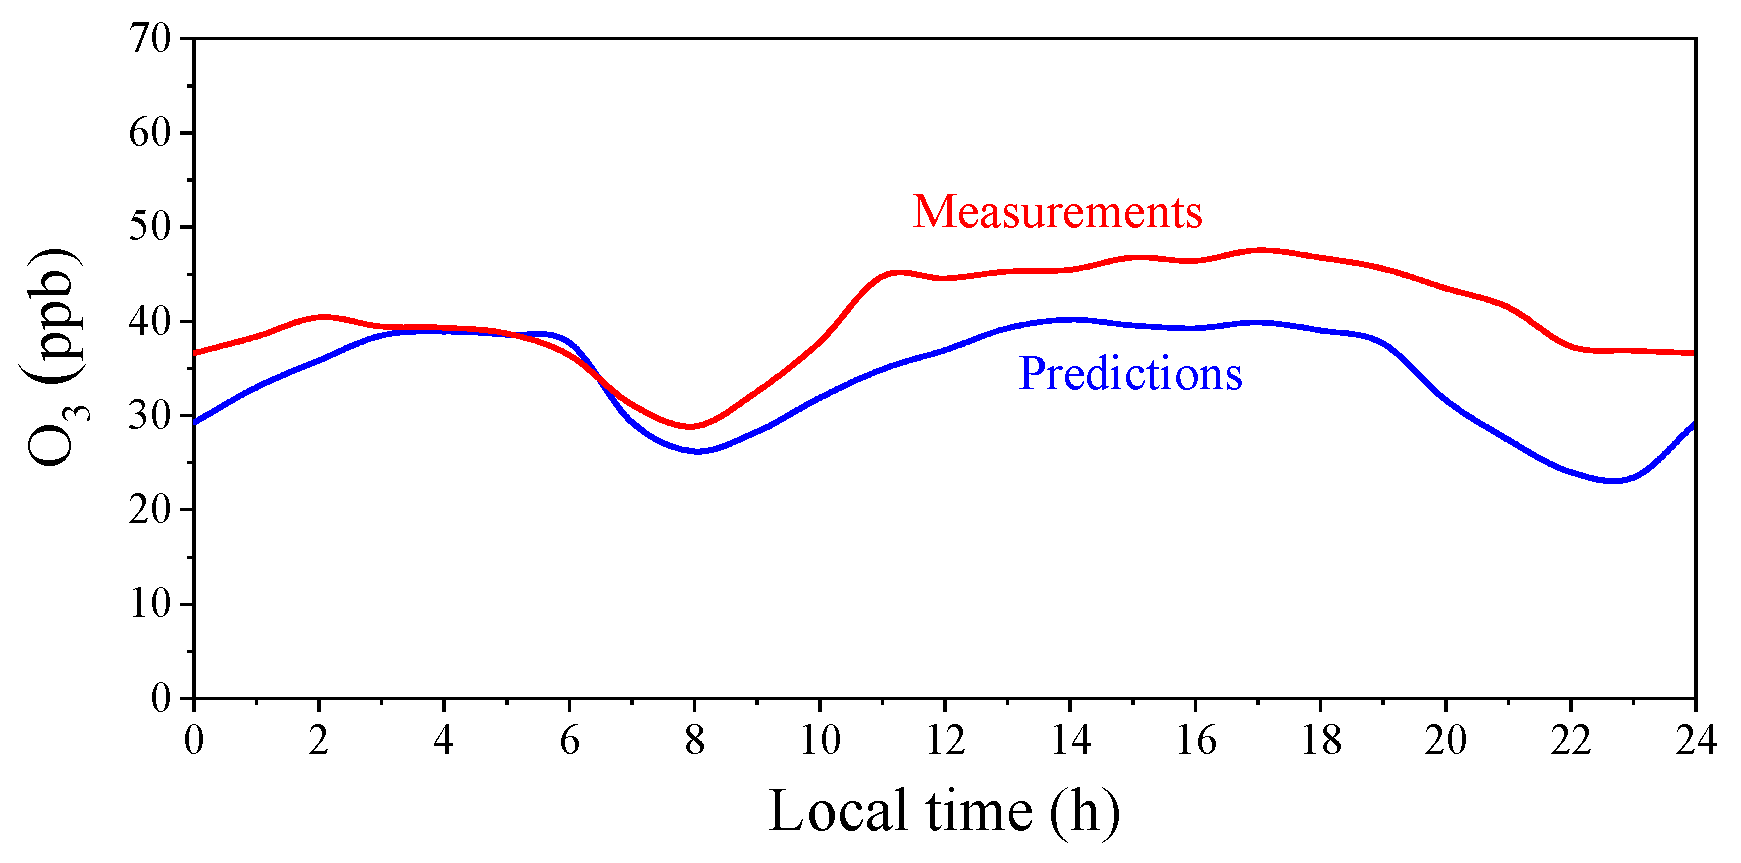
The average diurnal profile of predicted and measured O3 during July 2021 indicated good performance with a tendency towards underestimation of O3 in Drosopoulou Square (Figure 8). During the day, predicted and measured O3 reached a minimum at 8:00 LT when the NOx peaked, while during the night the predicted minimum was 14 ppb less than the measured value.
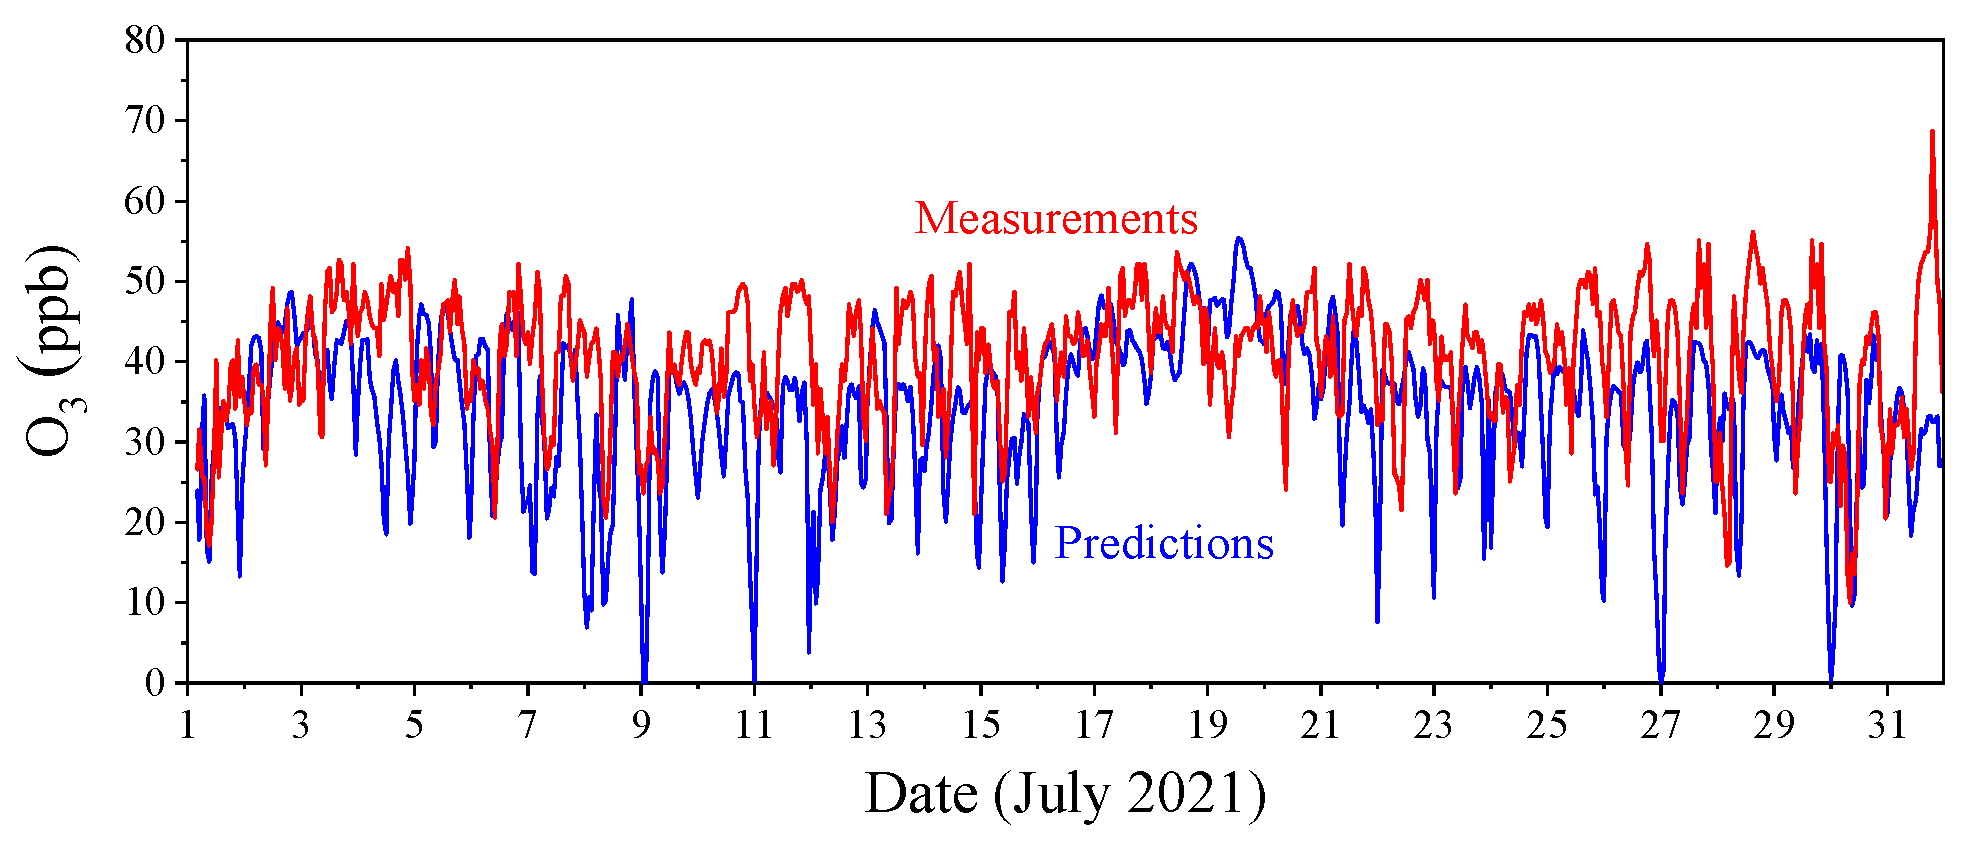
Time series of hourly O3 measurements and predictions during that period for Drosopoulou Square are shown in Figure 9. SmartAQ reproduces the peaks and the overall behavior of measurements, but most of the days there was an underprediction of the peaks. The average measured O3 concentration during the month was 40 ppb and the predicted 34 ppb. Mean bias was of about −5.9 ppb and mean error 6.6 ppb. During the summertime, normalized mean bias in hourly averaged O3 concentrations was −15% and the normalized mean error 22%. Those values achieved the performance goals for hourly O3 modeling of EPA [30] and the model performance is considered good [28].

4. Conclusions

We evaluated the SmartAQ performance for a summer, autumn, winter, and spring month for the city of Patras at high spatial resolution of 1 × 1 km2. The system had excellent PM2.5 performance during the summertime, with a mean bias and mean error of approximately −0.9 and 2.5 μg m−3, respectively, in the city center, in the high-restaurant-density area. SmartAQ reproduced the high measured PM2.5 nighttime peaks that were due to cooking activity. In the suburbs, the system reproduced the transported PM, with mean bias ranging from 0.6–1 μg m−3 and mean error close to 2 μg m−3. Long-range transport was the most important PM source in the city center (63% on average), while cooking was the dominant local PM source of pollution in the urban core during summer (24% of the fine PM on average). During the nighttime, at 21:00 LT, cooking was the dominant source of PM2.5, contributing approximately 55% of the total concentration.
PM2.5 concentrations during September were similar to the summer ones for both the urban core and suburbs. In autumn, local PM sources were similar to the summer ones, while cooking was again the dominant local source (20% of the fine PM on average) in the urban core.
During winter, the highest PM2.5 levels were predicted for the suburban areas that are characterized by high OA emissions from fireplaces. The model predictions at these suburban areas had a mean bias from −2 to 2.5 μg m−3 and mean error less than 8.5 μg m−3, while for the background sites mean bias ranged from −0.8 to 1 μg m−3 and mean error up to 3 μg m−3. Residential biomass burning dominated the particulate source contributions during winter in the urban and suburban core (67–76% on average). The SmartAQ system had the ability to reproduce the high PM2.5 nighttime and morning peaks in the suburban areas due to wood burning in fireplaces, but also the transported pollution at the background sites.
For early spring, PM2.5 concentrations in the high-biomass-burning-emission areas were overestimated, while there was an overprediction also of background PM pollution probably due to overestimation of transported pollution in this site.
Model performance of NOx during summer was average in the city center mainly due to uncertainties in the transportation sector emissions, while during the wintertime NOx model performance had fundamental problems due to the lack of biomass burning emissions. On the other hand, O3 model performance was good for the city center in summertime. SmartAQ reproduced well the NOx and O3 concentrations during the summertime, but there was a serious underestimation of wintertime NOx during the day. The major local source of NOx during the summer was road transport while both biomass burning and transportation were significant during the winter. The wintertime sources of NOx, especially during the day need to be reevaluated.
Uncertainties in meteorology lead to errors in forecasts, especially during winter. Uncertainties in particle phase measurements by the low-cost sensors may also contribute to the discrepancies between predictions and observations. A better spatial and day-to-day distribution of residential biomass burning emissions in the urban area would contribute to the reduction in wintertime prediction errors. In addition, uncertainties in emission rates used by SmartAQ can lead to errors in predicted concentrations and, as a result, potential corresponding errors in predicted sources contributions.

Supplementary Materials

The following supporting information can be downloaded at: https://www.mdpi.com/article/10.3390/atmos15010008/s1, Figure S1: Daily average predicted and measured PM2.5 concentrations (μg m−3) for (a) Georgiou Square, (b) Drosopoulou Square, (c) Koukouli, (d) Platani, (e) Kastelokampos and (f) Demenika during July 2021; Figure S2: Daily average predicted and measured PM2.5 concentrations (μg m−3) for (a) Drosopoulou Square, (b) Koukouli, (c) Platani, (d) Kastelokampos and (e) Demenika during September 2021; Figure S3: Daily average predicted and measured PM2.5 concentrations (μg m−3) for (a) Agia, (b) Koukouli, (c) Platani, (d) Kastelokampos and (e) Demenika during December 2021. Different scales are used; Figure S4: Daily average predicted and measured PM2.5 concentrations (μg m−3) for (a) Trion Navarchon Square, (b) Koukouli, (c) Platani, (d) Kastelokampos and (e) Demenika during March 2022. Different scales are used.

Author Contributions

E.S., K.S. and I.K. carried out the simulations, E.S. carried out the analysis, E.S. wrote the final manuscript with support from S.N.P., K.S., I.K., D.P., I.D.A., G.F. and S.N.P. supervised and coordinated the work. All authors provided critical feedback and helped shape the research, analysis, and manuscript. All authors have read and agreed to the published version of the manuscript.

Funding

This work was supported by the EU H2020 RI-URBANS project (grant 101036245).

Institutional Review Board Statement

Not applicable.

Informed Consent Statement

Not applicable.

Data Availability Statement

The model results and data used in the present study are available upon request due to restrictions ([email protected]).

Acknowledgments

We thank the Directorate of Environment and Spatial Planning of the Region of Western Greece for the provision of data and their overall cooperation.

Conflicts of Interest

The authors declare no conflict of interest.

References

  1. Manisalidis, I.; Stavropoulou, E.; Stavropoulos, A.; Bezirtzoglou, E. Environmental and Health Impacts of Air Pollution: A Review. Front. Public Health 2020, 8. [Google Scholar] [CrossRef] [PubMed]
  2. World Health Organization (WHO). Fact Sheet: Ambient (Outdoor) Air Pollution. 2022. Available online: https://www.who.int/news-room/fact-sheets/detail/ambient-(outdoor)-air-quality-and-health/ (accessed on 10 October 2023).
  3. EPA (Environmental Protection Agency). Health and Environmental Effects of Particulate Matter (PM). 2023. Available online: https://www.epa.gov/pm-pollution/health-and-environmental-effects-particulate-matter-pm (accessed on 10 October 2023).
  4. Marécal, V.; Peuch, V.-H.; Andersson, C.; Andersson, S.; Arteta, J.; Beekmann, M.; Benedictow, A.; Bergström, R.; Bessagnet, B.; Cansado, A.; et al. A regional air quality forecasting system over Europe: The MACC-II daily ensemble production. Geosci. Model Dev. 2015, 8, 2777–2813. [Google Scholar] [CrossRef]
  5. Honoré, C.; Rouil, L.; Vautard, R.; Beekmann, M.; Bessagnet, B.; Dufour, A.; Elichegaray, C.; Flaud, J.-M.; Malherbe, L.; Meleux, F.; et al. Predictability of European air quality: Assessment of 3 years of operational forecasts and analyses by the PREV’AIR system. J. Geophys. Res. 2008, 113, D04301. [Google Scholar] [CrossRef]
  6. Brasseur, G.P.; Xie, Y.; Petersen, A.K.; Bouarar, I.; Flemming, J.; Gauss, M.; Jiang, F.; Kouznetsov, R.; Kranenburg, R.; Mijling, B.; et al. Ensemble forecasts of air quality in eastern China–Part 1: Model description and implementation of the MarcoPolo-Panda prediction system, version 1. Geosci. Model Dev. 2019, 12, 33–67. [Google Scholar] [CrossRef]
  7. Chai, T.; Kim, H.-C.; Lee, P.; Tong, D.; Pan, L.; Tang, Y.; Huang, J.; McQueen, J.; Tsidulko, M.; Stajner, I. Evaluation of the United States National Air Quality Forecast Capability experimental real-time predictions in 2010 using Air Quality System ozone and NO2 measurements. Geosci. Model Dev. 2014, 6, 1831–1850. [Google Scholar] [CrossRef]
  8. CAMS. Regional Production, Updated Documentation Covering All Regional Operational Systems and the ENSEMBLE. ECMWF Copernicus Report. 2020. Available online: https://atmosphere.copernicus.eu/sites/default/files/2020-09/CAMS50_2018SC2_D2.0.2-U2_Models_documentation_202003_v2.pdf (accessed on 22 October 2023).
  9. Katragkou, E.; Kioutsioukis, I.; Poupkou, A.; Lisaridis, I.; Markakis, K.; Karathanasis, S.; Melas, D.; Balis, D. An air quality study for Greece with the MM5/CAMx modelling system. In Proceedings of the Electronic ‘Envisat Symposium 2007’, Montreux, Switzerland, 23–27 April 2007. [Google Scholar]
  10. Allan, J.D.; Williams, P.I.; Morgan, W.T.; Martin, C.L.; Flynn, M.J.; Lee, J.; Nemitz, E.; Phillips, G.J.; Gallagher, M.W.; Coe, H. Contributions from transports solid fuel burning, and cooking to primary organic aerosols in two UK cities. Atmos. Chem. Phys. 2010, 10, 647–668. [Google Scholar] [CrossRef]
  11. Mohr, C.; DeCarlo, P.F.; Heringa, M.F.; Chirico, R.; Slowik, J.G.; Richter, R.; Reche, C.; Alastuey, A.; Querol, X.; Seco, R.; et al. Identification and quantification of organic aerosol from cooking and other sources in Barcelona using aerosol mass spectrometer data. Atmos. Chem. Phys. 2012, 12, 1649–1665. [Google Scholar] [CrossRef]
  12. Crippa, M.; DeCarlo, P.F.; Slowik, J.G.; Mohr, C.; Heringa, M.F.; Chirico, R.; Poulain, L.; Freutel, F.; Sciare, J.; Cozic, J.; et al. Wintertime aerosol chemical composition and source apportionment of the organic fraction in the metropolitan area of Paris. Atmos. Chem. Phys. 2013, 13, 961–981. [Google Scholar] [CrossRef]
  13. Kostenidou, E.; Florou, K.; Kaltsonoudis, C.; Tsiflikiotou, M.; Vratolis, E.; Eleftheriadis, K.; Pandis, S.N. Sources and chemical characterization of organic aerosol during the summer in the eastern Mediterranean. Atmos. Chem. Phys. 2015, 15, 11355–11371. [Google Scholar] [CrossRef]
  14. Florou, K.; Papanastasiou, D.K.; Pikridas, M.; Kaltsonoudis, C.; Louvaris, E.; Gkatzelis, G.I.; Patoulias, D.; Mihalopoulos, N.; Pandis, S.N. The contribution of wood burning and other pollution sources to wintertime organic aerosol levels in two Greek cities. Atmos. Chem. Phys. 2017, 17, 3145–3163. [Google Scholar] [CrossRef]
  15. Siouti, E.; Skyllakou, K.; Kioutsioukis, I.; Patoulias, D.; Fouskas, G.; Pandis, S.N. Development and application of the SmartAQ high-resolution air quality and source apportionment forecasting system for European urban areas. Atmosphere 2022, 13, 1693. [Google Scholar] [CrossRef]
  16. Siouti, E.; Skyllakou, K.; Kioutsioukis, I.; Ciarelli, G.; Pandis, S.N. Simulation of the cooking organic aerosol concentration variability in an urban area. Atmos. Environ. 2021, 265, 118710. [Google Scholar] [CrossRef]
  17. Siouti, E.; Kilafis, K.; Kioutsioukis, I.; Pandis, S.N. Simulation of the influence of residential biomass burning on air quality in an urban area. Atmos. Environ. 2023, 309, 119897. [Google Scholar] [CrossRef]
  18. Skamarock, W.C.; Klemp, J.B.; Dudhia, J.; Gill, D.O.; Liu, Z.; Berner, J.; Wang, W.; Powers, J.G.; Duda, M.G.; Barker, D.M.; et al. A Description of the Advanced Research WRF Model Version 4.1; (No. NCAR/TN-556+STR); National Center for Atmospheric Research: Boulder, CO, USA, 2019. [Google Scholar] [CrossRef]
  19. Kuenen, J.J.P.; Visschedijk, A.J.H.; Jozwicka, M.; Denier van der Gon, H.A.C. TNO-MACC_II emission inventory; a multi-year (2003–2009) consistent high-resolution European emission inventory for air quality modelling. Atmos. Chem. Phys. 2014, 14, 10963–10976. [Google Scholar] [CrossRef]
  20. Guenther, A.B.; Jiang, X.; Heald, C.L.; Sakulyanontvittaya, T.; Duhl, T.; Emmons, L.K.; Wang, X. The Model of Emissions of Gases and Aerosols from Nature version 2.1 (MEGAN2.1): An extended and updated framework for modeling biogenic emissions. Geosci. Model Dev. 2012, 5, 1471–1492. [Google Scholar] [CrossRef]
  21. Guenther, A.; Jiang, X.; Shah, T.; Huang, L.; Kemball-Cook, S.; Yarwood, G. Model of Emissions of Gases and Aerosol from Nature Version 3 (MEGAN3) for estimating biogenic emissions. In Air Pollution Modeling and Its Application XXVI; Mensink, C., Gong, W., Hakami, A., Eds.; Springer: Cham, Switzerland, 2020; pp. 187–192. [Google Scholar]
  22. O’Dowd, C.D.; Langmann, B.; Varghese, S.; Scannell, C.; Ceburnis, D.; Facchini, M.C. A combined organic-inorganic sea-spray source function. Geophys. Res. Lett. 2008, 35, L01801. [Google Scholar] [CrossRef]
  23. Monahan, E.C.; Spiel, D.E.; Davidson, K.L. A model of marine aerosol generation via whitecaps and wave disruption. In Oceanic Whitecaps; Monahan, E.C., Niocaill, G.M., Eds.; Springer: Dordrecht, The Netherlands, 1986; Volume 2, pp. 167–174. [Google Scholar]
  24. Fountoukis, C.; Koraj, D.; Denier van der Gon, H.A.C.; Charalampidis, P.E.; Pilinis, C.; Pandis, S.N. Impact of grid resolution on the predicted fine PM by a regional 3-D chemical transport model. Atmos. Environ. 2013, 68, 24–32. [Google Scholar] [CrossRef]
  25. Wagstrom, K.M.; Pandis, S.N.; Yarwood, G.; Wilson, G.M.; Morris, R.E. Development and application of a computationally efficient particulate matter apportionment algorithm in a three-dimensional chemical transport model. Atmos. Environ. 2008, 42, 5650–5659. [Google Scholar] [CrossRef]
  26. Kosmopoulos, G.; Salamalikis, V.; Pandis, S.N.; Yannopoulos, P.; Bloutsos, A.A.; Kazantzidis, A. Low-cost sensors for measuring airborne particulate matter: Field evaluation and calibration at a South-Eastern European site. Sci. Total Environ. 2020, 748, 141396. [Google Scholar] [CrossRef]
  27. Morris, R.E.; McNally, D.E.; Tesche, T.W.; Tonnesen, G.; Boylan, J.W.; Brewer, P. Preliminary Evaluation of the Community Multiscale Air Quality Model for 2002 over the Southeastern United States. J. Air Waste Manag. Assoc. 2005, 55, 1694–1708. [Google Scholar] [CrossRef]
  28. Morris, R.E.; Koo, B.; Lau, S.; Tesche, T.W.; McNally, D.; Loomis, C.; Stella, G.; Tonnesen, G.; Wang, Z. VISTAS Emissions and Air Quality Modeling Phase I Task 4cd Report: Model Performance Evaluation and Model Sensitivity Tests for Three Phase I Episodes; Final report; Visibility Improvement State and Tribal Association of the Southeast (VISTAS): Swannanoa, NC, USA, 2004.
  29. World Health Organization (WHO). Health Risks of Air Pollution in Europe: HRAPIE Project: New Emerging Risks to Health from Air Pollution: Results from the Survey of Experts. 2013. Available online: https://www.who.int/europe/publications/i/item/WHO-EURO-2013-6696-46462-67326 (accessed on 10 October 2023).
  30. EPA (Environmental Protection Agency). Guidance for Regulatory Application of the Urban Airshed Model (UAM); Office of Air Quality Planning and Standards: Research Triangle Park, NC, USA, 1991.
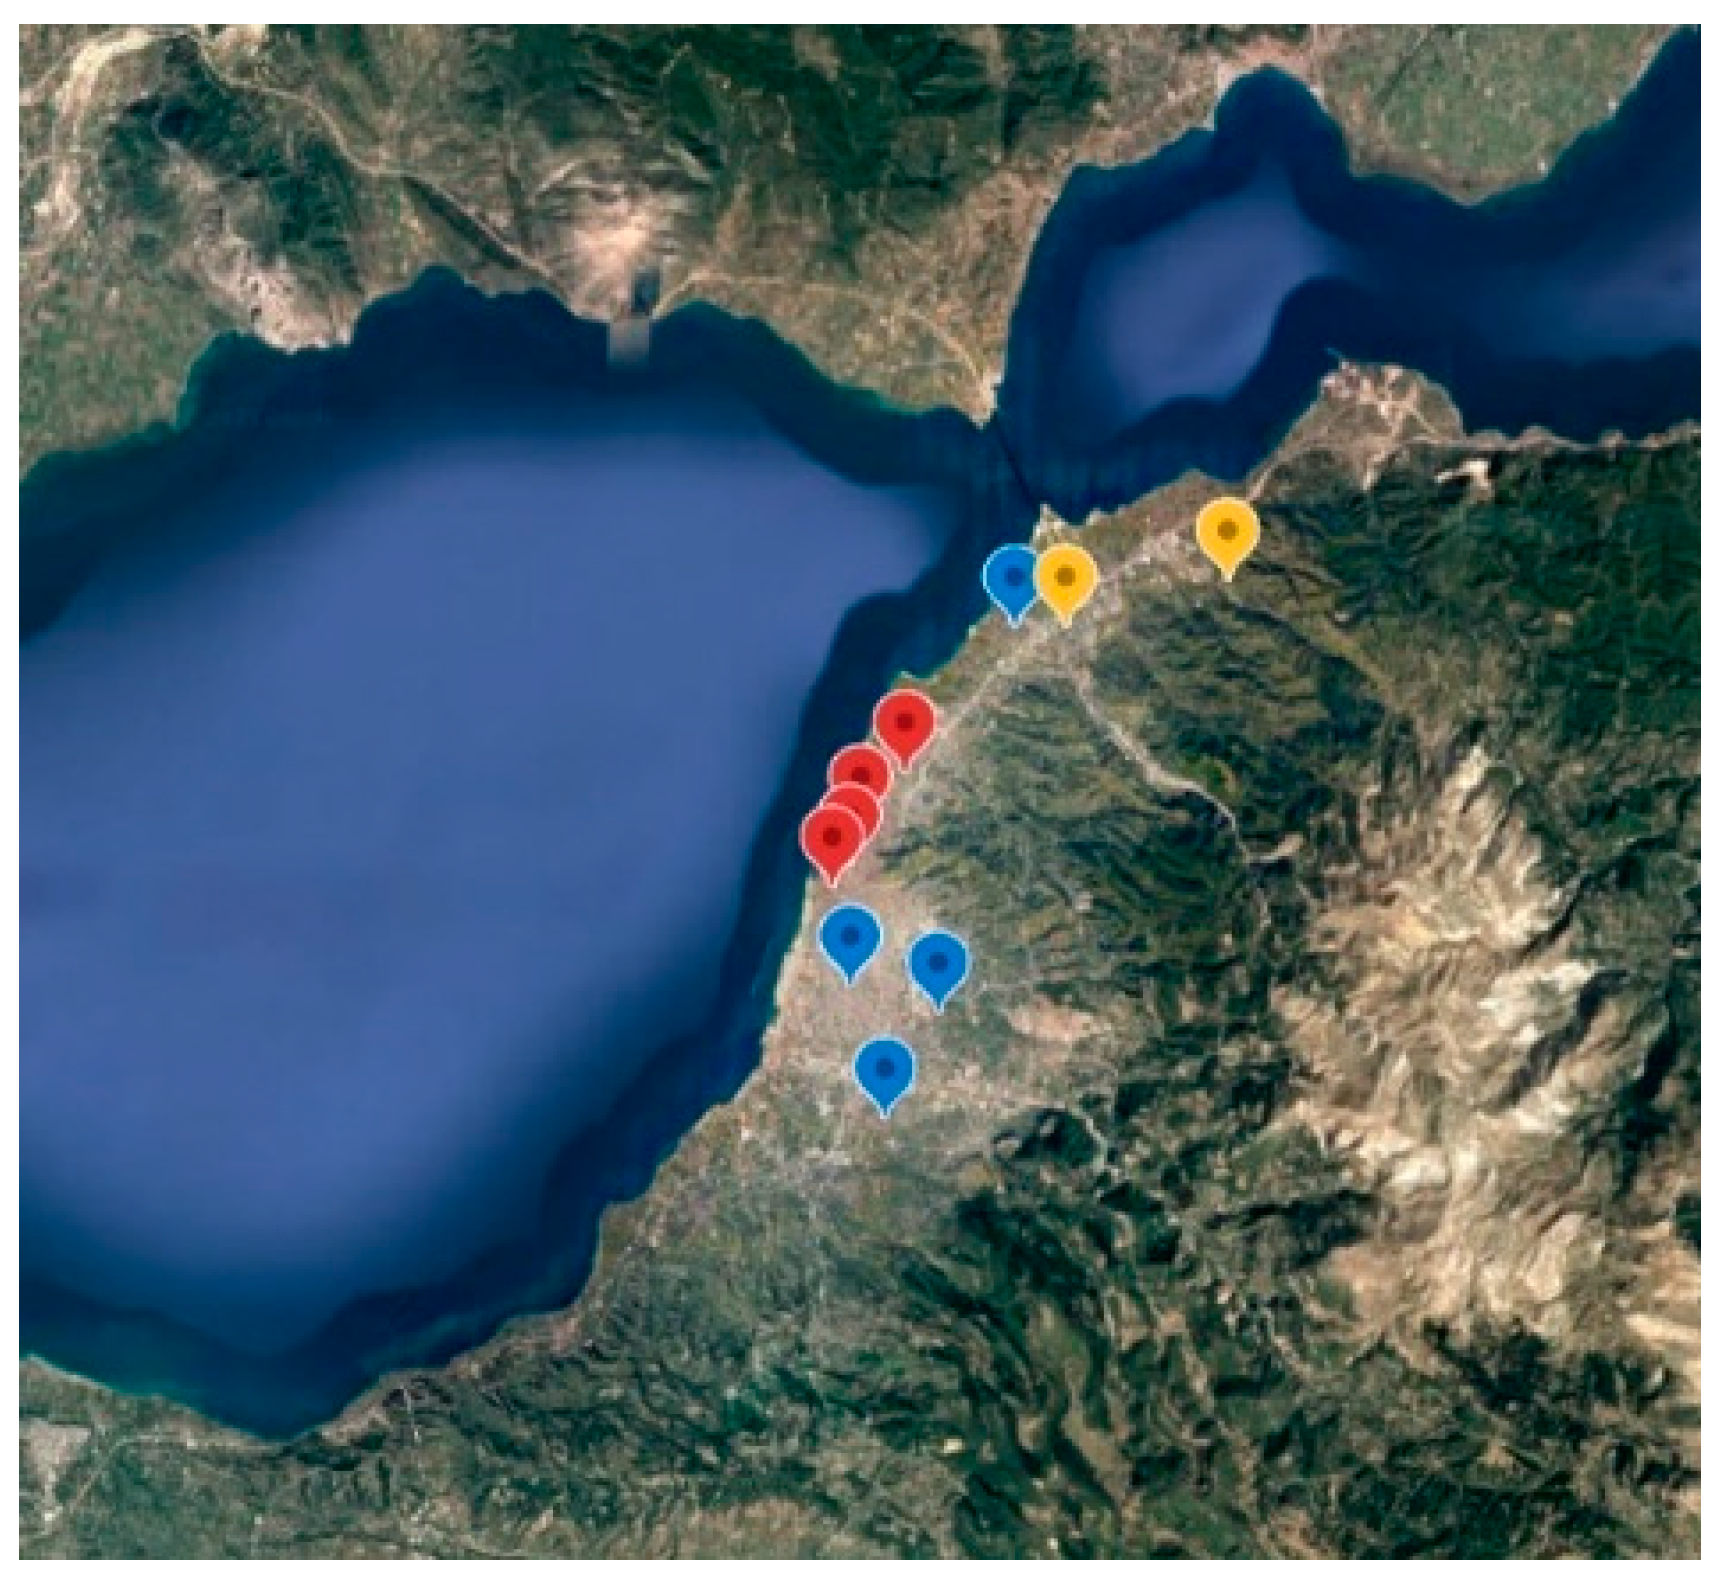
Figure 1. Map of the inner modeling region of SmartAQ with the locations of the ten PM2.5 measurement stations used in this study inside and around the city of Patras. Red: urban stations, blue: suburban stations and yellow: background stations.
Atmosphere 15 00008 g001
Figure 2. Daily average predicted and measured PM2.5 concentrations (μg m−3) for (a) Trion Navarchon Square and (b) University of Patras during July 2021, (c) Trion Navarchon Square and (d) University during September 2021, (e) Kypseli and (f) University during December 2021, (g) Kypseli and (h) University during March 2022. Different scales are used.
Atmosphere 15 00008 g002
Figure 3. Predicted average diurnal profiles for PM2.5 sources and measured PM2.5 for (a) Trion Navarchon Square and (b) University during July 2021, (c) Trion Navarchon Square and (d) University during September 2021, (e) Kypseli and (f) University during December 2021, (g) Kypseli and (h) University during March 2022. Different scales are used.
Atmosphere 15 00008 g003
Figure 4. Time series of PM2.5 concentrations (μg m−3) in (a) Trion Navarchon Square and (b) University during July 2021, (c) Trion Navarchon Square and (d) University during September 2021, (e) Kypseli and (f) University during December 2021, (g) Kypseli and (h) University during March 2022. Different scales are used.
Atmosphere 15 00008 g004
Figure 5. PM2.5 model evaluation using fractional error (%) versus fractional bias (%) of daily PM2.5 concentrations for several sites in Patras during (a) July 2021, (b) September 2021, (c) December 2021, and (d) March 2022.
Atmosphere 15 00008 g005
Figure 6. Average diurnal profile of sources of NOx concentrations (ppb) in Drosopoulou Square during (a) July 2021 and (b) December 2021 for the 1 km resolution grid.
Atmosphere 15 00008 g006
Figure 7. Time series of NOx concentrations (ppb) in Drosopoulou Square during (a) July 2021 and (b) December 2021 for the 1 km resolution grid.
Atmosphere 15 00008 g007
Figure 8. Average diurnal profile of O3 concentrations (ppb) in Drosopoulou Square during July 2021.
Atmosphere 15 00008 g008
Figure 9. Time series of O3 concentrations (ppb) in Drosopoulou Square during July 2021 for the 1 km resolution grid.
Atmosphere 15 00008 g009
Table 1. Measurement stations used in this study.
StationType
AgiaUrban
DemenikaSuburban
Drosopoulou SquareUrban
Georgiou SquareUrban-city center
KastelokamposSuburban
KoukouliSuburban
KypseliSuburban
PlataniBackground
Trion Navarchon SquareUrban-city center
University of PatrasBackground
Table 2. European air quality index for PM2.5.
Index LevelPM2.5 (μg m−3)
Good0–10
Fair10–20
Moderate20–25
Poor25–50
Very poor50–75
Extremely poor75–800
Table 3. Daily mean predicted and measured PM2.5 concentrations for July, September, and December 2021 and March 2022.
July 2021September 2021December 2021January 2022
SiteObserved (μg m−3)Predicted (μg m−3)Observed (μg m−3)Predicted (μg m−3)Observed (μg m−3)Predicted (μg m−3)Observed (μg m−3)Predicted (μg m−3)
Agia----7.88.1--
Demenika6.96.76.17.71616.216.618.7
Drosopoulou Sq.7.48.879.4----
Georgiou Sq.7.28.7------
Kastelokampos6.27.268.78.55.59.19.9
Koukouli7.4767.91113.81218
Kypseli----21.519.517.726.2
Platani5.86.55.38.25.34.56.39
Trion Navarchon Sq.11.210.29.210.8--14.517.3
U. of Patras675.48.53.74.86.59.5
Table 4. Mean bias (MB) and mean error (ME) for daily averaged PM2.5 predictions and measurements for July, September, and December 2021 and March 2022.
July 2021September 2021December 2021January 2022
SiteMB
(μg m−3)
ME
(μg m−3)
MB
(μg m−3)
ME
(μg m−3)
MB
(μg m−3)
ME
(μg m−3)
MB
(μg m−3)
ME
(μg m−3)
Agia----0.323.7--
Demenika−0.32.21.62.1−0.358.52.16.5
Drosopoulou Sq.1.42.22.52.9----
Georgiou Square1.52.1------
Kastelokampos12.22.62.9−3.140.83.1
Koukouli−0.52.41.92.22.56.567.8
Kypseli----−26.68.59.9
Platani0.61.933.1−0.832.93.4
Trion Navarchon Sq.−0.92.51.72.3--2.85.2
University of Patras12.23.23.31.11.933.7
Disclaimer/Publisher’s Note: The statements, opinions and data contained in all publications are solely those of the individual author(s) and contributor(s) and not of MDPI and/or the editor(s). MDPI and/or the editor(s) disclaim responsibility for any injury to people or property resulting from any ideas, methods, instructions or products referred to in the content.