Article

Modelling of Deep Street Canyon Air Pollution Chemistry and Transport: A Wintertime Naples Case Study

1
School of Geography Earth and Environment Sciences, University of Birmingham, Birmingham B15 2TT, UK
2
Lancaster Environment Centre, Lancaster University, Lancaster LA14YQ, UK
3
Department of Industrial Engineering, University of Naples Federico II, P.le V. Tecchio 80, 80125 Naples, Italy
4
Department of Chemical, Materials and Production Engineering, University of Naples Federico II, P.le V. Tecchio 80, 80125 Naples, Italy
*
Author to whom correspondence should be addressed.
Atmosphere 2023, 14(9), 1385; https://doi.org/10.3390/atmos14091385
Submission received: 29 July 2023 / Revised: 21 August 2023 / Accepted: 28 August 2023 / Published: 1 September 2023
(This article belongs to the Special Issue Urban Air Quality Modelling)

Abstract

:
The impact of urban morphology on air quality, particularly within deep canyons with longer residence times for complex chemical processes, remains insufficiently addressed. A flexible multi-box framework was used to simulate air quality at different canyon heights (3 m and 12 m). This approach incorporated essential parameters, including ventilation rates, background concentrations, photochemical schemes, and reaction coefficients. A field campaign within a deep canyon with an aspect ratio of 3.7, in Naples, Italy was conducted and used for the model evaluation. The model performance demonstrated good agreement, especially at the street level, when employing a realistic light intensity profile and incorporating volatile organic compound (VOC) chemistry. Our findings indicate that peroxyl radical production affects NO2 and O3 levels by up to 9.5% in deep canyons and underscore the significance of vertical distribution (approximately 5% variance) in health assessments and urban air quality strategy development. The model response was sensitive to changes in emissions as expected, but also, somewhat more surprisingly, to background conditions, emphasizing that policies to remove pollution hotspots must include local and broader citywide action. This work advances the understanding of air quality dynamics in deep urban canyons and presents a valuable tool for effective air quality management in intricate urban environments.

1. Introduction

Street canyons are streets that are bounded by buildings on both sides, and can be divided into three types based on the ratio of building height (h) to street width (w) (aspect ratio, AR): i.e., wide canyons (AR < 1), regular canyons (AR = 1), and deep canyons (AR > 1) [1,2,3,4]. Urban canyons are basic morphological units in densely populated cities. Urban canyons exhibit a unique microclimate and the canyon walls form a physical barrier that restricts the dispersion of air pollutants [5]. Deep urban canyons with high ARs are particularly challenging as they create environments with limited vertical mixing and reduced atmospheric pollution dispersion. The interaction between these factors creates pollution “hotspots”, leading to a situation where high concentrations of contaminants can accumulate even in areas with relatively low emissions [6,7,8]. This poses a significant risk to public health [9,10,11], necessitating a thorough understanding of the physical and chemical processes governing air pollutant dispersion and the development of effective mitigation strategies [12].
Few studies have addressed air pollution dispersion in deep urban canyons, even though deep canyons are common in many subtropical and tropical urban areas [13,14,15]. Ng and Chau [16] assessed the effective permeability of the built landscape, and setback configurations, in mitigating air pollutant exposure in isolated deep canyons (AR = 2, 4, 6). Their results indicated that building separation and setbacks were effective in reducing personal air exposures, particularly in the case of perpendicular wind. Yuan, Ng and Norford [17] employed a computational fluid dynamics (CFD) parametric approach to investigate the effects of urban permeability and building geometries on air pollutant dispersion in high-density urban areas. Their results highlighted the necessity for mitigation strategies in planning and designing activities to address air pollution in deep street canyons. By implementing strategies promoting convection effects, such as building separation, porosity, and stepped podium voids, air pollutant dispersion in high-density cities can be improved. Rakowska, et al. [18] conducted a study examining the impact of traffic volume and fleet composition on air pollutant concentrations in a busy Hong Kong business district. Their work focused on typical urban street canyons and open roadways, discovering that despite a nearly tenfold increase in traffic volume in wide and open roadways, on-road and roadside pollutant concentrations were significantly lower than in street canyons. This finding highlights the importance of considering not only total traffic volume but also urban planning strategies and traffic composition when addressing air quality. The strong contrast observed in their study underscores the need for comprehensive urban air quality management, integrating urban planning strategies with their impact on traffic-related air pollution and pedestrian exposure to pollutants.
Hood, et al. [19] applied an air quality dispersion model (i.e., ADMS-Urban) to cater to various canyon geometries, especially deep and/or asymmetric canyons, in air quality simulations. Unlike the widely used Operational Street Pollution Model (OSPM), which overlooks features such as high ARs, pavements, and building porosity, this new model provides a comprehensive representation by considering up to six component sources to illustrate the various effects of street canyons on the dispersion of road traffic emissions. Their work evaluates the model’s effectiveness against data from the “Optimisation of modelling methods for traffic pollution in streets” (TRAPOS) project and 42 monitoring sites in London. Murena, et al. [20] modelled carbon oxide (a passive tracer) within a deep canyon (AR = 5.7) in Naples using CFD and OSPM (Windows version). While CFD simulations matched well actual CO measurements, the OSPM model showed discrepancies. Fu, et al. [21] investigated the effects of street canyon geometry on air pollutant distributions in downtown Beijing using a CFD model and an urban-scale traffic pollutant dispersion model. The study revealed that taller buildings, particularly those exceeding 40 m in height, obstruct ventilation in street canyons, resulting in elevated pollutant concentrations. Results also suggested that meticulous planning of the asymmetry ratio in street canyons can contribute to an increase in ventilation and thus, a reduction in overall human exposure to air pollutants. He, et al. [22] investigated the impact of street aspect ratios, viaducts, and road barriers on vehicular CO exposure in high-rise deep street canyons using CFD under neutral atmospheric conditions. Higher carbon monoxide (CO) exposure was observed in street canyons with two main vortexes (AR between 5 and 6). Viaduct settings and road barriers were found to affect CO exposure in street canyons differently depending on the aspect ratio.
Despite the valuable insights provided by these studies, none of them explicitly consider the role of atmospheric chemistry. Limited research has been conducted on the role of volatile organic compounds (VOCs) in air pollution chemistry in deep canyons. For instance, the complex interactions between VOCs and other atmospheric species can lead to the formation of secondary pollutants, such as ozone (O3) and secondary organic aerosols (SOAs) [4,23,24]. Studies showed that increased aspect ratios of urban canyons can result in poorer air quality due to limited ventilation [12,25]. In a deep canyon, several critical atmospheric phenomena directly affect the dispersion and concentration of air pollutants. First, restricted ventilation leads to longer residence time of air parcels within deep canyons. Emissions (typically from vehicles) disperse less efficiently in the vertical, culminating in stratification and increased concentration of pollutants at the street level; secondly, the inherent geometric characteristics of deep canyons attenuate the amount of direct solar irradiance received at ground level. This diminished solar input may induce cooler street surface temperatures, potentially impacting buoyancy-driven ventilation processes within the canyon; in addition, the towering structures flanking these urban canyons facilitate multiple reflection pathways for pollutants. This dynamic can prolong the residence time of these pollutants within the canyon, further amplifying ground-level concentrations. Lastly, longer residence times within deep canyons are conducive to the progression of slower atmospheric chemical reactions. For example, peroxyl radicals are primarily produced during the oxidation of VOCs in the presence of ozone or NOx (NO + NO2). Once formed, these radicals can undergo various reactions that further impact the concentrations of NO2 and O3. One of the main fates of peroxyl radicals in urban environments is to react with NO to form NO2:
R O 2 + N O N O 2 + R O
This reaction reduces the concentration of NO, increasing NO2 levels in the atmosphere. Higher NO2 concentrations contribute to O3 production during daylight hours, creating “hotspots” with intensified pollutant concentrations. While the influence of such reactions is typically marginal in regular canyons due to effective ventilation [6], it becomes more important in areas where air residence time is extended [4]. Therefore, there remains a need for further research that integrates the effects of chemical reactions and interactions within the context of air pollution dispersion in deep urban canyons.
Although CFD-based models can provide a detailed and accurate representation of the atmospheric flow and other physical phenomena in street canyon simulations, generally these models require a significant amount of computational power and are time-consuming to operate, especially for large and complex simulations involved with atmospheric chemistry (e.g., hundreds of thousands of chemical reactions) [6]. Deep canyons necessitate a larger number of CFD cells, which means that incorporating VOC chemistry intensifies computational time, limiting the feasibility of high-resolution simulations [4]. The effects of meteorological factors on air pollution chemistry in deep urban canyons have received limited attention. The interaction of meteorological variables, such as solar radiation, temperature, and humidity, with air pollutants in street canyons can significantly impact the formation and dispersion of secondary pollutants [25,26,27]. While the importance of these factors is recognized, there remains a notable dearth of relevant literature and monitoring data in relation to vertical levels within a deep canyon.
Our recent study [28] has shown that the flexible multi-box model (MBM-FleX) is one of the most effective models for simulating air quality in urban canyons with high aspect ratios. It is a two-dimensional (2D) model that divides the canyon into multiple boxes, each representing a different layer of the atmosphere. The model considers the effect of building height, ventilation, VOC radical reactions, and street-level emissions on the dispersion of pollutants in the canyon. The multi-box model also allows for customized emission inventory, which is necessary for accurately modelling air quality in complex urban environments.
Below, the performance of the multi-box model was assessed under the specific conditions of a deep street canyon (AR = 3.7) in Naples, Italy, the capital of the Campania region and the country’s third-largest city. The urban area boasts a population of about a million but considering the metropolitan region extending approximately 20 miles beyond city limits, the population reaches around 3 million. The historical centre of Naples underwent remodelling during the Spanish occupation in the 16th century to accommodate the Spanish army. This area, known as the “Spanish neighbourhood”, features narrow streets approximately 5 m wide, forming a grid pattern lined with densely packed residential buildings approximately 20 m high. These deep urban street canyons are often associated with compromised air quality. Major contributors to nitrogen oxide air pollution in Naples include road and maritime transport, with NOx levels often exceeding the European threshold limit of 40 µg m−3 as annual average or 200 µg m−3 as hourly average. High levels of NO2 are not the city’s only air pollution concern: high levels of VOCs and active photochemistry during the warm season contribute to elevated O3 levels, posing an additional environmental challenge.
In this study, a field monitoring campaign was conducted within a deep street canyon in the “Spanish neighbourhood” of Naples, Italy, having an aspect ratio (AR) of 3.7. A flexible multi-box framework was employed to simulate air quality at different elevations within the canyon, integrating essential parameters such as ventilation rates, background concentrations, photochemical reaction mechanisms, and reaction coefficients. The study further investigated the vertical dispersion of pollutants and conducted sensitivity tests to explore the interaction times between VOCs and NOx in the production of O3. The paper is organized as follows. Section 2 outlines the sampling site conditions, the multi-box frameworks (including the typical MBM-FleX and a revised version termed MBM-FleX_r), model configurations and model scenarios, and data analysis methods. Section 3 presents a comparison of box-model simulations with CFD, describes concentration fields, analyses MBM-FleX results, evaluates model sensitivity, and assesses the performance of MBM-FleX_r. Section 4 provides the conclusions.

2. Materials and Methods

2.1. Field Data

Time series of nitrogen oxide (NO), nitrogen dioxide (NO2), and ozone (O3) were collected from Via Santa Teresella (40°50′14.5″ N, 14°14′41.6″ E) in Naples, Italy. Via Santa Teresella exhibits a distinct topography and urban surface characteristics that significantly influence its local microclimate and air quality. This narrow street, with a height of 20 m and a width of 5.4 m (see Figure 1a), displays a canyon-like geometry (AR ≈ 3.7) and is lined with closely spaced, tall residential buildings [29]. The canyon orientation extends from west-southwest (70°) to east-northeast (250°), with a street length (i.e., the unmodelled y-direction) of approximately 105 m between two crossroads. The confined layout of Via Santa Teresella limits traffic speed, affecting the dispersion of air pollutants. In addition, inconsistent and intermittent balconies on both lee and windward sides of the canyon hinder ventilation between the canyon and the surrounding environment [30]. The urban surface in this region predominantly consists of paved surfaces and near-flat building rooftops, further shaping the local microclimate and air quality conditions.
NO, NO2, and O3 concentrations were collected in successive 15-min intervals from two distinct heights from 11 to 15 January 2021. Each collection cycle commenced with a 15-min interval at 3 m, immediately followed by another 15-min interval at 12 m. This routine was consistently implemented between the hours of 8:00 and 20:00. The potential under-resolution challenges due to the 15-min sampling interval might miss rapid fluctuations in pollutant levels caused by transient emission sources or quick meteorological shifts. The interval may inadequately represent short-lived turbulent motions and fast-reacting chemical pathways. It may compromise the precision and reliability of model predictions, potentially obscuring transient yet significant pollutant dynamics, but the longer sampling interval offers broader insights and a more averaged perspective. It can be more representative of sustained pollution sources, such as constant vehicular traffic, as opposed to fleeting sources.
The monitoring sites were located at the heights of h1 = 3 m and h2 = 12 m on the southside of the street (blue diamond in Figure 1a). Equipment and measurement methods followed the standard established by the European Community (2008/50/CE). The observations were subsequently converted into mixing ratios for each model grid based on in-situ temperature and atmospheric pressure measurements. Simultaneously, a pre-installed camera recorded vehicle counts, grouped into passenger cars, two-wheel motor vehicles, and light-duty vehicles, throughout the monitoring campaign. In the data collection process, there were inevitably some gaps; however, these gaps did not exceed a duration of 30 min, ensuring no consecutive missing data points. To address these gaps, a linear interpolation method was employed, which allowed for the estimation of missing values based on the known data points surrounding each gap. As a result, 129 (64.5%) data points were available for model evaluation. For this evaluation, only measured data were utilized for comparison, while any imputed data resulting from the gap-filling procedure were excluded. This approach ensured that the model evaluation was based solely on observed data, providing a more reliable assessment of the model’s capability to represent actual conditions, and maintaining the robustness of the evaluation process.
Hourly measured NO2, O3, and CO data from the Osservatorio Astronomico (NA01, yellow diamond in Figure 1a) were employed to represent urban background conditions above the deep urban canyon. The NA01 site is situated at the Capodimonte Observatory at a latitude of 40°51′46.8″ N and longitude of 14°15′18″ E. Its location, distanced from direct pollution sources such as traffic and industrial emissions, ensures that it captures the broader air quality characteristics of the urban environment, rather than being influenced by localized pollution hotspots. The data can be accessed through the European Air Quality Portal (https://discomap.eea.europa.eu/map/fme/ (accessed on 17 July 2023). Hourly meteorological conditions, such as temperature, wind direction, and wind speed in the ambient background, were obtained from Naples International Airport (NIA, red square in Figure 1a), which is located approximately 5.5 km northeast of the canyon at a similar altitude (with latitude 40°53′06″ N and longitude 14°17′20.4″ E, respectively). Meteorological data can be acquired using the “openair” R package [31].

2.2. The Multi-Box Framework and Some New Developments

In a previous study [28], a multi-box model was employed to simulate a passive scalar (PS) and reactive species including NO2, O3, and VOC free radicals in regular and deep street canyons. The simulation employed an Eulerian process-based model called MBM-FleX, which combines physical and chemical processes to estimate air pollutant concentrations in the urban canyon environment. The algorithm for MBM-FleX can be expressed as:
d C q , [ k , i ] d t = E q , [ k , i ] G a , [ k , i + 1 ] + G e , [ k , i + 1 ] l i + G a , [ k , i ] + G e , [ k , i ] l i F a , [ k + 1 , i ] + F e , [ k + 1 , i ] h k + F a , [ k , i ] + F e , [ k , i ] h k + Δ S q , [ k , i ] + Δ V q , [ k , i ]
where Cq,[k,i] (ppb) is the mixing-ratio of the qth species in Box[k,i], Eq,[k,i] (ppb s−1) represents the emission rate of the qth species into Box[k,i], hk (m) and li (m) are the box height and box width, ΔSq,[k,i] (ppb s−1) is the net production rate of the qth species due to chemistry, and ΔVq,[k,i] (ppb s−1) is the net deposition term of the qth species in Box[k,i]. Fa,[k,i] (ppb m s−1) and Ga,[k,i] (ppb s−1) represent the mixing-ratio fractional fluxes due to advection. Fe,[k,i] (ppb m s−1) and Ge,[k,i] (ppb s−1) represent the mixing-ratio fluxes due to turbulent diffusion formulated by Fick’s law. Here, the dynamical components (i.e., advection and turbulence) were numerically calculated with 4th-order precision using the Runge–Kutta algorithm. Chemical species were treated at different time intervals based on their respective chemical lifetimes, as described in Zhong, Cai and Bloss [32]. Using predefined LES results corresponding to each canyon geometry as the driving factors for the model dynamics, MBM-FleX accurately identifies the main airflow characteristics within an idealized regular (AR = 1) and a deep (AR = 2) urban canyon (e.g., counter-rotating vortices in deep canyons, respectively) [28]. The modeled gaseous species, such as NO, NO2, and O3, closely match those predicted from LES, while reducing the computational resources required for processing. For example, the computing time decreases from two weeks to less than six minutes for a deep canyon (AR = 2) simulation with VOC radical chemistry.
The mass transfer between street canyons and the overlying background is vital in determining the degree of segregation of urban canyons. A number, m, of exchange velocities, is used to describe the flux-escaping processes for a m × n box model at the nth layer, such as we,[k,4] and we,[k,8] at the rooftop of regular and deep canyons in Figure S1a,c. Here k represents the kth grid along the x-axis (i.e., horizontal direction) and the escaping mass flux (fex,q) can be expressed as:
f e x , q = k = 1 m w e , [ k , n ] × ( C q , [ k , n ] C q , b )  
where Cq,[k,n] represents the concentration of qth species within the kth box at the nth layer and Cq,b is the concentration in the overlying background. Multi-exchange rates can provide a more precise depiction of physical processes, such as the determination of mass flux entering and escaping the canyon but, in the Naples case study, the application of such a set of exchange rates was deemed impractical for several reasons: (1) the intricate derivation of dynamical parameters based on the flux balance theory from the CFD; (2) the substantial requirement for background and initial concentrations during model “spin-up” periods; and (3) the implementation of a coupled modeling system that can effectively link local and regional scales (e.g., Kim, et al. [33]). For this case study, both the original version of the MBM-FleX and a modified variant of the MBM-FleX (hereafter referred to as MBM-FleX_r v1.0, a 2D model as illustrated in Figure S1b,d and Figure 1b) were deployed for simulating urban canyon air quality. In this variant, MBM-FleX_r, the exchange velocity between the street canyon and the background was represented using a single parameter, wt,0, while preserving the other dynamic components within the canyon. This approach allows for the proper preservation of airflow characteristics within the canyon. The exchange mass flux can be described as follows:
f e x , q = w e , 0 × ( C q , 0 C q , b )
Cq,0 is the concentration of qth species in the entire canyon (i.e., Box0) for each iteration (i.e., 0.03 s for long-lived species and 0.003 s for short-lived species):
C q , 0 = i = 1 , j = 1 m ,   n C q , [ i , j ] / ( m × n )
The performance of MBM-FleX_r has been evaluated in comparison to both MBM-FleX and LES models in estimating the dispersion of a passive scalar (PS) as well as reactive species, including NO2 and O3, within idealized regular (AR = 1) and deep (AR = 2) urban canyons. Detailed information on this assessment can be found in the Supporting Information (Figures S1–S7). It is also worth noting that the multi-box framework is based on the steady-state assumption, juxtaposed with the inherent unsteady characteristics’ nature of field measurements. Techniques such as CFD-based models offer closer real-world approximations, and online instruments provide granular observations, they demand higher computational and financial resources. Quantitative metrics such as root-mean-square deviation (RMSD) or temporal correlation coefficients provide clearer insights into the alignment between model predictions and field data (Section 2.4).

2.3. Model Configuration and Data Pre-Processing

A key step of this study is to evaluate the dynamical parameters by conducting a comparative analysis of the one-dimensional (1D) MBM-FleX (1 × 8), MBM-FleX_r (1 × 8), and CFD outputs for an idealized deep canyon with an AR of 3. The derived dynamical parameters were then applied to the real deep canyon. If MBM-FleX and MBM-FleX_r produce estimates that are sufficiently close to those of the CFD modeling, the multi-box models, with the derived exchange velocities, can replace further CFD simulations due to their ability to quickly handle complex chemical reactions and more modeling scenarios. To achieve this, the multi-box model configurations replicated those of the CFD approach. A concise summary of the parameters is provided below, with specifics available in Murena and Mele [30]. The canyon geometry was defined by a building height of 18 m and a street width of 6 m (i.e., AR = 3). The initial concentration of CO is 372 μmol m−3 (~10 mg m−3, 8700 ppb) under steady-stage conditions, and the inlet flow rate (i.e., prevailing wind speed) is 2.0 m s−1. CO is regarded as a PS, determined solely by physical processes, and its concentration within the street canyon diminished over time in wash-out simulations depending on the exchange velocity between the canyon and the background, since there were no emission sources within the canyon. Predicted CO in the deep canyon was compared between multi-box models and CFD results at t = 17 min (~1013 s, 50% wash-out time, see Section 2.4 for details). The CFD simulations used to parameterize the multi-box model represent a canyon with a lower aspect ratio than the actual canyon under study. Given our present knowledge constraints, these parameters serve as the best option to configure the model.
Advective velocities and turbulent velocities in the MBM-FleX and MBM-FleX_r models are important in determining the dynamical components inside street canyons. These values could be derived based on advective flux, turbulent flux, and concentration gradients between adjacent boxes, which could be obtained from LES and CFD simulations [28]. Under a 2D framework, eddies within street canyons can be properly parameterized. Here CFD was used for simulating an idealized canyon with an AR of 3 [30] to present the real canyon characterized by an AR of 3.7. This approach has several uncertainties, including (1) variation in the number of vortices with different ARs [34]; (2) the presence of building balconies that can strongly modify the wind flow pattern within street canyons [30,35]; (3) the Reynolds number (Re) within the canyon influences the number of vortices (a higher Re may result in a reduced number of vortices, even in a deep canyon) [36]; and (4) other factors such as short-time varying wind speeds [37], heating effects (influencing atmospheric stability) [38], roof shapes [27], and mechanical turbulence [39,40]. Including vortices could further increase modeling uncertainties. Therefore, the multi-box models were simplified from 2D to 1D consisting of eight boxes (Figure 1b), which captures the combined effect of vertical mixing of scalars, resulting from both large vortices and small turbulent eddies within the street canyon through parameterization. Each box of the MBM-FleX and MBM-FleX_r has a grid spacing of 2.7 m × 2.5 m × 1 m = 6.75 m³. This streamlined representation allowed for the disregard of horizontal advection and turbulence (i.e., ua,[k,i] and ue,[k,i]), focusing primarily on the vertical mixing velocities (i.e., we,[k,0]). The rationale behind choosing eight boxes lies in maintaining a balance between computational efficiency and an acceptable degree of accuracy in capturing concentration gradients. The we,[k,0] parameter serves as the primary focus of our investigation and encapsulates the most significant aspects of the mass transfer process. This term is derived from the concentration gradient during a brief time interval in the CFD simulation. The derived dynamical parameters allow the same atmospheric conditions between the multi-box model and the CFD simulations, with a neutral atmosphere being presumed. The details are presented in the Section 3.1 and the Supporting Information (Table S1).
In this study, traffic emissions were released at the bottom level of boxes, and emission factors were calculated using the Computer Program to Calculate Emission from Road Transport (COPERT) procedure [41] with a unit of [g km−1 h−1], representing the relationship between the number of pollutants emitted from tail pipes into the atmosphere and the corresponding traffic activities. The hot exhaust emissions of NOx (= NO + NO2), CO, and VOCs at 20 km h−1 from each class of vehicles were obtained and then used to calculate the equivalent mixing-ratio rates into the model mesh volume of Box [1,1] and Box [1,2] at standard temperature and pressure conditions (293 K and 1 atm) (Table S2). It is noted that these emission rates are based on available data and may not perfectly represent the actual measured temperature in January. The relative contributions of ethene (C2H4), propene (C3H6), formaldehyde (HCHO), and acetaldehyde (CH3CHO) to the total VOC emissions were 42%, 27%, 13%, and 18% [6], respectively. Unless otherwise noted, all percentages discussed below (i.e., “%”) denote volume percent changes or proportions in pollutant abundances. The primary fraction of NO2 for each vehicle type was obtained, along with the calculation of hourly traffic emissions based on emission factors, traffic composition and counts.
In modeling air quality within street canyons, it is crucial to obtain accurate background values for model inputs. The NA01 monitoring site (Section 2.1, Figure 1a), located approximately 3 km away from the deep street canyon, could potentially underestimate NO2 and overestimate O3 levels for the overlying background at the canyon location. Therefore, a scaling factor of 1.5 was applied to modify the background NO2 levels (i.e., scaled urban background, SUB). This adjustment ensures that the background NO2 for the canyon is higher than those at the NA01 site but lower than the observations at 12 m within the deep canyon, maintaining a proper gradient as depicted in Figure 2c. Consequently, O3 levels will also increase slightly due to the associated chemical processes. The impact of volatile organic compounds (VOC) radical chemistry on NO2 and O3 concentrations in the canyons was investigated. Simulations were conducted using both a simple NOx-O3 cycle and the reduced chemical scheme (RCS) to compare the respective impacts on pollution levels. The RCS comprises 51 species and 136 reactions, incorporating methane and eight parent non-methane hydrocarbons (NMHCs): isoprene, ethene, propene, formaldehyde, acetaldehyde, methanol, ethanol, and peroxyacetyl nitrate, providing a comprehensive representation of the major reactive components in urban canyon air chemistry [6]. In the RCS, the photolysis rates were initially calculated using the Tropospheric Ultraviolet and Visible (TUV) Radiation Model v4.1 [42] for simulations during midsummer daytime at the mid-latitude regions (Birmingham, UK). These rates were found to be significantly higher than those observed in Naples in winter [43]. Moreover, in this extremely deep urban canyon, shading effects could have an important impact on the concentrations of reactive species [26,44,45,46]. Therefore, the photochemical rates (Table S3) were scaled through a comparison of daytime surface solar radiation, which was obtained from the ERA5 global atmospheric reanalysis dataset, between the first of August in Birmingham and the monitoring period in January in Naples. The diurnal profile of net surface solar radiation was calculated as well.
In the present study, the angle of wind incidence (α) is delineated as the angle formed between the prevailing wind direction and the canyon axis, which enabled the decomposition of wind vectors perpendicular to the street (α = 90°) and along-street (α = 0° or 180°) directions. The dynamical parameters for MBM-FleX, derived from CFD simulations, inherently integrate the assumptions embedded within the CFD models, encompassing initial conditions, background conditions, canyon geometry, and other relevant factors. The boundary conditions for MBM-FleX are established based on these CFD assumptions, specifically accounting for the effects of perpendicular wind on canyon ventilation. Parallel wind has been posited to exert a larger influence on street canyon ventilation [47] but the focus here was on scenarios where the ambient wind blows perpendicular to the canyon-axis, as detailed in Section 3.2. Drawing from prior research [48,49], it was assumed that a linear relationship exists between vertical mixing velocities and the perpendicular velocity of the wind above the roof level.

2.4. Model Simulation and Data Post-Process

The earliest available air pollutant observations each day throughout the study period were used to generate essential chemical intermediates for the model simulations. A 30-min “spin-up” of the MBM-FleX/MBM-FleX_r models was conducted, without sources and dynamics. The resulting mixing ratios of all species at t = 30 min were considered to be the background conditions for subsequent simulations throughout the day. Physical, chemical, and emission modules were activated after spin-up.
To evaluate the model performance, final simulation results were chosen according to the monitoring height. For example, if the monitor was situated at 3 m above the ground, concentrations at the second box (i.e., Box [2,0]) were employed for evaluation, whereas if the monitor was positioned at 12 m, concentrations at the fifth box (i.e., Box [5,0]) were used. Vehicular emissions, exchange rates, and urban background levels for key pollutants (i.e., NO2, O3, and CO) were dynamically changed on an hourly basis. To assess model sensitivity, and to investigate the potential influence of various control strategies on air quality within the deep canyon, different model scenarios were designed (Table 1). Case A1 and Case A2 use MBM-FleX with either the RCS or a simple NOx-O3 cycle, employing photochemical kinetics representative of midsummer daytime in West Midlands, UK. Case A3 and Case A4 use MBM-FleX with either the RCS or a simple NOx-O3 cycle, employing photochemical kinetics characteristic of conditions in Naples, Italy. Case B1 and Case B2 correspond to scenarios with 50% reductions in NOx and VOC emissions. Cases B1-B5 demonstrate varying background conditions with low, medium, and high NOx levels, to understand the influence of different background pollutant concentrations. Lastly, Cases C1–C4 are dedicated to evaluating the performance of the MBM-FleX_r model, an alternative version of MBM-FleX, under various conditions.
Six widely-employed statistical metrics were utilized to assess the performance of the models [50,51], encompassing Pearson’s correlation coefficient (r), proportion of model results within a factor of two of observations (FAC2), root-mean-square deviation (RMSD), systematic RMSD (RMSDs), unsystematic RMSD (RMSDu), and index of agreement (IOA) [50,52,53,54]. The r quantifies the linear correlation between two data sets, with values ranging from −1 to 1; FAC2 is defined as the proportion of predicted data situated within a factor of two of the observations; RMSD calculates the average distance between corresponding pairs of estimates and observations, while systematic and unsystematic RMSD offer valuable insights into the origins of model uncertainty; IOA signifies the degree of congruence between model simulations and measurements, with a value of 1 indicating an impeccable alignment between the two data sets. The mathematical descriptions are provided below:
0.5 P r O r FAC 2 2.0
RMSD = r = 1 N P r O r 2 N
RMSD u = r = 1 N P r P ^ r 2 N
RMSD s = r = 1 N P ^ r O r 2 N
R = 1 N 1 r = 1 N P r P ¯ δ P O r O ¯ δ O
IOA = 1 r = 1 N P r O r 2 r = 1 N O r O ¯ , r = 1 N P r O r 2 r = 1 N O r O ¯ 2 r = 1 N O r O ¯ r = 1 N P r O r 1 , r = 1 N P r O r > 2 r = 1 N O r O ¯
Here Or and Pr are the rth rank of values from continuous observations and modeling, respectively; N represents the total number of datasets; the bar sign represents the mean concentration (e.g., P denotes the mean value of simulations); P ^ r can be estimated from the equation:
P ^ r = a + b × O r
Where, a and b are intercept and slope, respectively. Therefore, the following relationship can be derived:
RMSD 2 = RMSD u 2 + RMSD s 2
The values of R, FAC2 and IOA that converge to one and RMSD that converges to zero indicate that the model estimates are closer to the observations and, therefore, a better model performance.

3. Results

3.1. Comparing Box-Model Simulations with CFD

The first investigation analyzed the vertical distribution of air pollutants within an idealized deep canyon. This preliminary analysis employed three distinct models: MBM-FleX (1 × 8), MBM-FleX_r (1 × 8), and CFD simulations. MBM-FleX and MBM-FleX_r were adapted from 2D to 1D models for simulating the real canyon scenarios, and Figure S2 presents the vertical profiles of CO mixing ratios obtained from these models, with results truncated at around 12 min, corresponding to a 50% flushing time. The MBM-FleX and MBM-FleX_r grids integrate multiple CFD meshes that have been averaged to a coarser resolution, enabling a more straightforward comparative evaluation of model performance. The MBM-FleX and MBM-FleX_r (1D mode) were used to track vertical mixing ratio gradients within the canyon; that is, our analysis focused exclusively on the vertical distribution of air pollutants. The vertical profiles of CO mixing ratios modeled by MBM-FleX (green solid line) and MBM-FleX_r (black solid line) exhibited good agreement, with an index of agreement (IOA) of 0.97. The canyon-averaged CO mixing ratios for MBM-FleX, MBM FleX_r, and CFD models were 5008.0 ppb, 4921.8 ppb, and 4973.8 ppb, respectively, with minimal differences of approximately 0.7% and −1.0%. Figure S2b illustrates the dissipation rates of CO mixing ratios at different heights within the multi-box models. The results reveal that the locations at the bottom of the canyon exhibit slow dissipation rates, characterized by a gradual and continuous decrease in high pollution levels. In contrast, the boxes located higher up display a rapid and steep downward trend, followed by a more gradual decline until stabilization is reached.
The results indicate that the multi-box models effectively captured the primary features of CO within the deep canyon, including (1) a decreasing trend of CO mixing ratios with increasing building heights, and (2) the dissipation rates of CO mixing ratios from the canyon to the background atmosphere. As a result, assuming that the values of dynamical parameters alter proportionally with perpendicular cross-canyon wind speeds (Section 2.3), pre-defined dynamical sets (Table S1) were used to simulate air quality with MBM-FleX and MBM-FleX_r serving as proxies for RANS modeling results. The model accuracy was evaluated by comparing the model results with observations at heights of 3 m and 12 m within the street canyon.

3.2. Concentration Field

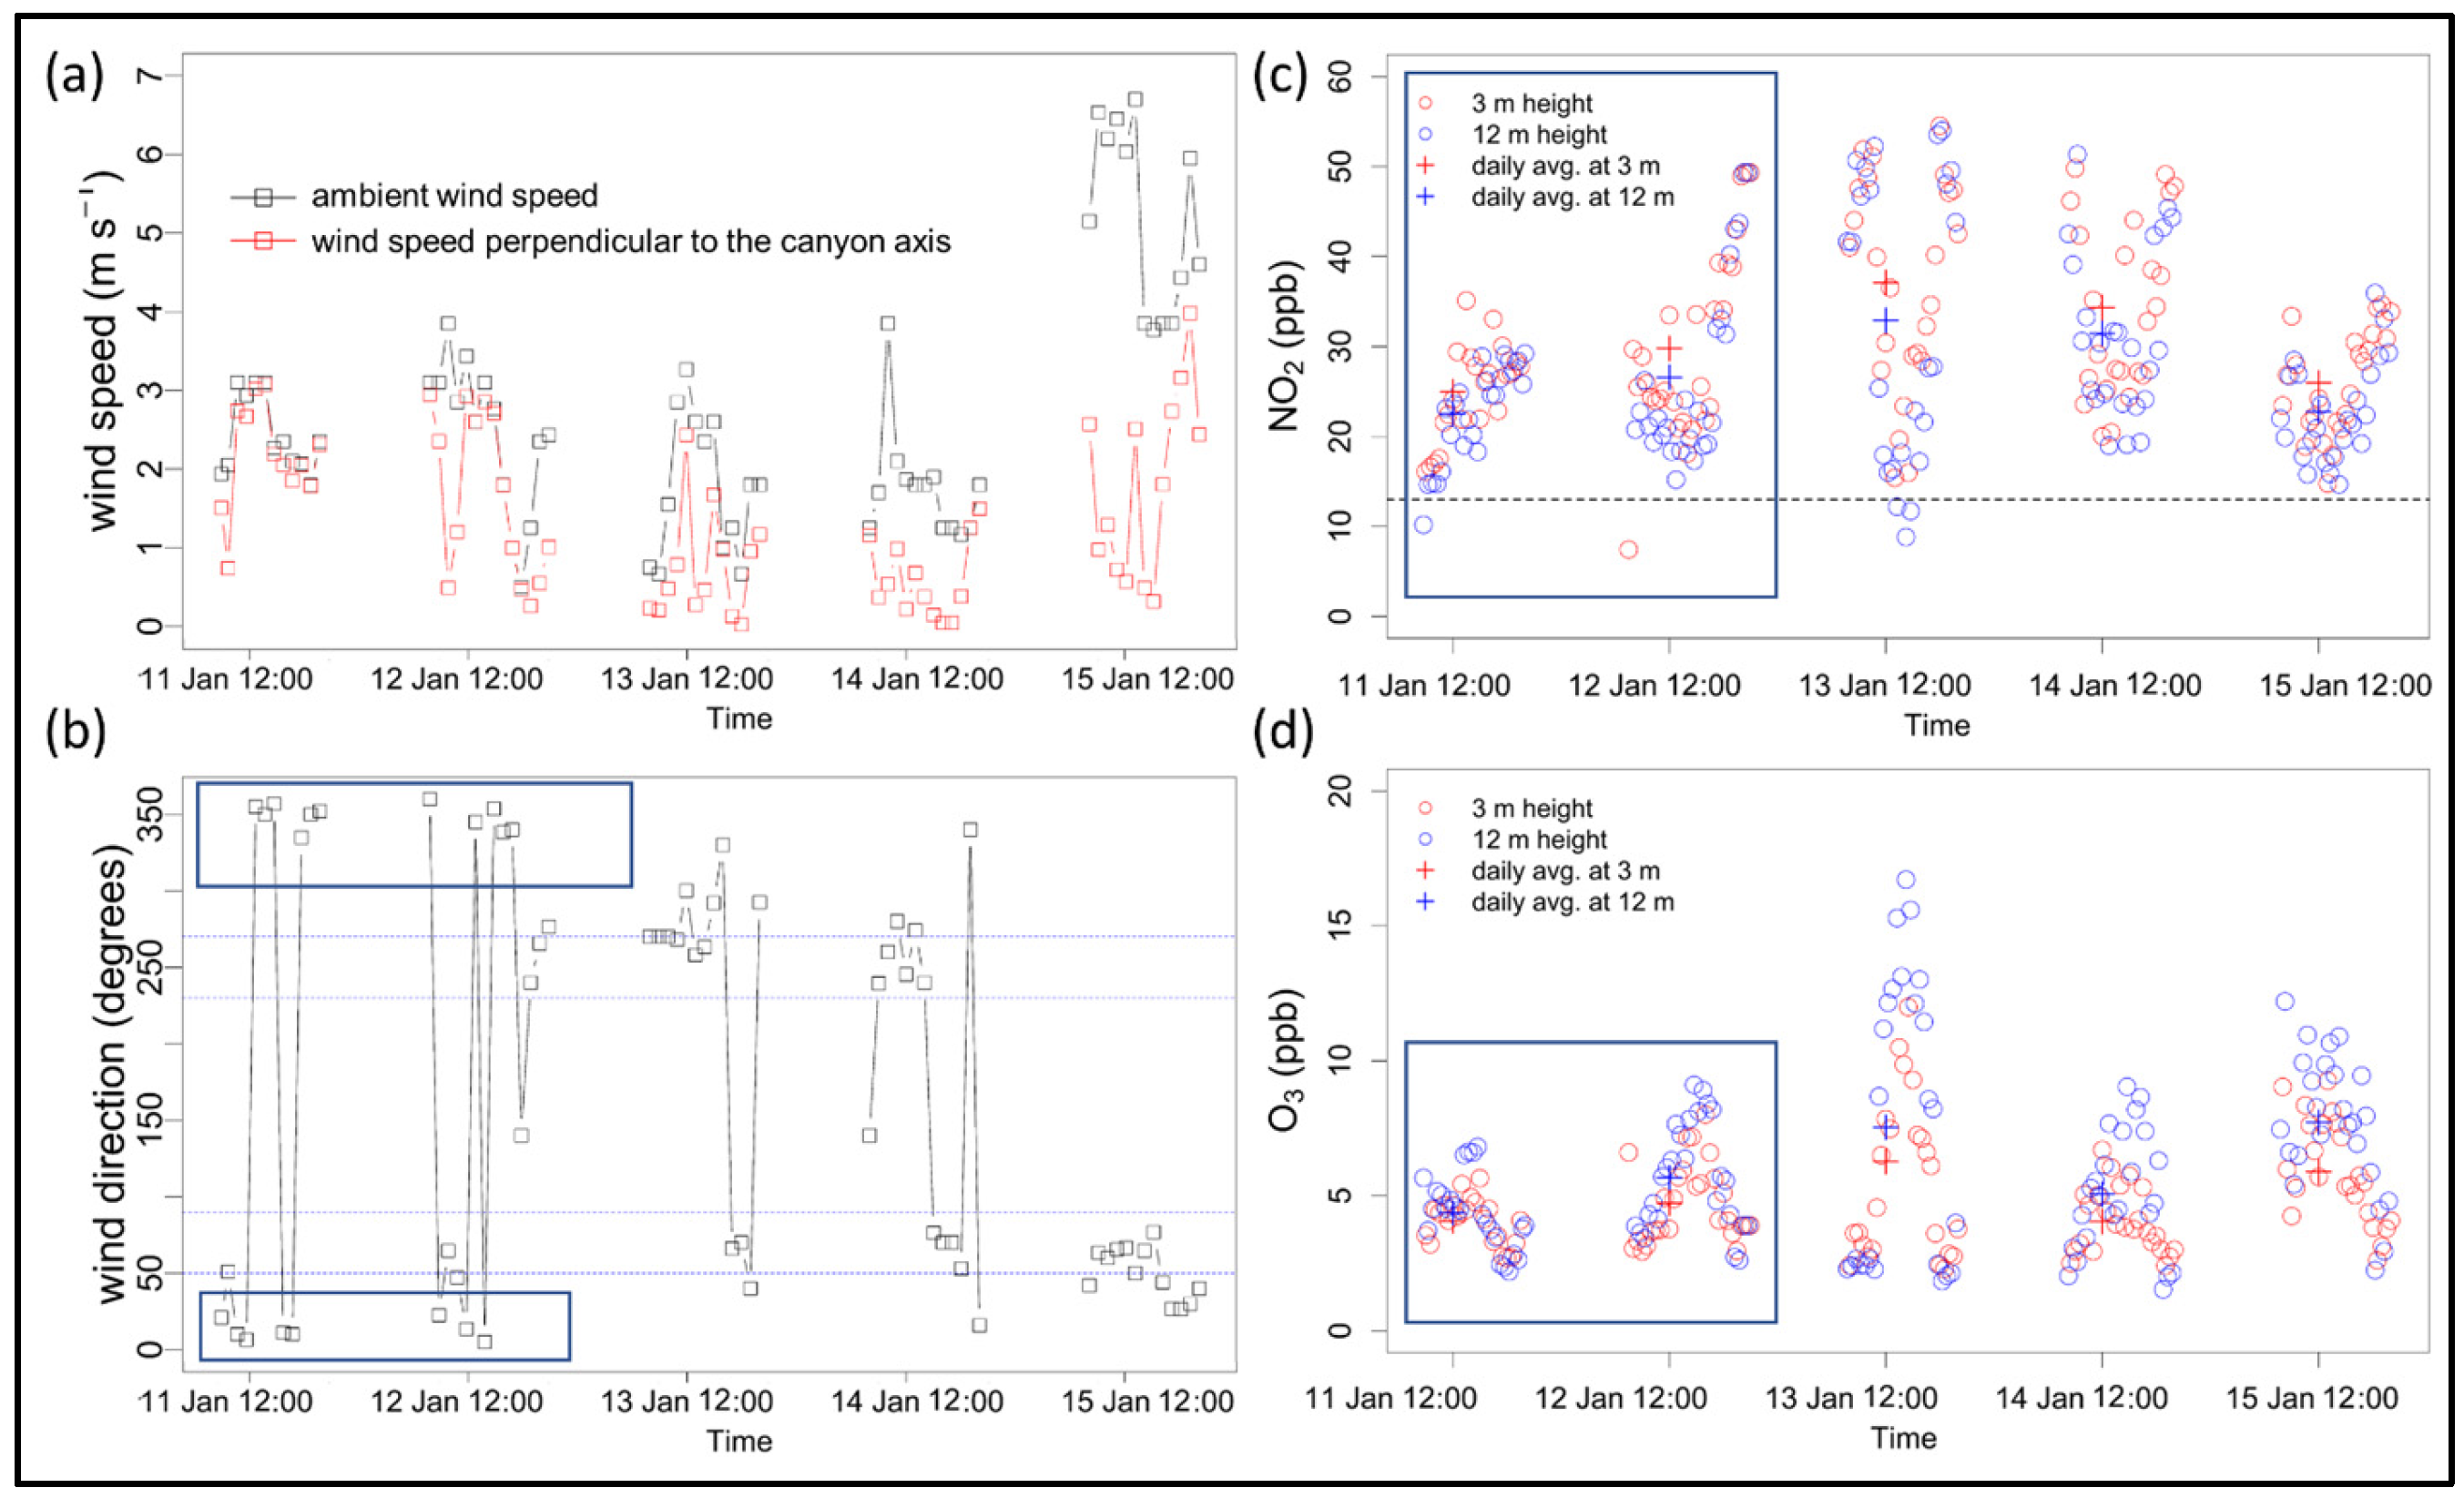
Meteorological conditions play a critical role in shaping air quality within urban canyons and, also, influencing the model performance. To contextualize the analysis of the modeling results, it is essential to provide an overview of the meteorological conditions during the monitoring campaign. Figure 2a,b display quarter-hourly measurements of ambient wind velocity and directional data, offering crucial insights for interpreting the findings. In Figure 2a, wind speeds perpendicular to the canyon axis (represented by black points) were compared. Between the 11th and the 13th of January, wind velocity exhibited a notable increase around 10:00 a.m. in the morning, stabilizing at approximately 3.0 m s−1, before decreasing during the afternoon. This pattern is strikingly similar to the wind features previously observed in Naples’ airport Capodichino [55]. The orientation of the street canyon is 70°–250°. Throughout the monitoring campaign, the wind direction, as illustrated by the grey lines in Figure 2b, reveals that the wind predominantly flowed parallel to the street canyon, primarily occurring from the 13th to the 15th of January 2021. During the first two days of the study period (11th and 12th of January, blue frame in Figure 2), the ambient wind direction was predominantly perpendicular to the canyon axis, which is the primary focus of our investigation.
Figure 2c,d depict the temporal variations (from 8:00 a.m. to 20:00 p.m.) in NO2 and O3 mixing ratios at distinct vertical heights within the deep urban canyon during the monitoring campaign. The observations reveal that NO2 mixing ratios at 3 m height were consistently higher than those at 12-m height, with the difference in daily averaged levels ranging between 9.8% (2.4 ppb) and 12.2% (3.2 ppb). This suggests that ground-level NO2 mixing ratios were predominantly affected by local emission sources (e.g., vehicular traffic), diluting from the canyon bottom to the top. Such concentration gradients expose pedestrians, especially those at lower elevations, to elevated levels of NO2. Note that NO2 at both height levels substantially exceeded the World Health Organization’s (WHO) Air Quality Guideline (AQG) of 13 ppb (25 μg m−3) for daily NO2 levels, with exceedances ranging from 91.9% to 185.2%. In contrast, O3 levels consistently adhered to the WHO AQG (50 ppb for an 8-h maximum average). O3 mixing ratios at 12-m height were slightly higher (by about 1 ppb) compared to those at 3-m height, especially at around 12:00 p.m. This difference can potentially be attributed to a result of a combination of factors including thermal dynamics, chemical reactions, deposition processes, and atmospheric mixing. For example, the concentration of background ozone tends to increase in the afternoon. This rise, in tandem with the vertical mixing, results in a heterogeneous distribution of ozone. Specifically, the ozone concentration at 12-m height is more affected by the elevated background level compared to the 3-m height. Additionally, during midday, the photolysis of NO2 at the surface swiftly generates NO, which then reacts with O3 through the titration effect, leading to reduced O3 levels at the 3-m height. It would be worthwhile to investigate this further with detailed observations and modeling techniques to understand the underlying processes better.

3.3. MBM-FleX Results

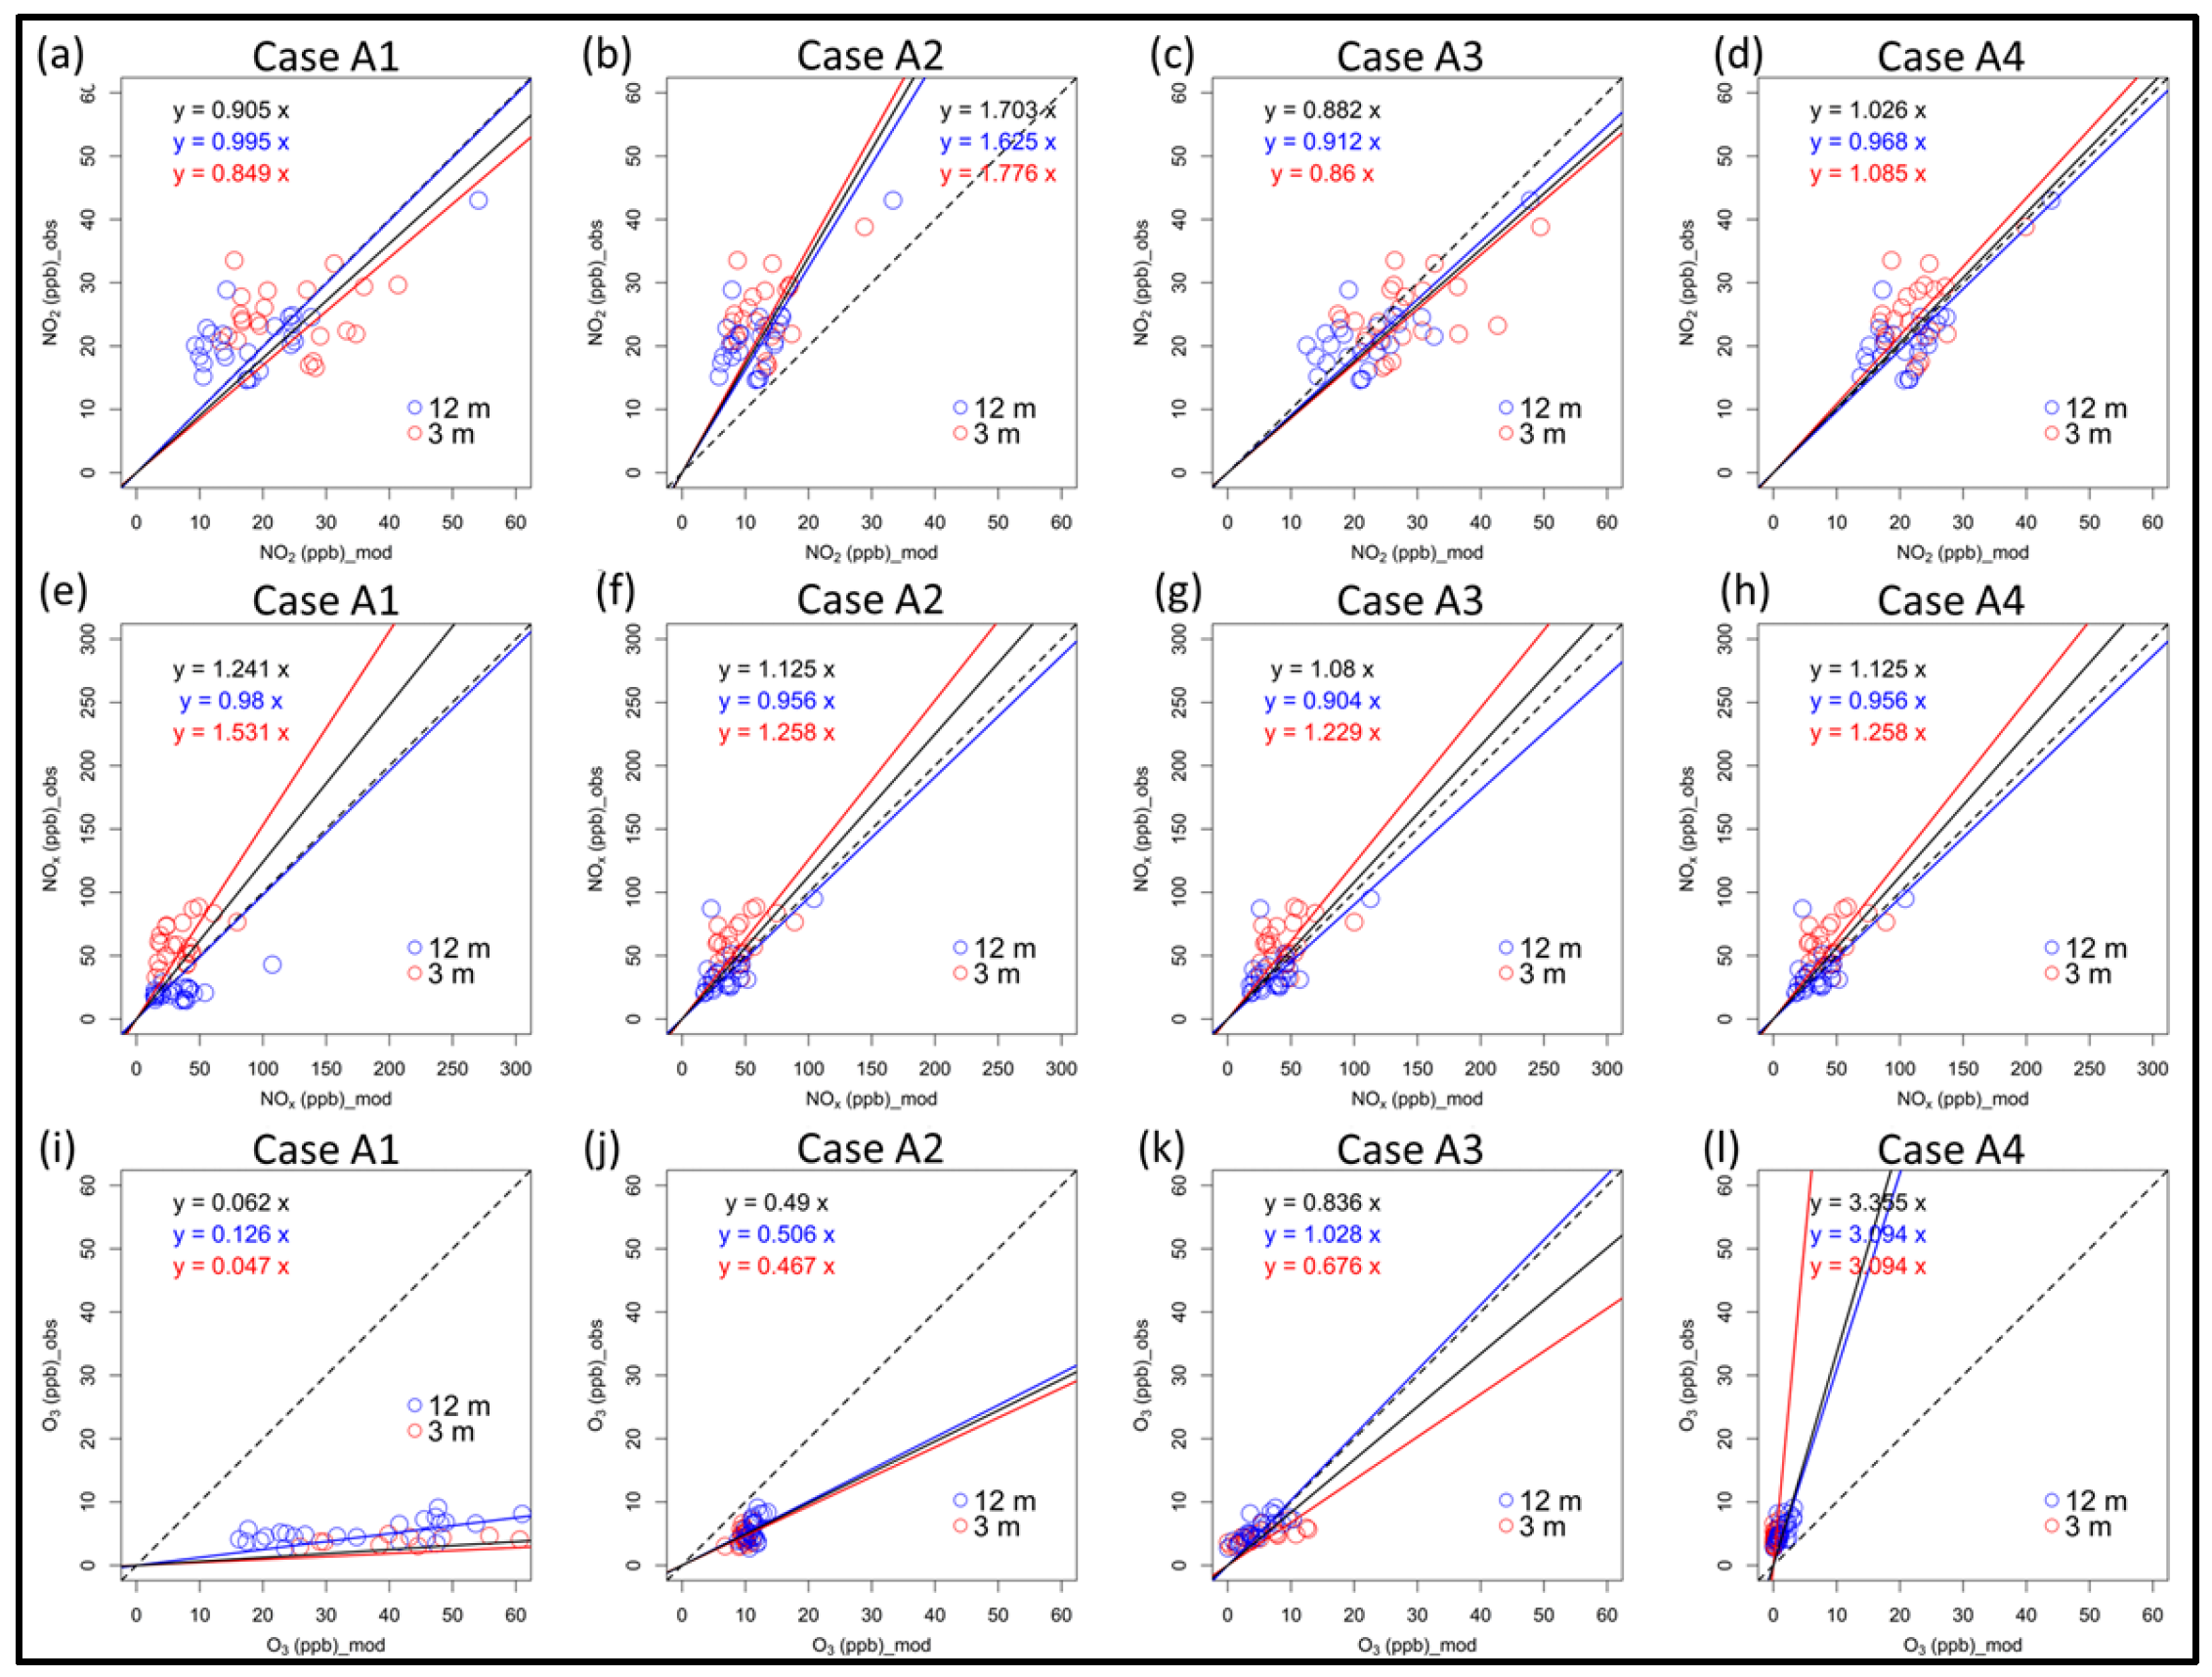
Figure 3 presents modeled mixing ratios for NO2, NOx, and O3 as simulated by the MBM-FleX in relation to observed values at distinct building heights (i.e., 3 m and 12 m) within the urban street canyon. Table 2 offers a statistical evaluation of modeled air pollutants compared to observations at both sampling locations, while Table S4 supplies a thorough assessment of model performance at 3 m and 12 m within the canyon. The MBM-FleX model consistently underestimates NOx mixing ratios, which can be effectively treated as passive scalars in all cases. This underestimation may be attributed to uncertainties in background conditions and emission inventories. When photochemical reaction rates, representative of summer midday conditions in the West Midlands, UK, were adopted, O3 formation accelerated markedly, leading to overestimated mixing ratios in both Case A1 and Case A2. Additionally, VOC radical chemistry contributes significantly to NO2 and O3 formation within the canyon due to limited ventilation, extended residence time, and increased reaction time. Implementation of a simple NOx-O3 cycle can suppress such overestimation. The averaged O3 mixing ratios were overestimated by 49.1 ppb (1185.1%) in Case A1 and by 6.7 ppb (163.8%) in Case A2. Without VOC chemistry, a considerable fraction of NO2 is neglected, with the time averaged NO2 being underestimated by approximately 6.4 ppb (20.4%) in Case A1 and by 14.3 ppb (48.3%) in Case A2. Case A3 showed the most favorable performance when compared to observations, exhibiting a difference of 1.8 ppb (6.2%) for NO2 and 0.7 ppb (13.0%) for O3. The model results from Case A3 were taken as the baseline for subsequent comparisons with Case B in the next section. As expected, Case A4 displayed similar results for NO2 when compared to Case A3, but the O3 mixing ratios were slightly lower due to the absence of VOC radical chemistry.
In the deep urban canyon, a high photolysis rate can intensify O3 formation, as exemplified by Case A1, even when VOC radical reactions become less significant (CaseA2). Consequently, O3 mixing ratios in such environments may pose a considerable concern during summer periods when solar radiation is intense. Our simulations indicate that O3 mixing ratios display a vertical distribution, potentially exposing individuals at O3 higher building heights to increased O3 levels. This trend can also be found in the observed values. Moreover, peroxyacetyl nitrate (PAN) is a crucial photochemical pollutant generated through reactions between NO2 and the peroxyacetyl radical (PA), typically considered a photochemical product of VOCs. Although both PAN and O3 are photochemical pollutants, their responses to precursors and temperature differ [56,57]. In Case A3, the spatiotemporal averaged PAN level within the canyon throughout the simulation period is 0.6 ppb, with a maximum value of 2.4 ppb at the street level on 12 January 2021. Exposure to PAN at the street level could significantly increase when solar radiation is high (e.g., Case A1). In light of these findings, future research is recommended to focus on refining model parameters and incorporating additional photochemical species, such as PAN, to enhance the accuracy of air quality predictions in deep canyon environments. Investigating the influence of seasonal fluctuations in solar radiation and meteorological conditions on photochemical pollutant concentrations will facilitate a more comprehensive understanding of the underlying processes and potential health hazards associated with elevated pollutant exposure at varying building heights.

3.4. Model Simulation Sensitivity to Emissions and Background

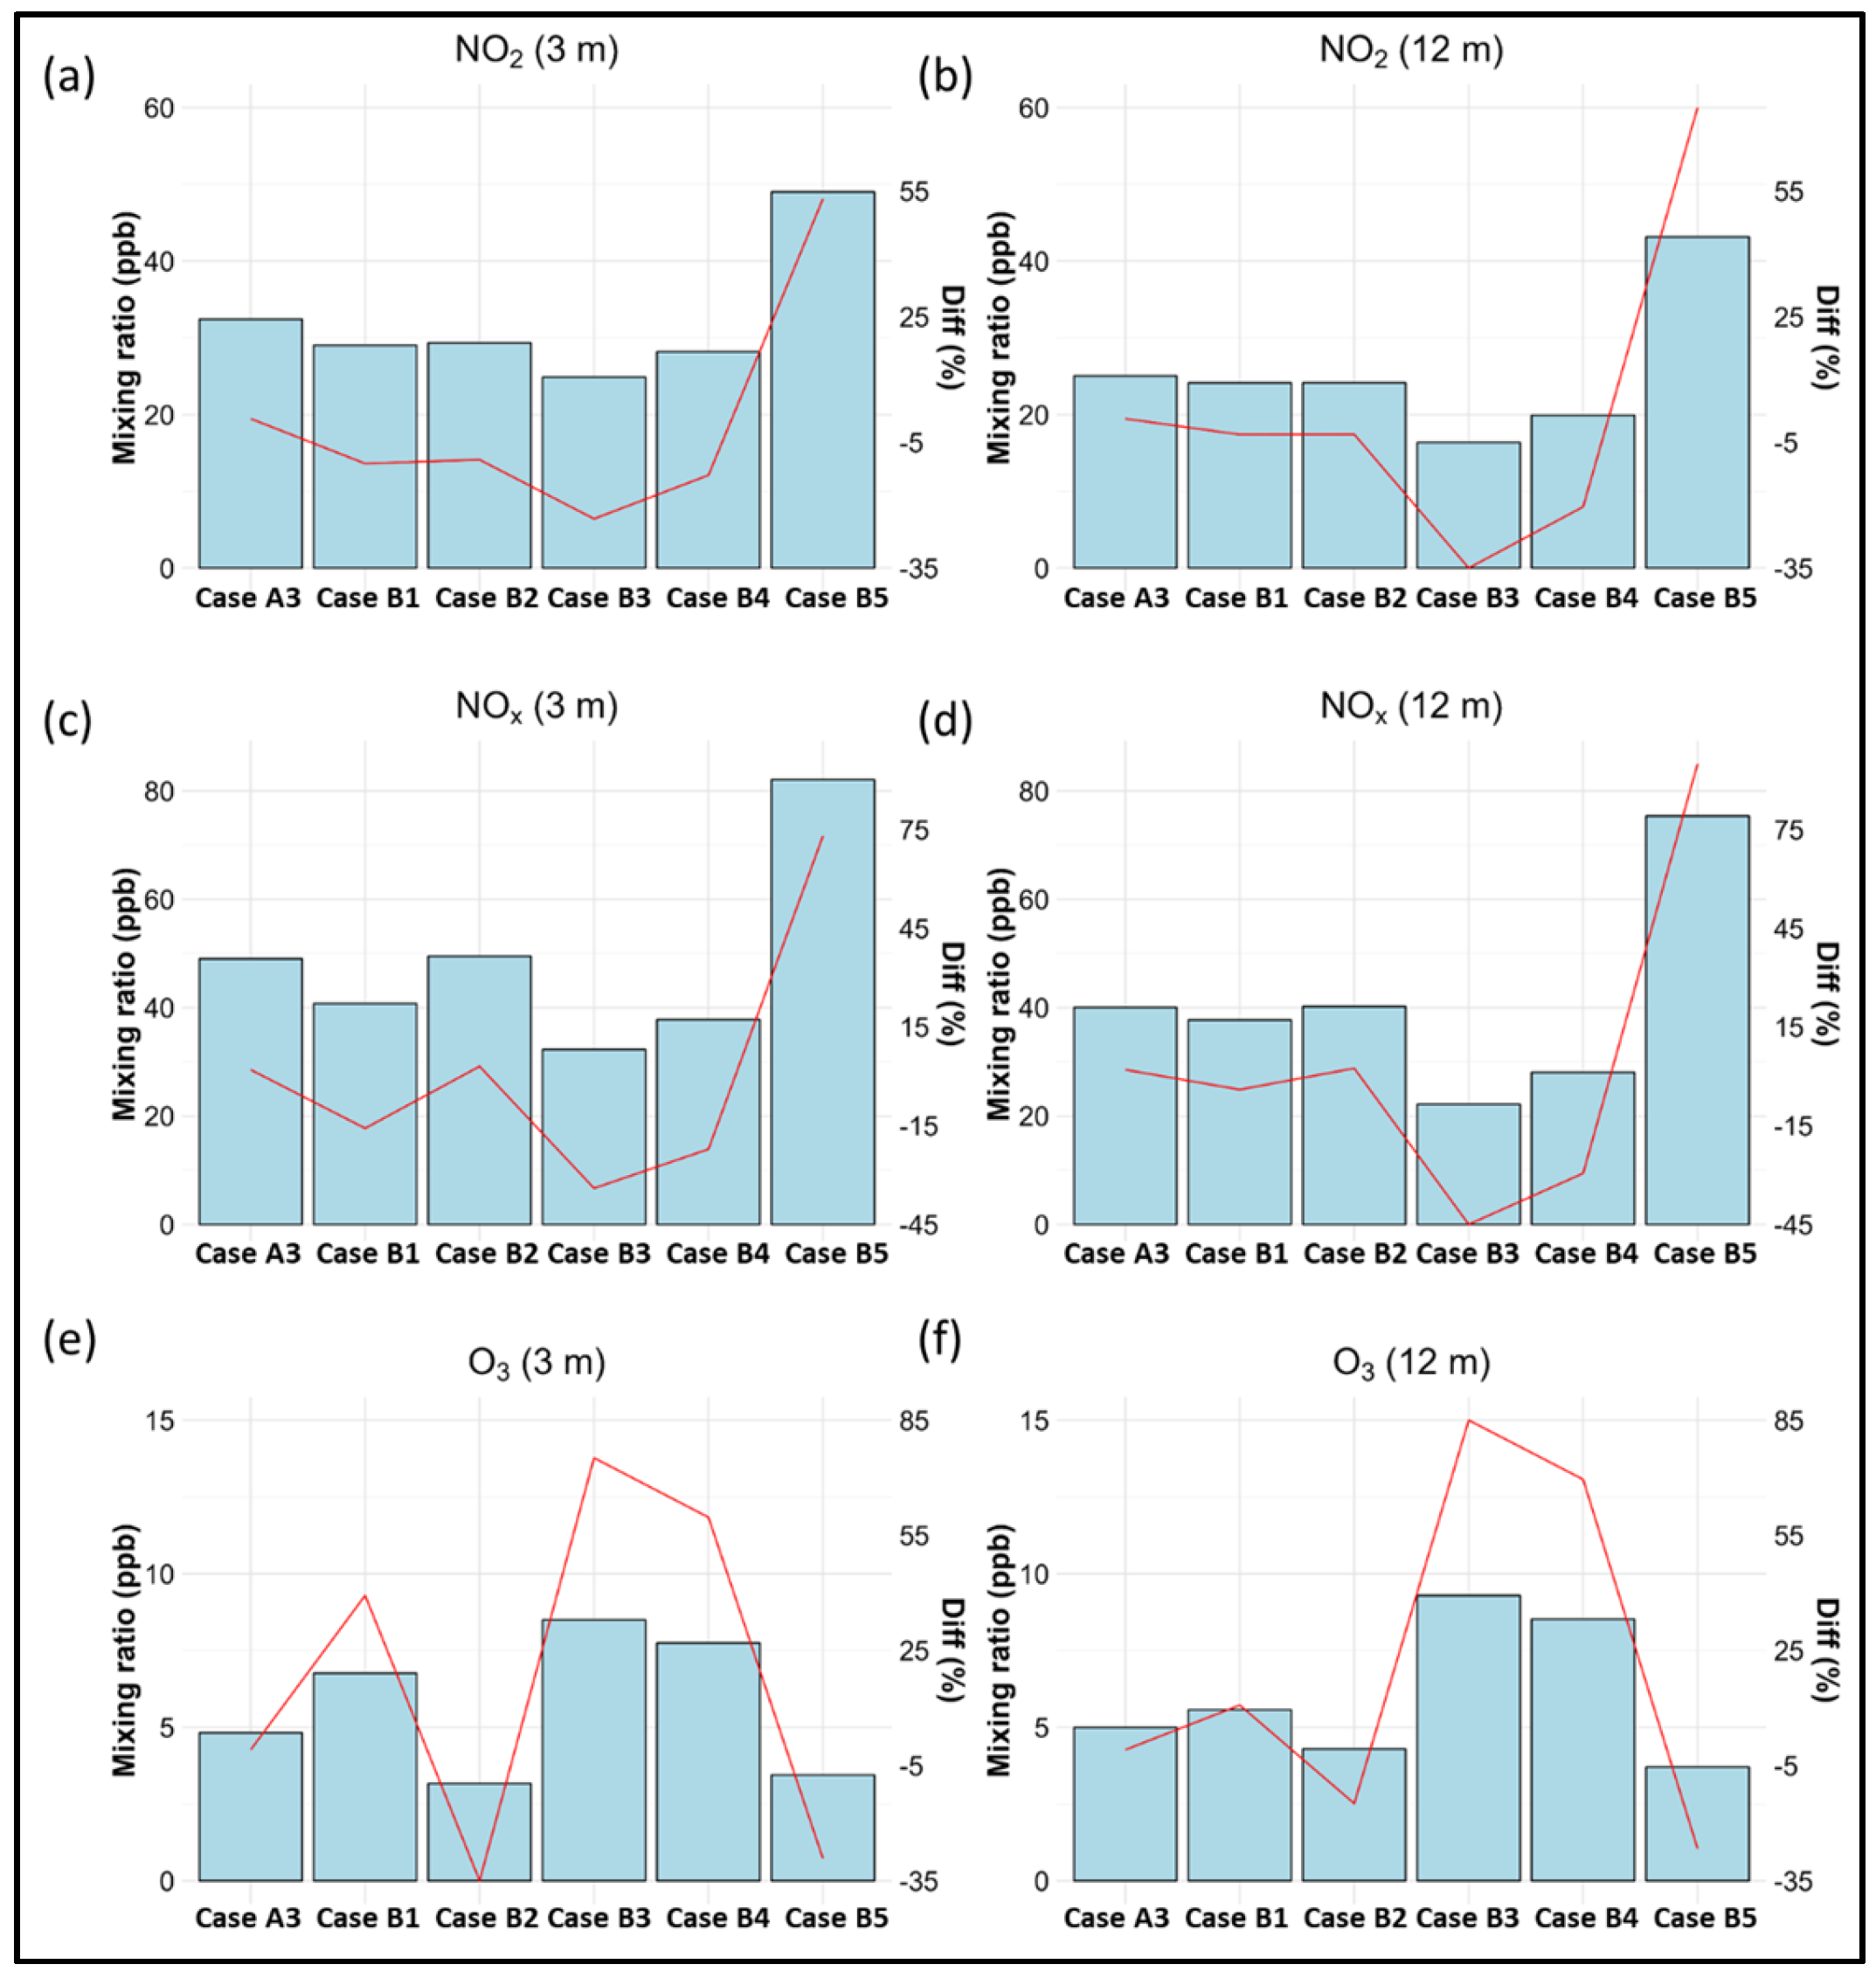
Various modeling scenarios (Cases B1–B5) were explored to understand the model response to changes in emissions and background conditions. The impact of emission rates and background conditions on air quality within the deep canyon can be expressed as the differences between Cases B1–B5 and Case A3 (See Figure 4). The red line in Figure 4 illustrates the percentage differences in air pollutant mixing ratios between the various modeling cases and their corresponding Case A3, attributable to reductions in NOx emissions (by 50%, Case B1), VOC emissions (by 50%, Case B2), and background conditions (Cases B3–B5).
Case B1 reveals that lowering NOx emissions leads to reduced NO2 and NOx mixing ratios at both heights and increased ground-level O3 mixing ratios. The reductions in NO2 and NOx at the street level are 3.4 ppb (10.4%) and 8.3 ppb (16.9%), respectively, which are substantially greater than those at the 12 m building height (1.0 ppb, 3.7% at the 3 m level, and 2.3 ppb, 5.7% at the 12 m level). The increases in O3 mixing ratios are 1.9 ppb (40.3%) and 0.6 ppb (11.7%) at the 3 m and 12 m levels of the canyon, respectively. Case B2 indicates that reduced VOC emissions result in similar decreases in NO2 mixing ratios through chemical processes at both 3 m and 12 m levels. However, changes in NOx levels in the street canyon did not vary substantially. This suggests that the urban atmosphere is sensitive to both NOx and VOC emissions. Reducing VOCs offers additional benefits, as O3 concentrations slightly decreased (1.6 ppb and 0.7 ppb) rather than increasing as in Case B1. This reduction may become more significant during summer daytime when photochemical processes intensify.
The model results also indicate that background NOx conditions significantly impact air pollution within the canyon. Lower background NOx levels were associated with decreased NO2 (e.g., 7.5 ppb, 23.3% at the 3 m level and 8.7 ppb, 34.7% at the 12 m level in Case B3) and NOx (16.8 ppb, 34.2% and 17.9 ppb, 44.6%, respectively) mixing ratios and increased O3 levels, while high background NOx conditions exhibited the opposite trend. In line with changes in traffic emissions (i.e., Case B1 and Case B2), these results indicate that the street level is more affected by traffic emissions, while the upper level of the canyon is more influenced by overlying background conditions. Strategies must be carefully designed to propose targeted approaches for mitigating air pollution at different heights within the canyon. The susceptibility of the canyon to background conditions highlights the need to consider background conditions when designing air quality management strategies for urban canyons. Policymakers and urban planners should implement integrated strategies to control local and citywide concentrations in order to reduce the exposure risk of pollutants for populations within street canyons. Localized actions could include (1) the integration of vertical greenery systems or green walls on building facades and (2) the establishment of low-emission zones coupled with restrictions on vehicle assess during high pollution periods. On a citywide scale, strategies should involve thoughtful urban planning with attention to building orientations, heights, and spacing. Additionally, augmenting urban green spaces, such as parks and gardens, and enforcing stringent emission standards for both industries and vehicles are pivotal. Incentives to accelerate the adoption of electric or hybrid vehicles would also be effective, for gas-phase pollutants at least.

3.5. The Performance of MBM-FleX_r

In the current study, the performance of MBM-FleX_r—an advanced and flexible methodology developed for future integration with regional-scale air quality models, similar to Kim, Wu, Seigneur and Roustan [33]—was evaluated. Figure S7 presents scatter plots comparing MBM-FleX_r simulations with observations, while Table S5 provides a statistical evaluation of MBM FleX_r at various heights within the deep canyon. Consistent with its predecessor MBM-FleX, Case C3, which incorporates VOC radical chemistry and a photochemical reaction intensity profile, exhibits the highest performance for NO2, NOx, and O3 simulations in MBM-FleX_r, with IOA values of 0.6, 0.63, and 0.55, respectively. The model shows enhanced performance at 12 m compared to 3 m; it should also be noted that optimizing overall model performance for the canyon air quality simulation may yield varying model performance at different heights. The differences between modeled and observed values are mainly attributed to systematic errors (Table S5).
The findings support the viability of using simplified exchange rates between the urban canyon and the ambient background while preserving pollution concentration gradients at the street level. However, a more in-depth evaluation of MBM-FleX_r performance in the horizontal direction is warranted by using 2D box models in future research. This will enable a more comprehensive understanding of the model capabilities and limitations, contributing to the improvement and refinement of air quality estimations in intricate urban environments.

4. Conclusions

Multi-box frameworks, incorporating both dynamics and chemistry, were employed to simulate reactive pollutants within deep urban canyon environments. The model results were assessed against measured NO2, NOx, and O3 at different building heights for a real deep canyon located in Naples, Italy. Firstly, using the dynamical parameters derived from the computational fluid dynamics (CFD) results, the vertical distribution of CO within an idealized deep canyon with an AR of 3, as modeled by one-dimensional MBM-FleX, exhibited a strong agreement with the results obtained from the CFD simulations. The dynamical parameters were applied to the real canyon with an AR of 3.7, which closely approximated the idealized canyon. Model results show that increasing photolysis rates (e.g., during summer months with strong solar radiation) may lead to an intensification of O3 formation within the deep canyon from less than 10 ppb to 50 ppb and even higher (e.g., Figure 3). This finding suggests that factors such as the shading effects (influencing photochemical kinetics) should be considered in future simulations for more accurate prediction [25]. The research emphasizes the importance of accounting for vertical distribution when assessing the health impacts of air pollutants and developing effective air quality control strategies in deep urban canyons.
The study employed various modeling scenarios (Cases B1–B5) to provide an understanding of the model response to changes in emissions and background conditions in the context of air quality within deep urban canyons. Case A3 showed the best model performance in the evaluation against the observations and was used as the baseline for further scenarios in which reducing NOx and VOC emissions and varying background conditions were discussed. Strong reductions in emissions are needed for even modest returns in air quality; reducing 50% of emissions can lead to improvements in air quality by 10.4% to 16.9% at the street level. The deep street canyon atmosphere is sensitive to both NOx and VOC emissions. Somewhat more surprisingly, since the background pollutant field can change the top-of-street flux appreciably, the model response was sensitive to changes in background conditions. This emphasizes the need for targeted approaches and consideration of regional and local background conditions in the design of air quality management strategies. Additionally, the performance of the newly developed MBM-FleX_r was assessed. The model exhibits some overestimation at rooftop heights, particularly on the windward side, but it effectively captures pollution concentration gradients at the ground level. This approach has the potential to integrate seamlessly with regional-scale air quality models, and so improve our understanding of air quality dynamics within complex urban environments over a range of scales.
To future improve the multi-box model accuracy, several important factors must be considered: Firstly, the distinctive geometry of urban canyons impacts ventilation rates, often leading to trapped pollutants; thus, gauging these rates is essential for predicting how pollutants might behave in these environments. Secondly, as urban canyons are embedded within the broader urban framework, their interaction with the ambient air quality becomes paramount; accurate integration of background concentrations at the rooftop level ensures a holistic portrayal of pollutants, encompassing both pre-existing and canyon-specific emissions. Lastly, given that primary pollutants in urban settings transform into secondary pollutants under sunlight, models must incorporate these photochemical processes, enabling predictions about both the dispersion and evolution of these pollutants.
Future research efforts should focus on incorporating additional photochemical species, such as peroxyacetyl nitrate (PAN), to improve the accuracy of air quality predictions within deep urban canyon environments. Examining the impact of seasonal variations in solar radiation and meteorological conditions on photochemical pollutant concentrations will provide a more comprehensive understanding of the underlying processes and potential health hazards related to elevated pollutant exposure at different building heights. A thorough evaluation of MBM-FleX_r performance using 2D multi-layer box models is recommended to facilitate a more in-depth understanding of the model’s capabilities and limitations.

Supplementary Materials

The following supporting information can be downloaded at: https://www.mdpi.com/article/10.3390/atmos14091385/s1, Figure S1. Diagram of the multi-box model (MBM-FleX) for air quality simulation within (a,b) regular and (c,d) deep street canyons. Red frames represent compartments that resolve a large vortex, blue lines further split the canyon volume into finer boxes, indicating the spatial resolution of the model within canyons, and green frame represents the entire volume of street canyons. Figure S2. Model results of CO concentrations from MBM-FleX, MBM-FleX_r, and CFD (i.e., RANS) for a deep canyon (AR = 3), where (a) shows the vertical distributions of CO concentrations within the canyon, and (b) illustrates the dissipation rates of CO with time. Figure S3. Model results of NO, NO2, O3, and PS from the original (i.e., MBM-FleX), revised (e.g., MBM-FleX_r) multi-box models, and large-eddy simulations (LES) with the simple NOx-O3 chemistry for the regular canyon (AR = 1). The black line represents results from MBM-FleX, the red line represents results from MBM-FleX_r, and the blue line represents results from LES, respectively. The grey dashed lines represent the division of the canyon horizontally, from the lee-side to the wind-side; in each panel the height increases as indicated by the orange arrow. Figure S4. Model results of NO, NO2, O3, and PS from the original (i.e., MBM-FleX), revised (e.g., MBM-FleX_r) multi-box models, and large-eddy simulations (LES) with the reduced chemical scheme (RCS) for the regular canyon (AR = 1). The black line represents results from MBM-FleX, the red line represents results from MBM-FleX_r, and the blue line represents results from LES, respectively. The grey dashed lines represent the division of the canyon horizontally, from the lee-side to the wind-side; in each panel the height increases as indicated by the orange arrow. Figure S5. Model results of NO, NO2, O3, and PS from the original (i.e., MBM-FleX), revised (e.g., MBM-FleX_r) multi-box models, and large-eddy simulations (LES) with the simple NOx-O3 chemistry for the regular canyon (AR = 1). The black line represents results from MBM-FleX, the red line represents results from MBM-FleX_r, and the blue line represents results from LES, respectively. The grey dashed lines represent the division of the canyon horizontally, from the lee-side to the wind-side; in each panel the height increases as indicated by the orange arrow. Figure S6. Model results of NO, NO2, O3, and PS from the original (i.e., MBM-FleX), revised (e.g., MBM-FleX_r) multi-box models, and large-eddy simulations (LES) with reduced chemical scheme (RCS) for the deep canyon (AR = 2). The black line represents results from MBM-FleX, the red line represents results from MBM-FleX_r, and the blue line represents results from LES, respectively. The grey dashed lines represent the division of the canyon horizontally, from the lee-side to the wind-side; in each panel the height increases as indicated by the orange arrow. Figure S7. Scatter plot illustrating the correlation between modeled (MBM-FleX_r) and observed NO2, NOx, and O3 concentrations at various heights within the deep street canyon. The red line delineates the relationship between modeled and observed values at 3 m height, the blue line represents the relationship at 12 m height, and the black line signifies model evaluations using data from all heights. Figure S8. Scatter plot illustrating the correlation between MBM-FleX_r and MBM-FleX simulations at various heights within the deep street canyon. The red line delineates the relationship between modeled and observed values at 3 m height, the blue line represents the relationship at 12 m height, and the black line signifies model evaluations using data from all heights. Table S1. Turbulent mixing velocities used in the MBM-FleX/MBM-FleX_r model, these dynamical parameters are derived from wash-out CFD simulations for a deep canyon (AR = 3) under a prevailing wind speed of 2 m s−1 in the neutral atmosphere. Table S2. Emission factors of main vehicle categories were calculated using the COPERT procedure at 20 km h−1, the unit has been transformed from g km−1 h−1 into ppb according to the volume of model mesh under standard pressure and 293 K. Table S3. Photochemical reactions and their reaction rate coefficients (J-values) at 293 K included in the Reduced Chemical Scheme (RCS). Table S4. Statistical evaluation of the MBM-FleX for NO2, NOx, and O3 at different building heights within the deep street canyon (AR = 3.7). Table S5. Statistical evaluation of the MBM-FleX_r for NO2, NOx, and O3 within the deep street canyon (AR = 3.7). References [6,8,12,28,58,59] are mentioned in the Supplementary Materials.

Author Contributions

Conceptualization, A.M. and Y.D.; methodology, software, Y.D., B.M.; formal analysis, writing—original draft preparation, Y.D.; writing—review and editing, A.M., J.Z., X.C., D.T., B.M., F.M., A.R.M.; supervision, A.R.M. All authors have read and agreed to the published version of the manuscript.

Funding

A.M., J.Z., X.C., A.R.M. acknowledge the funding from the UK Natural Environment Research Council (NERC) WM-Air project (grant number NE/S003487/1).

Institutional Review Board Statement

Not applicable.

Informed Consent Statement

Not applicable.

Data Availability Statement

Data available on request.

Acknowledgments

The computations described herein were conducted using the University of Birmingham’s BlueBEAR HPC service (http://www.bear.bham.ac.uk, accessed on 15 July 2023).

Conflicts of Interest

The authors declare no conflict of interest.

References

  1. Baik, J.-J.; Kang, Y.-S.; Kim, J.-J. Modeling reactive pollutant dispersion in an urban street canyon. Atmos. Environ. 2007, 41, 934–949. [Google Scholar] [CrossRef]
  2. Oke, T.R.; Mills, G.; Christen, A.; Voogt, J.A. Urban Climates; Cambridge University Press: Cambridge, UK, 2017. [Google Scholar]
  3. Vardoulakis, S.; Fisher, B.E.; Pericleous, K.; Gonzalez-Flesca, N. Modelling air quality in street canyons: A review. Atmos. Environ. 2003, 37, 155–182. [Google Scholar] [CrossRef]
  4. Zhong, J.; Cai, X.-M.; Bloss, W.J. Coupling dynamics and chemistry in the air pollution modelling of street canyons: A review. Environ. Pollut. 2016, 214, 690–704. [Google Scholar] [CrossRef] [PubMed]
  5. Demuzere, M.; Bechtel, B.; Middel, A.; Mills, G. Mapping Europe into local climate zones. PLoS ONE 2019, 14, e0214474. [Google Scholar] [CrossRef] [PubMed]
  6. Bright, V.B.; Bloss, W.J.; Cai, X. Urban street canyons: Coupling dynamics, chemistry and within-canyon chemical processing of emissions. Atmos. Environ. 2013, 68, 127–142. [Google Scholar] [CrossRef]
  7. Han, B.-S.; Baik, J.-J.; Kwak, K.-H.; Park, S.-B. Large-eddy simulation of reactive pollutant exchange at the top of a street canyon. Atmos. Environ. 2018, 187, 381–389. [Google Scholar] [CrossRef]
  8. Zhong, J.; Cai, X.-M.; Bloss, W.J. Modelling the dispersion and transport of reactive pollutants in a deep urban street canyon: Using large-eddy simulation. Environ. Pollut. 2015, 200, 42–52. [Google Scholar] [CrossRef]
  9. Turner, M.C.; Andersen, Z.J.; Baccarelli, A.; Diver, W.R.; Gapstur, S.M.; Pope, C.A., III; Prada, D.; Samet, J.; Thurston, G.; Cohen, A. Outdoor air pollution and cancer: An overview of the current evidence and public health recommendations. CA Cancer J. Clin. 2020, 70, 460–479. [Google Scholar] [CrossRef]
  10. Shah, A.S.; Lee, K.K.; McAllister, D.A.; Hunter, A.; Nair, H.; Whiteley, W.; Langrish, J.P.; Newby, D.E.; Mills, N.L. Short term exposure to air pollution and stroke: Systematic review and meta-analysis. BMJ 2015, 350, h1295. [Google Scholar] [CrossRef]
  11. Landrigan, P.J.; Fuller, R.; Acosta, N.J.; Adeyi, O.; Arnold, R.; Baldé, A.B.; Bertollini, R.; Bose-O’Reilly, S.; Boufford, J.I.; Breysse, P.N. The Lancet Commission on pollution and health. Lancet 2018, 391, 462–512. [Google Scholar] [CrossRef]
  12. Dai, Y.; Cai, X.; Zhong, J.; MacKenzie, A.R. Chemistry, street canyon geometry, and emissions effects on NO2 “hotspots” and regulatory “wiggle room”. npj Clim. Atmos. Sci. 2022, 5, 102. [Google Scholar] [CrossRef]
  13. Barlow, J.F.; Harman, I.N.; Belcher, S.E. Scalar fluxes from urban street canyons. Part I: Laboratory simulation. Bound. Layer Meteorol. 2004, 113, 369–385. [Google Scholar] [CrossRef]
  14. Cui, D.; Hu, G.; Ai, Z.; Du, Y.; Mak, C.M.; Kwok, K. Particle image velocimetry measurement and CFD simulation of pedestrian level wind environment around U-type street canyon. Build. Environ. 2019, 154, 239–251. [Google Scholar] [CrossRef]
  15. Gu, Z.-L.; Zhang, Y.-W.; Cheng, Y.; Lee, S.-C. Effect of uneven building layout on air flow and pollutant dispersion in non-uniform street canyons. Build. Environ. 2011, 46, 2657–2665. [Google Scholar] [CrossRef]
  16. Ng, W.-Y.; Chau, C.-K. A modeling investigation of the impact of street and building configurations on personal air pollutant exposure in isolated deep urban canyons. Sci. Total Environ. 2014, 468, 429–448. [Google Scholar] [CrossRef]
  17. Yuan, C.; Ng, E.; Norford, L.K. Improving air quality in high-density cities by understanding the relationship between air pollutant dispersion and urban morphologies. Build. Environ. 2014, 71, 245–258. [Google Scholar] [CrossRef] [PubMed]
  18. Rakowska, A.; Wong, K.C.; Townsend, T.; Chan, K.L.; Westerdahl, D.; Ng, S.; Močnik, G.; Drinovec, L.; Ning, Z. Impact of traffic volume and composition on the air quality and pedestrian exposure in urban street canyon. Atmos. Environ. 2014, 98, 260–270. [Google Scholar] [CrossRef]
  19. Hood, C.; Stocker, J.; Seaton, M.; Johnson, K.; O’Neill, J.; Thorne, L.; Carruthers, D. Comprehensive evaluation of an advanced street canyon air pollution model. J. Air Waste Manag. Assoc. 2021, 71, 247–267. [Google Scholar] [CrossRef]
  20. Murena, F.; Favale, G.; Vardoulakis, S.; Solazzo, E. Modelling dispersion of traffic pollution in a deep street canyon: Application of CFD and operational models. Atmos. Environ. 2009, 43, 2303–2311. [Google Scholar] [CrossRef]
  21. Fu, X.; Liu, J.; Ban-Weiss, G.A.; Zhang, J.; Huang, X.; Ouyang, B.; Popoola, O.; Tao, S. Effects of canyon geometry on the distribution of traffic-related air pollution in a large urban area: Implications of a multi-canyon air pollution dispersion model. Atmos. Environ. 2017, 165, 111–121. [Google Scholar] [CrossRef]
  22. He, L.; Hang, J.; Wang, X.; Lin, B.; Li, X.; Lan, G. Numerical investigations of flow and passive pollutant exposure in high-rise deep street canyons with various street aspect ratios and viaduct settings. Sci. Total Environ. 2017, 584, 189–206. [Google Scholar] [CrossRef] [PubMed]
  23. Sun, J.; Wu, F.; Hu, B.; Tang, G.; Zhang, J.; Wang, Y. VOC characteristics, emissions and contributions to SOA formation during hazy episodes. Atmos. Environ. 2016, 141, 560–570. [Google Scholar] [CrossRef]
  24. Li, Q.; Su, G.; Li, C.; Liu, P.; Zhao, X.; Zhang, C.; Sun, X.; Mu, Y.; Wu, M.; Wang, Q. An investigation into the role of VOCs in SOA and ozone production in Beijing, China. Sci. Total Environ. 2020, 720, 137536. [Google Scholar] [CrossRef] [PubMed]
  25. Zhang, K.; Chen, G.; Zhang, Y.; Liu, S.; Wang, X.; Wang, B.; Hang, J. Integrated impacts of turbulent mixing and NOX-O3 photochemistry on reactive pollutant dispersion and intake fraction in shallow and deep street canyons. Sci. Total Environ. 2020, 712, 135553. [Google Scholar] [CrossRef]
  26. Grawe, D.; Cai, X.-M.; Harrison, R.M. Large eddy simulation of shading effects on NO2 and O3 concentrations within an idealised street canyon. Atmos. Environ. 2007, 41, 7304–7314. [Google Scholar] [CrossRef]
  27. Huang, Y.; Lei, C.; Liu, C.-H.; Perez, P.; Forehead, H.; Kong, S.; Zhou, J.L. A review of strategies for mitigating roadside air pollution in urban street canyons. Environ. Pollut. 2021, 280, 116971. [Google Scholar] [CrossRef]
  28. Dai, Y.; Cai, X.; Zhong, J.; MacKenzie, A.R. Modelling chemistry and transport in urban street canyons: Comparing offline multi-box models with large-eddy simulation. Atmos. Environ. 2021, 264, 118709. [Google Scholar] [CrossRef]
  29. Murena, F.; Prati, M. The contribution of high emitters vehicles to FPS number concentration in the historical centre of Naples. In Proceedings of the Air Quality Science and Application, Online, 18–22 May 2020; p. 22. [Google Scholar]
  30. Murena, F.; Mele, B. Effect of balconies on air quality in deep street canyons. Atmos. Pollut. Res. 2016, 7, 1004–1012. [Google Scholar] [CrossRef]
  31. Carslaw, D.C.; Ropkins, K. Openair—An R package for air quality data analysis. Environ. Model. Softw. 2012, 27, 52–61. [Google Scholar] [CrossRef]
  32. Zhong, J.; Cai, X.-M.; Bloss, W.J. Large eddy simulation of reactive pollutants in a deep urban street canyon: Coupling dynamics with O3-NOx-VOC chemistry. Environ. Pollut. 2017, 224, 171–184. [Google Scholar] [CrossRef]
  33. Kim, Y.; Wu, Y.; Seigneur, C.; Roustan, Y. Multi-scale modeling of urban air pollution: Development and application of a Street-in-Grid model (v1. 0) by coupling MUNICH (v1. 0) and Polair3D (v1. 8.1). Geosci. Model Dev. 2018, 11, 611–629. [Google Scholar] [CrossRef]
  34. Yang, H.; Chen, T.; Lin, Y.; Buccolieri, R.; Mattsson, M.; Zhang, M.; Hang, J.; Wang, Q. Integrated impacts of tree planting and street aspect ratios on CO dispersion and personal exposure in full-scale street canyons. Build. Environ. 2020, 169, 106529. [Google Scholar] [CrossRef]
  35. Karkoulias, V.; Marazioti, P.; Georgiou, D.; Maraziotis, E. Computational Fluid Dynamics modeling of the trace elements dispersion and comparison with measurements in a street canyon with balconies in the city of Patras, Greece. Atmos. Environ. 2020, 223, 117210. [Google Scholar] [CrossRef]
  36. Chew, L.W.; Aliabadi, A.A.; Norford, L.K. Flows across high aspect ratio street canyons: Reynolds number independence revisited. Environ. Fluid Mech. 2018, 18, 1275–1291. [Google Scholar] [CrossRef]
  37. Murena, F.; Mele, B. Effect of short–time variations of wind velocity on mass transfer rate between street canyons and the atmospheric boundary layer. Atmos. Pollut. Res. 2014, 5, 484–490. [Google Scholar] [CrossRef]
  38. Cai, X. Effects of differential wall heating in street canyons on dispersion and ventilation characteristics of a passive scalar. Atmos. Environ. 2012, 51, 268–277. [Google Scholar] [CrossRef]
  39. Solazzo, E.; Cai, X.; Vardoulakis, S. Improved parameterisation for the numerical modelling of air pollution within an urban street canyon. Environ. Model. Softw. 2009, 24, 381–388. [Google Scholar] [CrossRef]
  40. Vachon, G.; Louka, P.; Rosant, J.; Mestayer, P.; Sini, J. Measurements of traffic-induced turbulence within a street canyon during the Nantes’ 99 experiment. Water Air Soil Pollut. Focus 2002, 2, 127–140. [Google Scholar] [CrossRef]
  41. Ntziachristos, L.; Samaras, Z.; Eggleston, S.; Gorissen, N.; Hassel, D.; Hickman, A. Copert iii. In Computer Programme to Calculate Emissions from Road Transport, Methodology and Emission Factors (Version 2.1); European Energy Agency (EEA): Copenhagen, Denmark, 2000. [Google Scholar]
  42. Madronich, S.; Flocke, S.; Zeng, J.; Petropavlovskikh, I.; Lee-Taylor, J. Tropospheric Ultraviolet and Visible (TUV) Radiation Model; National Center for Atmospheric Research (NCAR): Boulder, CO, USA, 2002; Available online: http://www2.acom.ucar.edu/modelling (accessed on 8 June 2023).
  43. Hersbach, H.; Bell, B.; Berrisford, P.; Hirahara, S.; Horányi, A.; Muñoz-Sabater, J.; Nicolas, J.; Peubey, C.; Radu, R.; Schepers, D. The ERA5 global reanalysis. Q. J. R. Meteorol. Soc. 2020, 146, 1999–2049. [Google Scholar] [CrossRef]
  44. Bourbia, F.; Awbi, H. Building cluster and shading in urban canyon for hot dry climate: Part 2: Shading simulations. Renew. Energy 2004, 29, 291–301. [Google Scholar] [CrossRef]
  45. Dai, Y.; Cai, X.; Zhong, J.; Mazzeo, A.; MacKenzie, A.R. Chemistry, transport, emission, and shading effects on NO2 and Ox distributions within urban canyons. Environ. Pollut. 2022, 315, 120347. [Google Scholar] [CrossRef]
  46. Paolini, R.; Mainini, A.G.; Poli, T.; Vercesi, L. Assessment of thermal stress in a street canyon in pedestrian area with or without canopy shading. Energy Procedia 2014, 48, 1570–1575. [Google Scholar] [CrossRef]
  47. Sin, C.H.; Jon, K.S.; Un, G.H.; Thae, Y.I.; Kim, H.; Tokgo, J.; Ri, H.M. Evaluation of the ventilation and pollutant exposure risk level inside 3D street canyon with void deck under different wind directions. Environ. Sci. Pollut. Res. 2023, 30, 61808–61828. [Google Scholar] [CrossRef] [PubMed]
  48. Kwak, K.-H.; Baik, J.-J.; Lee, S.-H.; Ryu, Y.-H. Computational fluid dynamics modelling of the diurnal variation of flow in a street canyon. Bound. Layer Meteorol. 2011, 141, 77–92. [Google Scholar] [CrossRef]
  49. Niachou, K.; Livada, I.; Santamouris, M. Experimental study of temperature and airflow distribution inside an urban street canyon during hot summer weather conditions. Part II: Airflow analysis. Build. Environ. 2008, 43, 1393–1403. [Google Scholar] [CrossRef]
  50. Willmott, C.J.; Robeson, S.M.; Matsuura, K. A refined index of model performance. Int. J. Climatol. 2012, 32, 2088–2094. [Google Scholar] [CrossRef]
  51. Chang, J.C.; Hanna, S.R. Air quality model performance evaluation. Meteorol. Atmos. Phys. 2004, 87, 167–196. [Google Scholar] [CrossRef]
  52. Cai, X.-M.; Steyn, D. Modelling study of sea breezes in a complex coastal environment. Atmos. Environ. 2000, 34, 2873–2885. [Google Scholar] [CrossRef]
  53. Willmott, C.J. On the validation of models. Phys. Geogr. 1981, 2, 184–194. [Google Scholar] [CrossRef]
  54. Willmott, C.J.; Ackleson, S.G.; Davis, R.E.; Feddema, J.J.; Klink, K.M.; Legates, D.R.; O’donnell, J.; Rowe, C.M. Statistics for the evaluation and comparison of models. J. Geophys. Res. Oceans 1985, 90, 8995–9005. [Google Scholar] [CrossRef]
  55. Murena, F. Monitoring and modelling carbon monoxide concentrations in a deep street canyon: Application of a two-box model. Atmos. Pollut. Res. 2012, 3, 311–316. [Google Scholar] [CrossRef]
  56. Wang, T.; Xue, L.; Brimblecombe, P.; Lam, Y.F.; Li, L.; Zhang, L. Ozone pollution in China: A review of concentrations, meteorological influences, chemical precursors, and effects. Sci. Total Environ. 2017, 575, 1582–1596. [Google Scholar] [CrossRef]
  57. Li, K.; Jacob, D.J.; Liao, H.; Zhu, J.; Shah, V.; Shen, L.; Bates, K.H.; Zhang, Q.; Zhai, S. A two-pollutant strategy for improving ozone and particulate air quality in China. Nat. Geosci. 2019, 12, 906–910. [Google Scholar] [CrossRef]
  58. Zhong, J.; Cai, X.-M.; Bloss, W.J. Modelling segregation effects of heterogeneous emissions on ozone levels in idealised urban street canyons: Using photochemical box models. Environ. Pollut. 2014, 188, 132–143. [Google Scholar] [CrossRef]
  59. Li, C.W.; Brasseur, G.P.; Schmidt, H.; Mellado, J.P. Error induced by neglecting subgrid chemical segregation due to inefficient turbulent mixing in regional chemical-transport models in urban environments. Atmos. Chem. Phys. 2021, 21, 483–503. [Google Scholar] [CrossRef]
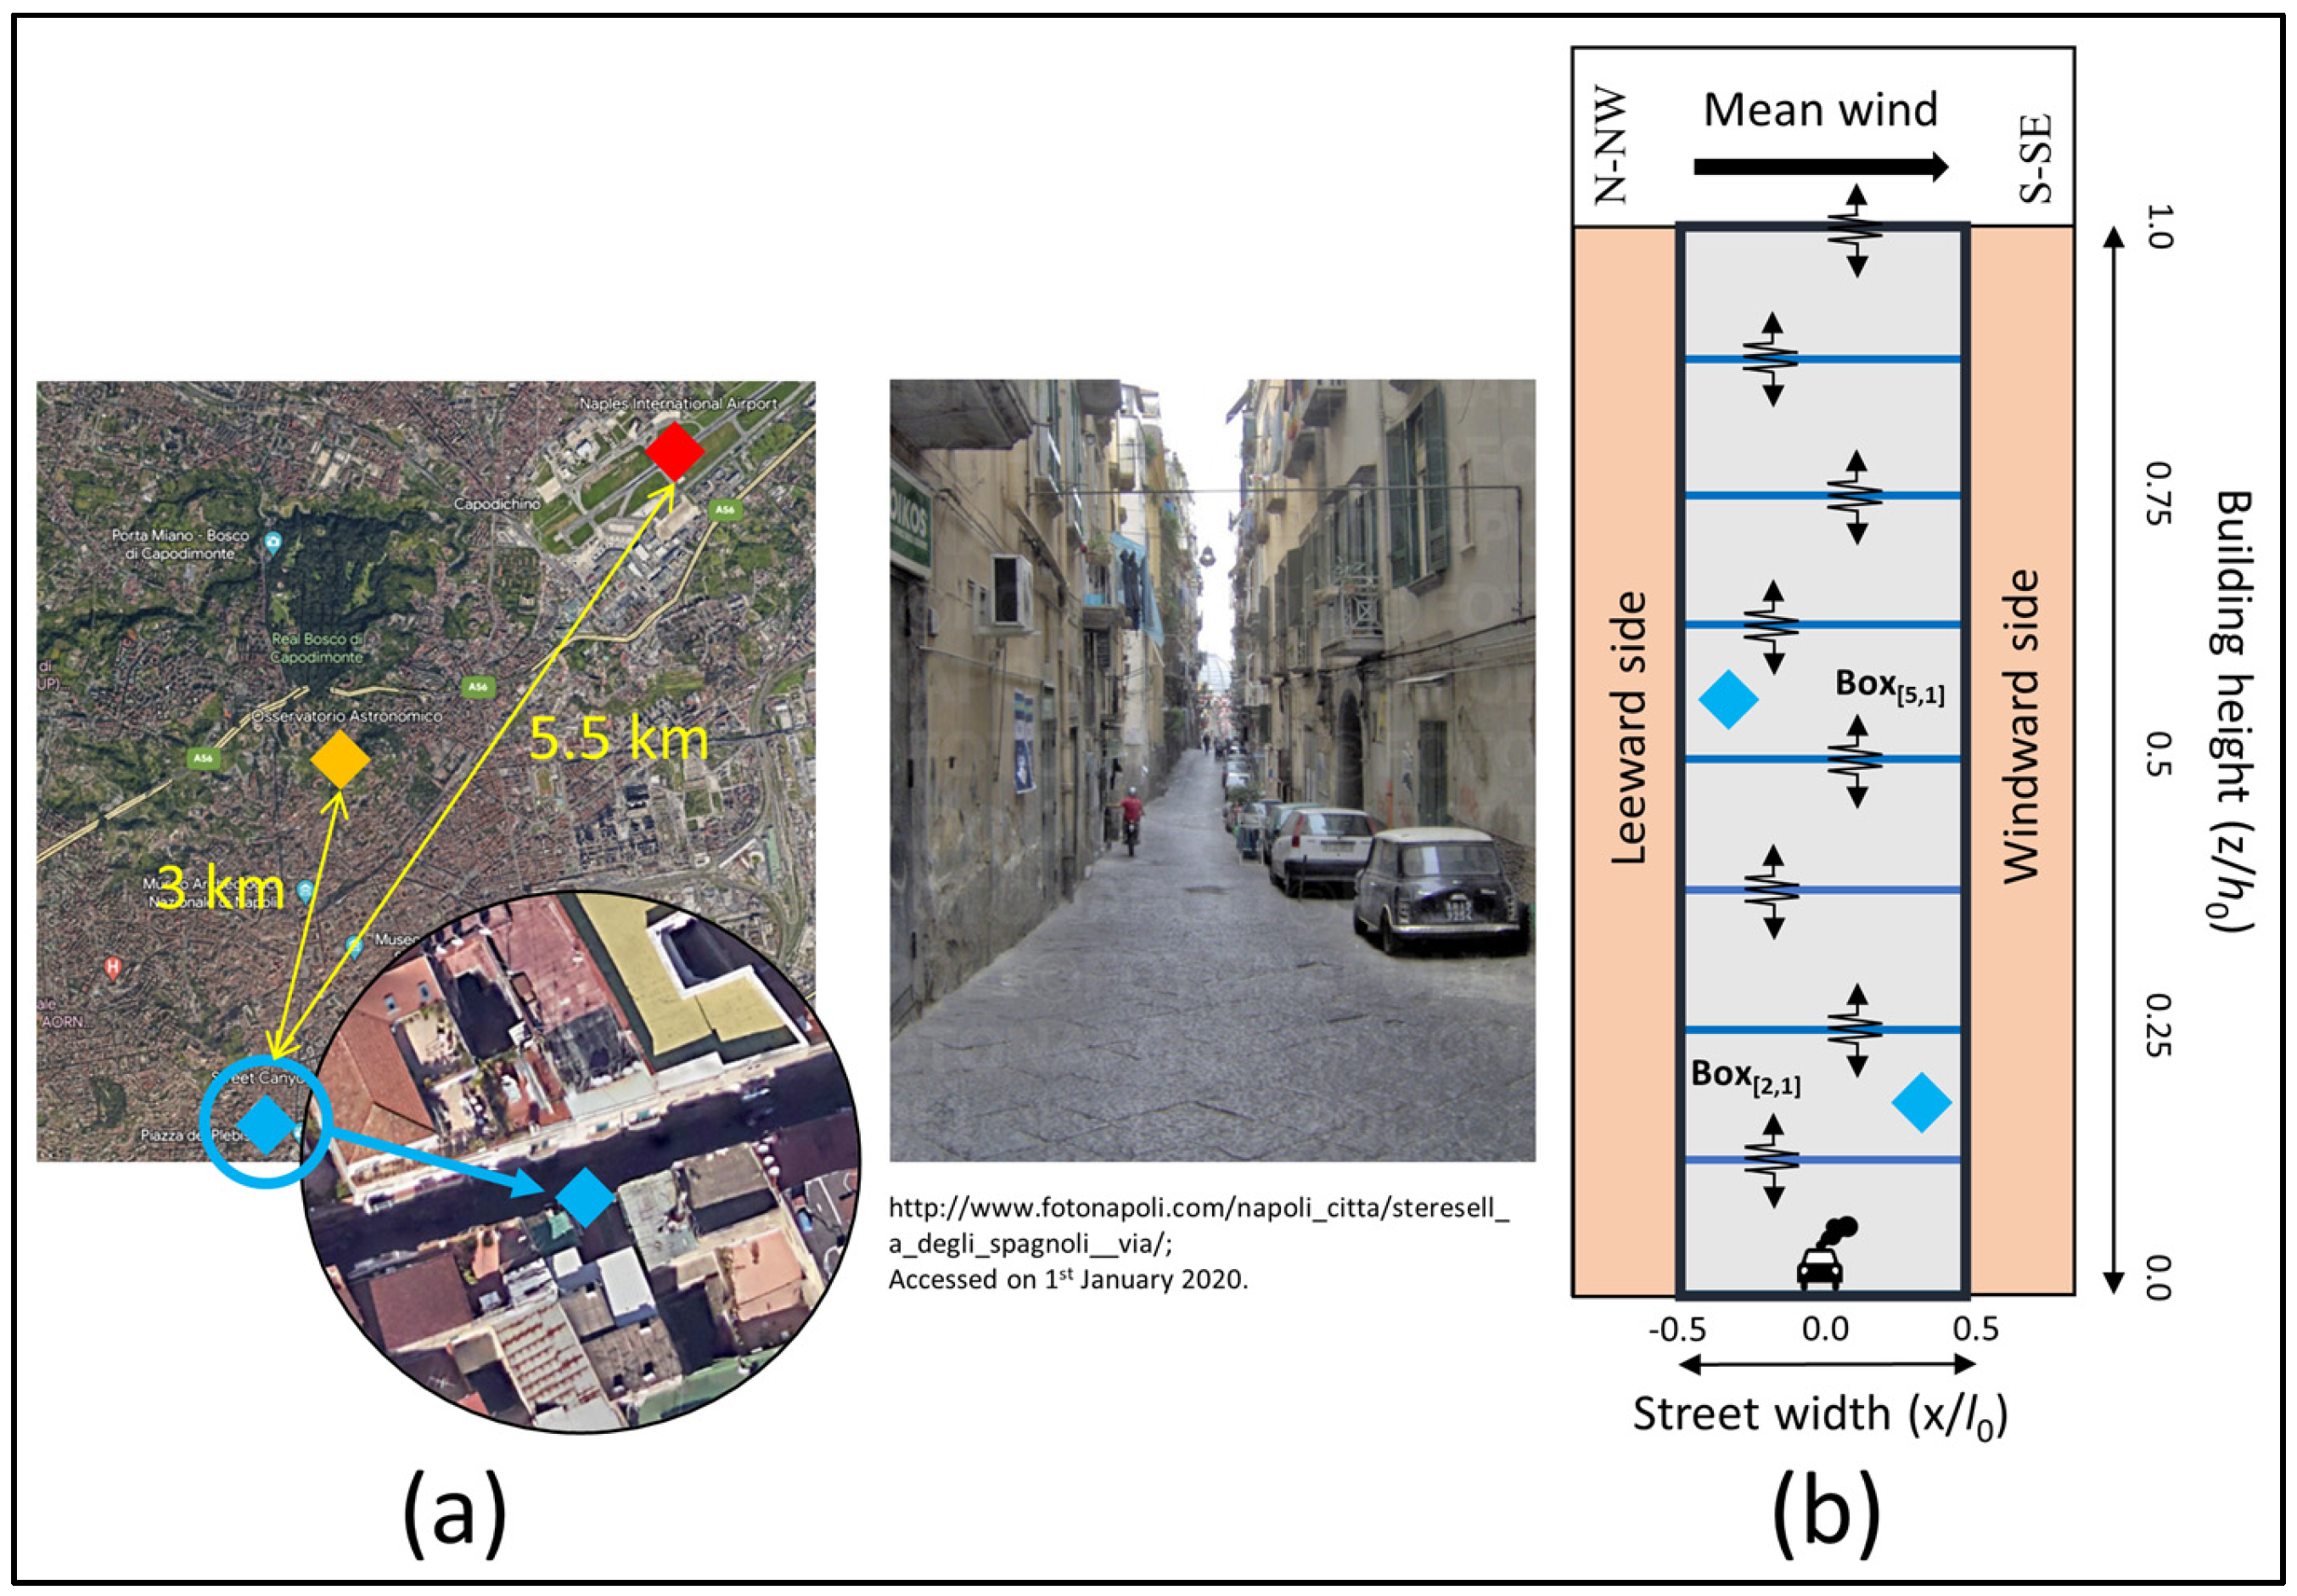
Figure 1. Map view of the monitoring site and locations (blue points), the urban background site (orange point), and the meteorological site (red point) in Via Santa Teresella (a); and a conceptual framework of MBM FleX/MBM-FleX_r for the deep canyon (b). Blue frames represent compartments that resolve a large vortex, and the black frame represents the entire volume of the street canyon. Well-mix assumption has been made and pollutants are homogeneously distributed in each finer box.
Atmosphere 14 01385 g001
Figure 2. Diurnal variations (8:00–20:00) of ambient wind speed and the wind speed perpendicular to the canyon axis (a) and wind direction (b), and of NO2 (c) and O3 (d) concentrations at various heights within the deep street canyon, Naples. The time period is from the 11 January to the 15 January, with a 15-min interval. Wind directions between the dashed blue lines represent conditions of wind mainly parallel to the street axis (i.e., 50° 90° and 230–270°). Crosses indicate daily concentration averages, and the dashed black line denotes WHO Air Quality Guidelines.
Atmosphere 14 01385 g002
Figure 3. Scatter plot illustrating the correlation between modeled (MBM-FleX) and observed NO2, NOx, and O3 concentrations at various heights within the deep street canyon. The red line delineates the relationship between modeled and observed values at 3 m height, the blue line represents the relationship at 12 m height, and the black line signifies model evaluations using data from all heights.
Atmosphere 14 01385 g003
Figure 4. The time-averaged concentrations of pollutants (represented by bar plots) at various heights under different modeling scenarios within the deep canyon throughout the entire simulation period. The red line shows the percentage differences in air pollutant mixing ratios between the various modeling cases and their corresponding baseline condition (Case A3), attributable to changes in NOx emissions, VOC emissions, and background conditions.
Atmosphere 14 01385 g004
Table 1. Overview of the model scenarios.
CaseModelChemical SchemePhotolysis RatesScaling Factor for Background NO2 *Emissions
Case A1MBM-FleXRCSConstant rates1.5On-road emissions
Case A2MBM-FleXSimple chemistryConstant rates1.5On-road emissions
Case A3MBM-FleXRCSDiurnal profile1.5On-road emissions
Case A4MBM-FleXSimple chemistryDiurnal profile1.5On-road emissions
Case B1MBM-FleXRCSDiurnal profile1.5Reduced NOx emissions
Case B2MBM-FleXRCSDiurnal profile1.5Reduced VOC emissions
Case B3MBM-FleXRCSDiurnal profile0.5On-road emissions
Case B4MBM-FleXRCSDiurnal profile1.0On-road emissions
Case B5MBM-FleXRCSDiurnal profile3.0 On-road emissions
Case C1MBM-FleX_rRCSConstant rates1.5On-road emissions
Case C2MBM-FleX_rSimple chemistryConstant rates1.5On-road emissions
Case C3MBM-FleX_rRCSDiurnal profile1.5On-road emissions
Case C4MBM-FleX_rSimple chemistryDiurnal profile1.5On-road emissions
* Here, a scaling factor refers to a value by which the background NO2 was multiplied.
Table 2. Statistical evaluation of the MBM-FleX for NO2, NOx, and O3 within the deep canyon (AR = 3.7) in Naples, Italy.
CaseSpeciesnFAC2rRMSEs (ppb)RMSEu (ppb)RMSE (ppb)IOA
Case A1NO2480.920.621.38.68.70.18
NOx0.730.4818.7315.4824.30.45
O300.2655.3938.3867.39−0.95
Case A2NO2480.50.6211.063.9811.76−0.18
NOx0.920.5913.1913.68190.59
O30.420.565.480.935.56−0.53
Case A3NO2480.990.652.126.036.390.42
NOx0.920.5412.7915.4320.040.55
O30.750.670.572.342.410.28
Case A4NO24810.612.754.345.140.51
NOx0.920.5913.1913.68190.59
O30.020.674.330.684.38−0.4
Disclaimer/Publisher’s Note: The statements, opinions and data contained in all publications are solely those of the individual author(s) and contributor(s) and not of MDPI and/or the editor(s). MDPI and/or the editor(s) disclaim responsibility for any injury to people or property resulting from any ideas, methods, instructions or products referred to in the content.