

Causes Investigation of PM2.5 and O3 Complex Pollution in a Typical Coastal City in the Bohai Bay Region of China in Autumn: Based on One-Month Continuous Intensive Observation and Model Simulation
 ,
, 
Abstract
1. Introduction
2. Materials and Methods
2.1. Observation Period and Location
2.2. Observation Items and Quality Control Quality Assurance
2.3. Data Processing
2.3.1. Pollution Processes Classification
2.3.2. Inverse Distance Weighted
2.3.3. Ozone Integrated Source Apportionment Method
2.3.4. Observation-Based Model
2.3.5. Transformation Rate of Sulfates and Nitrates
2.3.6. Calculation of Secondary Organic Carbon
2.3.7. Backward Trajectory
3. Results and Discussion
3.1. Air Quality and Meteorological Conditions
3.2. Characteristics of Complex Air Pollution
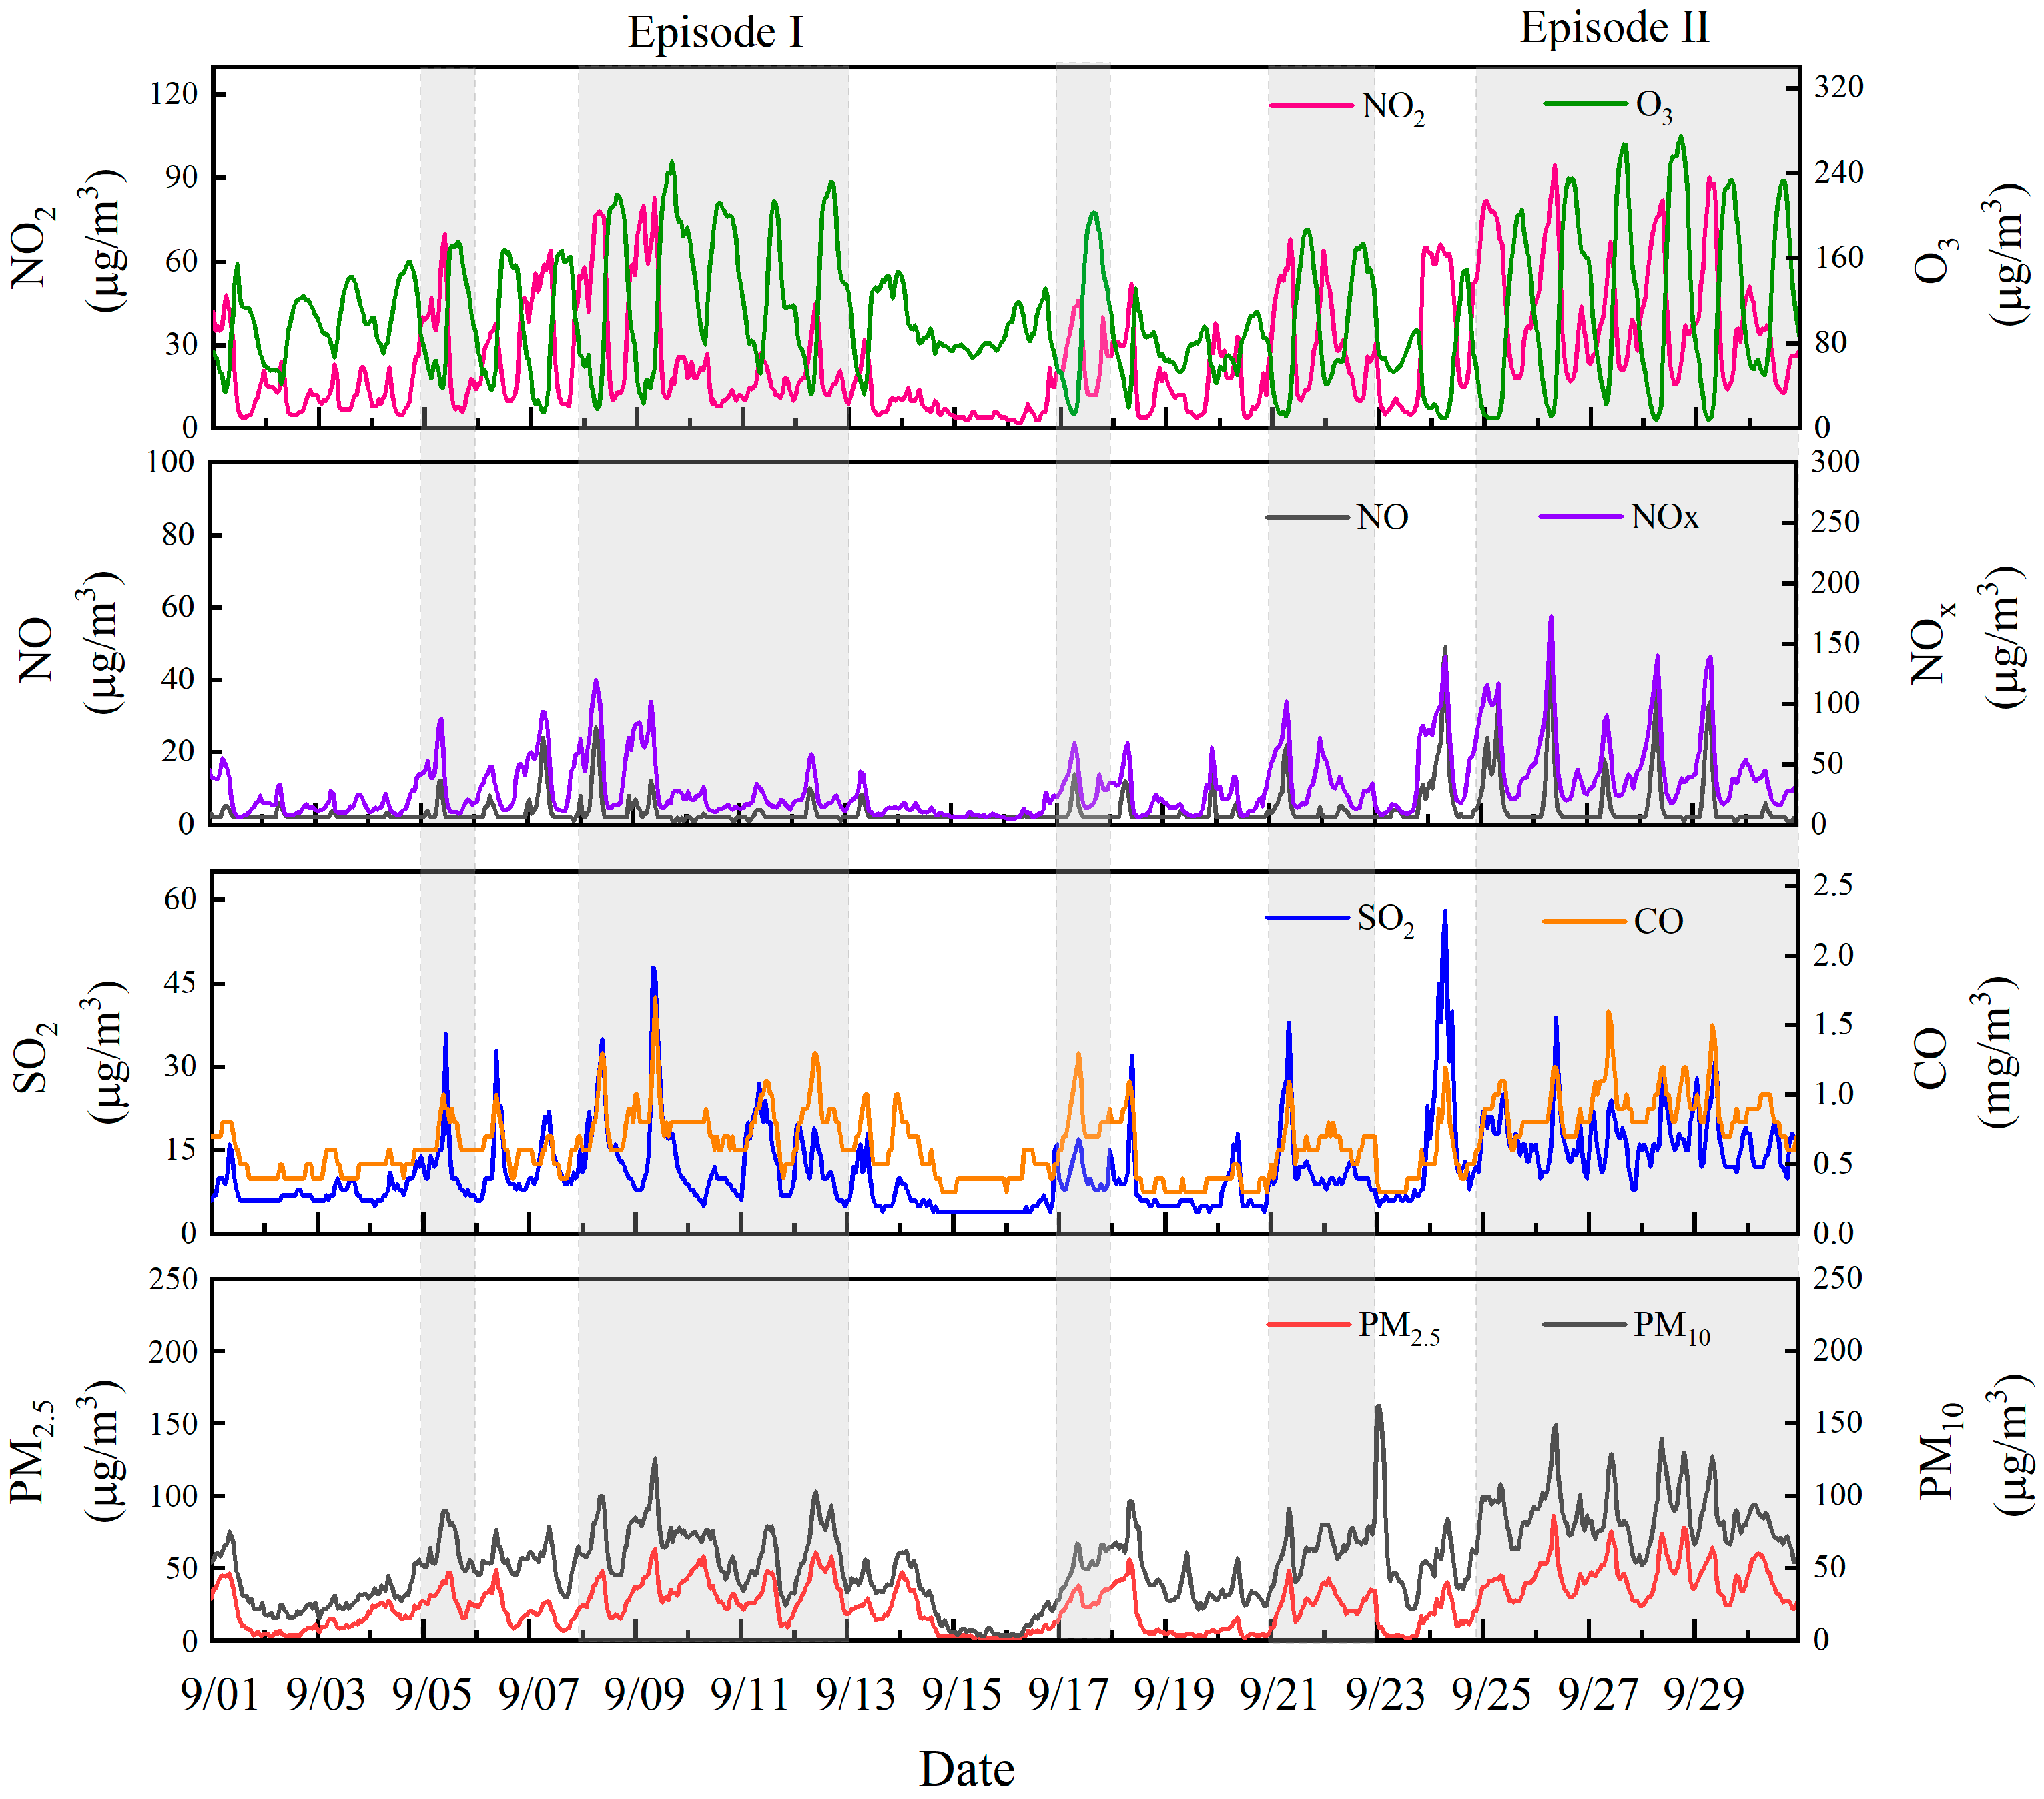
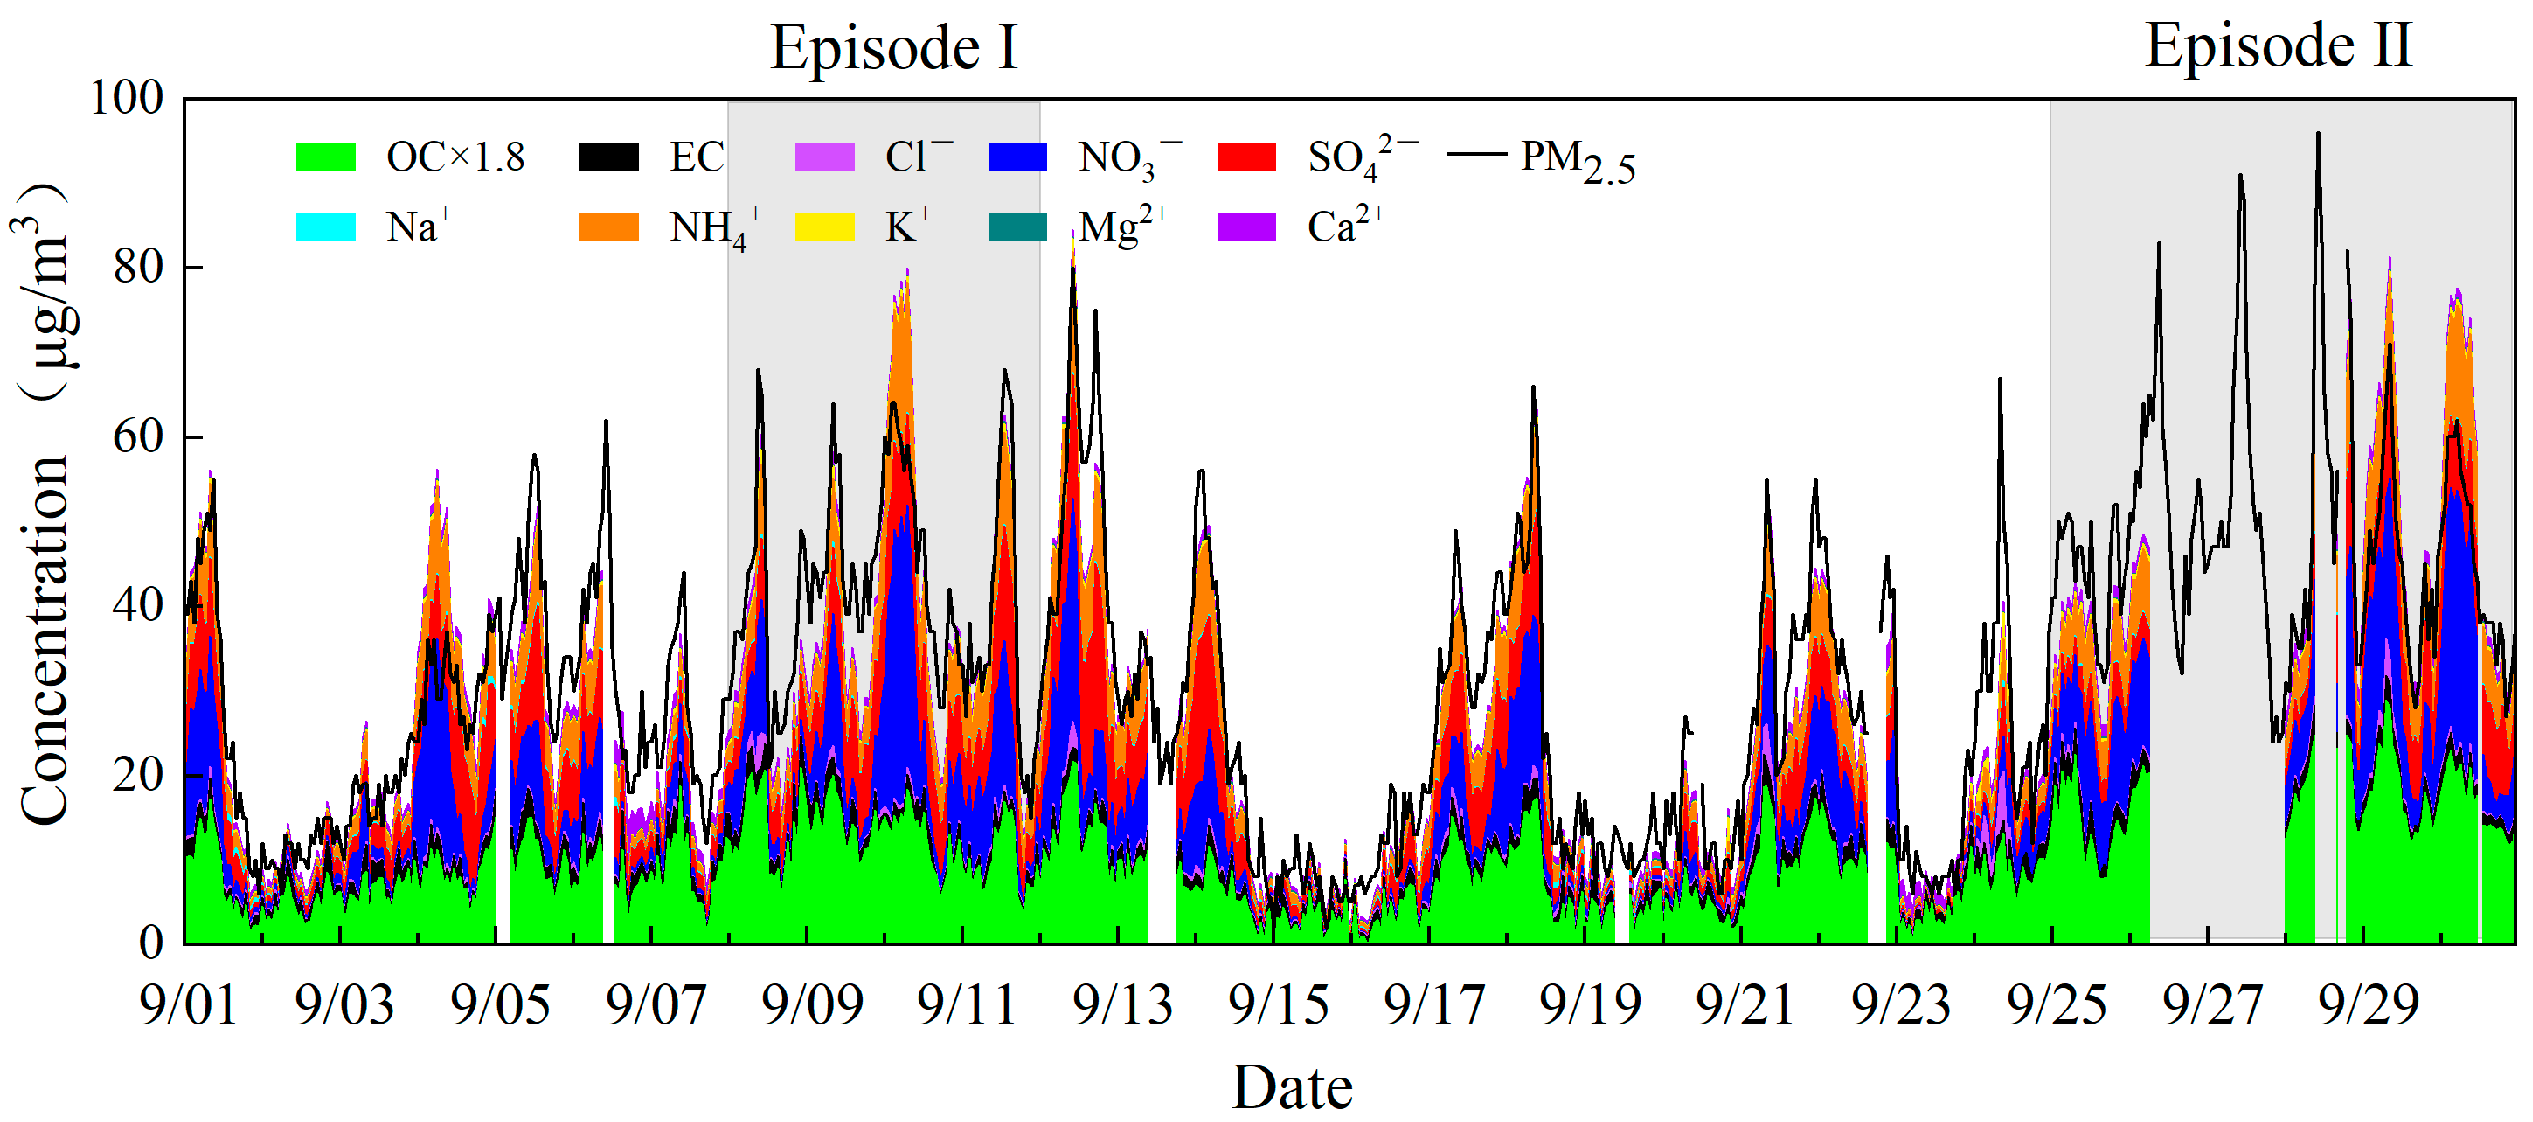
3.2.1. Temporal Variation
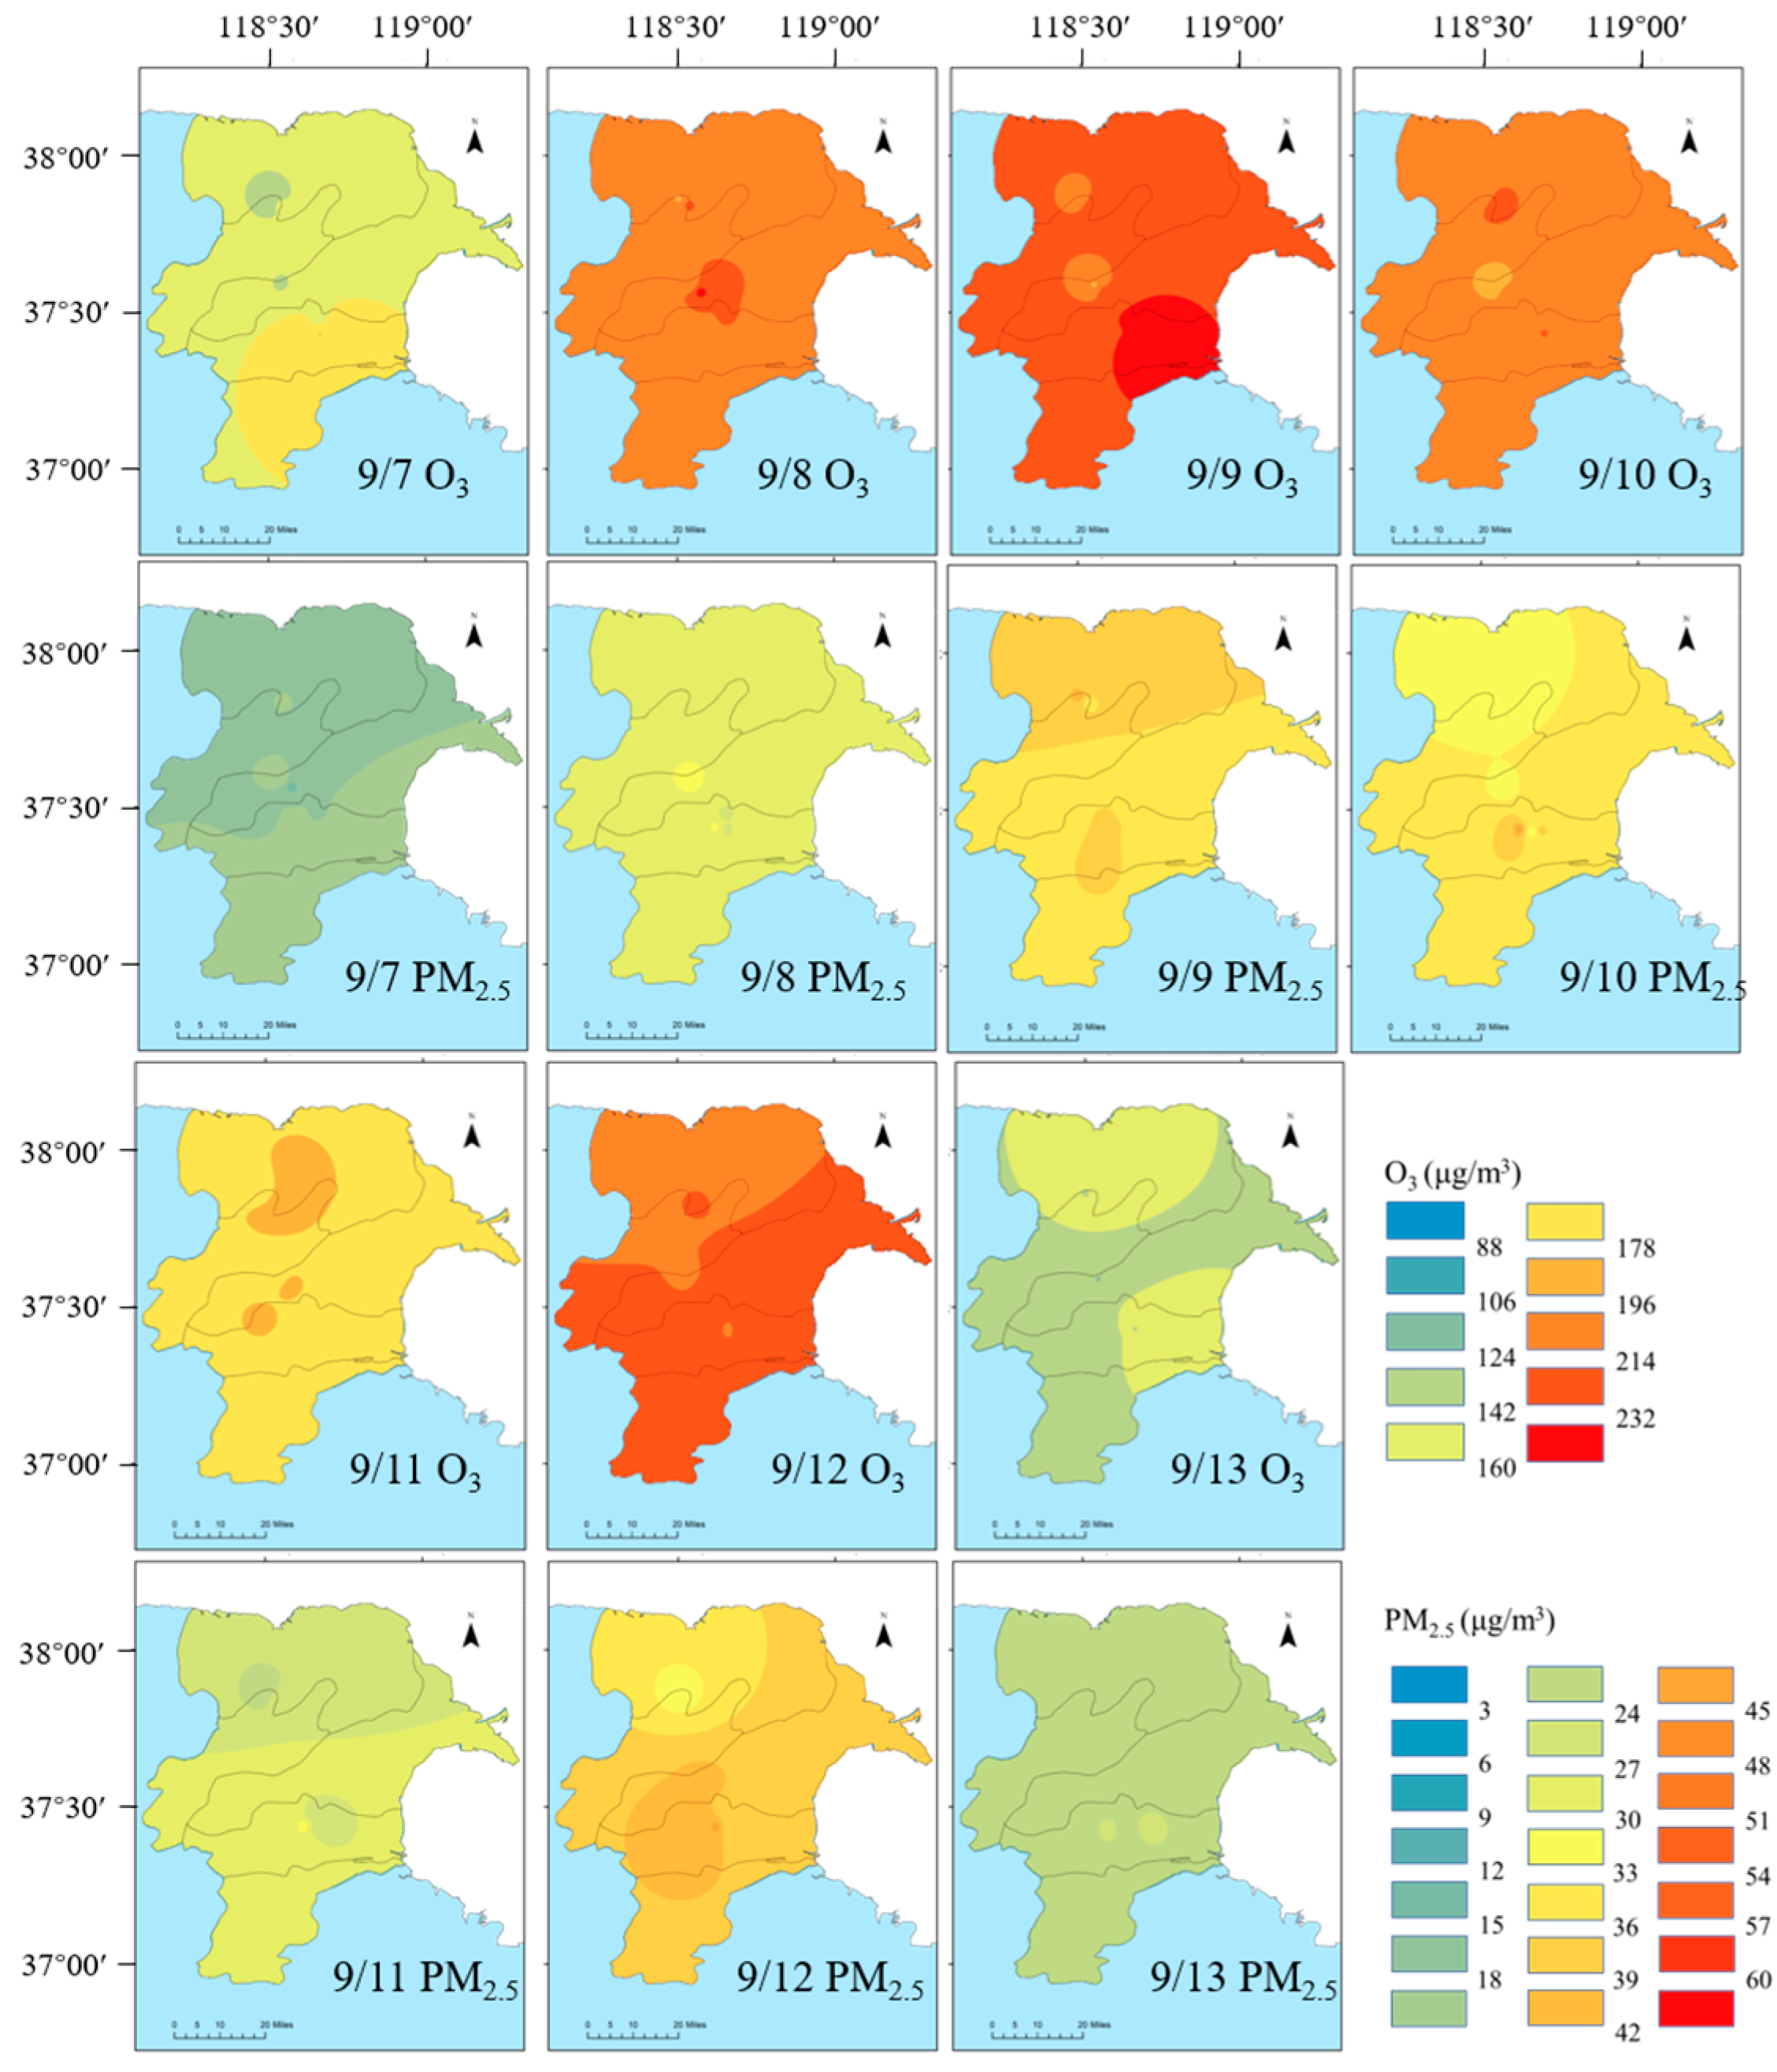
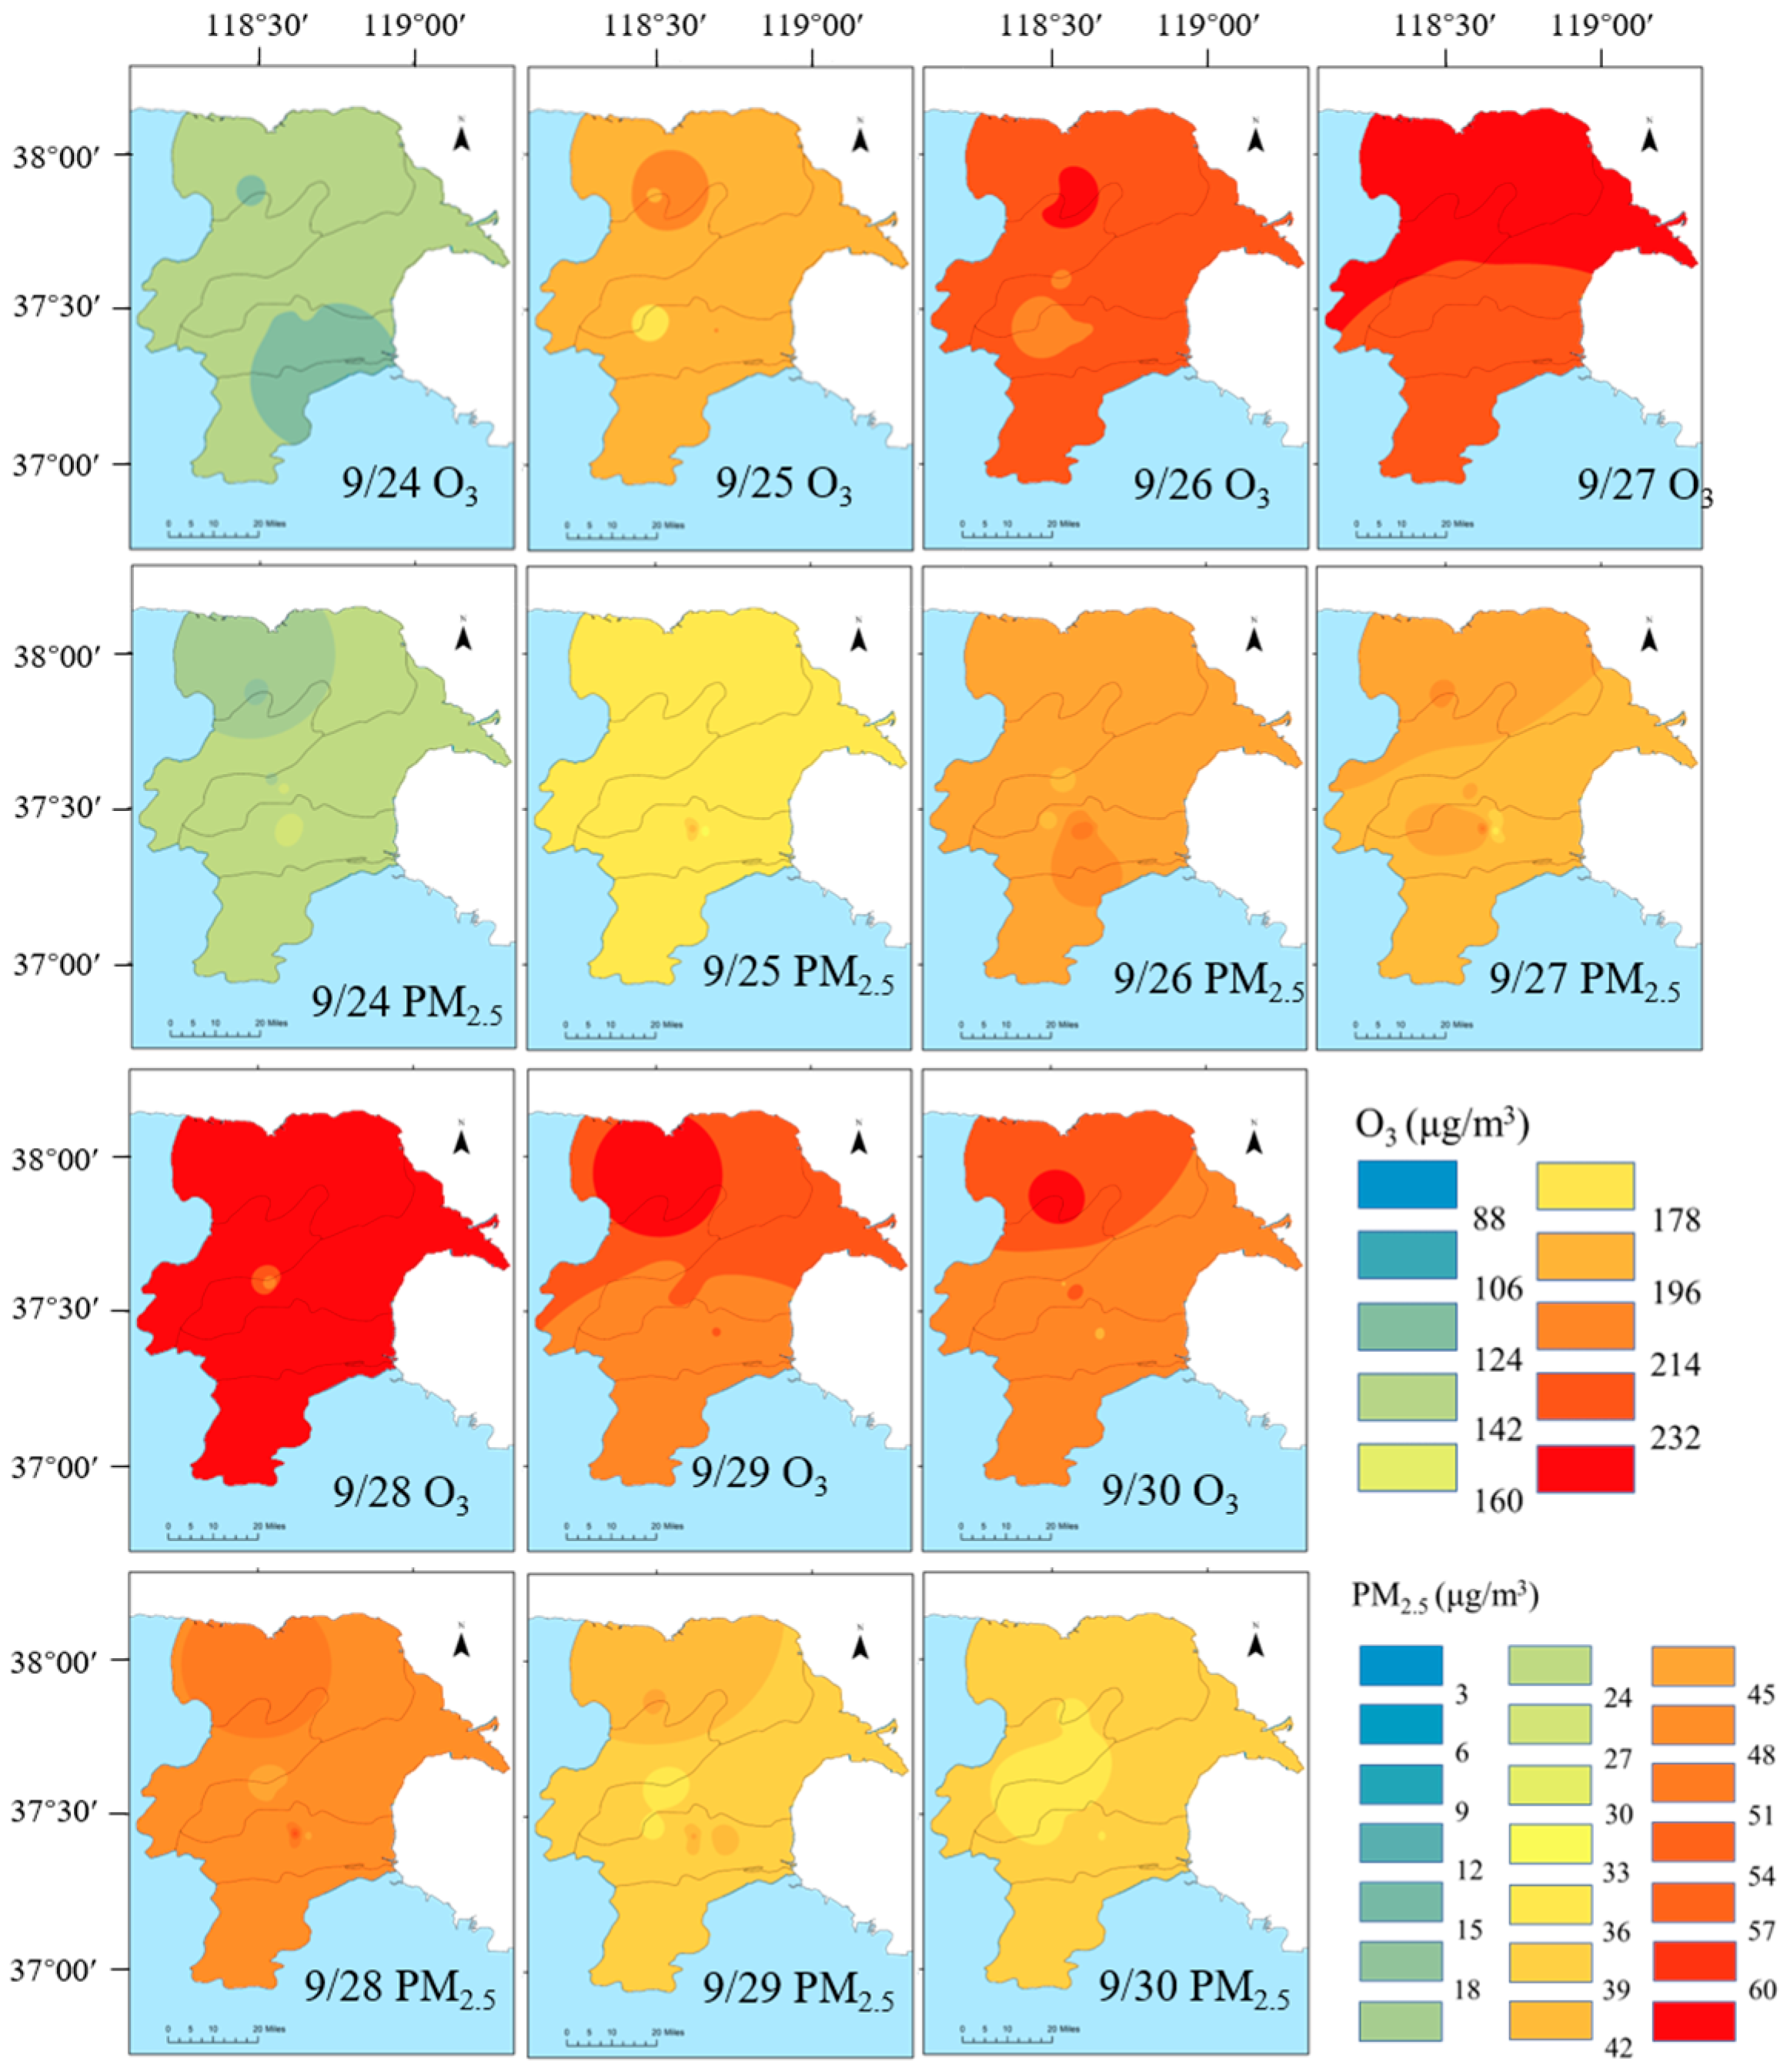
3.2.2. Spatial Variation
3.2.3. Correlation Analysis of PM2.5 and O3
3.3. Cause Analysis of Complex Pollutions
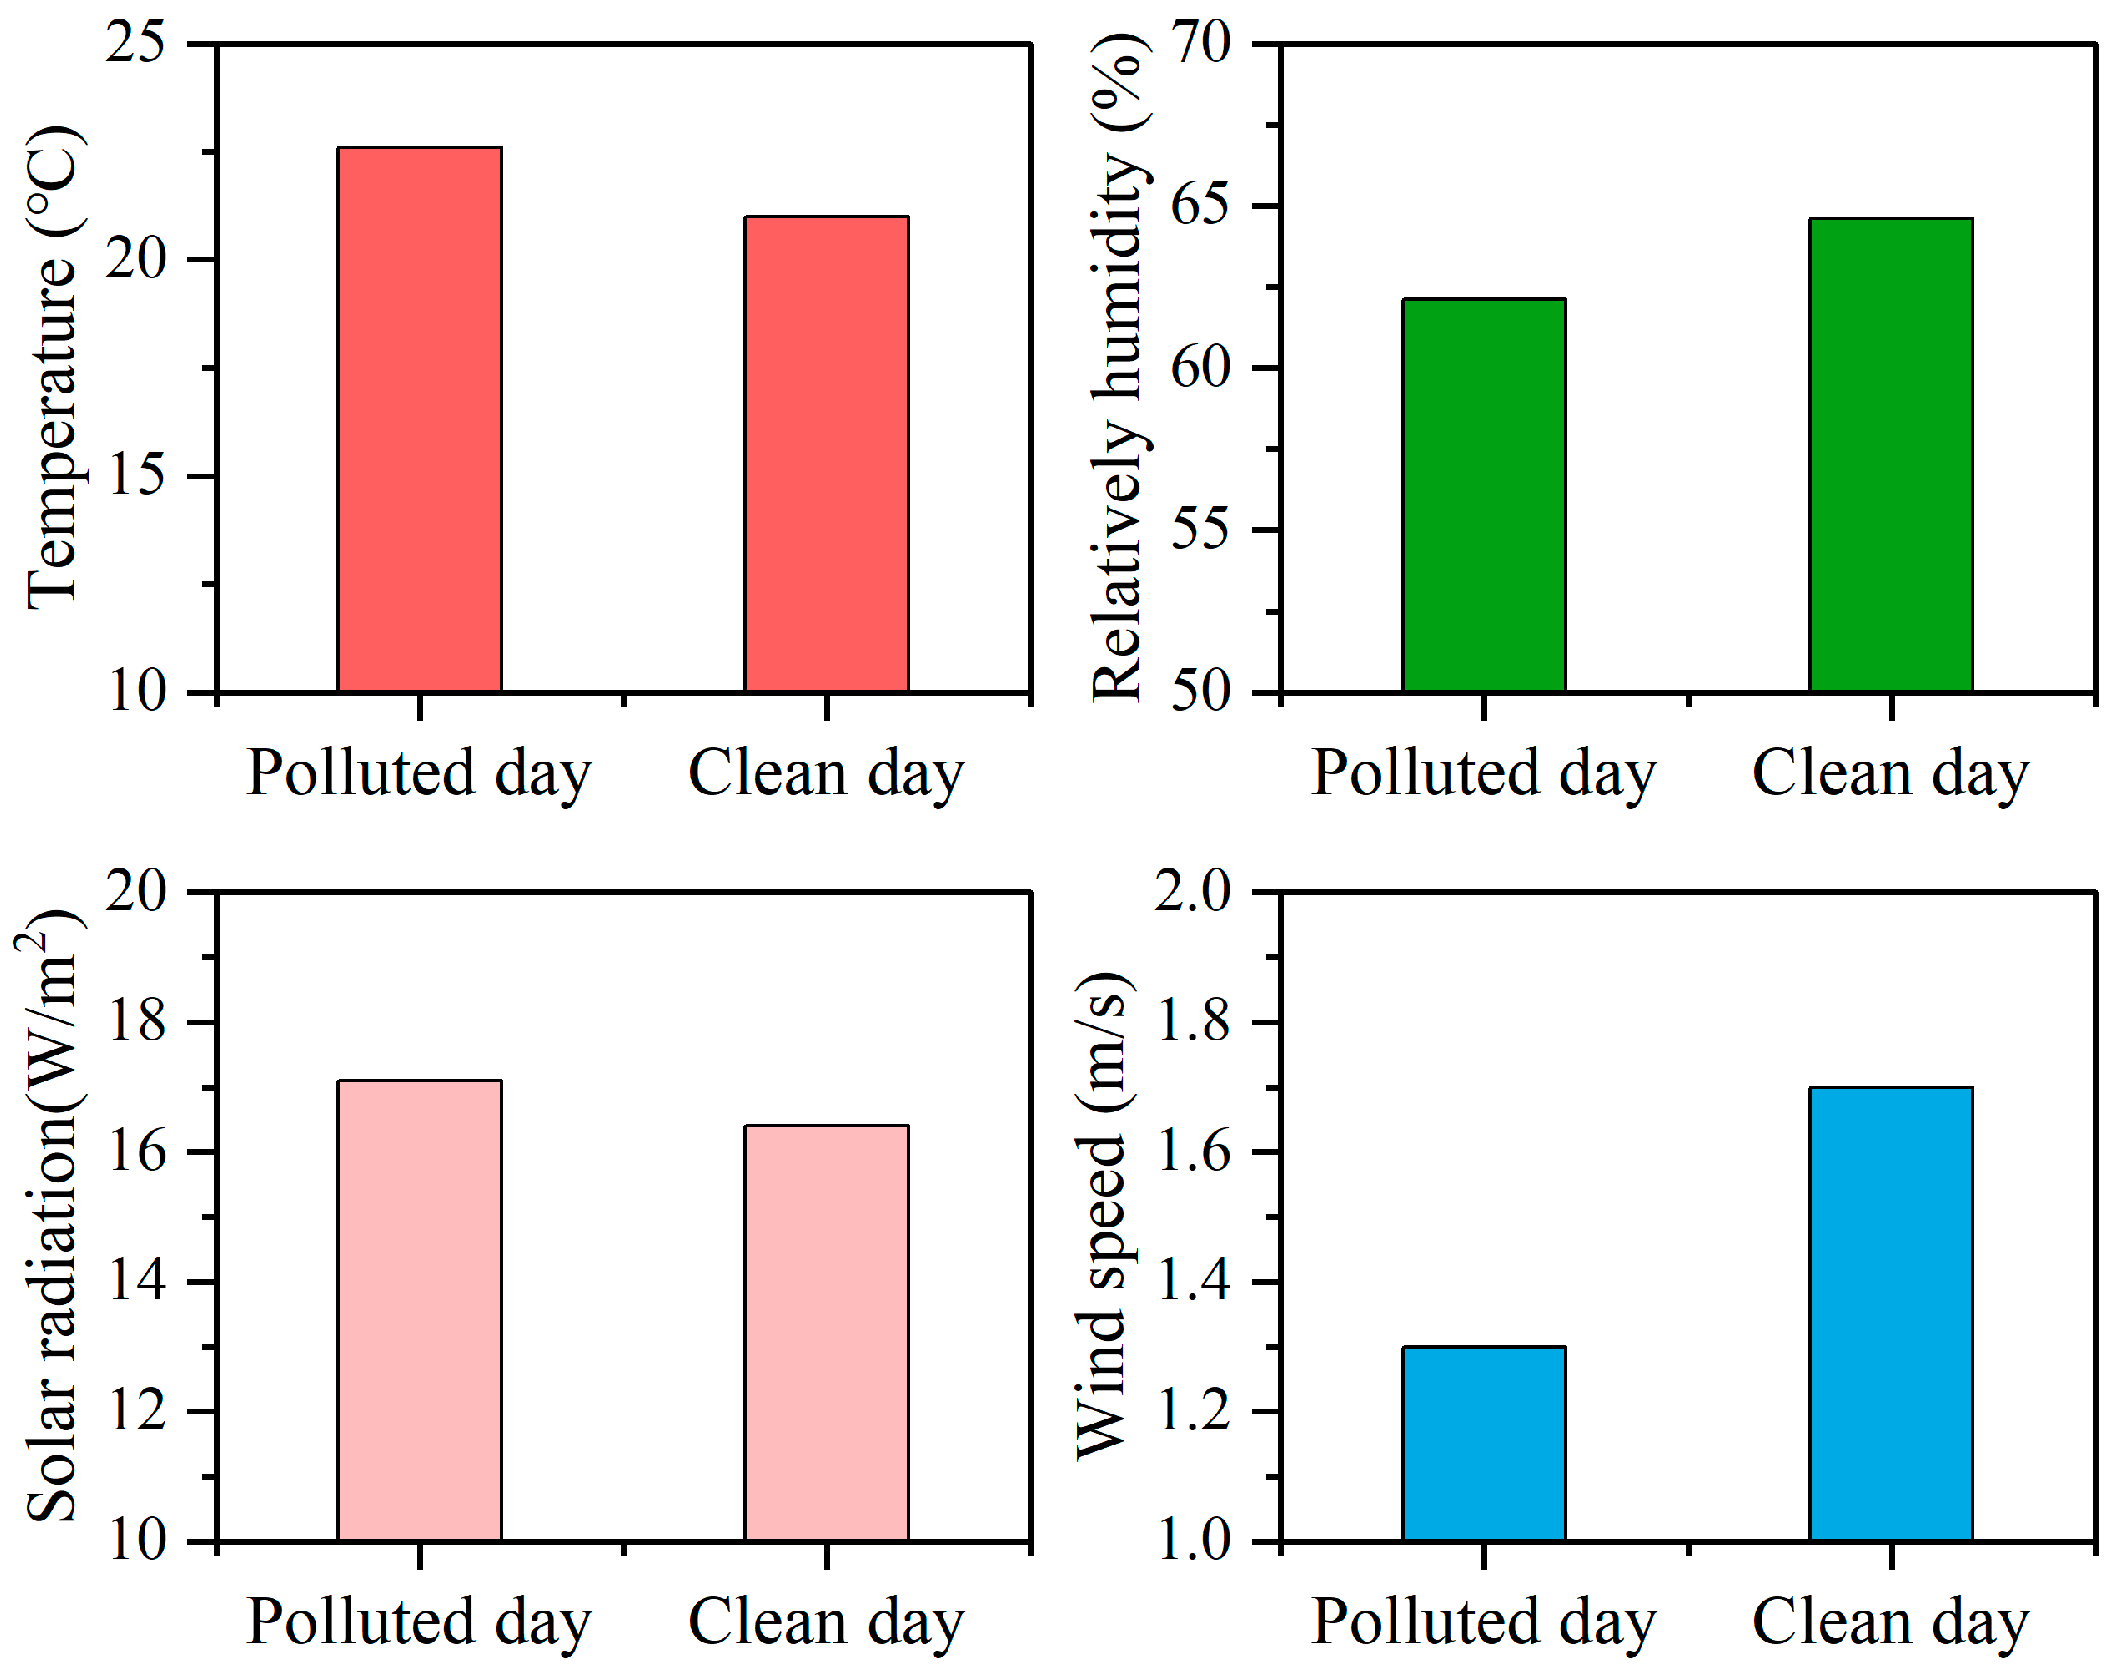
3.3.1. Meteorological Conditions of Pollutions
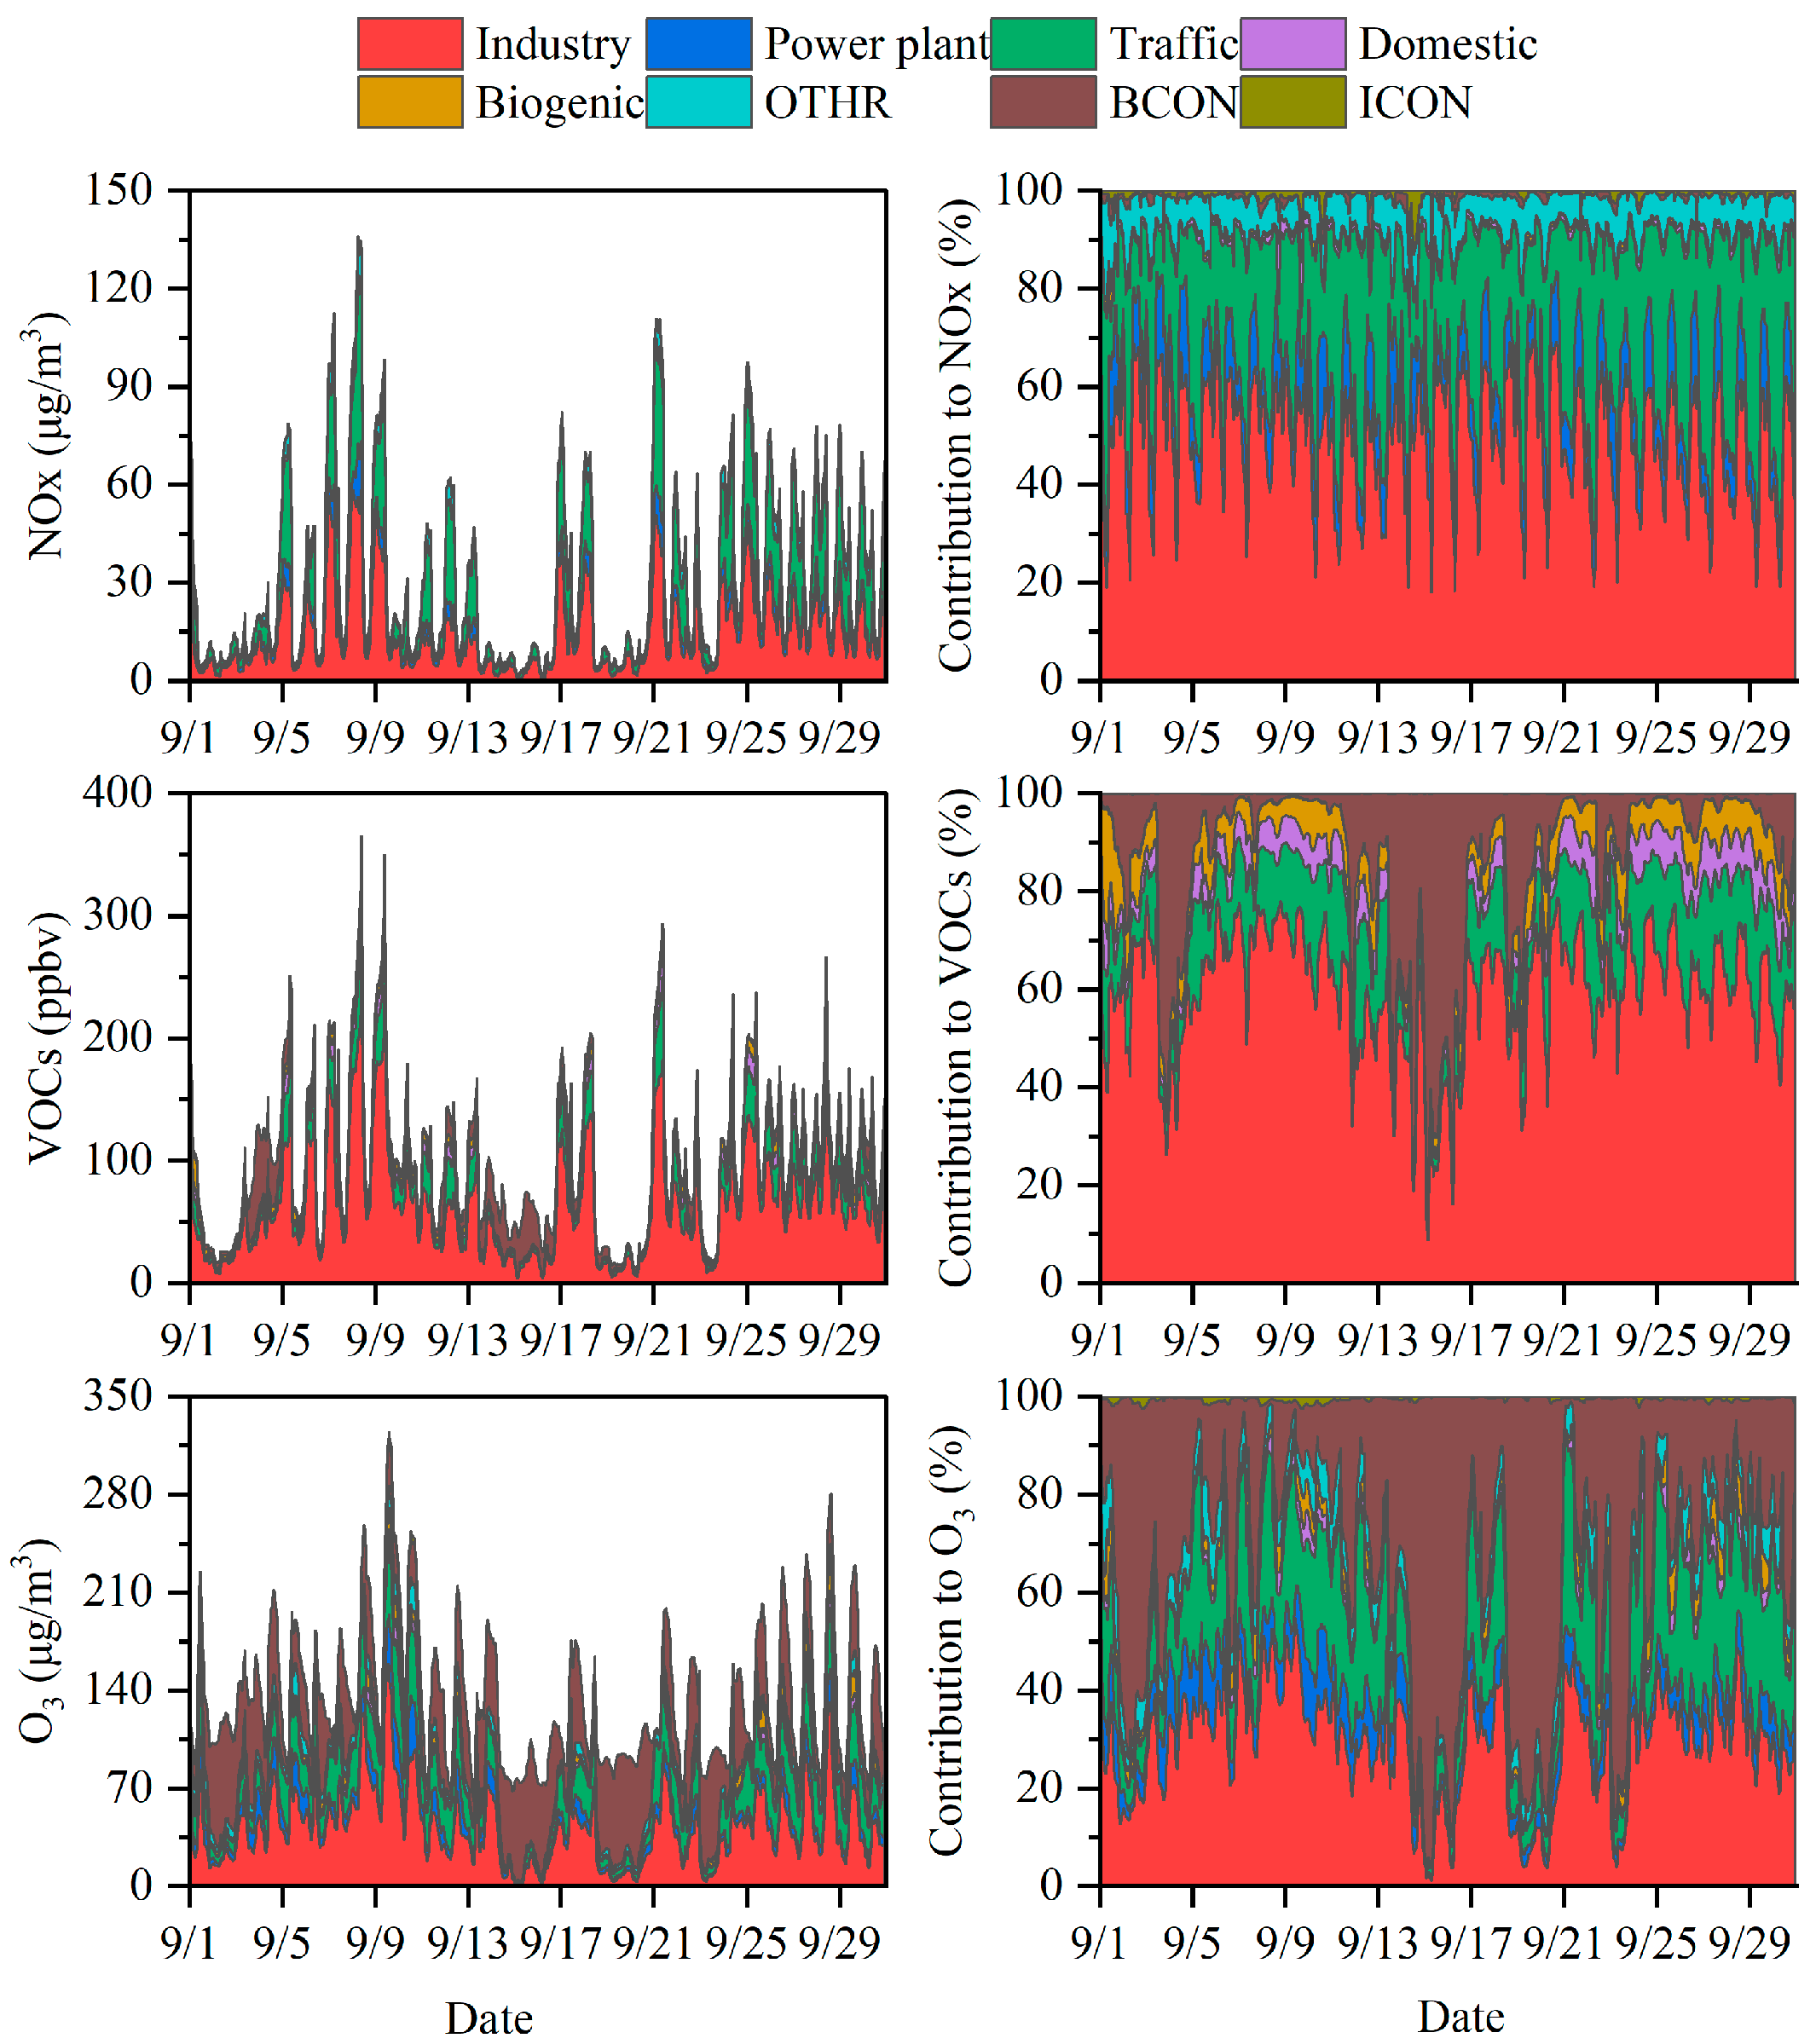
3.3.2. Local Emissions
3.3.3. Chemical Transformation
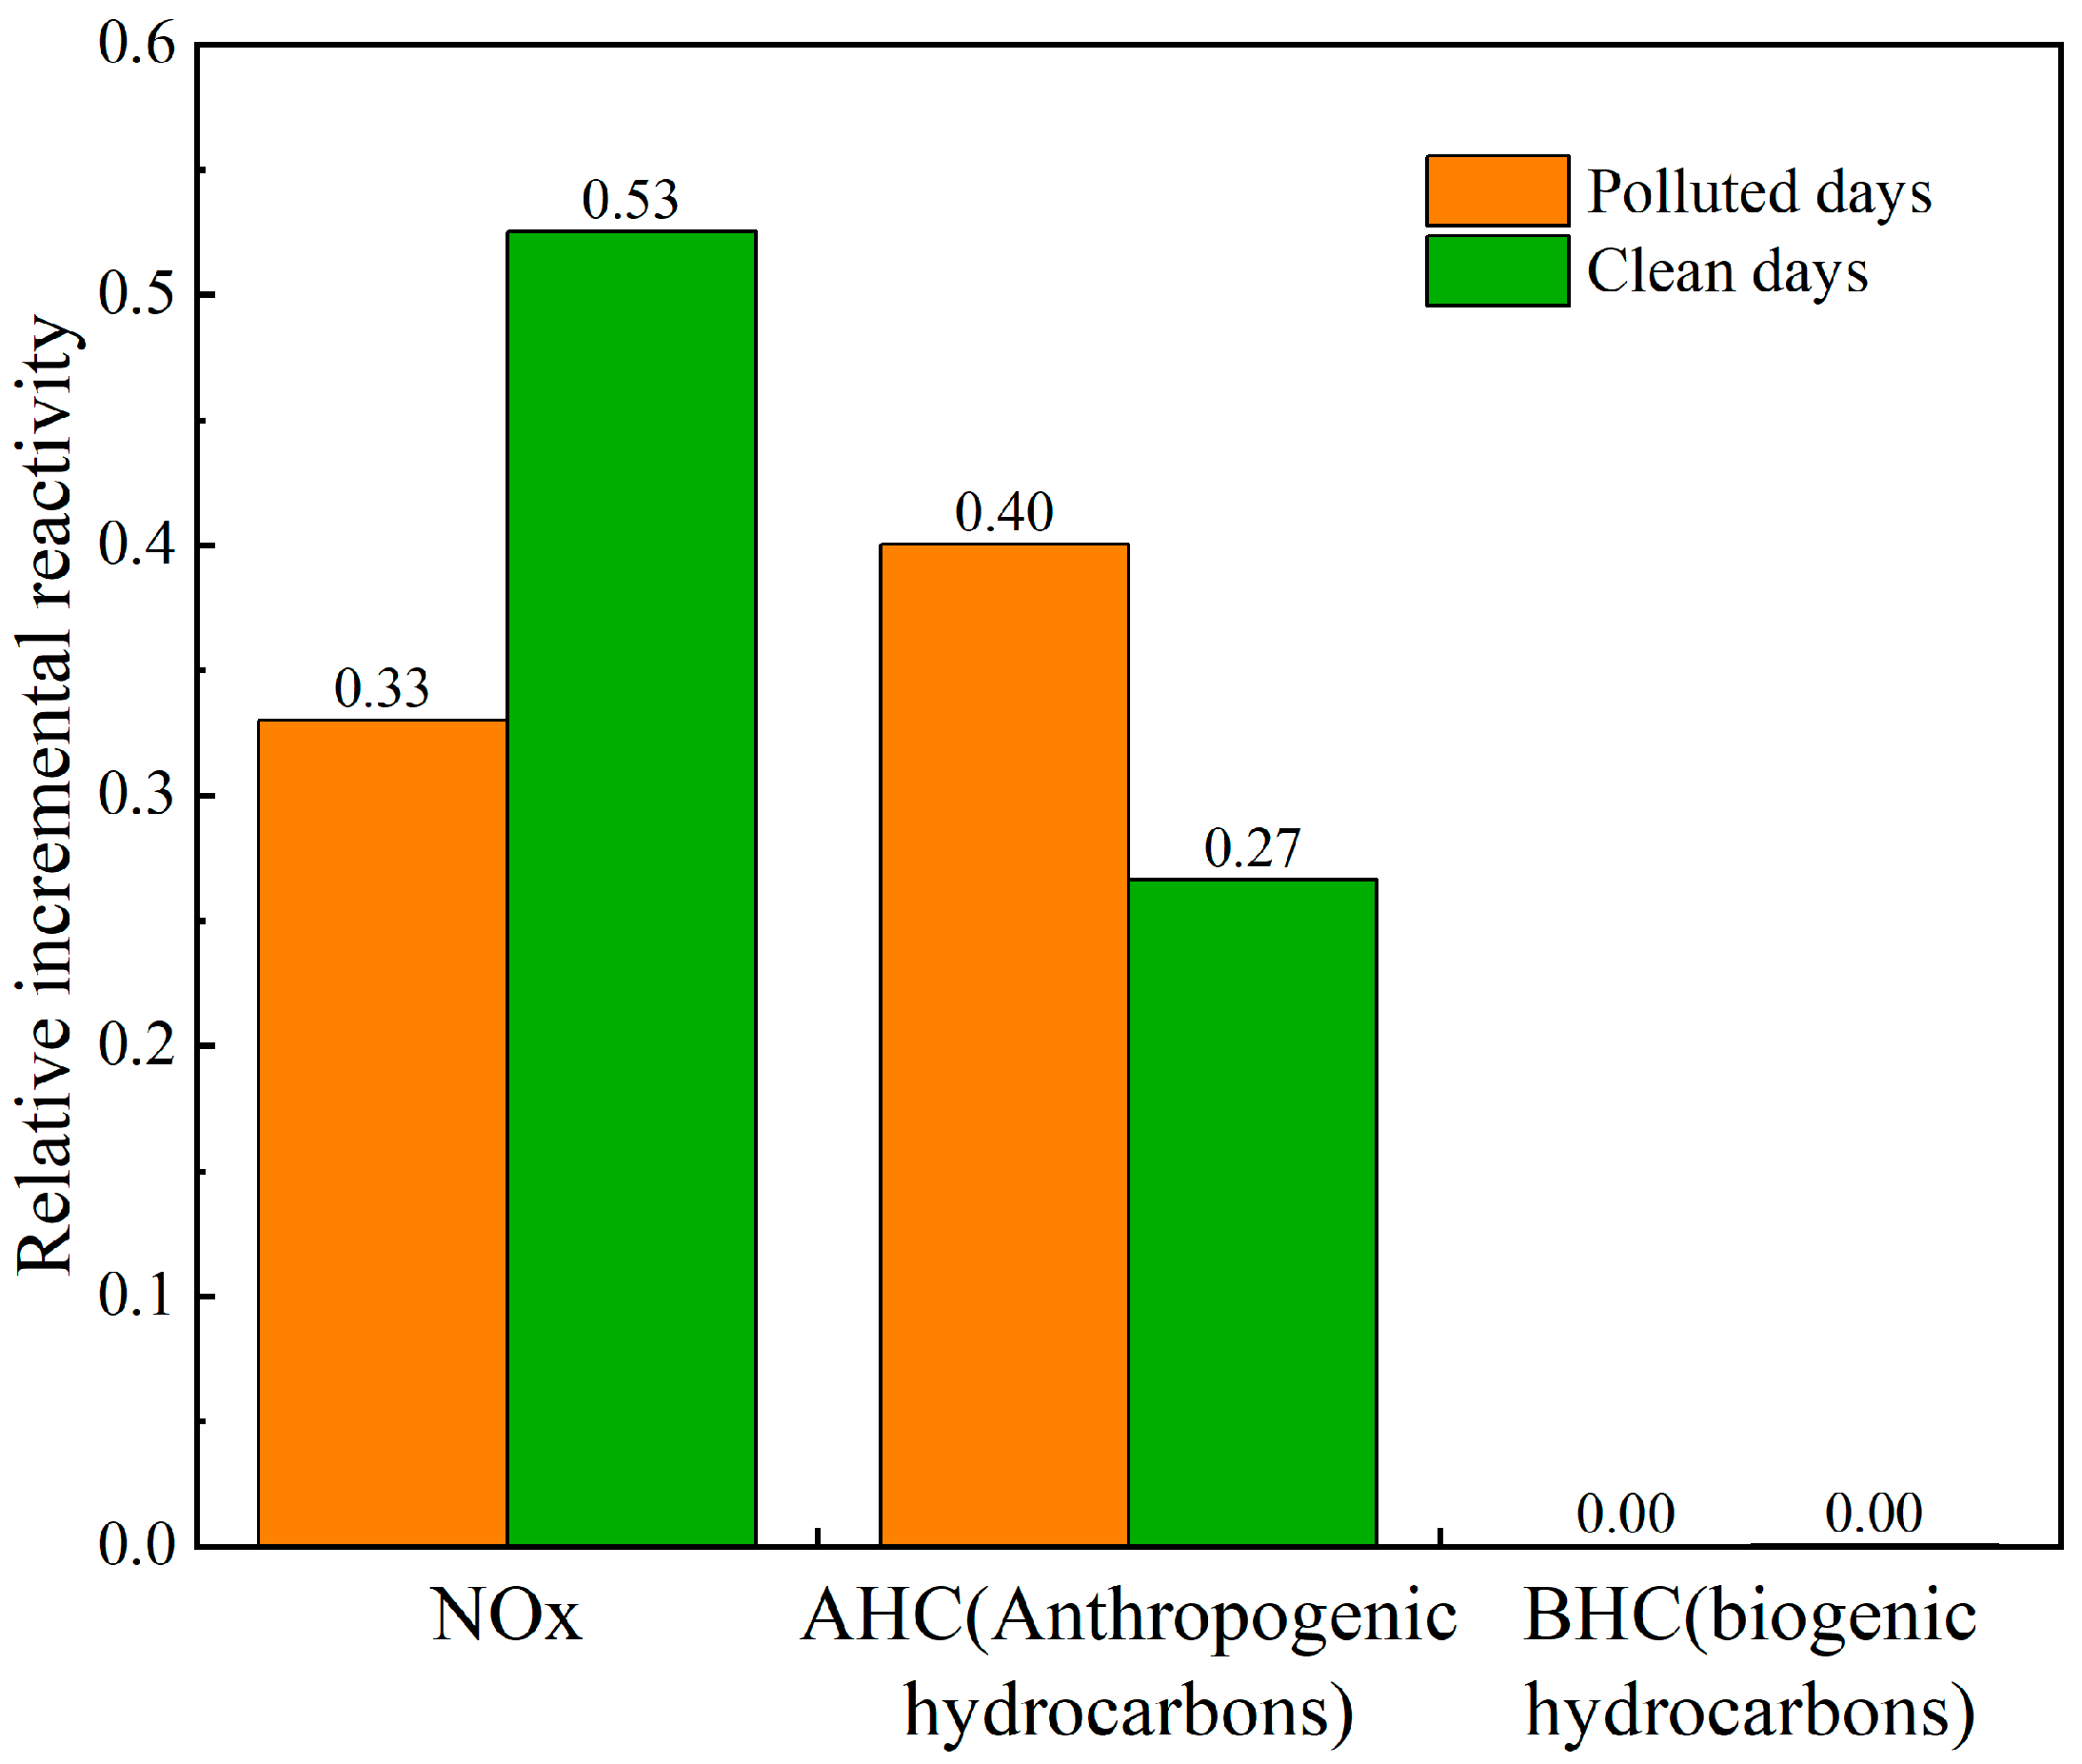
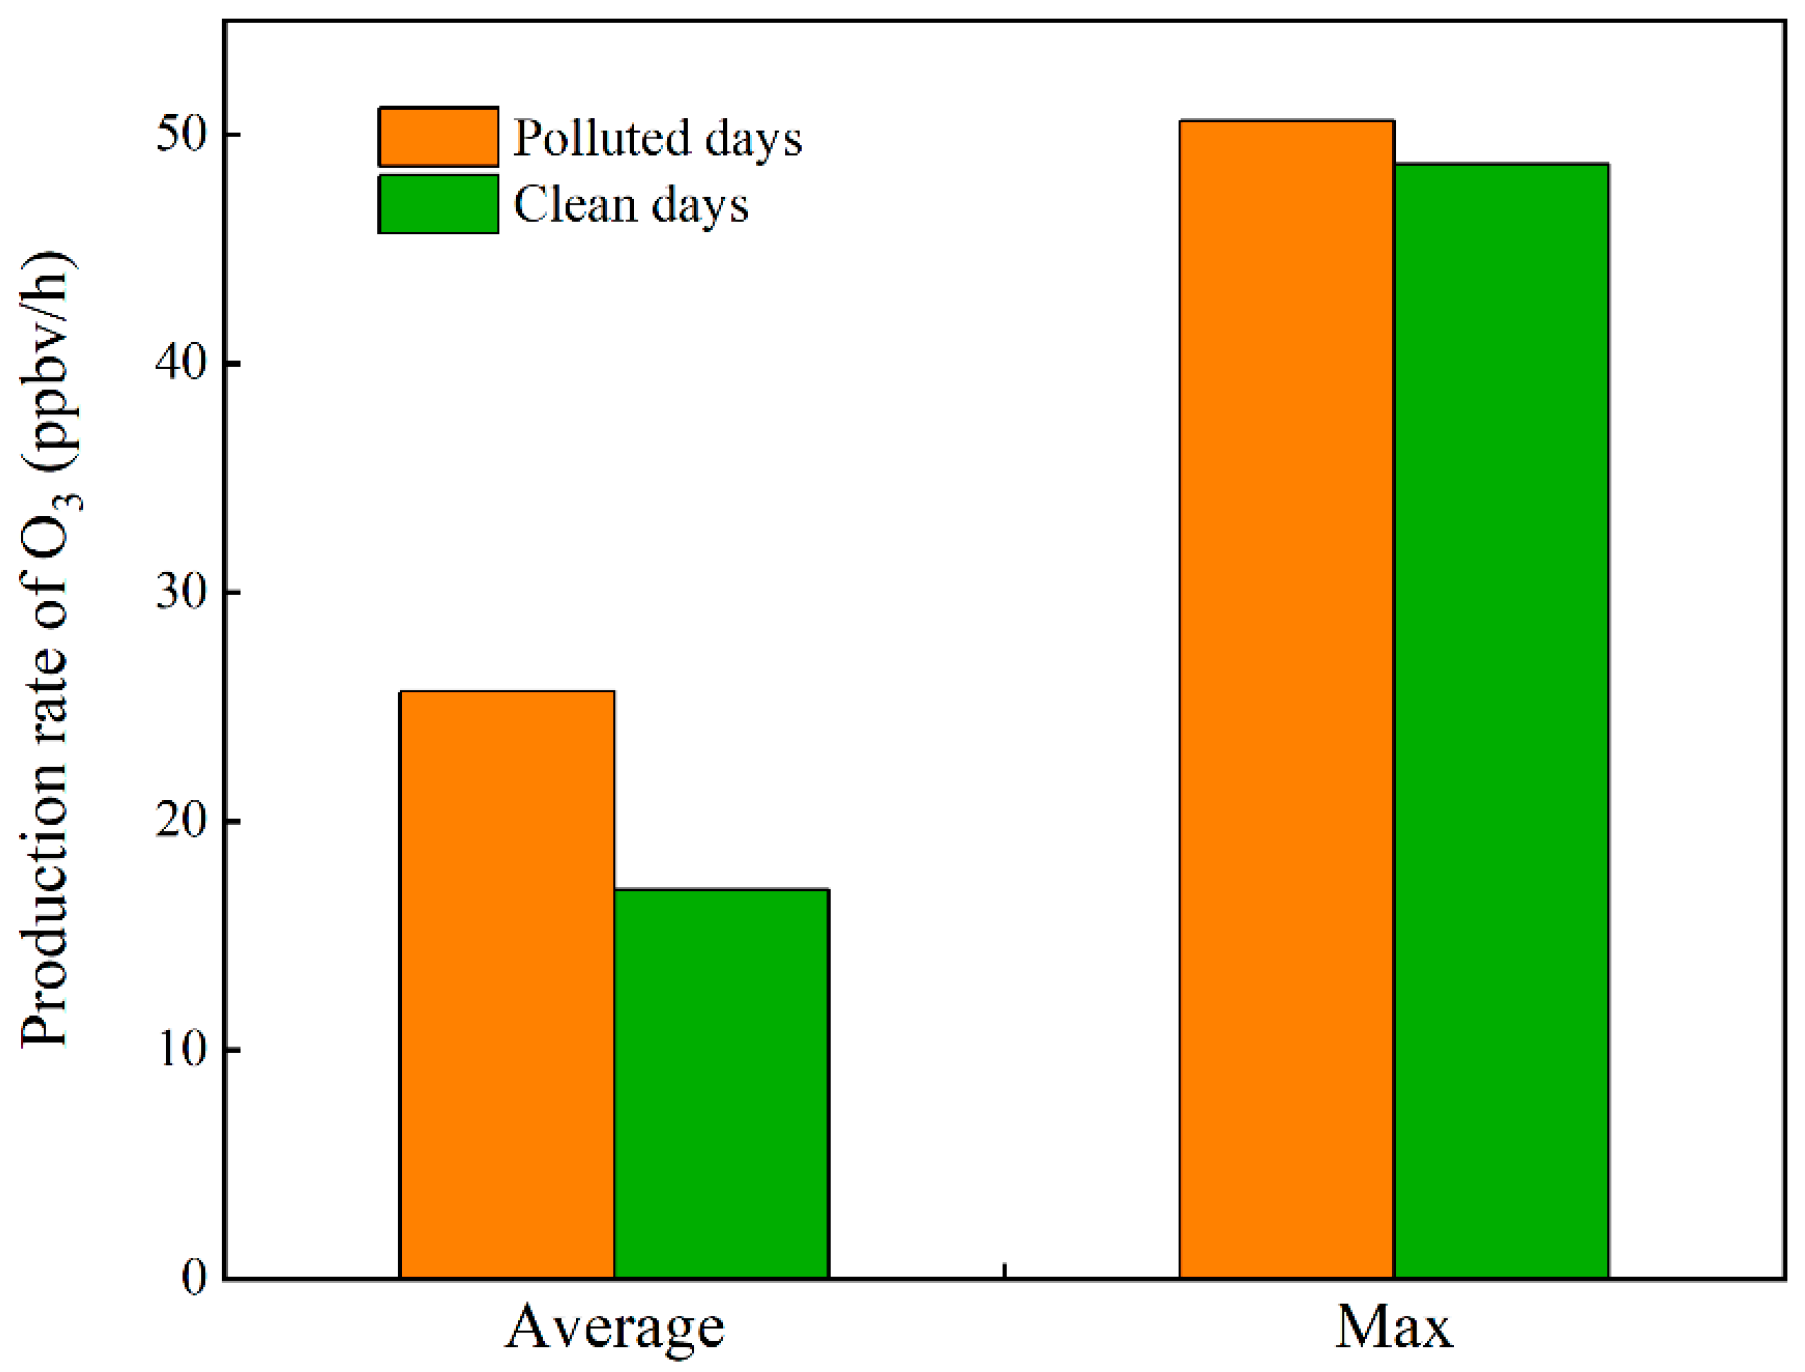
O3
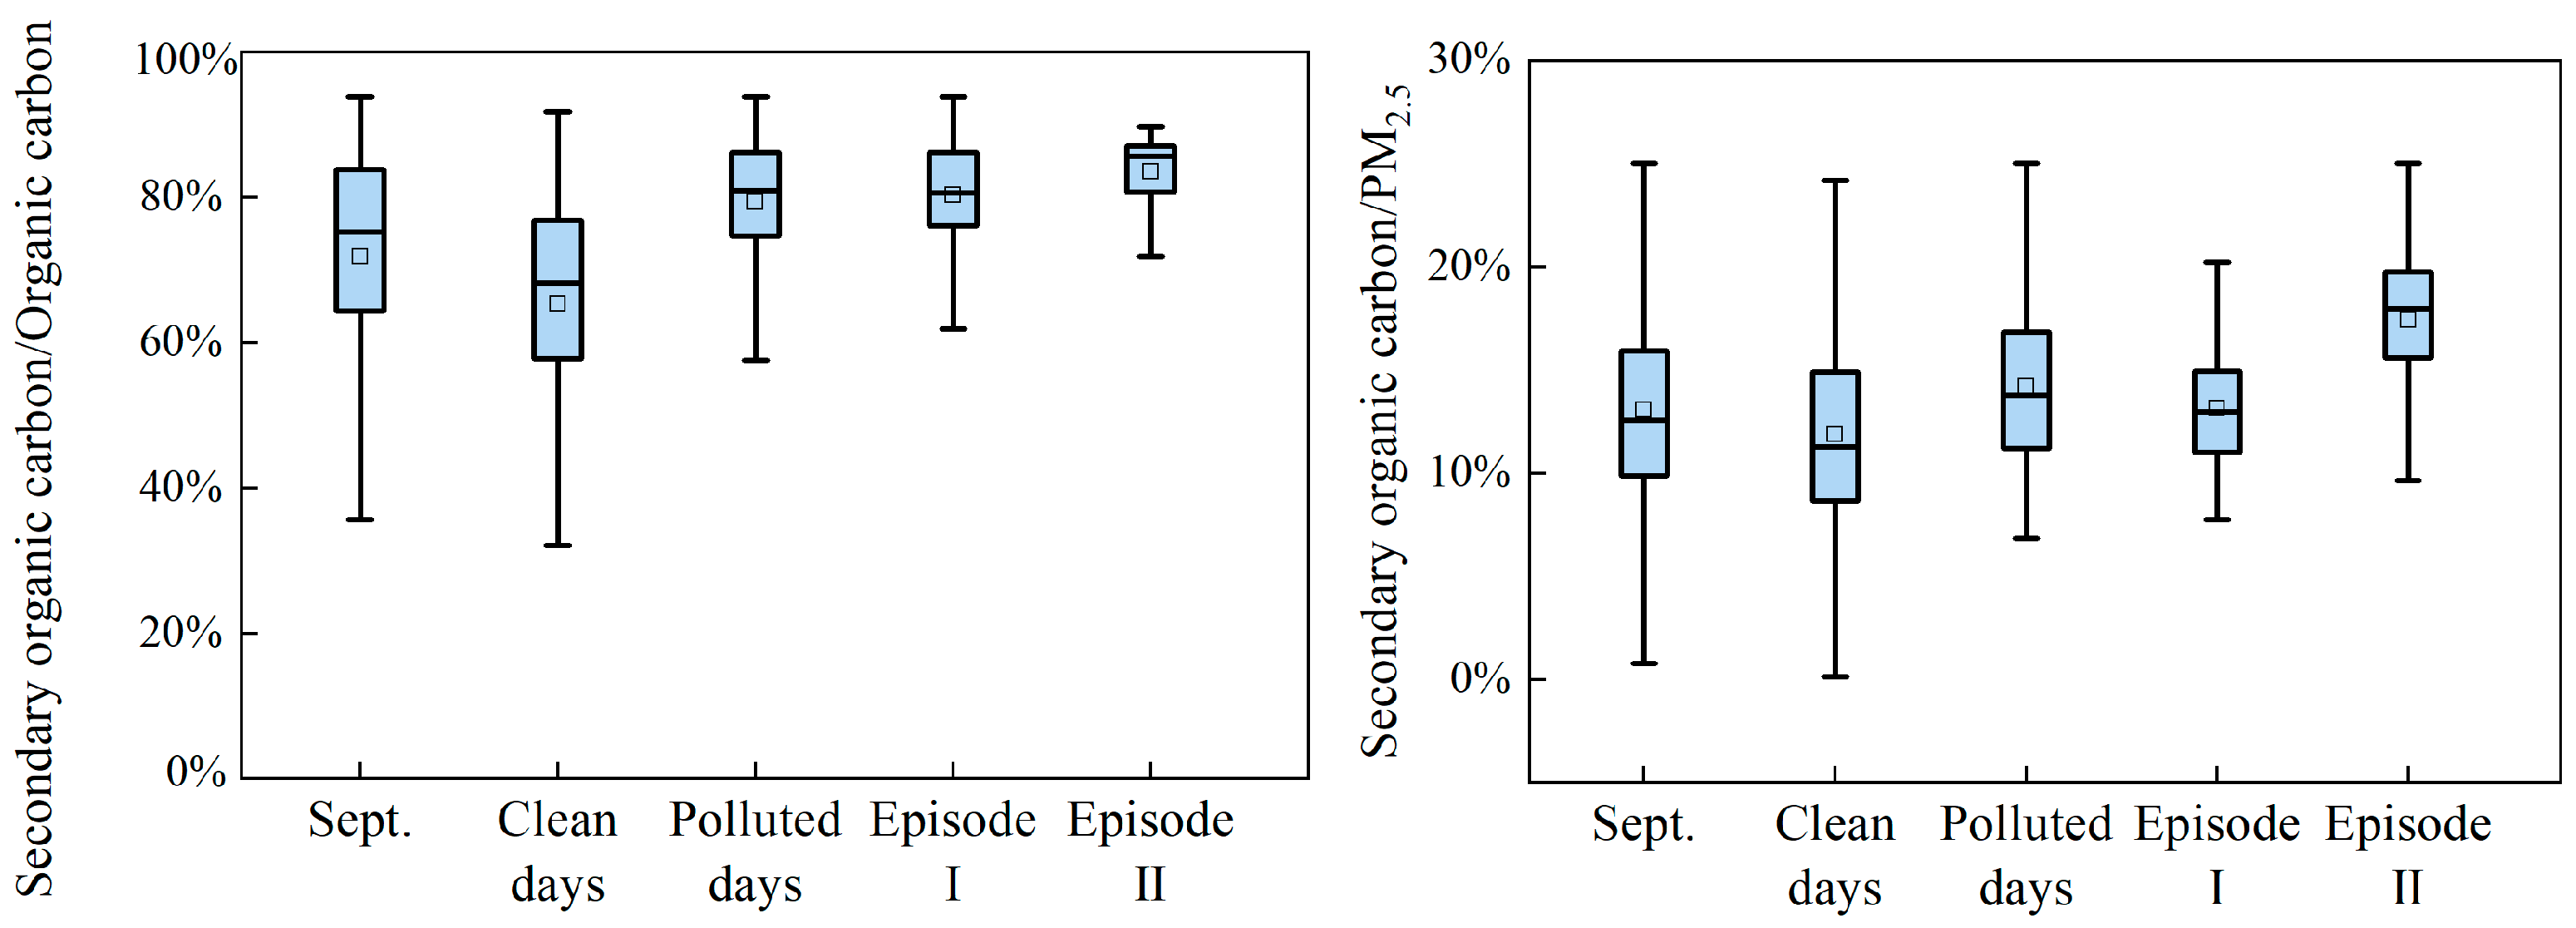
PM2.5
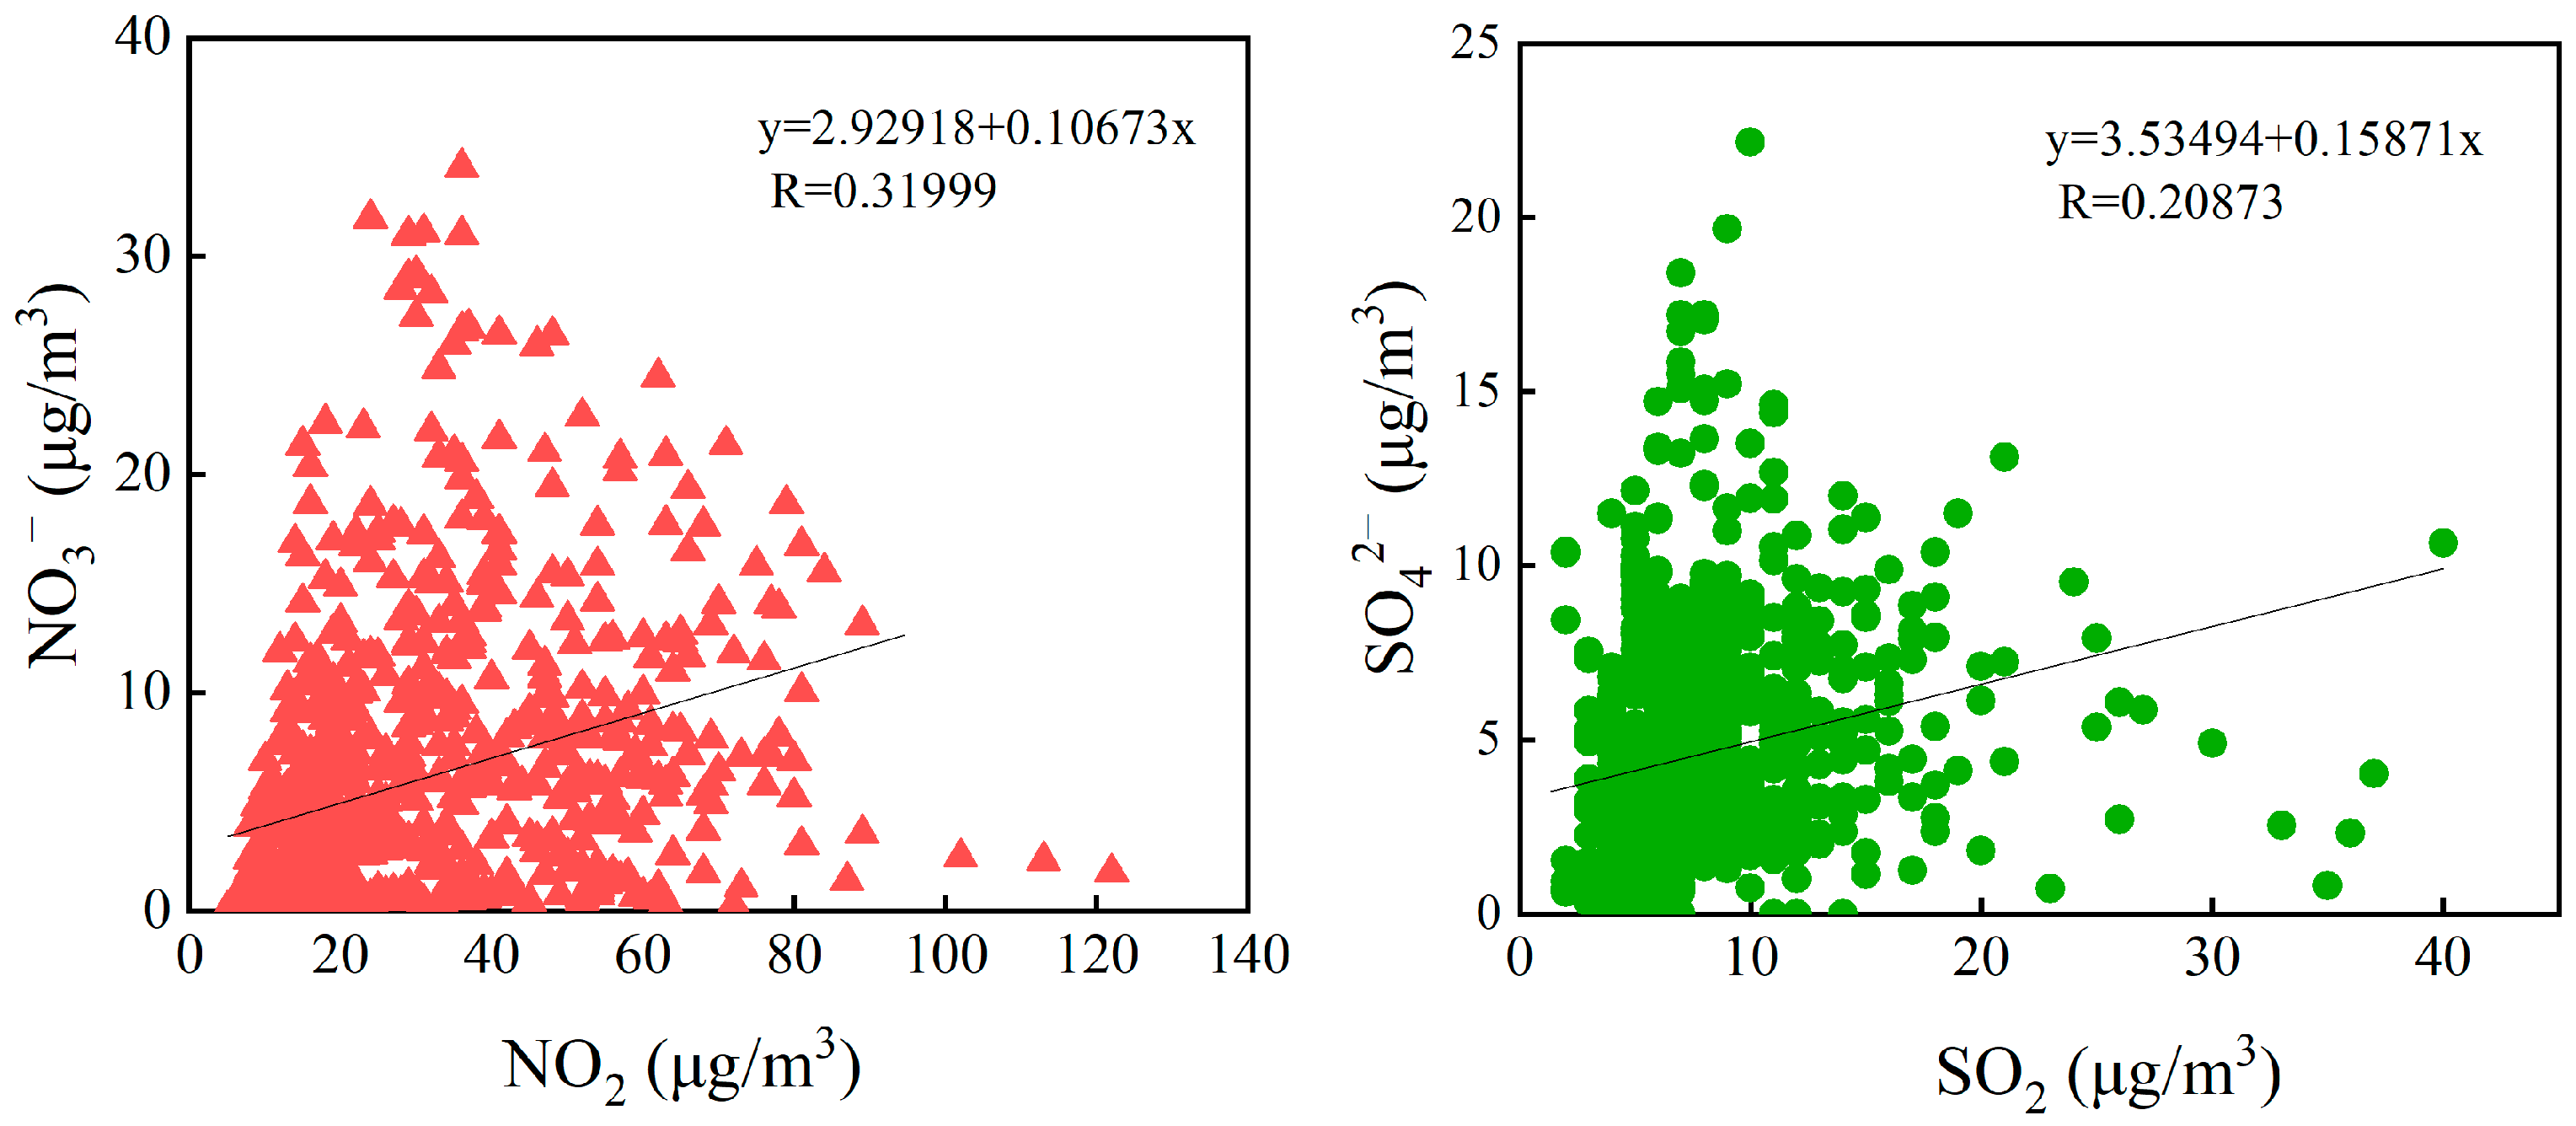
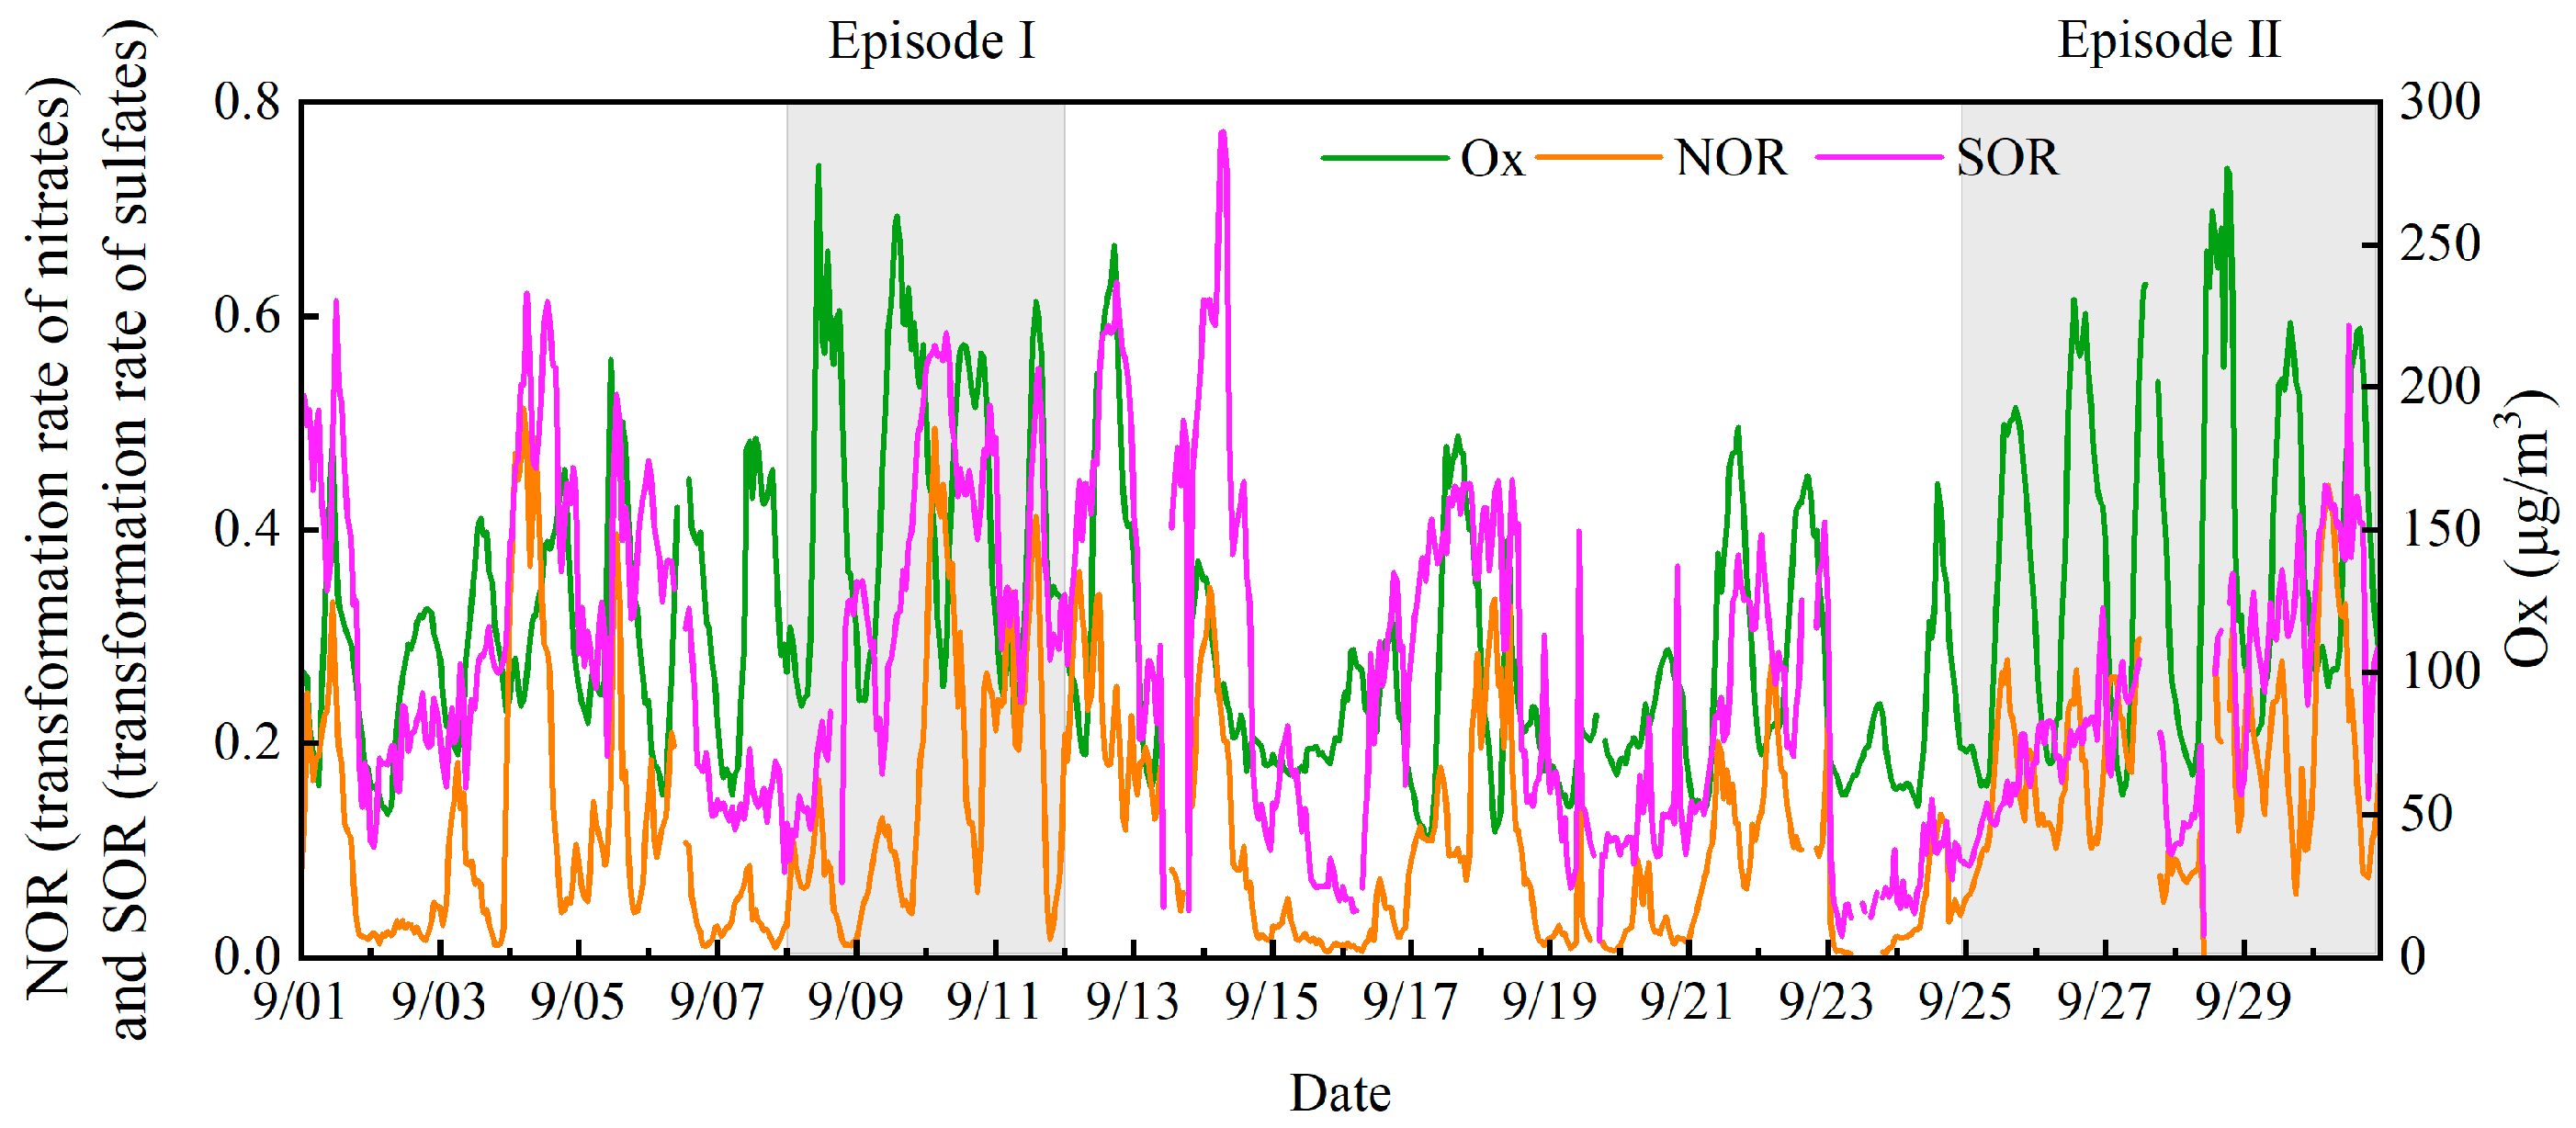
Effect of Atmospheric Oxidation on the Formation of Secondary Inorganic Components in PM2.5
3.3.4. Air pollution Transportations
4. Conclusions
- Higher daytime temperatures, higher nighttime relative humidity, high radiative fluxes, and low-speed southerly and southeasterly winds superimposed on the convergence zone are the main pollution meteorological conditions for the PM2.5 and O3 complex pollution in Dongying in September.
- In the context of pollutant emissions at a high level, compared with the variations in precursors emissions, the complex air pollution episode in September is more susceptible to changes in meteorological conditions and pollutant transport.
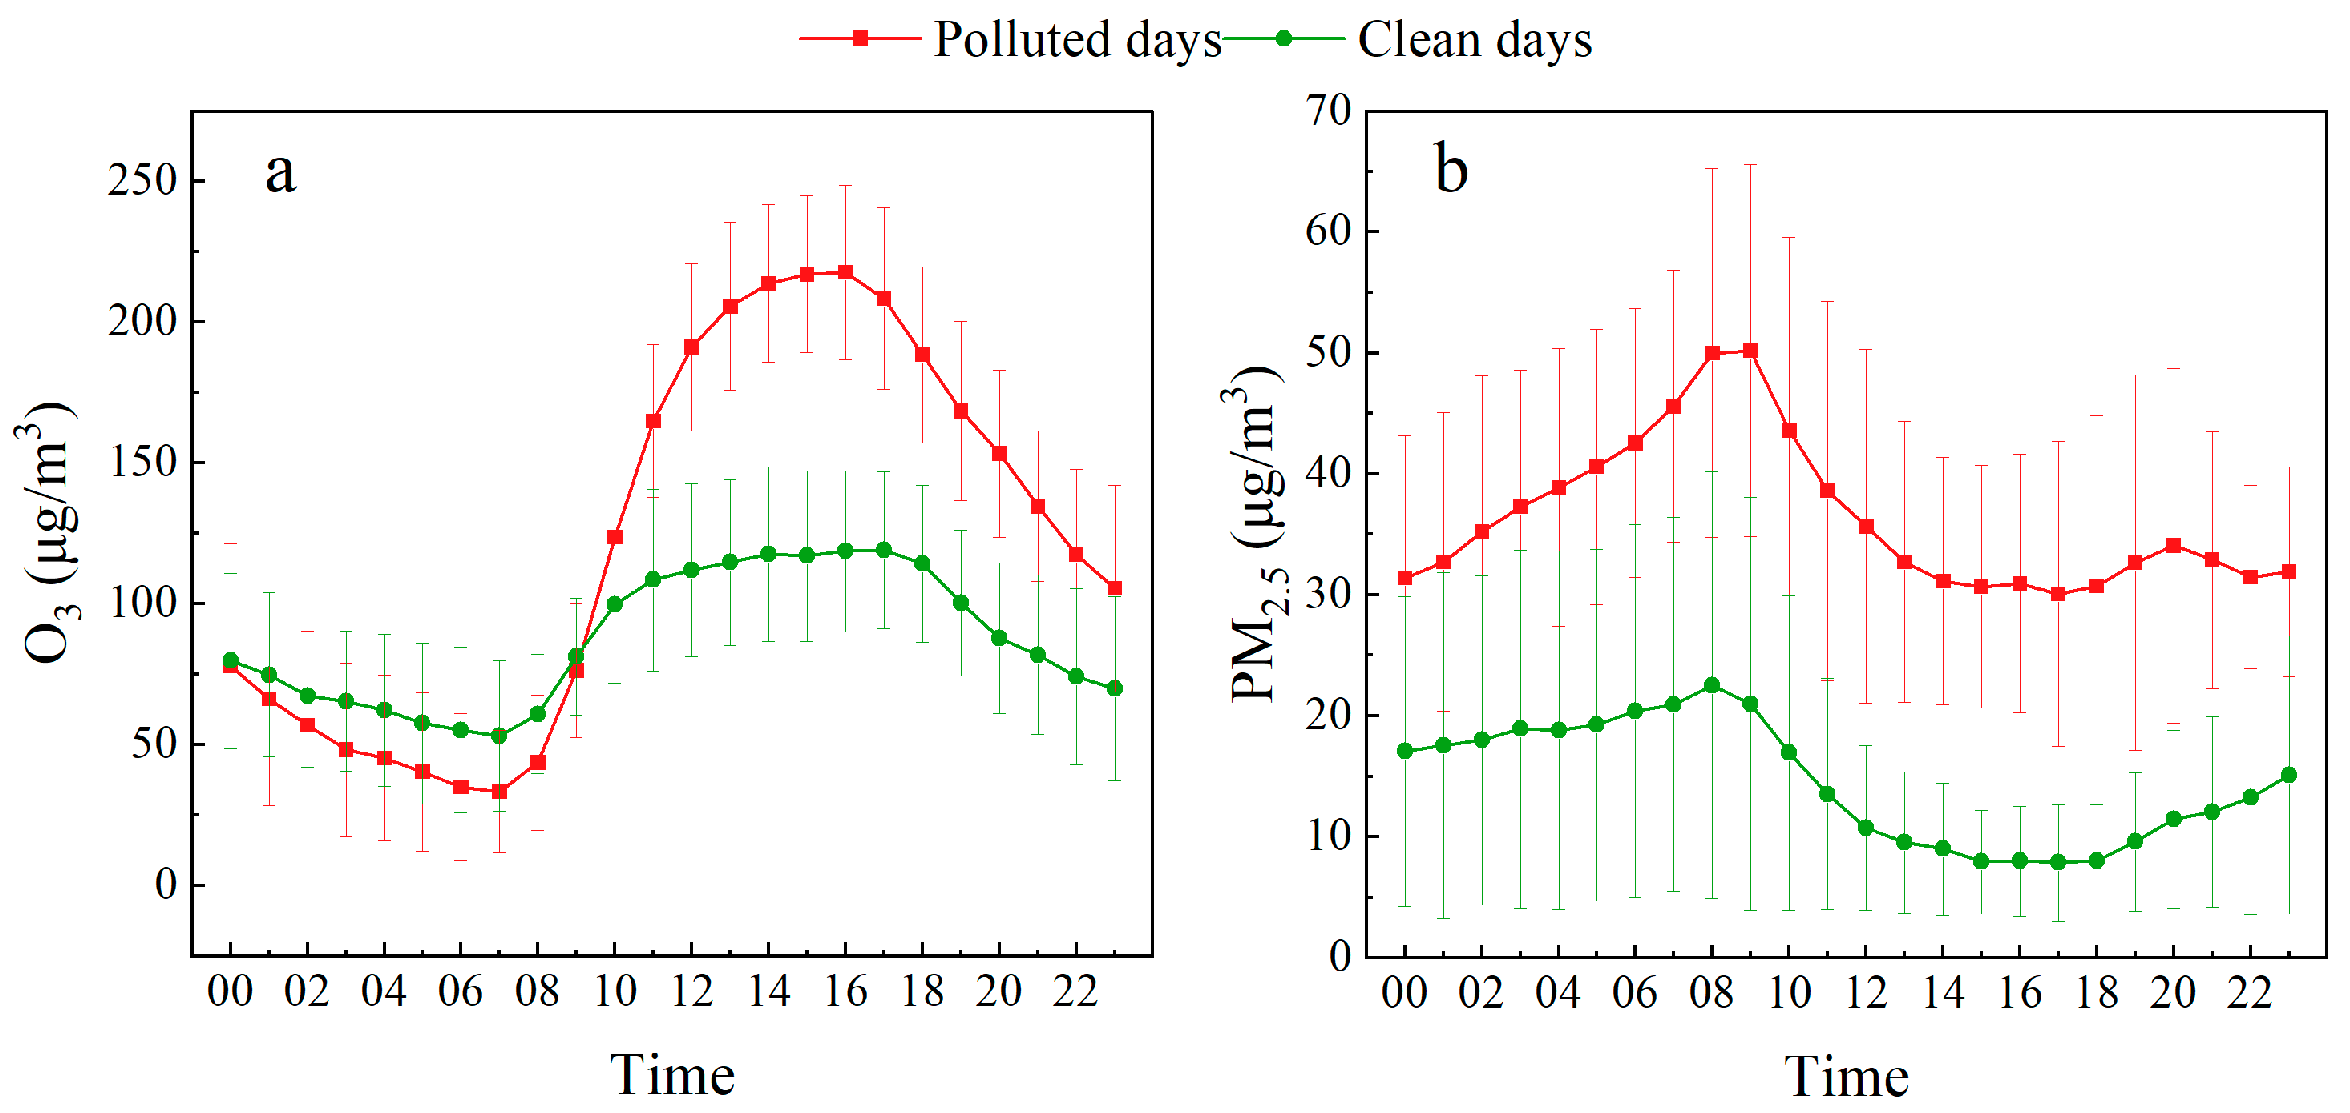
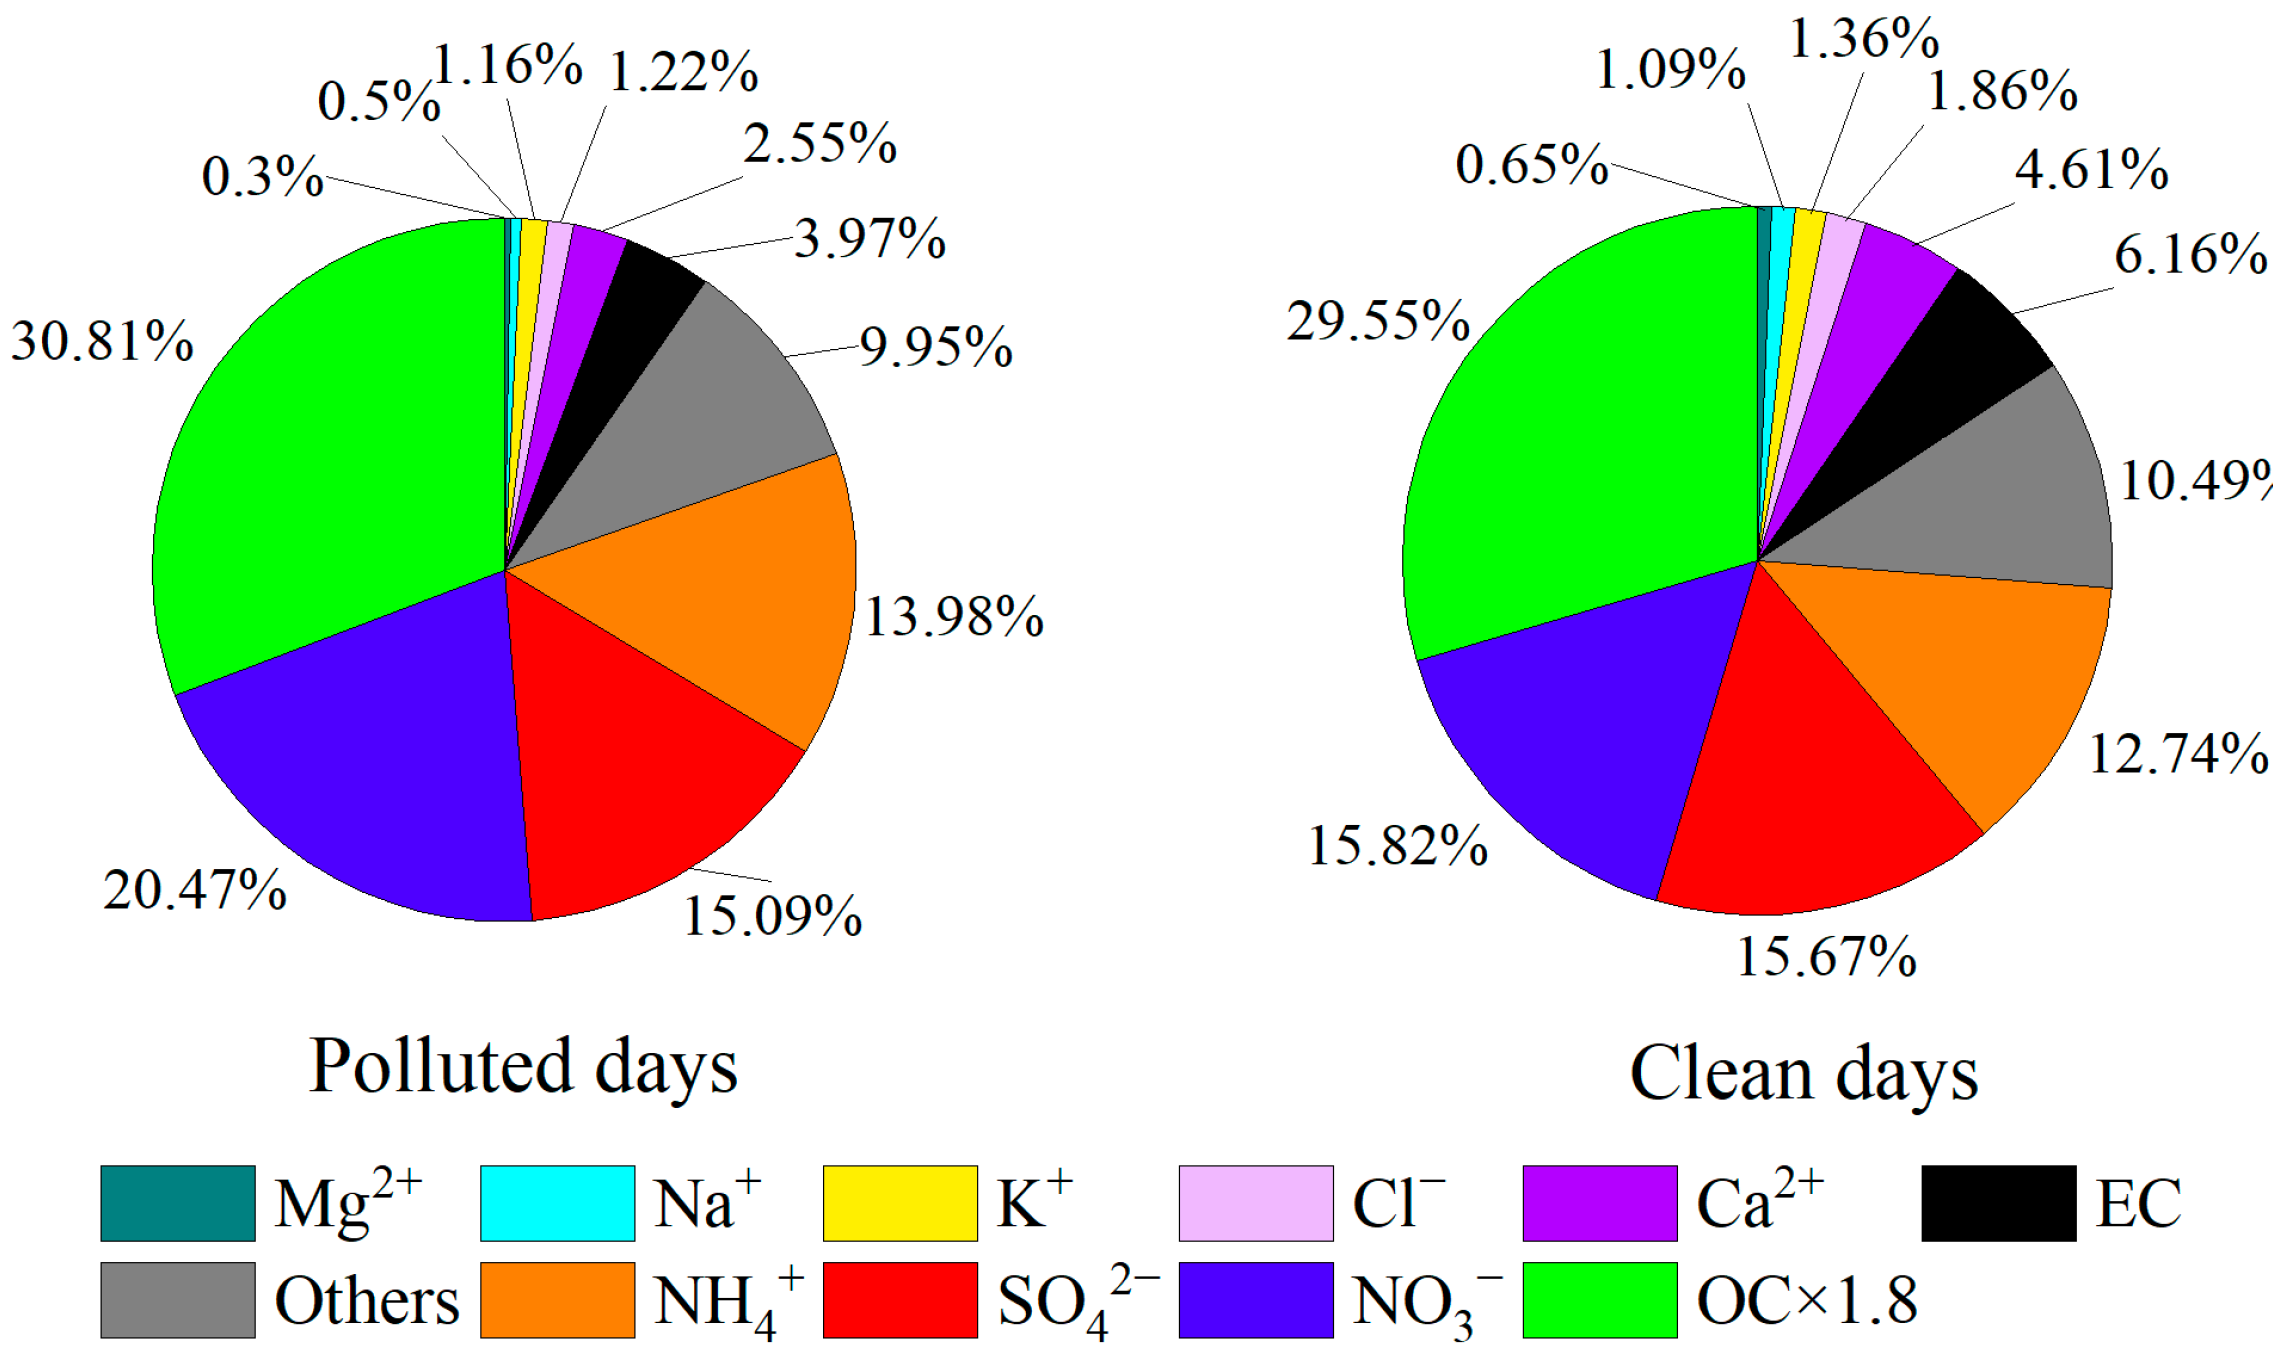
- The net daytime O3 generation rate in Dongying on polluted days was twice as high as that on clean days; O3 generation in the daytime was in the transitional regimes, and in the VOCs-limited regimes in the morning. The concentration increases of precursors NO2 and SO2 contributed greatly to the formation of NO3− and SO42−. When O3 was formed via atmospheric photochemical reactions, the atmospheric oxidation capacity was also improved, which promoted the conversion of precursors such as NO2 and SO2 to NO3− and SO42−. On the polluted days, secondary organic matter contributed significantly to the increase in PM2.5 concentration, which together led to the increasing trend of secondary pollutants concentrations in the process of O3 pollution.
- In addition, Dongying was frequently in the downwind direction of land and sea and was often in the convergence zone of air flows during the episodes. The diffusion conditions were very poor, and thus the pollutants formed locally and transported from the upwind direction, including the Bohai Bay air mass transportation, were easy to be accumulated. The vertical transportation would further increase the concentration of pollutants in Dongying.
- In terms of control, (1) the synergistic control of NOx and VOCs at the city level should be further strengthened in Dongying, and in particular, the control of NOx and VOCs emissions at nighttime needs to be strengthened to minimize the impact on O3 and PM2.5 complex pollution. (2) It is recommended that Dongying local government should actively promote the construction of effective air pollution joint prevention and control mechanisms with the neighboring cities such as Jinan, Tai’an, Zibo, and Weifang in Shandong Province.
- In terms of research, attention should be paid to scientific research on the characteristics of atmospheric pollution in Bohai Bay and its impact on the air quality of coastal cities, so as to contribute to the effective improvement of ambient air quality in coastal cities in Bohai Bay Rim.
Supplementary Materials
Author Contributions
Funding
Institutional Review Board Statement
Informed Consent Statement
Data Availability Statement
Conflicts of Interest
References
- He, J.; Gong, S.; Yu, Y.; Yu, L.; Wu, L.; Mao, H.; Song, C.; Zhao, S.; Liu, H.; Li, X.; et al. Air pollution characteristics and their relation to meteorological conditions during 2014-2015 in major Chinese cities. Environ. Pollut. 2017, 223, 484–496. [Google Scholar] [CrossRef]
- Li, R.; Wang, Z.; Cui, L.; Fu, H.; Zhang, L.; Kong, L.; Chen, W.; Chen, J. Air pollution characteristics in China during 2015-2016: Spatiotemporal variations and key meteorological factors. Sci. Total Environ. 2019, 648, 902–915. [Google Scholar] [CrossRef] [PubMed]
- Tang, X.Y.; Zhang, Y.H.; Shao, M. Atmospheric Environmental Chemistry, 2nd ed.; High Education Press: Beijing, China, 2006. [Google Scholar]
- Dai, S. Advances in Environmental Chemistry; Chemical Industry Press: Beijing, China, 2005. [Google Scholar]
- Zeng, Y.; Cao, Y.; Qiao, X.; Seyler, B.C.; Tang, Y. Air pollution reduction in China: Recent success but great challenge for the future. Sci. Total Environ. 2019, 663, 329–337. [Google Scholar] [CrossRef] [PubMed]
- Lyu, X.P.; Chen, N.; Guo, H.; Zhang, W.H.; Wang, N.; Wang, Y.; Liu, M. Ambient volatile organic compounds and their effect on ozone production in Wuhan, central China. Sci. Total Environ. 2016, 541, 200–209. [Google Scholar] [CrossRef] [PubMed]
- Lyu, X.; Wang, N.; Guo, H.; Xue, L.; Jiang, F.; Zeren, Y.; Cheng, H.; Cai, Z.; Han, L.; Zhou, Y. Causes of a continuous summertime O3 pollution event in Jinan, a central city in the North China Plain. Atmos. Chem. Phys. 2019, 19, 3025–3042. [Google Scholar] [CrossRef]
- Zhao, H.; Chen, K.; Liu, Z.; Zhang, Y.; Shao, T.; Zhang, H. Coordinated control of PM2.5 and O3 is urgently needed in China after implementation of the “Air pollution prevention and control action plan”. Chemosphere 2021, 270, 129441. [Google Scholar] [CrossRef] [PubMed]
- Yang, C.; Yang, H.; Guo, S.; Wang, Z.; Xu, X.; Duan, X.; Kan, H. Alternative ozone metrics and daily mortality in Suzhou: The China Air Pollution and Health Effects Study (CAPES). Sci. Total Environ. 2012, 426, 83–89. [Google Scholar] [CrossRef]
- Yue, X.; Unger, N. Ozone vegetation damage effects on gross primary productivity in the United States. Atmos. Chem. Phys. 2014, 14, 9137–9153. [Google Scholar] [CrossRef]
- Dong, C.; Gao, R.; Zhang, X.; Li, H.; Wang, W.; Xue, L. Assessment of O3-induced crop yield losses in northern China during 2013–2018 using high-resolution air quality reanalysis data. Atmos. Environ. 2021, 259, 118527. [Google Scholar] [CrossRef]
- Feng, Z.; De Marco, A.; Anav, A.; Gualtieri, M.; Sicard, P.; Tian, H.; Fornasier, F.; Tao, F.; Guo, A.; Paoletti, E. Economic losses due to ozone impacts on human health, forest productivity and crop yield across China. Environ. Int. 2019, 131, 104966. [Google Scholar] [CrossRef]
- Liu, C.; Chen, R.; Sera, F.; Vicedo-Cabrera, A.M.; Guo, Y.; Tong, S.; Lavigne, E.; Correa, P.M.; Ortega, N.V.; Achilleos, S.; et al. Interactive effects of ambient fine particulate matter and ozone on daily mortality in 372 cities: Two stage time series analysis. BMJ 2023, 383, e075203. [Google Scholar] [CrossRef] [PubMed]
- Jiang, H.; Gao, J.; Li, H.; Chu, W.; Chai, F. Preliminary Research on Theoretical Framework of Cooperative Control of AirPollution in China. Res. Environ. Sci. 2022, 35, 601–610. [Google Scholar] [CrossRef]
- Li, H.; Peng, L.; Bi, F.; Li, L.; Bao, J.; Li, J.; Zhang, H.; Chai, F. Strategy of Coordinated Control of PM2. 5 and Ozone in China. Res. Environ. Sci. 2019, 32, 1763–1778. [Google Scholar] [CrossRef]
- Hua, C.; Jiang, Q.; Chi, X.; Liu, C. Meteorological Characteristics of PM2.5-O3 Air Combined Pollution in Central andEastern China in the Summer Half Years of 2015–2020. Res. Environ. Sci. 2022, 35, 650–658. [Google Scholar] [CrossRef]
- Jia, M.; Zhao, T.; Cheng, X.; Gong, S.; Zhang, X.; Tang, L.; Liu, D.; Wu, X.; Wang, L.; Chen, Y. Inverse Relations of PM2.5 and O3 in Air Compound Pollution between Cold and Hot Seasons over an Urban Area of East China. Atmosphere 2017, 8, 59. [Google Scholar] [CrossRef]
- Zhu, J.; Chen, L.; Liao, H.; Dang, R. Correlations between PM2.5 and Ozone over China and Associated Underlying Reasons. Atmosphere 2019, 10, 352. [Google Scholar] [CrossRef]
- Meng, Z.; Dabdub, D.; Seinfeld, J.H. Chemical coupling between atmospheric ozone and particulate matter. Science 1997, 277, 116–119. [Google Scholar] [CrossRef]
- Xing, J.; Wang, J.; Mathur, R.; Wang, S.; Sarwar, G.; Pleim, J.; Hogrefe, C.; Zhang, Y.; Jiang, J.; Wong, D.C.; et al. Impacts of aerosol direct effects on tropospheric ozone through changes in atmospheric dynamics and photolysis rates. Atmos. Chem. Phys. 2017, 17, 9869–9883. [Google Scholar] [CrossRef]
- Tao, Z.; Yu, H.; Chin, M. The Role of Aerosol-Cloud-Radiation Interactions in Regional Air Quality—A NU-WRF Study over the United States. Atmosphere 2015, 6, 1045–1068. [Google Scholar] [CrossRef]
- Li, J.; Carlson, B.E.; Yung, Y.L.; Lv, D.; Hansen, J.; Penner, J.E.; Liao, H.; Ramaswamy, V.; Kahn, R.A.; Zhang, P.; et al. Scattering and absorbing aerosols in the climate system. Nat. Rev. Earth Environ. 2022, 3, 363–379. [Google Scholar] [CrossRef]
- Ivatt, P.D.; Evans, M.J.; Lewis, A.C. Suppression of surface ozone by an aerosol-inhibited photochemical ozone regime. Nat. Geosci. 2022, 15, 536–540. [Google Scholar] [CrossRef]
- Zhao, M.; Shen, H.; CHen, T.; Li, J.; Sun, Z.; Ji, Y.; Xue, L.; Li, H.; Wang, W.; Shang, F. Characteristics and Sensitivity Analysis of Ozone in the Representative City of the Yellow River Delta in Summer. Res. Environ. Sci. 2022, 35, 1351–1361. [Google Scholar] [CrossRef]
- Wu, L. Volatile Organic Compound Emissions from the Oilfield in the Yellow River Delta Region, Northern China and Their Impact on Regional Ozone Pollution. Master’s Thesis, Shandong University, Jinan, China, 2019. [Google Scholar]
- Wang, Z.S.; Chien, C.-J.; Tonnesen, G.S. Development of a tagged species source apportionment algorithm to characterize three-dimensional transport and transformation of precursors and secondary pollutants. J. Geophys. Res.-Atmos. 2009, 114, D21206. [Google Scholar] [CrossRef]
- Kwok, R.H.F.; Napelenok, S.L.; Baker, K.R. Implementation and evaluation of PM2.5 source contribution analysis in a photochemical model. Atmos. Environ. 2013, 80, 398–407. [Google Scholar] [CrossRef]
- Li, Q.; Su, G.; Li, C.; Liu, P.; Zhao, X.; Zhang, C.; Sun, X.; Mu, Y.; Wu, M.; Wang, Q. An investigation into the role of VOCs in SOA and ozone production in Beijing, China. Sci. Total Environ. 2020, 720, 137536. [Google Scholar] [CrossRef] [PubMed]
- Yin, S.; Liu, Y.; Ma, W.; Zheng, C.; Zhang, Y.; Wang, Z.; Cheng, Q.; Liu, X. Formation mechanism, precursor sensitivity and control strategies of summertime ozone on the Fenwei Plain, China. Atmos. Environ. 2023, 309, 119908. [Google Scholar] [CrossRef]
- Xue, L.; Wang, T.; Gao, J.; Ding, A.; Zhou, X.; Blake, D.; Wang, X.; Saunders, S.; Fan, S.; Zuo, H. Ground-level ozone in four Chinese cities: Precursors, regional transport and heterogeneous processes. Atmos. Chem. Phys. 2014, 14, 13175–13188. [Google Scholar] [CrossRef]
- Tan, Z.; Lu, K.; Jiang, M.; Su, R.; Dong, H.; Zeng, L.; Xie, S.; Tan, Q.; Zhang, Y. Exploring ozone pollution in Chengdu, southwestern China: A case study from radical chemistry to O3-VOC-NOx sensitivity. Sci. Total Environ. 2018, 636, 775–786. [Google Scholar] [CrossRef]
- Chow, J.C.; Watson, J.G.; Lu, Z.; Lowenthal, D.H.; Frazier, C.A.; Solomon, P.A.; Thuillier, R.H.; Magliano, K. Descriptive analysis of PM2.5 and PM10 at regionally representative locations during SJVAQS/AUSPEX. Atmos. Environ. 1996, 30, 2079–2112. [Google Scholar] [CrossRef]
- Wang, Y.Q. MeteoInfo: GIS software for meteorological data visualization and analysis. Meteorol. Appl. 2014, 21, 360–368. [Google Scholar] [CrossRef]
- Wang, Y. An Open Source Software Suite for Multi-Dimensional Meteorological Data Computation and Visualisation. J. Open Res. Softw. 2019, 7, 21. [Google Scholar] [CrossRef]
- Zhou, M. Emission Inventories and Pollution Characteristics of Anthropogenic Air Pollutants in Shandong Province. Master’s Thesis, Jinan University, Jinan, China, 2021. [Google Scholar]


Disclaimer/Publisher’s Note: The statements, opinions and data contained in all publications are solely those of the individual author(s) and contributor(s) and not of MDPI and/or the editor(s). MDPI and/or the editor(s) disclaim responsibility for any injury to people or property resulting from any ideas, methods, instructions or products referred to in the content. |
© 2024 by the authors. Licensee MDPI, Basel, Switzerland. This article is an open access article distributed under the terms and conditions of the Creative Commons Attribution (CC BY) license (https://creativecommons.org/licenses/by/4.0/).
Share and Cite
Ji, Y.; An, C.; Tang, J.; Li, J.; Yan, X.; Gao, X.; Chu, W.; Zhong, X.; Shang, F.; Li, J.; et al. Causes Investigation of PM2.5 and O3 Complex Pollution in a Typical Coastal City in the Bohai Bay Region of China in Autumn: Based on One-Month Continuous Intensive Observation and Model Simulation. Atmosphere 2024, 15, 73. https://doi.org/10.3390/atmos15010073
Ji Y, An C, Tang J, Li J, Yan X, Gao X, Chu W, Zhong X, Shang F, Li J, et al. Causes Investigation of PM2.5 and O3 Complex Pollution in a Typical Coastal City in the Bohai Bay Region of China in Autumn: Based on One-Month Continuous Intensive Observation and Model Simulation. Atmosphere. 2024; 15(1):73. https://doi.org/10.3390/atmos15010073
Chicago/Turabian StyleJi, Yuanyuan, Cong An, Jinghao Tang, Jialin Li, Xiaoyu Yan, Xiaoshuai Gao, Wanghui Chu, Xuelian Zhong, Fanyi Shang, Jidong Li, and et al. 2024. "Causes Investigation of PM2.5 and O3 Complex Pollution in a Typical Coastal City in the Bohai Bay Region of China in Autumn: Based on One-Month Continuous Intensive Observation and Model Simulation" Atmosphere 15, no. 1: 73. https://doi.org/10.3390/atmos15010073
APA StyleJi, Y., An, C., Tang, J., Li, J., Yan, X., Gao, X., Chu, W., Zhong, X., Shang, F., Li, J., Tan, L., Gao, R., Bi, F., & Li, H. (2024). Causes Investigation of PM2.5 and O3 Complex Pollution in a Typical Coastal City in the Bohai Bay Region of China in Autumn: Based on One-Month Continuous Intensive Observation and Model Simulation. Atmosphere, 15(1), 73. https://doi.org/10.3390/atmos15010073