Article

Characterizing Isotopic Composition and Trajectories of Atmospheric River Events

1
Department of Earth Sciences, Simon Fraser University, Burnaby, BC V5A 1S6, Canada
2
Department of Geography, Simon Fraser University, Burnaby, BC V5A 1S6, Canada
*
Author to whom correspondence should be addressed.
Atmosphere 2024, 15(1), 74; https://doi.org/10.3390/atmos15010074
Submission received: 30 November 2023 / Revised: 31 December 2023 / Accepted: 2 January 2024 / Published: 7 January 2024

Abstract

:
Landfalling atmospheric rivers (LARs) are important drivers of mid-latitude climate; however, our understanding of the water vapour sources, storm trajectories, and receiving waters of ARs is limited. This study aims to characterize LARs in southwest British Columbia by their isotopic composition and storm track trajectories and to better understand how AR-derived precipitation is manifested in watershed waters. ARs were depleted (−11.71‰ δ18O, −85.80‰ δ2H, n = 19) compared to non-ARs (−9.47‰ δ18O, −69.58‰ δ2H, n = 32) (p = 0.03); however, the difference is minimal. LAR storm tracks did not show any obvious correlation to their isotopic composition, despite the large variability in their source regions across the Pacific Ocean. The lack of correlation is attributed to mixing air parcels, thereby incorporating moisture with different isotopic compositions into the main transport mechanism. D-excess values for ARs and non-ARs were statistically similar, although seasonal differences were observed. ARs with higher d-excess were sourced from the central Pacific, whereas ARs with lower d-excess had storm tracks through the northern Pacific. Watershed water d-excess values (mean = 8.58 ± 2.97‰) were more similar to winter precipitation (mean = 10.1 ± 5.1‰), compared to summer (mean = 2.8 ± 4.3‰), likely due to their source of winter precipitation at high elevation. A greater range in AR d-excess winter values relative to summer values (3.6–16.6‰, −0.3–6.0‰, respectively) is attributed to storm track variability.

1. Introduction

Atmospheric river (AR) precipitation events are a normal recurring feature of climate in many parts of the world [1]. The impacts of ARs on land can vary significantly, from beneficial to extremely hazardous, and are a major atmospheric mechanism that controls hydrologic processes, including water vapour transport and water resource availability [2,3]. Western coastal areas, particularly in the mid-latitudes, experience 40 or more landfalling AR (LAR) days per year, with greater occurrence in the winter and lesser in the summer [4] and contribute approximately half of the annual precipitation [5]. Winter LARs along the Pacific North American coast have been associated with some of the costliest natural disasters [6], largely due to the presence of coastal mountains, and therefore orographic uplift which induces precipitation. Despite ARs being a well-studied feature of mid-latitude climate, our understanding of ARs regarding the associations between water vapour sources, storm trajectories, and receiving waters is limited.
ARs are long (>~2000 km) and narrow (<~1000 km) bands of moisture, transporting large amounts of water vapour, often from subtropical regions to the mid-latitudes, in the lower troposphere [1]. In some instances, however, ARs are associated with or considered part of extratropical cyclones which originate in the mid-latitudes [2,7]. Therefore, LARs may have different stable isotope (δ2H and δ18O) compositions depending on their source areas and trajectories. The isotopic signature of precipitation depends on source vapour composition, air temperature, and precipitation amount, which vary seasonally and spatially [8,9,10]. Globally, the isotopic composition of precipitation generally exhibits a linear relationship, as described by the global meteoric water line (GMWL):
δ2H = 8·δ18O + 10‰ (GMWL)
where δ denotes the per mil difference between the sample and Vienna Standard Mean Ocean Water. Deviations from the GMWL elucidate other natural processes or environmental conditions, such as secondary evaporation, high or low humidities at the water vapour source, and other kinetic processes. For example, local meteoric water lines for Victoria, British Columbia (BC), and Ottawa, Ontario have similar average annual slopes, but different δ2H intercepts. Ottawa’s higher intercept is due to tropical air streams from the Gulf of Mexico and the Atlantic Ocean, whereas Victoria receives weather from the higher latitudes of the Pacific Ocean [11]. This suggests that the isotopic composition at each locality can vary seasonally, and is influenced by the track an air parcel takes, which is determined by atmospheric circulation patterns.
A specific type of AR which originates in the central Pacific Ocean, colloquially known as a “Pineapple Express” (PE) storm, is associated with low-pressure cells over the Gulf of Alaska that funnel warm and wet subtropical air towards the west coast of North America [12,13]. PE storms have higher precipitation rates compared to other non-ARs and often AR events [14,15]. PE moisture is derived from lower latitudes, with warmer air that tends to hold moisture that is isotopically heavier than air masses from cooler regions [8,16]. Thus, on several accounts, these types of ARs have been explored isotopically and have been observed to be enriched relative to other AR and non-AR precipitation events [12,17]. However, there does not appear to be any studies comparing the isotopic composition of ARs to non-ARs. If the isotopic composition of ARs is distinct from non-AR events, then AR frequency and contribution to a watershed could likely be quantified via direct isotopic records or their proxies, potentially expanding our understanding of AR contributions.
Stable isotopes of water are natural tracers of the hydrologic cycle and can provide meaningful insight into various hydrological processes, including tracking parcels of water through the water cycle [11,18]. A study conducted in Massachusetts investigated surface water and groundwater samples between 2011 and 2016 which included the wettest hydrologic year on record due to tropical storm events. Isotope data revealed that the isotopically enriched water from the event, relative to mean annual compositions, was still draining from the groundwater systems to surface streams five years after this unique hydrologic year [19]. This raises the question of how persistent the precipitation from ARs in a watershed may be. To date, however, the use of isotopes to identify AR-sourced water in the water cycle has not been fully explored.
We aim to characterize LARs by their isotopic composition and storm trajectories and better understand how ARs are manifested in watershed waters. The objectives of the study are three-fold: (1) to determine whether LARs in southwest BC have a distinct isotopic composition compared to non-AR precipitation events; (2) to determine if LAR isotopic composition can be attributed to the storm trajectory; (3) to attempt to identify the contribution of AR-derived precipitation to surface water bodies and the groundwater system in a watershed. One motivation for this study was the occurrence of major AR events that flooded the south coast region of BC in November 2021. Could AR-derived precipitation be detected isotopically in watershed waters? We hypothesize that LARs in this region that are sourced from the central Pacific, near the Hawaiian region, will have a more enriched signature due to warmer sea surface temperatures (SSTs), compared to ARs sourced from or transported via the extratropics (i.e., northern Pacific Ocean) which is expected to have a more depleted signature due to colder SSTs. Accordingly, water from those ARs may be detected in watershed waters.

2. Materials and Methods

2.1. Precipitation Sample Collection and Isotopic Analysis

Fifty-eight rain samples were collected and analyzed between November 2021 and February 2023. Samples were collected in Pitt Meadows, BC (49.221, −122.677, 7 m above sea level (masl)) on a residential property (Figure 1). Daily precipitation samples were capped and sealed (ensuring no headspace). In cases when AR-events spanned two precipitation collection periods, precipitation-weighted averages were determined using hourly precipitation data measured at the Pitt Meadows Climate Station 1106178 (49.208, −122.690, 5 masl) located 1.7 km southwest of the isotope collection station (Figure 1).
A longer-term record of stable isotope composition of precipitation was retrieved from the nearest International Atomic Energy Agency and World Meteorological Organization (IAEA/WMO) Global Network of Isotopes in Precipitation (GNIP) station located on Saturna Island (48.783, −123.133; Station 1017098, 150 masl) (Figure 1). Monthly composite stable isotope data are available for the period between 1997 and 2010 and were retrieved from the Water Isotope System for Data Analysis (WISER) portal [20].

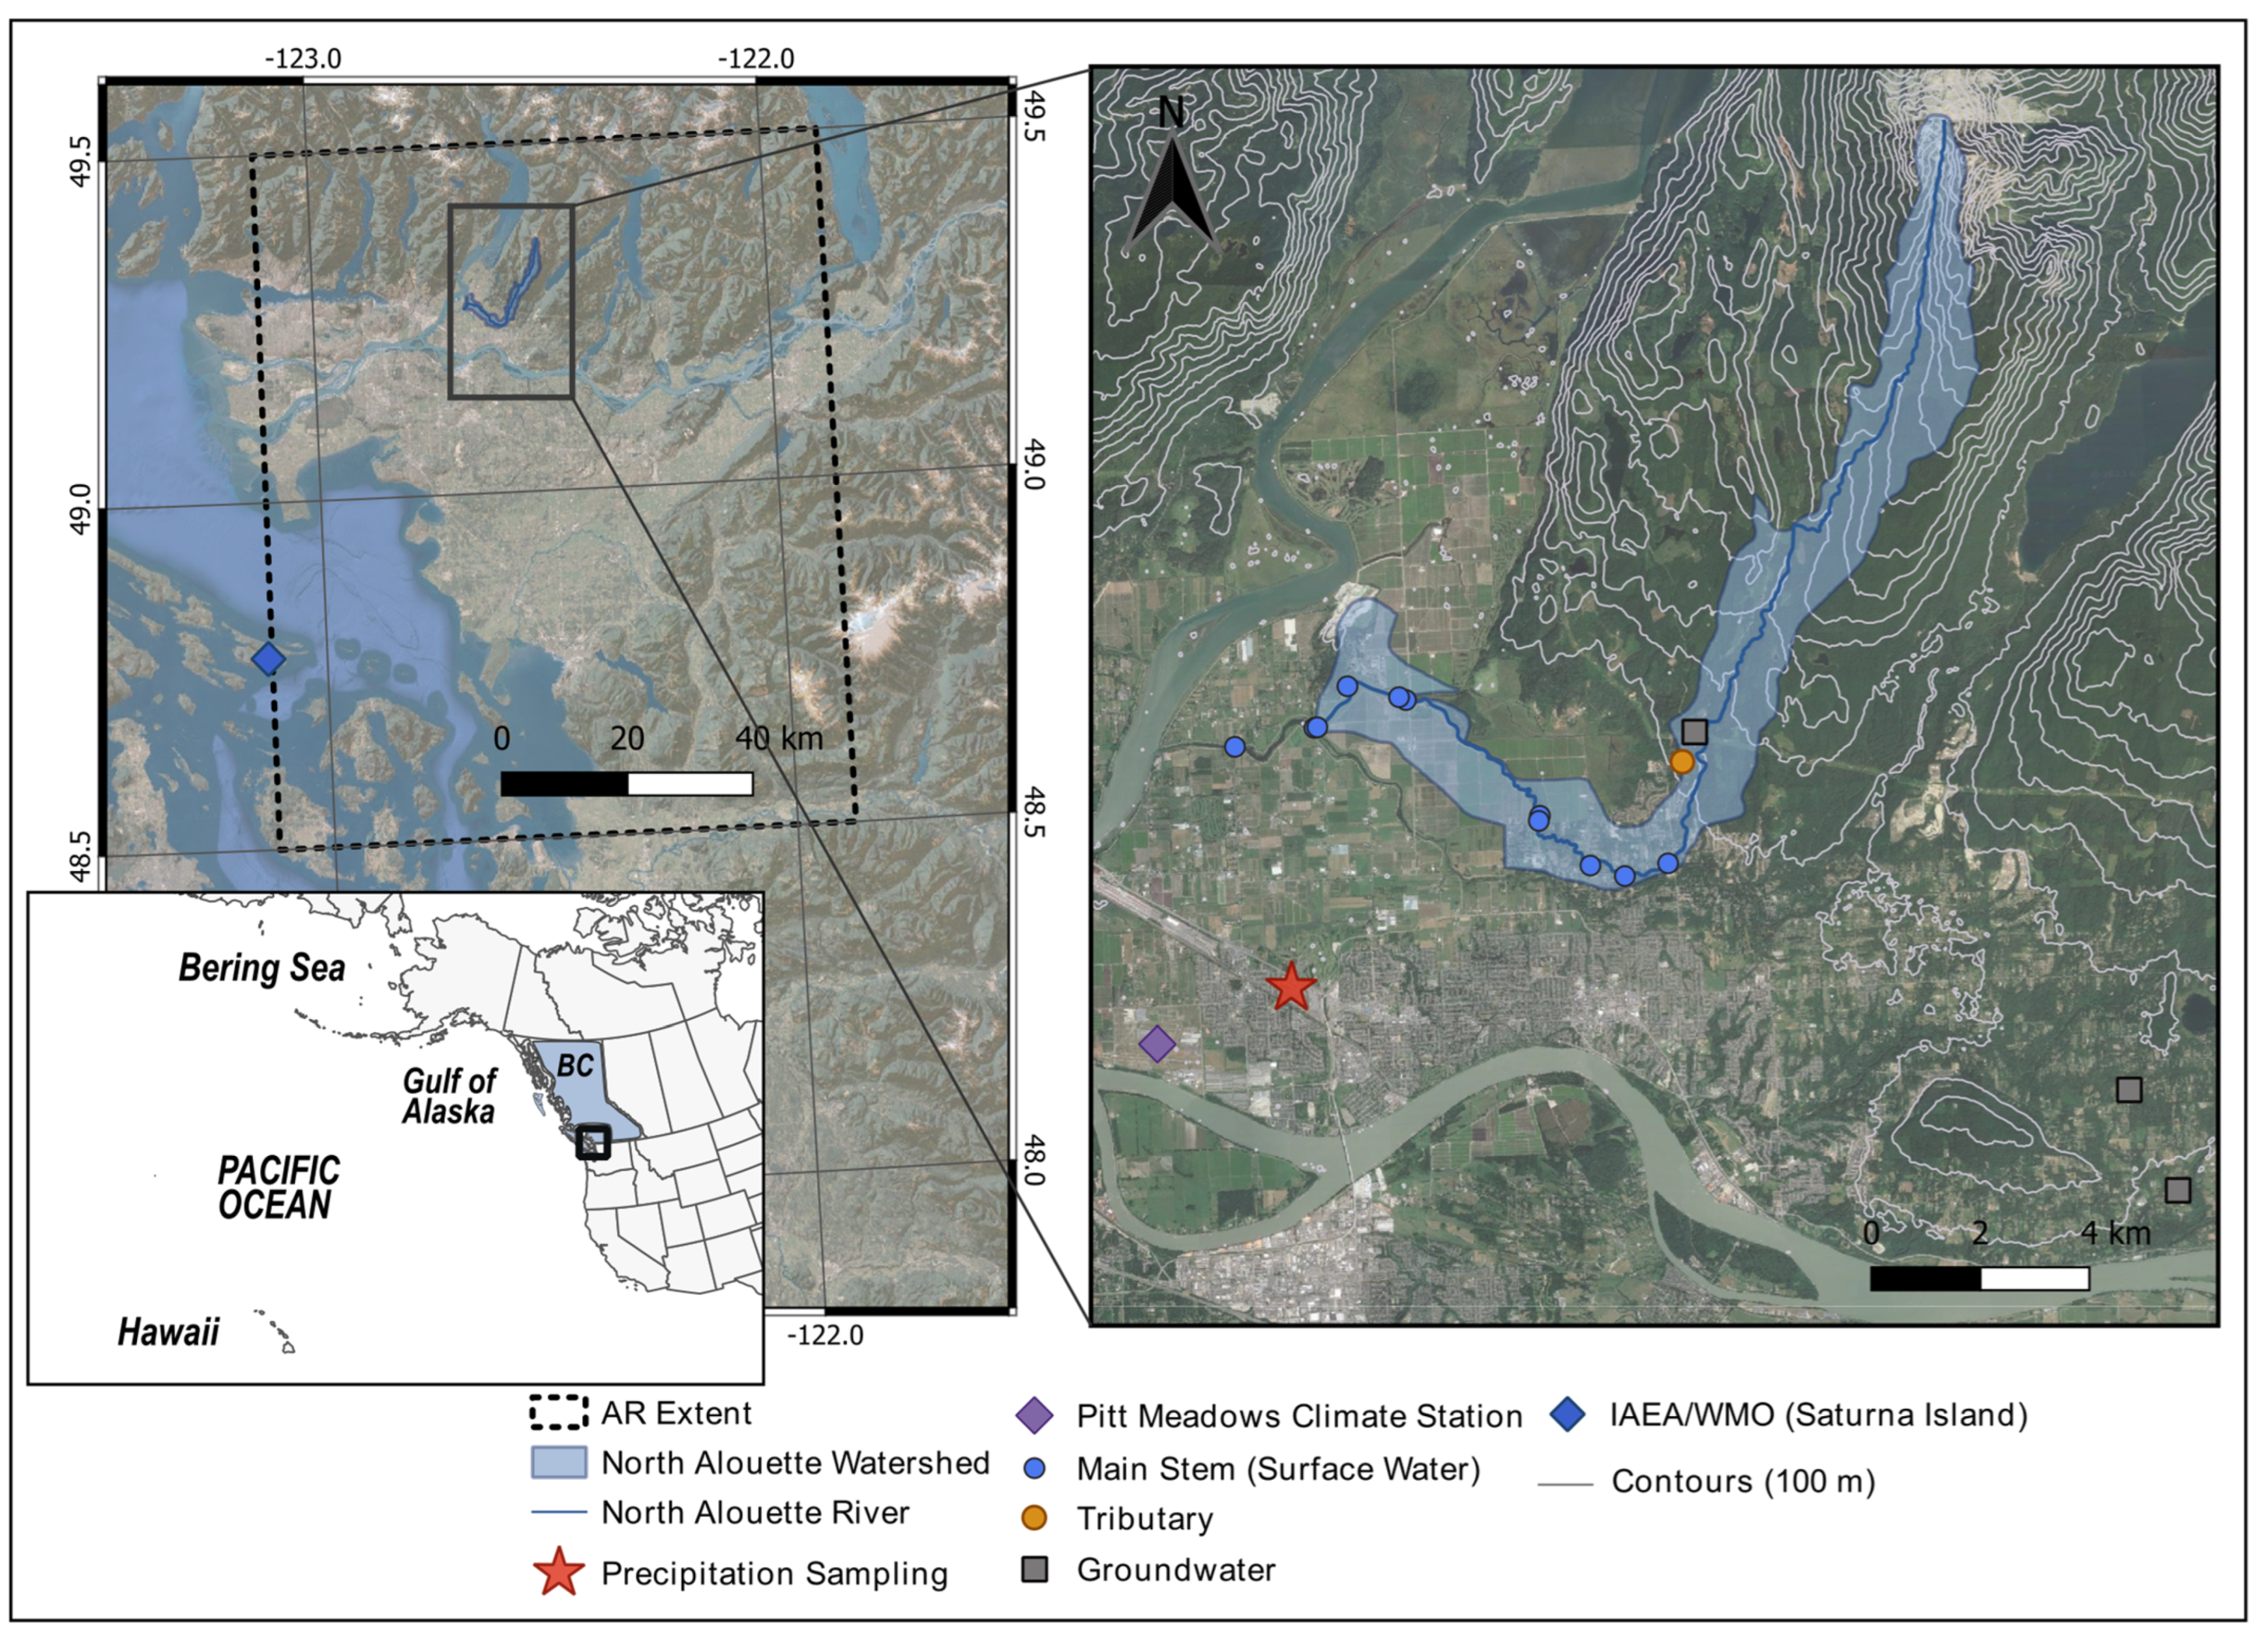
2.2. Surface Water and Groundwater Sample Collection

The North Alouette watershed, located ~40 km inland of the Pacific coast in southern BC, begins in a high-elevation headwater region with a streamflow regime dominated by rain in the fall and winter, snowmelt in the spring, and low summer dry season baseflows. At lower elevations, the land use is primarily agriculture and riparian habitat. Surface water samples from the main stem (i.e., North Alouette River) (n = 38, 3.4–16.5 masl) and one of its tributaries (n = 13, 103 masl) were sampled from the watershed during the study period. Three groundwater wells were also sampled (n = 5) within and adjacent to the watershed, with average depths to the water table ranging between 2.5 m and 52 m (Figure 1).

2.3. AR Identification

LARs and their associated integrated water vapour transport (IVT) amounts, a common parameter used to identify ARs, were obtained from a catalogue developed by Rutz et al. [21]. This catalogue was selected as it offered the most up-to-date AR reanalysis data available and is well suited for mountainous areas, such as southwest BC. The catalogue identifies AR presence or absence using NASA Modern-ERA Retrospective Analysis for Research and Applications version 2 (MERRA-2) reanalysis for the period from January 1980 to December 2022. The algorithm detects ARs as features with lengths > 2000 km and IVT > 250 kg m−1s−1 throughout the feature at a horizontal resolution of 0.625 × 0.5°. The global coverage of the Rutz et al. [21] data was cropped to the smallest extent containing the study region (48.5, 49.5, −121.875, −123.12; Figure 1) to determine AR conditions (binary presence or absence) and their associated average IVT. The original data were reported on a 3-h frequency (8-time steps/day) and upscaled to daily by considering only days in which >5 time steps were classified as ARs. If an AR day was identified in any grid cell within the cropped extent, then the entire extent was considered to have experienced an AR. Due to the time step upscaling and the inclusion of multiple grid cells in our data processing, a portion of the AR days resulted in average IVT amounts < 250 kg m−1s−1 since some time steps and grid cells had low IVT amounts, and therefore lowered the overall IVT daily average. Of the 58 rain samples collected for isotope analysis, 19 were classified as ARs based on the Rutz et al. algorithm [21]. Seven of the 58 samples could not be classified as an AR or non-AR because they were collected past the end date of the Rutz et al. [21] catalogue (31 December 2022). PEs were not explicitly identified in this study.

2.4. Precipitation Event Trajectories

Three methods were used to characterize AR storm trajectories: IVT direction, satellite (GOES-West IR) imagery, and Hybrid Single Particle Lagrangian Integrated Trajectory (HYSPLIT) modeling [22,23]. IVT direction between 2021 and 2022 was determined based on the ERA-5 global reanalysis dataset [24]. GOES Network archived images [25] were used to identify the initial moisture source of precipitation and observe storm tracks. Archived satellite imagery can be accessed at https://www.ncdc.noaa.gov/gibbs/ (accessed on 15 August 2023). Satellite images were available at 3-h time intervals; however, only one image was selected to represent the AR event (Supplementary Material, Table S1). The selected image for each event was captured during the 24-h isotope collection period and featured water vapour above the study site. The HYSPLIT modeling program is typically used to simulate the time history of air pollutant migration and concentration. Some studies have used HYSPLIT to determine trajectories and sources of extreme rainfall [26,27] and PE storms [28]. To our knowledge, no studies have used HYSPLIT to compute a series of hindcast analyses to determine the origin and trajectories of air masses associated with LARs. Archived meteorological data for the trajectory calculations were obtained from the Global Data Assimilation System (GDAS) 1-degree operation system, which is integrated into NOAA’s Air Resource Laboratory online system [29]. The back trajectory calculation originated from the precipitation sampling location in Pitt Meadows, BC. Seventy-two hours before 00:00, 08:00, and 16:00 UTC on the day the AR occurred were simulated and are represented as red, blue, and green tracks on the model outputs (see Supplementary Material, Table S1). Three different start times were selected to account for the sample accumulation period and to observe variability in trajectory patterns and general storm azimuth. The models were simulated at 100, 1000, and 3000 m above ground level (700–1000 hPa), which contains the lowest part of the troposphere, where precipitation forms, including ARs [2]. The R Package “SplitR” was used to plot the trajectories [30].

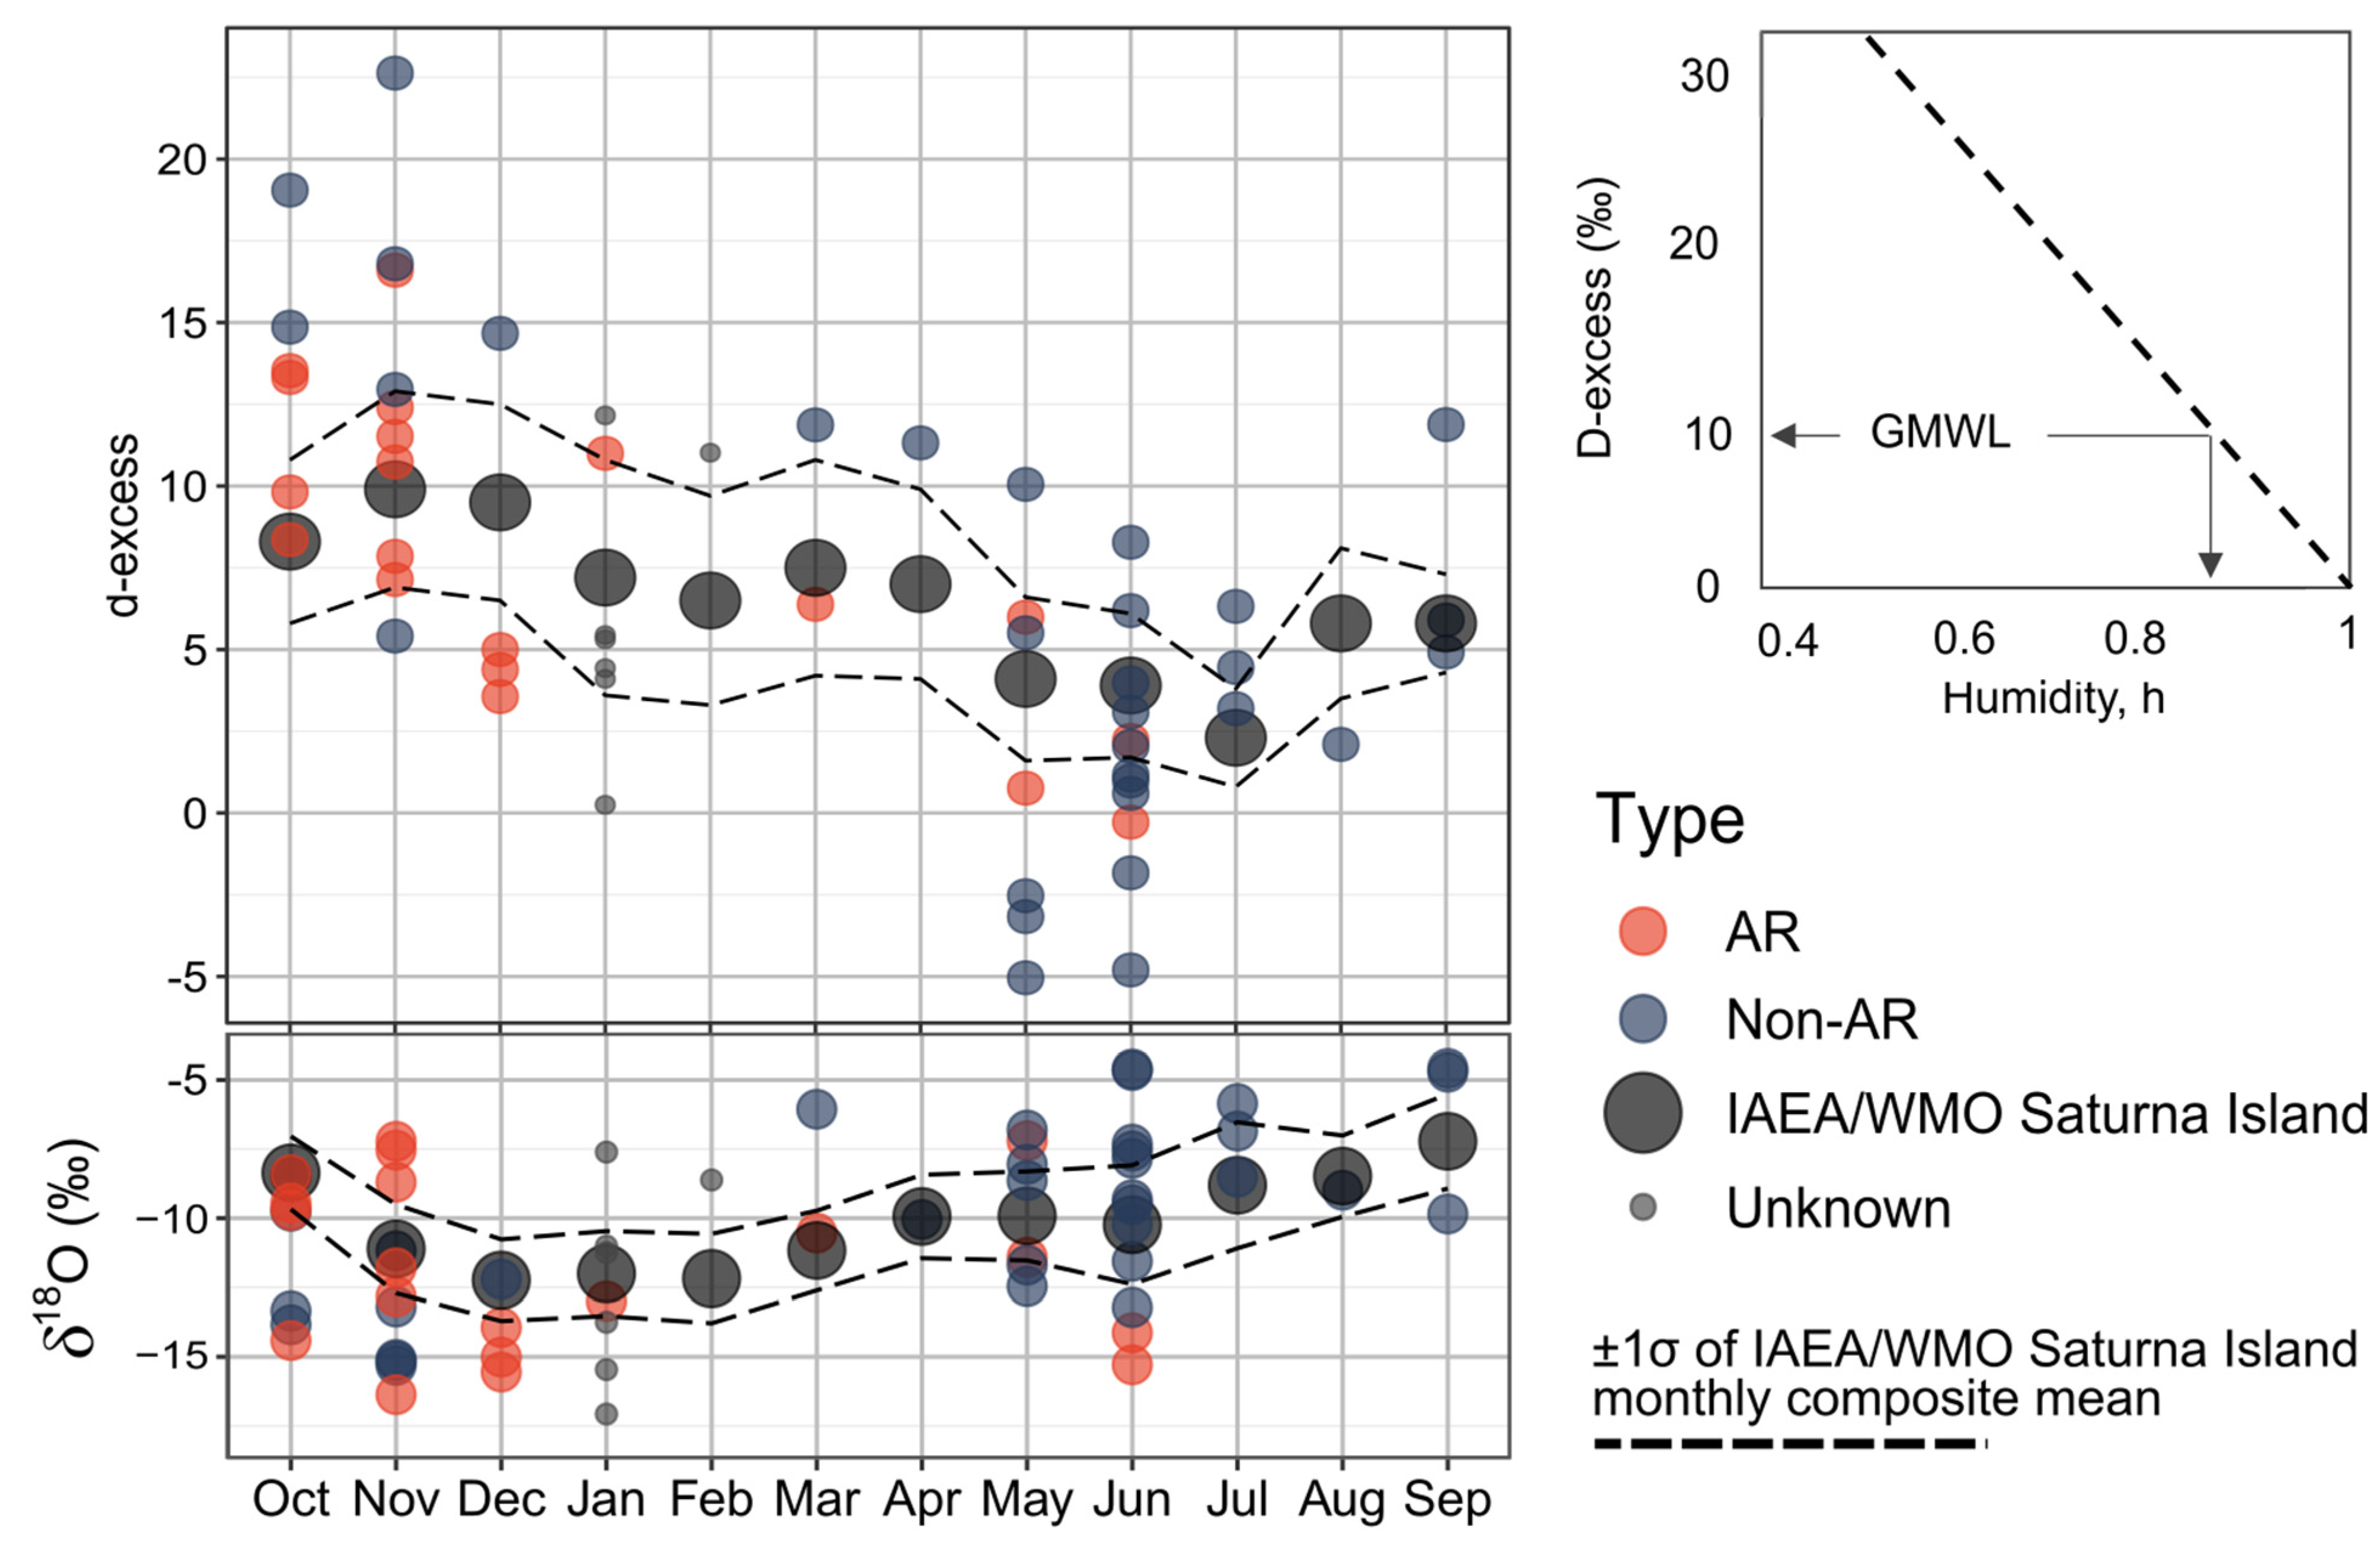
2.5. Deuterium Excess and Stable Isotope Analysis

Deuterium excess (d-excess) is a secondary isotope parameter that can be used as a proxy to constrain moisture sources of precipitation [8]. We use d-excess to verify whether ARs and non-ARs have unique vapour sources and to determine whether those signatures were reflected in the surface water and groundwater samples in a watershed ~40 km inland from the coast. The global average d-excess in precipitation is 10‰ [31] and can be calculated following Equation (1):
d-excess = δ2H − 8·δ18O
D-excess depends on the relative humidity (RH; negative correlation) and SST (positive correlation) at the evaporative source which consequently results in a seasonal distribution [32]. Higher d-excess values occur in winter (November to February) when the RH over the ocean is low, while lower d-excess values occur in summer (May–August) when the atmosphere over the ocean is wetter [33].
Isotopic compositions of the precipitation samples were analyzed on a Picarro® (Santa Clara, California) L2140-i Cavity Ring-Down Spectroscopy analyzer at Simon Fraser University via the Express Method. The United States Geological Survey (USGS) 46 (−29.79 ± 0.03‰ δ18O, −235.00 ± 0.19‰ δ2H, n = 27), 47 (−19.81 ± 0.06‰ δ18O, −151.49 ± 0.30‰ δ2H, n = 27), and 48 (−2.00 ± 0.02‰ δ18O, −1.80 ± 0.19‰ δ2H, n = 27) standards were used for instrument calibration and to account for analytical error. Standards were analyzed every 9–12 samples to account for instrument drift. An aliquot of each rain sample was analyzed 6 times, by extracting 0.5 μL of sample. The first three readings were discarded to eliminate the memory effect and the last three measurements were averaged.

3. Results

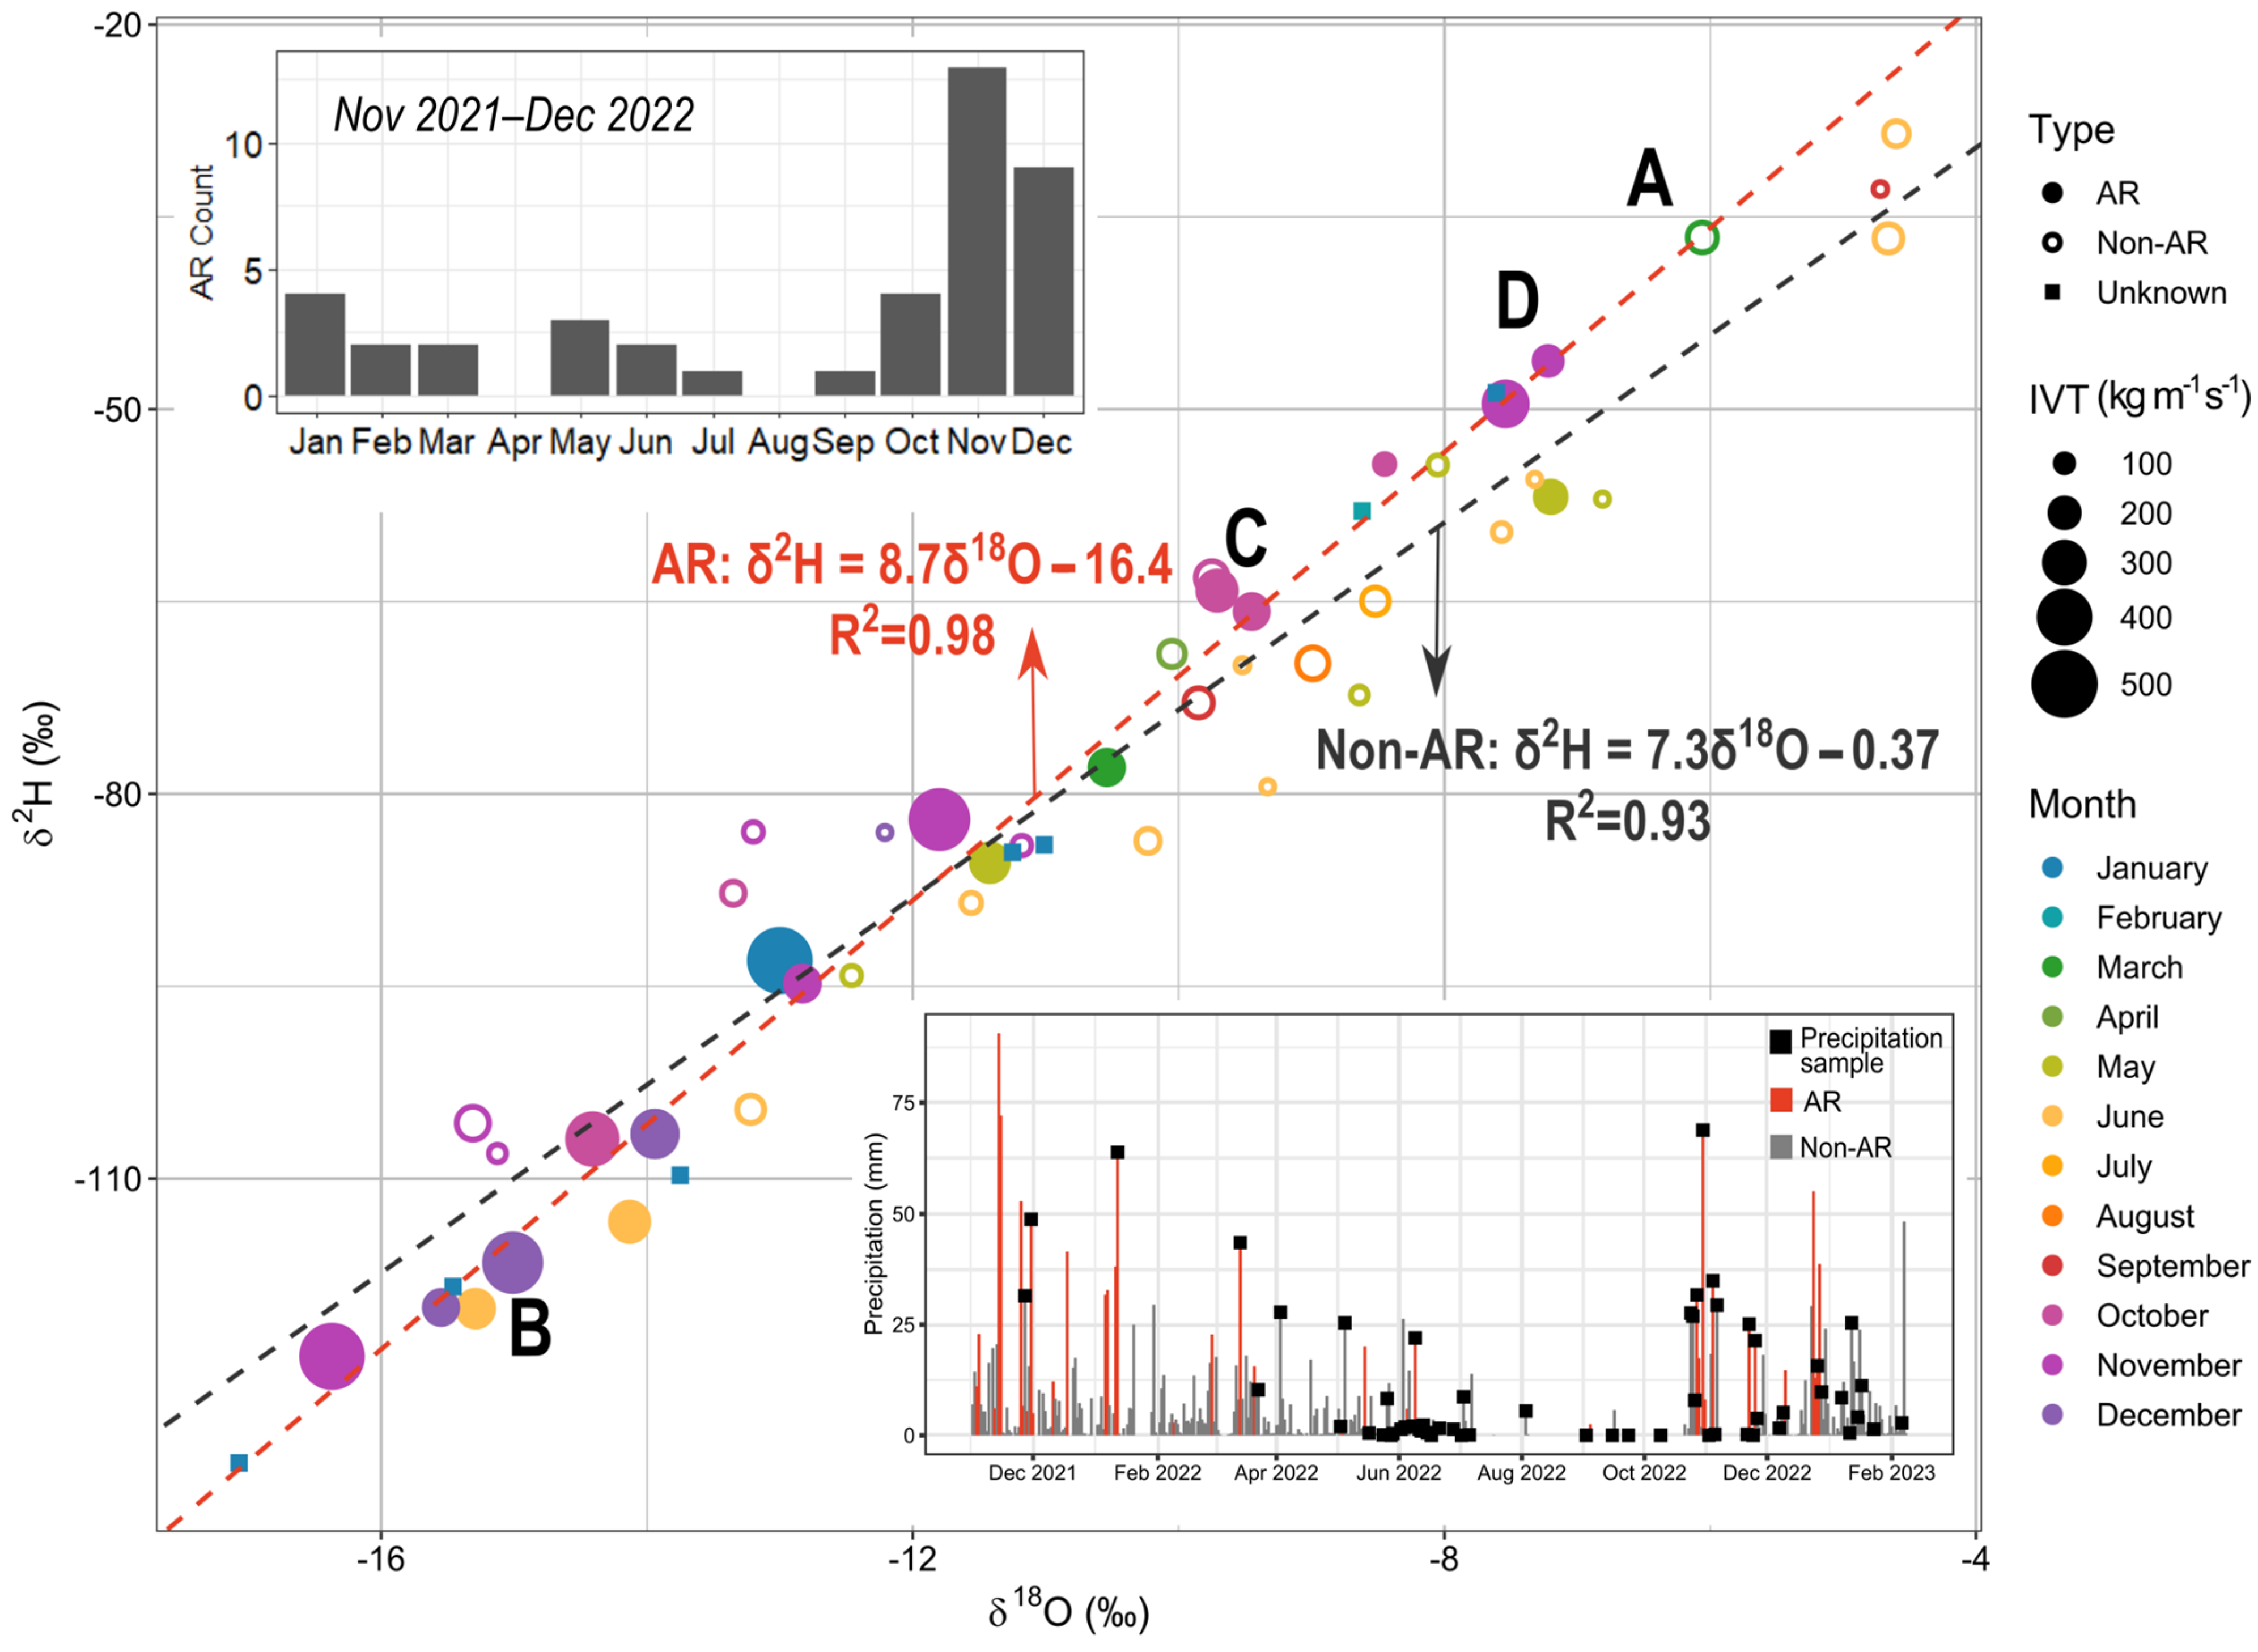
3.1. Isotopic Composition of ARs

Forty-one of the precipitation events between 1 November 2021 and 31 December 2022 were identified as ARs based on the Rutz et al. [21] catalogue, 19 of which were captured for isotopic analysis (Figure 2 lower inset). Thirty of the 41 ARs occurred between October and January and the remaining months experienced between 0 and 3 ARs (Figure 2 upper inset). This aligns with general storm occurrence in BC, which is more common in the fall and winter months (October–March). This pattern is largely due to the greater temperature contrasts in winter between the warmer ocean and cooler landmass, and between the equator and the poles. Seven of the 58 samples were not explicitly classified as ARs or non-ARs because they were collected after the Rutz et al. [21] catalogue ended (31 December 2022).
The slopes of the AR (8.7) and non-AR (7.3) samples are similar to meteoric water line slopes for the same climate and latitude, which range between 6.8 and 8.3 [34]. Slopes are not weighted based on precipitation intensity. The intercepts for the AR and non-AR linear regressions are 16.6‰ and −0.37‰, respectively; the GMWL intercept is ~10‰ (Figure 2). Deviations from 10‰ are typically associated with subcloud evaporation and humidity [32].
LAR isotopic composition was more depleted than non-AR events when comparing δ18O and δ2H values (Table 1). The d-excess of AR-derived precipitation is greater than non-AR precipitation and IAEA/WMO d-excess values but is statistically indistinguishable (Table 1). These results suggest that the moisture source for ARs and non-ARs is similar. We observe higher d-excess in winter compared to summer. Accordingly, the higher d-excess associated with ARs may reflect winter precipitation, which typically has a higher d-excess in the northern hemisphere due to lower relative humidities over the ocean surface [33,35]. Our findings align with typical d-excess values of 8.5‰ observed at 43° N, which range between 6.5‰ and 11‰ as previously identified by Bowen and Revenaugh [36].
Figure 2. Stable isotope composition of precipitation samples collected between November 2021 and February 2023, classified as an AR, non-AR, or unknown. Linear regressions are applied to AR and non-AR samples. Letters are associated with example events described in Section 3.2. Inset (upper): monthly AR count between November 2021 and December 2022. Inset (lower): daily precipitation record between 1 November 2021 and 6 February 2023 from Pitt Meadows Climate Station (Environment Canada Station 1106178) [37] showing AR and non-AR precipitation events and precipitation sample collection days.
Atmosphere 15 00074 g002
D-excess of AR and non-AR precipitation samples were also compared to the Saturna Island monthly average 13-year record (Figure 3). Event-based Saturna Island signatures are not available; therefore, monthly composite averages are reported which ranged between 2.3 ± 0.8‰ and 9.9 ± 3.0‰. AR d-excess ranged between −0.28‰ and −16.6‰ and non-AR d-excess ranged between −5.04‰ and 22.63‰. Approximately half of the AR precipitation samples were plotted within 1σ of the Saturna Island samples, yet only 22% of the non-AR precipitation samples were within 1σ. AR d-excess values are likely more representative of Saturna Island monthly composite d-excess values because a larger proportion of annual precipitation is AR derived, as ARs produce more precipitation than non-AR events. δ18O AR values are also more similar to Saturna Island monthly composite samples during winter months (October–January) compared to summer months (May–June). Conversely, δ18O non-AR precipitation values in May and June are more similar to Saturna Island monthly composite samples compared to AR δ18O values. This suggests that AR precipitation events in winter, the dominant recharge period, rather than large non-AR precipitation events alone, likely have a significant influence on receiving waters in southwest BC. Non-AR d-excess values fall outside the 1σ range possibly due to the difference in precipitation sampling locations (~60 km apart) or differences in the teleconnection phase that was present between 1997 and 2010 (duration of Saturna Island sampling record) compared to this study (2021–2023).
Finally, no correlation was observed between isotopic composition and IVT amount, despite ARs being more isotopically depleted compared to non-ARs and ARs having significantly higher IVT relative to non-ARs (α = 0.01).

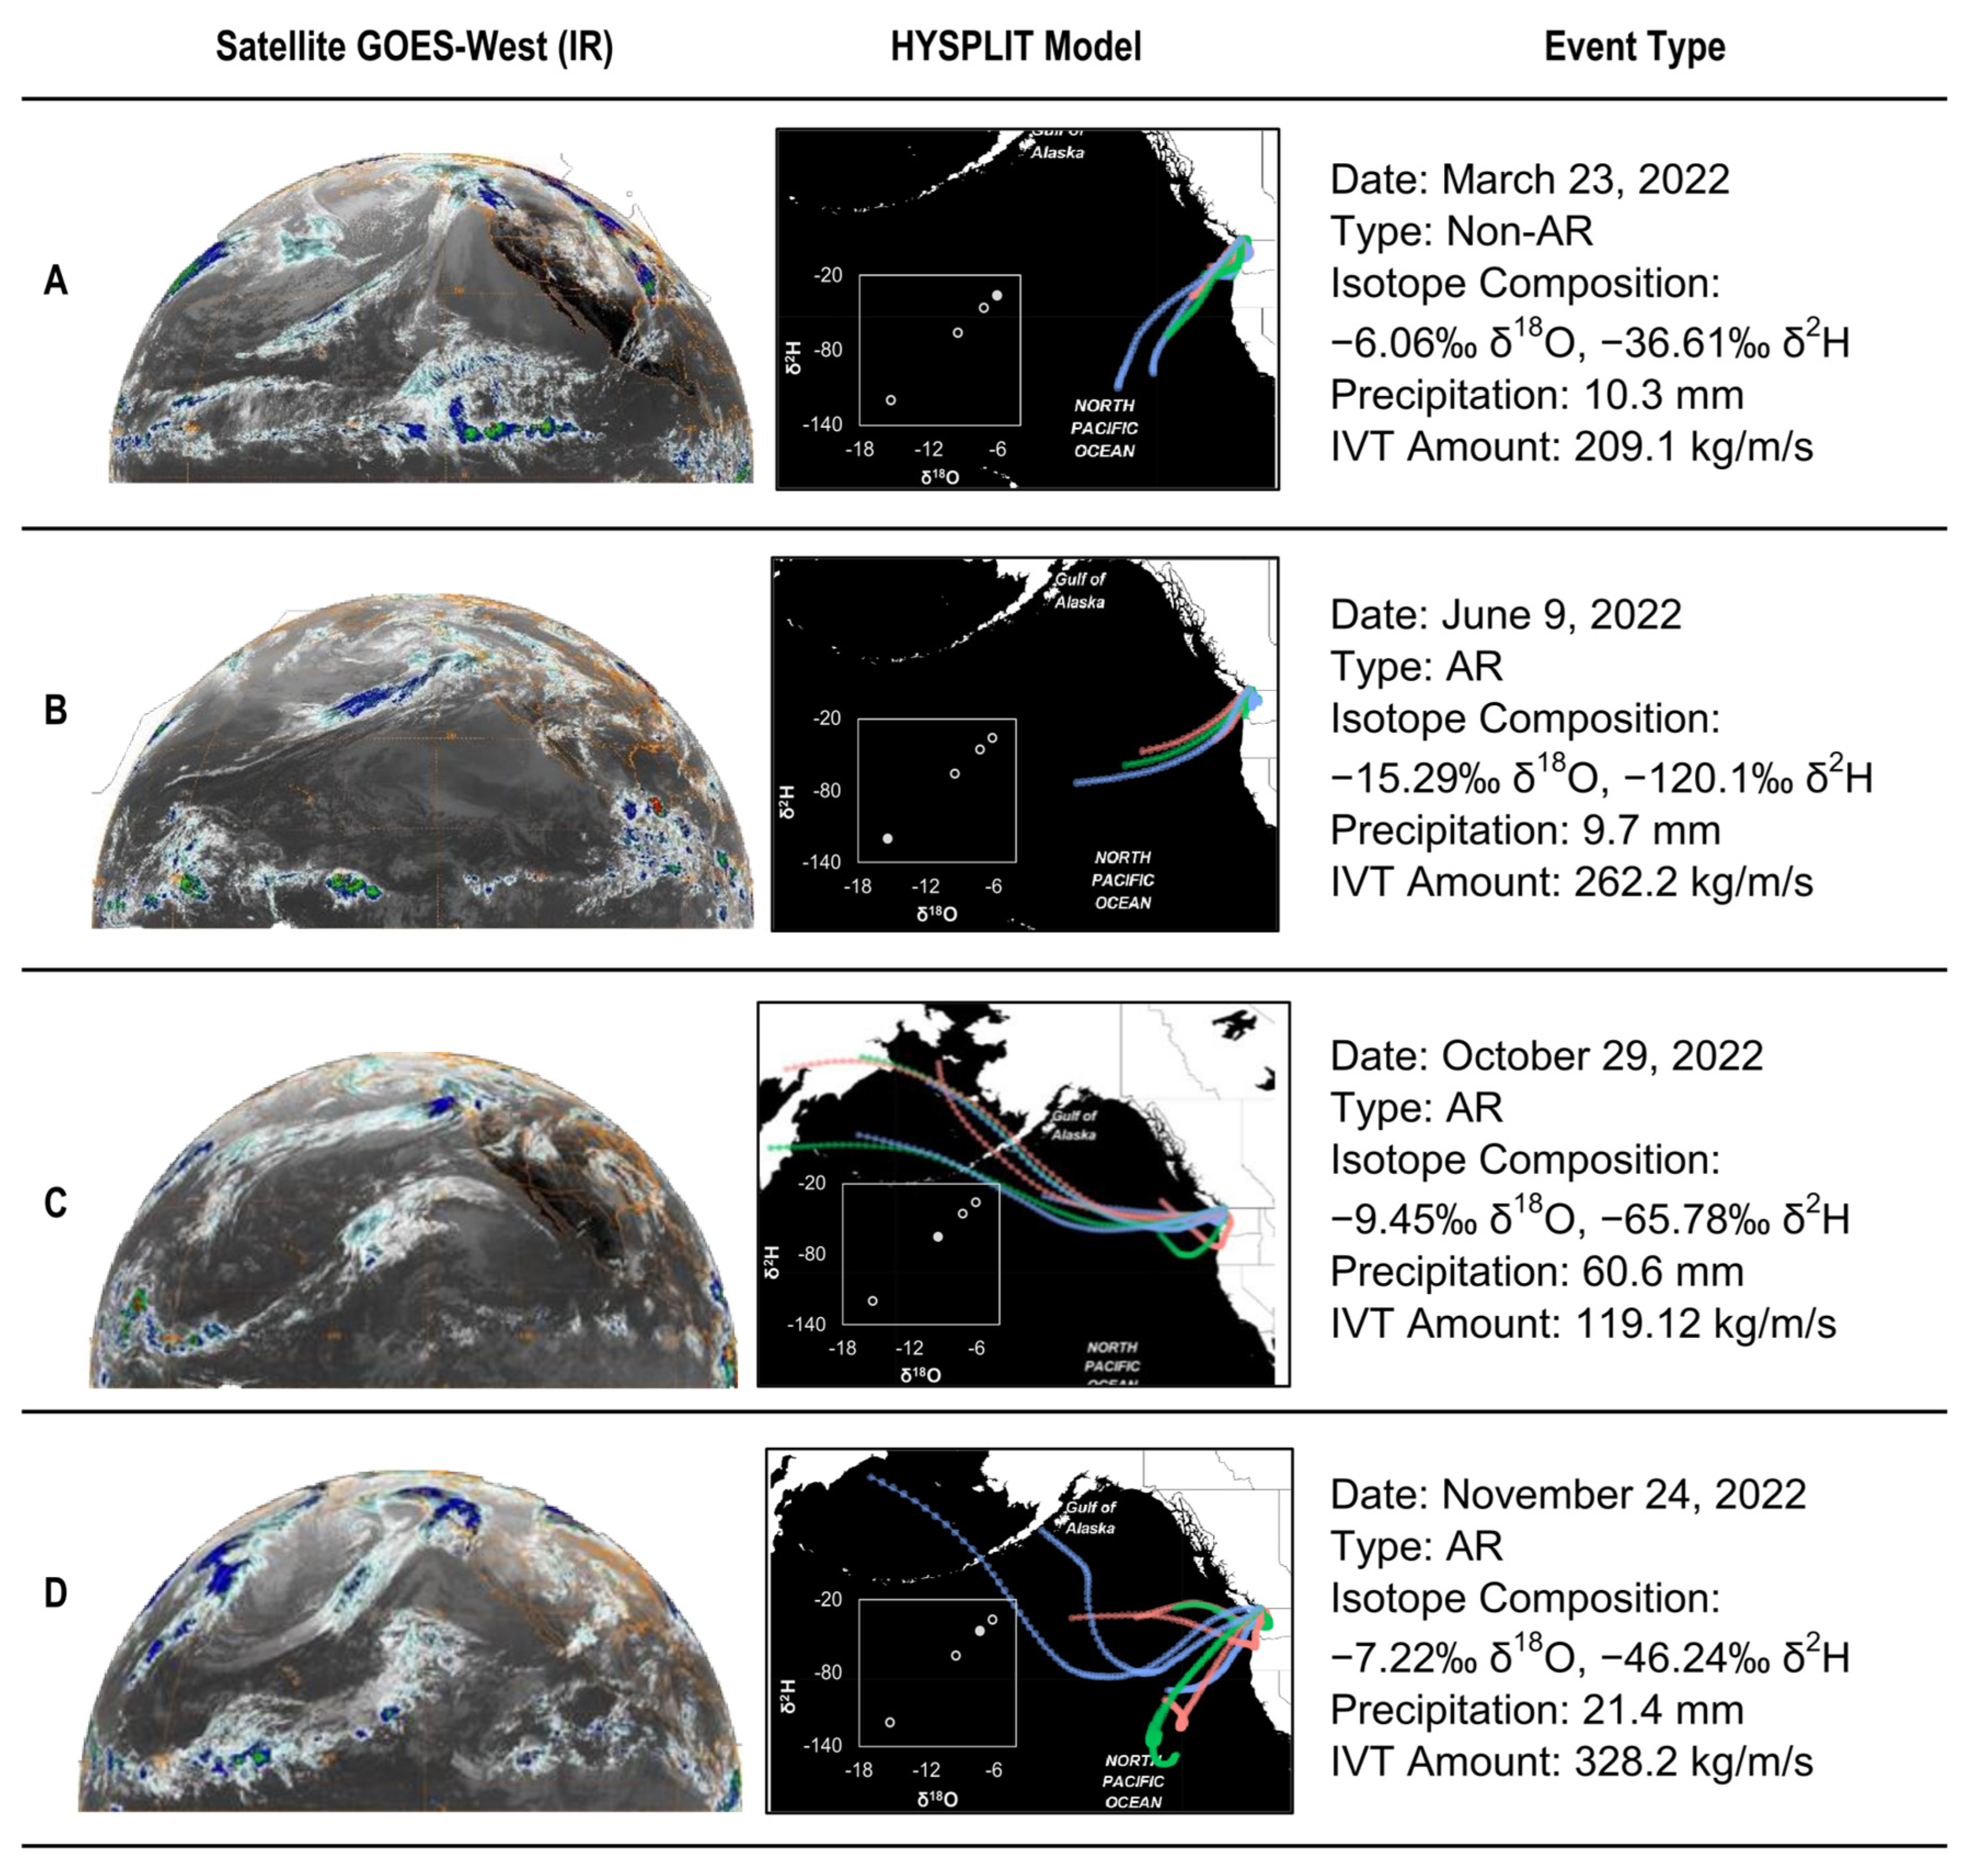
3.2. AR Storm Tracks

AR storm tracks were investigated to discern whether isotopic signatures of AR events were associated with their trajectories. IVT direction for all days between 1 January 2021 and 31 December 2022 was considered to determine if there was a significant difference between air parcel trajectories on AR and non-AR days. AR and non-AR days were determined by the Rutz et al. [21] catalogue. IVT direction was determined by the Hersbach et al. [24] ERA-5 reanalysis catalogue. IVT direction was provided as the IVT amount in a northward ( v ) and eastward vector ( u ) component which was used to determine the storm azimuth (A. Cannon, Environment Canada and Climate Change (ECCC), personal communication). No significant difference was observed between AR (234.6 ± 34.6°) and non-AR (232.2 ± 64.5°) IVT direction, nor was there a significant difference when comparing fall/winter to spring/summer AR IVT direction (p = 0.32). This suggests that most precipitation events, regardless of whether they are classified as an AR or non-AR, are sourced from the southwest. IVT direction, however, was significantly different in fall/winter (238.5 ± 59.1°) and spring/summer (226.5 ± 60.3°) (p = 0.003) for all days, independent of whether they were classified as an AR.
HYSPLIT models revealed that LARs are sourced primarily from the central Pacific, and to a lesser degree, the Gulf of Alaska and Bering Sea (Figure 4; see Supplementary Material, Table S1). In some cases, the trajectories of the precipitation event were uniform in length and azimuth (e.g., 28 November 2021; 12 January 2022; 25 May 2022; 10 December 2022; see Supplementary Material, Table S1); however, other events were observed to have mixed trajectories (e.g., 14 March 2022; 4 May 2022; 27 October 2022; 25 November 2022; see Supplementary Material, Table S1). Most of the trajectories were observed to be sourced in the central and northern Pacific Ocean; however, some shorter length trajectories were sourced over land which was likely not part of the main AR mechanism but would likely influence the resulting isotopic composition. No obvious correlations between storm track azimuth and isotopic composition, nor ground air temperature, were observed. This may be a result of the mixed trajectories (i.e., air parcels sourced from various directions) which would incorporate different air parcels with different isotopic compositions. In addition, seven of the 19 AR events identified over the study period had IVT amounts less than the AR criteria (i.e., 250 kg m−1 s−1), which is due to the data processing methods discussed in Section 2.3. HYSPLIT models, satellite images (GOES-West IR), isotopic compositions, IVT, and precipitation amount and ground air temperature when the sample was collected, are provided for each AR event (n = 19) (Supplementary Material, Table S1). Three examples of ARs and one non-AR event and their isotopic composition and storm tracks are provided in Figure 4, arranged in chronological order. The row letters correspond to the event labeled with the same letter in Figure 2. These events were specifically selected because they occurred in different seasons and are representative of the range of isotopic signatures that were observed throughout the study. Initially, we hypothesized that LARs in southwest BC, commonly sourced from the Hawaiian region (central Pacific), would have an enriched isotopic signature compared to non-AR events and ARs sourced from the northern Pacific. The four examples suggest that neither the isotopic signature nor the seasonality has an obvious linkage to the trajectory, nor to the event type (AR vs. non-AR) in southwest BC. A non-AR event on 23 March 2022 (Figure 4 A) sourced from the central Pacific had one of the most enriched isotopic signatures (>75th percentile) observed throughout the study (−6.06‰ δ18O, −36.61‰ δ2H). Other non-AR events observed throughout the study period also had enriched isotopic signatures relative to AR events which is likely a result of the “amount effect”. The “amount effect” refers to the tendency for the isotopic composition to shift in response to the amount of rainfall which generally reveals that rainfall amount and isotopic composition are negatively correlated [8]. This study did not estimate the amount of precipitation that fell before the precipitation event made landfall. Quantifying this amount using weather radar, numerical weather models, and satellites in future studies may elucidate possible reasons for isotopic variability in ARs. The LAR that occurred on 9 June 2022 (Figure 4B) was sourced from the central Pacific Ocean and had an isotopic composition below the 25th percentile (−15.29‰ δ18O, −120.1‰ δ2H). LARs sourced from the central Pacific Ocean also had isotopic compositions below the 25th percentile (e.g., 12 January 2022; 4 November 2022). This suggests that our hypothesis is not supported, because LARs sourced from the central Pacific Ocean were found to be more depleted compared to other LARs, regardless of whether they fell in the summer (June) or fall/winter (November/January). The two LARs sourced from the Bering Sea/Gulf of Alaska in October and November 2022 (Figure 4C, D, respectively) had isotopic signatures above the 50th (−9.45‰ δ18O, −65.78‰ δ2H) and 75th percentile (−7.22‰ δ18O, −46.24‰ δ2H), respectively. Despite both events having trajectories sourced from the northern Pacific Ocean, most of the trajectories associated with the November event are predominantly sourced from further south, near the central Pacific.
This could suggest that the heavier isotopologues observed in the November event are attributed to a latitudinal difference and potentially warmer SSTs relative to the October event. Alternatively, unaccounted for rain-out effects prior to landfall may have altered the isotopic composition.

3.3. Isotope Application to Groundwater and Surface Water

The d-excess values of precipitation followed a seasonal pattern that generally resembled the Saturna Island values (Figure 5). Winter d-excess values were higher (mean = 10.13 ± 5.10‰) compared to summer values (mean = 2.77 ± 4.27‰). The d-excess data can be broadly organized into three main sections (A, B, C). In Section A (November 2021–February 2022), three precipitation events had a d-excess signature above the monthly average. These samples are associated with ARs that were sourced from the central Pacific Ocean, where RH is typically lower, resulting in higher d-excess, compared to the northeastern Pacific [38] (Supplementary Material, Table S1). The elevated d-excess values are also reflected in the main stem and tributary samples, suggesting a rapid response to precipitation events. In Section B (March 2022–September 2022), the main stem and tributary samples were generally above the Saturna Island average, while the precipitation samples were similar to, or below, the Saturna Island average. This suggests that the surface waters between spring and fall reflect winter precipitation composition. Interestingly, summer ARs were generally below the Saturna Island average which may be attributed to their storm track migration through the northern/central Pacific Ocean, as RH increases northwards along the Pacific Ocean (Supplementary Material, Table S1). Lastly, in Section C (October 2022–December 2022), the precipitation values reflected the Saturna Island average, but the d-excess surface water values were below the Saturna Island average. In addition, winter AR precipitation in 2022 was lower compared to AR winter precipitation in 2021 (Section A). The d-excess values suggest that surface waters near the beginning of the water year are more similar to summer precipitation values. ARs in Section C have a wide d-excess signature range (3.6–13.5‰), compared to Sections A and B. The HYSPLIT model storm tracks and satellite imagery during this period clearly show that ARs with higher d-excess values are sourced from the central Pacific, whereas lower d-excess values have mixed storm tracks (see Supplementary Material, Table S1). The groundwater d-excess signature was similar to the d-excess of precipitation during the primary recharge months, November through March, rather than the Saturna Island monthly average, or summer precipitation. A similar narrative is shown by the δ18O signature of precipitation, surface water, and groundwater samples in the middle panel of Figure 5. Summer surface waters were more depleted relative to Saturna Island precipitation samples, and therefore more similar to winter precipitation. Median winter precipitation values were more similar to median summer surface waters (−12.0‰, −11.5‰, respectively) compared to median summer precipitation and median winter surface water values (−8.6‰, −10.4‰, respectively) (Figure 5, boxplot). In general, surface water samples were observed to have a damped isotopic variability compared to precipitation values, suggesting that surface waters are a mixture of summer, snowmelt, water from storage, and largely winter precipitation as shown by similar seasonal δ18O median and d-excess values (Figure 5, boxplot).

4. Discussion

4.1. Isotopic Composition of LARs and Non-AR Events

We found that δ18O and δ2H average values of landfalling ARs (LARs) were only slightly more depleted (−11.71‰ δ18O, −85.80‰ δ2H) compared to non-AR average values (−9.47‰ δ18O, −69.58‰ δ2H). Coplen et al. [40] also observed lower δ2H LAR averages compared to non-AR extratropical cyclones (−92.8‰ δ2H, n = 15, −65.2‰ δ2H, n = 16, respectively) based on four sites in Northern California. Two of the sites with δ2H values < −105‰ were classified as ARs. They inferred that ARs did not have significantly lower δ2H values, compared to non-ARs, because the most intense part of the storm did not intersect with their sampling station. This could explain why ARs did not consistently have more depleted isotopic signatures compared to non-ARs in our study. Coplen et al. [40] attributed the lower δ2H values of AR events to an interference with deeper layer cold clouds associated with “higher rainout” periods compared to the higher δ2H values of non-ARs, which are associated with shallower layer, warmer clouds, and “lower rainout” periods [41]. Intra-storm isotopic composition may also have large variability caused by differences in the origin and rainout history of the air parcel [16,42,43]. Commonly, the δ18O signature varies throughout the rain event, with the most depleted values being associated with the most intense portion of the event and the passage of the frontal system [44]. For example, a total decrease of 51‰ δ2H was observed within a 60-min period of an extratropical cyclone, which was attributed to large changes in isotopic composition due to cloud height (temperature of condensation) [41]. Our depleted isotopic AR values may also be attributed to the cooler SSTs over the North Pacific region during the study period, evidenced by the La Niña and negative Pacific Decadal Oscillation (PDO) phase during which the samples were collected. We attribute the lack of a significant difference in isotopic composition between ARs and non-ARs primarily to the mixing of storm tracks, as well as microphysical atmospheric processes that influence the isotopic signature of moisture parcels throughout transport.

4.2. LAR Isotopic Composition and Storm Track Trajectories

The AR events observed during the study period (n = 19) were sourced from the northern and central Pacific Oceans, or a mixture of both. In some instances, the HYSPLIT model storm tracks were quite complex (e.g., 27 October 2022, 25 November 2022; see Supplementary Material, Table S1) and included moisture parcels from various directions, which is likely the reason why no patterns in isotopic compositions were observed. Storm tracks of other ARs were observed to have moisture sourced from a more specific location (e.g., 9 June 2022, 24 May 2022; see Supplementary Material, Table S1). Some studies have shown that air parcel mixing may be related to the teleconnection phase that is present when the AR forms. For example, during neutral El Niño Southern Oscillation (ENSO) phases, ARs reach the North American western coastline directly from the tropics and migrate poleward. During the El Niño phase of ENSO, however, direct transport from the tropics is least probable [7]. Neutral ENSO phases were not present throughout the study period, which may be one of the reasons why indirect moisture transport and mixed air parcels were commonly observed in the HYSPLIT models. To our knowledge, there are no studies of transport patterns of ARs during La Niña, the phase of ENSO that was present throughout this study. Based on our results, we hypothesize that the AR trajectories are likely influenced by air parcels originating in the extratropics, ambient air, or the integration of new parcels with unique isotopic compositions into the main transport mechanism.
Another possible reason to explain the lack of distinction in the isotopic composition of ARs and non-ARs is that the trajectory, strength, and resulting latitude of landfall of an AR corresponds to a variety of factors: the temperature gradient between the pole and the equator affects the position and amplitude of the upper-level atmospheric flow [7,12,45] and the strength of the geopotential height anomalies that create a ridge over North America’s Pacific coast [46]. Variations in the transport height of the moisture parcel and temperature gradients, which are challenging to track throughout a precipitation event, will ultimately have an impact on isotopic composition. Additionally, apart from Rayleigh distillation, micro-scale processes have also been found to have a significant impact on stable isotope signatures throughout the transport of a moisture parcel [40,42,44,47]. These micro-scale processes include but are not limited to: below cloud evaporation, seeder-feeder mechanisms, equilibrium isotope effects, and post-condensation processes. For example, below cloud evaporation has been observed to influence the isotopic composition within a single event which is dependent on droplet size, rain rate, and relative humidity [43,48]. Future studies investigating AR isotopic composition and their trajectories would benefit from more frequent sampling throughout the event in conjunction with more detailed satellite data such as Special Sensor Microwave Imager/Sounder (SSMIS). Isotope data may be integrated into isotope-enabled regional climate models [48,49] to provide information on moisture transport and improve water balance estimates in catchments.
The lack of differences in moisture sources between ARs and non-ARs is also supported by their d-excess signatures. The d-excess signatures generally remain constant throughout transport, and therefore are often used to determine the initial source and moisture conditions [50]. The d-excess values were observed to be statistically similar between AR and non-AR events which may suggest that the moisture sources are not easily distinguished between either type of precipitation event, but that the track the storm takes may differ significantly.
Lastly, the backward trajectory modeling based on the HYSPLIT model can be sensitive to initial conditions. Particles released at slightly different times may result in very different trajectories from the true AR trajectory which makes it even more challenging to identify patterns between storm tracks and isotopic composition. In addition, HYSPLIT does not provide detailed accounts of each storm event, but rather large-scale synoptic patterns. In the future, we suggest using HYSPLIT for similar studies but recommend running longer simulations (>72 h) and investigating the simulated RH values and other meteorological data output throughout the trajectory. We also recommend comparing the results with other Lagrangian-type models or other water vapour tracers to better constrain AR trajectory behavior and to avoid overreliance on specific models.

4.3. Contribution of AR-Derived Precipitation to Watershed Waters

AR d-excess values reflected their storm track trajectories likely due to the RH associated with their vapour source. Winter ARs, which were observed to have higher d-excess, were generally transported via the central Pacific, while summer ARs, which expressed lower d-excess values, featured storm tracks transported via the northern Pacific. During the winter of 2022 (Figure 5; Section C), AR d-excess values were lower relative to AR d-excess values in winter of 2021 (Figure 5; Section A). We cautiously attribute the difference in winter d-excess to PE storm occurrence. PE storms tend to exhibit a more enriched δ18O signature relative to non-PE storms. As shown in the middle panel of Figure 5, δ18O signatures were more enriched compared to winter 2022 δ18O values. This inference is further supported by the storm trajectories which were observed to originate in the Hawaiian region in winter of 2021 but were more mixed in winter of 2022. We also note that we had more data in winter of 2022, which may be a more representative distribution of possible winter d-excess values in the study region. Nevertheless, we observed a seasonal distribution in the d-excess values of precipitation (AR and non-AR derived) which generally resembles the Saturna Island average. The d-excess values suggest that winter precipitation is reflected in winter surface waters, more so than during the summer months. In the summer season (May to September), d-excess surface water values deviate from summer precipitation d-excess values. Precipitation samples were collected in the valley bottom, rather than at high elevation in the catchment (see Figure 1). Precipitation at high elevation likely has a different isotopic composition due to an elevation effect. Moreover, the catchment receives a larger percentage of precipitation as snow. The release of meltwater feeds the main river and its tributaries well into the summer (freshet period), thus explaining the higher d-excess of the surface water samples compared to summer precipitation.
An additional consideration is that, although d-excess is generally considered a useful parameter to determine the moisture conditions at the source of evaporation [51,52], evaporative enrichment can significantly impact the d-excess signature of water in the near-surface environment [53]. When water undergoes evaporation, isotopic fractionation causes the remaining water to become more enriched in the heavier isotopes and d-excess tends to increase due to the preferential removal of the lighter isotopes [53], thus compromising the reliability of d-excess as a proxy of vapour source regions.
For future studies, we suggest more endmember (groundwater, snowmelt, soil water) sampling to better constrain stream water sources. In addition, surface water, groundwater, and precipitation samples should be collected at high-frequency time intervals to determine how signatures change temporally, as well as precipitation and groundwater samples at incremental elevations to better understand how they vary spatially throughout the watershed.
In general, ARs have been observed to produce higher runoff compared to non-AR events via higher precipitation rates and enhanced rain-on-snow events [6,46]. Understanding the timing and sources of surface water replenishment and groundwater recharge, as determined by isotopic signatures and field observations, may be useful for water resource allocation and managers, specifically in agricultural settings, where water demand is high during minimal recharge periods. If LARs become more frequent during historically low recharge periods, groundwater and surface water resources may be partially replenished, ultimately alleviating water resource challenges associated with drought.
Since 1980, AR frequency has fluctuated but has generally revealed a slightly increasing trend along the North American western coastline [21,54]. Some climate models predict ARs to increase in intensity and/or duration due to the increased atmospheric moisture as a result of a warming climate [12,55,56]. Other studies, however, have predicted that AR frequency will decrease due to the slower low-level winds, and a weaker equator-to-pole temperature gradient, amplifying the waviness of the jet streams [57,58]. Clearly, these findings suggest inconsistencies in our understanding and forecasting ability of future AR behavior. Notwithstanding, the recent occurrence of intense ARs in Lower Mainland, BC prompted the provincial government to establish a “Climate Preparedness and Adaptation Strategy” which includes increasing our understanding of extreme climate events through improved data collection and monitoring of ARs and water resources. We recommend conducting similar studies in other geographic regions impacted by ARs, as our study was the first of its kind, which signifies that our results are not definitive.

5. Conclusions

Fifty-eight precipitation samples were collected between November 2021 and February 2023; 19 were classified as ARs based on MERRA-2 reanalysis data [21]. We observed that ARs were isotopically depleted compared to non-ARs (−11.71‰ δ18O, −85.80‰ δ2H; −9.47‰ δ18O, −69.58‰ δ2H, respectively). Practically, however, this difference in isotopic composition is likely not large enough to distinguish the contribution of AR versus non-AR precipitation to receiving waters in a watershed, and further suggests that the use of fossil isotope records may not be useful to infer trends about past AR climatology.
We hypothesized that the isotopic composition of ARs would reflect their storm trajectories; however, AR isotopic signatures were not correlated to their respective storm tracks. We attributed the lack of correlation to the mixing of air parcels throughout moisture transport, which was supported by HSYPLIT models and satellite imagery. Mixing of air parcels throughout AR transport was further supported by statistically similar AR and non-AR d-excess values (7.9‰ and 6.2‰, respectively) which suggests that moisture sources for each event type are indistinguishable. Specifically, AR d-excess values were observed to be lower when storm tracks were sourced from the central Pacific, and higher when storm tracks migrated via the northern Pacific. Microphysical atmospheric processes such as below cloud evaporation, relative humidity, droplet size, and kinetic effects also influence the isotopic composition of a moisture parcel throughout transport.
D-excess was useful for exploring seasonal variations in local waters and precipitation, which generally aligned with longer record averages from Saturna Island. The d-excess values suggest that winter surface waters are largely replenished by winter precipitation and summer surface waters are replenished by winter precipitation from higher elevation. Surface waters responded more quickly to precipitation events in the winter but lagged precipitation in the summer months. Future studies would benefit from collecting endmember and stream water samples at high frequency time intervals throughout each storm event and systematically exploring the spatial patterns of precipitation input across the elevation gradients in the watershed.
Finally, despite the study region covering a small geographic area relative to the AR-impacted region, the methodologies used in this study can be easily applied to other watersheds impacted by ARs. This is largely due to the availability of stable isotope records (IAEA/GNIP WISER database), open access AR catalogues included in the Atmospheric River Tracking Method Intercomparison Project (ARTMIP), and open access HYSPLIT modeling program and archived satellite data.

Supplementary Materials

The following supporting information can be downloaded at: https://www.mdpi.com/article/10.3390/atmos15010074/s1. Table S1: Satellite Imagery, Trajectory Models, and Isotopic Composition of Sampled AR Events.

Author Contributions

Conceptualization and methodology, A.T.G., D.M.A. and W.J.H.; software, validation, formal analysis, investigation, data curation, visualization, writing—original draft preparation, A.T.G.; project administration, writing—review and editing, supervision, funding acquisition, D.M.A. and W.J.H. All authors have read and agreed to the published version of the manuscript.

Funding

This research was funded by the Pacific Institute for Climate Solutions—Opportunity Project Program (OP21DA) to D.M.A and W.J.H., a Natural Sciences and Engineering Research Council of Canada Discovery Grant to D.M.A, and a Canadian Foundation for Innovation—British Columbia Knowledge Development fund grant (40787) to W.J.H.

Institutional Review Board Statement

Not applicable.

Informed Consent Statement

Not applicable.

Data Availability Statement

The data presented in this study are openly available in CUAHSI HydroShare at https://doi.org/10.4211/hs.1d5bbf7f88cb484e892ac9d97523d63c.

Acknowledgments

We would like to thank Alex Nott and Laura Mackey for help in compiling the AR dataset and other lab members for help with field sample collection. We would also like to thank the reviewers and editors for their suggestions and comments towards the improvement of the manuscript.

Conflicts of Interest

The authors declare no conflicts of interest. The funders had no role in the design of the study; in the collection, analyses, or interpretation of data; in the writing of the manuscript; or in the decision to publish the results.

Abbreviation

ARAtmospheric River
BCBritish Columbia
d-excessDeuterium-excess
ECCCEnvironment and Climate Change Canada
ENSOEl Niño Southern Oscillation
ERAEuropean Centre for Medium-Range Weather Forecasts (ECMWF) Re-Analysis
GDASGlobal Data Assimilation System
GMWLGlobal Meteoric Water Line
GNIPGlobal Network of Isotopes in Precipitation
GOESGeostationary Operational Environmental Satellites
HYSPLIT Hybrid Single-Particle Lagrangian Integrated Trajectory
IAEAInternational Atomic Energy Agency
IRInfrared
IVTIntegrated Vapour Transport
LARLandfalling Atmospheric River
maslmetres above sea level
MERRA-2Modern-Era Retrospective Analysis for Research and Applications—Version 2
NASANational Aeronautics and Space Administration
NOAANational Oceanic and Atmospheric Administration
PDOPacific Decadal Oscillation
PEPineapple Express
RHRelative Humidity
SSTSea Surface Temperature
USGSUnited States Geological Survey
UTCCoordinated Universal Time
WISERWater Isotope System for Data Analysis, Visualization, and Electronic Retrieval
WMOWorld Meteorological Organization
δ18O δ O 18 = O 18 O 16 s a m p l e O 18 O 16 s t a n d a r d 1 × 1000
δ2H δ H 2 = H 2 H 1 s a m p l e H 2 H 1 s t a n d a r d 1 × 1000

References

  1. Zhu, Y.; Newell, R.E. A Proposed Algorithm for Moisture Fluxes from Atmospheric Rivers. Mon. Weather Rev. 1998, 126, 725–735. [Google Scholar] [CrossRef]
  2. Neiman, P.J.; Ralph, F.M.; Wick, G.A.; Lundquist, J.D.; Dettinger, M.D. Meteorological Characteristics and Overland Precipitation Impacts of Atmospheric Rivers Affecting the West Coast of North America Based on Eight Years of SSM/I Satellite Observations. J. Hydrometeorol. 2008, 9, 22–47. [Google Scholar] [CrossRef]
  3. Dettinger, M.D.; Ralph, F.M.; Das, T.; Neiman, P.J.; Cayan, D.R. Atmospheric Rivers, Floods and the Water Resources of California. Water 2011, 3, 445–478. [Google Scholar] [CrossRef]
  4. Waliser, D.; Guan, B. Extreme Winds and Precipitation during Landfall of Atmospheric Rivers. Nat. Geosci. 2017, 10, 179–183. [Google Scholar] [CrossRef]
  5. Gershunov, A.; Shulgina, T.; Clemesha, R.E.S.; Guirguis, K.; Pierce, D.W.; Dettinger, M.D.; Lavers, D.A.; Cayan, D.R.; Polade, S.D.; Kalansky, J.; et al. Precipitation Regime Change in Western North America: The Role of Atmospheric Rivers. Sci. Rep. 2019, 9, 9944. [Google Scholar] [CrossRef] [PubMed]
  6. Gillett, N.P.; Cannon, A.J.; Malinina, E.; Schnorbus, M.; Anslow, F.; Sun, Q.; Kirchmeier-Young, M.; Zwiers, F.; Seiler, C.; Zhang, X.; et al. Human Influence on the 2021 British Columbia Floods. Weather Clim Extrem 2022, 36, 100441. [Google Scholar] [CrossRef]
  7. Bao, J.-W.; Michelson, S.A.; Neiman, P.J.; Ralph, F.M.; Wilczak, J.M. Interpretation of Enhanced Integrated Water Vapor Bands Associated with Extratropical Cyclones: Their Formation and Connection to Tropical Moisture. Mon. Weather Rev. 2006, 134, 1063–1080. [Google Scholar] [CrossRef]
  8. Dansgaard, W. Stable Isotopes in Precipitation. Tellus 1964, 16, 436–468. [Google Scholar] [CrossRef]
  9. Clark, I.; Fritz, P. Environmental Isotopes in Hydrogeology; CRC Press: Boca Raton, FL, USA; Taylor & Francis Group: Hoboken, NJ, USA, 1997. [Google Scholar]
  10. Lawrence, J.; Gedzelman, S.; White, J.; Smiley, D.; Lazov, P. Storm Trajectories in Eastern US D/H Isotopic Composition of Precipitation. Nature 1982, 296, 638–640. [Google Scholar] [CrossRef]
  11. Fritz, P.; Drimmie, R.J.; Frape, S.K.; O’Shea, O. The Isotopic Composition of Precipitation in Groundwater in Canada. In Proceedings of the International Symposium on the Use of Isotope Techniques in Water Resources Development, Vienna, Austria, 30 Mar–3 April 1987; pp. 539–550. [Google Scholar]
  12. Dettinger, M. Climate Change, Atmospheric Rivers, and Floods in California—A Multimodel Analysis of Storm Frequency and Magnitude Changes. J. Am. Water Resour. Assoc. 2011, 47, 514–523. [Google Scholar] [CrossRef]
  13. Ralph, F.M.; Neiman, P.J.; Wick, G.A. Satellite and CALJET Aircraft Observations of Atmospheric Rivers over the Eastern North Pacific Ocean during the Winter of 1997/98. Mon. Weather Rev. 2004, 132, 1721–1745. [Google Scholar] [CrossRef]
  14. Dettinger, M. Fifty-Two Years of “Pineapple Express” Storms Across the West Coast of North America; PIER Energy-Related Environmental Research; CEC-500-2005-004; U.S. Geological Survey, Scripps Institution of Oceanography for the California Energy Commission: La Jolla, CA, USA, 2004.
  15. Mo, R.; Lin, H.; Vitart, F. An Anomalous Warm-Season Trans-Pacific Atmospheric River Linked to the 2021 Western North America Heatwave. Commun. Earth Environ. 2022, 3, 127. [Google Scholar] [CrossRef]
  16. Rozanski, K. Deuterium and Oxygen-18 in European Groundwaters—Links to Atmospheric Circulation in the Past. Chem. Geol. Isot. Geosci. Sect. 1985, 52, 349–363. [Google Scholar] [CrossRef]
  17. Spry, C.M.; Kohfeld, K.E.; Allen, D.M.; Dunkley, D.; Lertzman, K. Characterizing Pineapple Express Storms in the Lower Mainland of British Columbia, Canada. Can. Water Resour. J. 2014, 39, 302–323. [Google Scholar] [CrossRef]
  18. Friedman, I.; Machta, L.; Soller, R. Water-Vapor Exchange between a Water Droplet and Its Environment. J. Geophys. Res. 1962, 67, 2761–2766. [Google Scholar] [CrossRef]
  19. Boutt, D.F.; Mabee, S.B.; Yu, Q. Multiyear Increase in the Stable Isotopic Composition of Stream Water from Groundwater Recharge Due to Extreme Precipitation. Geophys. Res. Lett. 2019, 46, 5323–5330. [Google Scholar] [CrossRef]
  20. IAEA/WMO. Global Network of Isotopes in Precipitation. GNIP Database. Available online: https://www.iaea.org/services/networks/gnip (accessed on 3 March 2022).
  21. Rutz, J.J.; James Steenburgh, W.; Martin Ralph, F. Climatological Characteristics of Atmospheric Rivers and Their Inland Penetration over the Western United States. Mon. Weather Rev. 2014, 142, 905–921. [Google Scholar] [CrossRef]
  22. Draxler, R.R.; Hess, G.D. An Overview of the HYSPLIT_4 Modelling System for Trajectories, Dispersion, and Deposition. Aust. Meteorol. Mag. 1998, 47, 295–308. [Google Scholar]
  23. Stein, A.F.; Draxler, R.R.; Rolph, G.D.; Stunder, B.J.B.; Cohen, M.D.; Ngan, F. Noaa’s Hysplit Atmospheric Transport and Dispersion Modeling System. Bull. Am. Meteorol. Soc. 2015, 96, 2059–2077. [Google Scholar] [CrossRef]
  24. Hersbach, H.; Bell, B.; Berrisford, P.; Hirahara, S.; Horányi, A.; Muñoz-Sabater, J.; Nicolas, J.; Peubey, C.; Radu, R.; Schepers, D.; et al. The ERA5 Global Reanalysis. Q. J. R. Meteorol. Soc. 2020, 146, 1999–2049. [Google Scholar] [CrossRef]
  25. Knapp, K.R. Scientific Data Stewardship of International Satellite Cloud Climatology Project B1 Global Geostationary Observations. J. Appl. Remote Sens. 2008, 2, 023548. [Google Scholar] [CrossRef]
  26. Brimelow, J.C.; Reuter, G.W. Transport of Atmospheric Moisture during Three Extreme Rainfall Events over the Mackenzie River Basin. J. Hydrometeorol. 2005, 6, 423–440. [Google Scholar] [CrossRef]
  27. Gustafsson, M.; Rayner, D.; Chen, D. Extreme Rainfall Events in Southern Sweden: Where Does the Moisture Come From? Tellus Ser. A Dyn. Meteorol. Oceanogr. 2010, 62, 605–616. [Google Scholar] [CrossRef]
  28. Oster, J.L.; Montañez, I.P.; Kelley, N.P. Response of a Modern Cave System to Large Seasonal Precipitation Variability. Geochim. Cosmochim. Acta 2012, 91, 92–108. [Google Scholar] [CrossRef]
  29. Global Data Assimilation System (GDAS) 1-Degree Operation System, Which Is Integrated into NOAA’s Air Resource Laboratory Online System. Available online: https://www.ncei.noaa.gov/access/metadata/landing-page/bin/iso?id=gov.noaa.ncdc:C00379 (accessed on 15 August 2023).
  30. Iannone, R. SplitR 2016. Use of HYSPLIT within RStudio. R Version 4.3.1; GitHub: San Francisco, CA, USA. [CrossRef]
  31. Craig, H.; Gordon, L. Deuterium and Oxygen-18 Variation in the Ocean and the Marine Atmosphere. In Proceedings of a Conference on Stable Isotopes in Oceanographic Studies and Paleotemperatures; Tongiorgi, E., Ed.; Consiglio Nazionale delle Ricerche: Pisa, Italy, 1965; pp. 9–130. [Google Scholar]
  32. Merlivat, L.; Jouzel, J. Global Climatic Interpretation of the Deuterium-Oxygen 16 Relationship for Precipitation. J. Geophys. Res. 1979, 84, 5029–5033. [Google Scholar] [CrossRef]
  33. Gat, J.R. Oxygen and Hydrogen Isotopes in the Hydrologic Cycle. Annu. Rev. Earth Planet. Sci. 1996, 24, 225–262. [Google Scholar] [CrossRef]
  34. Putman, A.L.; Fiorella, R.P.; Bowen, G.J.; Cai, Z. A Global Perspective on Local Meteoric Water Lines: Meta-Analytic Insight Into Fundamental Controls and Practical Constraints. Water Resour. Res. 2019, 55, 6896–6910. [Google Scholar] [CrossRef]
  35. Rozanski, K.; Araguás-Araguás, L.; Gonfiantini, R. Isotopic Patterns in Modern Global Precipitation. Clim. Chang. Cont. Isot. Rec. 1993, 78, 1–36. [Google Scholar]
  36. Bowen, G.J.; Revenaugh, J. Interpolating the Isotopic Composition of Modern Meteoric Precipitation. Water Resour. Res. 2003, 39, SWC91–SWC913. [Google Scholar] [CrossRef]
  37. Environment Canada Past Weather and Climate: Historical Data. Available online: https://climate.weather.gc.ca/climate_data/hourly_data_e.html (accessed on 19 April 2022).
  38. Bershaw, J.; Hansen, D.D.; Schauer, A.J. Deuterium excess and 17O-excess variability in meteoric water across the Pacific Northwest, USA. Tellus B Chem. Phys. Meteorol. 2020, 72, 1773722. [Google Scholar] [CrossRef]
  39. Environment Canada Daily Discharge and Water Level Data Availability for NORTH ALOUETTE RIVER AT 232ND STREET, MAPLE RIDGE (08MH006). Available online: https://wateroffice.ec.gc.ca/report/data_availability_e.html?type=historical&station=08MH006&parameter_type=Flow+and+Level (accessed on 20 November 2023).
  40. Coplen, T.B.; Neiman, P.J.; White, A.B.; Landwehr, J.M.; Ralph, F.M.; Dettinger, M.D. Extreme Changes in Stable Hydrogen Isotopes and Precipitation Characteristics in a Landfalling Pacific Storm. Geophys. Res. Lett. 2008, 35. [Google Scholar] [CrossRef]
  41. Coplen, T.B.; Neiman, P.J.; White, A.B.; Martin Ralph, F. Categorisation of Northern California Rainfall for Periods with and without a Radar Brightband Using Stable Isotopes and a Novel Automated Precipitation Collector. Tellus B Chem. Phys. Meteorol. 2015, 6, 28574. [Google Scholar] [CrossRef]
  42. Leguy, C.; Rindsberger, M.; Zangwil, A.; Issar, A.; Gat, J.R. The Relation between the 18O and Deuterium Contents of Rain Water in the Negev Desert and Air-Mass Trajectories. Chem. Geol. 1983, 41, 205–218. [Google Scholar] [CrossRef]
  43. Mix, H.T.; Reilly, S.P.; Martin, A.; Cornwell, G. Evaluating the Roles of Rainout and Post-Condensation Processes in a Landfalling Atmospheric River with Stable Isotopes in Precipitation and Water Vapor. Atmosphere 2019, 10, 86. [Google Scholar] [CrossRef]
  44. Dansgaard, W. The Abundance of O 18 in Atmospheric Water and Water Vapour. Tellus 1953, 5, 461–469. [Google Scholar] [CrossRef]
  45. Payne, A.E.; Magnusdottir, G. Dynamics of Landfalling Atmospheric Rivers over the North Pacific in 30 Years of MERRA Reanalysis. J. Clim. 2014, 27, 7133–7150. [Google Scholar] [CrossRef]
  46. Sharma, A.R.; Déry, S.J. Linking Atmospheric Rivers to Annual and Extreme River Runoff in British Columbia and Southeastern Alaska. Am. Meteorol. Soc. 2020, 21, 2457–2472. [Google Scholar] [CrossRef]
  47. Weng, Y.; Johannessen, A.; Sodemann, H. High-Resolution Stable Isotope Signature of a Land-Falling Atmospheric River in Southern Norway. Weather. Clim. Dyn. 2021, 2, 713–737. [Google Scholar] [CrossRef]
  48. Yoshimura, K.; Kanamitsu, M.; Dettinger, M. Regional Downscaling for Stable Water Isotopes: A Case Study of an Atmospheric River Event. J. Geophys. Res. Atmos. 2010, 115, D18114. [Google Scholar] [CrossRef]
  49. Tada, M.; Yoshimura, K.; Toride, K. Improving Weather Forecasting by Assimilation of Water Vapor Isotopes. Sci. Rep. 2021, 11, 18067. [Google Scholar] [CrossRef]
  50. Sodemann, H.; Masson-Delmotte, V.; Schwierz, C.; Vinther, B.M.; Wernli, H. Interannual Variability of Greenland Winter Precipitation Sources: 2. Effects of North Atlantic Oscillation Variability on Stable Isotopes in Precipitation. J. Geophys. Res. Atmos. 2008, 113, D03107. [Google Scholar] [CrossRef]
  51. Gat, J.R.; Carmi, I. Evolution of the Isotopic Composition of Atmospheric Waters in the Mediterranean Sea Area. J. Geophys. Res. 1970, 75, 3039–3048. [Google Scholar] [CrossRef]
  52. Pfahl, S.; Sodemann, H. What Controls Deuterium Excess in Global Precipitation? Clim. Past. 2014, 10, 771–781. [Google Scholar] [CrossRef]
  53. Stewart, M.K. Stable Isotope Fractionation Due to Evaporation and Isotopic Exchange of Falling Waterdrops: Applications to Atmospheric Processes and Evaporation of Lakes. J. Geophys. Res. 1975, 80, 1133–1146. [Google Scholar] [CrossRef]
  54. Gershunov, A.; Shulgina, T.; Ralph, F.M.; Lavers, D.A.; Rutz, J.J. Assessing the Climate-Scale Variability of Atmospheric Rivers Affecting Western North America. Geophys. Res. Lett. 2017, 44, 7900–7908. [Google Scholar] [CrossRef]
  55. Gimeno, L.; Nieto, R.; Vázquez, M.; Lavers, D.A.; Trigo, R.M.; Martius, O.; Porcu, F. Atmospheric Rivers: A Mini-Review. Front. Earth Sci. 2014, 2, 2. [Google Scholar] [CrossRef]
  56. Shields, C.A.; Kiehl, J.T. Simulating the Pineapple Express in the Half Degree Community Climate System Model, CCSM4. Geophys. Res. Lett. 2016, 43, 7767–7773. [Google Scholar] [CrossRef]
  57. Stendel, M.; Francis, J.; White, R.; Williams, P.D.; Woollings, T. The Jet Stream and Climate Change. In Climate Change; Elsevier: Amsterdam, The Netherlands, 2021; pp. 327–357. [Google Scholar]
  58. Shields, C.A.; Richter, J.H.; Pendergrass, A.; Tilmes, S. Atmospheric Rivers Impacting Western North America in a World with Climate Intervention. NPJ Clim. Atmos. Sci. 2022, 5, 41. [Google Scholar] [CrossRef]
Figure 1. Study area with extent of AR identification and sampling locations of precipitation, surface water and groundwater collection.
Atmosphere 15 00074 g001
Figure 3. The d-excess and δ18O values of AR, non-AR precipitation samples, collected between November 2021 and February 2023 plotted on a water year and compared to IAEA/WMO Saturna Island monthly composite record [20]. Dashed lines represent 1σ of Saturna Island samples. Points labeled as unknown were collected after the Rutz et al. [21] catalogue ended in December 2022. Inset: d-excess as a function of humidity during kinetic evaporation from the ocean surface (after Merlivat and Jouzel [32]).
Atmosphere 15 00074 g003
Figure 4. GOES-West Satellite Images and HYSPLIT models for three AR events and one non-AR event. Event type includes isotopic composition, precipitation, and IVT amount. Red, blue, and green track colours correspond to the start times of the simulation, 0000, 0800, and 1600 UTC, respectively. Each model covers a 72-h period prior to when the sample was collected. Row letters correspond to letters in Figure 2. Inset figures on map: cross plot of δ18O versus δ2H for event precipitation. Subfigures—(A): isotopically enriched non-AR event sourced from the central Pacific Ocean; (B): isotopically depleted AR event sourced from the central Pacific Ocean; (C): AR event transported via the Bering Sea with an isotopic signature above the 50th percentile; (D): AR event with mixed trajectories and isotopic signature above the 75th percentile.
Atmosphere 15 00074 g004
Figure 5. D-excess and δ18O signature of surface water (main stem and tributary) samples between November 2021 and February 2023. Precipitation samples are scaled by precipitation amount and circled if identified as an AR. GNIP (IAEA/WMO) Saturna Island monthly composite samples are represented as dashed lines [20]. Boxplot of δ18O values on the right side show variability in precipitation and surface water samples by season. Daily precipitation and averaged monthly stream discharge (2004–2020) on lower panel are retrieved from Pitt Meadows Climate Station (Environment Canada Station 1106178) [37] and North Alouette River (Environment Canada Station 08MH006) [39], respectively. Panel shading and letters correspond to seasonal patterns: A—fall and winter; B—spring and summer; C—fall and winter.
Atmosphere 15 00074 g005
Table 1. Comparison of isotopic composition of ARs and non-ARs and resulting p values from t-test; n refers to sample size.
ARNon-ARp ValueIAEA/WMO (Saturna Island)
δ18O (‰)−11.71−9.470.02 *−10.14
δ2H (‰)−85.80−69.580.03 *−74.64
d-excess (‰)7.96.20.36.5
n1932 141
* Statistically significant.
Disclaimer/Publisher’s Note: The statements, opinions and data contained in all publications are solely those of the individual author(s) and contributor(s) and not of MDPI and/or the editor(s). MDPI and/or the editor(s) disclaim responsibility for any injury to people or property resulting from any ideas, methods, instructions or products referred to in the content.

