Article

Pollution Characteristics of Different Components of PM2.5 in Taiyuan during 2017–2020 Wintertime and Their Toxicity Effects on HepG2 Cells

1
Institute of Environmental Science, Shanxi University, Taiyuan 030006, China
2
Shanxi Unisdom Testing Technology Co., Ltd., Taiyuan 030006, China
3
Institute of Judicial Identification Techniques for Environmental Damage, Shanxi University-Unisdom, Taiyuan 030006, China
*
Author to whom correspondence should be addressed.
Atmosphere 2024, 15(1), 32; https://doi.org/10.3390/atmos15010032
Submission received: 20 November 2023 / Revised: 20 December 2023 / Accepted: 23 December 2023 / Published: 27 December 2023

Abstract

:
Fine particulate matter (PM2.5) is a common pollutant, and its health risk has attracted much attention. Studies have shown that PM2.5 exposure is associated with liver disease. The composition of PM2.5 is complex, and its hepatotoxic effects and lipid metabolism process are not well understood. In this study, we detected the concentrations of PM2.5 and its components (metals and polycyclic aromatic hydrocarbon (PAHs)) in the winter in Taiyuan, Shanxi Province, China, from 2017 to 2020 and then assessed the health risks. We also investigated the effects of different components (whole particles (WP), water-soluble particles (WSP), organic particles (OP)) of PM2.5 on the cytotoxicity and lipid metabolism in human liver cell line (HepG2) after 24 h of treatment. The changes in cytotoxicity indexes (LDH, IL-6, reactive oxygen species (ROS)) and lipids (triglyceride (TG), free fatty acid (FFA)) were measured after 24 h. The mRNA expression of lipid metabolism-related factors (SREBP1, CD36, MTTP) was determined by real-time quantitative RT-qPCR. Finally, the correlation between metals and PAHs with higher PM2.5 content in 4 years and biomarkers was analyzed. The results showed that: (1) The PM2.5 pollution was severe in Taiyuan during winter in 2017 and the subsequent four years. The calculation results of the metal enrichment factor (EF) value and PAHs characteristic ratio of PM2.5 showed that PM2.5 pollution sources differed in different years. (2) Exposure to metals and PAHs in PM2.5 did not cause a non-carcinogenic risk. Metals had no cancer risk, while PAHs inhaled in PM2.5 in 2017 and 2018 had a potential cancer risk. The atmospheric PM2.5 pollution in Taiyuan has had a downward trend, but the PAHs in the PM2.5 of 2017–18, when the pollution is relatively serious, have a potential carcinogenic risk. (3) WP, OP and WSP inhibited cell survival rate from 2017 to 2020, and OP had higher cytotoxicity at the same concentration. (4) WP, OP and WSP increased the levels of LDH, IL-6, TNF-α, ROS, MDA, TG and FFA, and inhibited SOD activity in a dose-effect relationship. The organic components in PM2.5 are more toxic to HepG2 cells and affect the expression of lipid metabolism-related factors at the transcriptional level. (5) The mRNA expressions of factors related to lipid synthesis, uptake, oxidation and output were up-regulated after treatment with PM2.5 and its components, suggesting a lipid metabolism disorder. (6) The biomarkers were associated with certain metals (Zn, Pb, Cu and Cr) and PAHs in PM2.5. These suggested that PM2.5- and PM2.5-bound organic matter caused HepG2 cytotoxicity and affected lipid metabolism.

1. Introduction

Fine atmospheric particulate matter (PM2.5) is a major air pollutant in many Chinese cities and an important public health risk factor, adversely affecting climate change, visibility, and human health [1]. Studies have shown that the toxicity induced by PM2.5 is related to its concentration, source and complex composition, and exposure to PM2.5 seriously harms human health, so it has attracted wide attention [2]. The chemical composition of PM2.5 mainly includes organic components (such as polycyclic aromatic hydrocarbon (PAHs) and its derivatives), water-soluble ions (such as SO42− NO3−, F and Cl), ferrum (Fe), plumbum (Pb), cuprum (Cu), zinc (Zn), chromium (Cr), molybdenum (Mo), arsenic (As), nickel (Ni), cadmium (Cd), manganese (Mn) and other metals and insoluble components [3,4,5]. Water-soluble ions in PM2.5 significantly impact weather and visibility [6], while metals, PAHs, and their derivatives harm human health [2,7,8]. The characteristics and chemical composition of PM2.5 pollution in different cities and seasons are significantly different, which leads to complex health hazards and toxicological mechanisms induced by PM2.5 [9,10,11]. Taiyuan is a typical resource-based city in northern China. Although the PM2.5 pollution level in Taiyuan has changed in the last 10 years [12], the PM2.5 pollution level in Taiyuan is still relatively within the scope of Chinese cities. It is significant to explore the sources of PM2.5 and its chemical components at different times and carry out corresponding health risk assessments to further understand the health effects of PM2.5. Therefore, it is necessary to conduct more and more research on the atmospheric PM2.5 pollution in Taiyuan and strengthen pollution control.
PM2.5 can be deposited in the pulmonary alveoli and enter the blood circulation through blood–gas exchange [13], reaching all body organs, including the liver. The liver is an essential metabolic and detoxification organ of the human body, involved in metabolizing sugars, lipids and proteins. The liver can play a role in lipid metabolism, such as fat metabolism, detoxification and catabolism. The liver can metabolize and decompose endogenous and exogenous substances, and lipid metabolism disorders can cause fatty liver, hepatitis and other liver diseases. Epidemiological studies have shown that PM2.5 is not only closely related to cardiopulmonary diseases, the immune system and the nervous system [14,15,16], but also related to the incidence of liver cancer. Studies have shown that PM2.5 and its binding compounds are deposited and metabolized in the liver, which may eventually cause liver damage [17]. Continuous exposure to PM2.5 for 17 weeks increased steatosis and lipid peroxidation in the liver of diabetic mice [18]. Exposure to PM2.5 in high-fat mice will increase liver inflammation and eventually lead to liver fibrosis [19]. Zheng et al. showed that exposure of mice to PM2.5 for 10 weeks can trigger inflammation, reduce fatty acid oxidation, and lead to steatosis [20]. The composition of PM2.5 is complex, and it causes different toxicological effects. For example, Xu et al. reported that injecting water-soluble diesel exhaust particulate matter (DEP) into mice would cause an increase in liver collagen and high cholesterol in mice [21]. Therefore, when assessing the impact of PM2.5 particles on lipid metabolism, it is necessary to consider the PM2.5 particles themselves and the impact of PM2.5 components. However, there are limited studies on the effects of PM2.5 and its different components on liver toxicity and lipid metabolism.
Given this, in this study: (1) based on the health risk assessment model, we analyze the pollution characteristics and pollution sources of different components of atmospheric PM2.5 in Taiyuan during the winters of 2017–2020 and evaluate the health risks of PM2.5; (2) using human hepatocellular carcinoma cell line HepG2 as a model in vitro, we investigate the toxic effects of PM2.5 and its components and the effects on lipid metabolism from the perspectives of oxidative stress, inflammation, lipid molecules and lipid metabolism; (3) we explore the relationship between metals and PAHs with higher content of PM2.5 and the above key biomarkers. This research will identify the key components of PM2.5 that are more toxic to the liver and indicate the mechanism of PM2.5 and its components on cytotoxicity and lipid metabolism, which will provide new experimental evidence for the study of PM2.5 liver toxicology.

2. Materials and Methods

2.1. PM2.5 Sampling and Collection

In this study, PM2.5 samples were collected on the rooftop of a 5-story building of the College of Environment and Resources, Shanxi University, Taiyuan, Shanxi Province, China, in winter during 2017–2020. This site is located about 300 m away from a major roadway. There are no apparent industrial pollution sources around. PM2.5 average concentrations in the site in the winter from 2017 to 2000 ranged from 73.4 to 82.4 µg/m3, which is typical of the general urban pollution in Taiyuan. PM2.5 samples were collected for 15 days during November and December of the winter heating period from 2017 to 2020 to determine the mean concentrations of metals and PAHs in PM2.5.
According to our previous report [22], inductively coupled plasma mass spectrometry (ICP-MS) (Agilent, Santa Clara, CA, USA) was used to detect metal components. Sixteen PAHs in PM2.5 were detected by high-performance liquid chromatography (HPLC) (Agilent, America), including naphthalene (NAP), acenaphthylene (ANY), acenaphthenene (ACE), fluorene (FLU), phenanthrene (PHE), anthracene (ANT), fluoranthrene (FLA), pyrene (PYR), benzo [a] anthracene (BaA), chrysene (CHR), benzo [b] fluoranthrene (BbF), benzo [k] fluoranthrene (BkF), benzo [a] pyrene (BaP), dibenzo [a,h] anthracene (DahA), benzo [g,h,i] perylene (BghiP) and indene [1,2,3-c,d] pyrene (IcdP) [23].
The carcinogenic and non-carcinogenic risk indices of metals and PAHs in PM2.5 samples were analyzed. PM2.5 whole particles (WP), water-soluble particles (WSP) and organic particles (OP) were extracted and prepared according to the previous methods of our laboratory [24], and then all samples were stored at 4 °C for the subsequent cell experiments.

2.2. Source Analytic Methods

The enrichment factor (EF) method was used to quantitatively assess the enrichment degree of metal elements in atmospheric particulate matter to determine its source [25]. The calculation formula is as follows:
EF i = ( C i C r ) e n v i r o n m e n t ( C i C r ) b a c k g r o u n d
In the Formula (1), EF is the enrichment factor, Ci and Ci′ are the content and background values of element i, and Cr and Cr′ are the content and background values of reference elements. In this study, the geochemical stable Al element was used as the reference element, and the EF value of each element was calculated separately. If EFi < 10, it is considered that the elements are not enriched relative to the crust, and the primary source is natural, caused by the weathering of soil rocks. EFi > 10 suggests that the elements are enriched and the primary source is anthropogenic.
Li et al. (2014) reported that the risk of non-carcinogenic effects is significant when the hazard index (HI) is greater than 1. The HI shows insignificant cancer potency when it is less than 1.0 [26].
The possible sources of PM2.5-bound PAH pollution are often identified with characteristic ratios of individual PAH concentrations, such as ANT/(ANT + PHE), FLA/(FLA + PYR), BaA/(BaA + CHR) and IcdP/(IcdP + BghiP) concentration ratio [27].

2.3. Health Risk Assessment

The health risk of metals in PM2.5 was assessed using the US EPA Health Risk Assessment model. The metals in PM2.5 mainly enter the human body through hand–oral ingestion, respiratory inhalation and skin contact to affect human health. Risk assessment includes non-carcinogenic risk and carcinogenic risk assessment. In this study, the daily exposure formulas of the three exposure pathways and the selection of parameters in the formulas refer to the research by Zhang [23].
PAHs are the product of incomplete combustion of carbon-containing substances, which are toxic and carcinogenic [28]. For non-carcinogenic effects, it can be characterized by a Hazard Quotient (HQ); for carcinogenic effects, it can be characterized by a cancer risk value (R) [23]. HQ value more than 1.0 indicates that there is a non-carcinogenic risk; otherwise, the non-carcinogenic risk is low. R value more than 1 × 10⁻⁶ suggests a risk of cancer; otherwise, the risk of cancer is very low.

2.4. Cell Culture and Exposure

Human HepG2 cells were donated by Shanxi Medical University (purchased from stem cell Bank of Shanghai Institute of Cell Biology, Chinese Academy of Sciences). The medium was high glucose medium (DMEM) (Seven, Beijing, China), 10% fetal bovine serum (FBS) (Gibco, Waltham, MA, USA) and 1% penicillin/streptomycin (Solarbio, Beijing, China). The incubator conditions were 37 °C, 5% CO2. Cell culture fluid is changed every 3 days. The cells were washed with a phosphate-buffered solution (PBS) (Solarbio, Beijing, China), digested with 0.25% trypsin (Solarbio, Beijing, China) for passage, and inoculated into new culture bottles.
According to the experimental requirements, a certain amount of whole particle (WP) and water-soluble particles (WSP) were dissolved in the sterilized PBS solution, and ultrasonic shaking was performed for 30 min before use. The negative control groups of cells treated with WP and WSP were given PBS. During the experiment, the DMEM medium was diluted to the corresponding working concentration to obtain different concentrations of PM2.5 working solution. The OP sample was dissolved in a cell culture medium containing 0.1% DMSO (final concentration) to obtain different concentrations of PM2.5 working solution. A negative control group of cells treated with OP was set as 0.1% DMSO (final concentration). Cells (n = 6 per group) were treated in different groups.

2.5. Cytotoxicity Study

HepG2 cell suspension was inoculated with 5 × 10³ cells per well into 96-well plates with a total of 100 μL per well and placed in an incubator overnight. They were then treated with PM2.5 working solution (0, 1, 5, 10, 25, 50, 100, 200, 250, 500 µg/mL) for 24 h; then, the absorbance value was measured with the full-wavelength scanning multifunctional enzyme-labeler (Thermo, Waltham, MA, USA) at 450 nm wavelength after analysis using the cell counting kit-8 (CCK-8) (Beiotai Biotechnology, China). Four concentrations of PM2.5 suspensions (0, 25, 50, 100 µg/mL) with cell survival rates above 70% were selected for the following cell experiments.
The cells were incubated in different sizes of petri dishes/plates. When the cell fusion degree reached 80–90%, the cells were treated with WP, OP and WSP working fluids of different concentrations for 24 h. After the reaction, wash twice with sterilized PBS at 37 °C. ROS (Beyotime, Shanghai, China) and TG (Jiancheng, Nanjing, China) contents were determined directly according to the kit. The protein concentration was determined using a BCA kit (Beyotime, Shanghai, China) and determined lactate dehydrogenase (LDH) (Jiancheng, Nanjing, China), interleukin-6 (IL-6) (Jianglai, Shanghai, China), tumor necrosis factor-alpha (TNF-α) (Jianglai, Shanghai, China), superoxide dismutase (SOD) (Jiancheng, Nanjing, China), malondialdehyde (MDA) (Jiancheng, Nanjing, China), and free fatty acid (FFA) (Jiancheng, Nanjing, China) according to the corresponding kits.

2.6. qRT-PCR Analysis

HepG2 cells were treated with WP, OP and WSP at different concentrations for 24 h. The cell samples in different groups were homogenized in TRIzol reagent (Promega Biotech, Madison, WI, USA). The quantitative RT-PCR of mRNA expression was performed with an iCycler iQ Real-Time PCR Detection System (Bio-Rad, Richmond, CA, USA) and the SYBR Premix ExTaq™ kit (TaKaRa, Dalian, China). The gene primers are displayed in Table S1. Glyceraldehyde-3-phosphate dehydrogenase (GAPDH) is an internal parameter for mRNA expression quantification.
The reaction parameters of PCR were as follows: predenaturation at 95 °C for 3 min, 94 °C/20 s, annealing temperature/20 s, 72 °C/20 s, 40 cycles.

2.7. Statistical Analysis

The cell experimental data were expressed as mean ± SD (n = 4) and analyzed by SPSS 19.0 statistical software with one-way analysis of variance (ANOVA) for statistical analysis. The mean differences between groups were compared by least significant difference (LSD). p < 0.05 indicated that the data were statistically significant.
In this study, we prepared whole particle (WP) samples from several PM2.5 sampling membranes each period during the winter in Taiyuan from 2017 to 2020 and treated the cells with a concentration of 100 μg/mL of WP to measure the levels of some specific biomarkers related to liver injury. We also obtained the average concentrations of PM2.5 components (primary metals and PAHs) for four years. Pearson correlation coefficient (r) was used to analyze correlations between mean concentrations of PM2.5 components (metals and PAHs) in winter for 4 years and levels of biomarkers in cells treated with WP for the same 4 years.

3. Results and Discussion

3.1. Pollution Concentration and Source Analysis of PM2.5 Components in Taiyuan during 2017–2020

Although the PM2.5 pollution in Taiyuan has improved in recent years, there is still some pollution. Therefore, we investigated to analyze the sources and evaluate the carcinogenic and non-carcinogenic risks of atmospheric PM2.5 in particular areas. We measured the concentrations of PM2.5 and its components (metals and PAHs) during the 2017–2020 heating period in Taiyuan.
The change in monthly average atmospheric PM2.5 concentration in Taiyuan from 2017 to 2020 is shown in Figure S1. As can be seen from Figure S1, the change curve of the average concentration of atmospheric PM2.5 in Taiyuan from January to November in the past four years presents a relatively gentle “U”-shaped change and a slight decline in December. In addition to 2018, the average monthly concentration of PM2.5 decreased month by month from the peak in the remaining three years from January. There was a slight rebound in June 2020. In 2019 and 2020, it fell to the lowest value for the whole year in August. From October 2017 to 2020, the monthly average concentration of PM2.5 had increased significantly. Overall, from June to September, the average monthly concentration of PM2.5 remained low. From November to February, the average monthly concentration of PM2.5 was within the high concentration range since there was more winter heating demand. During the heating period, the average monthly concentration of PM2.5 was higher in 2017 than in the remaining three years, suggesting serious pollution this year.
During the heating period, the average concentration of PM2.5 (82.4 μg/m3) in 2017 was higher than that in the remaining three years, indicating the most serious environmental pollution in Taiyuan in winter in 2017. In the heating period of 2020, the PM2.5 concentration was 73.4 μg/m3, close to the national air quality standard (75 μg/m3), indicating that, although the winter air in Taiyuan has been prevented and controlled, there is still pollution. Air pollution is a complex phenomenon, and the concentrations of air pollutants at a particular time and place are affected by many factors. The Taiyuan authority has taken many measures to control pollutant emissions, and the concentration of PM2.5 has recently declined from 2017 to 2020. However, the activity level of pollution sources in Taiyuan is still high, and the loads of central heating and civil heating are large in winter. In addition, the strong temperature inversion in winter is not conducive to the diffusion of pollutants. These result in the high level of air pollution still exist in Taiyuan among China cities.
Studies have shown that metals in PM2.5 enter the human body in various ways, interact with proteins and other biological macromolecules in the body, and cause damage to the human body [29]. In this study, the metal contents of PM2.5 from 2017 to 2020 were determined. The EF values results are shown in Table 1. The results showed that the EF values of metal Cd in 4 years were all greater than 10, suggesting that Cd was enriched in the atmosphere caused by anthropogenic sources. In 2017 and 2018, except for Cd, the EF values of the remaining 6 metals (Cr, Ni, Cu, Zn, As and Pb) were all less than 10, showing that the natural source was the primary source. In addition to Ni in 2019 and Cr and Ni in 2020, the EF value of the remaining metals was greater than 10, and the possibility of anthropogenic emissions was greater. Main anthropogenic sources of these metals include metallurgical industry, motor vehicles, coal burning, biomass combustion, soil dust, construction dust, etc. In recent years, the Taiyuan authority has taken effective measures to control metal pollutant emissions of PM2.5 pollution such as metallurgical industry, motor vehicles and coal burning, but biomass combustion, soil dust, construction dust and metallurgical industry pollution still trigger metal emission increases, which is necessary to strengthen the control further.
The concentrations of 16 PAHs in PM2.5 from 2017 to 2020 in Taiyuan were detected. ANY in 2017, NAP and ACE in 2019 were not detected, and the remaining PAH concentrations were shown in Table 2. The analysis of the characteristic ratio method suggested that the pollution sources of PM2.5 in the winter of 4 years were mainly coal and biomass combustion and motor vehicle emissions (Table 2 and Table S2). For example, the concentration ratios of ANT/(ANT + PHE), FLA/(FLA + PYR), BaA/(BaA + CHR) and IcdP/(IcdP + BghiP) in 2017 are 0.16, 0.6, 0.43 and 0.57, suggesting that sources of PM2.5-bound PAHs come from coal and biomass burning and motor vehicle emissions due to the identified methods, shown as Table S2. In 2019 and 2020, there were more sources of pollution from oil sources than in 2017. PM2.5-bound PAH pollution in the winter of 2018 was aggravated, maybe because of more burning of fossil fuels and biomass (Table 2 and Table S2).
Domestic and foreign studies have shown that PAHs are attached to PM2.5 and cause harm to the human body, with carcinogenic and teratogenic effects [30]. In this study, the concentrations of PAHs during the heating period from 2017 to 2020 were detected. And their levels were higher than that in southern cities such as Xiamen and Hangzhou, China [31]. In Taiyuan, a coal and resource-based city, the production process in some industrial factories and coal combustion in central heating and cooking during the winter heating caused high-level PAH pollution. This is why PAH pollution in Taiyuan is higher than in the southern cities.

3.2. Health Risk Assessment of Different Components of PM2.5 in Taiyuan during 2017–2020

3.2.1. Health Risk Assessment of Metals

As shown in Table 3, the 2017–2020 non-carcinogenic risk values for all metals tested in this study indicate a higher risk for children than adults. For adults and children, the 4-year non-carcinogenic risk values of metals were 2019 > 2020 > 2017 > 2018, and Pb incurred the highest risk in 2017 and 2020. Metal Cr had a higher risk value in 2018. In 2019, Zn has a slightly higher risk value than Pb. However, the non-carcinogenic risk of all metals was less than 1, illustrating no non-carcinogenic risk.
Using the carcinogenic risk assessment model of inhalation exposure patterns, we found that the order of carcinogenic risk values of metals was 2019 > 2020 > 2018 > 2017 (Table 4). The carcinogenic risk of metals peaked in 2019 and declined in 2020. However, these carcinogenic risk values were below the acceptable range (10−6–10−4) [23], suggesting that metals in PM2.5 from 2017 to 2020 did not pose a cancer risk.
According to the metal risk assessment model, the non-carcinogenic and carcinogenic exposure intensity of each metal is consistent with the concentration of metals. The risk of exposure to metals is higher in children than in adults. However, each metal exposure’s carcinogenic and non-carcinogenic risks in 2017–2020 are within the safe range. Exposure to metals alone or in combination has confirmed that these metals are associated with liver injury [32].

3.2.2. PAHs Health Risk Assessment

Based on the carcinogenic and non-carcinogenic risk assessment model of PAHs, the total carcinogenic risk values of 16 PM2.5-bound PAHs through inhalation in Taiyuan in 2017 and 2018 were 6.3 × 10⁻⁶ and 1.1 × 10⁻⁶ (Table 5), respectively. The risk of cancer was more remarkable than 1 × 10⁻⁶, indicating that at the exposure levels of PAHs in 2017 and 2018, residents in Taiyuan had a potential risk of cancer. There is no cancer risk by PAHs in 2019 and 2020. Table 2 shows that during the sampling period in 2017 and 2018, the BaP content of PM2.5 was 7.1 ± 3.2 ng/m3 and 12.72 ± 6.18 ng/m3, respectively, exceeding the Chinese National Standard (2.5 ng/m3). The non-carcinogenic risk values of PM2.5-bound PAHs from 2017 to 2020 were all below 1.0, indicating that residents in Taiyuan have no non-carcinogenic health risks at current exposure levels of PAHs.
According to the health risk assessment model based on PAHs, there are no non-carcinogenic risks in 4 years. In 2017 and 2018, PAHs in PM2.5 were potentially carcinogenic. Experiments have shown that the combined exposure of four kinds of PAHs at low doses has adverse effects on male SD rats such as liver injury, oxidative stress and lipid metabolism disorder to a certain extent [33].
The above results indicate that the sources of PM2.5 in Taiyuan from 2017 to 2020 are different. However, the common sources of pollution in the four years were transportation sources and coal burning. Liu et al. analyzed the composition of fine particles in winter in Taiyuan and found that inorganic sulfate and organic PAHs were important components of PM2.5 [34].

3.3. Cytotoxicity of PM2.5 Samples during 2017–2020 in HepG2 Cells

3.3.1. Effects of PM2.5 and Different Components on Cell Viability

Atmospheric PM2.5 easily absorbs toxic substances due to its large specific surface area, seriously damaging human health [35]. Epidemiological studies have shown that PM2.5 can cause cardiovascular and cerebrovascular diseases, lung diseases and endocrine disorders [36,37]. Recently, more and more attention has been paid to the role of PM2.5 in metabolic disorders (such as insulin resistance, neuroinflammation, etc.) [36,38]. However, the molecular mechanism of lipid metabolism disturbance caused by PM2.5 leading to nonalcoholic fatty liver disease (NAFLD) is less studied.
Due to different emission sources, regions, weather, time and other factors, the composition of PM2.5 is different to some extent, and the components of PM2.5 can also interact with each other to produce secondary pollutants with greater toxicity [39]. The composition of PM2.5 varies greatly, and they cause different toxicological effects. Therefore, when assessing the impact of PM2.5 particles on liver injury, it is necessary to consider not only the PM2.5 particles themselves, but also the impact of each component of PM2.5.
By studying the toxic effects of PM2.5 and its components, we can determine the primary air pollution sources in a certain period in this area and provide an experimental basis for air pollution control. Therefore, to explore the main toxic components of PM2.5 particles, we divided PM2.5 into WP, OP and WSP, and established an experimental model of HepG2 cell infection. In recent years, epidemiological investigations and animal experiments have shown that PM2.5 can cause NAFLD, but the differential effects of PM2.5 and its different components on liver function are rarely reported.
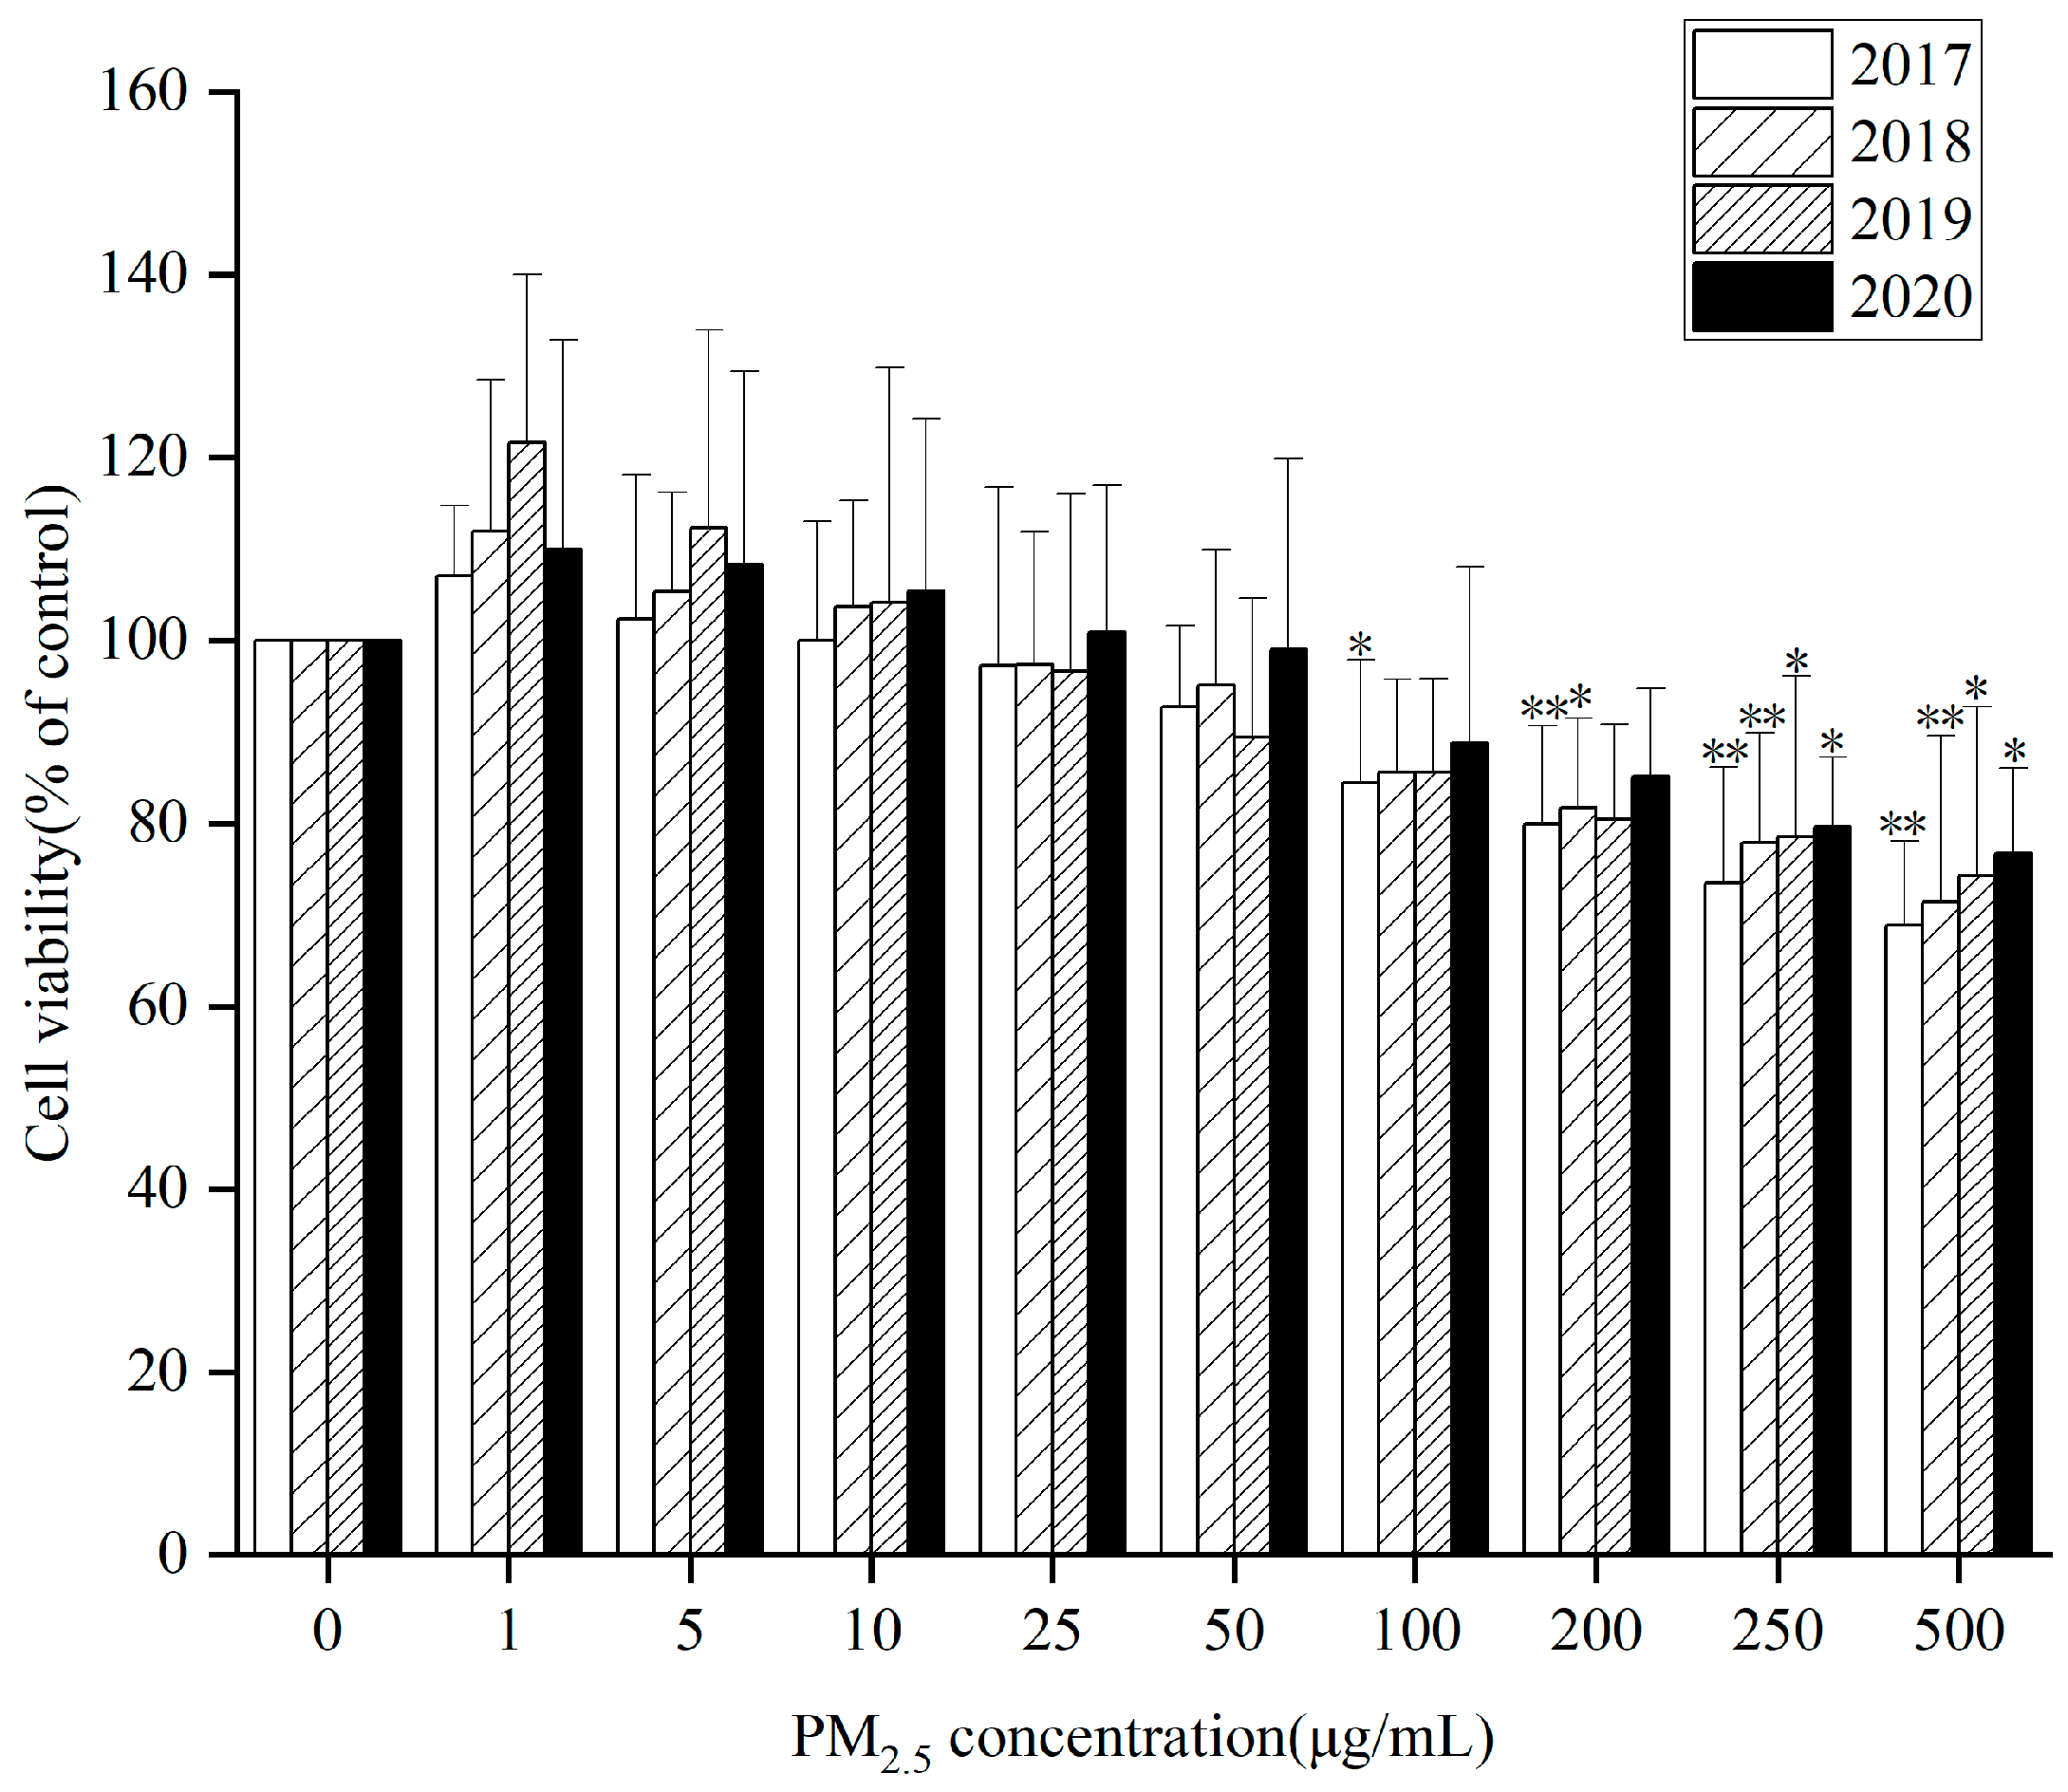
HepG2 cells were treated with three components of PM2.5 (WP, OP and WSP) at different concentrations for 24 h from 2017 to 2020. Cell viability measured by CCK8 kit showed that after 24 h exposure, extracts (WP, OP, and WSP) from PM2.5 samples for 4 years had significant cytotoxic effects on cells at 0, 50, 100, 200, 250, and 500 µg/mL compared to controls. Both 4-year WP (Figure 1) and WSP (Figure S2A) promoted cell proliferation at low concentrations (1, 5, 10 µg/mL). However, OP (Figure S2B) inhibited cell proliferation with increasing concentration and the cell survival rate was lower at the same concentration for a particular year from 2017 to 2020. Relatively, OP was a key component in inhibiting cell proliferation. However, there was no significant difference in cell viability between different components of PM2.5 over the years.
Next, LDH is an important enzyme in cells that is rapidly released from cells when the cell membrane is damaged and is often used to assess cell death or cytotoxicity [40]. In this study, we found that, compared with the control group, LDH activity increased significantly at WP (Figure 2), WSP (Figure S3A), and OP (Figure S3B) concentrations of 100 µg/mL from 2017 to 2020. In 2017, WP significantly increased LDH activity at a 50 µg/mL concentration. Elevating LDH, induced by WP components at 0, 25, and 50 µg/mL, showed significant differences in 2017 and 2019, while at 100 µg/mL, there were significant differences between 2017 and the other three years. When the WSP component was 100 µg/mL, LDH activity displayed remarkable differences in 2019. Of note, there was a significant difference in LDH activity between 2017 and 2019 when OP components were 50 and 100 µg/mL. This may be related to differences in physical and chemical properties due to different sources of particulate matter in 2019 [41].

3.3.2. Effects of PM2.5 and Its Components on Inflammatory Factors and Oxidative Stress

Previous studies have illustrated that oxidative stress and abnormal upregulation of inflammation caused by irritants can aggravate liver dyslipidemia and lipid accumulation, ultimately promoting NAFLD development [42,43,44]. Based on this, we evaluated markers of inflammation, oxidative stress, and lipid metabolism after exposure to HepG2 cells from different components of PM2.5 in different years to determine their possible relationship. Figure 3, Figure 4 and Figures S3 and S4 show that after exposure to different components of PM2.5 from 2017 to 2020, the levels of inflammatory factors IL-6 and TNF-α in HepG2 cells gradually elevated with the increase of exposure concentration, suggesting that PM2.5 and its components can trigger cellular inflammation.
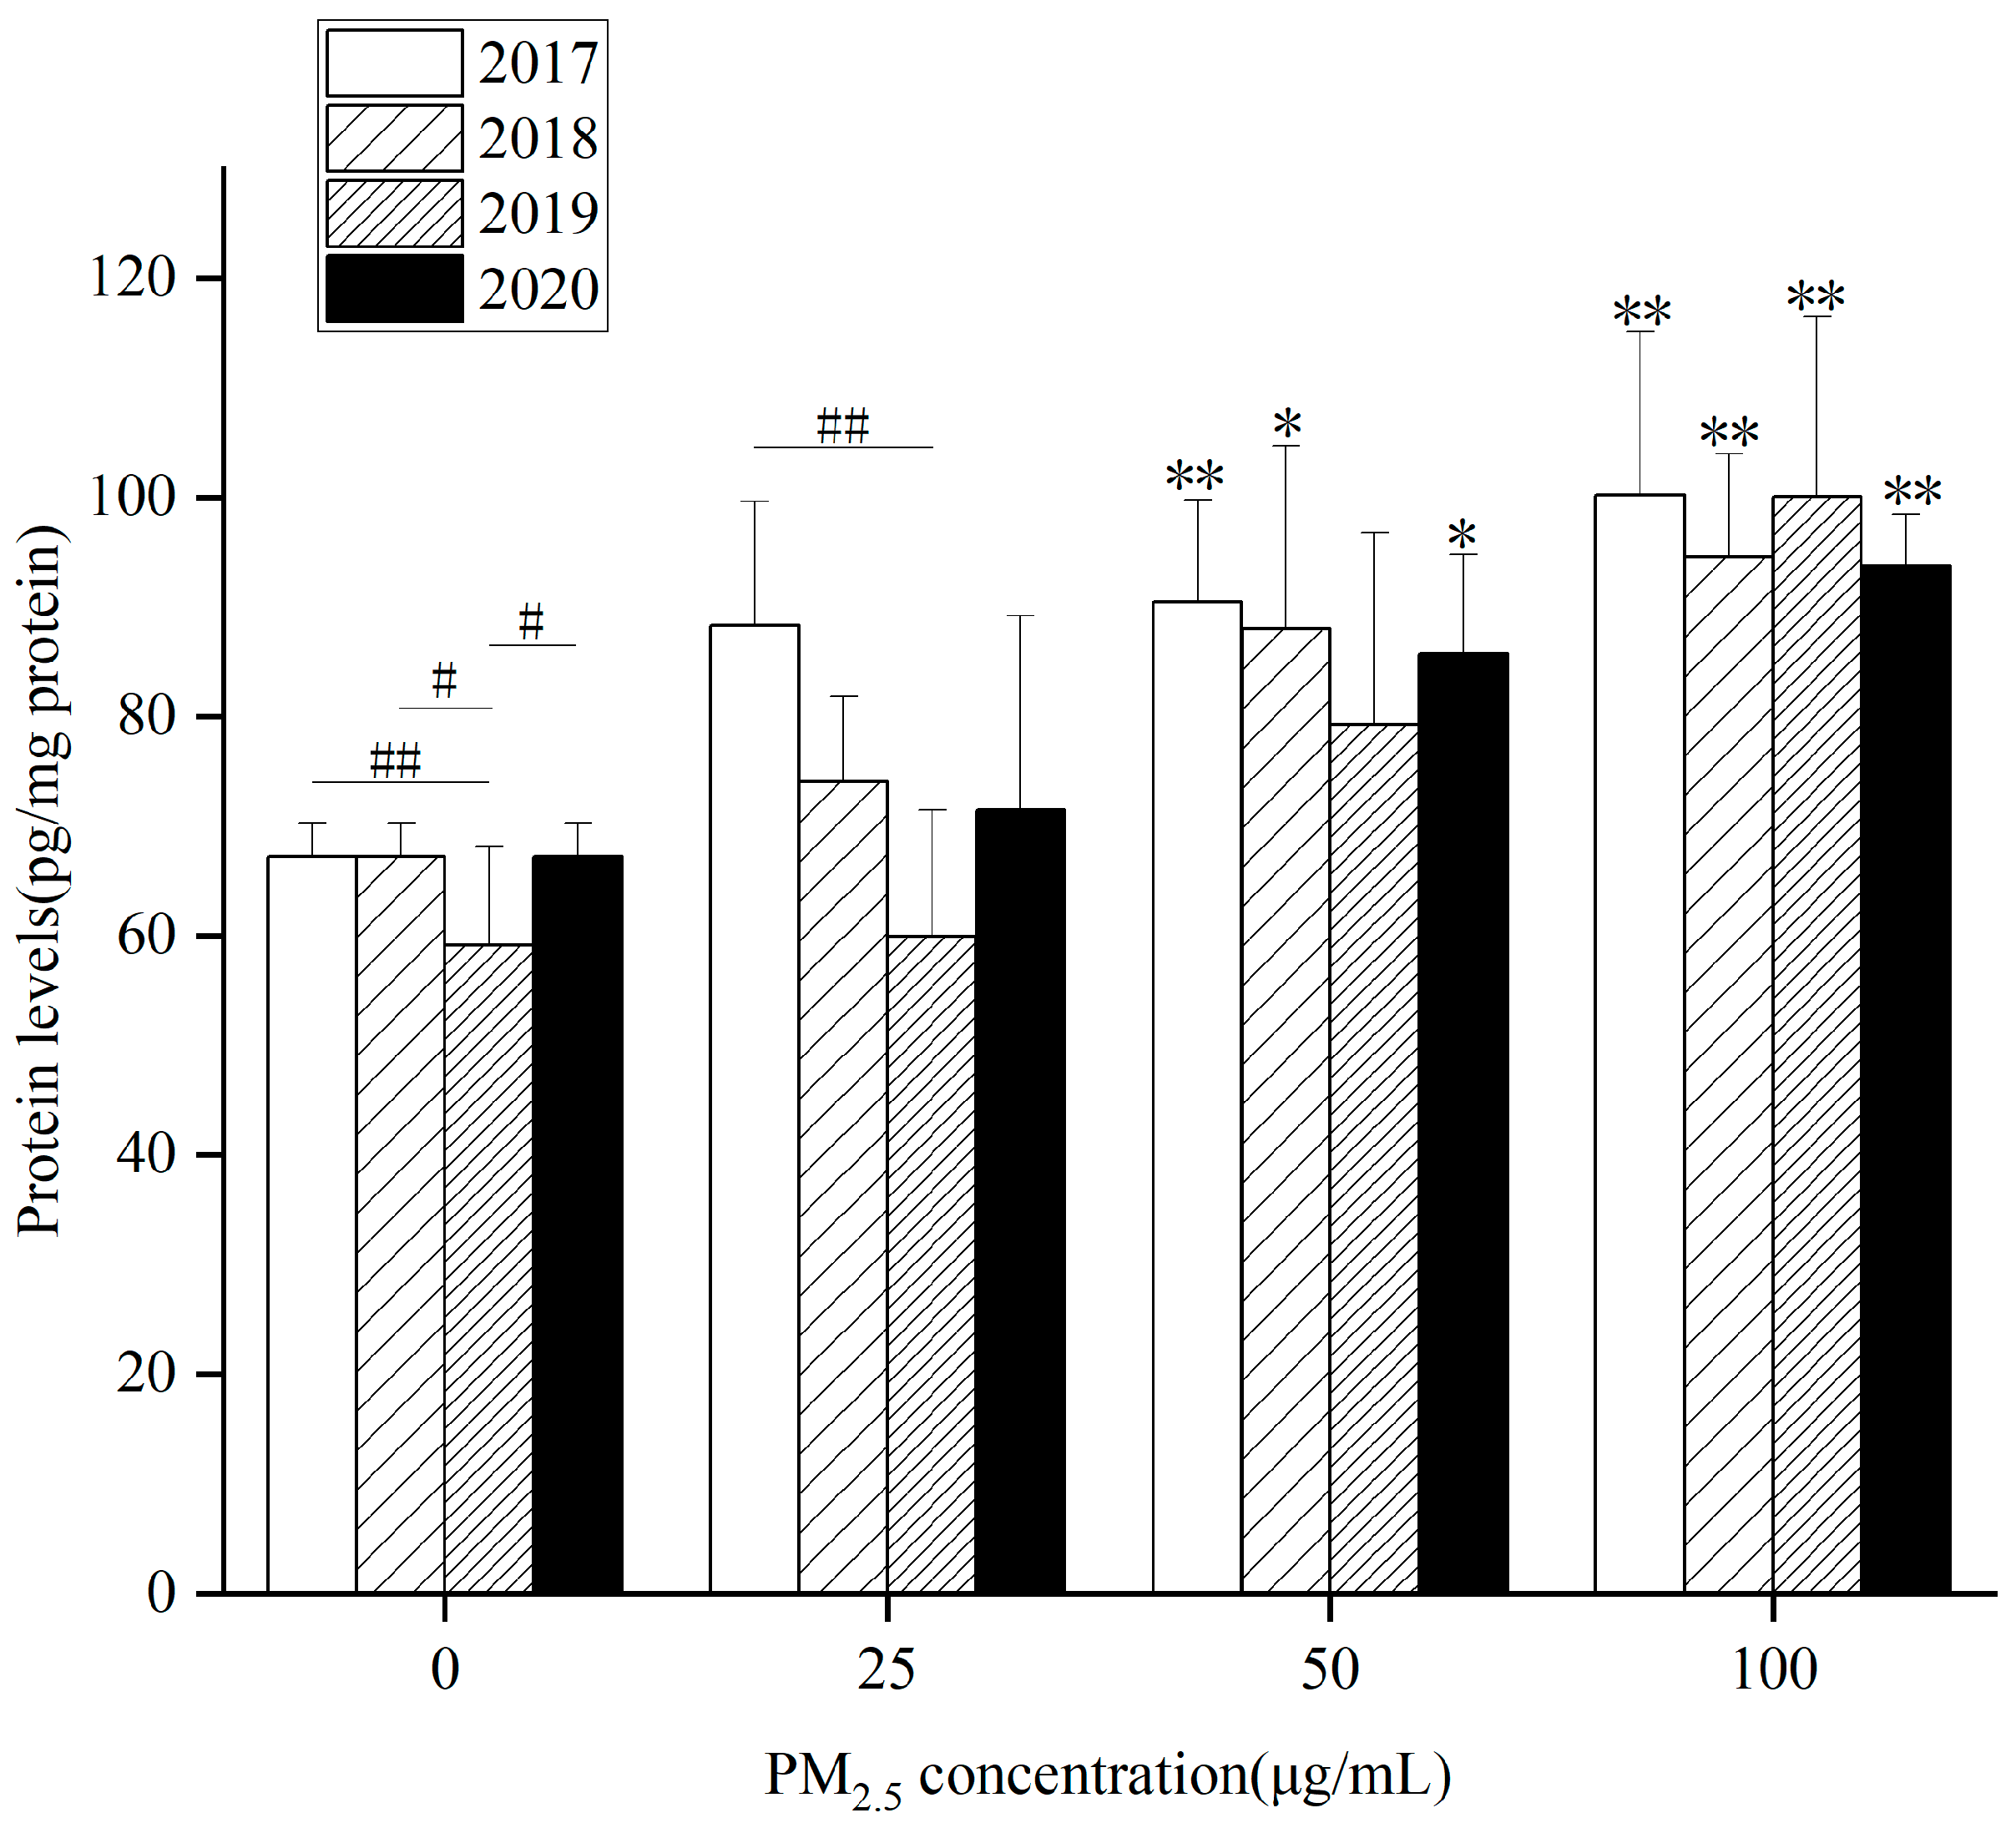
At the same concentration, each component in different years affected inflammatory factors differently. The key components that contribute to elevated levels of inflammatory factors also vary. In Figure 3, IL-6 levels in HepG2 cells markedly raised after WP components exposure to 50 and 100 µg/mL for 24 h in 2017, 2018 and 2020. In 2019, it was only at 100 µg/mL that it was obviously higher than the control group. Compared with the control group, 4-year exposure to WSP (Figure S4A) and OP (Figure S4B) for 24 h remarkably up-regulated intracellular IL-6 levels at 100 µg/mL. In 2020, there was a significant difference in WSP components at 50 µg/mL. After exposure of the OP component to 50 µg/mL in 2018, the intracellular IL-6 level was observably higher than that of the control group.
When the WP component concentration was 25 µg/mL, there was a significant difference between 2017 and 2019. After exposure to OP components at concentrations of 25 and 50 µg/mL, there were significant differences in IL-6 levels in 2019 and 2020.
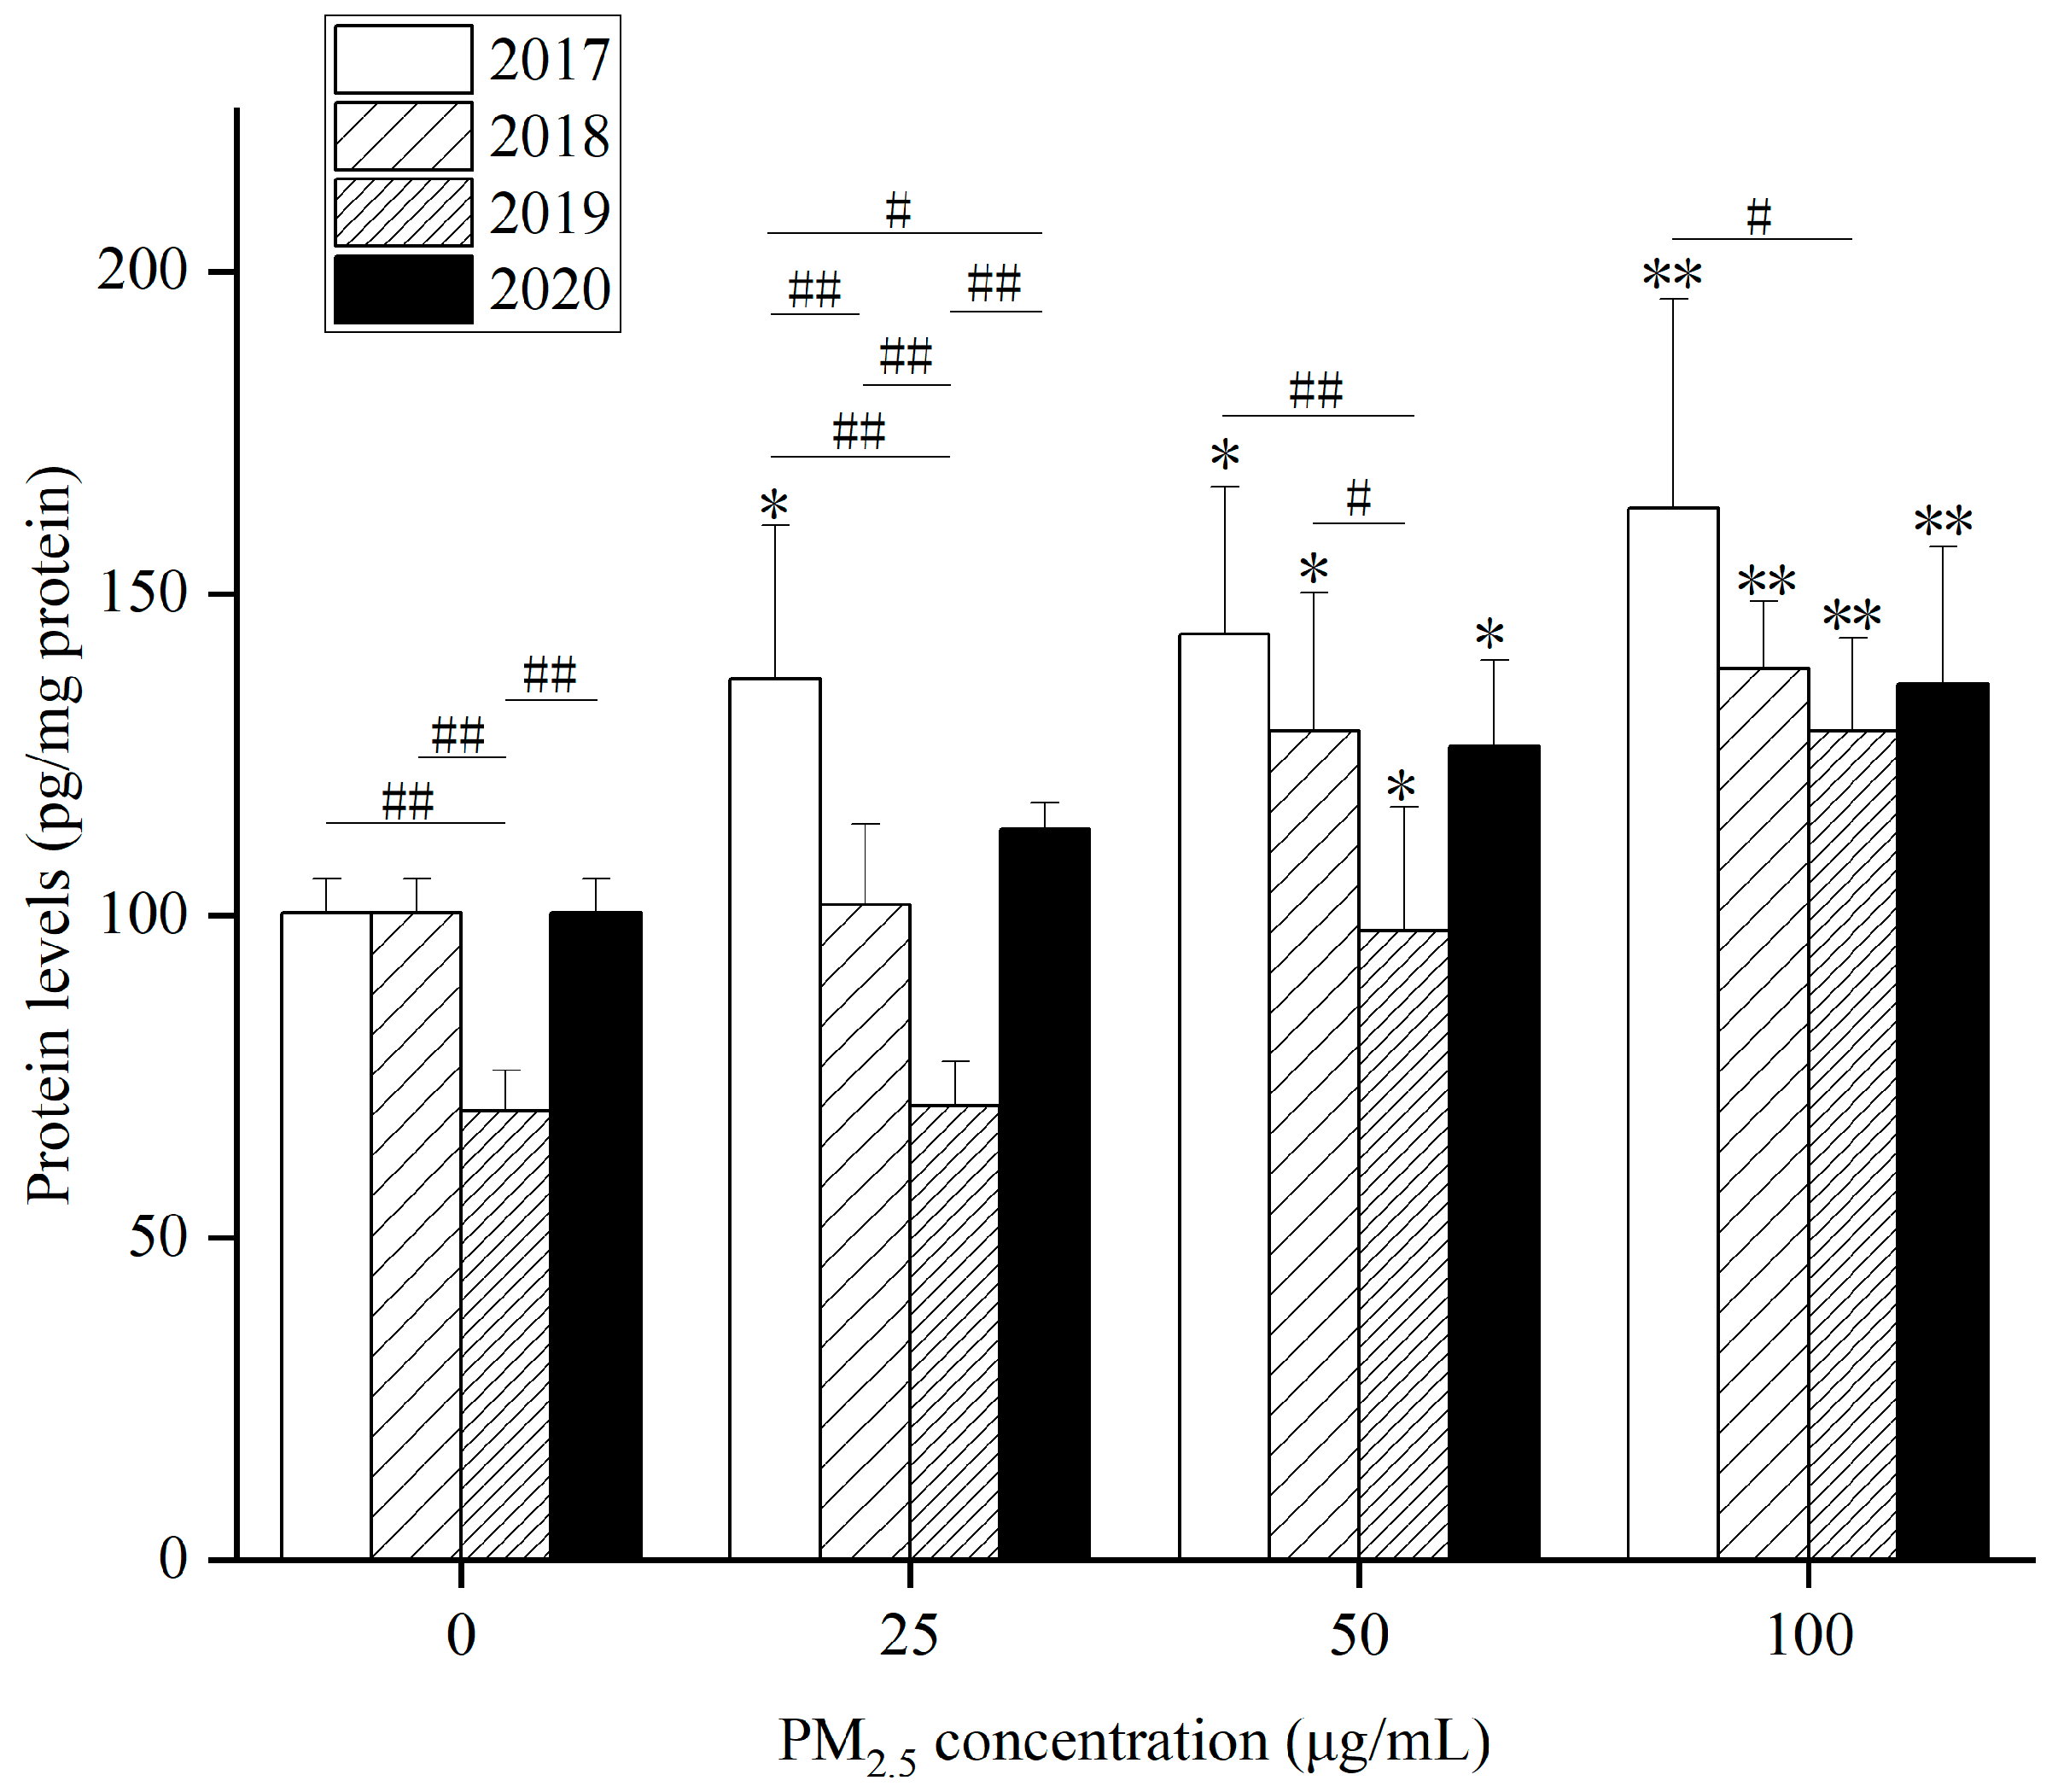
The level of TNF-α in HepG2 cells increased after WP (Figure 4), WSP (Figure S5A) and OP (Figure S5B) exposure for 24 h. Compared with the control group, 24 h after WP exposure from 2017 to 2020, intracellular TNF-α levels were markedly raised at 50 and 100 µg/mL concentrations. After 24 h exposure to WSP, the level of TNF-α went up significantly only when the concentration was 100 µg/mL. After OP exposure, TNF-α levels in HepG2 cells increased markedly at a 100 µg/mL concentration at 4 years. At a 50 µg/mL concentration, there was only a significant increase in HepG2 cells in 2017 and 2020.
The interannual differences in TNF-α levels in different years after exposure to the three components are as follows: (1) TNF-α levels induced by WP component at 0 and 25 µg/mL in 2019 showed significant differences from the other three years. At 25 µg/mL, TNF-α levels in 2017 differed significantly from those in 2018 and 2020. At 50 µg/mL, TNF-α levels in 2019 presented a significant difference relative to 2017 and 2018. At 100 µg/mL, there was only a significant difference in TNF-α levels between 2017 and 2019. (2) TNF-α levels induced by WSP component at 25 and 50 µg/mL caused significant differences between 2019 and 2020. At 50 µg/mL, 2020 also differed from 2018. At 100 µg/mL, intracellular TNF-α levels significantly differed in 2019 compared to 2018 and 2020. (3) OP components at four concentrations (0, 25, 50, 100 µg/mL) were obviously different in TNF-α levels in 2019 and the other three years.
Oxidative stress is the critical mechanism of NAFLD. Various hepatotoxic substances will lead to the production of ROS in hepatocytes. Then, the interaction of oxygen free radicals with cell membranes will result in lipid peroxy reaction to form lipid free radicals, which will jointly cause liver cell damage [45,46]. As displayed in 
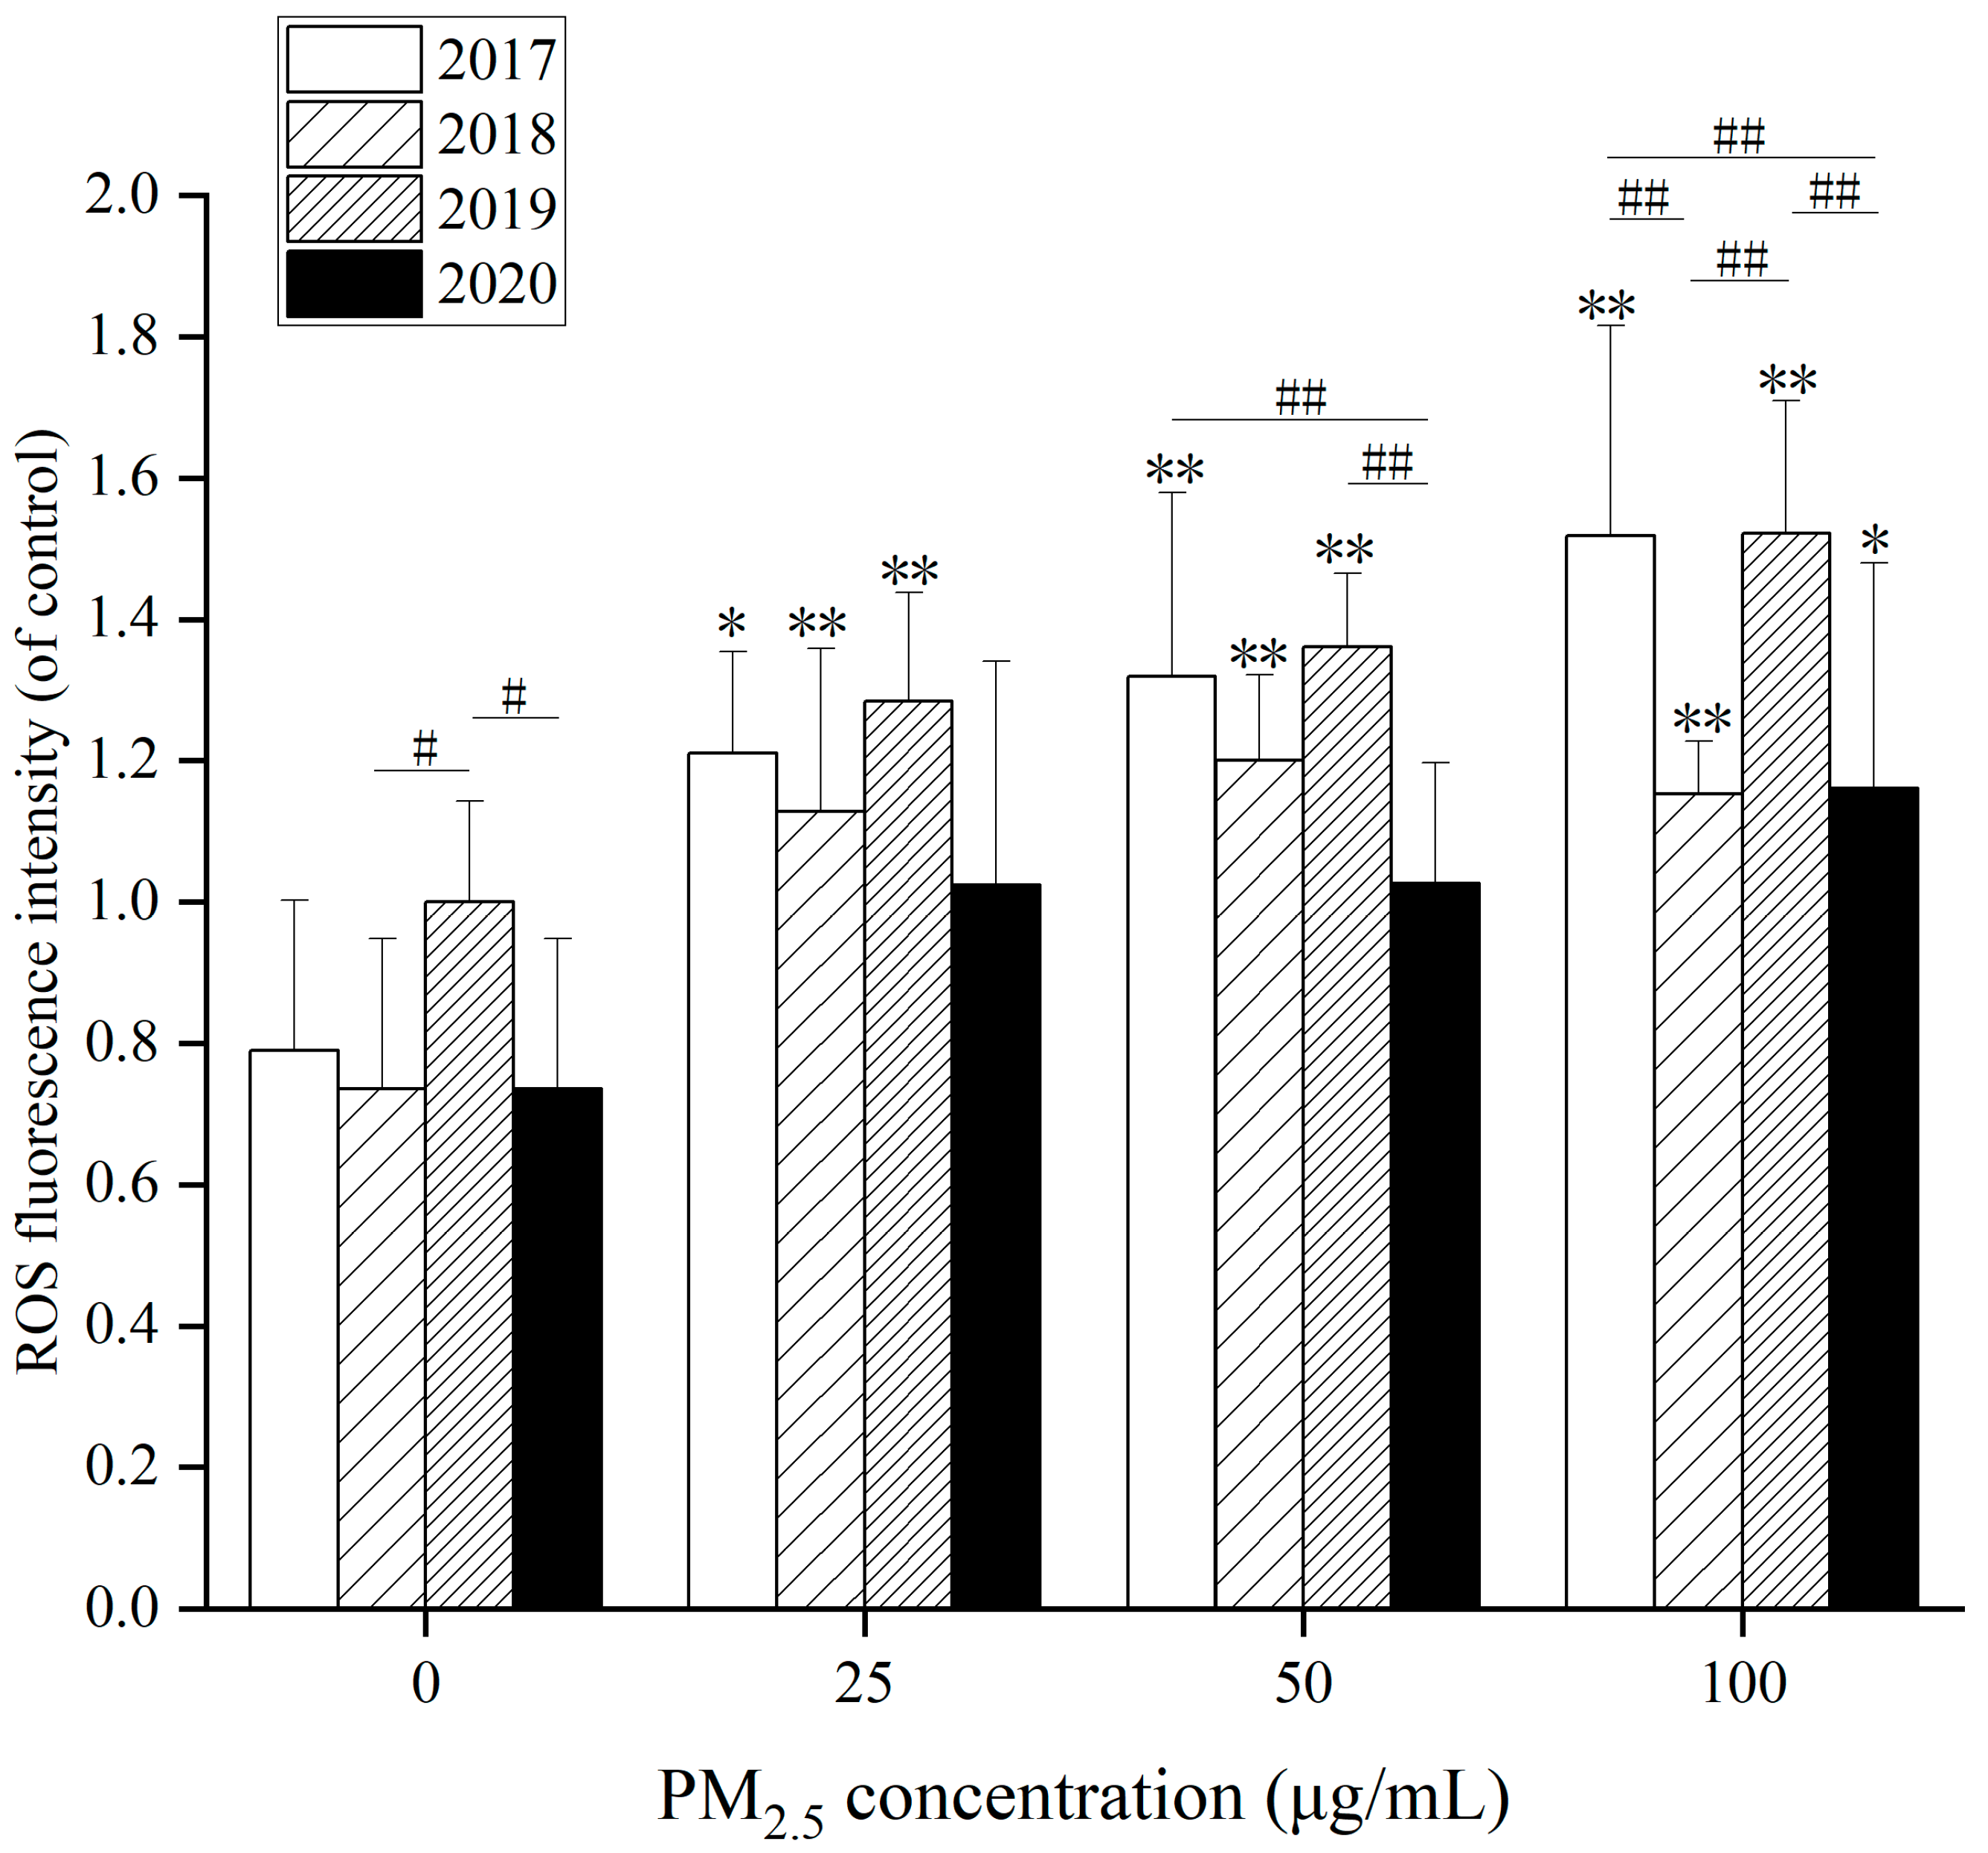
Figure 5, after 24 h exposure to WP at different concentrations, ROS levels in HepG2 cells raised to 100 µg/mL in 2020 compared with the control group. In the other three years, there was a markedly when WP concentration went up at 25, 50 and 100 µg/mL. Besides, in Figure 5, WP was markedly augmented at 25 µg/mL after action compared to the control group. In 2020, due to reduced pollution, it did not become significant until 100 µg/mL. The effects of WSP and OP also cause significant changes in ROS.
Statistical significance in ROS levels, especially after the WSP treatment, existed in different years. After 24 h exposure to WSP at different concentrations (Figure S6A), ROS levels in HepG2 cells elevated at 50 and 100 µg/mL in 2018 compared with controls. ROS levels in HepG2 cells augmented at 100 µg/mL in 2020. After 24 h of OP exposure (Figure S6B), ROS levels in HepG2 cells increased at 25, 50, and 100 µg/mL in 2017 compared with controls. ROS levels mounted up dramatically at 100 µg/mL in 2018. In 2019 and 2020, the ROS levels in HepG2 cells were elevated at 50 and 100 µg/mL. After WSP exposure in 2017, intracellular ROS levels were lower than in the remaining three years. ROS levels were higher after exposure to WP components in 2018 and 2020. In 2017 and 2019, it was higher after total particle exposure. After OP component exposure, intracellular ROS levels in 2019 were lower than those in the other three years.
In Figure 6, after 24 h exposure to WP at different concentrations, SOD activity in HepG2 cells decreased at 50 and 100 µg/mL at 4 years compared with control. At 100 µg/mL, there is a significant difference between 2019 and 2020. Besides, after 24 h exposure to WSP at different concentrations (Figure S7A), SOD activity in HepG2 cells decreased significantly at 100 µg/mL in 2020 compared with the control group. At 100 µg/mL, there is a significant difference between 2018 and 2019. Additionally, after 24 h exposure to different concentrations of OP (Figure S7B), SOD activity in HepG2 cells decreased significantly at 25, 50 and 100 µg/mL in 2017 compared with control. In 2018, SOD activity significantly reduced at 50 and 100 µg/mL. SOD activity in HepG2 cells decreased significantly at 100 µg/mL OP in 2019 and 2020. When the concentration of OP is 0, there is a significant difference between 2019 and the other three years. At 25 µg/mL of OP, SOD activity in 2019 was significantly different from that in 2018 and 2020. At 100 µg/mL of OP, there was a significant difference in SOD activity between 2017 and 2018, 2018 and 2020, 2017 and 2019, 2019 and 2020.
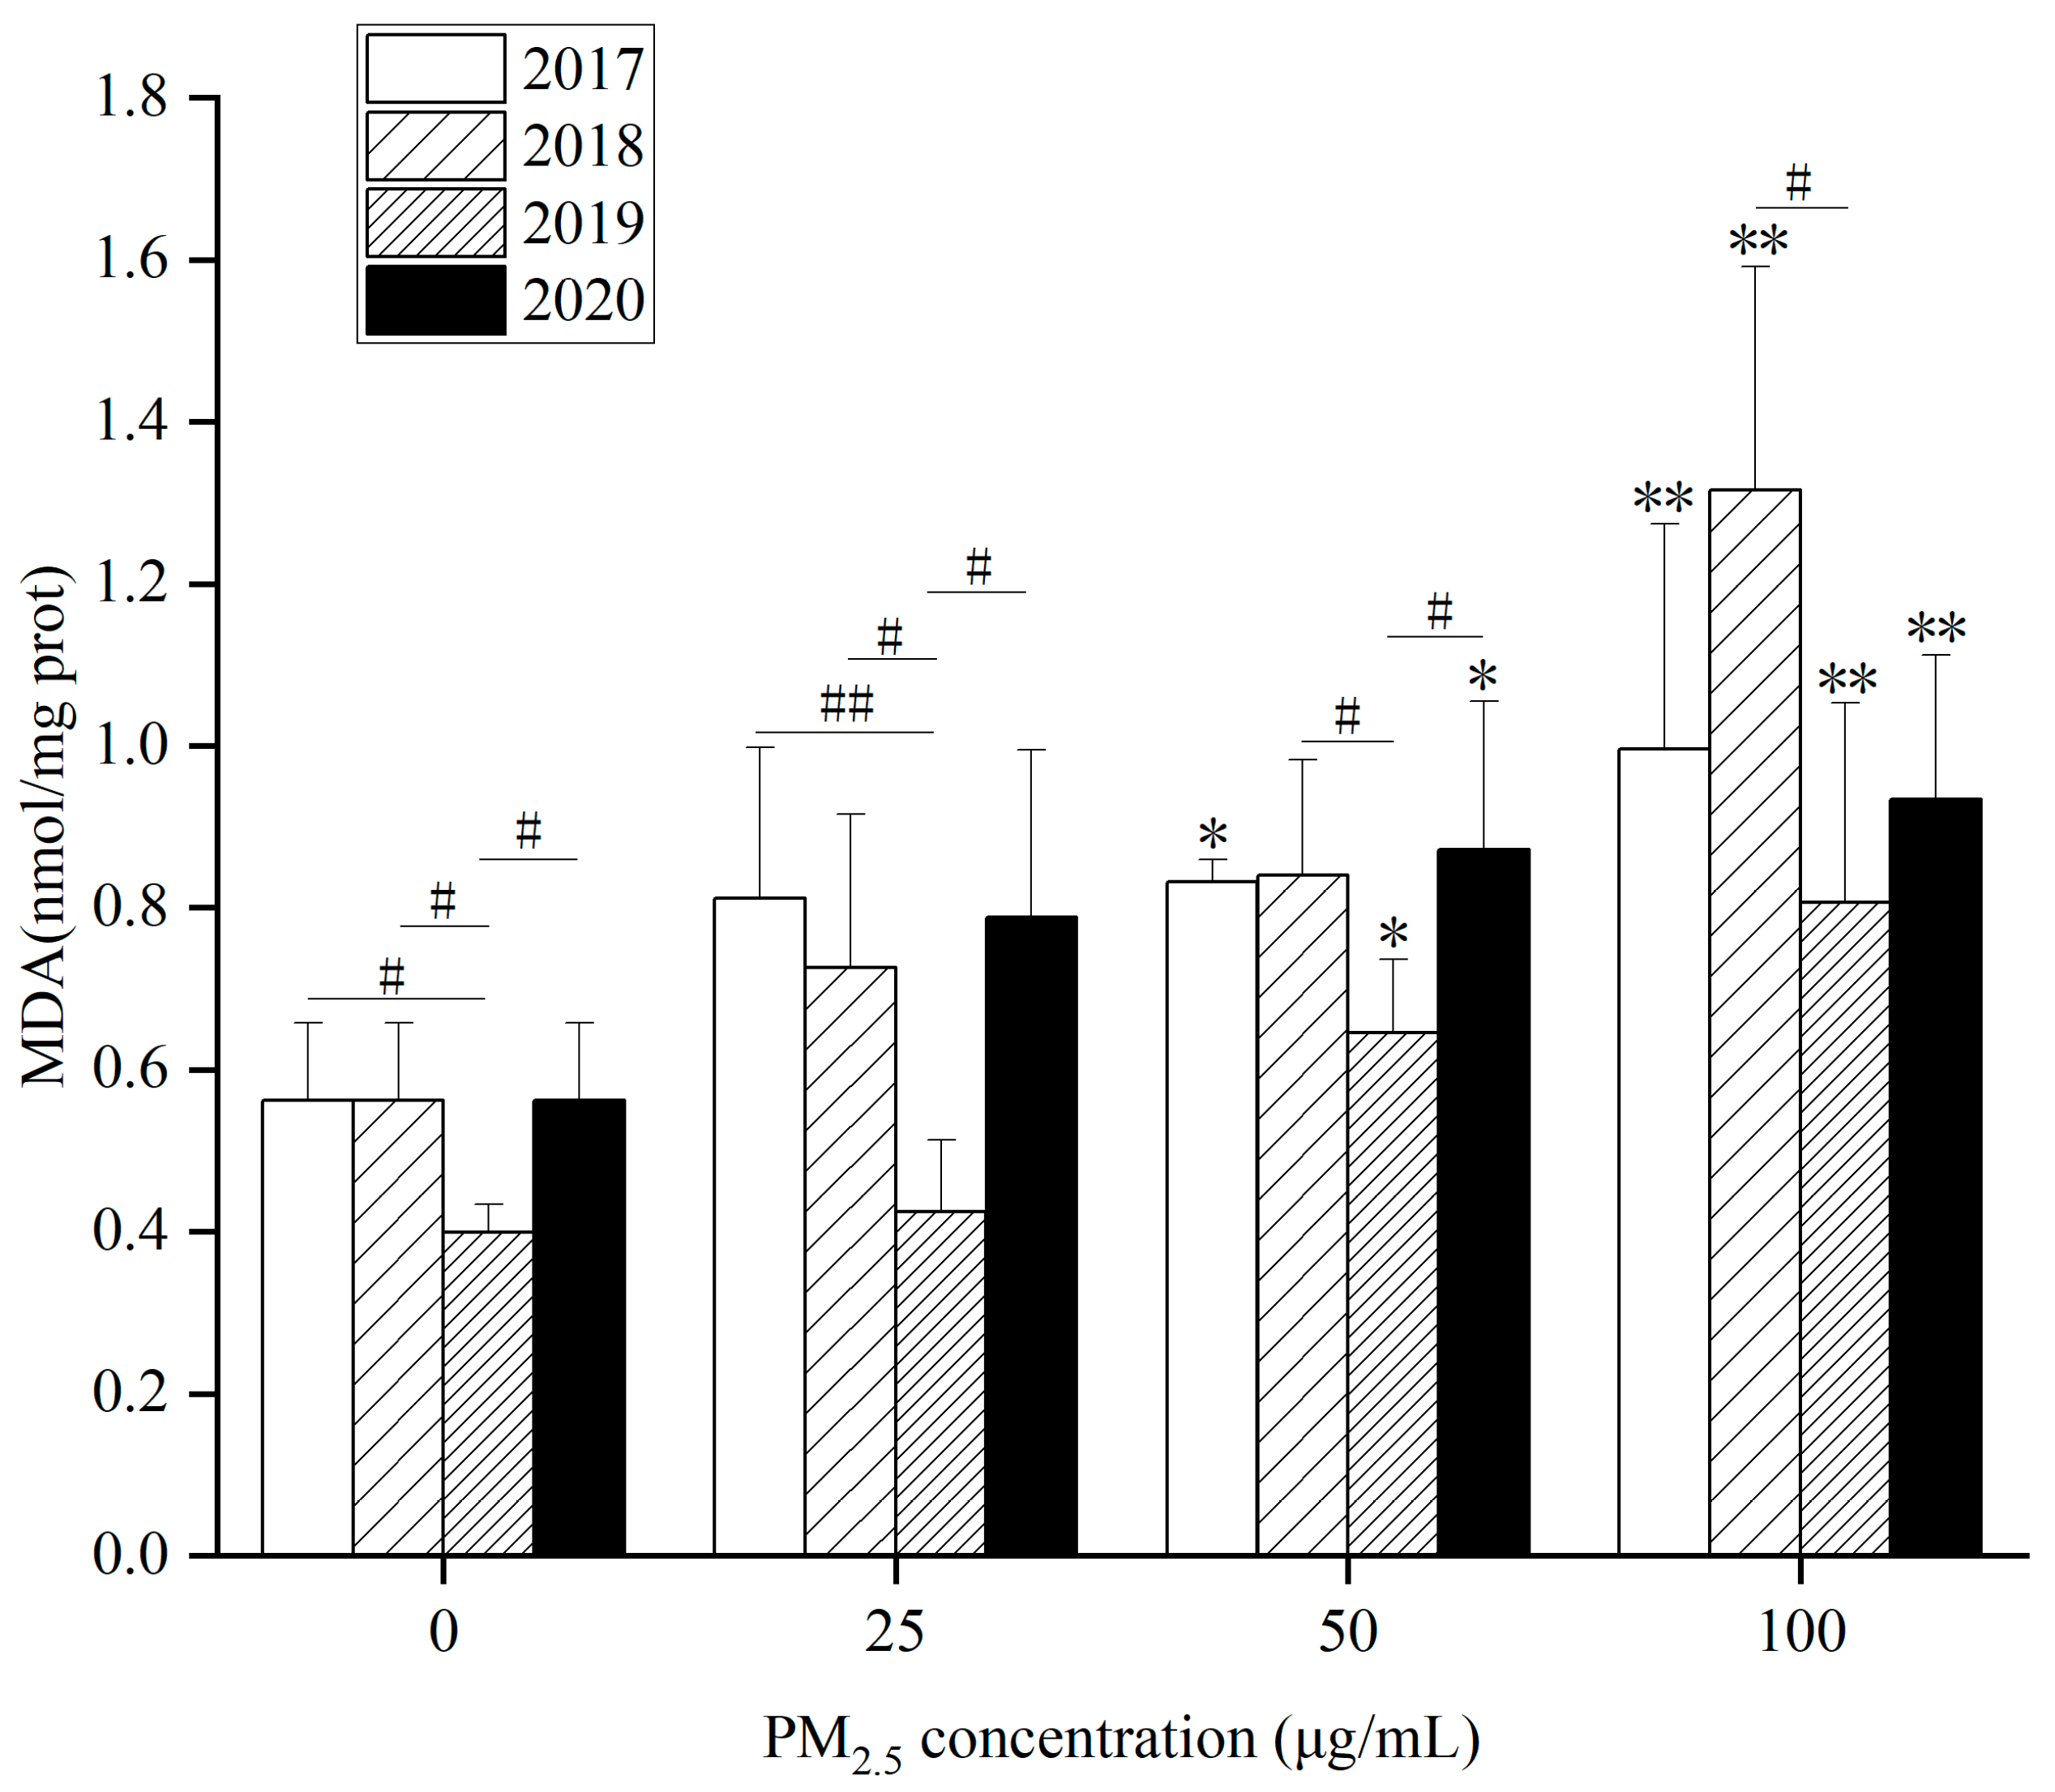
As for intracellular MDA content, (1) Figure 7 showed that MDA content in HepG2 cells elevated dramatically at 50 and 100 µg/mL in 2017, 2019 and 2020 after WP exposure at different concentrations for 24 h. When WP exposure concentration was 100 µg/mL in 2018, MDA content in HepG2 cells went up. (2) In Figure S8A, MDA content in HepG2 cells was remarkably raised at 100 µg/mL at 4 years after exposure to WSP at different concentrations for 24 h. (3) In Figure S8B, after exposure to OP at different concentrations for 24 h, MDA content in HepG2 cells at 50 and 100 µg/mL in 2017, 2018 and 2019 were observably augmented. In 2020, HepG2 cells’ MDA content went up significantly at 100 µg/mL. After WP, WSP exposure in 2019, the intracellular MDA content was reduced. However, MDA content after OP exposure was greater than that in the other three years.
WP, OP and WSP significantly increased intracellular MDA content, indicating that many lipid free radicals formed in cells after exposure to PM2.5. The decrease in intracellular SOD content suggested that the activity of the major antioxidant enzyme SOD decreased under the action of PM2.5, revealing that PM2.5 and its components not only promoted the formation of oxygen free radicals and lipid free radicals, but also inhibited the antioxidant system of cells (Figure 6, Figure 7 and Figures S7 and S8). Xie et al. found that after PM2.5 acted on HepG2 cells, intracellular ROS level and MDA content increased while SOD activity reduced, which was consistent with our results [47].

3.3.3. Effects of PM2.5 and Different Components on Cellular Lipids

As a raw material of lipids and a product of lipolysis, FFA is a potential mediator in the development of NAFLD. Under physiological conditions, FFA can be lipidated to produce TG (a major component of lipids) and can also be oxidized to provide energy [48]. However, hepatic FFA overload may promote oxidative stress and produce ROS, which may be key to the progression of simple steatosis to steatohepatitis [49].
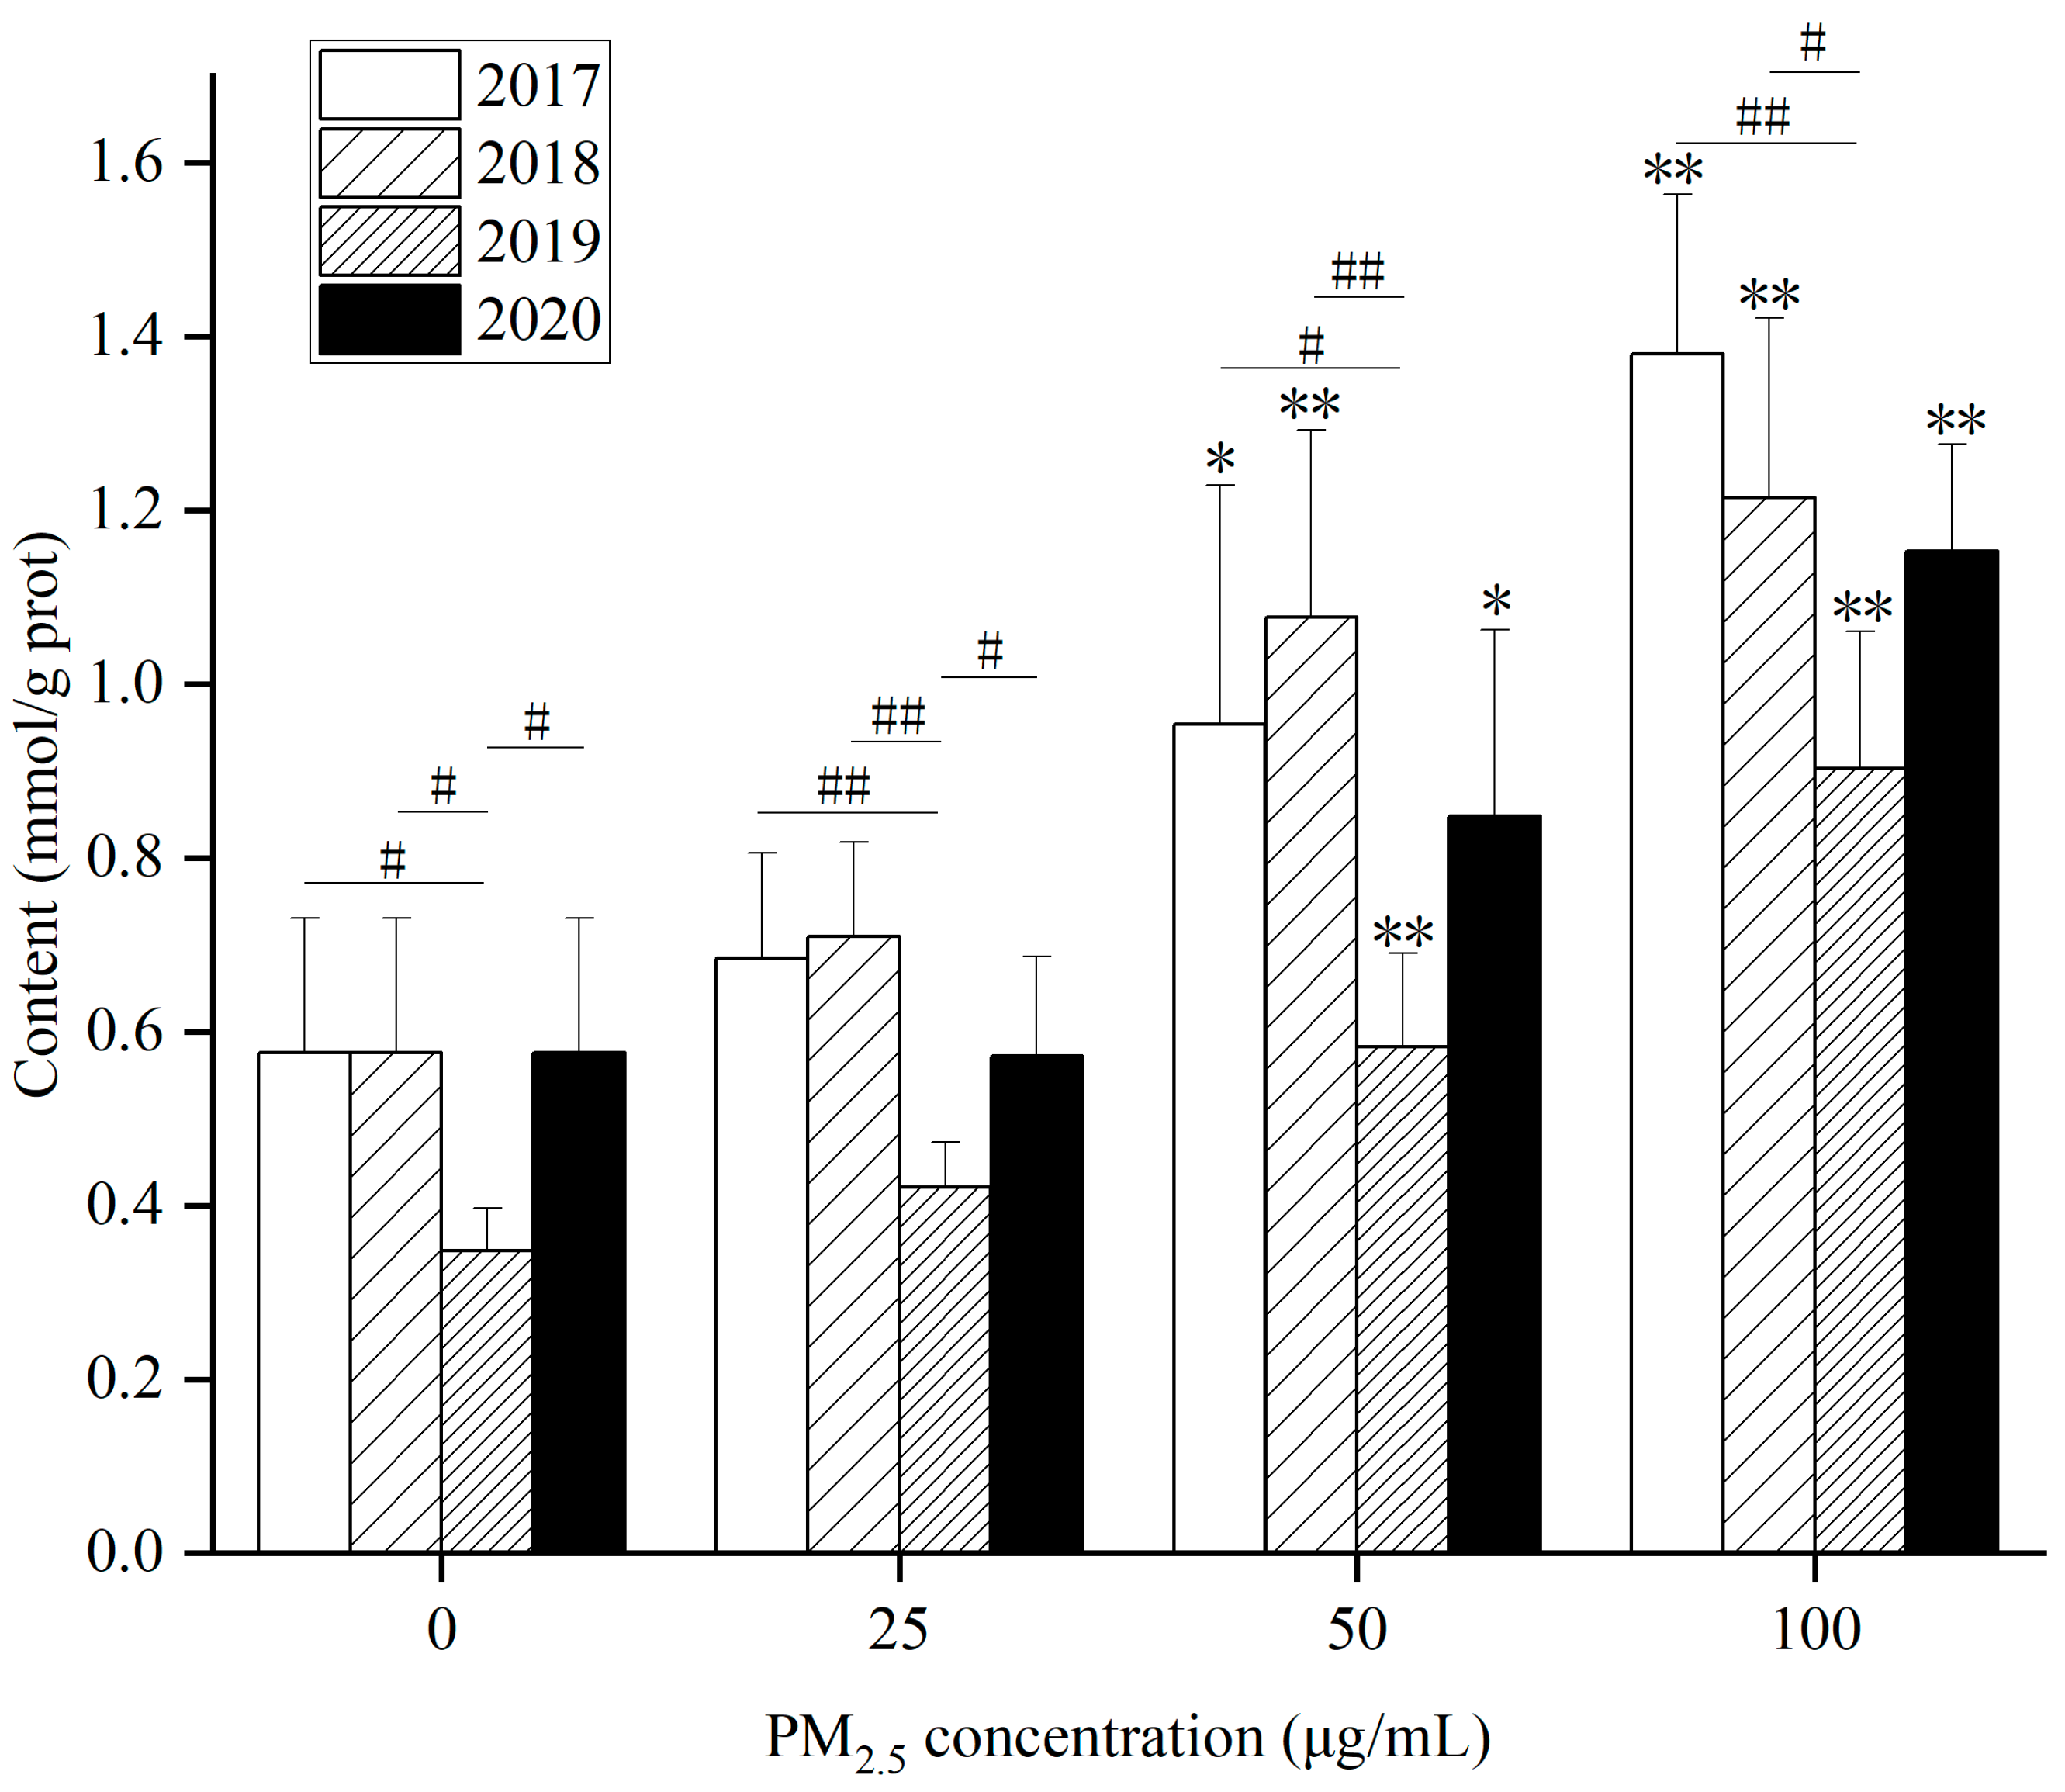
As for intracellular TG content after PM2.5 exposure, (1) WP significantly elevated TG content in HepG2 cells at 50 and 100 µg/mL after exposure for 24 h compared with the control for 4 years (Figure 8). (2) After exposure to WSP (Figure S9A), TG levels in HepG2 cells in 2017 and 2020 were markedly augmented at 50 and 100 µg/mL. In 2018 and 2019, TG levels rose, obviously only at 100 µg/mL. (3) After exposure to OP (Figure S9B), TG levels increased remarkably in 2017 at concentrations of 50 and 100 µg/mL. TG levels at 25 µg/mL exposure in 2018 were observably higher than those in the control. In 2019 and 2020, TG content increased significantly at 100 µg/mL. After exposure to the WP component, TG content was lower in 2019 compared to three years. On the contrary, TG content was higher in 2019 after WSP exposure.
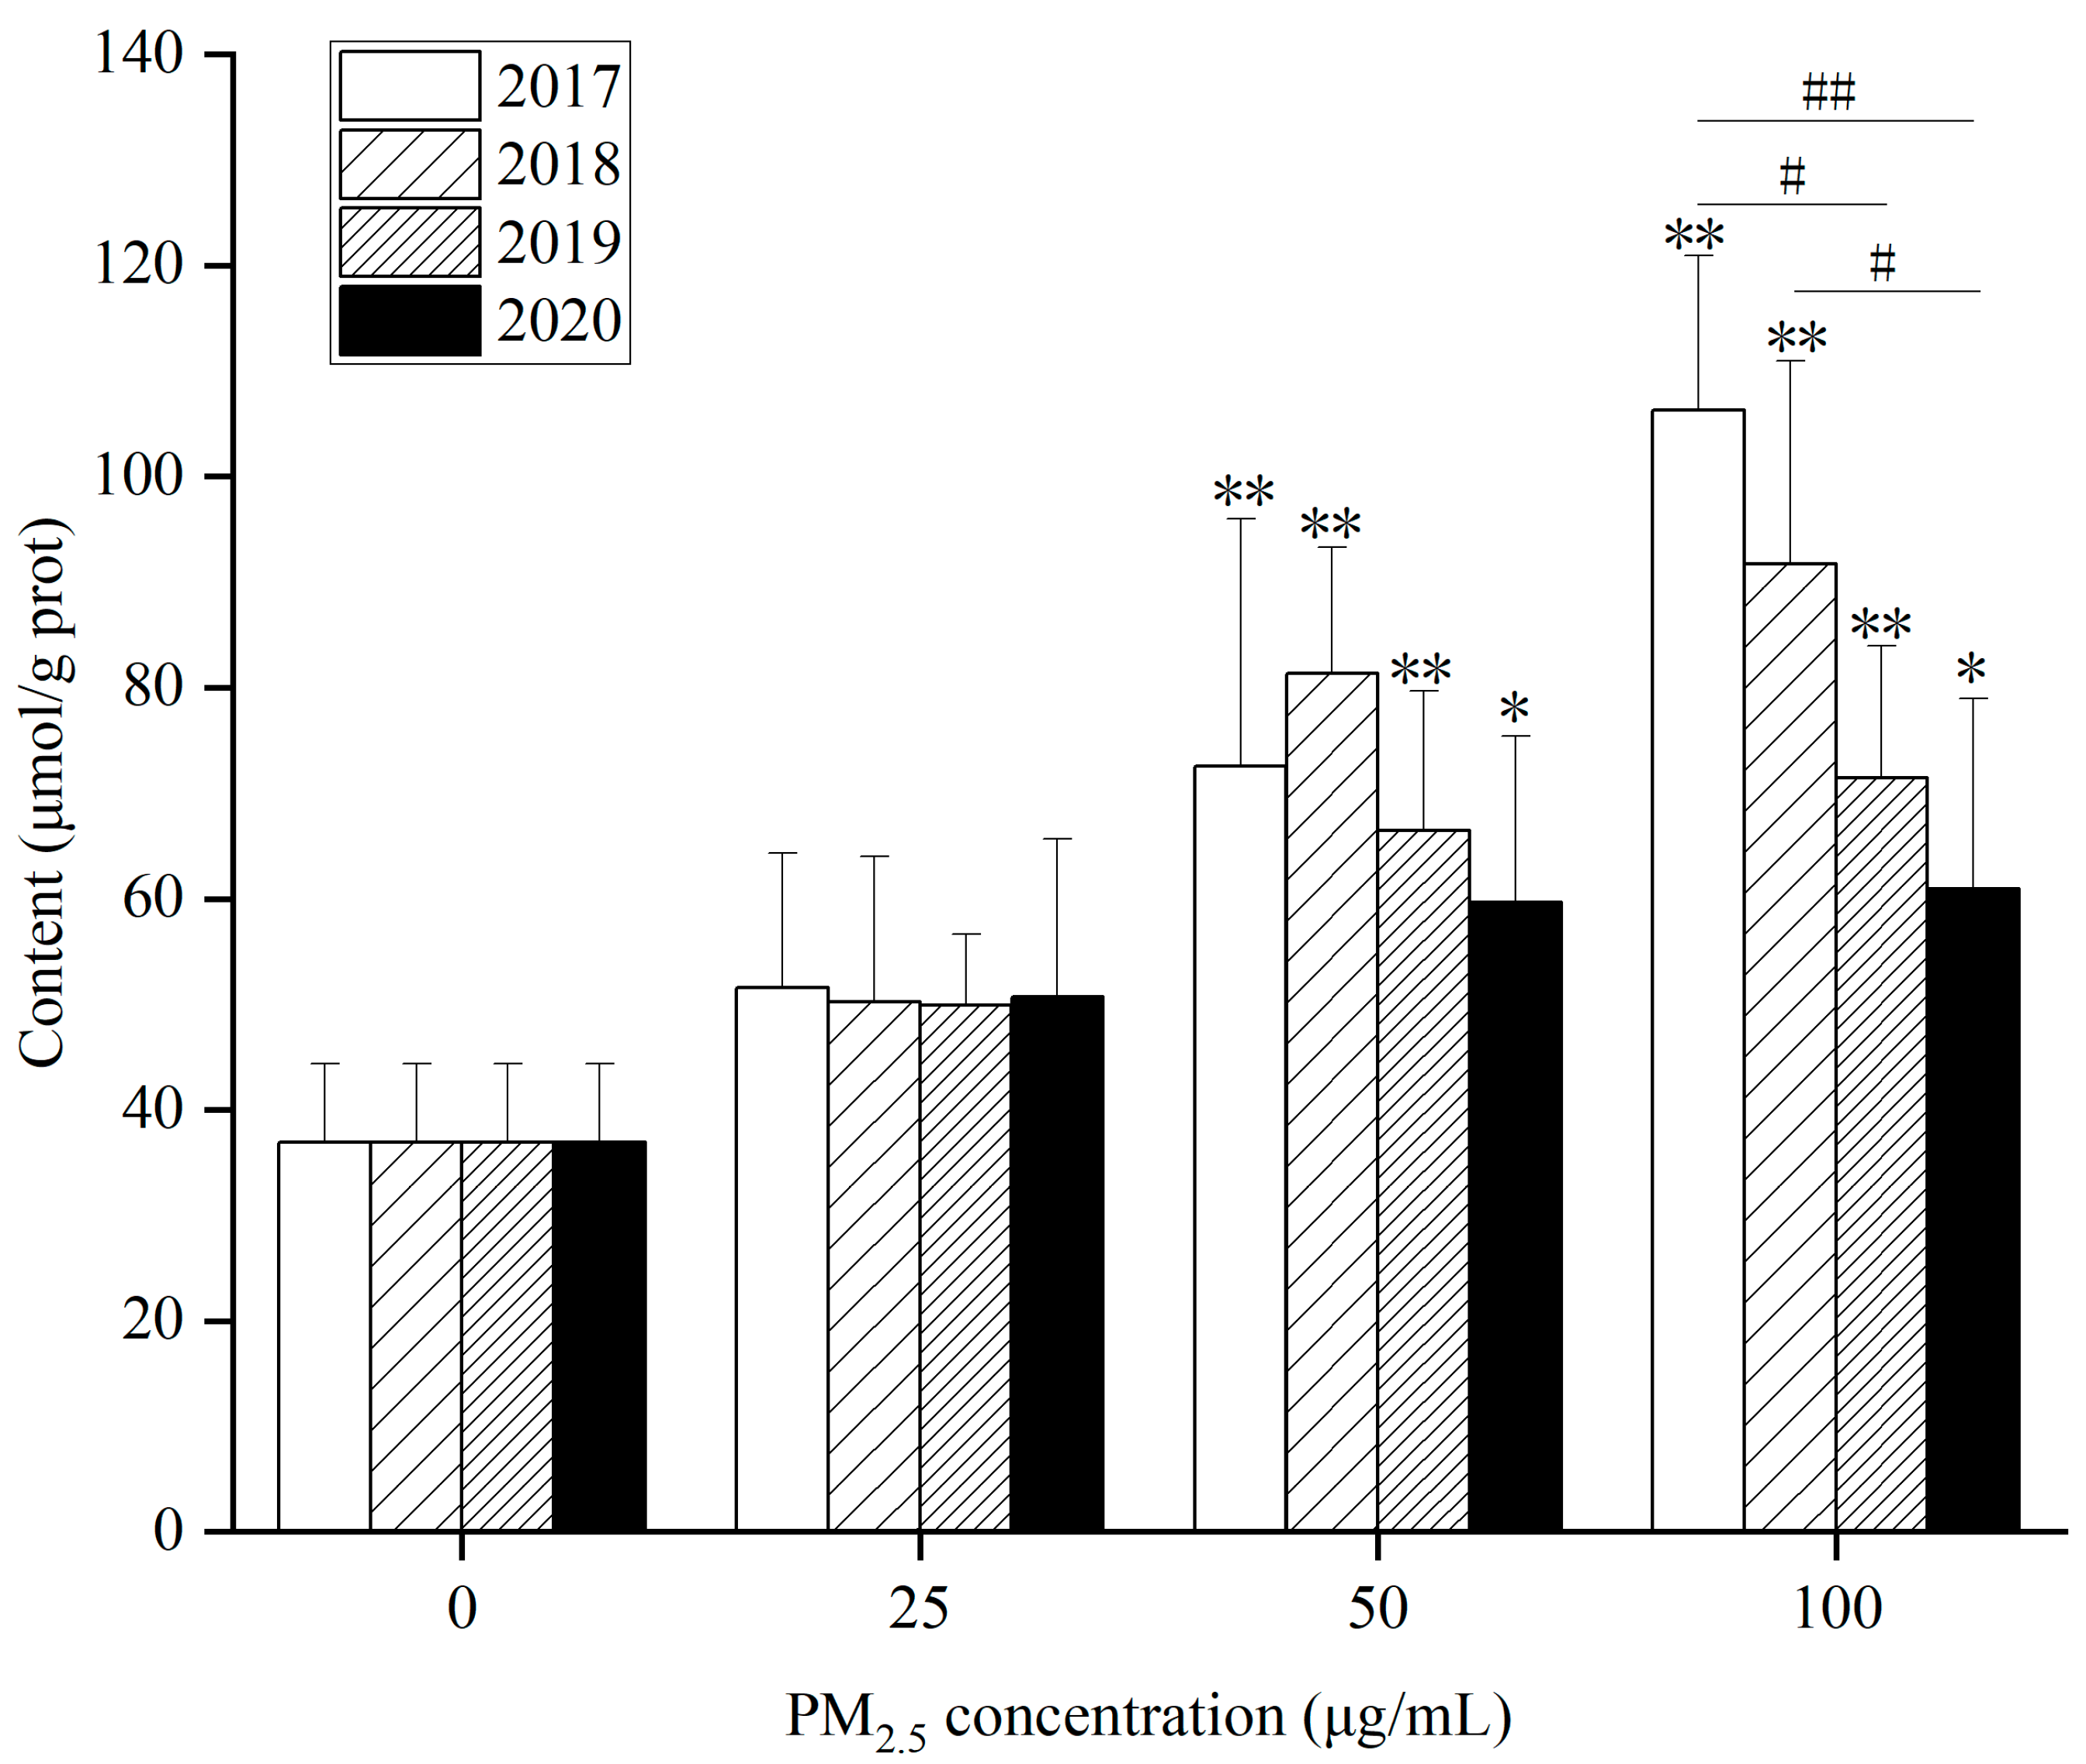
As for FFA content, (1) in Figure 9, FFA content in 4-year HepG2 cells at 50 and 100 µg/mL after WP exposure for 24 h rose remarkably compared with the control. (2) After exposure to WSP (Figure S10A), FFA content in HepG2 cells significantly augmented at 100 µg/mL for 4 years. (3) After exposure to OP (Figure S10B), FFA levels in 2017 elevated significantly at concentrations of 25, 50, and 100 µg/mL. FFA content increased dramatically at 100 µg/mL in the remaining three years compared with the control. After 100 µg/mL WP exposure, intracellular FFA levels decreased yearly from 2017–2020. After OP exposure, intracellular FFA levels were higher in 2017 compared to the other three years.
As seen in Figure 8, Figure 9 and Figures S9 and S10, after exposure to different components, the intracellular TG content varied significantly between years, especially WSP, while FFA content varied little between years. Due to the important role of FFA in lipid metabolism, increased FFA content and flux in the liver can reflect metabolic dysfunction. Therefore, lipid accumulation, especially TG accumulation caused by imbalances in lipogenesis and lipolysis, as well as metabolic changes associated with FFA, including lipid synthesis, lipid uptake, lipid oxidation, and lipid output, are critical to understanding the molecular mechanisms of PM2.5-induced lipid dysregulation [50].

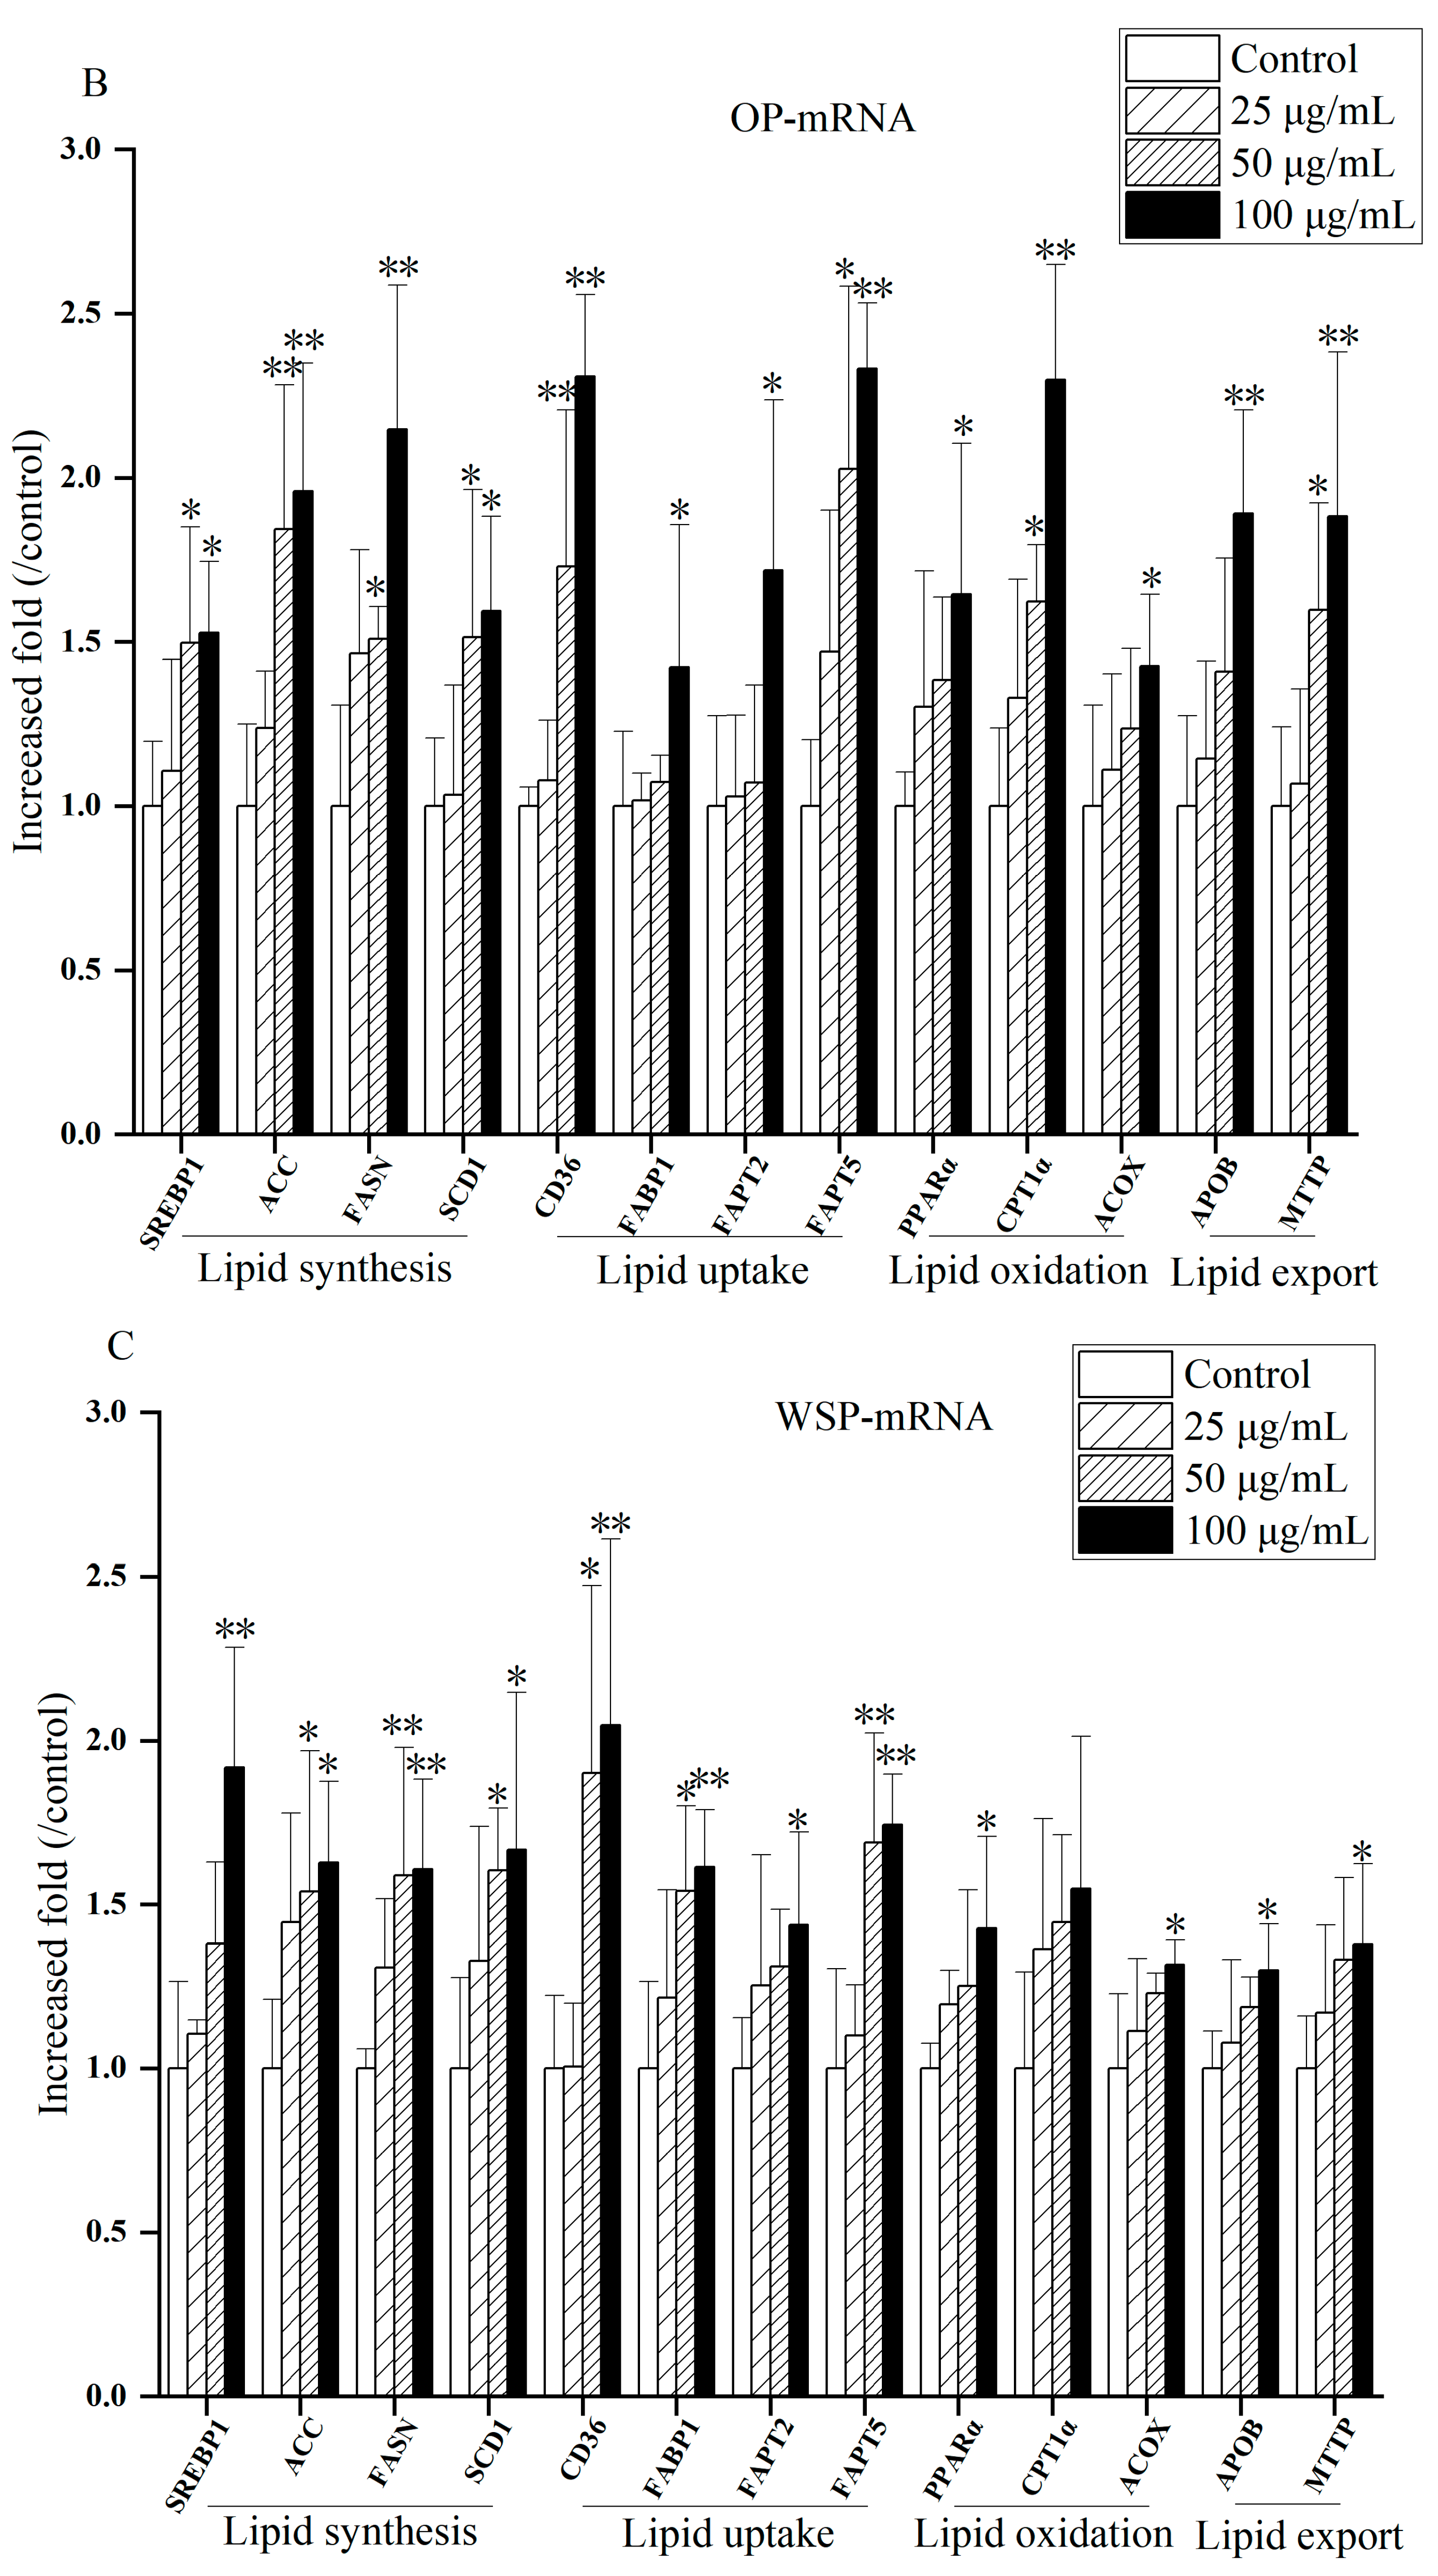
3.3.4. Effects of PM2.5 and Its Components on Lipid Metabolism in Cells

Hepatic dysfunction caused by oxidative stress and inflammatory response can interfere with lipid metabolism, which may promote the process of hepatic dyslipidemia and increase the risk of NAFLD. Therefore, we evaluated changes in mRNA levels of lipid synthesis, uptake, oxidation, and output, which are indicators of lipid metabolism in the liver.
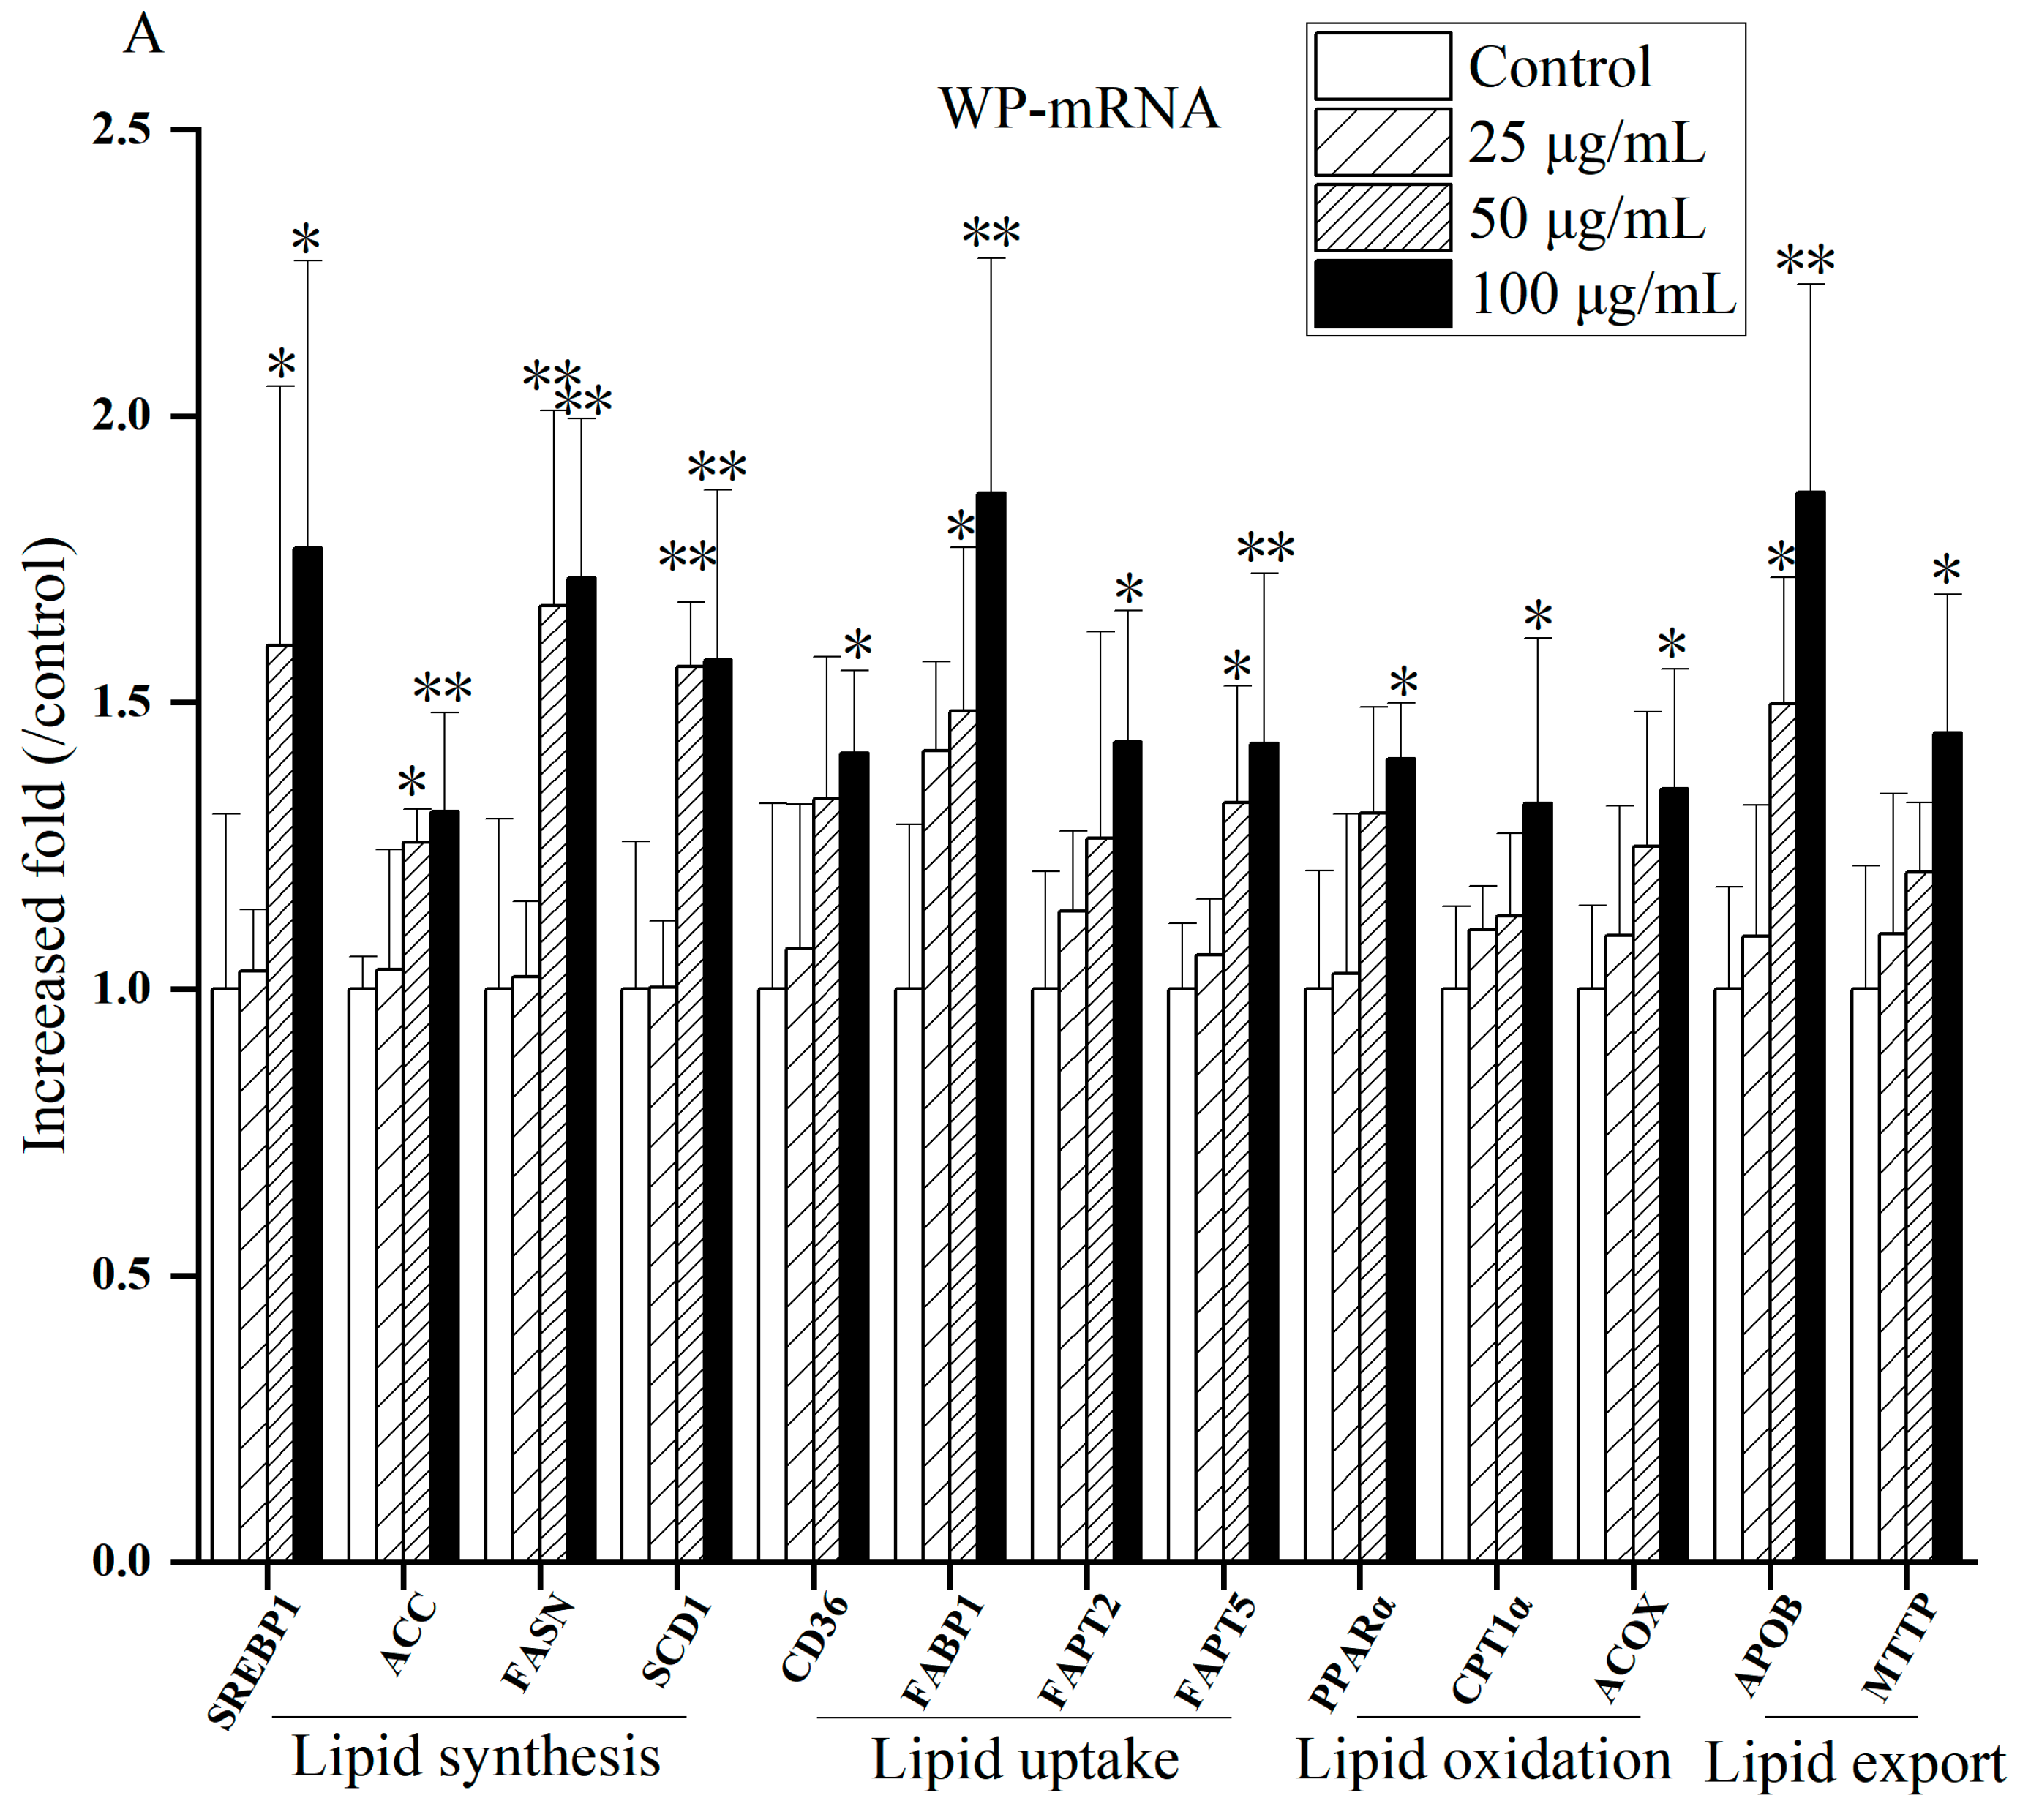
Figure 10 and Figures S11–S13 present gene expression related to lipid metabolism after exposure to different components of PM2.5 in 2017. As exposure levels raised, compared to control, the mRNA expressions of lipid synthesis genes (SREBP1, ACC, FASN, SCD1), lipid uptake genes (CD36, FABP1, FAPT2, FAPT5), lipid oxidation genes (PPAR-α, CPTα, ACOX1), and lipid transport genes (APOB, MTTP) were up-regulated. The mRNA expression of some genes (SREBP1, ACC, FASN, SCD1, CD36, FABP1, FAPT2, FAPT5, PPAR-α, ACOX1, APOB, MTTP) at high concentrations (50 or 100 µg/mL) of PM2.5 were significant (p < 0.05 or p < 0.01), suggesting that PM2.5 may cause lipid metabolism disturbances. It is worth noting that the mRNA expression of lipid oxidation genes of WP and OP components in 2018 and three components (WP, WSP and OP) in 2019 elucidated at 100 µg/mL. The mRNA expression of some lipid oxidation genes decreased after exposure to OP and WSP at a concentration of 100 µg/mL in 2020. The mRNA expression of the lipid transport gene MTTP also lessened after WP exposure.
In this study, we first analyzed the mRNA expression levels of genes related to lipid synthesis treated with PM2.5 and its components. SREBP1 regulates the expression of ACC, FASN and SCD1 [51,52]. ACC is a rate-limiting enzyme that catalyzes the first step of fatty acid anabolism [53]. FASN is a crucial enzyme in de novo synthesis of fatty acids [54]. SCD1 is a rate-limiting enzyme that catalyzes the synthesis of unsaturated fats [55]. Our results found that the mRNA expression of lipid synthesis genes (SREBP1, ACC, FASN, SCD1) augmented observably under the influence of PM2.5 and its components from 2017 to 2020 compared with the control group. These results indicate that exposure to PM2.5 and its components induces lipid synthesis in HepG2 cells, and the greater the concentration of PM2.5 and its components, the greater the impact on lipid synthesis, which is consistent with previous findings [56].
CD36, FABP1, FAPT2 and FAPT5 are key gene molecules that regulate FFA uptake in the liver [57]. CD36 is a membrane protein with multiple metabolic functions that mediates FFA transmembrane transport to hepatocytes via FATPs [58,59]. FABP can enhance fatty acid intake [60]. In this study, the mRNA expression of lipid uptake genes (CD36, FABP1, FAPT2, FAPT5) was obviously raised under the influence of PM2.5 and its components compared with the control group during 2017–2020. This suggests that exposure to PM2.5 and its components affects lipid uptake in HepG2 cells. Studies have illustrated that activated CD36, FABPs and FATPs promoted lipid uptake and transport, while alleviated gene expression can improve lipid accumulation in hepatocytes [59,61], which is consistent with our results.
The activation of PPARα target gene promotes the oxidation of fatty acids, promotes decomposition, and reduces the synthesis and secretion of TG. CPT1α and ACOX1 are key rate-limiting enzymes in lipid oxidation, catalyzing mitochondrial and peroxisomal β oxidation [62]. The over-expression of lipid oxidation genes and the dysfunction of lipid oxidation can cause the production of excessive ROS, which may induce diseases through oxidative stress [59].In this study, under the influence of PM2.5 and its components, mRNA expressions of lipid oxidation genes (PPAR-α, CPT1α and ACOX1) were significantly elevated in 2017 compared with the control group, which was consistent with the results of Ding et al. [58]. We also found that the mRNA expression of the above lipid oxidation genes decreased from 2018 to 2020. Giving that the mRNA expressions of PPAR-α, CPT1α and ACOX1 decreased under short-term exposure to PM2.5, which is related to lipidolysis [51]. And the inhibited lipolytic genes and the weakened oxidation capacity promote lipid deposition, related to down-regulated PPARα and its regulated CPT1 and ACOX1 [50]. Thus, the research results on the role of lipid oxidation in NAFLD are not uniform, and further research is needed.
Elevated very low-density lipoprotein (VLDL) in plasma is also a characteristic of NAFLD [63]. VLDL are endogenous triglycerides mainly synthesized by liver cells. Newborn VLDLs produced in the liver are surrounded by phospholipids, cholesterol esters, and specific apolipoproteins, of which APOB is the most important [64]. APOB cotranslates lipidization in the endoplasmic reticulum lumen via MTTP and further lipidization in the Golgi apparatus [65]. Excess TG can be secreted as VLDL to relieve TG accumulation [66]. In this study, mRNA expression of lipid exporting gene MTTP was significantly reduced in cells after WP treatment in 2020. As a lipid transporter, MTTP is mainly involved in VLDL transport and secretion formed by the combination of free fatty acids and APOB [67]. When MTTP is reduced or dysfunction occurs, the output of TG in hepatocytes diminishes, and lipid droplet formation increases, resulting in hepatic lipid deposition [68]. In the present study, from 2017 to 2019, the mRNA expression of lipid export genes (APOB and MTTP) was markedly raised after PM2.5 and its components were treated compared with the control, indicating that more lipids were removed from liver tissues. Still, the role of lipid synthesis may be more significant, leading to intracellular FFA and TG accumulation.

3.4. Correlation Analysis

We also investigated the correlation between metals and PAHs in PM2.5 with HepG2 cytotoxicity, lipid and lipid metabolism biomarkers during 2017–2020. Based on the above results of toxicology, lipid and lipid metabolism indexes caused by the main components of PM2.5 in Taiyuan from 2017 to 2020, we selected metals (Zn, Pb, Cu and Cr) and PAHs (FLA, PYR, CHR, BbF and IcdP) with high pollutant concentrations and biomarkers (IL-6, TNF-α, ROS, SOD, MDA, TG and FFA) with significant changes and differences when the whole particle exposure concentration was 100 μg/mL in the present results (Table 6, Table 7, Table 8 and Table 9), and conducted correlation statistical analysis.
The results showed (Table 7) that Zn, Pb, Cu and Cr in PM2.5 with high levels were correlated with IL-6, ROS, SOD and MDA to varying degrees. Liu et al. revealed that the combined exposure of Cr, Mn, Cd, Zn, Cu, and Pb led to an increase in MDA content and a decrease in SOD content in HepG2 cells [69]. Masashi et al. found that Cu exposure induced the secretion of pro-inflammatory cytokines and increased neuroinflammation [70]. This suggests that PM2.5-bound metals are associated with oxidative stress in hepatocytes.
As can be seen from Table 6, Pb, Cu and Cr are positively correlated with IL-6 and ROS, and negatively correlated with SOD and MDA. There was a significant correlation between Cu and ROS. There was a significant negative correlation between Cr and SOD. Cr was negatively correlated with TG. The correlation between Zn and biomarkers was weak. Table 7 shows that TNF-α is positively correlated with CHR and IcdP. MDA was positively correlated with FLA, PYR, CHR, BbF and IcdP, and significantly positively correlated with FLA and PYR. TG and FFA were positively correlated with CHR, BbF and IcdP. FFA was significantly correlated with CHR.
Table 8 and Table 9 screen out several lipid metabolism genes related to the main components of pollutants (metals and PAHs) in 2017–2020. Table 8 shows that metal Pb and Cr are negatively correlated with SREBP1, FAPT5 and CPTα. FAPT5 was also negatively correlated with Cu. Zn was positively correlated with PPARα and ACOX, and significantly positively correlated with APOB. FAPT2 was negatively correlated with Zn and Cu. In addition, FABP1 was positively correlated with Pb and Cu. MTTP was positively correlated with Pb and Cr. As can be seen from Table 9, the overall correlation between PAHs and lipid metabolism genes was weak. Among them, FASN was negatively correlated with CHR. FAPT2 was positively correlated with PYR.
Liu et al. found that Cr participated in lipid metabolism by enhancing the activities of plasma lecithin cholesterol acyltransferase (LCAT) and liver endothelial cell lipase (HEL) in hyperlipidemia rats [71]. Similarly, we found that Cr was negatively correlated with TG. Also, FLA (PAH monomer) exposure to cells will produce toxic effects on them, namely, decreased cell survival rate, cell membrane damage, and decreased MDA content [72]. In this study, MDA is correlated with FLA, PYR, CHR, BbF and IcdP (Table 8). TG and FFA were correlated with CHR, BbF and IcdP. Of note, Table 8 and Table 9 showed the correlation between the main components of pollutants (metals and PAHs) and several lipid metabolism genes from 2017 to 2020. The results showed that Pb and Cr were negatively correlated with SREBP1, FAPT5 and CPTα. FAPT5 was also negatively correlated with Cu. Zn was positively correlated with PPARα and ACOX, and significantly positively correlated with APOB. FAPT2 was negatively correlated with Zn and Cu. In addition, FABP1 was positively correlated with Cu. MTTP was also positively correlated with Cr. A study revealed that exposure to Cr, Cu and Zn caused lipid peroxidation and liver damage [73]. Another study found that high levels of Cr, Cu and Pb may be associated with changes in the risk of NAFLD [74]. Some compounds were positively correlated with biomarkers, indicating that compounds could up-regulate related-gene expression. Other components were negatively associated with biomarkers, suggesting that compounds could down-regulate related-gene expression. This hints that the interaction between compounds and genes can lead to abnormal genetic changes, which in turn affect the function of liver tissue and cause liver toxicity. The relationships between PM2.5-bound metals or PAHs and lipids metabolism still need further study.

4. Conclusions

The present study showed that PM2.5 pollution still appeared in Taiyuan during heating in recent years. Among them, 2017 was the most polluted year. Coal, biomass burning and motor vehicle emissions were the primary sources of pollution for four years. There is no carcinogenic and non-carcinogenic risk of PM2.5-metals from 2017 to 2020. PM2.5-bound PAHs in 2017 and 2018 had a potential cancer risk and there were no non-carcinogenic risks in 4 years. On the other hand, different concentrations of PM2.5 components (WP, WSP, and OP) in 4 years caused oxidative stress and inflammatory response in HepG2 cells, accumulation of TG and FFA, eventually leading to lipid metabolism disorders. Exposure to WP, WSP, and OP induced abnormal changes in intracellular mRNA expression of lipid genes. Relatively speaking, OP is a key component of cellular hepatotoxicity. Besides, some metals and PAHs in PM2.5 were correlated with cytotoxic biomarkers and lipid metabolism genes in HepG2 cells.
Consequently, the study of PM2.5 pollution levels, components, sources and health risks under different spatial and temporal conditions is of positive significance for evaluating the characteristics of PM2.5 pollution. Exploring the liver toxicology of PM2.5 based on liver cytotoxicity and lipid metabolism disorders and discovering the key components of PM2.5 will be of great scientific value in elucidating the relationship between PM2.5 and liver diseases.

Supplementary Materials

The following supporting information can be downloaded at: https://www.mdpi.com/article/10.3390/atmos15010032/s1.

Author Contributions

Conceptualization, R.L. and M.Z.; methodology, L.B. and M.Z.; validation, L.B., S.C. and W.C.; formal analysis, M.Z. and L.B.; investigation, Z.L. and J.Y.; resources, C.D.; data curation, L.B.; writing—original draft preparation, L.B.; writing—review and editing, R.L.; supervision, R.L.; project administration, R.L.; funding acquisition, R.L. All authors have read and agreed to the published version of the manuscript.

Funding

This research was funded by the National Natural Science Foundation of China, grant number 22176116.

Institutional Review Board Statement

This study did not involve humans or animals.

Informed Consent Statement

Not applicable.

Data Availability Statement

Data is contained within the article or Supplementary Material.

Conflicts of Interest

The authors declare no conflicts of interest.

References

  1. Zhang, Y.S.; Ma, G.X.; Yu, F.; Cao, D. Health Damage Assessment Due to PM2.5 Exposure during Haze Pollution Events in Beijing-Tianjin-Hebei Region in January 2013. Natl. Med. J. China 2013, 93, 5–8. [Google Scholar] [CrossRef]
  2. Li, B.; Ma, Y.; Zhou, Y.; Chai, E. Research Progress of Different Components of PM2.5 and Ischemic Stroke. Sci. Rep. 2023, 13, 15965. [Google Scholar] [CrossRef] [PubMed]
  3. Badaloni, C.; Cesaroni, G.; Cerza, F.; Davoli, M.; Brunekreef, B.; Forastiere, F. Effects of Long-Term Exposure to Particulate Matter and Metal Components on Mortality in the Rome Longitudinal Study. Environ. Int. 2017, 109, 146–154. [Google Scholar] [CrossRef] [PubMed]
  4. Liang, C.S.; Duan, F.K.; Bin, K.H.; Ma, Y.L. Review on Recent Progress in Observations, Source Identifications and Countermeasures of PM2.5. Environ. Int. 2016, 86, 150–170. [Google Scholar] [CrossRef] [PubMed]
  5. Maier, M.L.; Balachandran, S.; Sarnat, S.E.; Turner, J.R.; Mulholland, J.A.; Russell, A.G. Application of an Ensemble-Trained Source Apportionment Approach at a Site Impacted by Multiple Point Sources. Environ. Sci. Technol. 2013, 47, 3743–3751. [Google Scholar] [CrossRef] [PubMed]
  6. O’Day, P.A.; Pattammattel, A.; Aronstein, P.; Leppert, V.J.; Forman, H.J. Iron Speciation in Respirable Particulate Matter and Implications for Human Health. Environ. Sci. Technol. 2022, 56, 7006–7016. [Google Scholar] [CrossRef] [PubMed]
  7. Nguyen, T.P.M.; Bui, T.H.; Nguyen, M.K.; Ta, T.N.; Tran, T.M.H.; Nguyen, Y.N.; Nguyen, T.H. Assessing Pollution Characteristics and Human Health Risk of Exposure to PM2.5-Bound Trace Metals in a Suburban Area in Hanoi, Vietnam. Hum. Ecol. Risk Assess. 2022, 28, 433–454. [Google Scholar] [CrossRef]
  8. Thulasinathan, B.; Ganesan, V.; Manickam, P.; Kumar, P.; Govarthanan, M.; Chinnathambi, S.; Alagarsamy, A. Simultaneous Electrochemical Determination of Persistent Petrogenic Organic Pollutants Based on AgNPs Synthesized Using Carbon Dots Derived from Mushroom. Sci. Total Environ. 2023, 884, 163729. [Google Scholar] [CrossRef]
  9. Ambade, B.; Sankar, T.K.; Kumar, A.; Gautam, A.S.; Gautam, S. COVID-19 Lockdowns Reduce the Black Carbon and Polycyclic Aromatic Hydrocarbons of the Asian Atmosphere: Source Apportionment and Health Hazard Evaluation. Environ. Dev. Sustain. 2021, 23, 12252–12271. [Google Scholar] [CrossRef]
  10. Chen, W.; Luo, Y.; Quan, J.; Zhou, J.; Yi, B.; Huang, Z. PM2.5 Induces Renal Tubular Injury by Activating NLRP3-Mediated Pyroptosis. Ecotoxicol. Environ. Saf. 2023, 265, 115490. [Google Scholar] [CrossRef]
  11. Chen, Y.; Luo, X.S.; Zhao, Z.; Chen, Q.; Wu, D.; Sun, X.; Wu, L.; Jin, L. Summer–Winter Differences of PM2.5 Toxicity to Human Alveolar Epithelial Cells (A549) and the Roles of Transition Metals. Ecotoxicol. Environ. Saf. 2018, 165, 505–509. [Google Scholar] [CrossRef] [PubMed]
  12. Xiang, F.; Cai, W.; Hou, Q.; Gai, J.; Dong, X.; Li, L.; Liu, Z.; Tian, X.; Shan, C.; Guo, Z. Comparative Analysis of the Microbial Community Structure in Light-Flavor Daqu in Taiyuan and Suizhou Regions, China. LWT 2023, 177, 114599. [Google Scholar] [CrossRef]
  13. Yang, L.; Liu, G.; Fu, L.; Zhong, W.; Li, X.; Pan, Q. DNA Repair Enzyme OGG1 Promotes Alveolar Progenitor Cell Renewal and Relieves PM2.5-Induced Lung Injury and Fibrosis. Ecotoxicol. Environ. Saf. 2020, 205, 111283. [Google Scholar] [CrossRef] [PubMed]
  14. Zhu, D.; Liu, J.; Wang, J.; Zhang, L.; Jiang, M.; Liu, Y.; Xiong, Y.; He, X.; Li, G. Transcriptome and Pan-Cancer System Analysis Identify PM2.5-Induced Stanniocalcin 2 as a Potential Prognostic and Immunological Biomarker for Cancers. Front. Genet. 2023, 13, 1077615. [Google Scholar] [CrossRef] [PubMed]
  15. Ye, D.; Klein, M.; Mulholland, J.A.; Russell, A.G.; Weber, R.; Edgerton, E.S.; Chang, H.H.; Sarnat, J.A.; Tolbert, P.E.; Sarnat, S.E. Estimating Acute Cardiovascular Effects of Ambient PM2.5 Metals. Environ. Health Perspect. 2018, 126, 027007. [Google Scholar] [CrossRef] [PubMed]
  16. Zhou, X.; Dai, H.; Jiang, H.; Rui, H.; Liu, W.; Dong, Z.; Zhang, N.; Zhao, Q.; Feng, Z.; Hu, Y.; et al. MicroRNAs: Potential Mediators between Particulate Matter 2.5 and Th17/Treg Immune Disorder in Primary Membranous Nephropathy. Front. Pharmacol. 2022, 13, 968256. [Google Scholar] [CrossRef] [PubMed]
  17. Lin, L.; Tian, L.; Li, T.; Sun, M.; Duan, J.; Yu, Y.; Sun, Z. Microarray Analysis of MRNA Expression Profiles in Liver of Ob/Ob Mice with Real-Time Atmospheric PM2.5 Exposure. Environ. Sci. Pollut. Res. 2022, 29, 76816–76832. [Google Scholar] [CrossRef]
  18. Liu, C.; Xu, X.; Bai, Y.; Wang, T.Y.; Rao, X.; Wang, A.; Sun, L.; Ying, Z.; Gushchina, L.; Maiseyeu, A.; et al. Air Pollution-Mediated Susceptibility to Inflammation and Insulin Resistance: Influence of CCR2 Pathways in Mice. Environ. Health Perspect. 2014, 122, 17–26. [Google Scholar] [CrossRef]
  19. Zheng, Z.; Zhang, X.; Wang, J.; Dandekar, A.; Kim, H.; Qiu, Y.; Xu, X.; Cui, Y.; Wang, A.; Chen, L.C.; et al. Exposure to Fine Airborne Particulate Matters Induces Hepatic Fibrosis in Murine Models. J. Hepatol. 2015, 63, 1397–1404. [Google Scholar] [CrossRef]
  20. Zheng, Z.; Xu, X.; Zhang, X.; Wang, A.; Zhang, C.; Hüttemann, M.; Grossman, L.I.; Chen, L.C.; Rajagopalan, S.; Sun, Q.; et al. Exposure to Ambient Particulate Matter Induces a NASH-like Phenotype and Impairs Hepatic Glucose Metabolism in an Animal Model. J. Hepatol. 2013, 58, 148–154. [Google Scholar] [CrossRef]
  21. Xu, Y.; Li, Z.; Liu, Y.; Pan, B.; Peng, R.; Shao, W.; Yang, W.; Chen, M.; Kan, H.; Ying, Z.; et al. Differential Roles of Water-Insoluble and Water-Soluble Fractions of Diesel Exhaust Particles in the Development of Adverse Health Effects Due to Chronic Instillation of Diesel Exhaust Particles. Chem. Res. Toxicol. 2021, 34, 2450–2459. [Google Scholar] [CrossRef] [PubMed]
  22. Zhang, M.; Li, Z.; Xu, M.; Yue, J.; Cai, Z.; Yung, K.K.L.; Li, R. Pollution Characteristics, Source Apportionment and Health Risks Assessment of Fine Particulate Matter during a Typical Winter and Summer Time Period in Urban Taiyuan, China. Hum. Ecol. Risk Assess. 2020, 26, 2737–2750. [Google Scholar] [CrossRef]
  23. Zhang, M. Study of Atmospheric Fine Particulate Matter Exposure- Induced Liver Injuries and Related Molecular Mechanisms; Shanxi University: Taiyuan, China, 2022. [Google Scholar]
  24. Wang, Y.; Zhang, M.; Li, Z.; Yue, J.; Xu, M.; Zhang, Y.; Yung, K.K.L.; Li, R. Fine Particulate Matter Induces Mitochondrial Dysfunction and Oxidative Stress in Human SH-SY5Y Cells. Chemosphere 2019, 218, 577–588. [Google Scholar] [CrossRef] [PubMed]
  25. Liu, Q.; Diamond, M.L.; Gingrich, S.E.; Ondov, J.M.; Maciejczyk, P.; Stern, G.A. Accumulation of Metals, Trace Elements and Semivolatile Organic Compounds on Exterior Window Surfaces in Baltimore. Environ. Pollut. 2003, 122, 51–61. [Google Scholar] [CrossRef] [PubMed]
  26. Li, L.J.; Wen, Y.P.; Peng, L.; Bai, H.L.; Liu, F.X.; Shi, M.X. Characteristic of Elements in PM2.5 and Health Risk Assessment of Heavy Metals during Heating Season in Taiyuan. Huan Jing Ke Xue 2014, 35, 4431–4438. [Google Scholar] [CrossRef] [PubMed]
  27. Guillon, A.; Le Ménach, K.; Flaud, P.M.; Marchand, N.; Budzinski, H.; Villenave, E. Chemical Characterization and Stable Carbon Isotopic Composition of Particulate Polycyclic Aromatic Hydrocarbons Issued from Combustion of 10 Mediterranean Woods. Atmos. Chem. Phys. 2013, 13, 2703–2719. [Google Scholar] [CrossRef]
  28. Sun, H.; Wang, L.; Kang, X.; Wu, Z.; Yu, H.; Wu, R.; Yao, L.; Chen, J. Characterization of Polycyclic Aromatic Hydrocarbons (PAHs) in Atmospheric Particles (PM2.5) in the North China Plain Using Positive-Ion Atmospheric Pressure Photoionization (APPI) Coupled with Fourier Transform Ion Cyclotron Resonance Mass Spectrometry. Atmos. Environ. 2023, 314, 120090. [Google Scholar] [CrossRef]
  29. Yu, P.; Han, Y.; Wang, M.; Zhu, Z.; Tong, Z.; Shao, X.Y.; Peng, J.; Hamid, Y.; Yang, X.; Deng, Y.; et al. Heavy Metal Content and Health Risk Assessment of Atmospheric Particles in China: A Meta-Analysis. Sci. Total Environ. 2023, 867, 161556. [Google Scholar] [CrossRef]
  30. Gao, P.; Deng, F.; Chen, W.S.; Zhong, Y.J.; Cai, X.L.; Ma, W.M.; Hu, J.; Feng, S.R. Health Risk Assessment of Inhalation Exposure to Airborne Particle-Bound Nitrated Polycyclic Aromatic Hydrocarbons in Urban and Suburban Areas of South China. Int. J. Environ. Res. Public Health 2022, 19, 15536. [Google Scholar] [CrossRef]
  31. Li, Y.H.; Rao, Z.G.; Tan, J.H.; Duan, J.C.; Ma, Y.L.; He, K. Bin Pollutional Characteristics and Sources Analysis of Polycyclic Aromatic Hydrocarbons in Atmospheric Fine Particulate Matter in Lanzhou City. Huanjing Kexue/Environ. Sci. 2016, 37, 2428–2435. [Google Scholar] [CrossRef]
  32. Wang, X.; Wang, B.; Zhou, M.; Xiao, L.; Xu, T.; Yang, S.; Nie, X.; Xie, L.; Yu, L.; Mu, G.; et al. Systemic Inflammation Mediates the Association of Heavy Metal Exposures with Liver Injury: A Study in General Chinese Urban Adults. J. Hazard. Mater. 2021, 419, 126497. [Google Scholar] [CrossRef] [PubMed]
  33. Lu, Y.H.; Yang, M.; Cao, X.; Mao, W.F. Preliminary Study on Toxicity of Low- Dose Exposure of Four Polycyclic Aromatic Hydrocarbons Combined in Rats. Chin. J. Food Hyg. 2021, 33, 743–748. [Google Scholar] [CrossRef]
  34. Cao, L.; Tao, Y.; Zheng, H.; Wang, M.; Li, S.; Xu, Y.; Li, M. Chemical Composition and Source of PM2.5 during Winter Heating Period in Guanzhong Basin. Atmosphere 2023, 14, 1640. [Google Scholar] [CrossRef]
  35. Martins, N.R.; da Graça, G.C. Health Effects of PM2.5 Emissions from Woodstoves and Fireplaces in Living Spaces. J. Build. Eng. 2023, 79, 107848. [Google Scholar] [CrossRef]
  36. Wang, S.; Zhou, Q.; Tian, Y.; Hu, X. The Lung Microbiota Affects Pulmonary Inflammation and Oxidative Stress Induced by PM2.5 Exposure. Environ. Sci. Technol. 2022, 56, 12368–12379. [Google Scholar] [CrossRef]
  37. Mo, Y.; Mo, L.; Zhang, Y.; Zhang, Y.; Yuan, J.; Zhang, Q. High Glucose Enhances the Activation of NLRP3 Inflammasome by Ambient Fine Particulate Matter in Alveolar Macrophages. Part. Fibre Toxicol. 2023, 20, 41. [Google Scholar] [CrossRef]
  38. Sun, J.; Peng, S.; Li, Z.; Liu, F.; Wu, C.; Lu, Y.; Xiang, H. Association of Short-Term Exposure to PM2.5 with Blood Lipids and the Modification Effects of Insulin Resistance: A Panel Study in Wuhan. Toxics 2022, 10, 663. [Google Scholar] [CrossRef]
  39. Guo, C.C.; Lyu, Y.; Xia, S.S.; Ren, X.K.; Li, Z.F.; Tian, F.J.; Zheng, J.P. Organic Extracts in PM2.5 Are the Major Triggers to Induce Ferroptosis in SH-SY5Y Cells. Ecotoxicol. Environ. Saf. 2023, 249, 114350. [Google Scholar] [CrossRef]
  40. Ke, H.Y.; Ouyang, C.; Zhao, J.L.; Ma, X.; Liu, Y.M.; Zhang, L.W.; Li, X.H.; Tan, J.F.; Yu, L.; Li, W.W. Air Fine Particulate Matter Induced Alveolar Type II Epithelial Cell Injury in Rats. J. Hyg. Res. 2022, 51, 953–960. [Google Scholar] [CrossRef]
  41. Kang, M.J.; Fan, W.H.; Wu, Z.H.; Liu, F.W.; Li, Y.X. Distribution Characteristics and Health Risk Assessment of Polycyclic Aromatic Hydrocarbons in Atmospheric Particulates in Taiyuan in Winter. Environ. Manage. 2021, 46, 180–184. [Google Scholar]
  42. Pirozzi, C.; Lama, A.; Simeoli, R.; Paciello, O.; Pagano, T.B.; Mollica, M.P.; Di Guida, F.; Russo, R.; Magliocca, S.; Canani, R.B.; et al. Hydroxytyrosol Prevents Metabolic Impairment Reducing Hepatic Inflammation and Restoring Duodenal Integrity in a Rat Model of NAFLD. J. Nutr. Biochem. 2016, 30, 108–115. [Google Scholar] [CrossRef] [PubMed]
  43. Ge, C.X.; Yu, R.; Xu, M.X.; Li, P.Q.; Fan, C.Y.; Li, J.M.; Kong, L.D. Betaine Prevented Fructose-Induced NAFLD by Regulating LXRα/PPARα Pathway and Alleviating ER Stress in Rats. Eur. J. Pharmacol. 2016, 770, 154–164. [Google Scholar] [CrossRef] [PubMed]
  44. Apostolopoulou, M.; Gordillo, R.; Koliaki, C.; Gancheva, S.; Jelenik, T.; De Filippo, E.; Herder, C.; Markgraf, D.; Jankowiak, F.; Esposito, I.; et al. Specific Hepatic Sphingolipids Relate to Insulin Resistance, Oxidative Stress, and Inflammation in Nonalcoholic Steato Hepatitis. Diabetes Care 2018, 41, 1235–1243. [Google Scholar] [CrossRef] [PubMed]
  45. Dichtel, L.E.; Corey, K.E.; Haines, M.S.; Chicote, M.L.; Kimball, A.; Colling, C.; Simon, T.G.; Long, M.T.; Husseini, J.; Bredella, M.A.; et al. The GH/IGF-1 Axis Is Associated with Intrahepatic Lipid Content and Hepatocellular Damage in Overweight/Obesity. J. Clin. Endocrinol. Metab. 2022, 107, E3624–E3632. [Google Scholar] [CrossRef]
  46. Periasamy, S.; Chien, S.P.; Chang, P.C.; Hsu, D.Z.; Liu, M.Y. Sesame Oil Mitigates Nutritional Steatohepatitis via Attenuation of Oxidative Stress and Inflammation: A Tale of Two-Hit Hypothesis. J. Nutr. Biochem. 2014, 25, 232–240. [Google Scholar] [CrossRef] [PubMed]
  47. Xie, J.J. Role of PM2.5 on Steatosis Ang Apoptosis in HepG2 Cells and Effects of Resveratrol. Guangdong Pharmaceutical Univercity: Guangzhou, Guangdong, 2016. [Google Scholar]
  48. Zhang, Y.; Cui, Y.; Wang, X.L.; Shang, X.; Qi, Z.G.; Xue, J.; Zhao, X.; Deng, M.; Xie, M.L. PPARα/γ Agonists and Antagonists Differently Affect Hepatic Lipid Metabolism, Oxidative Stress and Inflammatory Cytokine Production in Steatohepatitic Rats. Cytokine 2015, 75, 127–135. [Google Scholar] [CrossRef]
  49. Liu, J.; Han, L.; Zhu, L.; Yu, Y. Free Fatty Acids, Not Triglycerides, Are Associated with Non-Alcoholic Liver Injury Progression in High Fat Diet Induced Obese Rats. Lipids Health Dis. 2016, 15, 27. [Google Scholar] [CrossRef]
  50. Yang, S.; Chen, R.; Zhang, L.; Sun, Q.; Li, R.; Gu, W.; Zhong, M.; Liu, Y.; Chen, L.C.; Sun, Q.; et al. Lipid Metabolic Adaption to Long-Term Ambient PM2.5 Exposure in Mice. Environ. Pollut. 2021, 269, 116193. [Google Scholar] [CrossRef]
  51. Vesterdal, L.K.; Danielsen, P.H.; Folkmann, J.K.; Jespersen, L.F.; Aguilar-Pelaez, K.; Roursgaard, M.; Loft, S.; Møller, P. Accumulation of Lipids and Oxidatively Damaged DNA in Hepatocytes Exposed to Particles. Toxicol. Appl. Pharmacol. 2014, 274, 350–360. [Google Scholar] [CrossRef]
  52. Peel, J.L.; Tolbert, P.E.; Klein, M.; Metzger, K.B.; Flanders, W.D.; Todd, K.; Mulholland, J.A.; Ryan, P.B.; Frumkin, H. Ambient Air Pollution and Respiratory Emergency Department Visits. Epidemiology 2005, 16, 164–174. [Google Scholar] [CrossRef]
  53. Liu, H.; Witzigreuter, L.; Sathiaseelan, R.; Agbaga, M.P.; Brush, R.S.; Stout, M.B.; Zhu, S. Obesity Promotes Lipid Accumulation in Mouse Cartilage—A Potential Role of Acetyl-CoA Carboxylase (ACC) Mediated Chondrocyte de Novo Lipogenesis. J. Orthop. Res. 2022, 40, 2771–2779. [Google Scholar] [CrossRef] [PubMed]
  54. Lin, Q.X.; Jiang, Y.A.; Zhou, F.; Zhang, Y.P. Fatty Acid Synthase (FASN) Inhibits the Cervical Squamous Cell Carcinoma (CESC) Progression through the Akt/MTOR Signaling Pathway. Gene 2023, 851, 147023. [Google Scholar] [CrossRef] [PubMed]
  55. Su, K.; Sabeva, N.S.; Liu, J.; Wang, Y.; Bhatnagar, S.; Van Der Westhuyzen, D.R.; Graf, G.A. The ABCG5 ABCG8 Sterol Transporter Opposes the Development of Fatty Liver Disease and Loss of Glycemic Control Independently of Phytosterol Accumulation. J. Biol. Chem. 2012, 287, 28564–28575. [Google Scholar] [CrossRef] [PubMed]
  56. Ding, D.; Ye, G.; Lin, Y.; Lu, Y.; Zhang, H.; Zhang, X.; Hong, Z.; Huang, Q.; Chi, Y.; Chen, J.; et al. MicroRNA-26a-CD36 Signaling Pathway: Pivotal Role in Lipid Accumulation in Hepatocytes Induced by PM2.5 Liposoluble Extracts. Environ. Pollut. 2019, 248, 269–278. [Google Scholar] [CrossRef] [PubMed]
  57. Ipsen, D.H.; Lykkesfeldt, J.; Tveden-Nyborg, P. Molecular Mechanisms of Hepatic Lipid Accumulation in Non-Alcoholic Fatty Liver Disease. Cell. Mol. Life Sci. 2018, 75, 3313–3327. [Google Scholar] [CrossRef] [PubMed]
  58. Zhao, L.; Zhang, C.; Luo, X.; Wang, P.; Zhou, W.; Zhong, S.; Xie, Y.; Jiang, Y.; Yang, P.; Tang, R.; et al. CD36 Palmitoylation Disrupts Free Fatty Acid Metabolism and Promotes Tissue Inflammation in Non-Alcoholic Steatohepatitis. J. Hepatol. 2018, 69, 705–717. [Google Scholar] [CrossRef] [PubMed]
  59. Drygalski, K.; Berk, K.; Charytoniuk, T.; Iłowska, N.; Łukaszuk, B.; Chabowski, A.; Konstantynowicz-Nowicka, K. Does the Enterolactone (ENL) Affect Fatty Acid Transporters and Lipid Metabolism in Liver? Nutr. Metab. 2017, 14, 69. [Google Scholar] [CrossRef]
  60. Chen, J.; Zou, X.; Zhu, W.; Duan, Y.; Merzendorfer, H.; Zhao, Z.; Yang, Q. Fatty Acid Binding Protein Is Required for Chitin Biosynthesis in the Wing of Drosophila Melanogaster. Insect Biochem. Mol. Biol. 2022, 149, 103845. [Google Scholar] [CrossRef]
  61. Gao, Y.; Zhang, S.; Li, J.; Zhao, J.; Xiao, Q.; Zhu, Y.; Zhang, J.; Huang, W. Effect and Mechanism of Ginsenoside Rg1-Regulating Hepatic Steatosis in HepG2 Cells Induced by Free Fatty Acid. Biosci. Biotechnol. Biochem. 2020, 84, 2228–2240. [Google Scholar] [CrossRef]
  62. Yoon, S.; Kim, J.; Lee, H.; Lee, H.; Lim, J.; Yang, H.; Shin, S.S.; Yoon, M. The Effects of Herbal Composition Gambigyeongsinhwan (4) on Hepatic Steatosis and Inflammation in Otsuka Long-Evans Tokushima Fatty Rats and HepG2 Cells. J. Ethnopharmacol. 2017, 195, 204–213. [Google Scholar] [CrossRef]
  63. Van den Berg, E.H.; Corsetti, J.P.; Bakker, S.J.L.; Dullaart, R.P.F. Plasma ApoE Elevations Are Associated with NAFLD: The PREVEND Study. PLoS ONE 2019, 14, 3–5. [Google Scholar] [CrossRef] [PubMed]
  64. Li, S.Y. Effects of Fine Particulate Matter from Different Cities on Liver Lipid Metabolism. Int. J. Environ. Res. Public Health 2023, 20, 2803. [Google Scholar]
  65. Tran, K.; Thorne-Tjomsland, G.; Delong, C.J.; Cui, Z.; Shan, J.; Burton, L.; Jamieson, J.C.; Yao, Z. Intracellular Assembly of Very Low Density Lipoproteins Containing Apolipoprotein B100 in Rat Hepatoma McA-RH7777 Cells. J. Biol. Chem. 2002, 277, 31187–31200. [Google Scholar] [CrossRef] [PubMed]
  66. Sirwi, A.; Mahmood Hussain, M. Lipid Transfer Proteins in the Assembly of ApoB-Containing Lipoproteins. J. Lipid Res. 2018, 59, 1094–1102. [Google Scholar] [CrossRef] [PubMed]
  67. Sundaram, M.; Yao, Z. Recent Progress in Understanding Protein and Lipid Factors Affecting Hepatic VLDL Assembly and Secretion. Nutr. Metab. 2010, 7, 35. [Google Scholar] [CrossRef] [PubMed]
  68. Chen, P.; Li, Y.; Xiao, L. Berberine Ameliorates Nonalcoholic Fatty Liver Disease by Decreasing the Liver Lipid Content via Reversing the Abnormal Expression of MTTP and LDLR. Exp. Ther. Med. 2021, 22, 1109. [Google Scholar] [CrossRef]
  69. Li, H.S.; Li, Y.L.; Kong, J.W.; Zhou, M.Y.; Ge, D.Y.; Liu, J.J.; Peng, J.Y.; Liao, Y. Sagittaria Sagittifolia Polysaccharides Regulates Nrf2/HO-1 to Relieve Liver Injury Caused by Multiple Heavy Metals in Vivo and in Vitro. China J. Chin. Mater. Med. 2022, 47, 1913–1920. [Google Scholar]
  70. Kitazawa, M.; Hsu, H.W.; Medeiros, R. Copper Exposure Perturbs Brain Inflammatory Responses and Impairs Clearance of Amyloid-Beta. Toxicol. Sci. 2016, 152, 194–204. [Google Scholar] [CrossRef]
  71. Liu, M.; Su, J.Y.; Dong, C.R. Research on the Relationship Og Trace Element Chromium to Atherosclerosis --II. Effects of Cr3+ on Several Key Enzymes of Lipid Metabolism in Hyperlipidemia Rats. J. Beijing Med. Univ. 1991, 23, 12–14. [Google Scholar]
  72. Chen, S.Y. Distribution Characteristics and Toxicity of Persistent Organic Pollutants in the Northern Edge of Sichuan Basin; Southwest University of Science and Technology: Mianyang, China, 2023. [Google Scholar]
  73. Wang, X. Associations of Exposure to Heavy Metals with the Indicator of Liver Injury and Potential Mediating Effects Assessments in Community Residents; Huazhong University of Science and Technology: Wuhan, China, 2022. [Google Scholar]
  74. Li, W.N. Correlation between Non-Alcoholic Fatty Liver Disease and 9 Common Metals in Rural Residents of Xinxiang County; Xinxiang Medical University: Xinxiang, China, 2022. [Google Scholar]
Figure 1. Toxic effects of different concentrations of PM2.5 whole particle components on HepG2 cells from 2017 to 2020 (n = 4, compared with control group, * p < 0.05, ** p < 0.01).
Atmosphere 15 00032 g001
Figure 2. Effects of different concentrations of PM2.5 total particle component exposure on LDH release from HepG2 cells from 2017 to 2020 (n = 4, compared with the control group, * p < 0.05, ** p < 0.01; compared between years, # p < 0.05, ## p < 0.01).
Atmosphere 15 00032 g002
Figure 3. Effects of different concentrations of PM2.5 whole particle components on IL-6 levels in HepG2 cells from 2017 to 2020 (n = 4, compared with the control group, * p < 0.05, ** p < 0.01; compared between years, # p < 0.05, ## p < 0.01).
Atmosphere 15 00032 g003
Figure 4. Effects of different concentrations of PM2.5 whole particle components on TNF-α levels in HepG2 cells from 2017 to 2020 (n = 4, compared with the control group, * p < 0.05, ** p < 0.01; compared between years, # p < 0.05, ## p < 0.01).
Atmosphere 15 00032 g004
Figure 5. Effects of different concentrations of PM2.5 whole particle components on intracellular ROS levels of HepG2 from 2017 to 2020 (n = 4, compared with the control group, * p < 0.05, ** p < 0.01; compared between years, # p < 0.05, ## p < 0.01).
Atmosphere 15 00032 g005
Figure 6. Effects of different concentrations of PM2.5 total particle components on SOD content in HepG2 cells from 2017 to 2020 (n = 4, compared with the control group, * p < 0.05, ** p < 0.01; compared between years, # p < 0.05).
Atmosphere 15 00032 g006
Figure 7. Effects of different concentrations of PM2.5 total particle components on MDA content in HepG2 cells from 2017 to 2020 (n = 4, compared with the control group, * p < 0.05, ** p < 0.01; compared between years, # p < 0.05, ## p < 0.01).
Atmosphere 15 00032 g007
Figure 8. Effects of different concentrations of PM2.5 whole particle components on TG content in HepG2 cells from 2017 to 2020 (n = 4, compared with the control group, * p < 0.05, ** p < 0.01; compared between years, # p < 0.05, ## p < 0.01).
Atmosphere 15 00032 g008
Figure 9. Effects of different concentrations of PM2.5 whole particle components on FFA content in HepG2 cells from 2017 to 2020 (n = 4, compared with the control group, * p < 0.05, ** p < 0.01; compared between years, # p < 0.05, ## p < 0.01).
Atmosphere 15 00032 g009
Figure 10. Effects of different concentrations of PM2.5 and its extracts on lipid metabolism in HepG2 cells (A) WP (B) in 2017 OP (C) WSP (n = 4, compared with control group, * p < 0.05, ** p < 0.01).
Atmosphere 15 00032 g010aAtmosphere 15 00032 g010b
Table 1. Content and enrichment factors of metals in PM2.5 in Taiyuan from 2017 to 2020. -: indicates that it was not detected.
Metals2017201820192020
Contents (ng/m3)EFContents (ng/m3)EFContents (ng/m3)EFContents (ng/m3)EF
Cr11 ± 70.30.9 ± 0.60.745.5 ± 17.113.73.2 ± 2.72.1
Ni14 ± 50.80.04 ± 0.030.111.3 ± 6.17.53.9 ± 1.25.7
Cu28 ± 152.10.06 ± 0.030.124.9 ± 12.120.88.9 ± 3.416.2
Zn186 ± 874.82.9 ± 1.7235.8 ± 8.48.49164.3 ± 82.3101.2
As8 ± 62- 11.3 ± 7.930.9-
Cd2 ± 1360.07 ± 0.0533.92.6 ± 1.9524.21.4 ± 0.9621.6
Pb67 ± 325.90.5 ± 0.21.2103.7 ± 64.799.923.5 ± 11.749.2
Al39,130114531354611631.11
Table 2. PM2.5-bound PAHs content and sources in Taiyuan from 2017 to 2020; ND indicates that it was not detected.
PAHs/Mean Concentration (ng/m3)2017201820192020
NAP10.6 ± 8.43.01 ± 2.39ND0.05 ± 0.03
ACE0.3 ± 0.20.40 ± 0.19ND0.19 ± 0.11
FLU1.7 ± 0.90.03 ± 0.020.9 ± 0.50.04 ± 0.02
PHE9.0 ± 4.315.11 ± 9.061.7 ± 1.12.63 ± 1.01
ANT1.7 ± 0.72.07 ± 1.540.2 ± 0.10.09 ± 0.04
FLA10.2 ± 5.123.08 ± 17.765.4 ± 2.86.39 ± 2.27
PYR6.7 ± 2.926.59 ± 9.153.4 ± 1.95.15 ± 2.32
BaA7.7 ± 6.114.06 ± 8.402.7 ± 1.01.92 ± 1.18
ANYND5.39 ± 2.134.0 ± 2.40.71 ± 0.32
CHR10.1 ± 5.78.99 ± 6.593.2 ± 1.02.62 ± 1.15
BbF10.9 ± 4.315.16 ± 9.155.2 ± 1.55.30 ± 1.52
BkF3.2 ± 1.515.16 ± 7.401.7 ± 0.60.79 ± 0.37
BaP7.1 ± 3.212.72 ± 6.182.3 ± 0.81.86 ± 1.18
DahA 1.5 ± 0.71.51 ± 1.160.7 ± 0.30.04 ± 0.02
BghiP6.2 ± 3.12.67 ± 1.873.3 ± 1.22.17 ± 0.85
IcdP 8.2 ± 4.68.55 ± 7.682.1 ± 1.33.43 ± 1.50
Total94.3 ± 40.9154.5 ± 75.7634.1 ± 16.533.38 ± 13.89
FLA/(FLA + PYR)0.600.460.610.55
ANT/(ANT + PHE)0.160.120.110.03
BaA/(BaA + CHR)0.430.610.460.42
IcdP/(IcdP + BghiP)0.600.760.390.61
Table 3. Non-carcinogenic health risks of metals, 2017–2020.
GroupElements2017201820192020
HIHIHIHI
ChildrenNi1.2 × 10−42.5 × 10−61.2 × 10−28.1 × 10⁻⁴
Cd3.1 × 10−48.9 × 10−57.2 × 10−42.5 × 10⁻⁴
Cr3.6 × 10−42.3 × 10−48.5 × 10−43.1 × 10⁻⁴
Zn9.5 × 10−51.1 × 10−54.2 × 10−26.2 × 10⁻⁴
Cu1.1 × 10−42.1 × 10−63.4 × 10−31.8 × 10⁻³
Pb2.6 × 10−31.7 × 10−43.4 × 10−27.8 × 10⁻³
Sum3.6 × 10−35.0 × 10−49.3 × 10−21.2 × 10⁻²
AdultsNi2.3 × 10−52.1 × 10−69.5 × 10−36.6 × 10⁻⁴
Cd6.2 × 10−57.2 × 10−55.8 × 10−42.0 × 10⁻⁴
Cr7.3 × 10−51.9 × 10−46.8 × 10−42.4 × 10⁻⁴
Zn1.4 × 10−56.5 × 10−62.3 × 10−23.7 × 10⁻⁴
Cu2.3 × 10−51.6 × 10−62.7 × 10−31.5 × 10⁻³
Pb3.9 × 10−41.0 × 10−42.1 × 10−24.8 × 10⁻³
Sum5.9 × 10−43.7 × 10−45.7 × 10−27.7 × 10⁻³
Table 4. Carcinogenic health risks of metals, 2017–2020.
Elements2017201820192020
Ni1.4 × 10−111.0 × 10−115.8 × 10−74.0 × 10−8
Cd1.4 × 10−111.4 × 10−102.9 × 10−910.0 × 10⁻¹⁰
Cr5.3 × 10−101.1 × 10⁻⁸--
Zn--5.1 × 10⁻⁸-
Cu--5.1 × 10−92.8 × 10−9
Sum5.6 × 10−101.2 × 10−86.4 × 10−74.4 × 10⁻⁸
Table 5. Carcinogenic and non-carcinogenic health assessment of PAHs 2017–2020.
Items2017201820192020
R6.3 × 10−61.1 × 10−66.4 × 10−79.6 × 10⁻⁷
HQ1.0 × 10−29.5 × 10−15.3 × 10−18.0 × 10⁻¹
Table 6. Correlation analysis of major metals and biomarkers of cytotoxicity and lipid in pollutants from 2017 to 2020.; Pearson correlation coefficient (r) was used to compare correlations among indicators, *: p < 0.05.
ItemsIL-6ROSSODMDATG
Zn0.1130.1780.483−0.3820.548
Pb0.8940.928−0.830−0.814−0.461
Cu0.9280.960 *−0.559−0.733−0.058
Cr0.7130.736−0.965 *−0.712−0.766
Table 7. Correlation between major PAHs and cytotoxic and lipid biomarkers in pollutants from 2017 to 2020.; Pearson correlation coefficient (r) was used to compare correlations among indicators, *: p < 0.05.
ItemsTNF-αMDATGFFA
FLA0.1130.981 *0.4030.511
PYR−0.0270.969 *0.2960.381
CHR0.7700.6680.7870.972 *
BbF0.4180.9290.6130.762
IcdP0.7020.8150.8440.871
Table 8. Correlation analysis of major metals in pollutants and biomarkers of cellular lipid metabolism from 2017 to 2020.; Pearson correlation coefficient (r) was used to compare correlations among indicators, *: p < 0.05.
ItemsSREBP1FABP1FAPT2FAPT5PPARαCPT1αACOXAPOBMTTP
Zn0.5390.443−0.880−0.1320.7030.5640.9180.952 *−0.554
Pb−0.7070.631−0.543−0.908−0.503−0.768−0.248−0.2200.674
Cu−0.5190.865−0.765−0.940−0.296−0.4990.0510.1480.493
Cr−0.8000.298−0.191−0.725−0.659−0.919−0.540−0.5760.767
Table 9. Comparison of correlations between major PAHs and biomarkers of cellular lipid metabolism in pollutants from 2017 to 2020.; Pearson correlation coefficient (r) was used to compare correlations among indicators.
ACCFASNSCD1CD36FABP1FAPT2FAPT5
FLA−0.476−0.594−0.374−0.455−0.0060.6240.275
PYR−0.301−0.346−0.219−0.250−0.3980.8820.528
CHR−0.647−0.806−0.553−0.6650.5030.178−0.168
BbF−0.531−0.647−0.431−0.5120.0540.6020.210
Disclaimer/Publisher’s Note: The statements, opinions and data contained in all publications are solely those of the individual author(s) and contributor(s) and not of MDPI and/or the editor(s). MDPI and/or the editor(s) disclaim responsibility for any injury to people or property resulting from any ideas, methods, instructions or products referred to in the content.

