Article

Statistical Relations among Solid Precipitation, Atmospheric Moisture and Cloud Parameters in the Arctic

by
Sergey Y. Matrosov
Cooperative Institute for Research in Environmental Sciences, University of Colorado and NOAA Physical Sciences Laboratory, Boulder, CO 80309, USA
Atmosphere 2024, 15(1), 132; https://doi.org/10.3390/atmos15010132
Submission received: 1 December 2023 / Revised: 10 January 2024 / Accepted: 19 January 2024 / Published: 21 January 2024
(This article belongs to the Special Issue Feature Papers in Meteorological Science (2nd Edition))

Abstract

:
Observations collected during cold-season precipitation periods at Utquagvik, Alaska and at the multidisciplinary drifting observatory for the study of Arctic climate (MOSAiC) are used to statistically analyze the relations among the atmospheric water cycle parameters including the columnar supercooled liquid and ice amounts (expressed as liquid-water and ice-water paths, i.e., LWP and IWP), the integrated water vapor (IWV) and the near-surface snowfall rate. Data come from radar and radiometer-based retrievals and from optical precipitation sensors. While the correlation between snowfall rate and LWP is rather weak, correlation coefficients between radar-derived snowfall rate and IWP are high (~0.8), which is explained, in part, by the generally low LWP/IWP ratios during significant precipitation. Correlation coefficients between snowfall rate and IWV are moderate (~0.45). Correlations are generally weaker if snowfall is estimated by optical sensors, which is, in part, due to blowing snow. Correlation coefficients between near-surface temperature and snowfall rates are low (r < 0.3). The results from the Alaska and MOSAiC sites are generally similar. These results are not very sensitive to the amount of time averaging (e.g., 15 min averaging versus daily averages). Observationally based relations among the water cycle parameters are informative about atmospheric moisture conversion processes and can be used for model evaluations.

1. Introduction

Earth’s water cycle is a complex system, and its characteristics are modified by climate change. Evaporation, water vapor condensation and precipitation are important processes of the water cycle. Precipitation removes condensed water vapor from the atmosphere and is influenced by available water vapor and cloud water/ice amounts. Precipitation modeling is difficult as this water cycle component has a high spatial variability and probably the sharpest gradients amongst all meteorological fields [1]. Modeling is especially challenging in the Arctic where climate changes are amplified compared to other regions of the Earth [2].
Generally, the availability of sufficient integrated water vapor (IWV, also known as PWV—precipitable water vapor) in the vertical column is a precondition for precipitation reaching the ground. Physical mechanisms governing precipitation formation, however, are rather complicated and depend on many factors which are described by various models with different degrees of complexity. Concurrent observations of IWV and precipitation characteristics (e.g., precipitation rate near the ground level) as well as other meteorological parameters (e.g., cloud liquid and ice contents, surface meteorological parameters) can provide valuable statistical information on the interrelations among different atmospheric moisture characteristics and precipitation, which can help to evaluate model performances in describing various mechanisms of the water cycle.
Data from existing observational meteorological and hydrological networks worldwide allow for correlation analyses of the interrelations among different components of Earth’s water cycle. A number of different studies have analyzed atmospheric water vapor and liquid precipitation correspondences. The emphasis is often on tropical rainfall (e.g., [3]). While both convective and stratiform rainfall was considered (e.g., [4]), the particular interest was on deep convection and extreme precipitation in both mid-latitudes (e.g., [5]) and tropics (e.g., [6]). Changes in rainfall and atmospheric water vapor with temperature were also studied (e.g., [7,8]).
Most recently, Zhang et al. [9] and Li at al. [10] conducted correlation analysis of IWV and precipitation over different regions in China. These authors found that the Pearson correlation coefficients between IWV and the observed precipitation amounts varied over an approximate range of between about 0.3 and 0.9 depending on the climatic zone. Model simulations of relations between precipitation rate and IWV (e.g., [11]) exhibit a strong increase in precipitation when IWV is substantially large (e.g., IWV > 30 mm), which is typical for warm-season precipitation (i.e., rain). Liquid precipitation has been so far the main interest.
There is still a relative lack of quantitative knowledge of relations among the different components of the water cycle parameters for solid precipitation (i.e., snowfall) which also generally increases with increasing atmospheric water vapor amount (e.g., [12]). IWV values during snowfall events in the Arctic are often less than about 15 mm. Water condensed in clouds in both ice and supercooled liquid phases is also expected to influence the precipitation intensity. A number of different research facilities located in the Arctic provide observational data which allow for the statistical analysis of Arctic solid precipitation (i.e., snowfall) interrelations with other components of the water cycle, including atmospheric water vapor and condensed cloud water contents of both phases and also with different meteorological parameters near the surface (e.g., temperature, humidity).
The main objective of this study was to statistically analyze the correspondences among parameters characterizing the moisture conversion efficiency in the Arctic atmosphere during precipitation. In addition to relations between IWV and snowfall, relations among the total cloud mass (with liquid and ice separately) and snowfall intensity were also of interest in this study. A wider scope of observationally based inter-relations among several parameters of the water cycle can potentially present a framework for better understanding the efficiency of atmospheric moisture conversion and provide observationally based results for future evaluations of how well different numerical weather prediction (NWP) models handle specific moisture transformation processes at the parameterization level.
This study used the data from the U.S. Department of Energy’s (DOE) Atmospheric Radiation Measurement (ARM) Program facility located at the North Slope of Alaska (NSA) near Utquagvik (formerly Barrow), and from the Multidisciplinary drifting Observatory for the Study of Arctic Climate (MOSAiC), which conducted one-year-long observations in the Central Arctic [13]. These well-instrumented observational sites had similar sensors which provided a wide range of direct measurements and remote-sensing retrievals of different meteorological and hydrological parameters including the components of the Arctic water cycle which are of interest to this study.

2. Data and Methods

The NSA ARM stationary (71.323° N, 156.616° W) facility and the MOSAiC expedition ARM mobile facility instrumentation suites had similar ground-based sensors used to infer atmospheric moisture, cloud and precipitation parameters. The snowfall rates were retrieved from measurements conducted by vertically pointing Ka-band (~35 GHz) ARM Zenith radars (KAZRs) [14,15]. The radar-based snowfall rate retrievals from [16] utilized in this study were the most consistent in terms of the data availability and they were largely immune to blowing snow artifacts and high wind conditions which can negatively influence measurements by other ground-based sensors (e.g., optical precipitation sensors and tipping bucket gauges). In the general operation mode, ARM KAZRs have a gate spacing of 30 m, ~2 s dwell time and a 1 km range reflectivity factor sensitivity of about −35 dBZ. The lowest KAZR range gate, where measurements can be used for estimating snowfall, is typically at an altitude of approximately 170 m above the ground. Both NSA and MOSAiC KAZRs were similarly calibrated.
Previously, radar-based Arctic snowfall accumulation retrievals performed using the radar reflectivity factor, Ze,—snowfall rate, S, relation Ze (mm6m−3) = 63S1.2(mmh−1) were shown in [16] to be in good agreement with the Climate Reference Network (CRN) gauge equipped with a double fence intercomparison reference (DFIR) wind shield, which serves as a World Meteorological Organization standard reference for measuring solid precipitation [17]. This relation was further used in this study to obtain high-temporal-resolution radar-based estimates of snowfall rate.
For periods when the radiometric information on atmospheric column moisture contents was available, Figure 1a,b show 15 min snowfall rate averages as retrieved from the MOSAiC KAZR measurements at an altitude of ~170 m above the ground during the MOSAiC first drift period (11 October 2019–14 May 2020), when practically all observed precipitation was snowfall (Figure 1b), and snowfall rates retrieved using NSA KAZR measurements during the 2017–2018 cold season (Figure 1a), which was a special observing period of the Year of the Polar Prediction (YOPP) project [18]. These average liquid equivalent snowfall rates rarely exceeded 2 mmh−1, though some instantaneous values were higher. Atmospheric temperatures during the entire observation periods considered in this study generally remained below freezing, and the liquid equivalent total snowfall accumulations were approximately 80 and 111 mm for the NSA and MOSAiC locations, respectively. Snowfall rate retrieval uncertainties due to the variability of reflectivity—snowfall rate relations could be as high as about 50% [16].
There are different approaches to retrieve IWV from ground-based and satellite measurements (e.g., [19]). This study uses IWV retrievals from vertically pointing microwave radiometer (MWR) measurements at frequencies of ~24 and ~31 GHz [20,21]. In addition to these retrievals, the MWR data provide estimates of cloud columnar integrated supercooled liquid expressed as liquid water path (LWP). Both MWR-based IWV and LWP values are collocated with the radar-based precipitation measurements and are shown in Figure 1c,d. It can be seen from these figures that supercooled liquid is quite often present in cloud systems producing snowfall. Gaps with no data intervals in Figure 1d correspond to the periods when MOSAiC microwave radiometer data were not available.
As seen from Figure 1c,d, on average, IWV and LWP values observed at the NSA site were larger than those during the MOSAiC expedition drift. This is, in part, due to more northern MOSAiC site locations which varied in latitude between 89° N and 83.5° N during the drift period between mid-October 2019 and mid-May 2020 (as compared to the ARM NSA facility location at 71.323° N, 156.616° W). The largest supercooled LWP amounts observed during extreme precipitation events, however, reached values greater than about 300 g m−2 in both data sets [22].
The columnar values of ice water path (IWP) shown in Figure 1e,f were calculated by vertically integrating ice water content (IWC) estimates which, in turn, were obtained from KAZR reflectivity measurements using the Ka-band IWC-Ze relation for precipitating ice clouds suggested by Liu and Illingworth [23]:
IWC (gm−3) = 0.097 [Ze (mm6m−3)]0.59,
On average, IWP values for both the MOSAiC and NSA observation periods were noticeably larger compared to the concurrent LWP values (Figure 1e,f vs. Figure 1c,d). As for snowfall precipitation rates, 15 min averaging was also performed for other water cycle parameters (i.e., IWV, LWP, IWP).

3. Results

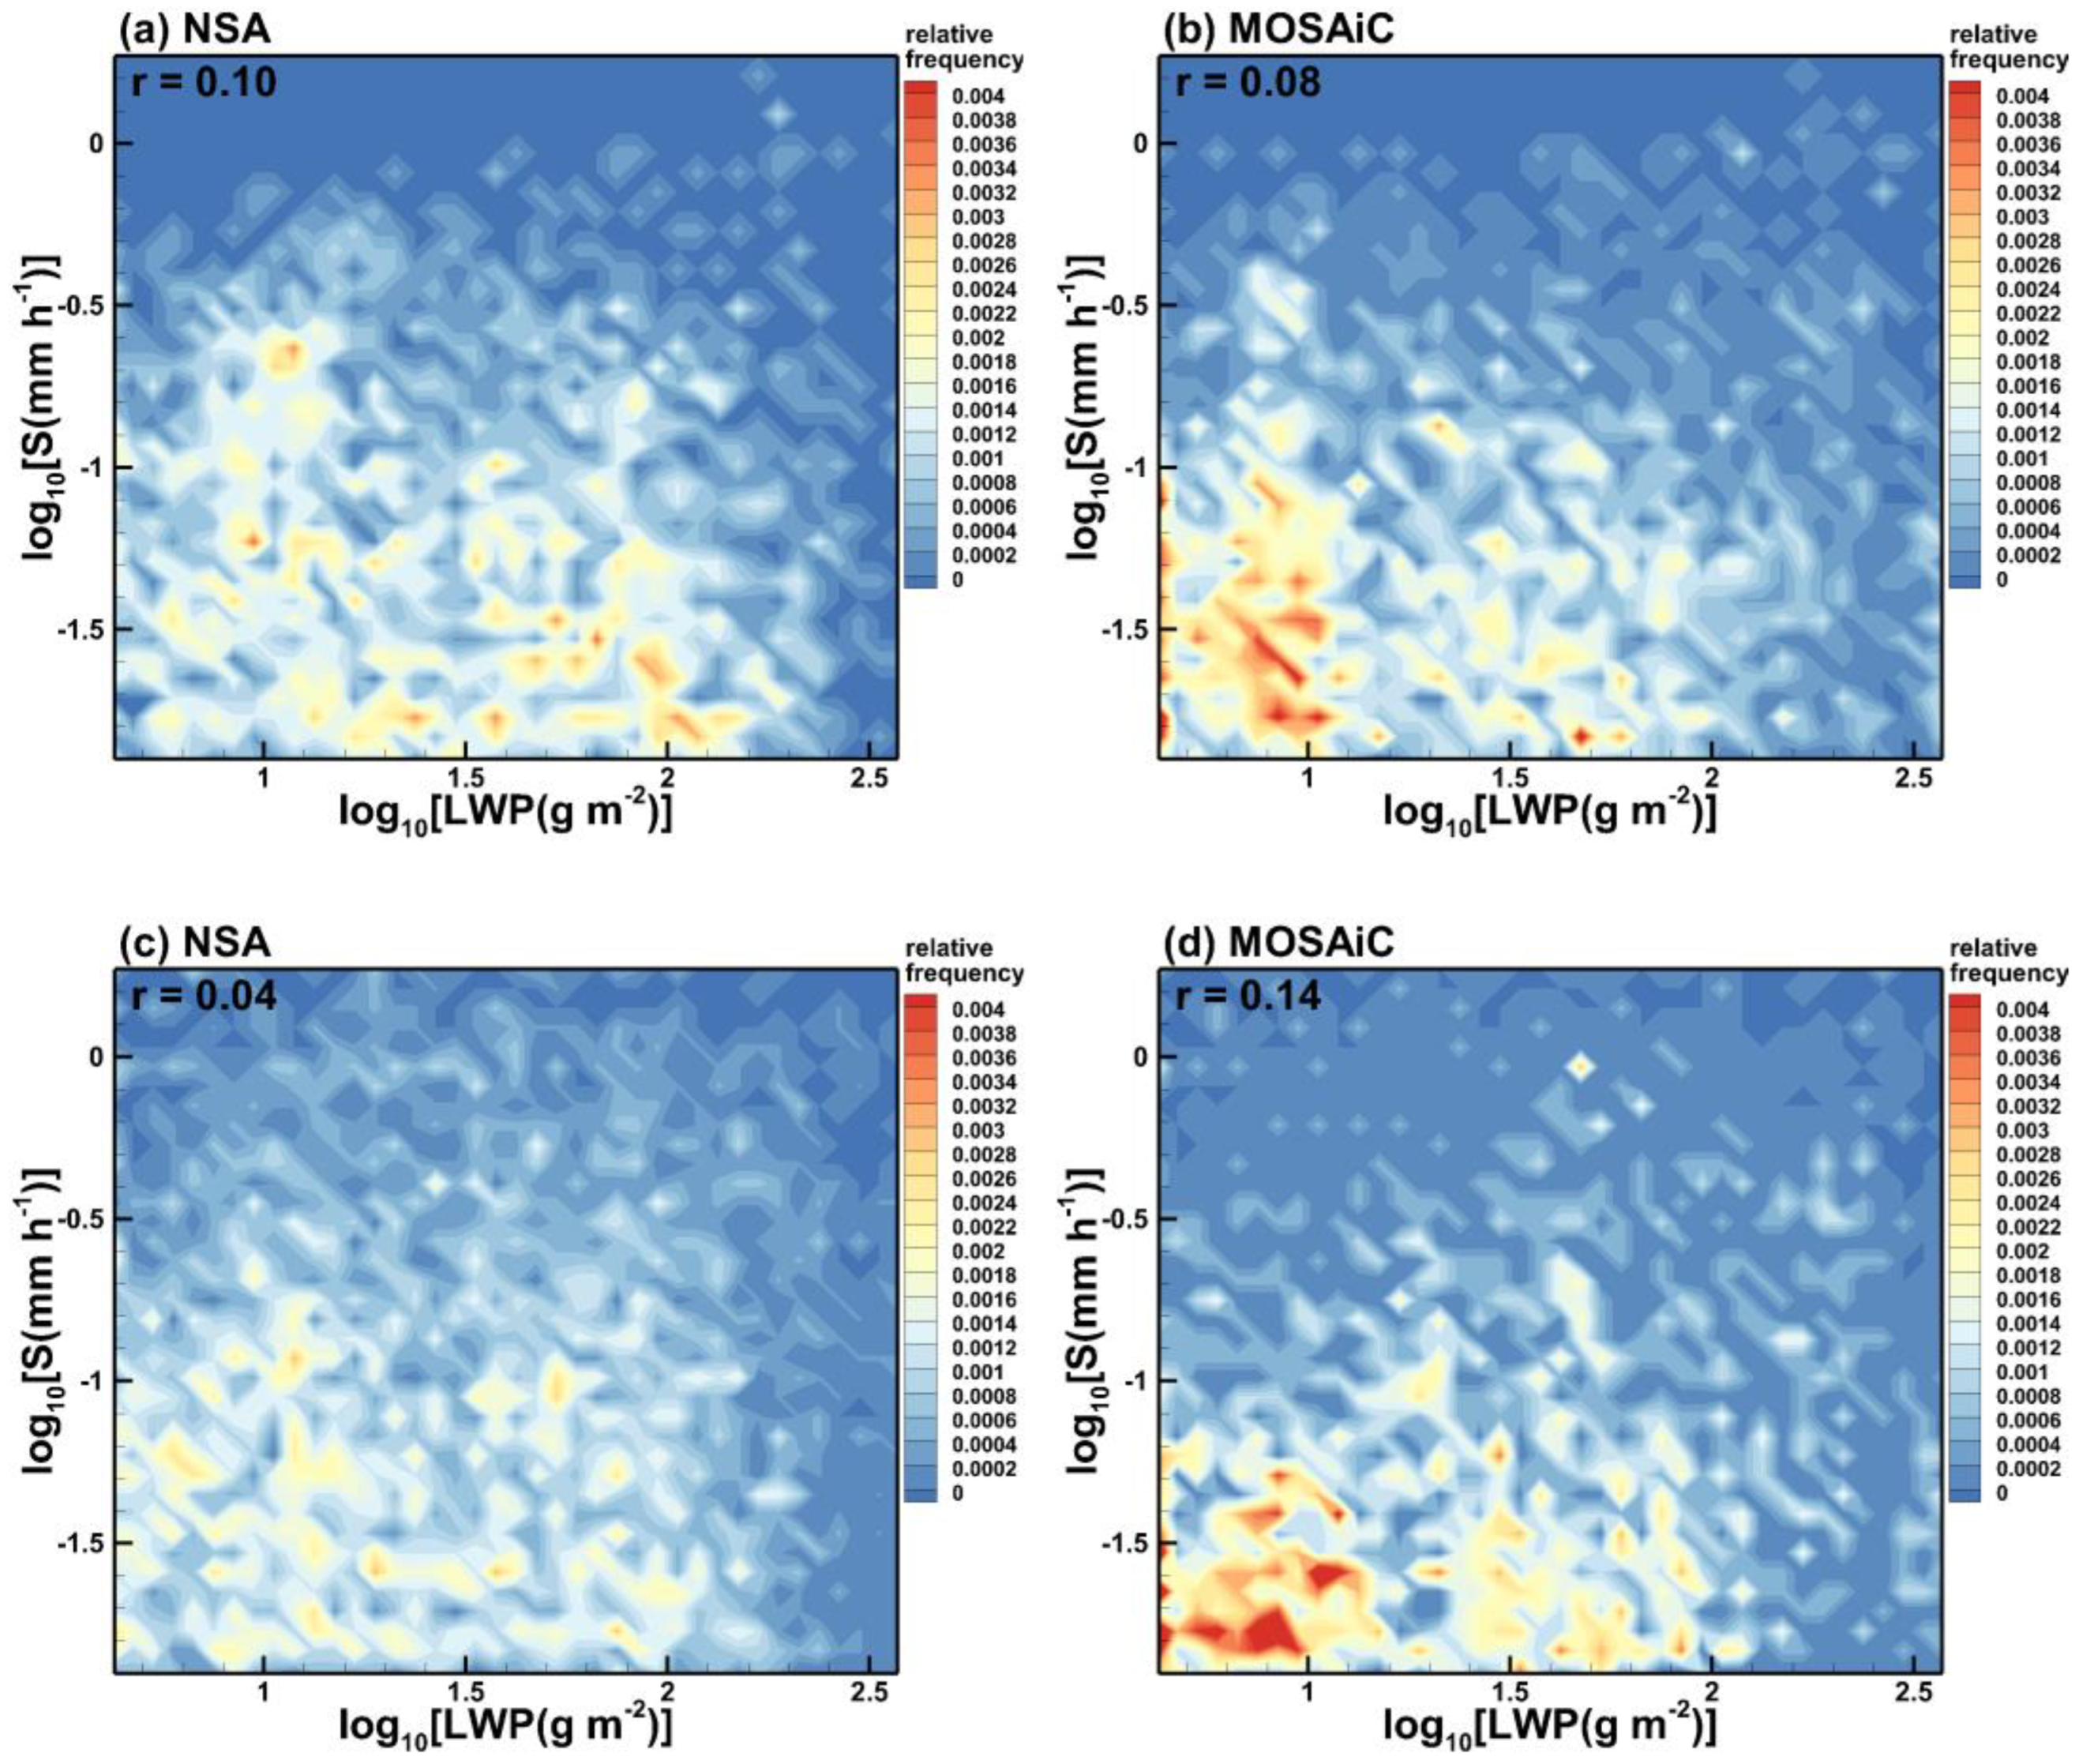
3.1. Influence of Supercooled Liquid on Snowfall Rates

Layers of supercooled water in precipitating clouds have a large impact on the radiation budget (e.g., [24]) and they also cause snowflake riming. Thus, it is instructive to evaluate statistical correspondences between observed snowfall rates and the amount of supercooled water in precipitating clouds. For snowfall periods with S > 0.01 mmh−1, Figure 2 shows the frequency of occurrence scatter plots of snowfall rates, S, versus MWR-based estimates of LWP. As seen from this figure, there is practically no significant correlation between S and LWP during appreciable precipitation periods for both data sets. Corresponding Pearson correlation coefficients, r, which are also shown in Figure 2, are less than 0.15. The total number of data samples was about 3300 for NSA (~3100 for MOSAiC).
On average, the frequency of occurrence of elevated values of LWP at the NSA location was higher than that during MOSAiC. The lack of significant correlation between snowfall rate and the amount of supercooled liquid water in the atmospheric column is observed for both radar-based snowfall estimates (Figure 2a,b) and for those obtained by the surface-based Vaisala present weather detector (PWD) optical precipitation sensors (Figure 2c,d), which were deployed near the KAZRs at both the NSA and MOSAiC locations. Optical sensor-based and radar-retrieved snowfall rates are completely independent, though PWD estimates from [25,26] could be influenced by blowing snow during high wind conditions [17].
The data shown in Figure 2 correspond to the concurrent measurements of snowfall rate and cloud LWP. S-LWP correlation estimates were also performed using LWP measurements taken 15 min prior to those of snowfall rate. Assuming that the mean cloud liquid water layer height is ~0.9 km, this 15 min lag corresponds to an average time interval required for snow particles to reach the ground from the height of the liquid layer with a typical mean snowflake fall velocity of approximately 1 m s−1. The general pattern of the S-LWP frequency of occurrence scatter plots with the use of the time lag did not change much from those depicted in Figure 2. The corresponding correlation coefficients remained smaller than 0.1.

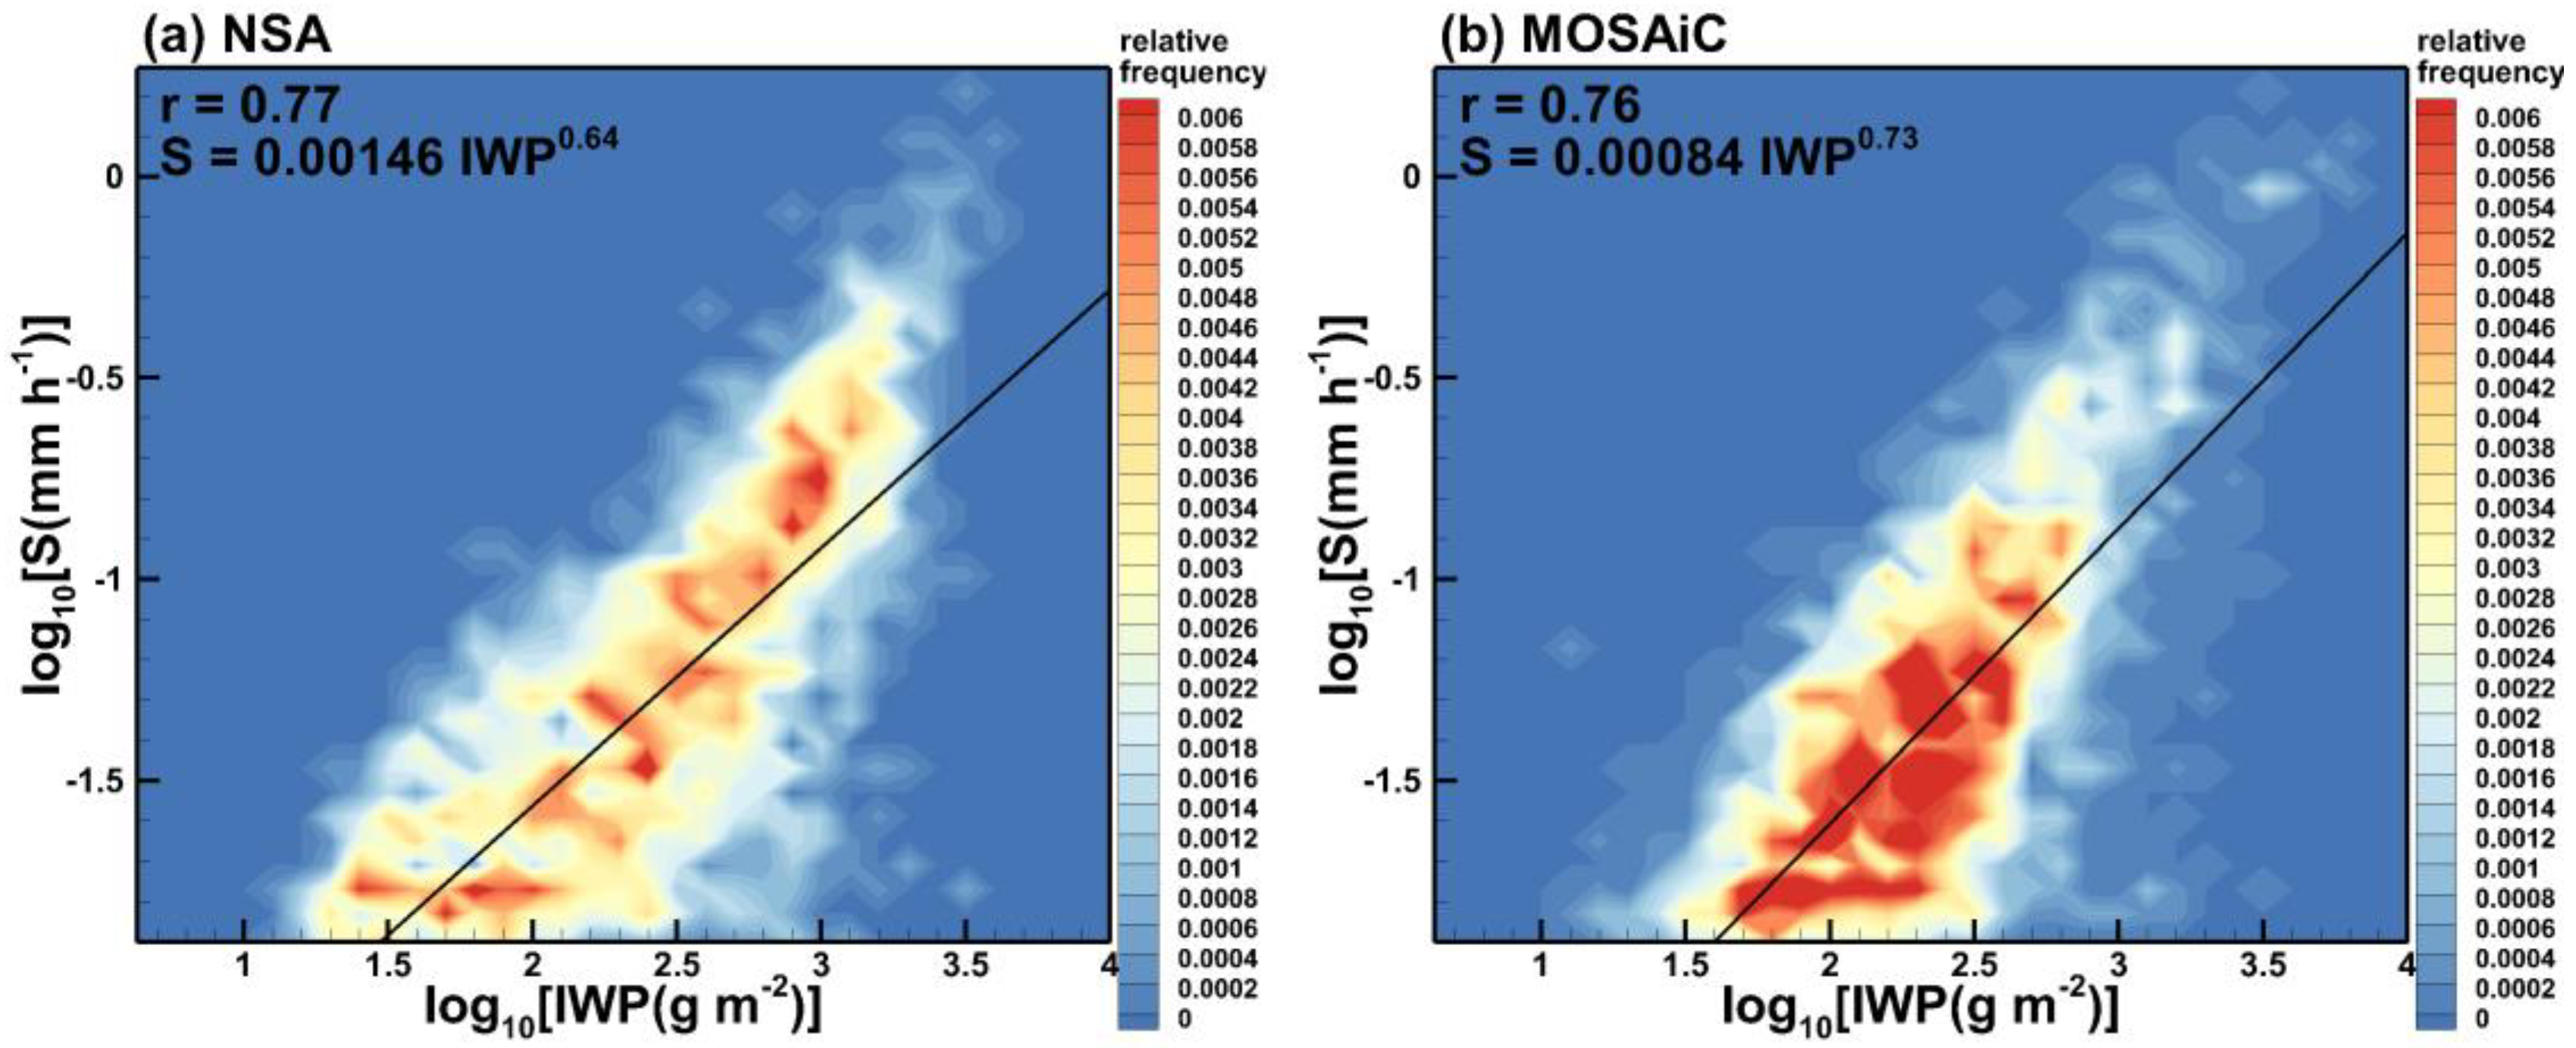
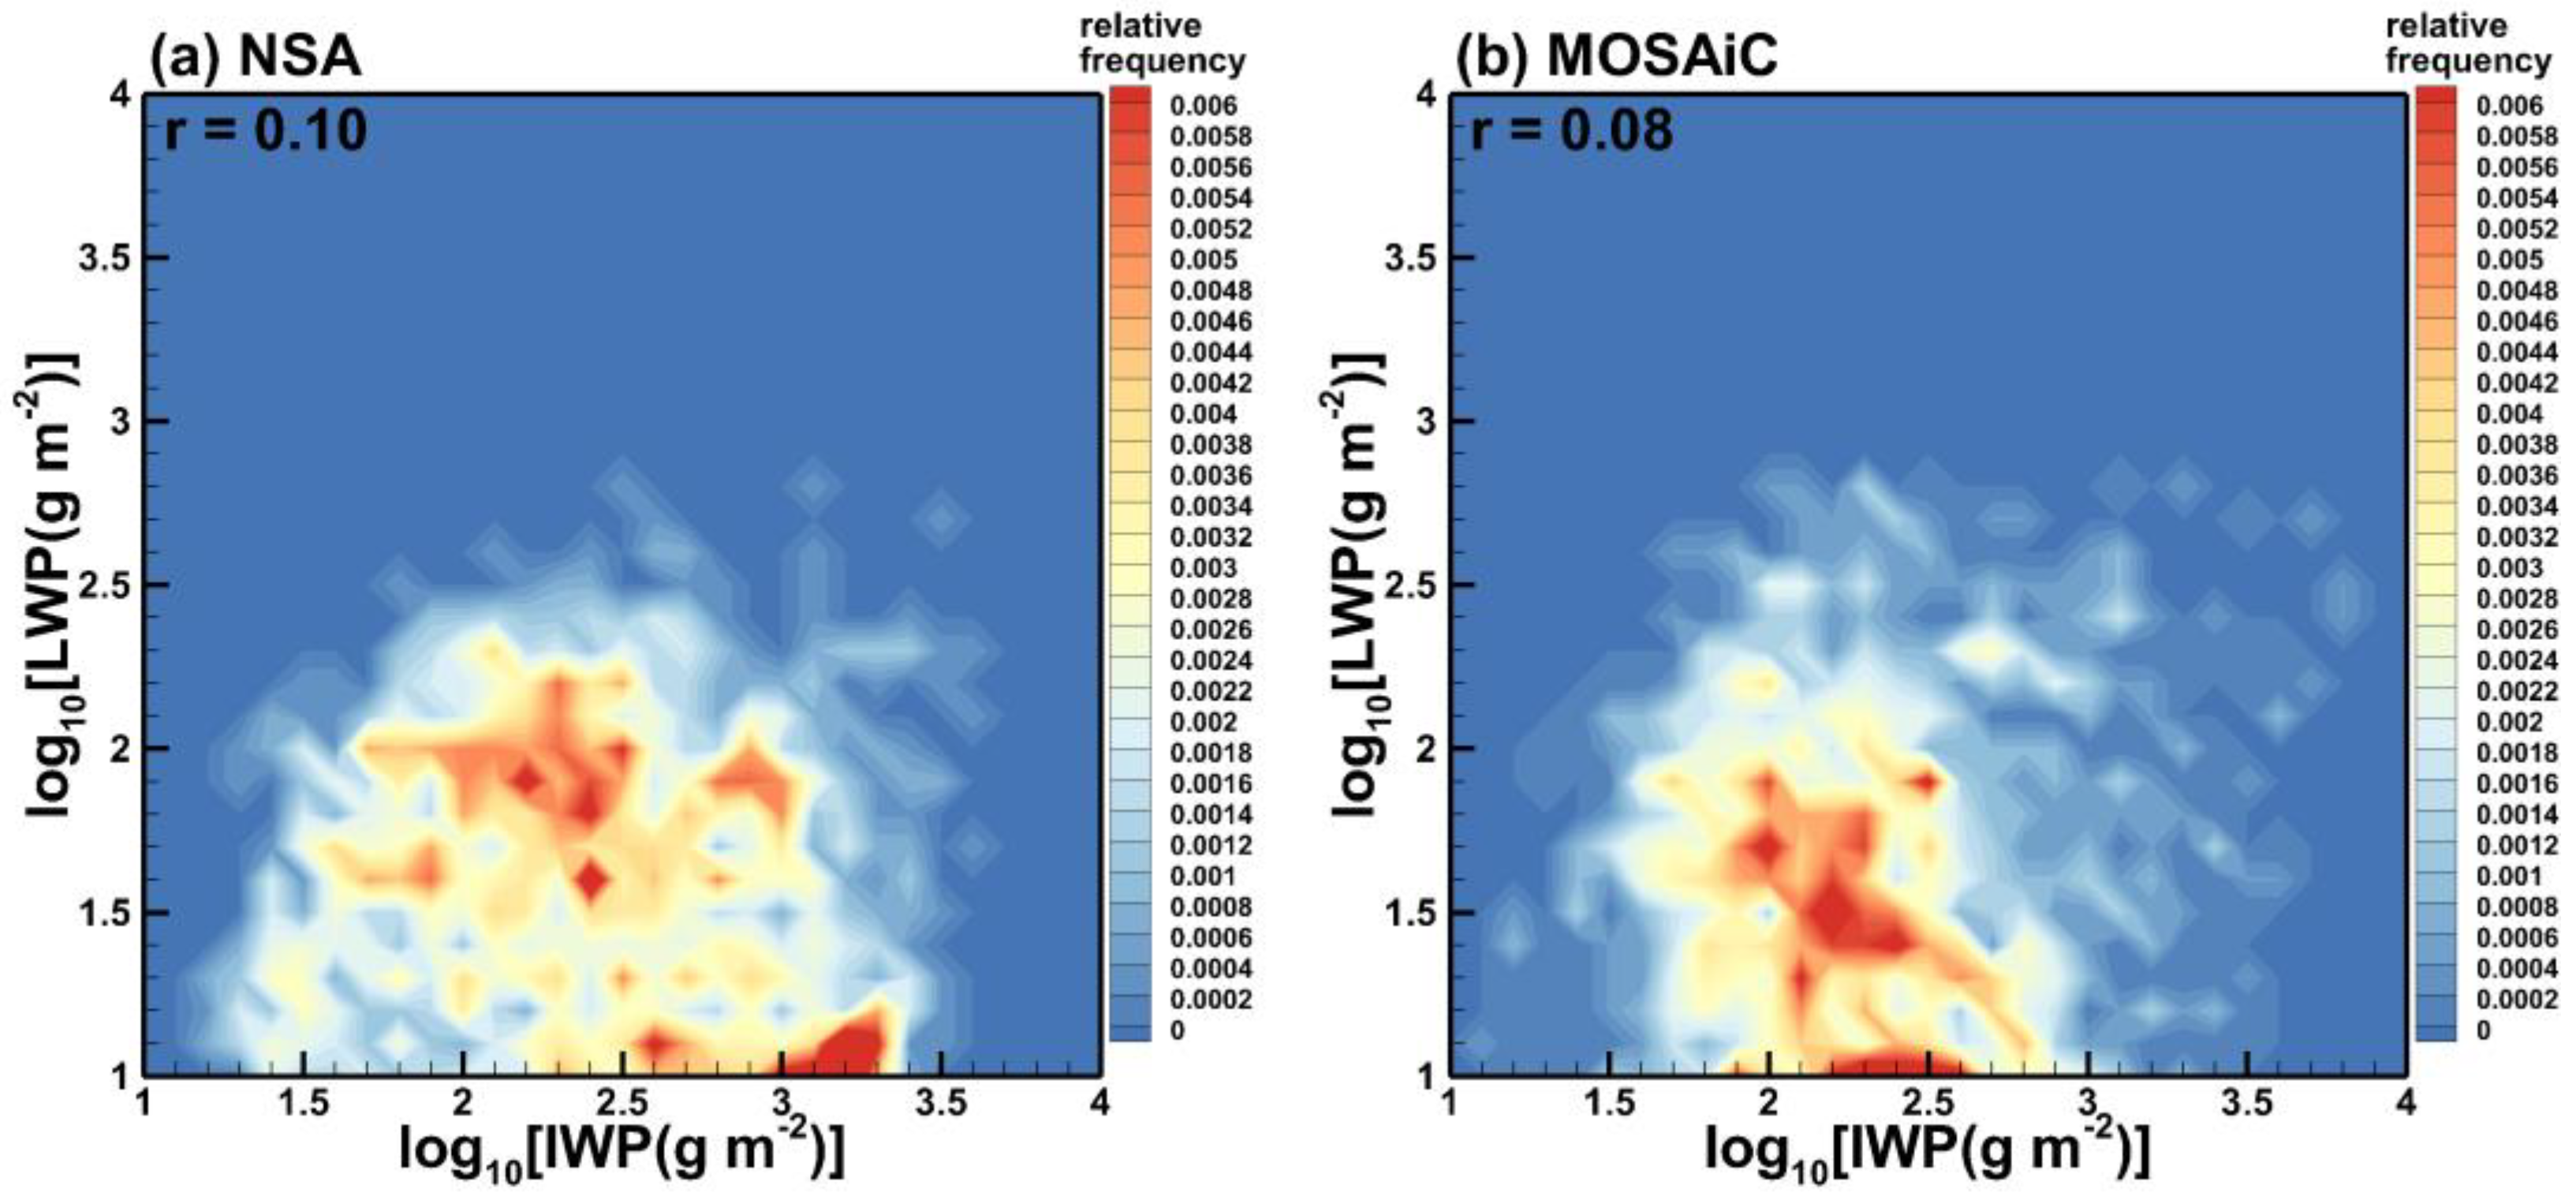
3.2. Correlation of Snowfall Rate and IWP

Figure 3 shows the frequency of occurrence scatter plots of 15 min averages of radar-derived snowfall rate and IWP values for the NSA and MOSAiC data sets. In order to account for the radar “dead zone” below the lowest range gate of ~170 m, where reliable radar echoes are not available, it was assumed that the IWC in the lowest 170 m layer was the same as at this range gate. The major contributions to the total IWP during observed snowfall, however, came from altitudes higher than 170 m. Best-fit power-law approximations are also shown in Figure 3. As seen from this figure, the correlation between S and IWP is rather high. The corresponding correlation coefficients, r, are around 0.8. As seen from Figure 3, the power-law fits underestimate the mean snowfall rates for higher values of IWP (i.e., for IWP greater than about 1 kg m−2).
Applying a time lag delay to snowfall data (the corresponding scatter plots are not shown), as was done for evaluating S-LWP correspondences, does not result in significant changes of S-IWP statistical relations. Correlation coefficients between PWD optical sensor-based snowfall rates and IWP are reduced to about 0.45 compared to those for radar-based values. This is, in part, due to the effects of blowing snow periods when optical precipitation sensors recorded measurable snowfall while the radar did not detect any significant echoes in the vertical column, which is an indication of the absence of any significant precipitation. IWC (and hence, IWP) retrievals have large uncertainties. Depending on the choice of an IWC-Ze relation used for retrievals, IWC errors can be as high as a factor of about 2 [27]. In order to evaluate the variability in the correlation between snowfall rate and IWP due to the choice of an IWC-Ze relation, another Ka-band IWC-Ze relation obtained in [28] for precipitating ice clouds was also used to derive IWP values:
IWC (gm−3) = 0.06[Ze (mm6m−3)]0.8,
While changing the best power-law approximations (i.e., S = 0.0026 IWP0.58 for NSA, and S = 0.0016 IWP0.68 for MOSAiC) instead of those shown in Figure 3, the use of relation (2) instead of (1) for estimating IWP did not result in significant changes in the correlation coefficients (i.e., r ≈ 0.81 instead of r ≈ 0.76). Similar small changes in these coefficients are also present if the daily averages of IWP and daily precipitation accumulations instead of 15 min averages are considered and when power-law correlation coefficients are calculated (i.e., when the logarithms of variables are used in correlation calculations rather than the variables themselves).
A strong correlation between S and IWP and the lack of significant correlation between S and cloud supercooled LWP (at least for appreciable snowfall in the data sets used in this study) suggest that the process of snow particle growth via water vapor deposition, on average, likely dominates the process of snowfall enhancement by riming when falling ice hydrometeors grow by accretion of small supercooled liquid water droplets which freeze on contact with the ice surfaces of generally larger solid particles.
The frequency of occurrence scatter plots of retrieved values of IWP and LWP during periods of snowfall with liquid equivalent rates greater than ~0.01 mm h−1 are shown in Figure 4. As seen from Figure 4, there is no significant correlation between IWP and LWP values. The corresponding correlation coefficients are only around 0.1. For both locations, the IWP values during precipitation observed near the ground were, on average, noticeably greater than cloud LWP. For the data in Figure 4, mean values of LWP and IWP were approximately 49 gm−2 and 525 gm−2, and 43 gm−2 and 370 gm−2 for the NSA and MOSAiC data, respectively. The IWP values are, on average, 30% lower if relation (2) is used for calculating columnar ice amount instead of relation (1).

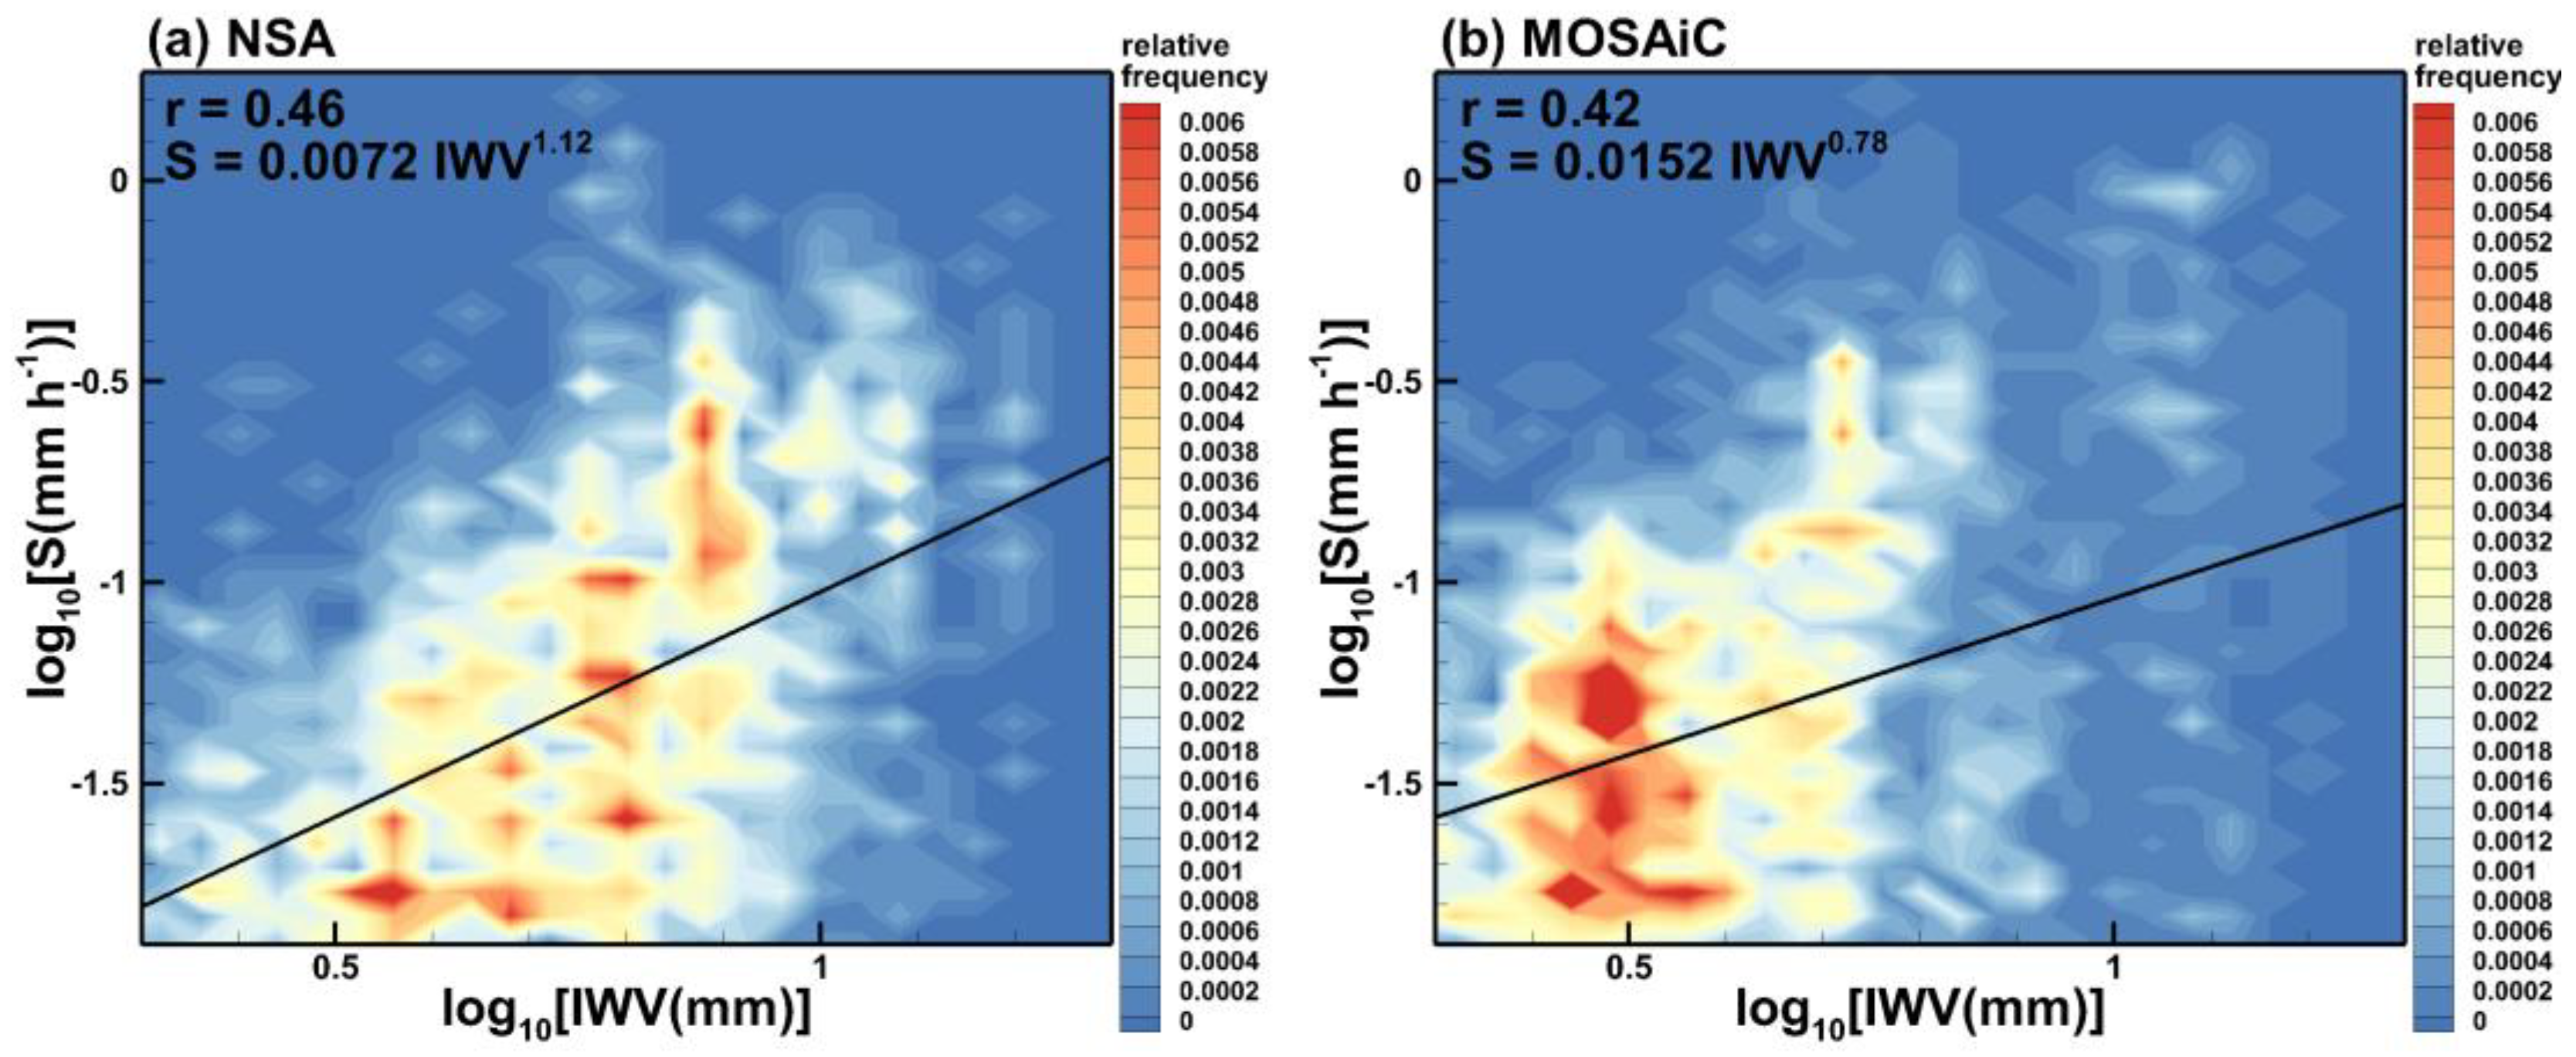
3.3. Correlation of Snowfall Rate and Integrated Water Vapor

Since atmospheric water vapor is a source of all condensed liquid water and ice in clouds and precipitation, it is particularly important to evaluate the statistical correspondence between observed IWV and snowfall rates. For the NSA and MOSAiC data sets, Figure 5 depicts the frequency of occurrence scatter plots of the radar-derived snowfall rate and IWV as estimated from the ARM microwave radiometer measurements.
As seen from Figure 5, the correlation between the 15 min averages of MWR-derived IWV and radar-derived snowfall rate is moderate, with the correlation coefficients around 0.4–0.5. Similar correlations were also observed when the mean daily values were used instead of 15 min averages. On average, the atmosphere was moister during NSA snowfalls, though the largest observed IWV values (~15 mm) were similar in both data sets (Figure 1c,d). As for the S-IWP parameter pair, introducing a time lag delay between the snowfall rate and IWV data time series does not significantly change the observed correlation between these two water cycle parameters.
In part due to blowing snow artifacts, the snowfall rates obtained from the ground-based PWD optical sensors correlate with IWV values even less (the scatter plots are not shown). The corresponding correlation coefficients for the data derived for PWD optical sensor-based snowfall rates and microwave radiometer-based IWV are generally less than 0.4. The correlation coefficients between the columnar IWV and radar-based snowfall rate values, which were found in this study, are in a lower part of the correlation coefficient range reported earlier by Zhang et al. [9] who statistically related global positioning system-based observations of IWV and liquid precipitation at mid-latitudes.
The exponents in the best-fit power-law approximations depicted in Figure 5 are relatively close to 1 which suggests that statistical snowfall-IWV relations are near linear. The IWV values in the Arctic data sets considered here, however, are commonly less than approximately 15 mm (Figure 1c,d and Figure 5). A pronounced non-linear behavior of precipitation-IWV relationships exists for liquid precipitations for which IWV values are significantly larger (e.g., [11]).
The presence of only a moderate correlation between the retrieved columnar IWV and subsequent snowfall rates suggests that the total amount of available columnar water vapor in the atmosphere is not a single decisive factor influencing precipitation existence and its intensity. The physical mechanisms of precipitation are rather complicated and other influencing factors such as the atmospheric dynamics on both the synoptic scale and mesoscale affect precipitation. One factor influencing the intensity of precipitation, for example, is the existence of converging horizontal atmospheric moisture fluxes.

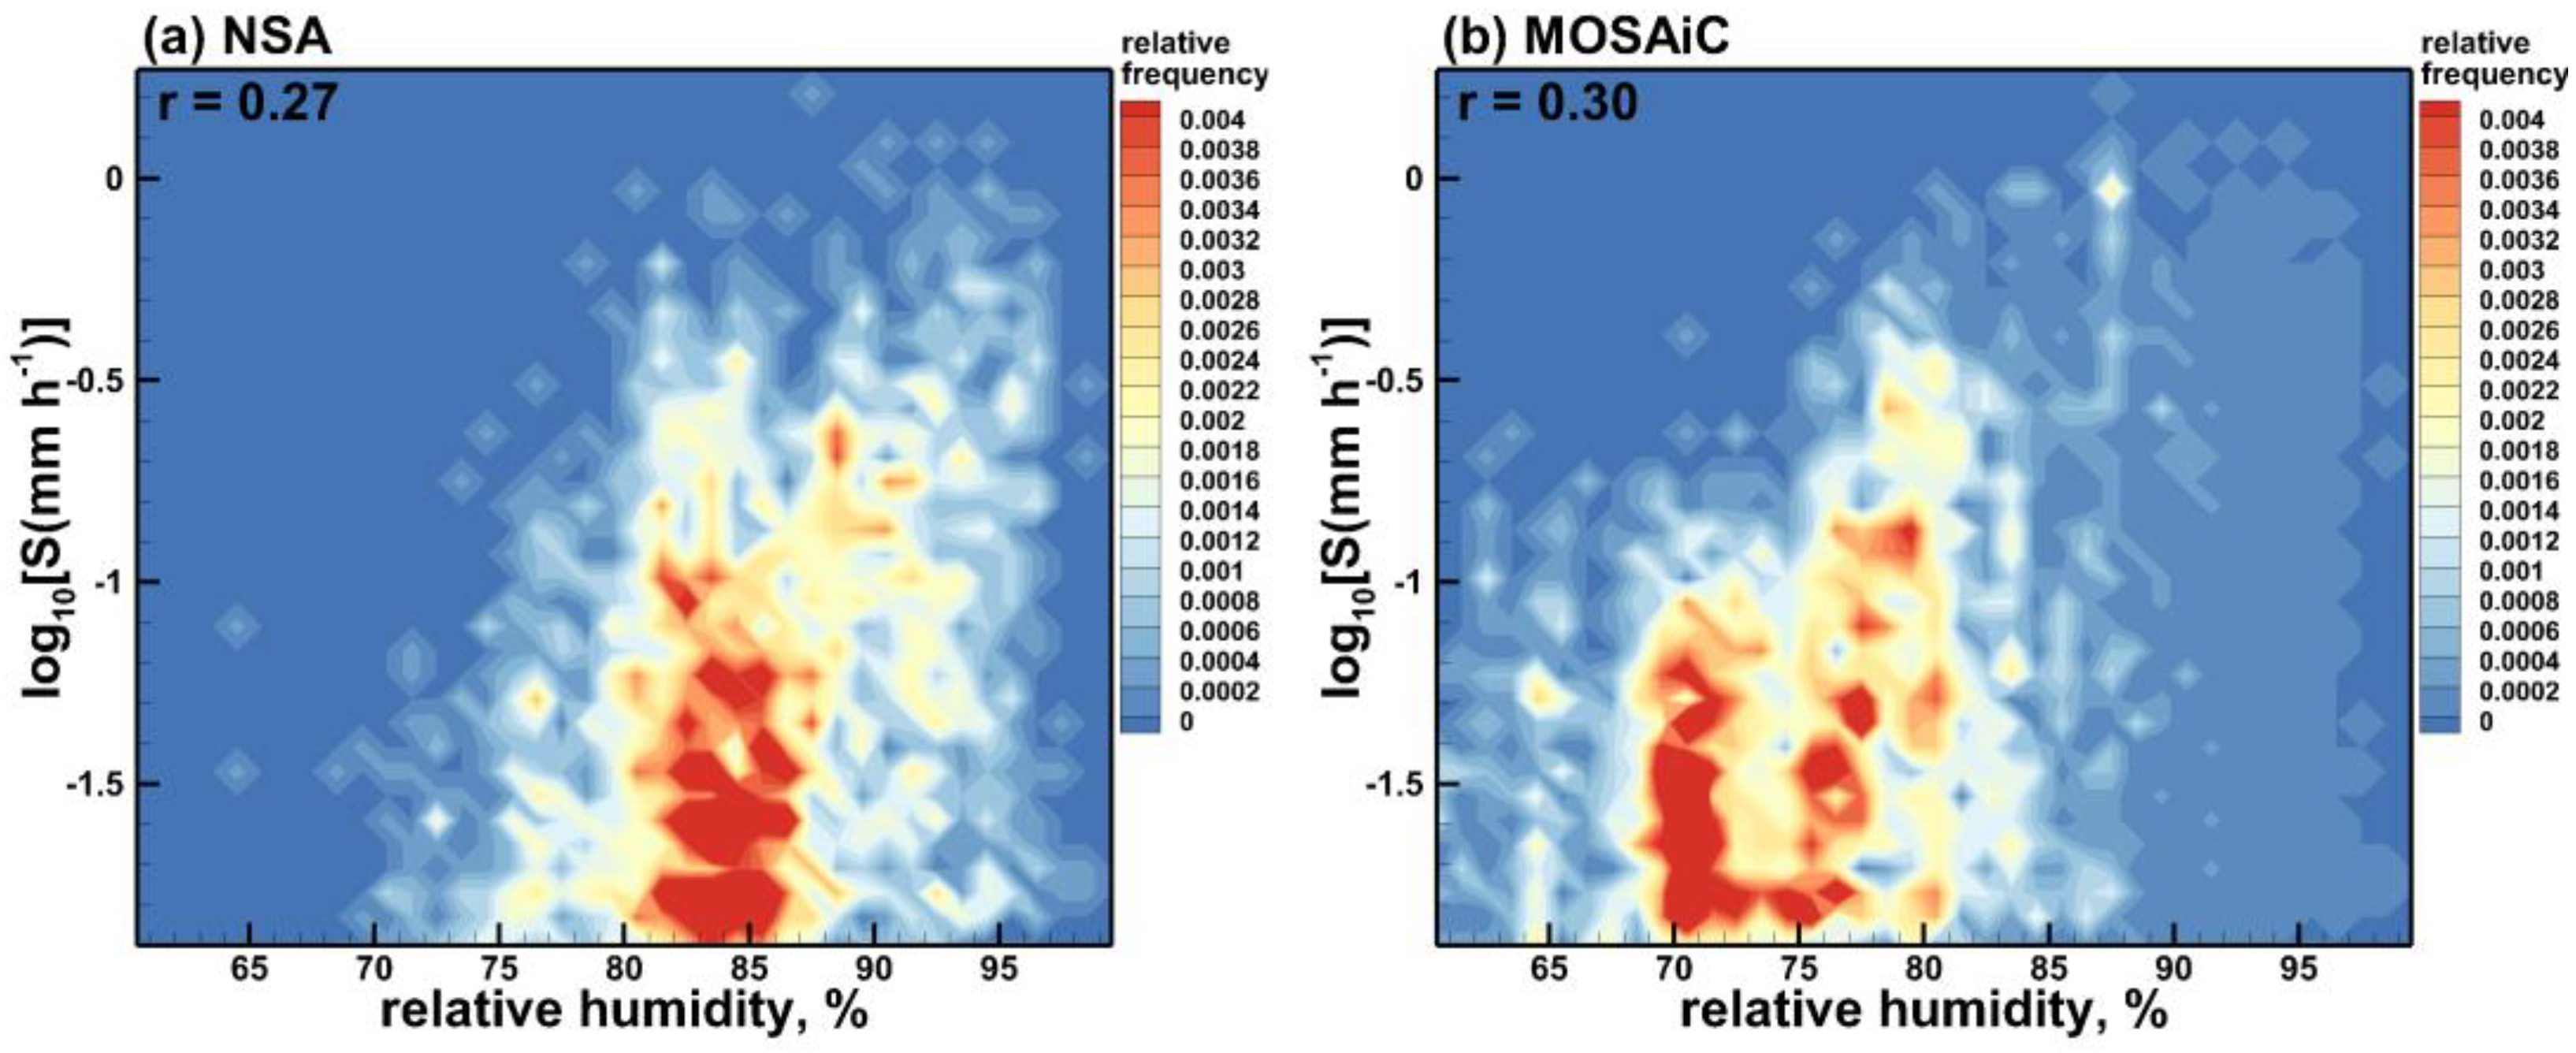
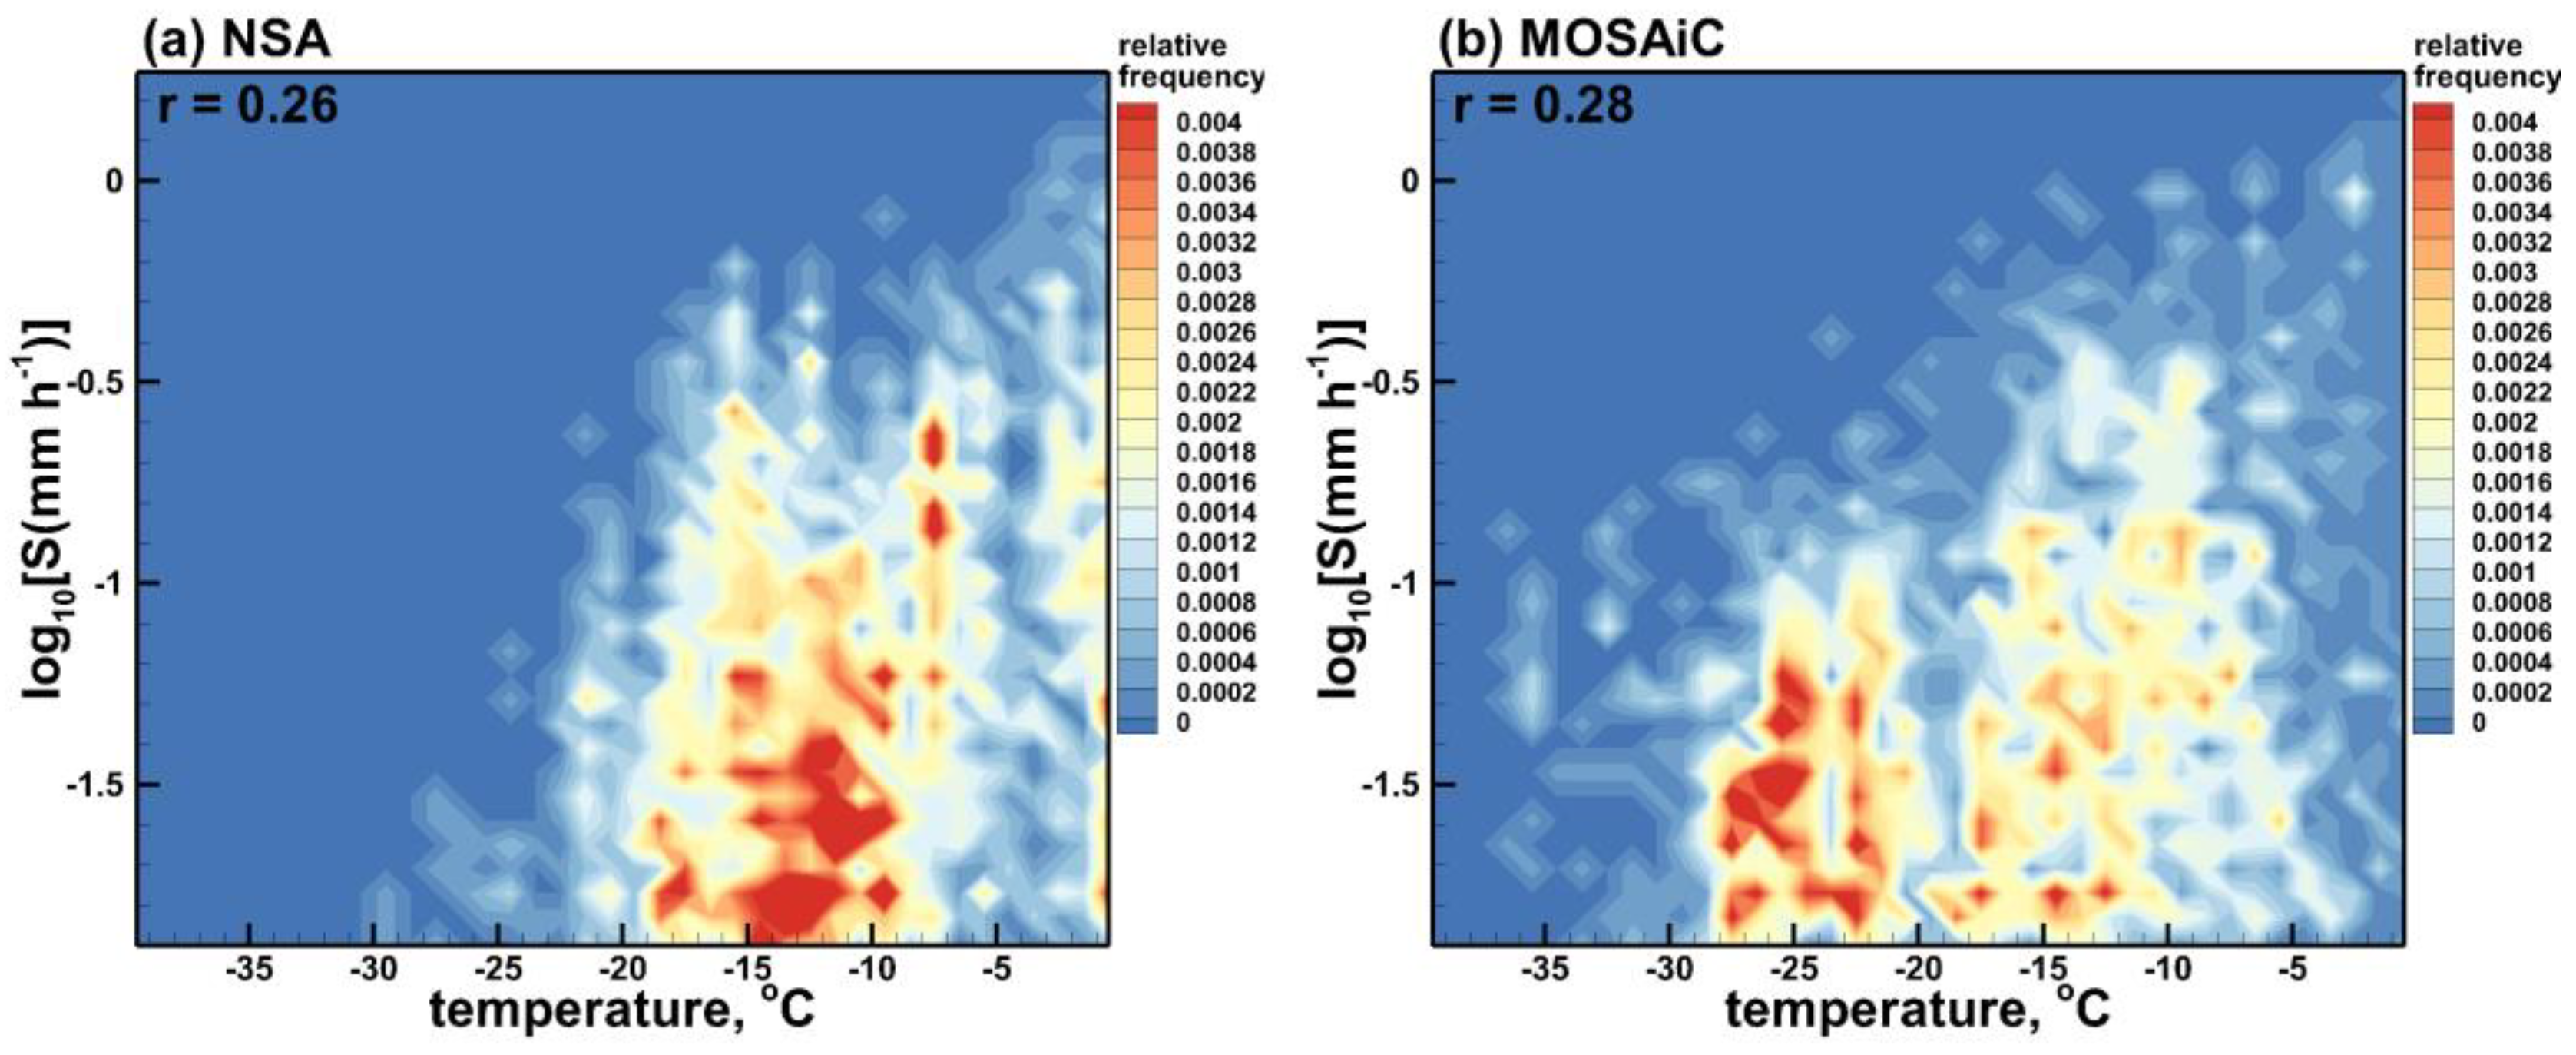
3.4. Correlation of Snowfall Rate with Surface Meteorology Parameters

The observational data sets considered in this study indicate that there is only a weak correlation between snowfall rates and near-surface air temperatures. The Pearson correlation coefficients between these parameters are just 0.26 and 0.28 for the NSA and MOSAiC data sets, respectively. The correlation remains low regardless of the source of the snowfall intensity information (i.e., radar-based snowfall retrievals or PWD optical precipitation sensor estimates). The corresponding frequency of occurrence scatter plots of radar-derived precipitation rates versus temperature are shown in Figure 6. As seen in this figure, MOSAiC snowfalls, on average, occur at lower temperatures, which is likely due to a generally colder environment in the Central Arctic compared to the North Slope of Alaska. It can also be seen from Figure 6 that the frequency of snowfall occurrence is maximal for near-surface temperatures between approximately −15 °C and −10 °C for the NSA facility data, and between about −28 °C and −23 °C for the MOSAiC observations. There are some tendencies of snowfall rate to increase with temperature for both data sets, though they are not statistically significant since the corresponding correlation coefficients are quite low.
Figure 7 shows the frequency of occurrence scatter plots of snowfall rates retrieved from the radar data versus measurements of near-surface relative humidity. As for precipitation—near-surface temperature plots (Figure 6), the correlation between snowfall and relative humidity is relatively low (r ≤ 0.3), and it does not depend much on the source of precipitation data (i.e., radar retrievals versus optical sensor data). The majority of the data points in Figure 7 correspond to values near the saturation water vapor pressure over ice. The reciprocal ratio of this pressure to that over supercooled liquid water monotonically diminishes almost linearly from about 1.35 at~−30 °C (~243 K) to 1 at 0 °C (e.g., [29], their Figure 4).

4. Discussion and Conclusions

Two data sets of particular interest to the Arctic research community were used to statistically investigate the correspondences among the water cycle parameters characterizing the atmospheric moisture conversion processes which result in solid precipitation at the ground. These data sets covered approximately 6-month periods of cold seasons, when all precipitation fell as snowfall, and were collected at the NSA DOE ARM facility during a special observing period of the international Year of the Polar Prediction and during the MOSAiC expedition. The sensors used in this study to infer parameters of the water cycle and meteorological variables were similar at both locations.
Previous observationally based studies of statistical inter-relations among different water cycle and meteorological parameters were mostly focused on liquid precipitation and generally did not consider the quantitative characteristics of cloud content, which is an important water cycle parameter. This study specifically addresses solid precipitation periods in the Arctic—the region which experiences a more rapid change compared to other regions of the Earth. A multi-sensor approach for collecting the data allowed the obtaining of concurrent estimates of cloud, precipitation and atmosphere water vapor parameters.
The water cycle parameters analyzed in this study included vertically pointing microwave radiometer-based estimates of columnar IWV and cloud supercooled LWP as well as radar-based retrievals of IWP and near-surface liquid-equivalent snowfall rate. The radars were similarly calibrated in the absolute sense. Snowfall rate estimates were also available from the ground-based precipitation sensors. The optical sensor estimates, however, are influenced by blowing snow, especially in high wind conditions. The data sets considered in this study included time periods when observations/retrievals of all water cycle parameters were available and when mean liquid equivalent precipitation rates, S, were greater than 0.01 mm h−1, which approximately correspond to the precipitation rate retrieval sensitivity limits. These periods normally correspond to the observational events with snow accumulations at the ground and exclude observations of thin stratiform liquid-bearing clouds that might precipitate very weakly (S < 0.01 mm h−1). Although 15 min parameter averages were generally used, the length of the averaging period did not significantly influence the statistical analysis results.
Supercooled liquid, which is often observed in Arctic precipitating clouds, strongly influences their the radiative properties. However, on average, little statistical correlation was found between LWP values and liquid-equivalent snowfall precipitation rates for both NSA and MOSAiC data sets and for both sources of independent snowfall rate information (i.e., from vertically pointing radar-based retrievals and from ground-based precipitation sensors). Note that radar reflectivity-snowfall rate relations do not strongly depend on riming conditions for typical snowfall intensities observed in the Arctic, which are often in the range of 0.05-2 mm h−1 (e.g., [16,30]). This is, in part, because riming causes an increase in both particle mass and reflectivity.
The snowfall rate-LWP correlation coefficients remained low for both concurrent estimates of supercooled LWP and S as well as for their time lagged values accounting for an average time, which is necessary for snowflakes to reach the ground from supercooled liquid water layers aloft. While the corresponding correlation coefficients were generally smaller than about 0.15 if the entire data sets were considered, some stronger positive correlations were observed for particular case studies with high LWP and significant snowflake riming (e.g., [22]).
Unlike for LWP, correlations between IWP and near-surface snowfall rate were quite significant, which allowed for deriving meaningful best-fit power-law S-IWP relations. Although the coefficients in these relations are dependent on the IWC-Ze correspondences used for ice content retrievals, correlations between IWP and S remain significant regardless of the exact form of these correspondences. For both Arctic locations considered here, correlation coefficients between S and IWP were approximately 0.8 when S was estimated using the radar measurements and around 0.45 when the data from the optical precipitation sensors were used. During the time periods when precipitation was present at the ground, there was no significant correlation between the total columnar amounts of ice/snow and supercooled liquid.
Overall IWP values were typically significantly larger than LWP values during precipitation periods at both locations considered here. On average, IWP values were greater than LWP by about an order of magnitude. This average disparity between solid and liquid columnar water amounts, in part, explains higher S-IWP correlations compared to S-LWP correlations.
Moderate correlations were observed between columnar water vapor and snowfall rate. Although increased IWV values are generally necessary for developing and maintaining precipitation, the S-IWV correlation coefficients were in an approximate range of only ~0.4–0.5. Precipitation processes are rather complicated and many other factors (e.g., storm dynamics, moisture convergence and vertical fluxes) are responsible for precipitation intensity in addition to elevated values of IWV. An increase in time averaging for the observation/retrieval values in this study to daily means typically results in only modest changes in the correlation coefficients between water cycle parameters (e.g., ~0.05 in the absolute sense).
The precipitation rate-columnar water vapor correlation coefficients found here for the Arctic are on the low side of the range of correlations between liquid precipitation and IWV found in [9] for different regions in China. These coefficients, however, are higher than a ~0.26 value found recently in [10] for the correlation between rain precipitation intensity and IWV. Introducing a time lag in snowfall rate and IWV data does not significantly change the corresponding correlation coefficients. This is in line with the results obtained in [10] where only small changes in correlations between warm precipitation and IWV were found when time shifts of up to 12 h were considered.
Only weak correlations were observed between snowfall rates and near-surface meteorological parameters such as temperature and relative humidity. The corresponding correlation coefficients were smaller than ~0.3 for both the NSA and MOSAiC data sets. Note that the correlation coefficients between warm precipitation and temperature/humidity parameters in [10] were even lower (i.e., r < 0.1). The concurrent precipitation and surface meteorology observations indicated that NSA snowfall most often occurred when near-surface temperatures were between approximately −15 °C and −10 °C while a significant part of the MOSAiC snowfall was observed at colder temperatures of around −25 °C. Near-surface relative humidity values during snowfall at both locations considered here were generally near saturation with respect to ice.
The mean statistical relations among different parameters of the water cycle presented in this study can be used to assess NWP model performances in describing solid precipitation processes in the Arctic—the region where the changes are more pronounced than in other parts of the globe. Comparing the modeled relationships among these parameters with those obtained using observational data sets provides a framework for evaluating how well different models handle specific moisture conversion processes.

Funding

This research was supported, in part, by the US Department of Energy (DOE) Atmospheric Systems Research (ASR) program project DE-SC0022163. Additional support was provided by the NOAA Physical Sciences Laboratory through the cooperative agreement NA22OAR4320151. Data were obtained from the Atmospheric Radiation Measurement (ARM) Program sponsored by the U.S. Department of Energy, Office of Science, Office of Biological and Environmental Research, Climate and Environmental Sciences Division. Data were also collected from Multidisciplinary drifting Observatory for the Study of the Arctic Climate (MOSAiC) from the Atmospheric Radiation Measurement (ARM) User Facility, a U.S. Department of Energy (DOE) Office of Science User Facility managed by the Biological and Environmental Research Program, under expedition number MOSAiC20192020 and project identifier AWI_PS122_00.

Institutional Review Board Statement

Not applicable.

Informed Consent Statement

Not applicable.

Data Availability Statement

The NSA, KAZR, MWR and meteorological sensor data used in this study are publicly available from the ARM archive as indicated in the ARM User Facility references below (i.e., [14,15,20,21,25,26]).

Acknowledgments

The contribution of many people involved in collecting the MOSAiC data set and in all aspects of MOSAiC is acknowledged, as outlined in [31].

Conflicts of Interest

The author declares no conflicts of interest.

References

  1. Tapiador, F.J.; Roca, R.; Del Genio, A.; Dewitte, B.; Petersen, W.; Zhang, F. Is Precipitation a Good Metric for Model Performance? Bull. Am. Meteor. Soc. 2019, 100, 223–233. [Google Scholar] [CrossRef] [PubMed]
  2. England, M.R.; Eisenman, I.; Lutsko, N.J.; Wagner, T.J.W. The recent emergence of Arctic Amplification. Geophys. Res. Lett. 2021, 48, 2021GL094086. [Google Scholar] [CrossRef]
  3. Bretherton, C.S.; Peters, M.E.; Back, L.E. Relationships between water vapor path and precipitation over the tropical oceans. J. Clim. 2004, 17, 1517–1528. [Google Scholar] [CrossRef]
  4. Ahmed, F.; Schumacher, C. Convective and stratiform components of the precipitation-moisture relationship. Geophys. Res. Lett. 2015, 42, 10453–10462. [Google Scholar] [CrossRef]
  5. Priego, E.; Jones, J.; Porres, M.; Seco, A. Monitoring water vapor with GNSS during a heavy rainfall event in the Spanish Mediterranean area. Geomat. Nat. Hazards Risk 2017, 8, 282–294. [Google Scholar] [CrossRef]
  6. Adams, D.K.; Barbosa, H.M.J.; Gaitán De Los Ríos, K.P. A spatiotemporal water vapor–deep convection correlation metric derived from the Amazon dense GNSS meteorological network. Mon. Weather Rev. 2017, 145, 279–288. [Google Scholar] [CrossRef]
  7. Fujita, M.; Sato, T. Observed behaviors of precipitable water vapor and precipitation intensity in response to upper air profile estimated from surface air temperature. Sci. Rep. 2017, 7, 4233. [Google Scholar] [CrossRef]
  8. Neelin, J.D.; Martinez-Villalobos, C.; Stechmann, S.N.; Ahmed, F.; Chen, G.; Norris, J.M.; Kuo, Y.; Lenderink, G. Precipitation extremes and water vapor. Curr. Clim. Chang. Rep. 2022, 8, 17–33. [Google Scholar] [CrossRef]
  9. Zhang, Z.; Lou, Y.; Zhang, W.; Liang, H.; Bai, J.; Song, W. Correlation analysis between precipitation and precipitable water vapor over China based on 199-2015 ground-based GPS observations. J. Appl. Meteorol. Clim. 2022, 61, 1663–1677. [Google Scholar] [CrossRef]
  10. Li, H.; Choy, S.; Zaminpardaz, S.; Carter, B.; Sun, C.; Purwar, S.; Liang, H.; Li, L.; Wang, X. Investigating the Inter-Relationships among Multiple Atmospheric Variables and Their Responses to Precipitation. Atmosphere 2023, 14, 571. [Google Scholar] [CrossRef]
  11. Hagos, S.M.; Leung, L.R.; Garuba, O.A.; Demont, C.; Harrop, B.; Lu, J.; Ahn, M. The relation between precipitation and precipitable water in CMIP6 simulations and implication for tropical climatology and change. J. Clim. 2021, 34, 1587–1600. [Google Scholar] [CrossRef]
  12. Liu, J.; Curry, J.A.; Wang, H.; Song, M.; Horton, M.H. Impact of declining Arctic sea ice on winter snowfall. Proc. Natl. Acad. Sci. USA 2012, 109, 4074–4079. [Google Scholar] [CrossRef] [PubMed]
  13. Shupe, M.D.; Rex, M.; Dethloff, K.; Damm, E.; Fong, A.A.; Gradinger, R.; Heuze, C.; Loose, B.; Makarov, A.; Maslowski, W.; et al. The MOSAiC Expedition: A Year Drifting with the Arctic Sea Ice. In Arctic Report Card 2020; Thoman, R.L., Richter-Menge, J., Druckenmiller, M.L., Eds.; NOAA: Washington, DC, USA, 2020. [Google Scholar] [CrossRef]
  14. Bharadwaj, N.; Lindenmaier, I.; Feng, Y.; Johnson, K.; Nelson, D.; Isom, B.; Hardin, J.; Matthews, A.; Wendler, T.; Castro, V.; et al. Atmospheric Radiation Measurement (ARM) User Facility. Ka ARM Zenith Radar (KAZRGE). 2017-11-01 to 2018-04-30, North Slope Alaska (NSA) Central Facility, Barrow AK (C1); ARM Data Center: Washington, DC, USA, 2011. [Google Scholar] [CrossRef]
  15. Lindenmaier, I.; Feng, Y.; Johnson, K.; Nelson, D.; Isom, B.; Hardin, J.; Matthews, A.; Wendler, T.; Castro, V.; Deng, M. Atmospheric Radiation Measurement (ARM) User Facility. Ka ARM Zenith Radar (KAZRCFRGE). 2019-10-11 to 2020-10-01, ARM Mobile Facility (MOS) MOSAIC (Drifting Obs—Study of Arctic Climate); AMF2 (M1); ARM Data Center: Washington, DC, USA, 2019. [Google Scholar] [CrossRef]
  16. Matrosov, S.Y.; Shupe, M.D.; Uttal, T. High temporal resolution estimates of Arctic snowfall rates emphasizing gauge and radar-based retrievals from the MOSAiC expedition. Elem. Sci. Anthr. 2022, 10, 00101. [Google Scholar] [CrossRef]
  17. Goodison, B.E.; Klemm, S.; Sevruk, B. WMO Solid Precipitation Measurement Intercomparison; TECO-1988 WMO/TD-No. 222, WMO: Geneva, Switzerland, 1988; pp. 255–262. Available online: https://library.wmo.int/idurl/4/28336 (accessed on 21 October 2021).
  18. Werner, K.; Goessling, H.; Jung, T.; Hoke, W.; Pasqualetto, S.; Kirchhoff, K. The Year of Polar Prediction—Developments and Prospects through Three Special Observing Periods. In Proceedings of the EGU General Assembly 2019, Vienna, Austria, 7–12 April 2019; Available online: https://meetingorganizer.copernicus.org/EGU2019/EGU2019-12762.pdf (accessed on 21 October 2021).
  19. Xia, X.; Fu, D.; Shao, W.; Jiang, R.; Wu, S.; Zhang, P.; Yang, D.; Xia, X. Retrieving precipitable water vapor over land from satellite passive microwave radiometer measurements using automated machine learning. Geophys. Res. Lett. 2023, 50, e2023GL105197. [Google Scholar] [CrossRef]
  20. Zhang, D. Atmospheric Radiation Measurement (ARM) User Facility. MWR Retrievals (MWRRET1LILJCLOU). 2017-11-01 to 2018-04-30, North Slope Alaska (NSA) Central Facility, Barrow AK (C1); ARM Data Center: Washington, DC, USA, 2011. [Google Scholar] [CrossRef]
  21. Zhang, D. Atmospheric Radiation Measurement (ARM) User Facility. MWR Retrievals (MWRRET1LILJCLOU). 2019-10-11 to 2020-10-01, ARM Mobile Facility (MOS) MOSAIC (Drifting Obs—Study of Arctic Climate); AMF2 (M1); ARM Data Center: Washington, DC, USA, 2019. [Google Scholar] [CrossRef]
  22. Matrosov, S.Y. Frozen hydrometeor terminal fall velocity dependence on particle habit and riming as observed by vertically-pointing radars. J. Appl. Meteorol. Clim. 2023, 62, 1023–1038. [Google Scholar] [CrossRef]
  23. Liu, C.-L.; Illingworth, A.J. Toward more accurate retrievals of ice water content from radar measurements of clouds. J. Appl. Meteor. 2000, 39, 1130–1146. [Google Scholar] [CrossRef]
  24. Morrison, H.; de Boer, G.; Feingold, G.; Harrington, J.; Shupe, M.D.; Sulia, K. Resilience of persistent Arctic mixed-phase clouds. Nat. Geosci. 2012, 5, 11–17. Available online: https://www.nature.com/articles/ngeo1332 (accessed on 21 October 2021). [CrossRef]
  25. Kyrouac, J.; Shi, Y. Atmospheric Radiation Measurement (ARM) User Facility. Surface Meteorological Instrumentation (MET). 2017-11-01 to 2018-04-30, North Slope Alaska (NSA) Central Facility, Barrow AK (C1); ARM Data Center: Washington, DC, USA, 2003. [Google Scholar] [CrossRef]
  26. Kyrouac, J.; Shi, Y. Atmospheric Radiation Measurement (ARM) User Facility. Surface Meteorological Instrumentation (MET). 2019-10-15 to 2020-09-18, ARM Mobile Facility (MOS) Collocated Instruments on Ice (S3); ARM Data Center: Washington, DC, USA, 2019. [Google Scholar] [CrossRef]
  27. Matrosov, S.Y. Variability of microphysical parameters in high-altitude ice clouds: Results of the remote sensing method. J. Appl. Meteor. 1997, 36, 633–648. [Google Scholar] [CrossRef]
  28. Matrosov, S.Y.; Heymsfield, A.J. Estimating ice content and extinction in precipitating cloud systems from CloudSat radar measurements. J. Geophys. Res. 2008, 113, D00A05. [Google Scholar] [CrossRef]
  29. Ambaum, M.H.P. Accurate, simple equation for saturated vapour pressure over water and ice. Q. J. R. Meteorol. Soc. 2020, 146, 4252–4258. [Google Scholar] [CrossRef]
  30. Falconi, M.T.; von Lerber, A.; Ori, D.; Marzano, F.S.; Moisseev, D. Snowfall retrieval at X, Ka and W bands: Consistency of backscattering and microphysical properties using BAECC ground-based measurements. Atmos. Meas. Tech. 2018, 11, 3059–3079. [Google Scholar] [CrossRef]
  31. Nixdorf, U.; Dethloff, K.; Rex, M.; Shupe, M.; Sommerfeld, A.; Perovich, D.K.; Nicolaus, M.; Heuze, C.; Rabe, B.; Loose, B.; et al. 2021: MOSAiC Extended Acknowledgement. Zenodo Open Repository, Operated by CERN—The European Organization for Nuclear Research. Available online: https://zenodo.org/records/5541624 (accessed on 21 October 2021).
Figure 1. Time series of (a,b) liquid equivalent snowfall rates, S, (c,d) LWP (green) and IWV (black), and (e,f) IWP. Frames (a,c,e)—NSA data, frames (b,d,f)—MOSAiC data.
Atmosphere 15 00132 g001
Figure 2. Scatter plots of radar-derived (a,b) and optical sensor-based (c,d) snowfall rates versus LWP for (a,c) NSA and (b,d) MOSAiC data sets.
Atmosphere 15 00132 g002
Figure 3. Scatter plots of radar-derived snowfall rates versus IWP for (a) NSA and (b) MOSAiC data.
Atmosphere 15 00132 g003
Figure 4. Scatter plots of retrieved LWP and IWP values for (a) NSA and (b) MOSAiC data.
Atmosphere 15 00132 g004
Figure 5. Scatter plots of radar-derived snowfall rates versus IWV for (a) NSA and (b) MOSAiC data.
Atmosphere 15 00132 g005
Figure 6. Scatter plots of snowfall rates near surface and temperature for (a) NSA and (b) MOSAiC data.
Atmosphere 15 00132 g006
Figure 7. Scatter plots of snowfall rates near surface versus relative humidity for (a) NSA and (b) MOSAiC data sets.
Atmosphere 15 00132 g007
Disclaimer/Publisher’s Note: The statements, opinions and data contained in all publications are solely those of the individual author(s) and contributor(s) and not of MDPI and/or the editor(s). MDPI and/or the editor(s) disclaim responsibility for any injury to people or property resulting from any ideas, methods, instructions or products referred to in the content.

