Article

Relationships between Temperature at Surface Level and in the Troposphere over the Northern Hemisphere

by
Zbigniew Ustrnul
1,2,
Jadwiga Woyciechowska
2 and
Agnieszka Wypych
1,*
1
Department of Climatology, Jagiellonian University in Krakow, 30-387 Krakow, Poland
2
Institute of Meteorology and Water Management—National Research Institute, 01-683 Warsaw, Poland
*
Author to whom correspondence should be addressed.
Atmosphere 2023, 14(9), 1423; https://doi.org/10.3390/atmos14091423
Submission received: 14 August 2023 / Revised: 2 September 2023 / Accepted: 7 September 2023 / Published: 11 September 2023
(This article belongs to the Section Climatology)

Abstract

:
The thermal structure of the troposphere remains a hot topic, including modelling issues as well as temperature field simulations. This study evaluates the relationship between the air temperature at the Earth’s surface and the temperature of various layers of the troposphere over the Northern Hemisphere, as well as attempts to identify determinants of its variability. Vertical differentiation has been analyzed from the layer σ = 0.995 representing the surface (surface air temperature, SAT), up to an isobaric level of 300 hPa with a focus on the main pressure levels, i.e., 925 hPa, 850 hPa, 700 hPa, 500 hPa. The data were obtained from an NCEP/NCAR reanalysis with a resolution of 2.5 degrees latitude and longitude for the period 1961–2020. The relationship between the SAT and the temperature at each level was expressed using a simple but effective correlation coefficient by Pearson (PCC). These relationships obviously, according to Tobler’s law, weaken with an increasing altitude. However, the distribution of PCC (both horizontal and vertical) proves the impact of geographic factors associated with the relief and also with the surface itself (e.g., land cover). These factors are the main drivers of inversion layers and significantly disturb the straight vertical structure of the atmosphere. The research has shown a significant interannual differentiation of these interactions, as well as their spatial diversity in geographic space. The altitude–temperature relationship becomes weaker in all seasons, but much faster during summer and winter, relative to both spring and autumn.

1. Introduction

The Earth and its atmosphere of mixed gases make up a complex system. Processes taking place in the air that surrounds the rotating planet have been described by atmospheric physicists (e.g., [1,2,3]). They offer complete formulae describing the type and scale of any movement in the atmosphere. It allows the determination of its temporal and spatial variability. While certainly useful, these are partial non-linear hydrodynamic formulae that offer no analytical solutions and force researchers to seek simplifications in the form of mathematical models. Thus, when trying to investigate single or multiple climatic elements, it should be considered that the state of the atmosphere is an outcome of the action of a complicated moving mechanism. That component is a result of correlated processes and interlinked phenomena, as well as the interaction between the atmosphere and the surface.
However, when looking at the vertical variability of mean temperature, especially in the lower layer of the atmosphere, it is hard to resist the temptation to investigate the linear relationships between the surface air temperature (SAT) and the temperature higher up, even if its vertical variability differs from area to area and between seasons; as such, the correlation between temperature values in different air layers is a complex one. An analysis of the relationship should help to tell us what the impact of temperature at higher levels of the troposphere is (where most of the major weather phenomena occur) on thermal conditions at the surface level. It should also answer the question of whether or not there are areas with a strong co-variability of temperatures at different levels, what their characteristics are, and whether the relationships are permanent throughout the year or change and differ from season to season.
The relationship between the air temperature at the surface of the Earth and the temperature in the upper parts of the troposphere remains an engaging issue in the scientific community. The issue remains a hot topic and includes research themes such as the temperature structure of the troposphere, determinants of the temperature–temperature relationship, and modelling issues, as well as temperature field simulations (e.g., [4,5,6,7,8,9,10,11,12,13]). These works focus on large-scale changes in light of the fact that an understanding of horizontal and vertical temperature gradients is vital in climate modelling and weather forecasting.
Even though the literature provides a relatively clear picture of the changes that take place in the atmosphere and the variability and dependence between the components, processes, and phenomena observable in the troposphere, a relatively low number of studies address the relationships between meteorological fields at surface level and the values in higher atmospheric altitudes over vast areas, i.e., at a hemisphere or continent level. It must, however, be admitted that, along with the development of various tools, studies have started to appear presenting the results of research carried out on a meso- and macroscale.
The purpose of this paper is to identify relationships between surface air temperature and the temperature at different altitudes of the troposphere over the Northern Hemisphere (NH). Simultaneously, it aims to evaluate spatial variability in the context of underlying factors. Thus, this paper analyses the layer of the troposphere over the NH that extends from the Earth’s surface to the 300 hPa isobaric surface.
Research has shown that the largest spatial differences in temperature are observed in the summer and winter months, which leads most researchers to calculate the average seasonal temperatures for these two seasons or their representative months (i.e., July and January). Given that spring and autumn are characterized by far fewer temperature differences, this paper also uses the summer and winter seasons to illustrate spatial differences in temperature relationships for vertical cross sections of the atmosphere. Such generalization of data also applies to annual averages.

2. Materials and Methods

As some authors have demonstrated [14,15,16,17,18], gridded data may serve as a basis for investigating atmospheric phenomena and processes. It seems particularly useful in evaluating the correlations between climate components [19], such as the surface air temperature (SAT) and the temperature in the troposphere, which are the subject of this study.
In order to deliver its objective, this study uses average monthly temperature values at standard 925, 850, 700, 500, and 300 hPa pressure levels within the layer of the troposphere investigated, derived from the joint NCEP/NCAR project [20,21] (further ‘reanalysis’). The SAT used for this study is a temperature of σ = 0.995. The average monthly values were used to determine seasonal means (DJF and JJA for winter and summer, respectively) and mean annual values for the years 1961–2020. All data have been calculated for gridded points with a spatial resolution of 2.5° longitude and latitude. The boundary layer is represented by the 925 and 850 hPa isobaric surfaces, the mid-troposphere by the 700 and 500 hPa surfaces, and the upper troposphere by the 300 hPa level.
Latitudinal (50° N) and longitudinal (20° E) cross sections were also analyzed in order to help to determine the relationship between the air temperature at the Earth surface and that in the troposphere, noted at selected altitudes (isobaric surfaces). The 20° E meridian line cuts across northern Africa and Europe, including Spitsbergen, and is quite representative of the NH with the majority of Earth’s landmass. The 50° N parallel line cuts across Central Europe, Asia, and North America, and is representative of geographic regions in the temperate zone.
The relationship between surface air temperature and the temperature at different levels of the troposphere was calculated using a well-known and simple method of linear correlation. Calculations were performed at each grid point. The data used, i.e., monthly air temperature values for NH for the period 1961–2020, create annual data strings with a strong Gaussian distribution, which allowed the use of the Pearson correlation coefficient (R). Then, the obtained correlation coefficient values were used to prepare relevant maps, which in turn allowed for a detailed spatial analysis of the obtained dependencies. In the construction of maps, the method of ordinary kriging was used, which is usually used in macro-scale analyses. The developed maps allowed for a detailed spatial analysis of the obtained dependencies and, as a result, their evaluation. While only a simple statistical measure, the correlation coefficient serves as the most accurate and effective measure of dependence (e.g., [16,17,18]).

3. Results

The analysis of the correlation between the SAT and the temperature of the pressure layers between 925 hPa and 300 hPa was expected to identify areas and isobaric surfaces in the NH where the relationship was the strongest.
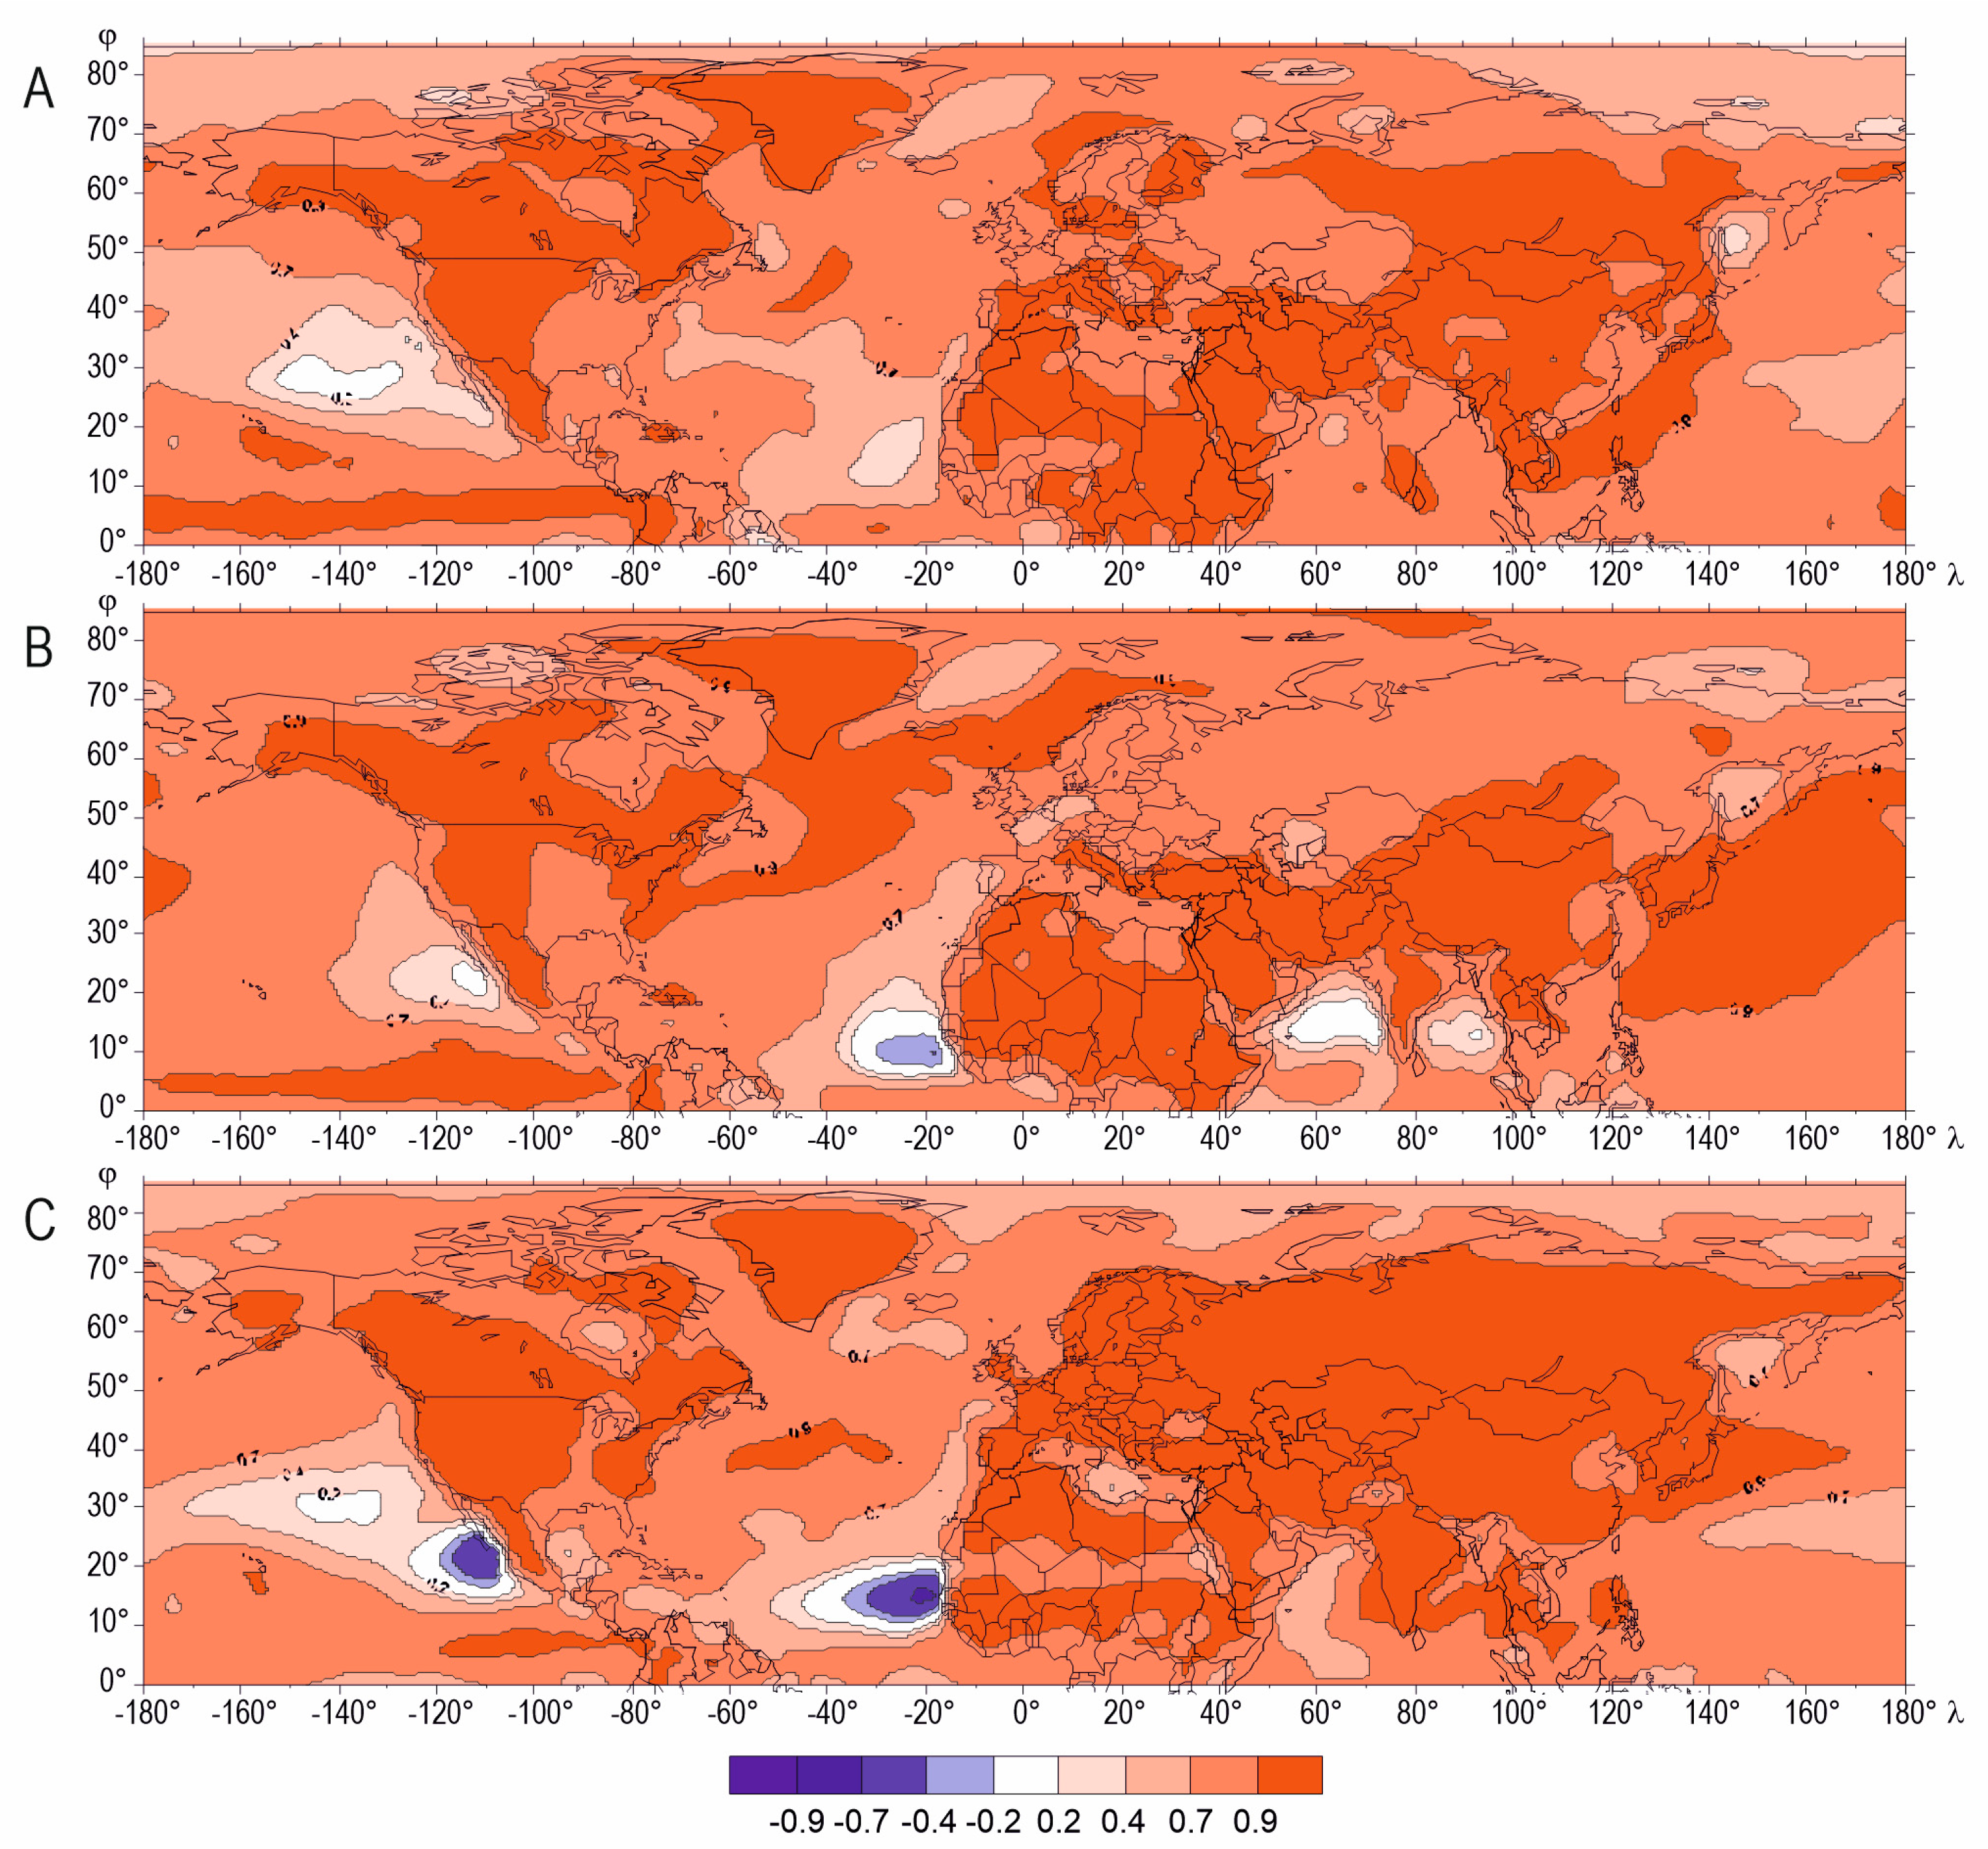
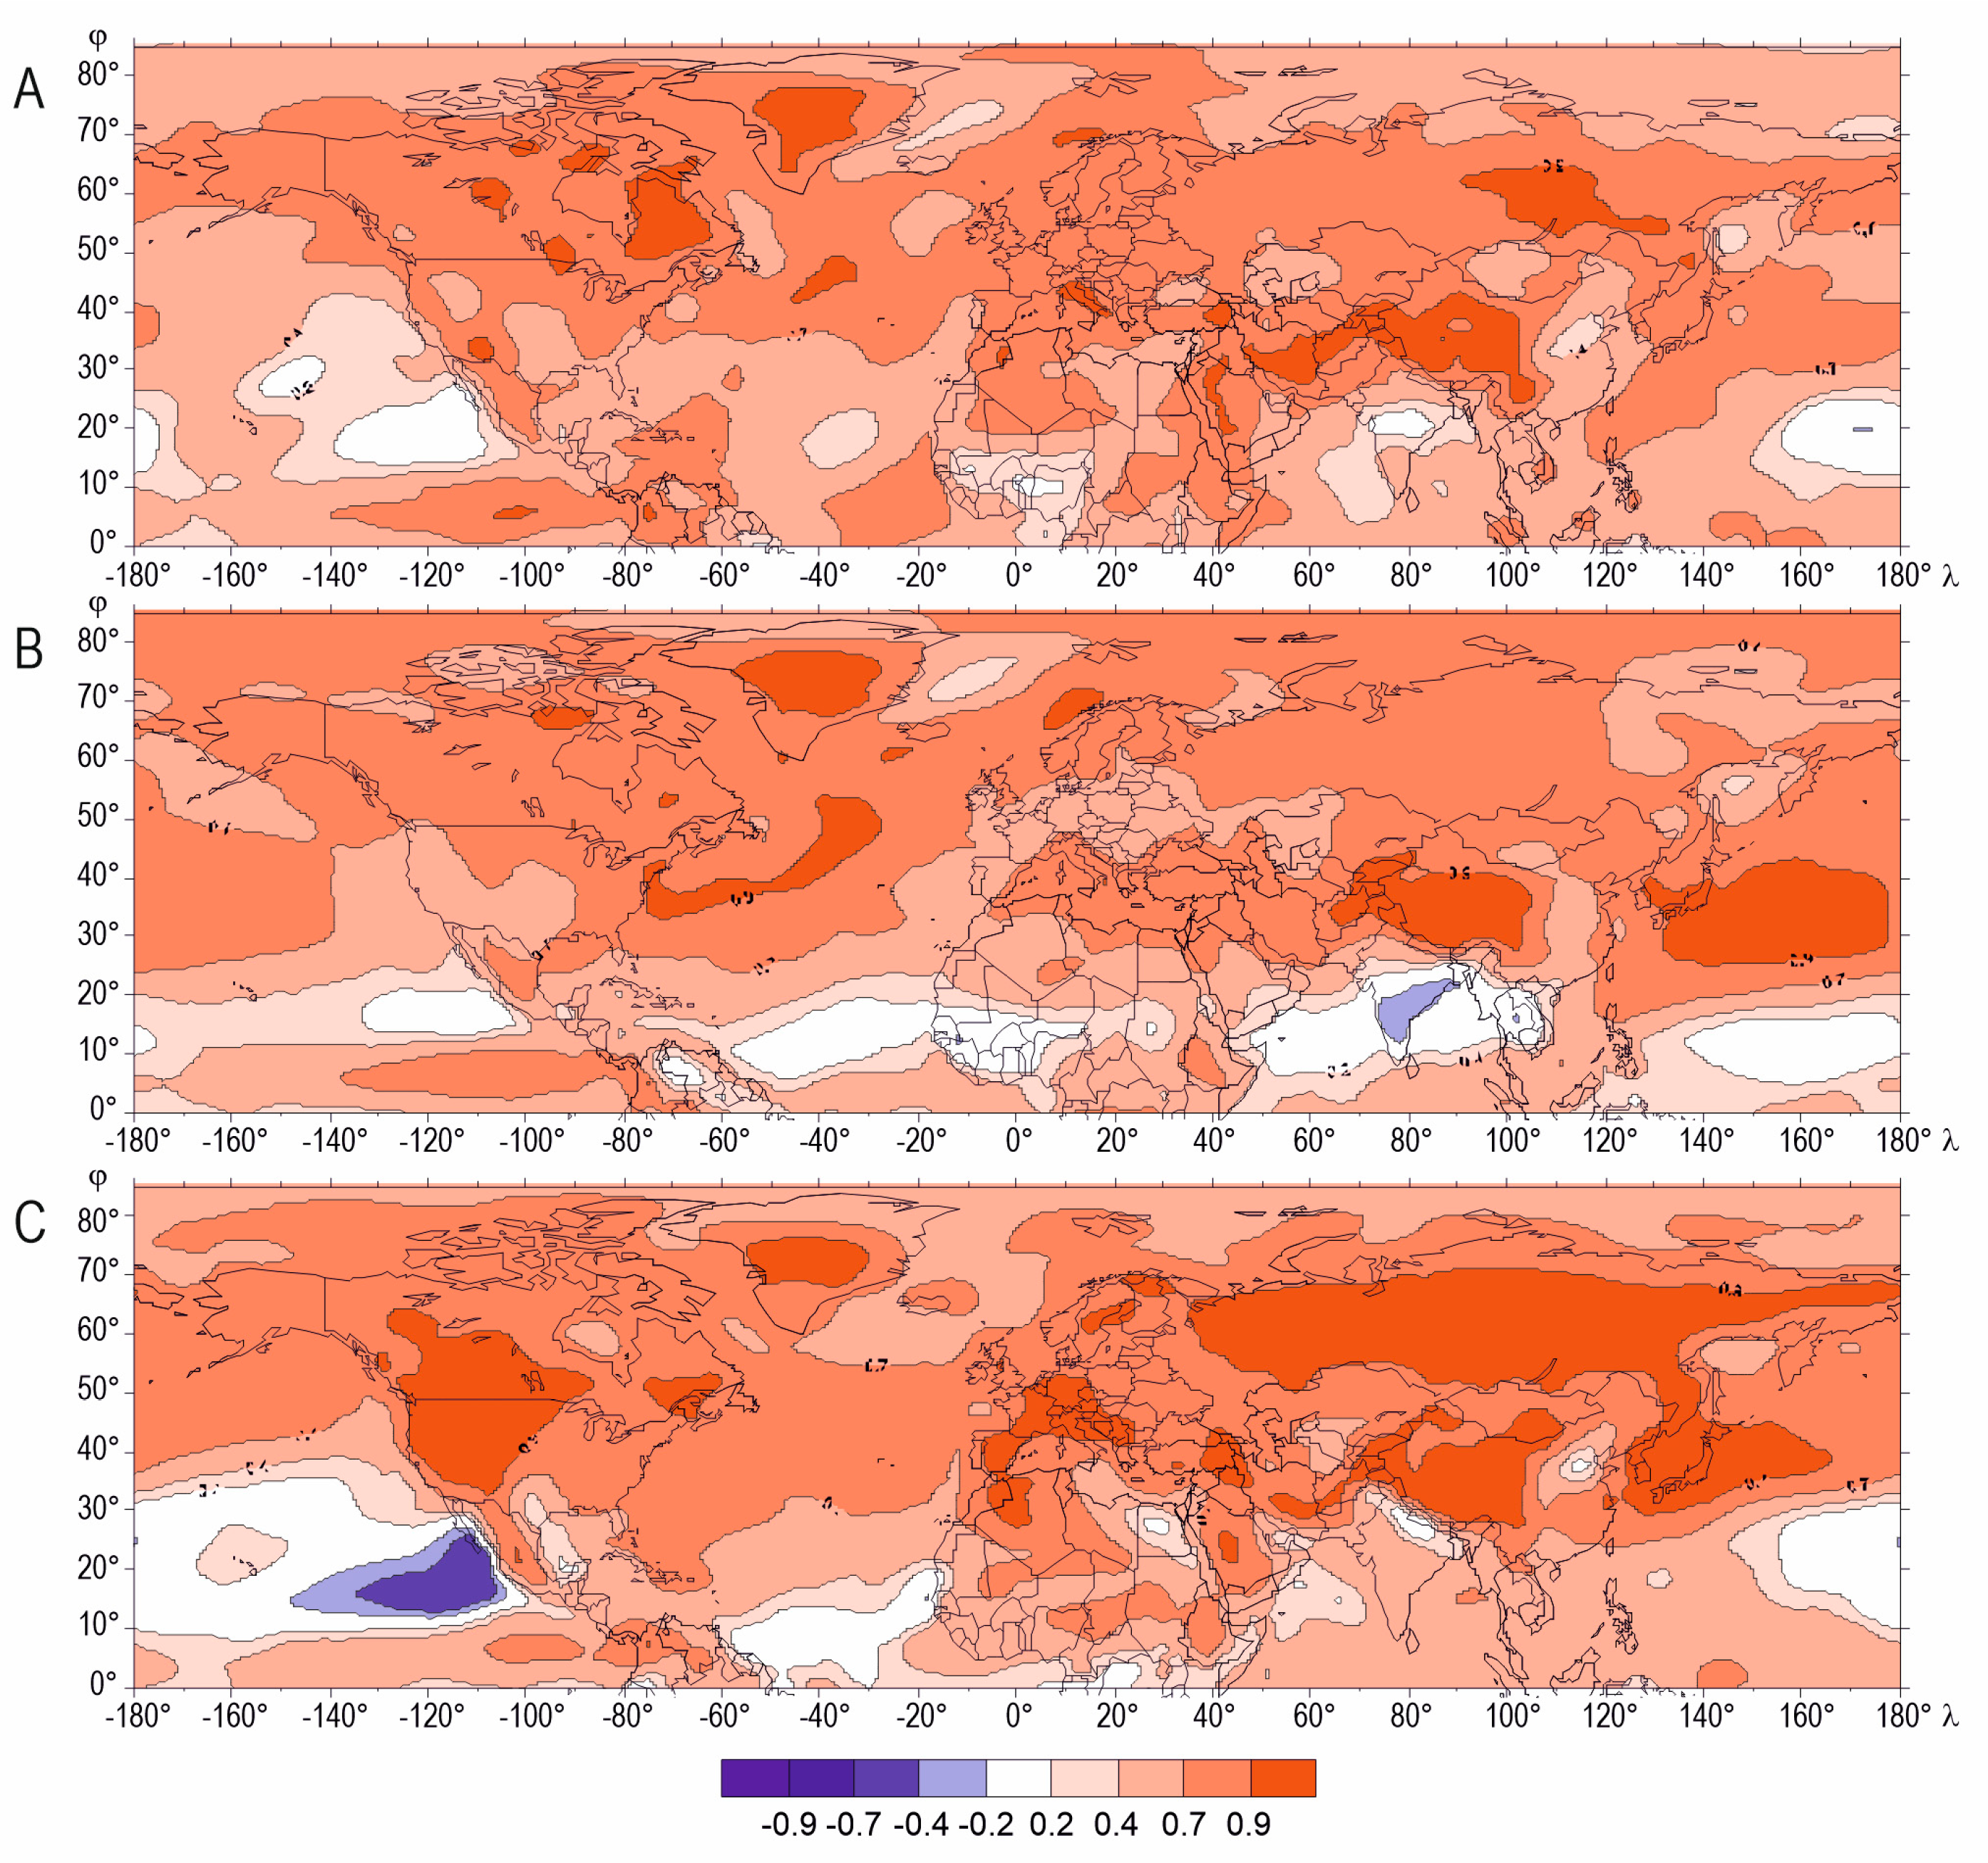
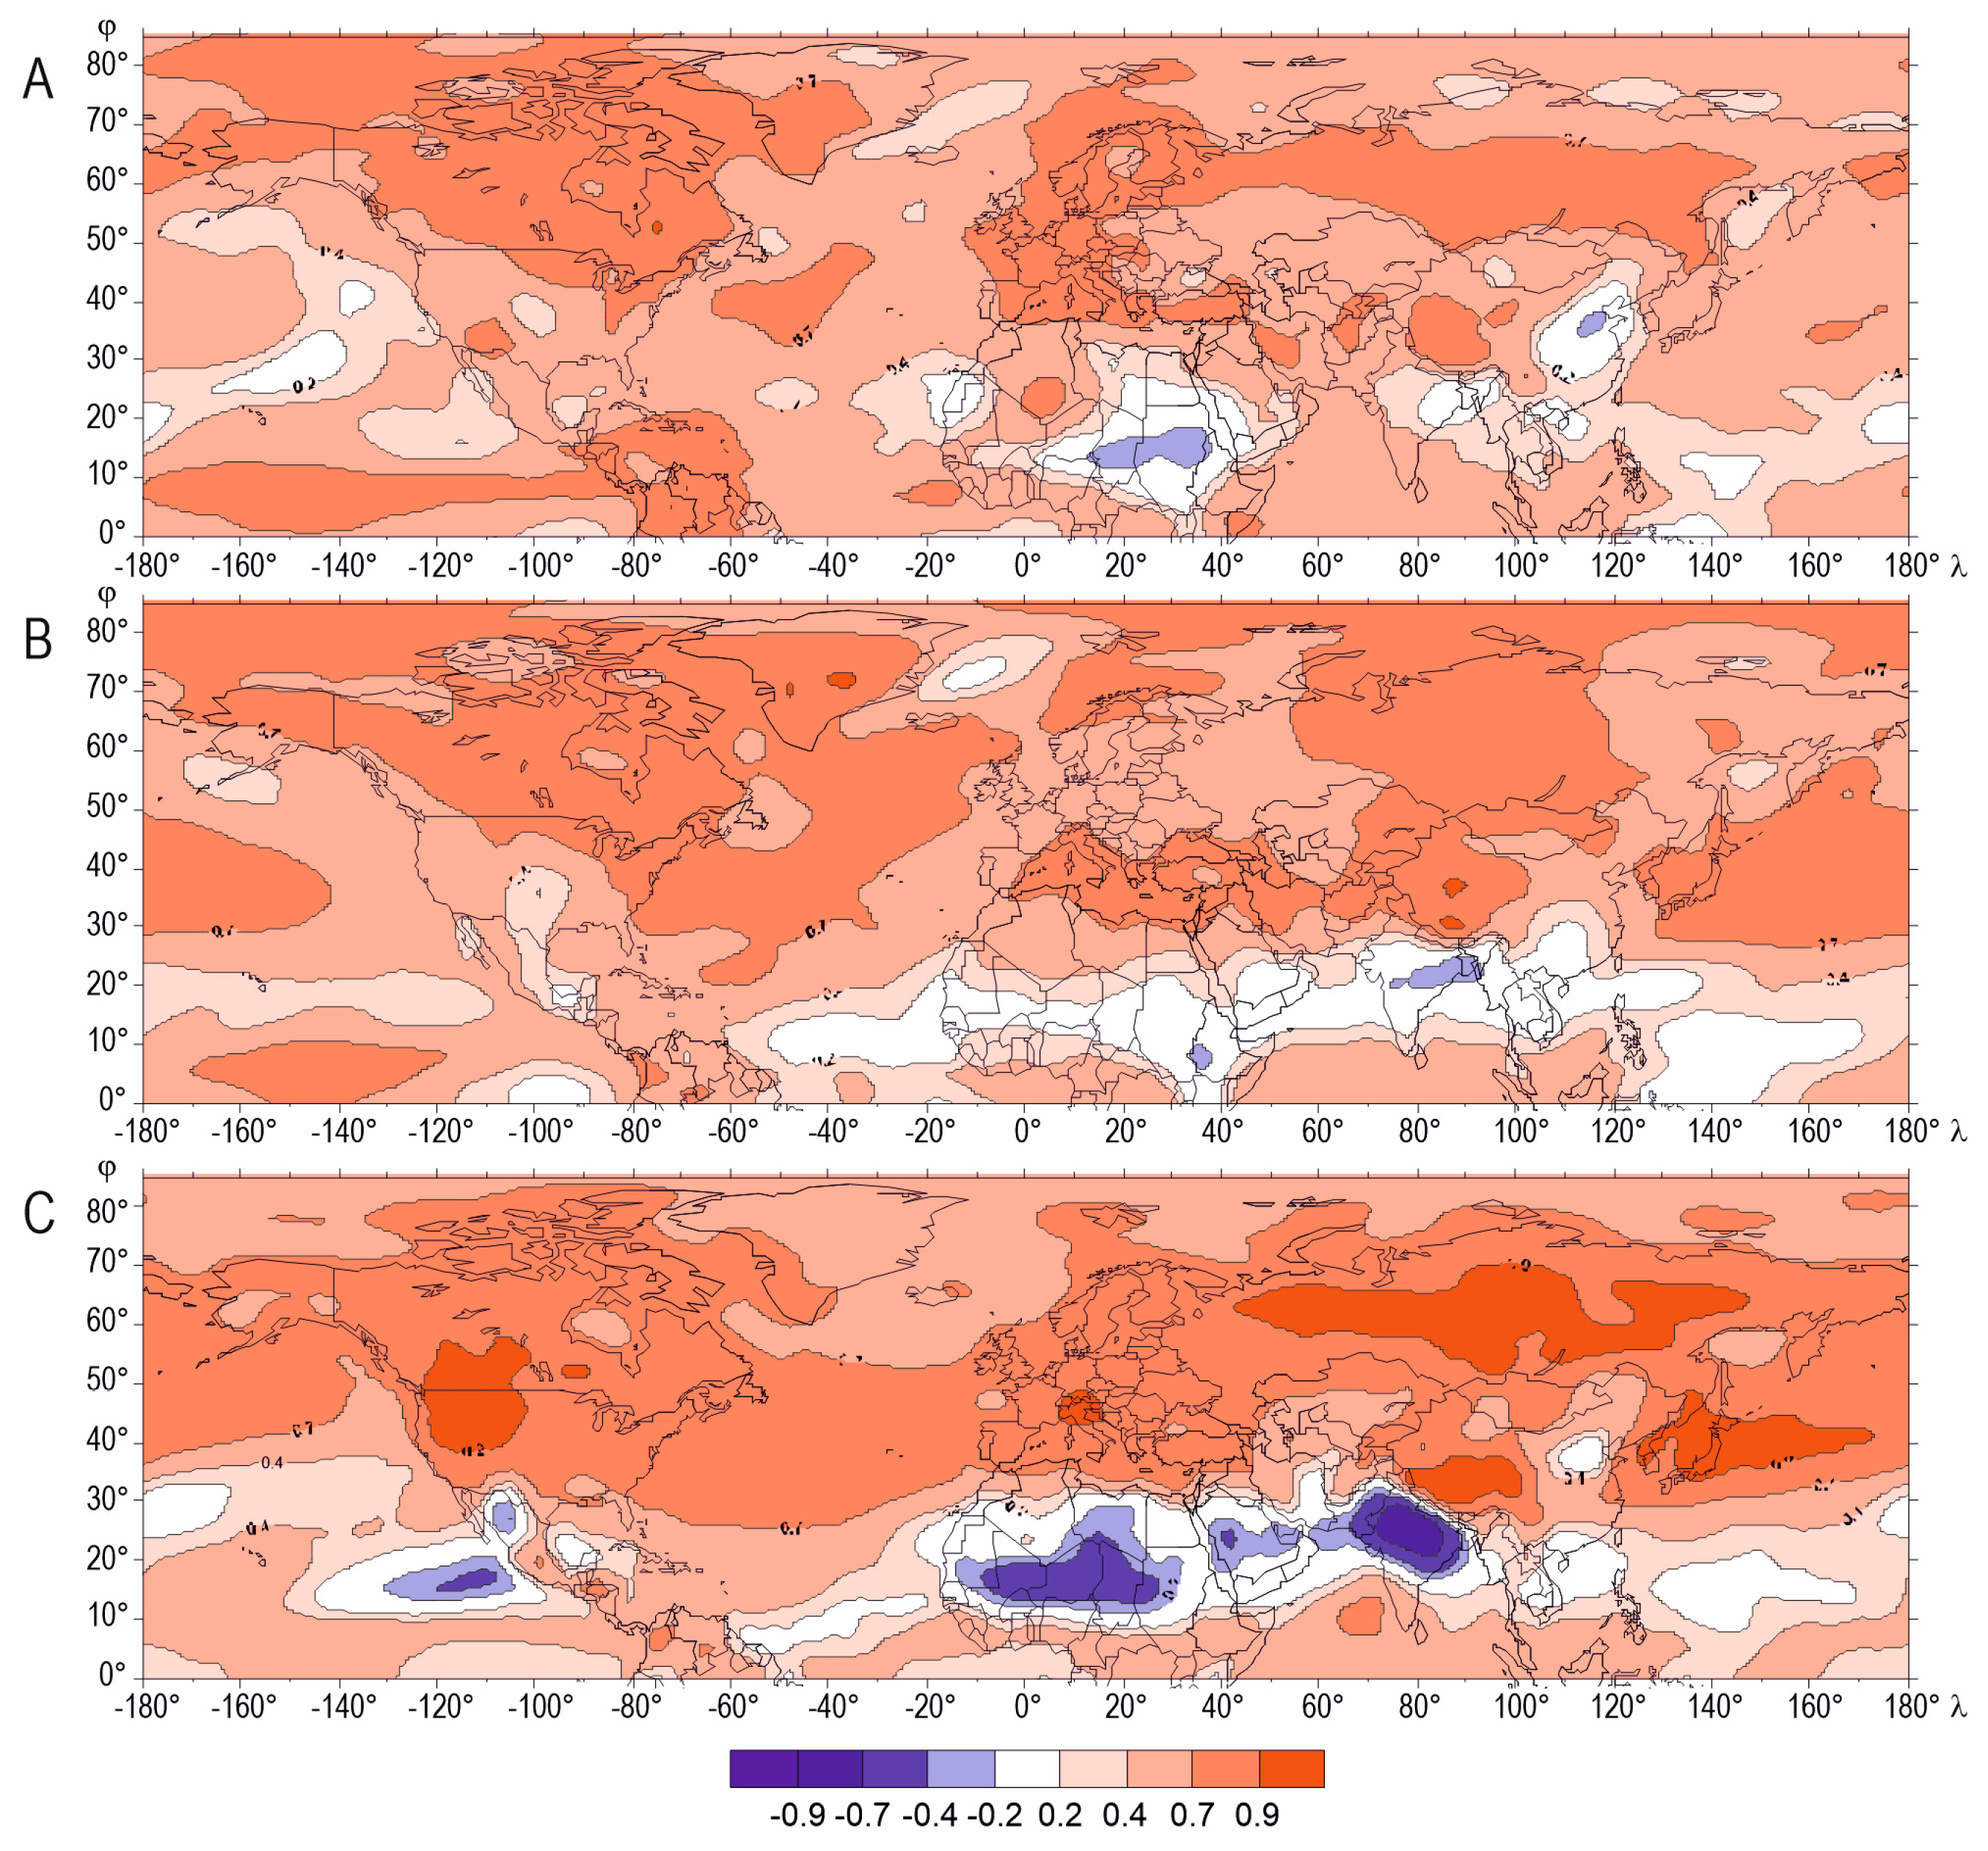
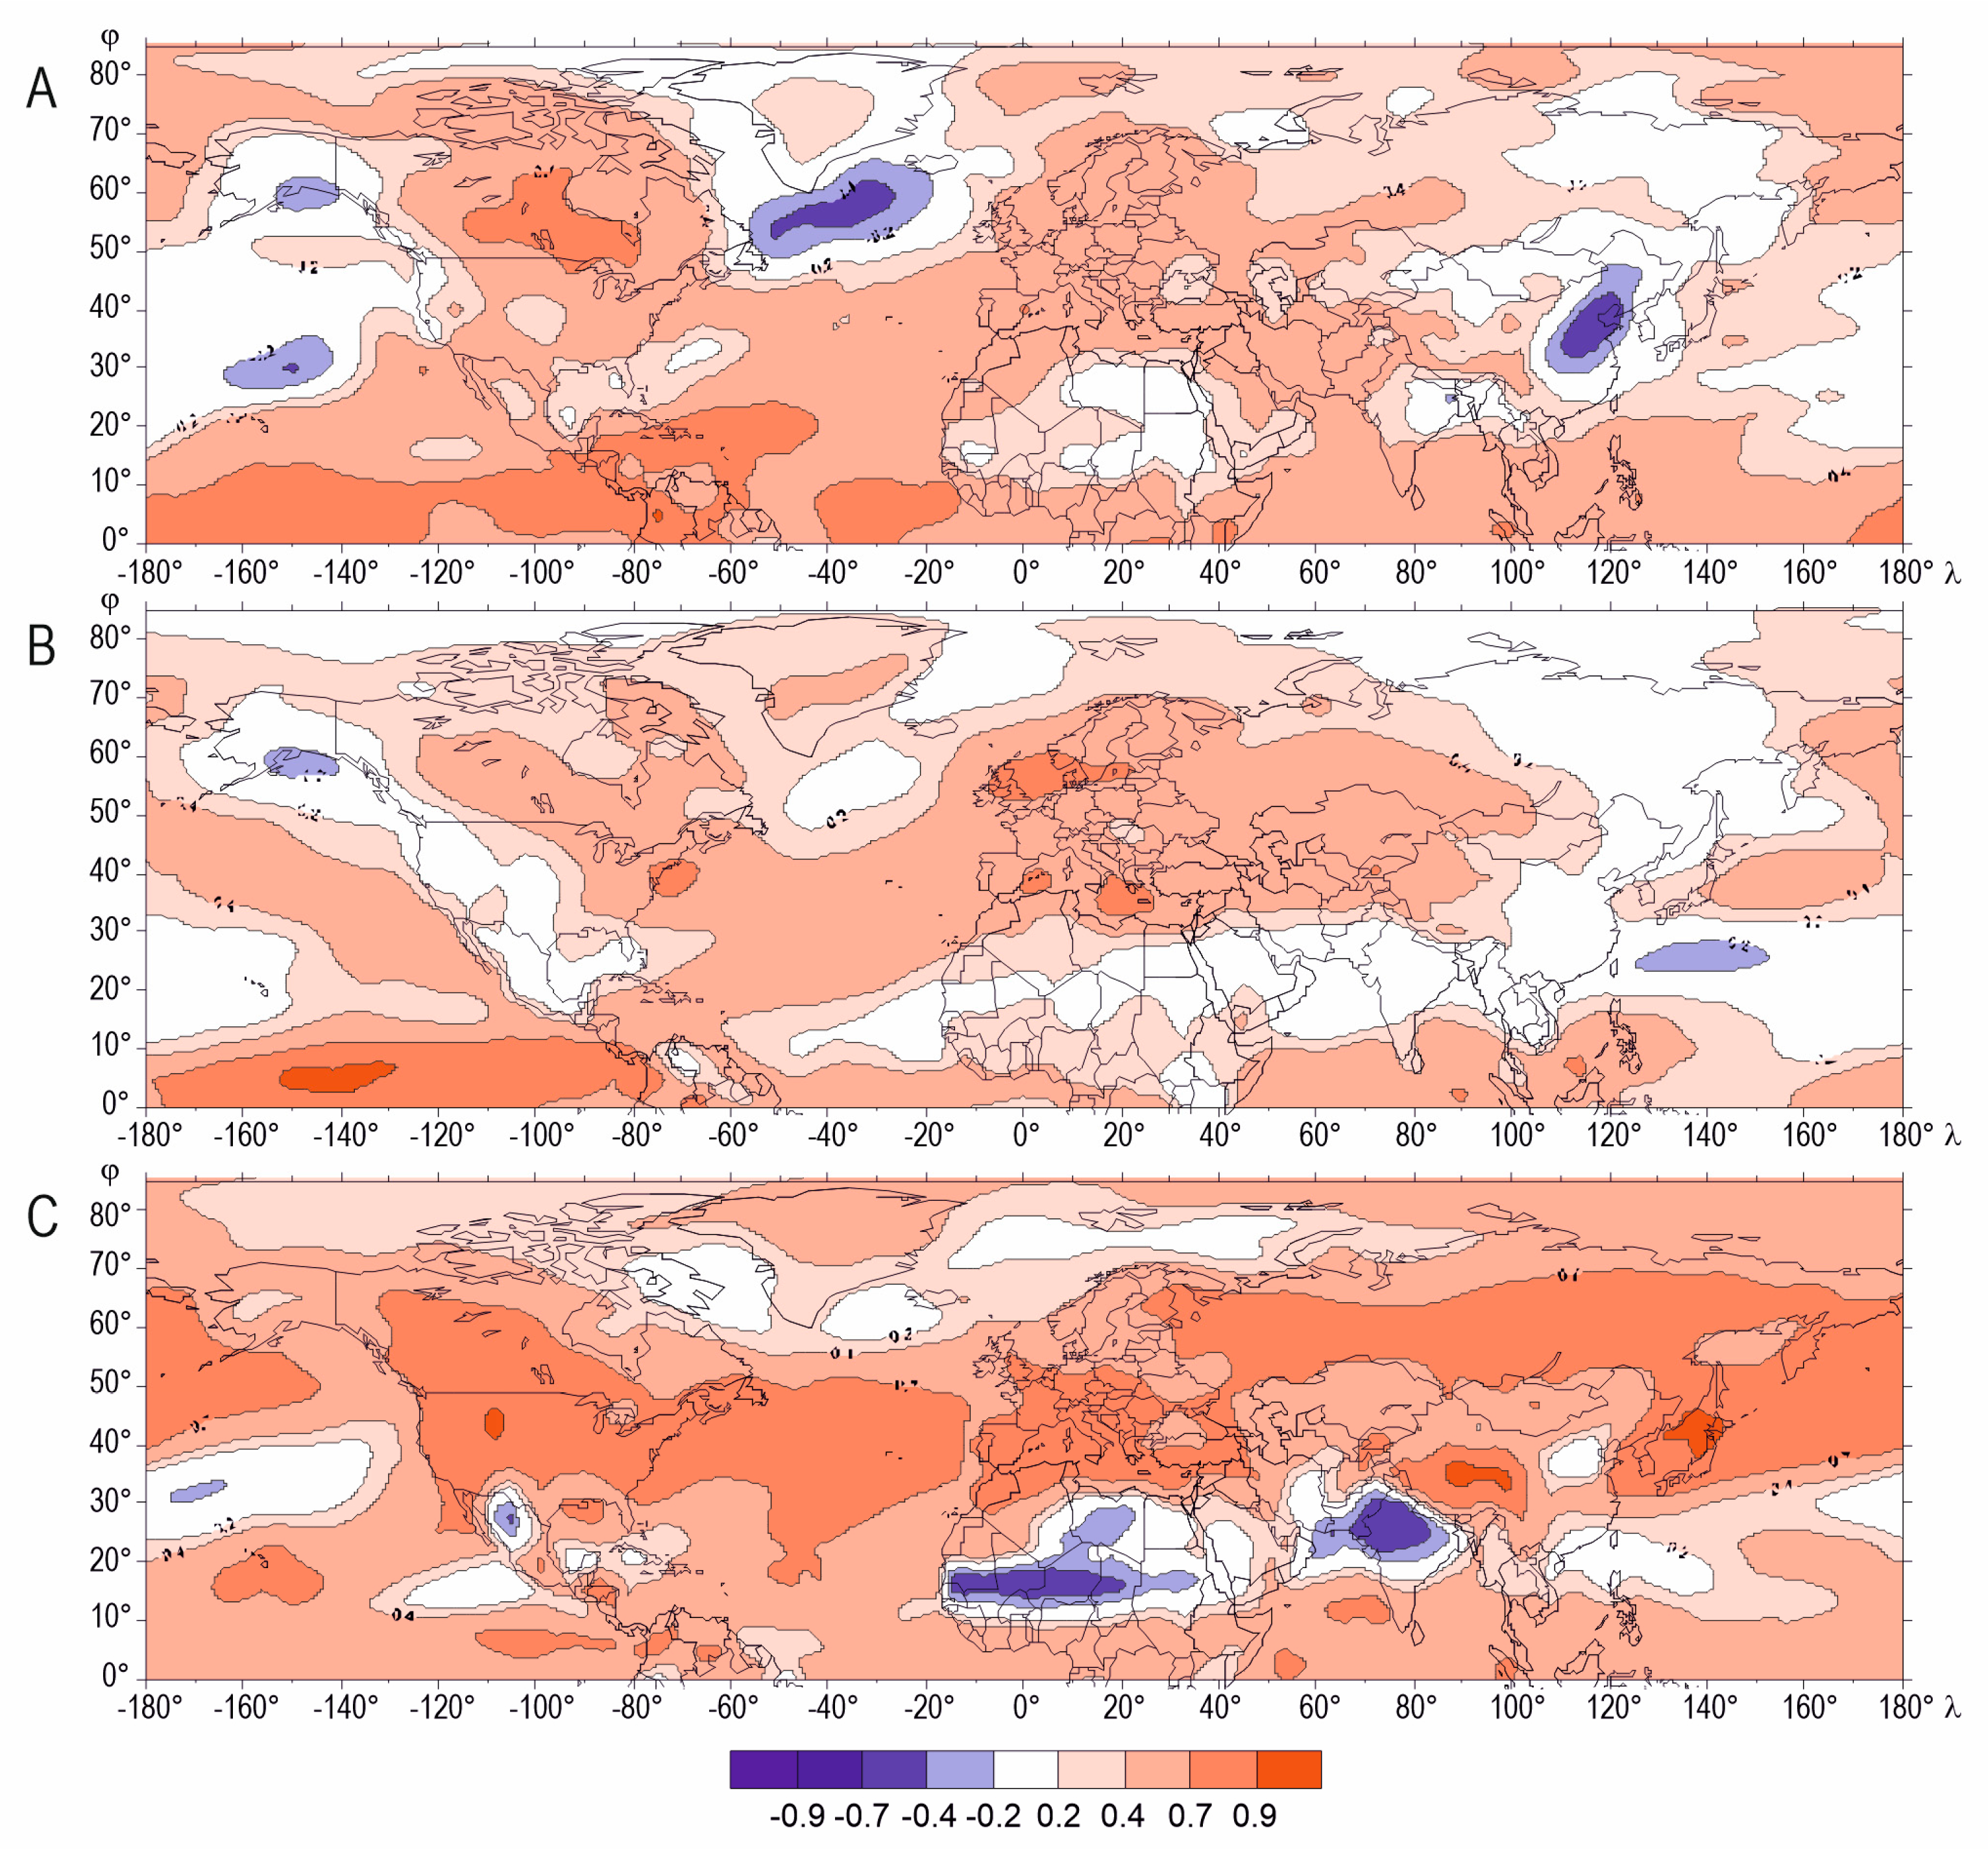
Although the distributions of the correlation coefficient for the SAT and temperature at the various isobaric surfaces of the troposphere nearly always divide the area under study into regions located on either side of 30° N, they reveal different features across the individual layers of the troposphere. This pattern is noted in the spatial variability of relationships in the annual context (Figure 1A, Figure 2A, Figure 3A, Figure 4A and Figure 5A), but is most visible in the seasonal approach.
For the 925 hPa and 850 hPa boundary layers, spatial variability in the correlation coefficient strongly suggests an influence of local factors (ocean versus land) in changes in SAT values (Figure 1B,C, Figure 2B,C, Figure 3B,C, Figure 4B,C and Figure 5B,C). Differences in relationships between the temperature in the upper layers of the troposphere and the surface air temperature provide a different picture of the correlation distribution. The greatest variability appears to be caused by processes and phenomena related to the Inter-Tropical Convergence Zone (ITCZ), which shifts cyclically during the year [22,23,24,25,26,27]. Therefore, it seems justified to illustrate relationships between the surface air temperature and the temperature in the mid-troposphere based on the seasons of the year.

3.1. Boundary Layer

The interrelationships between the SAT and boundary layer temperature show very clearly marked areas stretching west from the northwest coast of Africa, west from the west coast of North America, and over the northern Indian Ocean. In all these regions, the correlation coefficient has low values, indicating that there is no linear correlation between temperatures over ocean waters and air temperatures at higher levels, except in summer (Figure 1 and Figure 2). It seems that within the area, the air temperature above the water surface is strongly influenced by the surface temperature of the ocean, which mainly depends on the processes occurring in the respective bodies of water, which are, in turn, related to the processes and phenomena occurring in the atmosphere. The interrelationships are complex and, despite years of studies carried out so far, the mechanisms behind the processes observed in the oceans and over their surface, or interactions between them, are not clear and require further analysis. This is stressed by the authors of numerous studies in the region, e.g., [22,23,24,25] and many others.
The lowest values of the coefficient are observed throughout the year west of the northwest coast of Africa between approx. 5° N and 20° N. The seasonal variation in the regions, both in terms of magnitude and locations where the correlation coefficient values are the lowest, reflect the changes to surface ocean currents resulting from the annual shift of the ITCZ.
The above interrelationships are relatively easy to be observed on maps of the entire NH. However, there are certain regional differences over the entire area requiring more detailed comment, for the most part affecting either water areas or land areas, but not both at the same time. Therefore, the authors discuss the key aspects of the variations and their probable causes separately for ocean and land areas. Due to the limitations of this study, the authors do not discuss seasonal variations, which can be substantial on occasion.
Similar behavior is seen over both the Atlantic and Pacific Oceans where the ITCZ that travels according to an annual pattern remains confined to the NH and the positive Ekman pumping effect it causes is observed in the eastern tropical regions of both oceans [23,26,27]. The seasonal and spatial variability of those areas over which the correlation between the air temperature over the water surface and the boundary layer temperature is insubstantial shows a clear similarity over both the Atlantic and the Pacific. The variations shown in the figures (Figure 1 and Figure 2) present the correlation coefficients over both oceans correspond to the pattern of surface currents present at northern latitudes. Some similarities, notably south of 45° N, are shown by the oceans themselves [28]. The structure of the oceanic floor, both in the Pacific and in the Atlantic, is similar, and upwelling is accompanied by a qualitatively analogous action of the atmosphere. Furthermore, in a similar manner to the Canary Current off the shores of Africa, cold deep ocean waters flowing from the north are carried to the surface by upwelling in the changeable southbound California Current flowing along the west coast of North America. Despite the above analogies, a more detailed analysis indicates that the dynamics over the Pacific are less marked than over the Atlantic, which only proves Lazar et al. to be right [23].
The structure of seas and land over the NH causes the ITCZ over the Indian Ocean, which is enclosed by continents (unlike the ITCZ over the Pacific and the Atlantic), to move over the entire ocean area north of the equator. This annual cyclical shift of the convergence zone induces the south westerly winds (south westerly summer trade) to blow towards the land as observed over the Indian Ocean in summer, and winds blowing in the opposite direction, i.e., north easterly winter trades, to blow from the land towards the ocean in wintertime. In the transitional periods between the winter and summer monsoon (from April to May [28] or, as suggested by Potemra et al. [29], from March to April), and between the summer and winter monsoon (from October to November), there is a change in the conditions determining these fields over the Indian Ocean.
At higher latitudes, in the transitional seasons, the temperature over the Atlantic and Pacific oceans in the entire air layer under study is for the most part strongly and significantly correlated (R > 0.7). In summer, when despite the substantial influx of solar energy, air temperature near the thawing land does not change considerably, remaining close to 0 °C [30], the linear annual correlation between the upper boundary layer temperature and the temperature over the Arctic Ocean is the weakest, i.e., moderate (0.4 < R < 0.7). Also, in winter, the correlation coefficient values are lower than in spring or autumn, but demonstrate a stronger interdependence between the fields than in summer. As a rule, the correlation coefficient R takes values higher than 0.7. It seems that a stronger impact, although definitely not the only one, on the relationship between the SAT and boundary layer temperature in high latitudes is that of the radiation balance. The interrelationships here show a higher linearity in spring and autumn than during winter or summer, when, as is shown by the results of the modelling, the processes that occur between ice, water, and surface air are convergent [31]. In a multi-annual perspective, one must not forget, however, about the role of atmospheric circulation, which has a considerable impact on the vertical system of temperatures in the region [32,33].
As mentioned above, the correlation between the surface air temperature and the temperature of the 925 hPa and 850 hPa levels is very strong (R > 0.9) over land (except for areas between the equator and 10° N–15° N). In summer, it is mainly seen over tundra (northern regions of continents), while in winter, it extends much further inland. Lower values of the correlation coefficient (0.7 < R < 0.9) are also observed south of North America, in the Mississippi basin, whereas east of the Caspian Sea and over the western lowlands of Western Europe and the south-western Iberian Peninsula, the correlation is moderate (0.4 < R < 0.7).
At low geographical latitudes, in the tropical zone over continents, the interrelationships between the temperature over land and the temperature at 850 hPa are very strong (R > 0.9) and significant (0.7 < R < 0.9). The presence of areas (for the most part oriented latitudinally) over which the correlation coefficient values are lower may be explained by the variety of climate types, which differ in terms of the quantity and pattern of annual precipitation and cloudiness. Apparently, there is a relationship here with the stratification of the trade wind current, strong convection, and the resultant formation of cumuli up to approx. 1200–2000 m above sea level, where thermal inversion can be observed or where the temperature gradient is clearly weaker than in the lower layer [30]. The height of the 850 hPa level in the equatorial region and at slightly higher latitudes reaches approx. 1500 m, which may explain the presence of areas over which the linear correlation of the component under study is poorer. However, it seems that in the intertropical zone, the impact of cloudiness, temperature inversion, and precipitation on the absence of an interrelation between the surface temperature and the temperature in the atmosphere is clearer for the mid-troposphere.

3.2. Mid- and Upper Troposphere

The distribution of the correlation coefficient between the surface air temperature and the mid and upper troposphere temperature (700–300 hPa levels) reveals a more zonal nature than for the boundary layer temperature (Figure 3, Figure 4 and Figure 5).
For the mid troposphere (Figure 3 and Figure 4), the areas with the lowest correlation coefficient values occur at lower latitudes. Variations in the correlation, especially at low geographical latitudes, depend on the presence of clouds, precipitation, and temperature inversions, the changes of which over the area between the equator and 30° N (occurring on a timescale of months) mainly control the position and shift, following the movement of the sun, of the ITCZ. The trade wind zone also moves along with it. The vertical temperature gradients of the trade wind current, moving over the warm surface of the oceans, grow, which leads to strong convection and the formation of clouds. These, however, do not yield intensive precipitation. At an altitude of 1200–2000 m, a temperature inversion or the small gradient occurring there stop further cloud formation, as a result of which, clouds cannot reach the altitude, i.e., about 5000 m, where ice crystals can be formed [30].
Compared to the trade wind zone, the uplifting in the ITCZ is intensive, and by interrupting temperature inversion, it reaches high altitudes, which enable the formation of clouds producing heavy rainfall. The heat apportioned for temperature change linked to the occurrence of rain represents, at the time when rainfall occurs, a significant component of the heat balance on the surface, as confirmed by observations in the ITCZ [34,35]. Also, Fu and Wang [36] point to the importance of clouds and longwave radiation in determining the processes in the boundary layer (its thermodynamics), especially in the tropical zone, both over the oceans and land. Their conclusions are also helpful in explaining the difference in the distribution of the SAT and the temperature in the different layers of the troposphere observed in summer.
By comparing the distribution of the correlation coefficient with the dynamics of the processes occurring over the trade wind zone and in the ITCZ, the conclusion can be drawn that the magnitude of cloudiness, rainfall, or temperature inversion may be co-responsible for the relationships between the SAT and mid troposphere temperature between the equator and around 30° N. The seasonal variability and movement of rainfall and cloud areas can explain, at least to some extent, the observable temporal and spatial variability of the correlation coefficient between the SAT and mid-troposphere temperature, where rainfall clouds are formed (this mainly concerns tropical and lower latitudes), as pointed out, e.g., by Sikka and Gadgil [37], Sultan et al. [38], Sultan and Janicot [39], Gu and Adler [40], or Jury and Mpeta [41].
The distribution of the correlation coefficients between the surface air temperature and the upper troposphere temperature differs from that described above for temperatures at lower levels, especially over areas lying north of subtropical latitudes (Figure 5). At latitudes lower than 30° N, the distributions of the correlation coefficient between the SAT and temperatures at 300 hPa and 500 hPa converge, suggesting that there are no observable factors in the 500–300 hPa layer that significantly modify temperature values.

3.3. Spatial Differences in Relationships between Surface air Temperature (SAT) and Temperature in the Troposphere—A Cross-Sectional Analysis

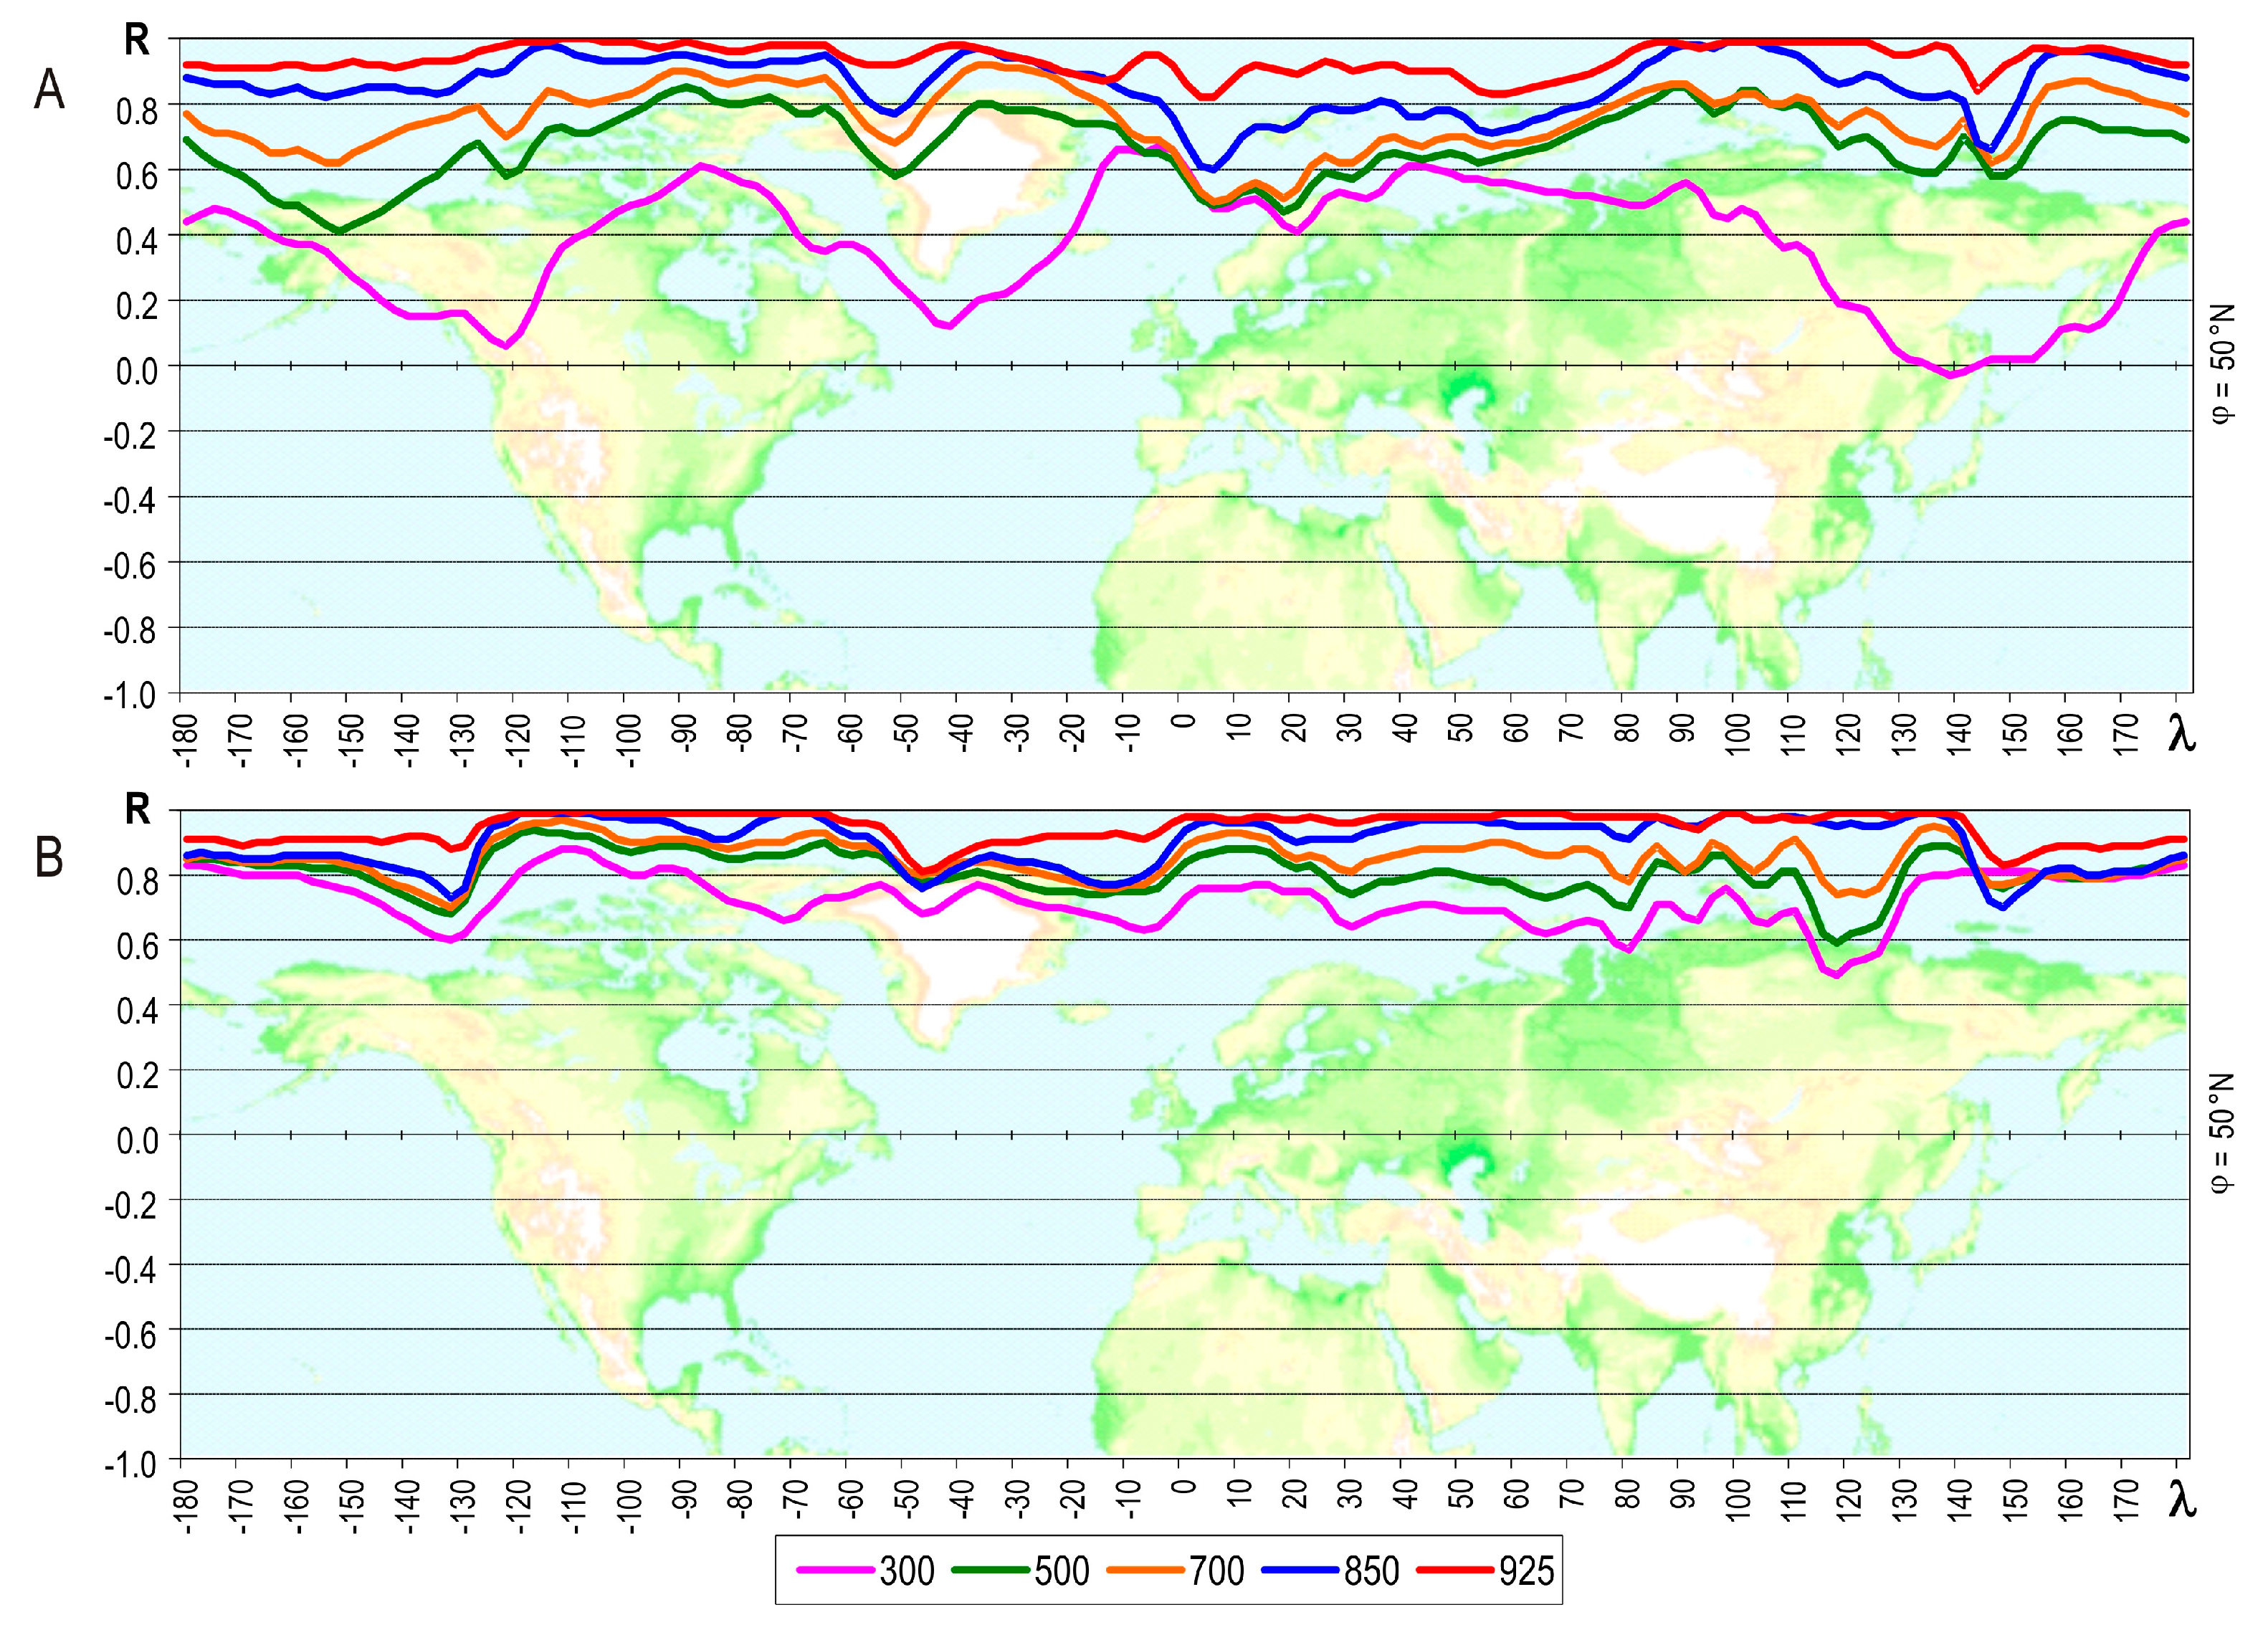
Figure 6 and Figure 7 show the correlation coefficient for the SAT versus the temperature at selected isobaric surfaces for selected seasons, calculated along the 50° N parallel line (temperate climate zone) (Figure 6) as well as along the 20° E meridian line (the Northern Hemisphere) (Figure 7). Both cross sections are highly representative of the vertical structure of air temperature in the NH.
The higher the troposphere layer, the weaker the relationship between the air temperature at the Earth’s surface and the air temperature in that layer. This relationship depends not only on the altitude of the given layer, but also the grid point and season of the year, which confirms earlier observations. The relationship between the surface air temperature and temperatures at higher altitudes is very strong over land and relatively strong over the ocean—weaker than over land but still statistically significant. The temperature at the surface of the Earth “reacts” to changes in surface material as well as changes in elevation above sea level, which can be readily observed at the edge of a continent or ocean and across the uplands of central Asia (Figure 6). It may be assumed that temperature changes follow a similar pattern throughout the troposphere; however, altitude does affect the relationship between the surface air temperature and the temperature at a given point in the troposphere. The higher the altitude, the weaker the relationship. The correlation is the weakest in the winter season (Figure 6B and Figure 7B).
Changes in the relationship between the temperature at the Earth’s surface and that in the troposphere are more substantial with respect to the studied geographic latitude (Figure 7) than with respect to the studied geographic longitude (Figure 6). Changes in this specific relationship are more seasonal in southern regions such as Africa and the Mediterranean. In the summer (Figure 7B), the correlation coefficient changes in a consistent manner across all studied isobaric surfaces and assumes similar values (greater than 0.8) in the lower and middle troposphere in subtropical regions and at higher latitudes. The relationship between the temperature at the Earth’s surface and that at an isobaric surface of 300 hPa is markedly weaker north of the Scandinavian peninsula.
The correlation coefficient decreases with increasing altitude within the lower and middle troposphere. At this time of the year, the dependence between the temperature at the Earth’s surface and that at other isobaric surfaces decreases towards the North Pole. Heat close to the Earth’s surface is used mainly for phase changes (hidden in the heat balance) and not to change the air temperature. The correlation coefficient for the lower and middle troposphere in the area north of the Scandinavian peninsula decreases with increasing altitude both in the summer and winter. However, the coefficient is lower in the winter than in the summer, except for areas north of the 75° N parallel line. The relationship between the temperature at the Earth’s surface and that in the troposphere over Europe is markedly weaker. Moreover, the relationship between the temperature at the surface and that in the upper troposphere is also different. Dependence between the temperature at the Earth’s surface and that at 300 hPa weakens towards the North Pole and is not observed at the North Pole itself.
Changes in the correlation coefficient, both in the summer and winter, calculated for regions located south of the 40° N parallel line suggest very dynamic changes in weather phenomena in subtropical and tropical regions—particularly in the trade wind zone (Figure 7). The relationship between the air temperature over the southern Mediterranean Sea, especially in the summer, and the air temperature at the 925 hPa and 850 hPa isobaric surfaces is weaker than that over adjacent landmasses. At this time of year, large parts of Africa (between 10 and 30° N) are characterized by negative values of the correlation coefficient between the SAT and the temperature at the 500 hPa and 300 hPa isobaric surfaces (Figure 7B).

4. Discussion

The key results of this study show that the relationship between the SAT and the temperature at higher layers of the troposphere during the various seasons demonstrates an increasing zonality with increasing altitude, which is affected by the thermal conditions linked to the form and type of land.
It seems that the air temperature over ocean waters is determined by the temperature of the surface layer of these waters. Meanwhile, the waters in the basins are in permanent motion, constantly mixing and changing their position as a result of the Earth’s rotation, interacting with the atmosphere, while the movement of the latter is modified by the shape of the ocean floor and the horizontal shape of the Earth. As is suggested by some authors [28,42,43], the stronger the trade wind, the colder the water.
It was found that the distribution of the correlation coefficient between the SAT and the temperature in the lower troposphere at low latitudes reflects, above all, the variability of the temperature observed in the surface layer of the oceans and its influence on the temperature of the air layer just above it. It must be pointed out here that the results obtained on the basis of averaged temperature values over this area are to be treated with some reserve (especially considering the highly dynamic nature of the phenomena and processes observed). For example, Kubota and Terao [44] demonstrate that the mean temperature in the 20° S–20° N boundary layer (up to 850 hPa) is an ideal covariate with the SAT, which is not confirmed by the maps constructed on the basis of the same source data presented here. Also, as seems obvious, the period for which the mean values are determined should be chosen carefully, depending on the scale of the process or phenomenon concerned (and the goal of the research). This is evident, for instance, if to compare the distribution of the correlation coefficients established on the basis of the mean values for the seasons and for the year.
In turn, the correlations between the SAT and the temperature in higher layers mirrors the dynamics linked to the annual movement of the ITCZ and related processes. At low latitudes, there are no significant differences between the distribution of the correlation between the SAT and temperatures at 500 hPa and 300 hPa, which may suggest that there are no factors in the layer (upper troposphere) which have a significant impact on the temperature field in question. On the other hand, the form of the correlation between the air temperature over the water surface and the troposphere temperature over the western Pacific Ocean near the equator may be, to a certain degree, a response to ENSO.
At subtropical and higher latitudes, the correlation (especially over land) is less varied and stronger in spring and autumn than that observable in summer and winter. In particular, in summer (and to a lesser extent, in winter), the linear correlation (in the lower and mid-troposphere) in the north over the Arctic Ocean is weaker than in lower latitudes, which may be due to the consumption of nearly all the heat reaching the surface for phase transitions, while the increase (decrease) in tropospheric air temperature depends on the perceptible heat controlled by wind speed, rather than water temperature in the basin [45]. This is also confirmed by the results of works by Palarz et al. [46] and Wypych and Bochenek [47] on the conditions of the occurrence of temperature and humidity inversions over Europe and the Atlantic.
On the other hand, Bartzokas et al. [48] point out that in examining the interrelationship between the SAT and the temperature in the troposphere in summer, one must take into account more factors than in analyzing analogous relationships in winter. This may explain the varied values of the correlation coefficient observed on the maps over the oceans, not only at polar latitudes.
Finally, it should be stated that the relationship between the SAT and the air temperature in the troposphere is more complex. The large differentiation of the correlation coefficient presented in the study, both in the year and in individual seasons, is the result of the impact of the abovementioned geographical factors. This was clearly shown by the attached and discussed figures. However, the issue is more complex. It is difficult to identify all the physical reasons for the relationship between the SAT and the temperature at other pressure levels. According to the available literature, it should be pointed out that global tropopause fluctuations influence this relationship. As was stated on the basis of daily data over 25 years, the long-range correlations in the tropopause height variability can decrease with increasing latitude; this is also associated with ozone column fluctuations [49,50]. Simultaneously, when analyzing the SAT, long memory effect should also be taken into consideration due to the persistence of the land–sea surface system [51,52]. Another issue which should also be pointed out is the so-called scaling effect [53,54].

5. Conclusions

This study describes the correlation between the surface air temperature and the temperature in the layers between the surface and the 300 hPa pressure level. The aim was to find the areas of the NH and the pressure levels where the temperature shows the strongest relationships with the SAT, and to attempt to establish the dependence between the temperature in the different layers of the troposphere. The analysis addressed the correlation between the SAT and the temperature at the individual isobaric surfaces within the air thickness concerned.
The results of the study led to the following conclusions:
  • The distribution of the correlation coefficient between the SAT and the temperature in the successive layers of the troposphere in the individual seasons demonstrates an increasing zonality with increasing altitude, which is affected by the thermal conditions linked to land form and character. Over most of the area, regardless of the season, the correlation between the SAT and the temperature in higher air layers declines with altitude;
  • The results demonstrate the seasonal variability of the interrelationships between the SAT and the temperature in the troposphere. Variability with increasing altitude is discernible throughout the year, although the distribution of the correlation coefficient varies from season to season. With altitude, the correlation, as well as the interdependence, fades faster in summer and winter than in the transitional seasons of the year;
  • It was found that the linear correlation coefficient between the SAT and the air temperature throughout the layer of the troposphere concerned has the lowest values over areas lying at latitudes below 30° N in all seasons. The temperature in the boundary layer at low latitudes, mainly in the layer just over the ocean, is determined by different factors than in the temperate zone. Apparently, close to the water surface, the air temperature is significantly correlated with the temperature in the water surface itself, which, in turn, depends on the processes that occur within it;
  • Weak relationships were mainly found off the west coast of North America, as well as at the western and eastern margins of Africa where upwelling is present. Its presence, and especially its variability, as well as that of the ocean currents, are reflected in particular seasons. Also, the distribution of the correlation between the SAT over the Indian Ocean and the temperature in the boundary layer reflects the complexity of the processes taking place in the ocean and of the strongly variable surface current regime, which is undeniably associated with monsoons. Although the processes and phenomena have not been thoroughly explored, it can be concluded that they have an impact on water temperature, and thus also on the air temperature over its surface;
  • By contrast, the variations in the distribution of the correlation coefficient between the SAT and the temperature at higher levels (not just over the oceans, as was the case with the boundary layer, but also over land) reflects the cyclical annual movement of the ITCZ. The processes and phenomena that occur in it have an impact on the thermal conditions within this zone;
  • Although contemporary meteorology and climatology strive to use modern research methods, relatively simple approaches, such as linear correlation in this case, are still worth using. They can indicate dependencies that enable us to detect and explain dependencies existing on a macroscale.
All above mentioned conclusions are based on the long-term reanalysis data. Some dependencies in particular regions are very strong and usually can be seen in all seasons. However, it does not mean that such an air temperature structure can be detected everyday as a result of weather variability resulting from the dynamics of atmospheric processes and the interactions with the Earth surface (both the land and sea surface). The recognition of these relationships is possible using daily or even sub daily data. Nowadays, thanks to the new NCEP/NCAR as well as ERA5 reanalyses, such detailed analyses are feasible.

Author Contributions

Conceptualization, Z.U. and J.W.; methodology, Z.U.; validation, J.W. and Z.U.; formal analysis, J.W.; investigation, Z.U. and A.W.; writing—original draft preparation, Z.U.; writing—review and editing, A.W.; visualization, A.W. All authors have read and agreed to the published version of the manuscript.

Funding

This research received no external funding.

Institutional Review Board Statement

Not applicable.

Informed Consent Statement

Not applicable.

Data Availability Statement

The data were provided by NCEP-NCAR reanalysis, available at: https://psl.noaa.gov/data/gridded/data.ncep.reanalysis.html (accessed on 1 September 2023).

Acknowledgments

The concept of the research has been inspired thanks to the Senior Fulbright Scholarship of the first author. The comments of Andrew Comrie from University of Arizona were very helpful and constructive. The analyses were possible thanks to the NCEP/NCAR Reanalysis data.

Conflicts of Interest

The authors declare no conflict of interest.

References

  1. Holton, J.R.; Hakim, G.J. An Introduction to Dynamic Meteorology, 5th ed.; Elsevier Science Publishing Co. Inc.: Amsterdam, The Netherlands, 2013; pp. 1–552. [Google Scholar]
  2. Pedlosky, J. Geophysical Fluid Dynamics, 2nd ed.; Springer: Berlin/Heidelberg, Germany, 1987; pp. 1–710. [Google Scholar]
  3. Peixoto, J.P.; Oort, A.H. Physics of Climate; American Institute of Physics: New York, NY, USA, 1992; pp. 1–520. [Google Scholar]
  4. Perry, A.; Walker, J.M. The Ocean-Atmosphere System; Longman: Harlow, UK, 1977; pp. 1–160. [Google Scholar]
  5. Ustrnul, Z. Variability of the Atmospheric Circulation on the Northern Hemisphere in the 20th Century; Materiały Badawcze IMGW, IMGW: Warszawa, Poland, 1997; pp. 1–208, (In Polish, English Summary). [Google Scholar]
  6. Hegerl, G.C.; Wallace, J.J. Influence of patterns of climate variability on the difference between satellite and surface temperature trends. J. Clim. 2002, 15, 2412–2428. [Google Scholar] [CrossRef]
  7. Santer, B.D.; Wigley, T.M.L.; Mears, C.; Wentz, F.J.; Klein, S.A.; Seidel, D.J.; Taylor, K.E.; Thorne, P.W.; Wehner, M.F.; Gleckler, P.J.; et al. Amplification of surface temperature trends and variability in the tropical atmosphere. Science 2005, 309, 1551–1556. [Google Scholar] [CrossRef]
  8. Klotzbach, P.J.; Pielke, R.A., Sr.; Pielke, R.A., Jr.; Christy, J.R.; McNider, R.T. An alternative explanation for differential temperature trends at the surface and in the lower troposphere. J. Geophys. Res. 2009, 114, D21102. [Google Scholar] [CrossRef]
  9. Christy, J.R.; Herman, B.; Pielke, R., Sr.; Klotzbach, P.; McNider, R.T.; Hnilo, J.J.; Spencer, R.W.; Chase, T.; Douglass, D. What do observational datasets say about modeled tropospheric temperature trends since 1979? Remote Sens. 2010, 2, 2148–2169. [Google Scholar] [CrossRef]
  10. Thorne, P.W.; Lanzante, J.R.; Peterson, T.C.; Seidel, D.J.; Shine, K.P. Tropospheric temperature trends: History of an ongoing controversy. WIRes Clim. Chang. 2011, 2, 66–88. [Google Scholar] [CrossRef]
  11. Santer, B.D.; Mears, C.; Doutriaux, C.; Caldwell, P.; Gleckler, P.J.; Wigley, T.M.L.; Solomon, S.; Gillett, N.P.; Ivanova, D.; Karl, T.R.; et al. Separating signal and noise in atmospheric temperature changes: The importance of timesscale. J. Geophys. Res.-Atmos. 2011, 116, D22105. [Google Scholar] [CrossRef]
  12. Christiansen, B. Changes in temperature records and extremes: Are they statistically significant? J. Clim. 2013, 26, 7863–7875. [Google Scholar] [CrossRef]
  13. Wehner, M.F. A temporary hiatus in warming of extreme temperatures is not unusual, nor inconsistent with model simulations of human-induced climate change. Environ. Res. Lett. 2014, 9, 071001. [Google Scholar] [CrossRef]
  14. Atkinson, D.E.; Solomon, S.M. Comparison of NCEP/NCAR Reanalyses Data with Station Data for the Circum-Polar Coastal Regime. AMS Conference on Polar Meteorology and Oceanography and Joint Symposium on High-Latitude Climate Variations. 2003. Available online: https://ams.confex.com/ams/pdfpapers/61084.pdf (accessed on 30 June 2023).
  15. Stine, A.R.; Huybers, P. Changes of the seasonal cycle of temperature and atmospheric circulation. J. Clim. 2012, 25, 7362–7380. [Google Scholar] [CrossRef]
  16. Palarz, A.; Celiński-Mysław, D.; Ustrnul, Z. Temporal and spatial variability of surface-based inversions over Europe based on ERA-Interim reanalysis. Int. J. Climatol. 2018, 38, 158–168. [Google Scholar] [CrossRef]
  17. Palarz, A.; Celiński-Mysław, D.; Ustrnul, Z. Temporal and spatial variability of elevated inversions over Europe based on ERA-Interim reanalysis. Int. J. Climatol. 2020, 40, 1335–1347. [Google Scholar] [CrossRef]
  18. Palarz, A.; Luterbacher, J.; Ustrnul, Z.; Xoplaki, E.; Celiński-Mysław, D. Representation of low-tropospheric temperature inversions in ECMWF reanalyses over Europe. Environ. Res. Lett. 2020, 15, 074043. [Google Scholar] [CrossRef]
  19. Woyciechowska, J.; Bąkowski, R. Comparison of values of the chosen meteorological fields measured at aerological station and the values taken from NCEP/NCAR Reanalysis. Időjárás 2006, 110, 183–189. [Google Scholar]
  20. Kalnay, E.; Kanamitsu, M.; Kistler, R.; Collins, W.; Deaven, D.; Gandin, L.; Iredell, M.; Saha, S.; White, G.; Woollen, J.; et al. The NCEP/NCAR 40-Year Reanalysis Project. Bull. Am. Meteor. Soc. 1996, 77, 437–471. [Google Scholar] [CrossRef]
  21. Kistler, R.; Kalnay, E.; Collins, W.; Saha, S.; White, G.; Woollen, J.; Chelliah, M.; Ebisuzaki, W.; Kanamitsu, M.; Kousky, V.; et al. The NCEP/NCAR 50-Year Reanalysis: Monthly Means CD-ROM and Documentation. Bull. Am. Meteor. Soc. 2001, 82, 247–267. [Google Scholar] [CrossRef]
  22. Carton, J.A.; Cao, X.; Giese, B.S.; Silva, A.M. Decadal and interannual SST variability in the tropical Atlantic Ocean. J. Phys. Oceanogr. 1996, 26, 1165–1175. [Google Scholar] [CrossRef]
  23. Lazar, A.; Inui, T.; Malanotte-Rizzoli, P.; Busalacchi, A.J.; Wang, L.; Murtugudde, R. Seasonality of the ventilation of the tropical Atlantic thermocline in an ocean general circulaton model. J. Geophys. Res. 2002, 107, 18-1–18-17. [Google Scholar] [CrossRef]
  24. Polo, I.; de Fonseca, B.R.; Sheinbaum, J. Northwest Africa upwelling and the Atlantic climate variability. Geophys. Res. Lett. 2005, 32, L23702. [Google Scholar] [CrossRef]
  25. Santos, A.M.P.; Kazmin, A.S.; Peliz, A. Decadal changes in the Canary upwelling system as revealed by satellite observations: Their impact on productivity. J. Mar. Res. 2005, 63, 359–379. [Google Scholar] [CrossRef]
  26. Rothstein, L.M.; Zhang, R.-H.; Busalacchi, A.J.; Chen, D. A numerical simulation of the mean water pathways in the subtropical and tropical Pacific Ocean. J. Phys. Oceanogr. 1998, 28, 322–343. [Google Scholar] [CrossRef]
  27. Inui, T.; Lazar, A.; Malanotte-Rizzoli, P.; Busalacchi, A. Wind stress effects on subsurface pathways from the subtropical to tropical Atlantic. J. Phys. Oceanogr. 2002, 32, 2257–2276. [Google Scholar] [CrossRef]
  28. Tomczak, M.; Godfrey, J.S. Regional Oceanography: An Introduction; Daya Publishing House: Delhi, India, 2003; pp. 1–390. [Google Scholar]
  29. Potemra, J.T.; Luther, M.E.; O’Brien, J.J. The seasonal circulation of the upper ocean in the Bay of Bengal. J. Geophys. Res. 1991, 96, 12667–12683. [Google Scholar] [CrossRef]
  30. Khromov, S.P.; Petrosyants, M.A. Meteorology and Climatology; Kolos Publishing House of Moscow State University: Moscow, Russia, 2004; pp. 1–582. (In Russian) [Google Scholar]
  31. Hansen-Bauer, I.; Førland, E. Verification and analysis of a climate simulation of temperature and pressure fields over Norway and Svalbard. Clim. Res. 2001, 16, 225–235. [Google Scholar] [CrossRef]
  32. Rigor, I.G.; Colony, R.L.; Martin, S. Variation in surface air temperature observations in the Arctic, 1979–1997. J. Clim. 2000, 13, 896–914. [Google Scholar] [CrossRef]
  33. Bitz, C.M. The relation among sea ice, surface temperature, and atmospheric circulation in simulations of future climate. In Proceedings of the International Symposium, Arctic Feedbacks to Global Change, Arctic Centre, Rovaniemi, Finland, 25–27 October 2001; pp. 20–24. [Google Scholar]
  34. Anderson, S.P.; Hinton, A.; Weller, R.A. Moored observations of precipitation temperature. J. Atmos. Ocean. Technol. 1998, 15, 979–986. [Google Scholar] [CrossRef]
  35. Flament, P.; Sawyer, M. Observations of the effect of rain temperature on the surface heat flux in the intertropical Convergence Zone. J. Phys. Oceanogr. 1995, 25, 413–419. [Google Scholar] [CrossRef]
  36. Fu, X.; Wang, B. The role of longwave radiation and boundary layer thermodynamics in forcing tropical surface winds. J. Clim. 1999, 12, 1049–1069. [Google Scholar] [CrossRef]
  37. Sikka, D.R.; Gadgil, S. On the maximum cloud zone and ITCZ over Indian longitudes during the southwest monsoon. Mon. Wea. Rev. 1980, 108, 1840–1853. [Google Scholar] [CrossRef]
  38. Sultan, B.; Janicot, S.; Diedhiou, A. The West African monsoon dynamics. Part I: Documentation of interseasonal variability. J. Clim. 2003, 16, 3389–3406. [Google Scholar] [CrossRef]
  39. Sultan, B.; Janicot, S. The West African monsoon dynamics. Part II: The “preonset” and “onset” of the summer monsoon. J. Clim. 2003, 16, 3407–3427. [Google Scholar] [CrossRef]
  40. Gu, G.; Adler, R.F. Seasonal evolution and variability associated with the west African monsoon system. J. Clim. 2004, 17, 3364–3377. [Google Scholar] [CrossRef]
  41. Jury, M.R.; Mpeta, E.J. The annual cycle of African climate and its variability. Water SA 2005, 31, 1–8. [Google Scholar] [CrossRef]
  42. Lentz, S.J. The surface boundary layer in coastal upwelling regions. J. Phys. Oceanogr. 1992, 22, 1517–1539. [Google Scholar] [CrossRef]
  43. Huang, B.; Carton, J.A.; Shukla, J. A numerical simulation of the variability in the tropical Atlantic Ocean, 1980–1988. J. Phys. Oceanogr. 1995, 25, 835–854. [Google Scholar] [CrossRef]
  44. Kubota, T.; Terao, T. The seasonal-scale persistence of tropical tropospheric temperature associated with the El Nino/Southern Oscillation. J. Meteorol. Soc. Jpn. 2003, 81, 581–598. [Google Scholar] [CrossRef]
  45. Cayan, D.R. Latent and sensible heat flux anomalies over the Northern Oceans: Driving the sea surface temperature. J. Phys. Oceanogr. 1992, 22, 859–881. [Google Scholar] [CrossRef]
  46. Palarz, A.; Celiński-Mysław, D. Low-tropospheric humidity inversions over Europe: Spatiotemporal variability and relations to temperature inversions’ occurrence. Theor. Appl. Climatol. 2020, 141, 967–978. [Google Scholar] [CrossRef]
  47. Wypych, A.; Bochenek, B. Vertical Structure of Moisture Content over Europe. Adv. Meteorol. 2018, 2018, 3940503. [Google Scholar] [CrossRef]
  48. Bartzokas, A.; Metaxas, D.A.; Giles, B.D. On the relation between sea surface and lower troposphere temperature over the Northern Hemisphere. Glob. Nest Int. J. 2002, 4, 127–137. [Google Scholar] [CrossRef]
  49. Seidel, D.J.; Randel, W.J. Variability and trends in the global tropopause estimated from radiosonde data. J. Geophys. Res. 2006, 111, D21101. [Google Scholar] [CrossRef]
  50. Varotsos, C.; Efstathiou, M.; Tzanis, C. Scaling behaviour of the global tropopause. Atmos. Chem. Phys. 2009, 9, 677–683. [Google Scholar] [CrossRef]
  51. Koscielny-Bunde, E.; Bunde, A.; Havlin, S.; Goldreich, Y. Analysis of daily temperature fluctuations. Phys. A Stat. Mech. Its Appl. 1996, 231, 393–396. [Google Scholar] [CrossRef]
  52. Efstathiou, M.N.; Tzanis, C.; Cracknell, A.P.; Varotsos, C.A. New features of land and sea surface temperature anomalies. Int. J. Remote Sens. 2011, 32, 3231–3238. [Google Scholar] [CrossRef]
  53. Ramirez, J.A.; Alvarez, J.; Dagdug, L.; Rodriguez, E.; Echeverria, J.C. Long-term memory dynamics of continental and oceanic monthly temperatures in the recent 125 years. Phys. A Stat. Mech. Its Appl. 2008, 387, 3629–3640. [Google Scholar] [CrossRef]
  54. Varotsos, C.A.; Efstathiou, M.N.; Cracknell, A.P. On the scaling effect in global surface air temperature anomalies. Atmos. Chem. Phys. 2013, 13, 5243–5253. [Google Scholar] [CrossRef]
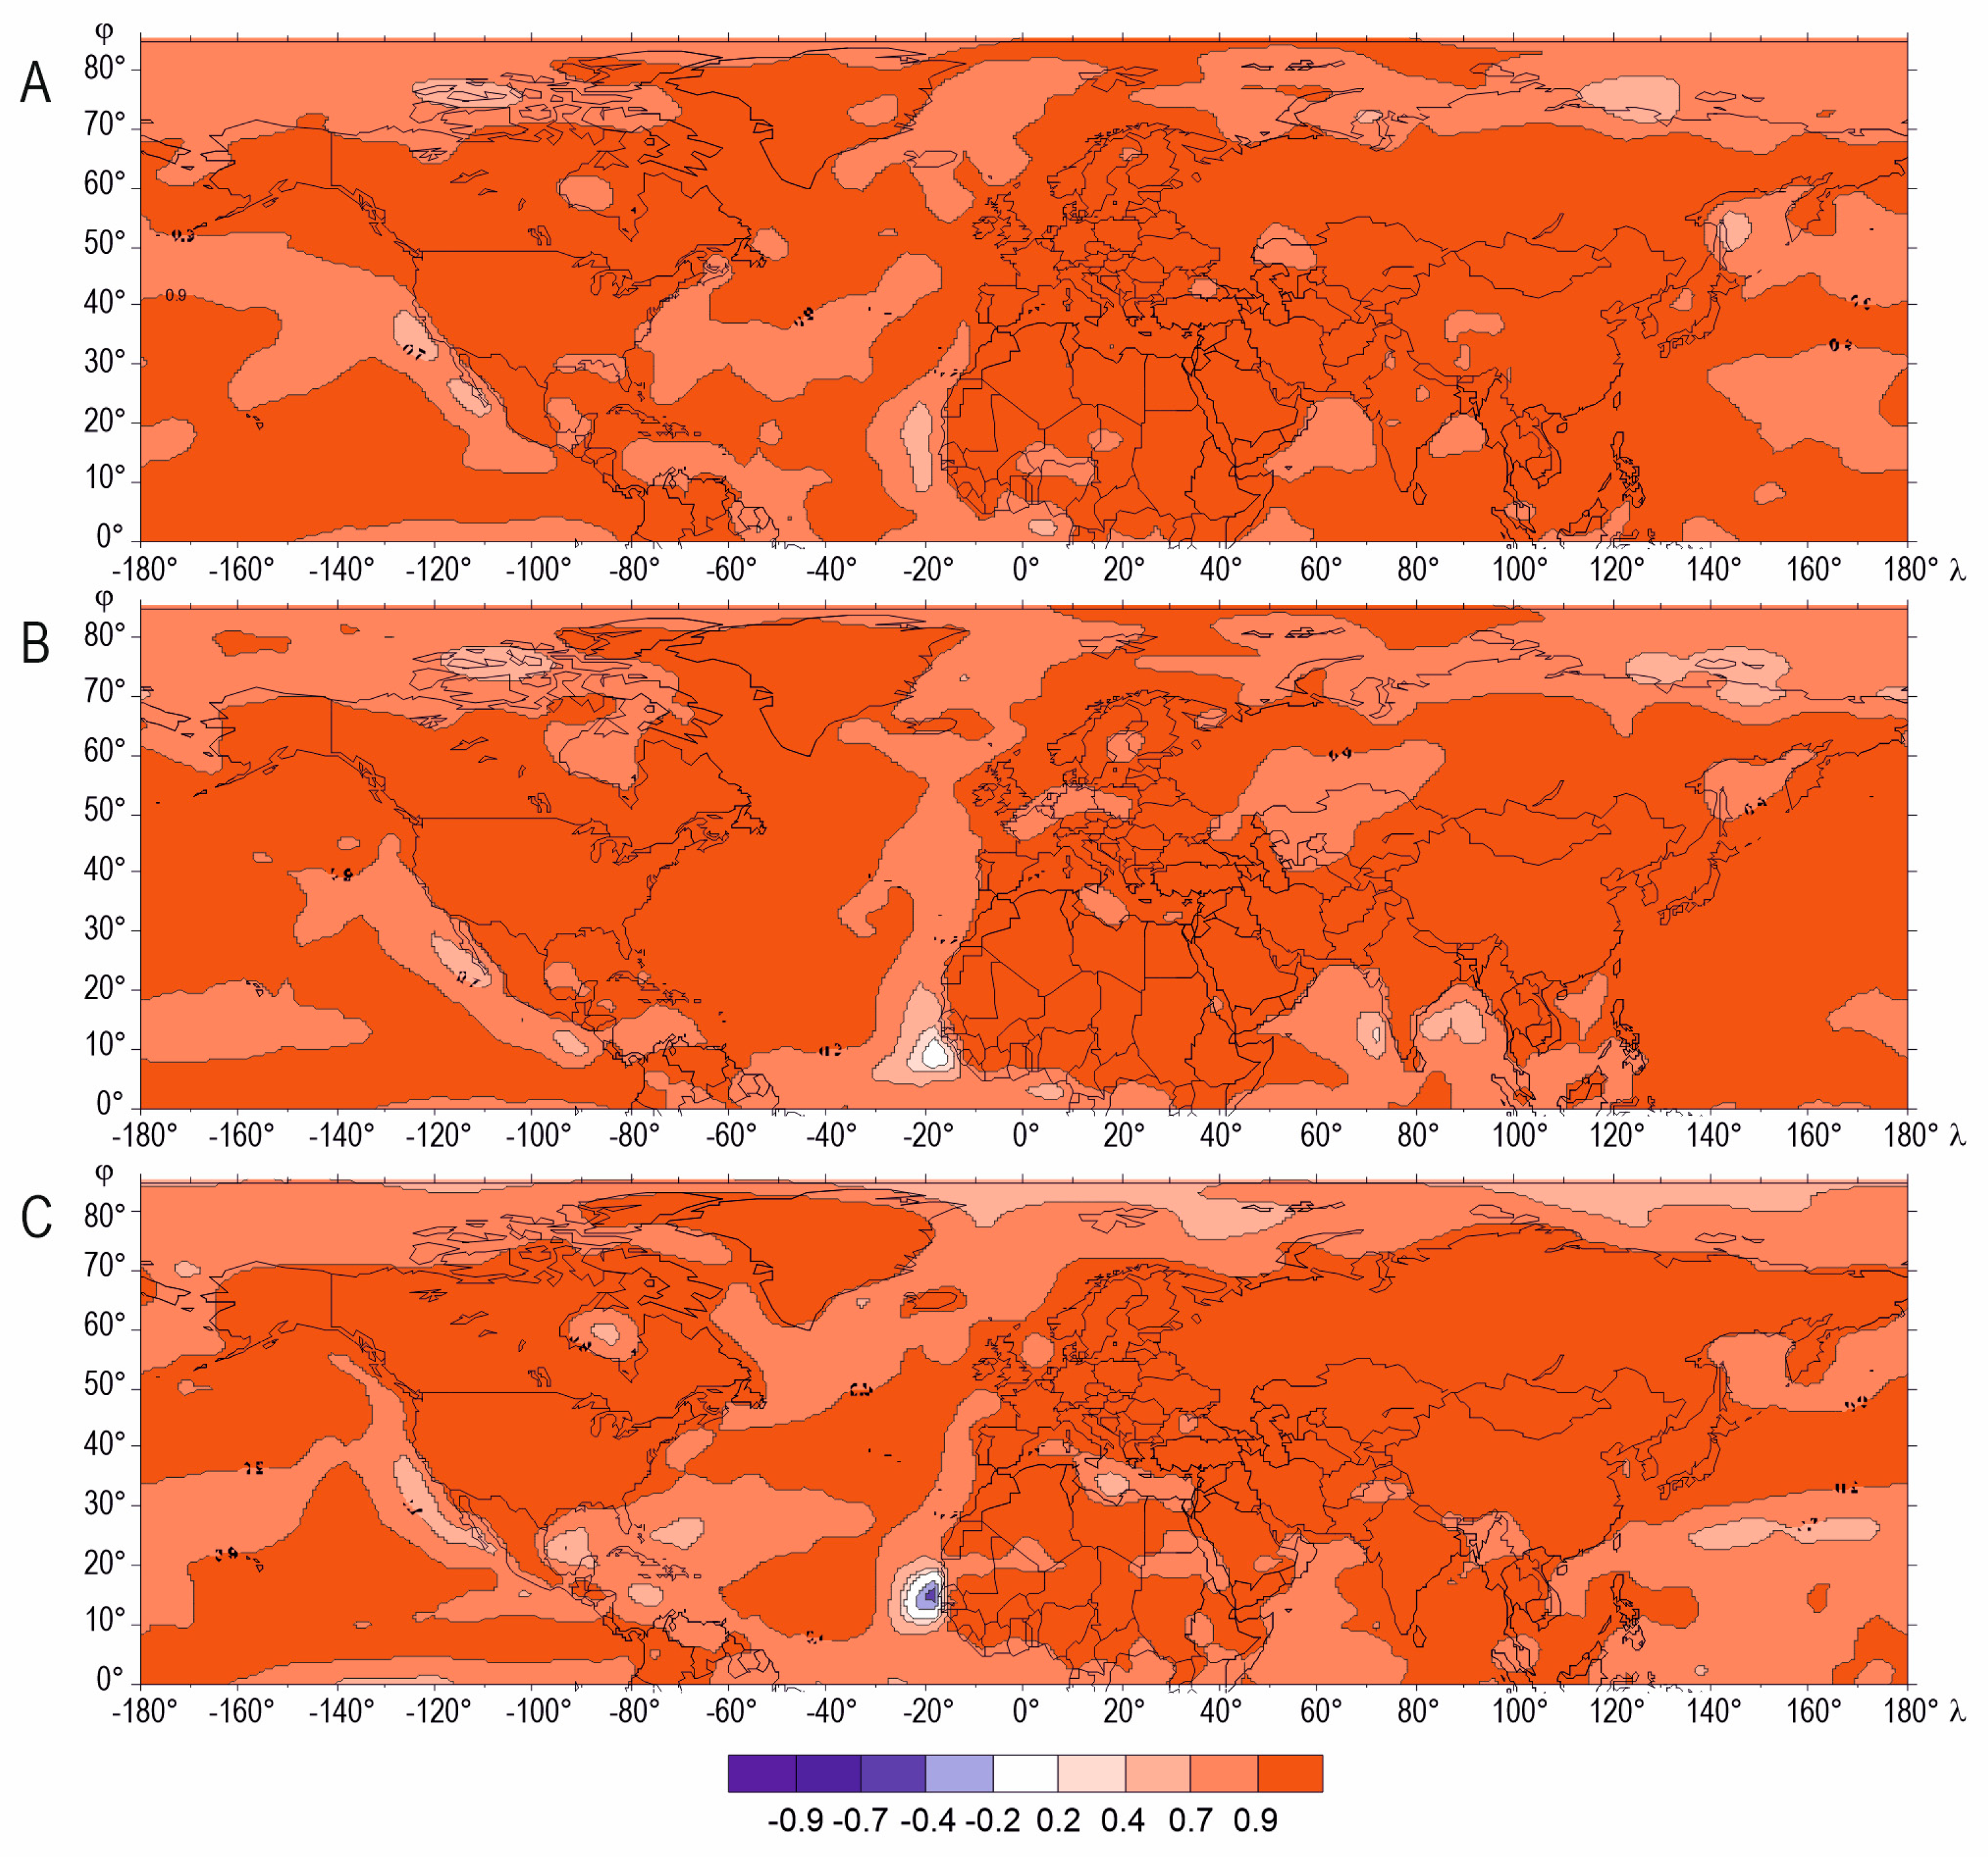
Figure 1. Correlation coefficient between surface air temperature (SAT) and temperature at the 925 hPa isobaric level in the Northern Hemisphere, ((A)—year, (B)—winter, (C)—summer).
Atmosphere 14 01423 g001
Figure 2. Correlation coefficient between surface air temperature (SAT) and temperature at the 850 hPa isobaric level in the Northern Hemisphere, ((A)—year, (B)—winter, (C)—summer).
Atmosphere 14 01423 g002
Figure 3. Correlation coefficient between surface air temperature (SAT) and temperature at the 700 hPa isobaric level in the Northern Hemisphere, ((A)—year, (B)—winter, (C)—summer).
Atmosphere 14 01423 g003
Figure 4. Correlation coefficient between surface air temperature (SAT) and temperature at the 500 hPa isobaric level in the Northern Hemisphere, ((A)—year, (B)—winter, (C)—summer).
Atmosphere 14 01423 g004
Figure 5. Correlation coefficient between surface air temperature (SAT) and temperature at the 300 hPa isobaric level in the Northern Hemisphere, ((A)—year, (B)—winter, (C)—summer).
Atmosphere 14 01423 g005
Figure 6. Correlation coefficient (R) between surface air temperature (SAT) and temperature at selected isobaric surfaces (in hPa) along the 50° N parallel line, ((A)—winter, (B)—summer).
Atmosphere 14 01423 g006
Figure 7. Correlation coefficient (R) between surface air temperature (SAT) and temperature at selected isobaric surfaces (in hPa) in the Northern Hemisphere along the 20° E parallel line ((A)—winter, (B)—summer).
Atmosphere 14 01423 g007
Disclaimer/Publisher’s Note: The statements, opinions and data contained in all publications are solely those of the individual author(s) and contributor(s) and not of MDPI and/or the editor(s). MDPI and/or the editor(s) disclaim responsibility for any injury to people or property resulting from any ideas, methods, instructions or products referred to in the content.