Article

South American Monsoon Lifecycle Projected by Statistical Downscaling with CMIP6-GCMs

by
Michelle Simões Reboita
1,*,
Glauber Willian de Souza Ferreira
1,
João Gabriel Martins Ribeiro
1,
Rosmeri Porfírio da Rocha
2 and
Vadlamudi Brahmananda Rao
3
1
Institute of Natural Resources, Federal University of Itajubá (UNIFEI), Itajubá 37500-903, Brazil
2
Institute of Astronomy, Geophysics and Atmospheric Sciences, University of São Paulo (USP), São Paulo 05508-090, Brazil
3
Department of Meteorology and Oceanography, Andhra University, Visakhapatnam 530003, Andhra Pradesh, India
*
Author to whom correspondence should be addressed.
Atmosphere 2023, 14(9), 1380; https://doi.org/10.3390/atmos14091380
Submission received: 7 August 2023 / Revised: 29 August 2023 / Accepted: 29 August 2023 / Published: 31 August 2023
(This article belongs to the Section Meteorology)

Abstract

:
This study analyzed the main features (onset, demise, and length) of the South American Monsoon System (SAMS) projected in different time slices (2020–2039, 2040–2059, 2060–2079, and 2080–2099) and climate scenarios (SSP2–4.5 and SSP5–8.5). Eight global climate models (GCMs) from the Coupled Model Intercomparison Project Phase 6 (CMIP6) that perform well in representing South America’s historical climate (1995–2014) were initially selected. Thus, the bias correction–statistical downscaling (BCSD) technique, using quantile delta mapping (QDM), was applied in each model to obtain higher-resolution projections than their original grid. The horizontal resolution adopted was 0.5° of latitude × longitude, the same as the Climate Prediction Center precipitation analysis used as a reference dataset in BCSD. The QDM technique improved the monsoon onset west of 60° W and the simulated demise and length in southwestern Amazonia. Raw and BCSD ensembles project an onset delay of approximately three pentads compared to the historical period over almost all regions and a demise delay of two pentads northward 20° S. Additionally, the BCSD ensemble projects a reduced length with statistical significance in most South Atlantic Convergence Zone regions and a delay of three pentads in the demise over the Brazilian Amazon from the second half of the 21st century.

1. Introduction

The classical definition of a monsoon considers a region to have a monsoon climate when rainfall increases in association with a seasonal reversal in low-level wind direction [1]. Following this concept, South America (SA) does not have a monsoon climate. However, modern definitions of a monsoon consider a region to have this climate type based on the occurrence of a dry and a wet well-defined period in a year [2]. In this sense, SA is a region with a monsoon climate [3,4]. For instance, more than 50% of the total precipitation occurs in austral summer (DJF) in central and eastern Brazil, northern Argentina, and the central north of the Andes Mountains [5,6]. The onset of the South American rainy season is configured with the rapid shift of the area of intense convection between the northwestern extreme of the continent and latitudes south of the equator [7,8].
There are different approaches to studying the South American Monsoon System (SAMS), and one of them is in terms of the SAMS lifecycle [7,9,10,11,12]: onset, demise, length, and intensity (volume of precipitation). These studies, generally, use pentads of precipitation (mean or sum of five days) and have differences in methodology because some of them identify the SAMS lifecycle in each grid point of a dataset [12], while others consider Midwest Brazil (50°–60° W and 10°–20° S) as a hotspot region to study the monsoon [9]. In Midwest Brazil, the average SAMS lifecycle begins in 58–59 pentads, decaying by 18–21 pentads, and having a length of 33–34 pentads. Kousky [13] presents a table for the pentads with the corresponding calendar dates. To complement information about the literature, the Supplementary Materials present comparative Tables S1–S4 of the SAMS lifecycle features obtained by different studies for various regions where the system operates.
The SAMS lifecycle can vary from one year to another. For instance, the rainy phase of the SAMS can have a short or long duration. Fu and Li [14] observed that the wetter land surface in southern Amazonia in the dry season could cause an abnormally lower convective inhibition energy (CINE), which promotes an earlier and more rapid increase in rainfall during the early phase of the transition. On the other hand, if the increase in surface evapotranspiration is significantly weakened during the dry season, for example, by a rise in runoff due to land use or a decrease in rainfall in previous seasons, the onset of the wet season would probably be delayed [14]. Similar results were obtained in the midwest and southeast of Brazil by Dias et al. [15]. These findings indicate an early or late SAMS onset, but they do not explain the causes of the precipitation and land-surface interaction variability, i.e., what are the drivers for a dryer or wetter dry season? Another group of researchers [16,17,18,19,20,21,22] has addressed this problem and studied the impact of the modes of atmospheric variability at different scales (interdecadal, decadal, interannual, and intraseasonal) on atmospheric circulation and their effects on SA. While the physical chain is simple—the changes in the atmospheric circulation caused by the atmospheric modes of variability affect the distribution of synoptic and mesoscale precipitation systems, which, in turn, affect the SAMS lifecycle (Mechoso et al. [23])—the predictability and the coupling effect of different teleconnection modes continue to present a challenge for researchers. For SA, most studies on teleconnection patterns and their impacts on monsoons focus on the rainfall intensity and spatial distribution rather than the implications for atmospheric systems that cause precipitation. Additionally, few studies analyze the effects of teleconnection patterns on the onset and demise of monsoons. Most studies address the SAMS lifecycle variability regarding land use and describe that in southern Amazonia, the wet seasons have become shorter due to deforestation [24,25,26,27].
In SA, land-use changes are mainly responsible for the historical cumulative CO2 emissions [28]. The impact of global climate change and, on a regional scale, the effect of land use have been considered in the climate projections and indicated changes in the atmospheric circulation and, consequently, in precipitation in SA [29,30,31]. With the Couple Model Intercomparison Project Phase 3 (CMIP3) projections, Bombardi and Carvalho [10] evaluated the monsoon lifecycle in the twentieth century (1981–2000) and in the A1B scenario (2081–2100). The authors observed that most models represent the spatiotemporal variability of the annual precipitation cycle in central and eastern Brazil during the summer monsoon in the reference period. For the A1B scenario, the models do not indicate statistically significant changes in SAMS onset and demise dates. The most coherent feature projected was a reduction in precipitation over central-eastern Brazil. Jones and Carvalho [32] analyzed six global climate models (GCMs) of CMIP5 under the RCP8.5 scenario, and the models projected significant increases in seasonal amplitudes, early onsets (14 days or ~3 pentads), late demises (17 days or ~4 pentads), and durations of the SAMS. In terms of regional climate models (RCMs), Reboita et al. [11] projected the SAMS lifecycle using the RegCM3 nested in two GCMs (HadCM3 and ECHAM5) under the A1B scenario. Focusing on Midwest Brazil, for the period 2010–2040, a delay of one pentad was obtained at the beginning of the rainy season, while for the period 2070–2100, the authors obtained a reduction of ~2 pentads in the duration of the rainy season. Ashfaq et al. [12] evaluated the projections of global monsoons in an ensemble with RegCM4 nested in models from CMIP5 under the RCP2.6 and RCP8.5 scenarios. For SA, the RegCM4 ensemble simulated Amazonia’s monsoon onset later in the reference period. However, the authors highlighted that the RegCM4 ensemble was within the uncertainties shown in Bombardi and Carvalho [10]. The projected changes are more intense in the RCP8.5 scenario. Even beyond SA, the authors found a delay in monsoon demise but less than the monsoon onset, which reflects a shrinking of the monsoon rainy seasons. In SA, under the RCP8.5 scenario, the onset is projected to be delayed in ~4 pentads and the demise in ~3 pentads. The authors also explore the drivers of the changes in the monsoon lifecycle. They mention that every monsoon region receives a noticeable amount of pre-monsoon precipitation, which helps to warm up the upper troposphere and induce deep overturning through latent heat release in the atmosphere. In the future, the dry conditions will negatively affect the pre-monsoon precipitation, causing a delayed onset.
CMIP provides the projections with GCMs for developing studies for the International Panel on Climate Change (IPCC) assessment report. However, in regional and local studies of climate impacts, the GCMs’ resolution is coarse, and downscaling techniques need to be applied to obtain high-resolution climate information [33,34,35]. There are two types of downscaling: dynamical and statistical [36,37]. In dynamical downscaling, RCMs are nested into GCM outputs, and RCMs simulate the physical processes of the climate system. This methodology requires substantial computing power and time. For this reason, this task is generally performed by international projects, such as the Coordinated Regional Climate Downscaling Experiment (CORDEX, https://cordex.org/, accessed on 26 January 2022) under the World Climate Research Project (WCRP)’s supervision, which makes the projections available on the same platform as CMIP projections (Earth System Grid Federation, ESGF).
Statistical downscaling does not directly simulate the physical processes of the climate systems. It relies on establishing statistical relationships between large-scale climate variables (obtained from GCMs) and local-scale variables (obtained from in situ measurements). These relationships are derived from historical observations (perfect prognosis—PP—approach) or simulations (model output statistics—MOS—approach) and then applied to project future climate conditions [36]. Traditionally, in climate research, the PP approach has been used, and it includes different methods [36], such as regression models (linear models, generalized linear models—GLM quantile regression), also called the transfer function model [37], weather type methods, and analog and resampling methods.
Statistical downscaling is less computationally demanding compared to dynamical downscaling. For this reason, many studies have used it. For SA, most of the studies focus on southeastern South America (SESA) [38,39,40,41]. Bettolli et al. [38] analyzed the capability of a set of projections using CORDEX dynamical downscaling and statistical downscaling based on regression models (analog and GLM) in simulating daily precipitation during the 2009–2010 austral warm season over SESA. The results revealed that no single model performs best in all aspects evaluated and that most models capture the extreme events selected, although with a considerable spread in accumulated values and the location of heavy precipitation. Balmaceda-Huarte and Bettolli [39] applied statistical downscaling to simulate daily and maximum temperatures in Argentina, considering three approaches: analog, GLM, and artificial neural networks. According to the authors, depending on the aspect analyzed, one specific model was more/less skillful. In addition, the authors highlighted that it is a challenge to capture the local variability of daily extreme temperatures in regions with complex topography (Argentinian Patagonia and the subtropical Andes). A similar study but for precipitation over SESA was carried out by Olmo and Bettolli [40], while Olmo et al. [41] applied the CMIP5 and CMIP6-GCM projections.
Although statistical downscaling is less costly than dynamical downscaling, robust computational resources are still needed, justifying its application in small domains. One of the statistical downscaling approaches that is less computationally expensive is the model based on transfer functions. This approach was applied by Ballarin et al. [42] using quantile delta mapping. The authors developed a Brazilian dataset for different hydrological variables for both historical (1980–2013) and future (2015–2100) scenarios, under the Shared Socioeconomic Pathways (SSPs) 2–4.5 and 5–8.5, at a 0.25° ×  0.25° spatial resolution. To our knowledge, this is the only study of CMIP6-GCMs statistical downscaling covering a large area in SA.
In January 2022, the execution of the project “Hydro, wind, and solar energy in Brazil: Changes projected by CMIP6 climate models” (R&D Project 00403-0054/2022) began in order to provide a regional view of the climate change in different renewable energy sources in SA. Therefore, this study aims to assess the projected changes in the monsoon lifecycle in SA, which significantly affects hydroelectric power generation on the continent. Considering this project’s scope, CMIP6-GCMs have been statistically downscaled in the whole of SA, yielding a new dataset with a 0.5° horizontal resolution. Thus, the main objective of this work is to describe the projected changes to the SAMS lifecycle (onset, demise, and length) using an ensemble composed of eight CMIP6-GCMs under the SSP2–4.5 and SSP5–8.5 scenarios and considering four time slices until 2099. Hereby, this study addresses uncertainties about SAMS lifecycle projections and the absence of works with CMIP6 projections for SA.

2. Materials and Methods

2.1. Study Area and Reference Dataset

The study area comprises the SA continent (Figure 1), located at latitudes 12° N–55° S. Due to its large latitudinal extension, different climate regimes occur over the continent but with a predominance of monsoon [3,4,43] with the local convection and the South Atlantic Convergence Zone (SACZ) as the main drivers of precipitation. The subdomains shown in Figure 1 indicate the main areas of the monsoon climate and will be used in our analyses. R1 indicates Amazonia, R2 Midwest Brazil, R3 southeastern Brazil (the boundary between São Paulo and Minas Gerais states), R4 north of Southeast Brazil, and R5 north Argentina and Paraguay. SACZ occurs from the southern R1 to R3, crossing R2. Therefore, when mentioned in the text, the “SACZ region” refers to such areas.
The reference dataset is the precipitation analysis from the Climate Prediction Center Gauge-Based Analysis of Global Daily Precipitation (CPC) [44]. The CPC has a daily frequency and horizontal resolution of 0.5° (available at https://ftp.cpc.ncep.noaa.gov/precip/CPC_UNI_PRCP/GAUGE_GLB/RT/, accessed on 22 January 2022). It is developed through rain gauge observations and has been applied in several studies in SA [40,45,46,47]. In this study, the period from 1995 to 2014 is used.

2.2. CMIP6-GCMs

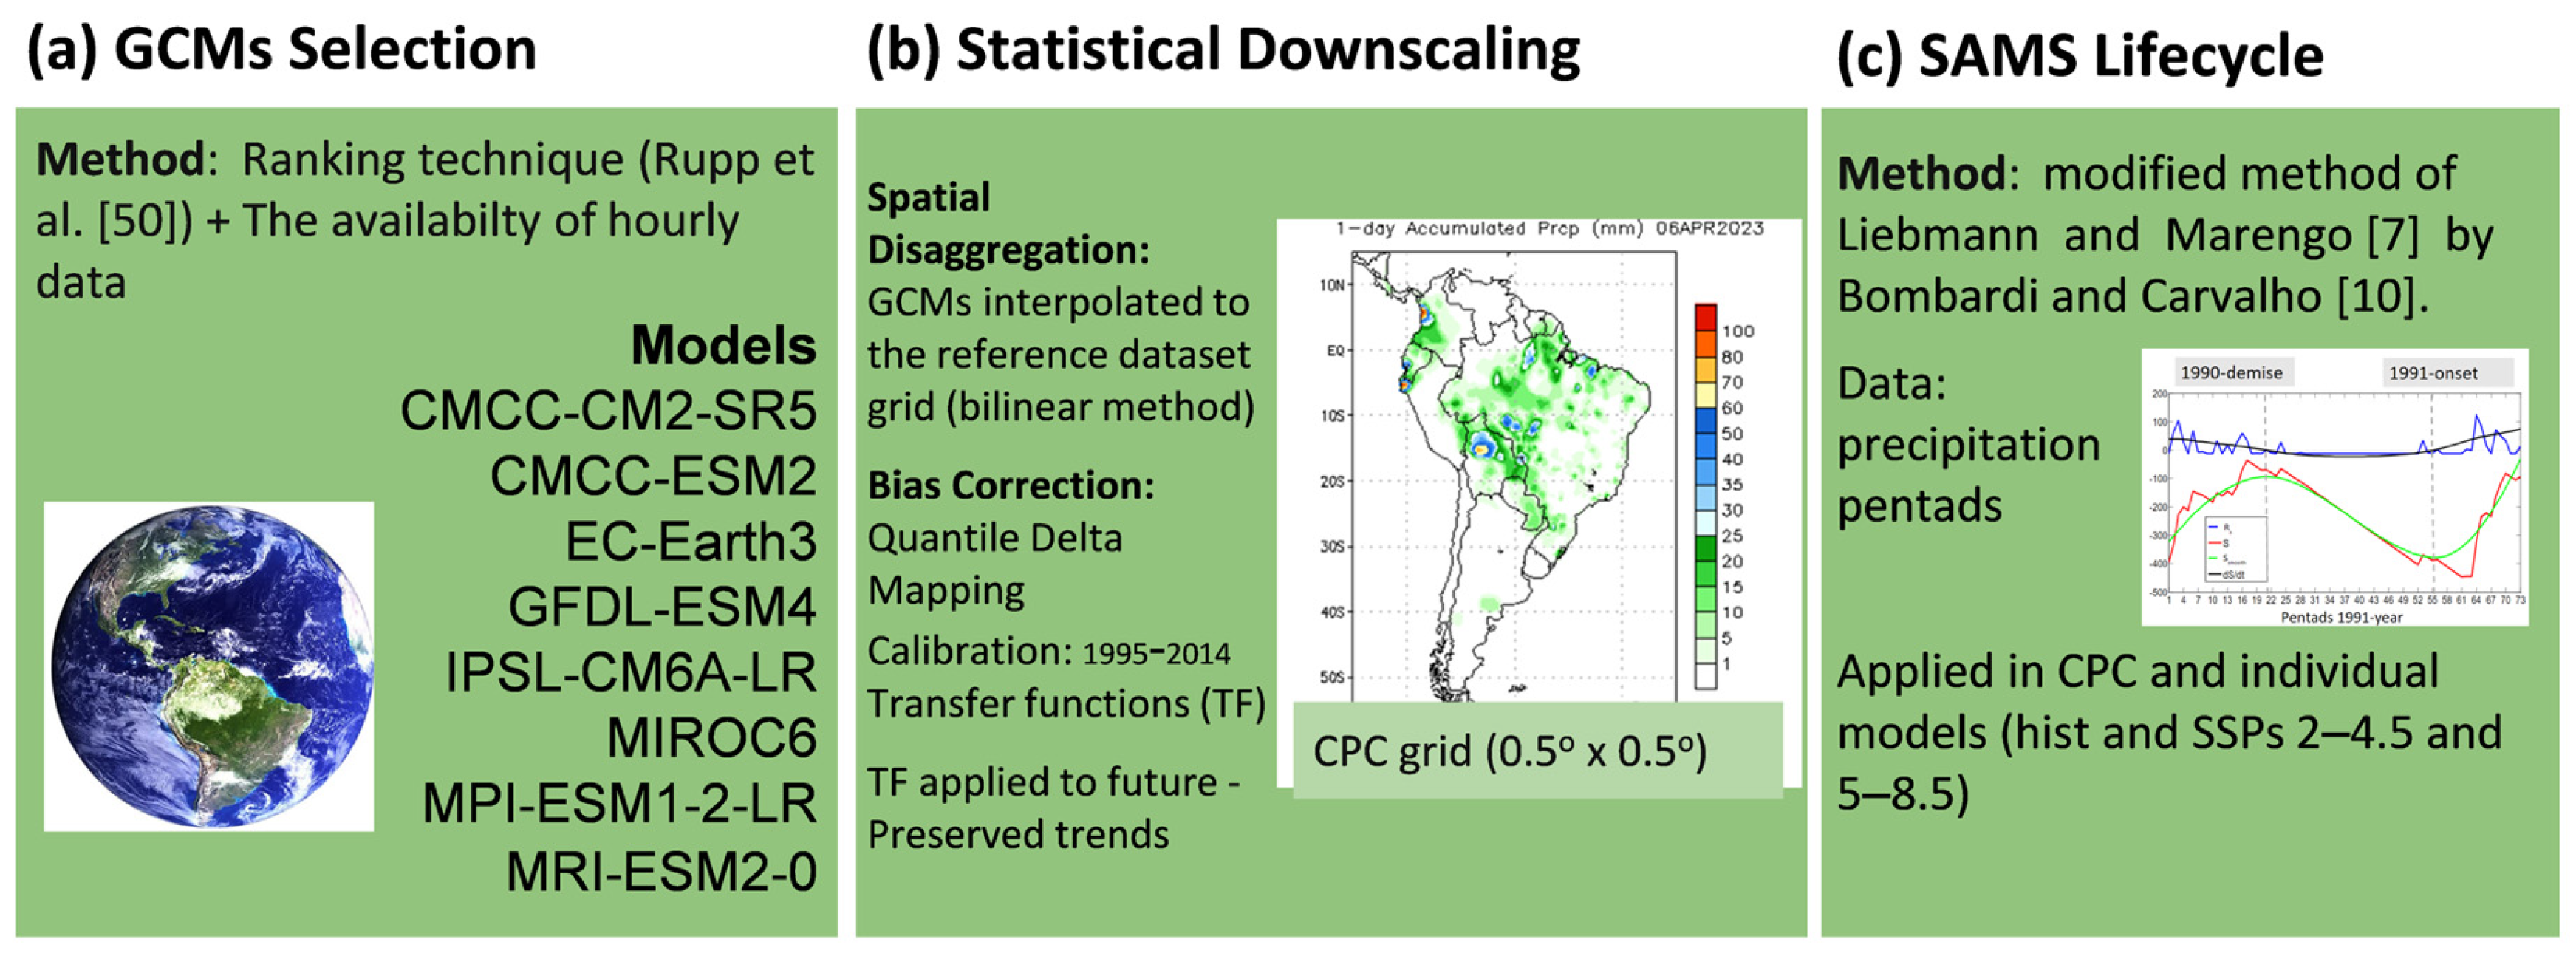
The projections of eight CMIP6-GCMs (Table 1) are used in this study. The models were selected in January 2022 under the R&D project 00403-0054/2022. As described in Ferreira et al. [48,49], the performance of 50 CMIP6-GCMs in representing the mean state of the SA climate was analyzed with the methodology of ranking analysis [50]. Monthly data (from 1995 to 2014) of air temperature at 2 m and precipitation of these models were used. Not all top-ranking models could be selected due to the absence of hourly/daily data and/or projections on the database of the ESGF platform (available at https://esgfnode.llnl.gov/search/cmip6, accessed on 20 January 2022). Thus, the selection followed the ranking and data availability on the ESGF platform.
Moreover, studies such as Dias and Reboita [51] have indicated that an ensemble of CMIP6-GCMs for the historical period composed of the models with better representation of the SA climate presents fewer biases with the reference datasets than an ensemble with around 50 GCMs. Therefore, the GCMs used in this study were selected based on the ranking method and data availability on the ESGF platform, but the validation previously carried out by Dias and Reboita [51] also corroborates the choice of some of the GCMs used, given their good performance in simulating the SA climate. We emphasize that if the model has a good representation of the historical climate, it can have a good representation in the future [52]. For this reason, we are using only eight models in the study, which helps to save computational resources. The main steps of the methodology are indicated in Figure 2.
After the eight CMIP6-GCMs (Table 1) were selected, precipitation projections every three hours were downloaded from ESGF and, posteriorly, were accumulated into daily data (the rainfall for a given day was accumulated from 1200 Z of the previous day to 1200 Z of the day in question). As CMIP6-GCMs present distinct horizontal resolutions (Table 1), the data were remapped into a regular 0.5° × 0.5° grid using a bi-linear interpolation technique [42,53,54].
Table 1. Information on each CMIP6-GCM employed in the study.
ModelResolution (°Lat × °Lon)InstituteReference
CMCC-CM2-SR51.25 × 0.94Fondazione Centro Euro-Mediterraneo sui Cambiamenti ClimaticiLovato and Peano [55]
CMCC-ESM21.25 × 0.94Fondazione Centro Euro-Mediterraneo sui Cambiamenti ClimaticiLovato et al. [56]
EC-Earth30.70 × 0.70EC-Earth ConsortiumDöscher et al. [57]
GFDL-ESM41.25 × 1.00Geophysical Fluid Dynamics LaboratoryKrasting et al. [58]
IPSL-CM6A-LR2.50 × 1.26Institut Pierre Simon LaplaceBoucher et al. [59]
MIROC-61.41 × 1.41Japan Agency for Marine-Earth Science and TechnologyTatebe and Watanabe [60]
MPI-ESM1-2-LR0.94 × 0.94Max Planck Institute for MeteorologyWieners et al. [61]
MRI-ESM2-01.13 × 1.13Meteorological Research InstituteYukimoto et al. [62]
The historical period (1995–2014) follows the IPCC recommendation [12]. For the future, two greenhouse gas emission scenarios (SSP2–4.5 and SSP5–8.5) are evaluated in four time slices (2020–2039, 2040–2059, 2060–2079, and 2080–2099). SSPs are narratives describing different development paths of society [63]. The SSP2–4.5 scenario denotes a moderate emission scenario, in which the future trends in climate change stay relatively the same as they are currently, with moderate population growth, uneven development, slow progress towards sustainable development goals, environmental degradation, and persistent income inequality, resulting in a forcing pathway of 4.5 Wm−2 by 2100 [63,64]. SSP5–8.5 considers a high greenhouse gas emission context, representing a period with little effort to mitigate climate change effects, which leads to a forcing pathway of 8.5 Wm−2 in 2100. As in Ballarin et al. [42], we chose these two scenarios, moderate and extreme, because they represent a wide range of expected changes, covering other intermediate scenarios such as SSP3–7.0.

2.3. Statistical Downscaling

Our study aims to have projections with an intermediate horizontal resolution (0.5° × 0.5°) and which are bias-corrected. As dynamical downscaling has time-dependent boundaries, a considerable quantity of data and computational power is necessary, becoming a working difficulty for small research laboratories. The best alternative is to use statistical downscaling. Thus, in this study, we use the PP approach with the transfer function method (quantile delta mapping, QDM). This method, also known as BCSD, was chosen for its simplicity of implementation and for preserving time-series trends [65]. This last feature is important because if the GCM shows, for instance, a dry trend in a given region, that trend will be maintained after bias correction. In addition, several studies in different global areas have used the method [42,66,67,68,69].
As the BCSD methodology is described in Ferreira et al. [48,49], here we provide only a summary. For obtaining a dataset with an intermediate horizontal resolution, initially, the daily precipitation from CMIP6-GCMs is spatially disaggregated, i.e., remapped to a grid of 0.5° × 0.5°, which is the same as that from the reference dataset (CPC), as mentioned in the previous section. The next step is to apply the QDM in the reference dataset and in each historical simulation to obtain the model representative of each grid point and to bias-correct the CMIP6-GCMs of the reference period. The last step is to apply the transfer functions in the future period. The Python-based package xclim [70] was used to perform the calculations.
The performance of bias correction applied to precipitation over SA in the reference period is presented in detail in Ferreira et al. [49]. Here, we only show a few comparisons of the GCMs with and without BCSD.

2.4. Determination of SAMS Lifecycle

The SAMS lifecycle is defined by the onset and demise dates of the rainy season using the Liebmann and Marengo [7] method adapted by Bombardi and Carvalho [10]. This method has also been used by Silva and Reboita [71], Reboita et al. [72], and Ashfaq et al. [12], for example. For the identification of the onset and demise dates, only precipitation in pentads is required, and the method begins with the calculation of accumulated anomalies (S):
S pentad = n = pentad 1 pentatd R n R ¯
where R n is the precipitation of the n pentad (each year consists of 73 pentads, and when the year is bissextile, 29 February is included in the 12th pentad; a table with the pentads and corresponding dates is presented in Kousky [13]); R ¯ is the climatological average of all the pentads under study. The first pentad in the summation (pentad1) is chosen as the first pentad of the year (total precipitation from 1 January to 5 January), which, in turn, falls within the rainy season of the study region. After summing up the precipitation anomalies ( R n R ¯ ) at each iteration, the resulting time series S is smoothed with a 3-point moving average applied 30 times. The next step involves calculating the first derivative of S = dS/dt to identify the onset and demise of the rainy season for each year under study. This procedure is applied in CPC and each model for historical and future climates and each time slice.
The mentioned steps were implemented in a script in Python language by the authors of the present study. The algorithm performance was verified by comparing the monsoon’s onset, demise, and length obtained with the CPC (reference dataset) with the literature and considering each region shown in Figure 1. For brevity, here we only show R2 (Table 2), the most common area used to define the SAMS lifecycle, since it is the central core of the SA rainy season [9,73,74]. The tables for the other regions are presented in the Supplementary Materials. In general, the results obtained here reaffirm those of previous studies, particularly the works of Bombardi and Carvalho [10], Ashfaq et al. [12], Gan et al. [73], and Reboita et al. [75], indicating the good performance of the algorithm. Some slight variations between the results may be due to differences in the data, period, and methodology used for analysis. Not all mentioned studies in the tables were performed with the same methods applied in this work.

2.5. Analysis

All the analyses are performed considering the ensemble of the raw and BCSD projections. Initially, the performance of the raw and BCSD ensemble is evaluated through comparisons with the CPC analysis. Future projections under the SSP2–4.5 and SSP5–8.5 scenarios are described based on the spatial patterns during the different time slices (2020–2039, 2040–2059, 2060–2079, and 2080–2099). The average precipitation and onset, demise, and monsoon’s length are presented, as well as the difference of the time slices minus the historical climate (1995–2014). Statistically significant differences at a 95% confidence level, computed with a t-test, are indicated in the figures. For a more detailed analysis, under the SSP2–4.5 and SSP5–8.5 scenarios, the changes projected for the monsoon’s lifecycle by the BCSD ensemble are evaluated in each region as shown in Figure 1. The statistical significance of the trends is calculated with the Mann–Kendall trend test [79,80], used to analyze trends in hydrological series [81,82]. In addition, Sen’s slope estimation test was also employed to detect the SAMS parameters’ linear trend in the selected subdomains.

3. Results and Discussion

3.1. BCSD Performance

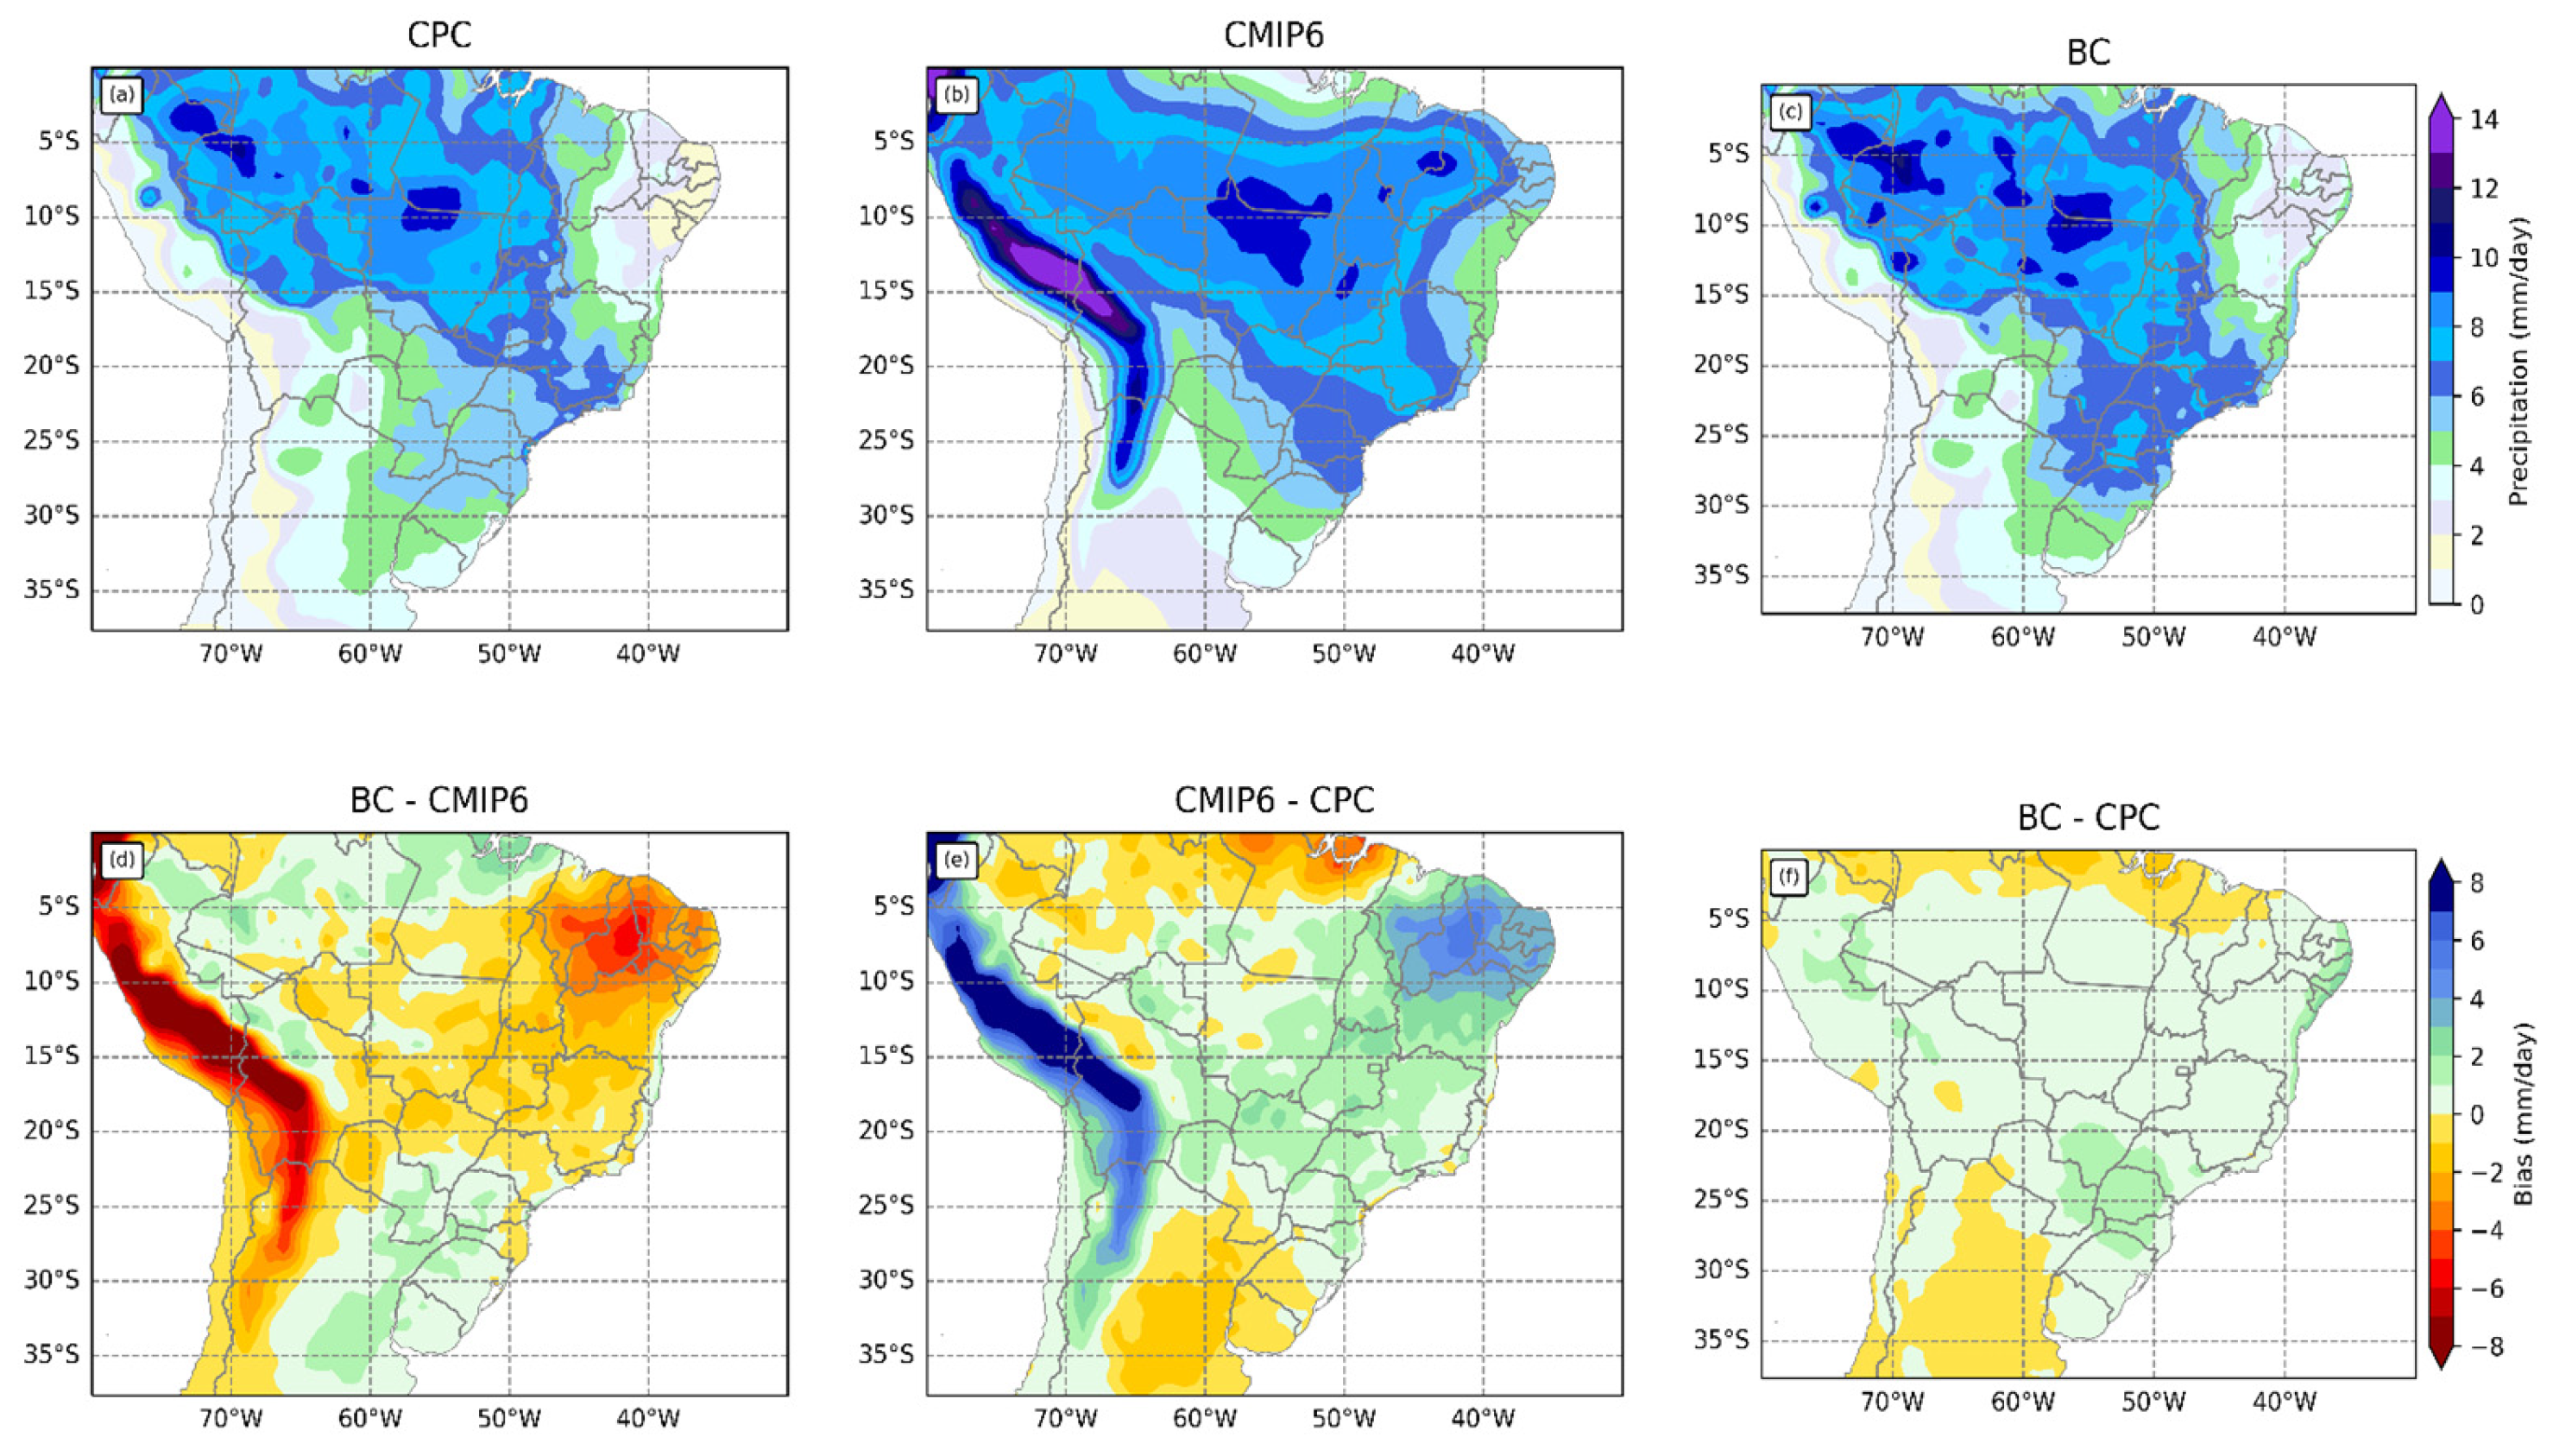
Comparisons of the reference period evaluate the performance of the BCSD without and with the technique application and CPC for precipitation and the main features of the SAMS. In this section, we explore the spatial pattern of the variables without focusing specifically on the regions R1 to R5 (Figure 1), which will be described in more detail in Section 3.3. Figure 3 presents the historical simulations (1995–2014) of precipitation for the period from October to March (rainy season) obtained by the ensemble of eight CMIP6-GCMs without (middle column) and with (right column) applying the BCSD. The raw ensemble (Figure 3b,e) overestimates precipitation in most parts of Brazil and the western coast of SA, with great overestimations over the Andes. In contrast, underestimations occur in the Brazilian Amazon, northwest SA, central-north Argentina, Uruguay, and extreme southern Brazil. On average, the raw ensemble can represent the spatial distribution of the highest rainfall volumes associated with the SACZ, but it exhibits an unreal amplification and displacement of the system towards the southeast and northeast of Brazil.
The underestimation of precipitation in northwest SA and northern Brazil corroborates the results of other studies using CMIP5 and CMIP6 models [83,84,85,86,87]. These systematic errors result from various factors, such as the models’ sensitivity to the sea surface temperature (SST) and their deficiency in simulating the Intertropical Convergence Zone (ITCZ) and surface wind convergence [83,87], limitations in cloud physics representation [88], and processes such as biosphere–atmosphere interactions and soil moisture [89], as well as uncertainties associated with the insufficient coverage of rain gauge networks for validating climate simulations [84,90].
The BCSD application notably reduces biases throughout the continent, especially on the western coast of SA and northeastern Brazil (Figure 3c,f). There is also a significant improvement in representing the intensity and location of precipitation maxima associated with SACZ despite a persistent overestimation of rainfall in the core of the continental SACZ. Figure 3d also indicates these features, showing the difference between the ensemble with and without BCSD application. In summary, the BCSD technique efficiently reduces systematic errors in the global models comprising the CMIP6-GCMs ensemble, thereby ensuring more reliable projections of future climate conditions. Additionally, the biases that persist after the application of correction are located in problematic sectors of global climate modeling, such as the tropical region and the continental portion of SACZ.
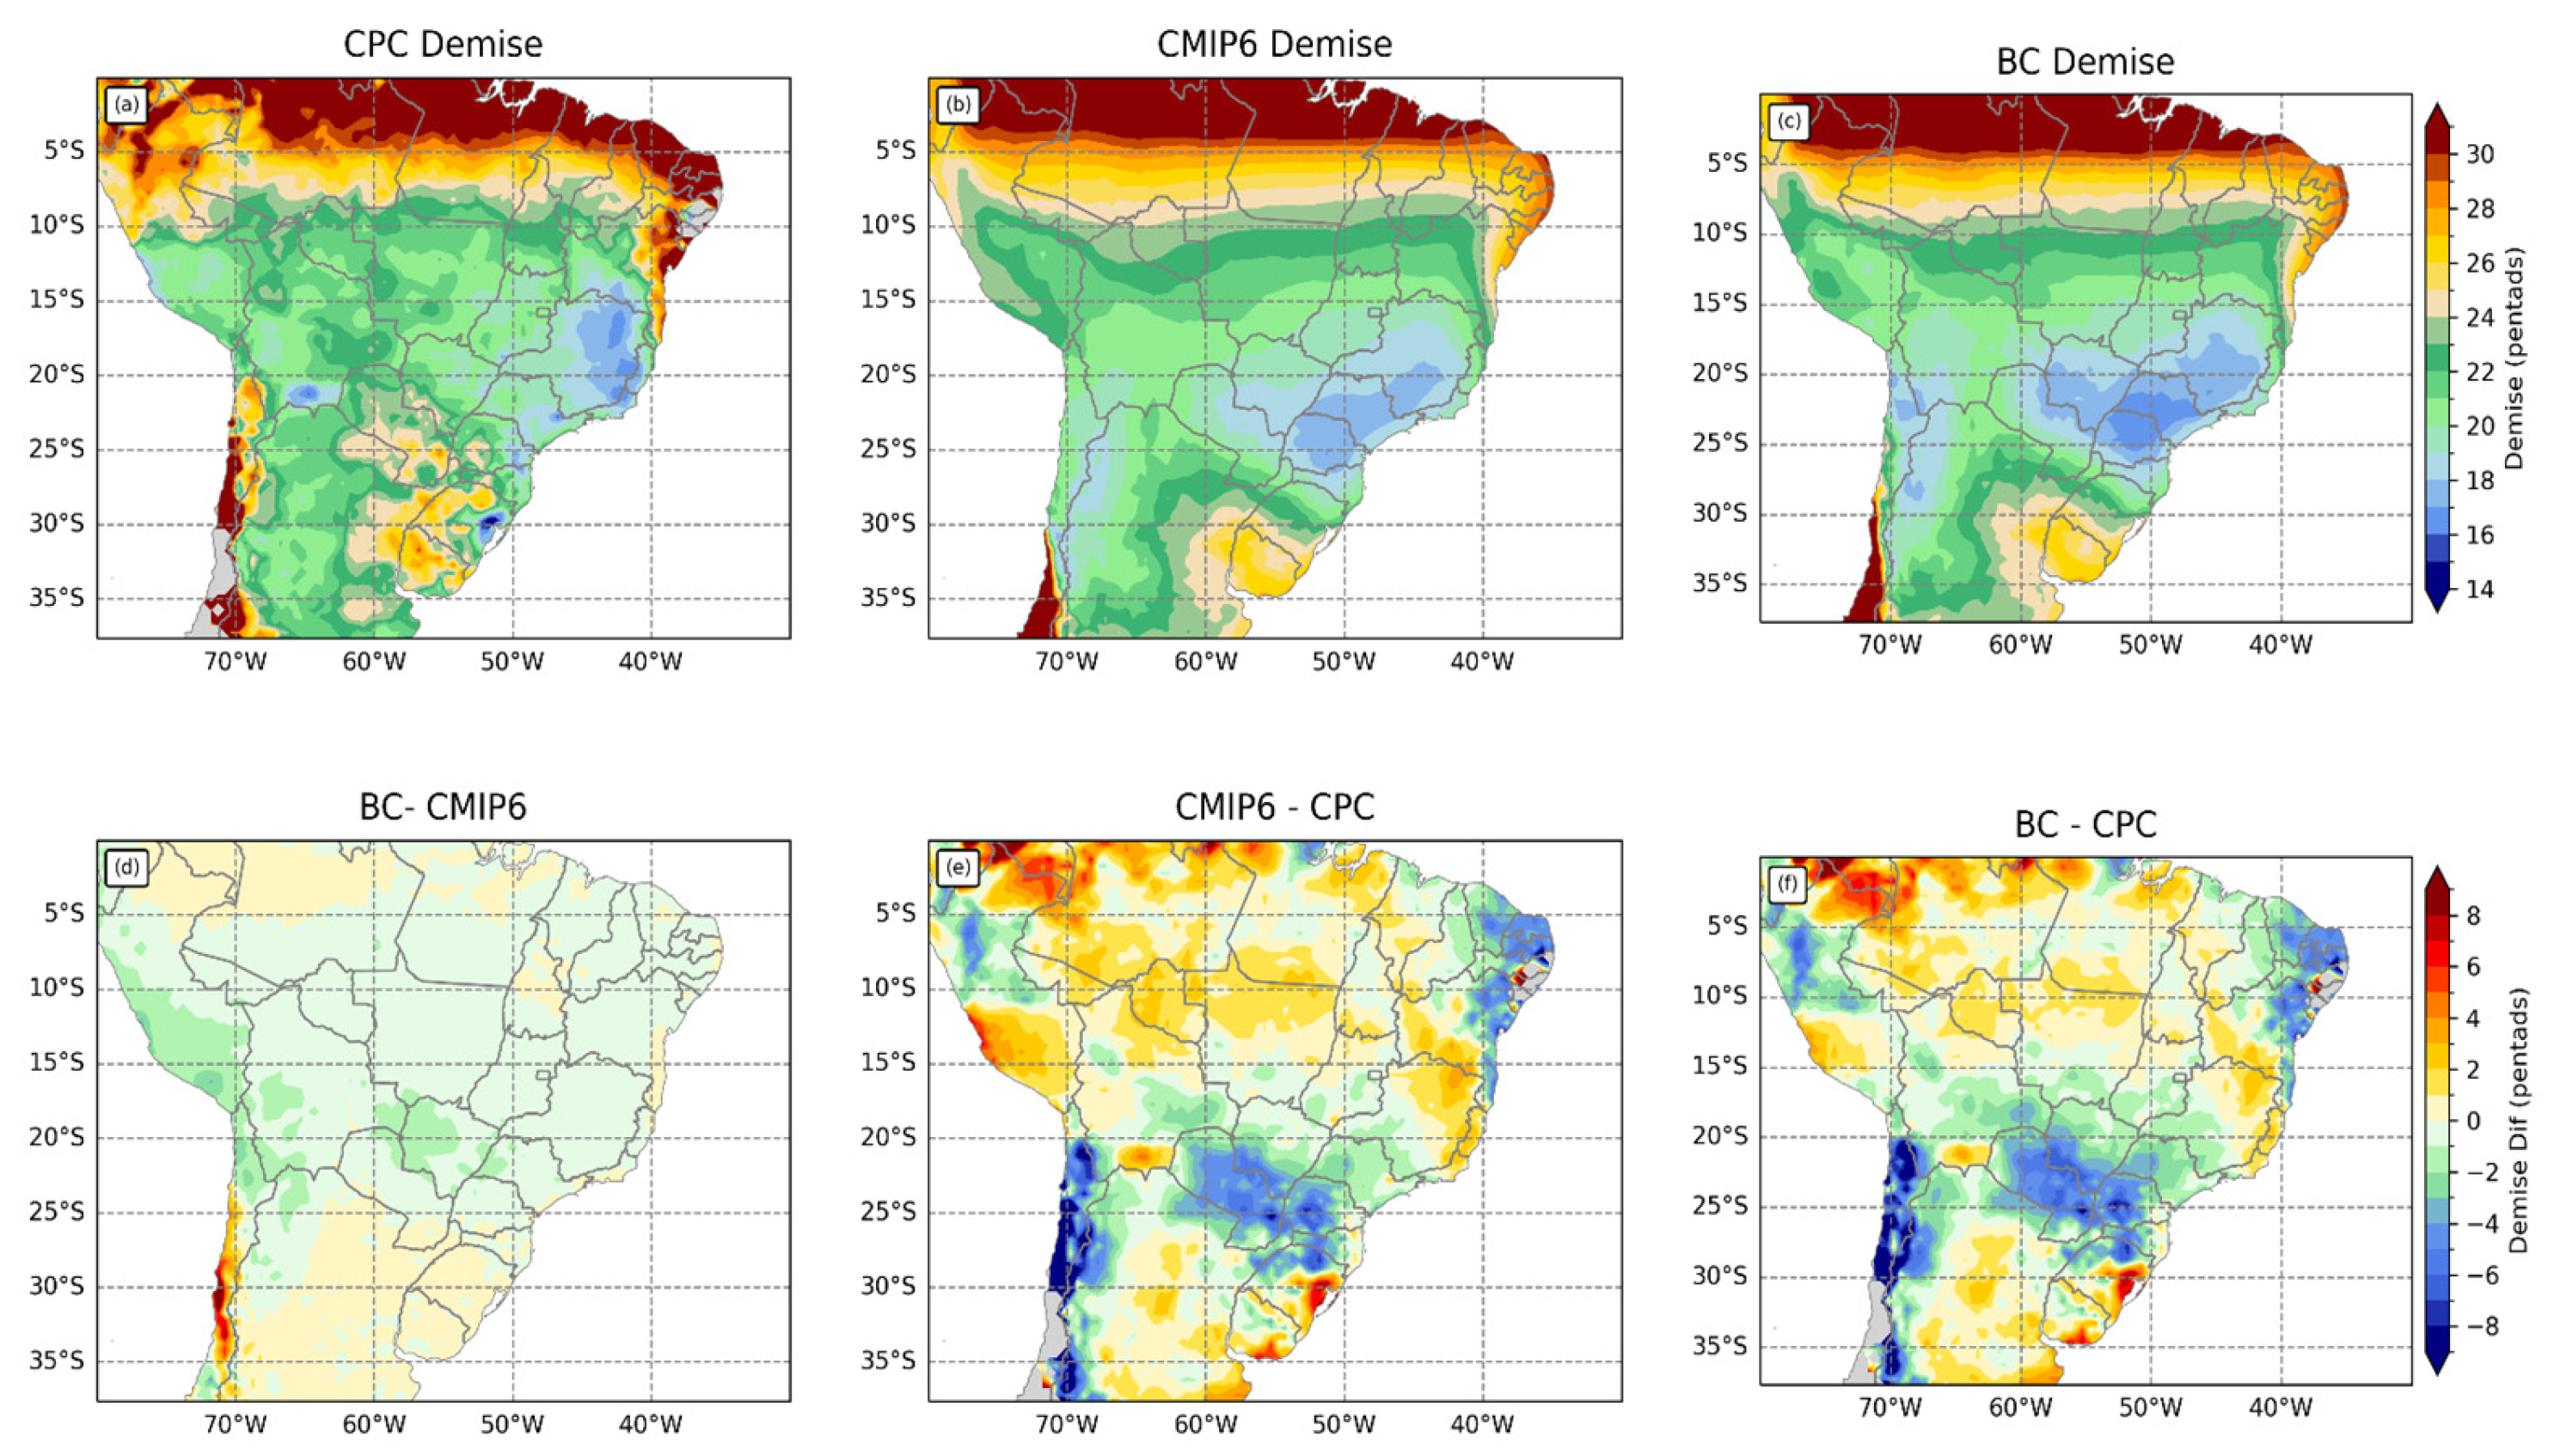
Figure 4, Figure 5 and Figure 6 show the SAMS lifecycle: onset, demise, and length during the historical period. Regarding the SAMS onset, the raw ensemble (Figure 4b,e) approximately estimates the monsoon onset in the Brazilian Midwest from Pentads 60 (23–27 October) to 61 (28 October–1 November), indicating a delay of nearly two pentads compared to the onset in CPC (approximately in Pentad 58, 13–17 October). Considering the BCSD ensemble (Figure 4c,f), the onset of the rainy season in the Brazilian Midwest occurs around Pentad 61, indicating that the 2–3 pentad delay persists even after bias correction. For Southeast Brazil, the raw ensemble (Figure 4b,e) simulates the SAMS onset during Pentads 57–58 (8–12 October to 13–17 October), in agreement with the start obtained by CPC (Pentad 58). Similarly, the ensemble with BCSD (Figure 4c,f) indicates the onset of the rainy season around Pentads 57–58, analogous to the result from CPC. Regarding the sector encompassing Paraguay and northern Argentina, both the raw and BCSD ensembles provide the onset of the rainy season around Pentad 58, indicating an earlier start of the rainy season than obtained by the CPC, which is approximately around Pentad 61. In summary, the main gain with the BCSD ensemble is the enhancement of the onset results west of 60° W, which includes southern Amazonia. It is a good result since this region corresponds to the northern portion of the SACZ. In addition, BCSD also shows a slightly better performance over north Argentina.
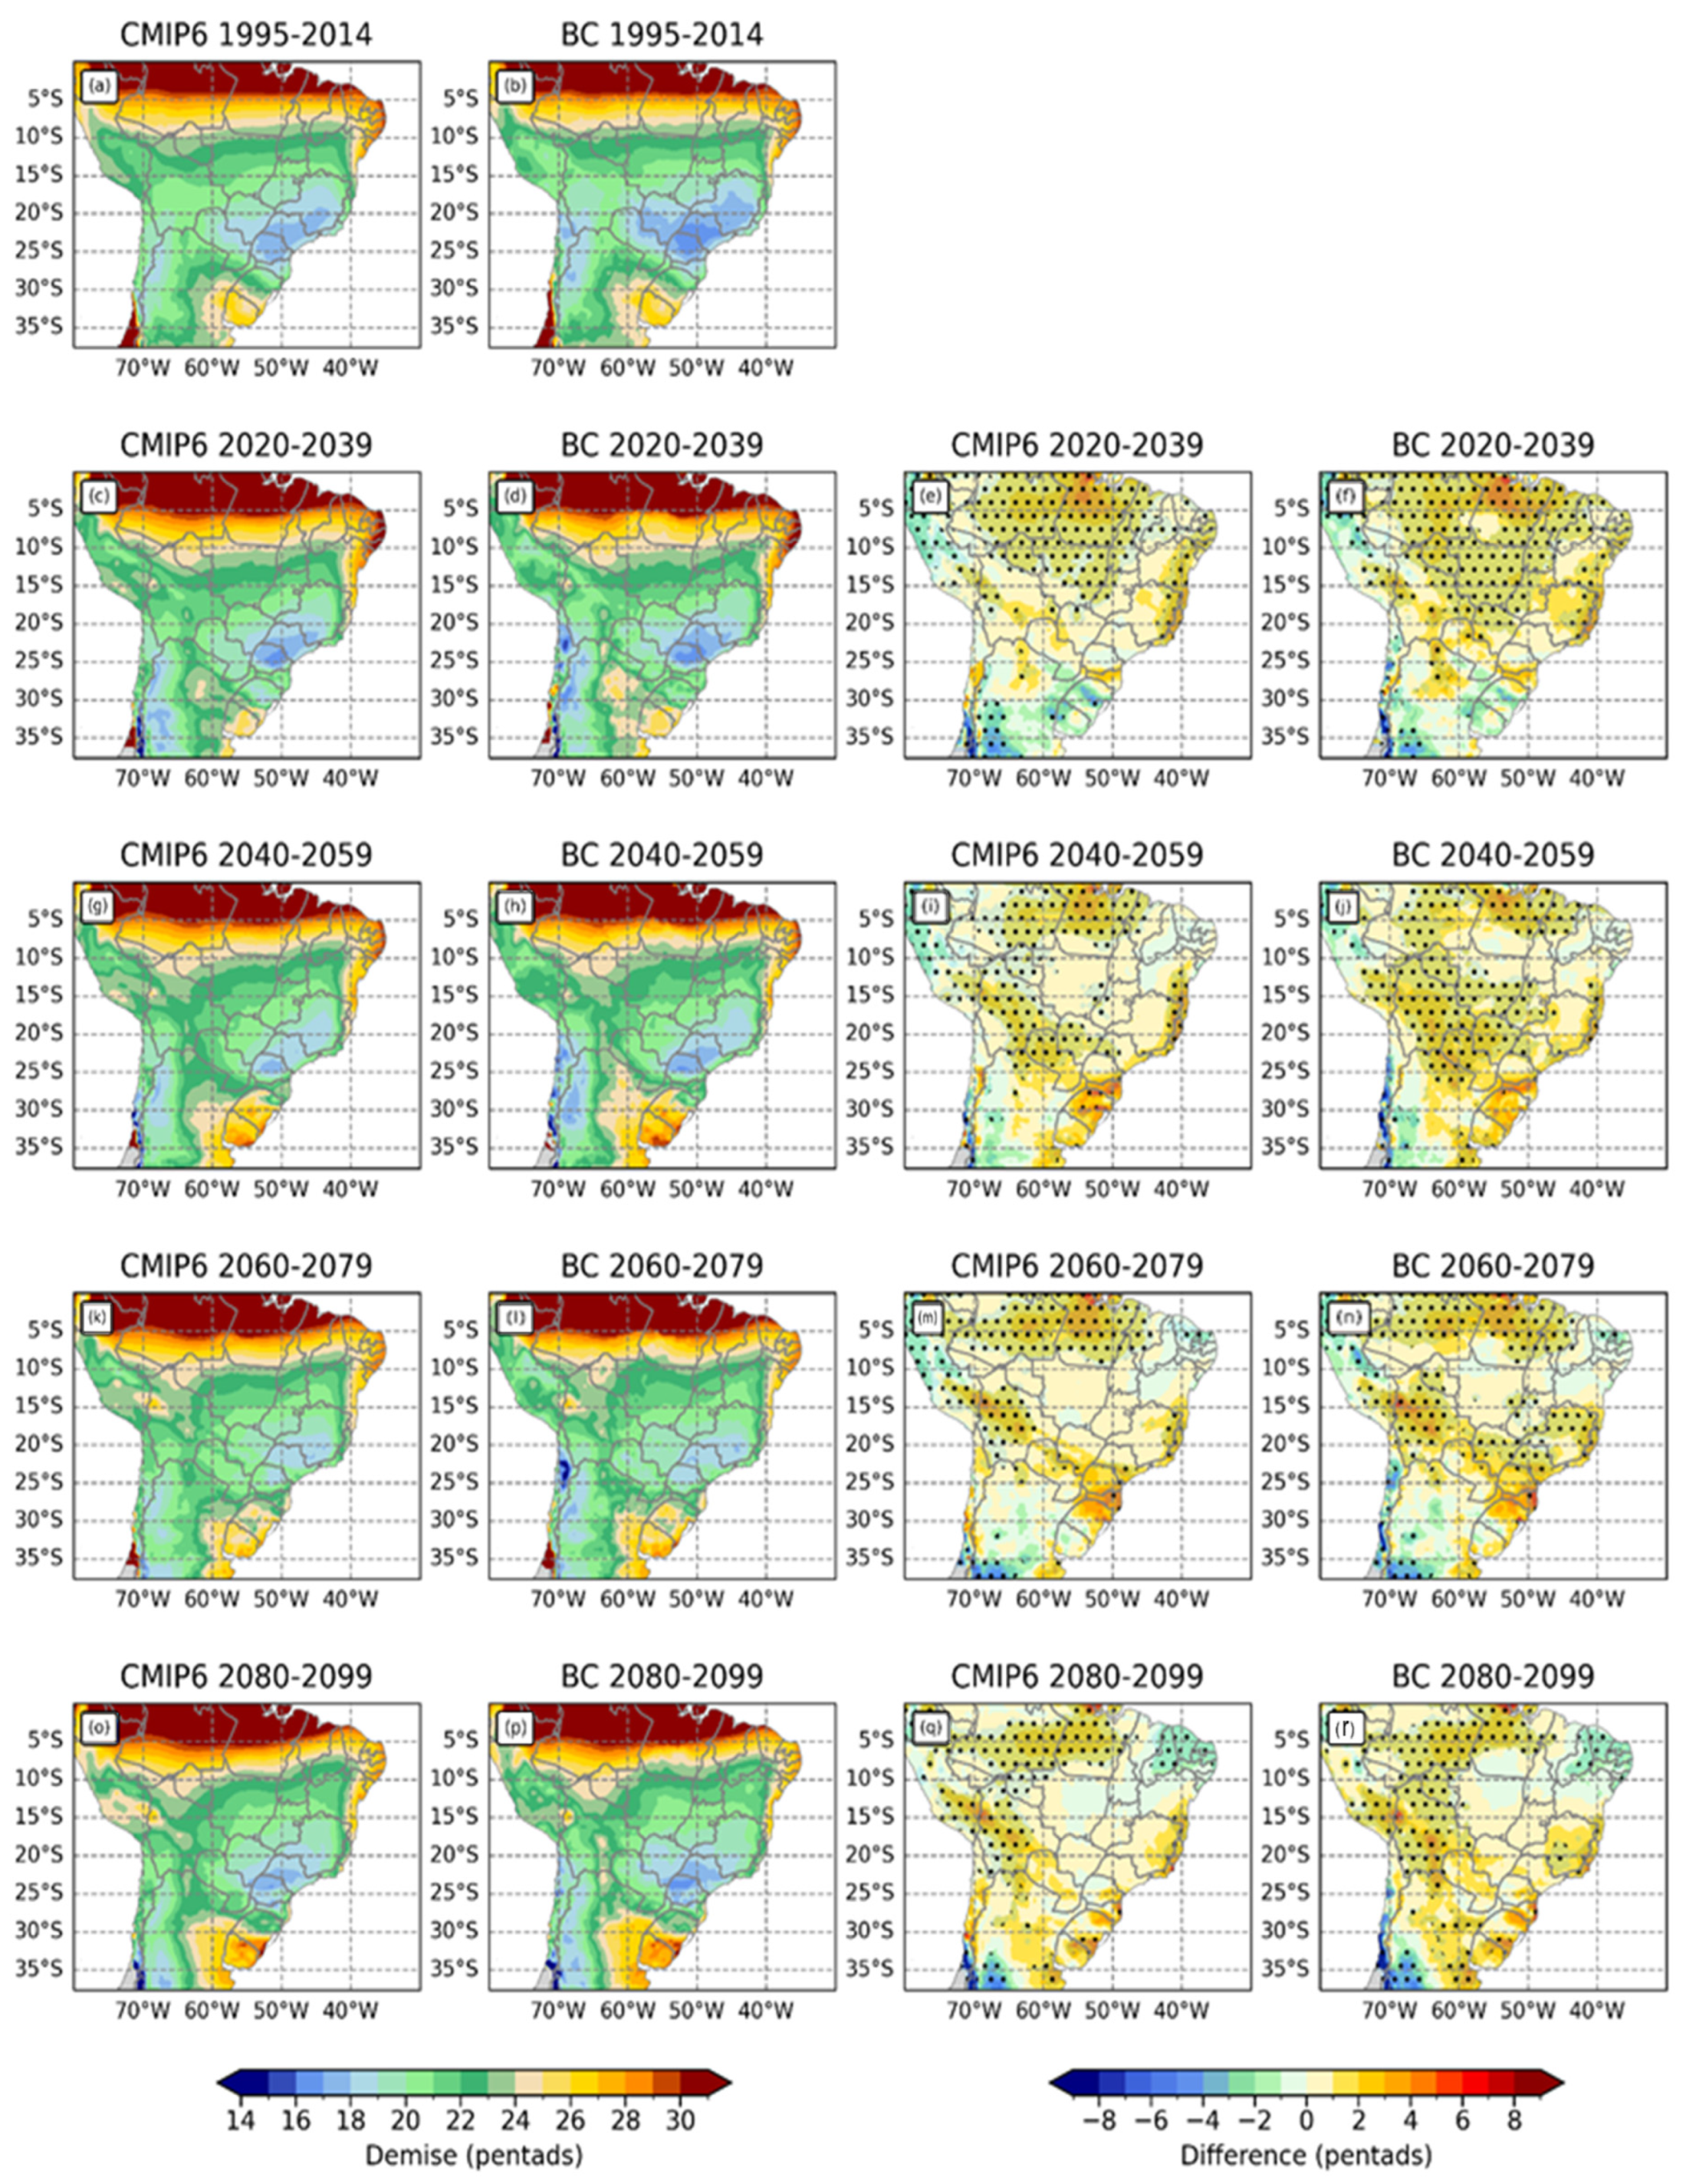
Considering the demise of the rainy season (Figure 5), both the raw and BCSD ensembles indicate a delay in this parameter in Brazil’s southern Amazonia, Midwest, and north of Southeast Brazil. In contrast, the monsoon’s demise is anticipated in Paraguay and northern Argentina. Both ensembles show the rainy season’s demise around Pentads 21–22 (from 11–15 April to 16–20 April) in southern Amazonia and the Midwest, while the CPC indicates the demise during Pentad 20 (5–10 April). Similarly, a lag of approximately two pentads also occurs in the north of Southeast Brazil, with the simulations indicating the demise of the monsoon in Pentad 17 (22–26 March), while the CPC provides the end in Pentad 20 (Figure 5a–c). The most prominent difference between the raw and BCSD ensembles in these areas with a delay in the demise is that BCSD simulates a smaller area with the maximal values of delay (Figure 5e,f). Considering the demise anticipation by the ensembles over Paraguay and northern Argentina, the demise occurs in Pentad 19 (1–5 April), up to three pentads earlier than that provided by the CPC (Pentad 22). Generally, the BCSD ensemble improves the rainy season demise over southern Amazonia and Midwest Brazil. On the other hand, the BCSD ensemble does not decrease the bias over northern Argentina and Paraguay simulated in the raw ensemble.
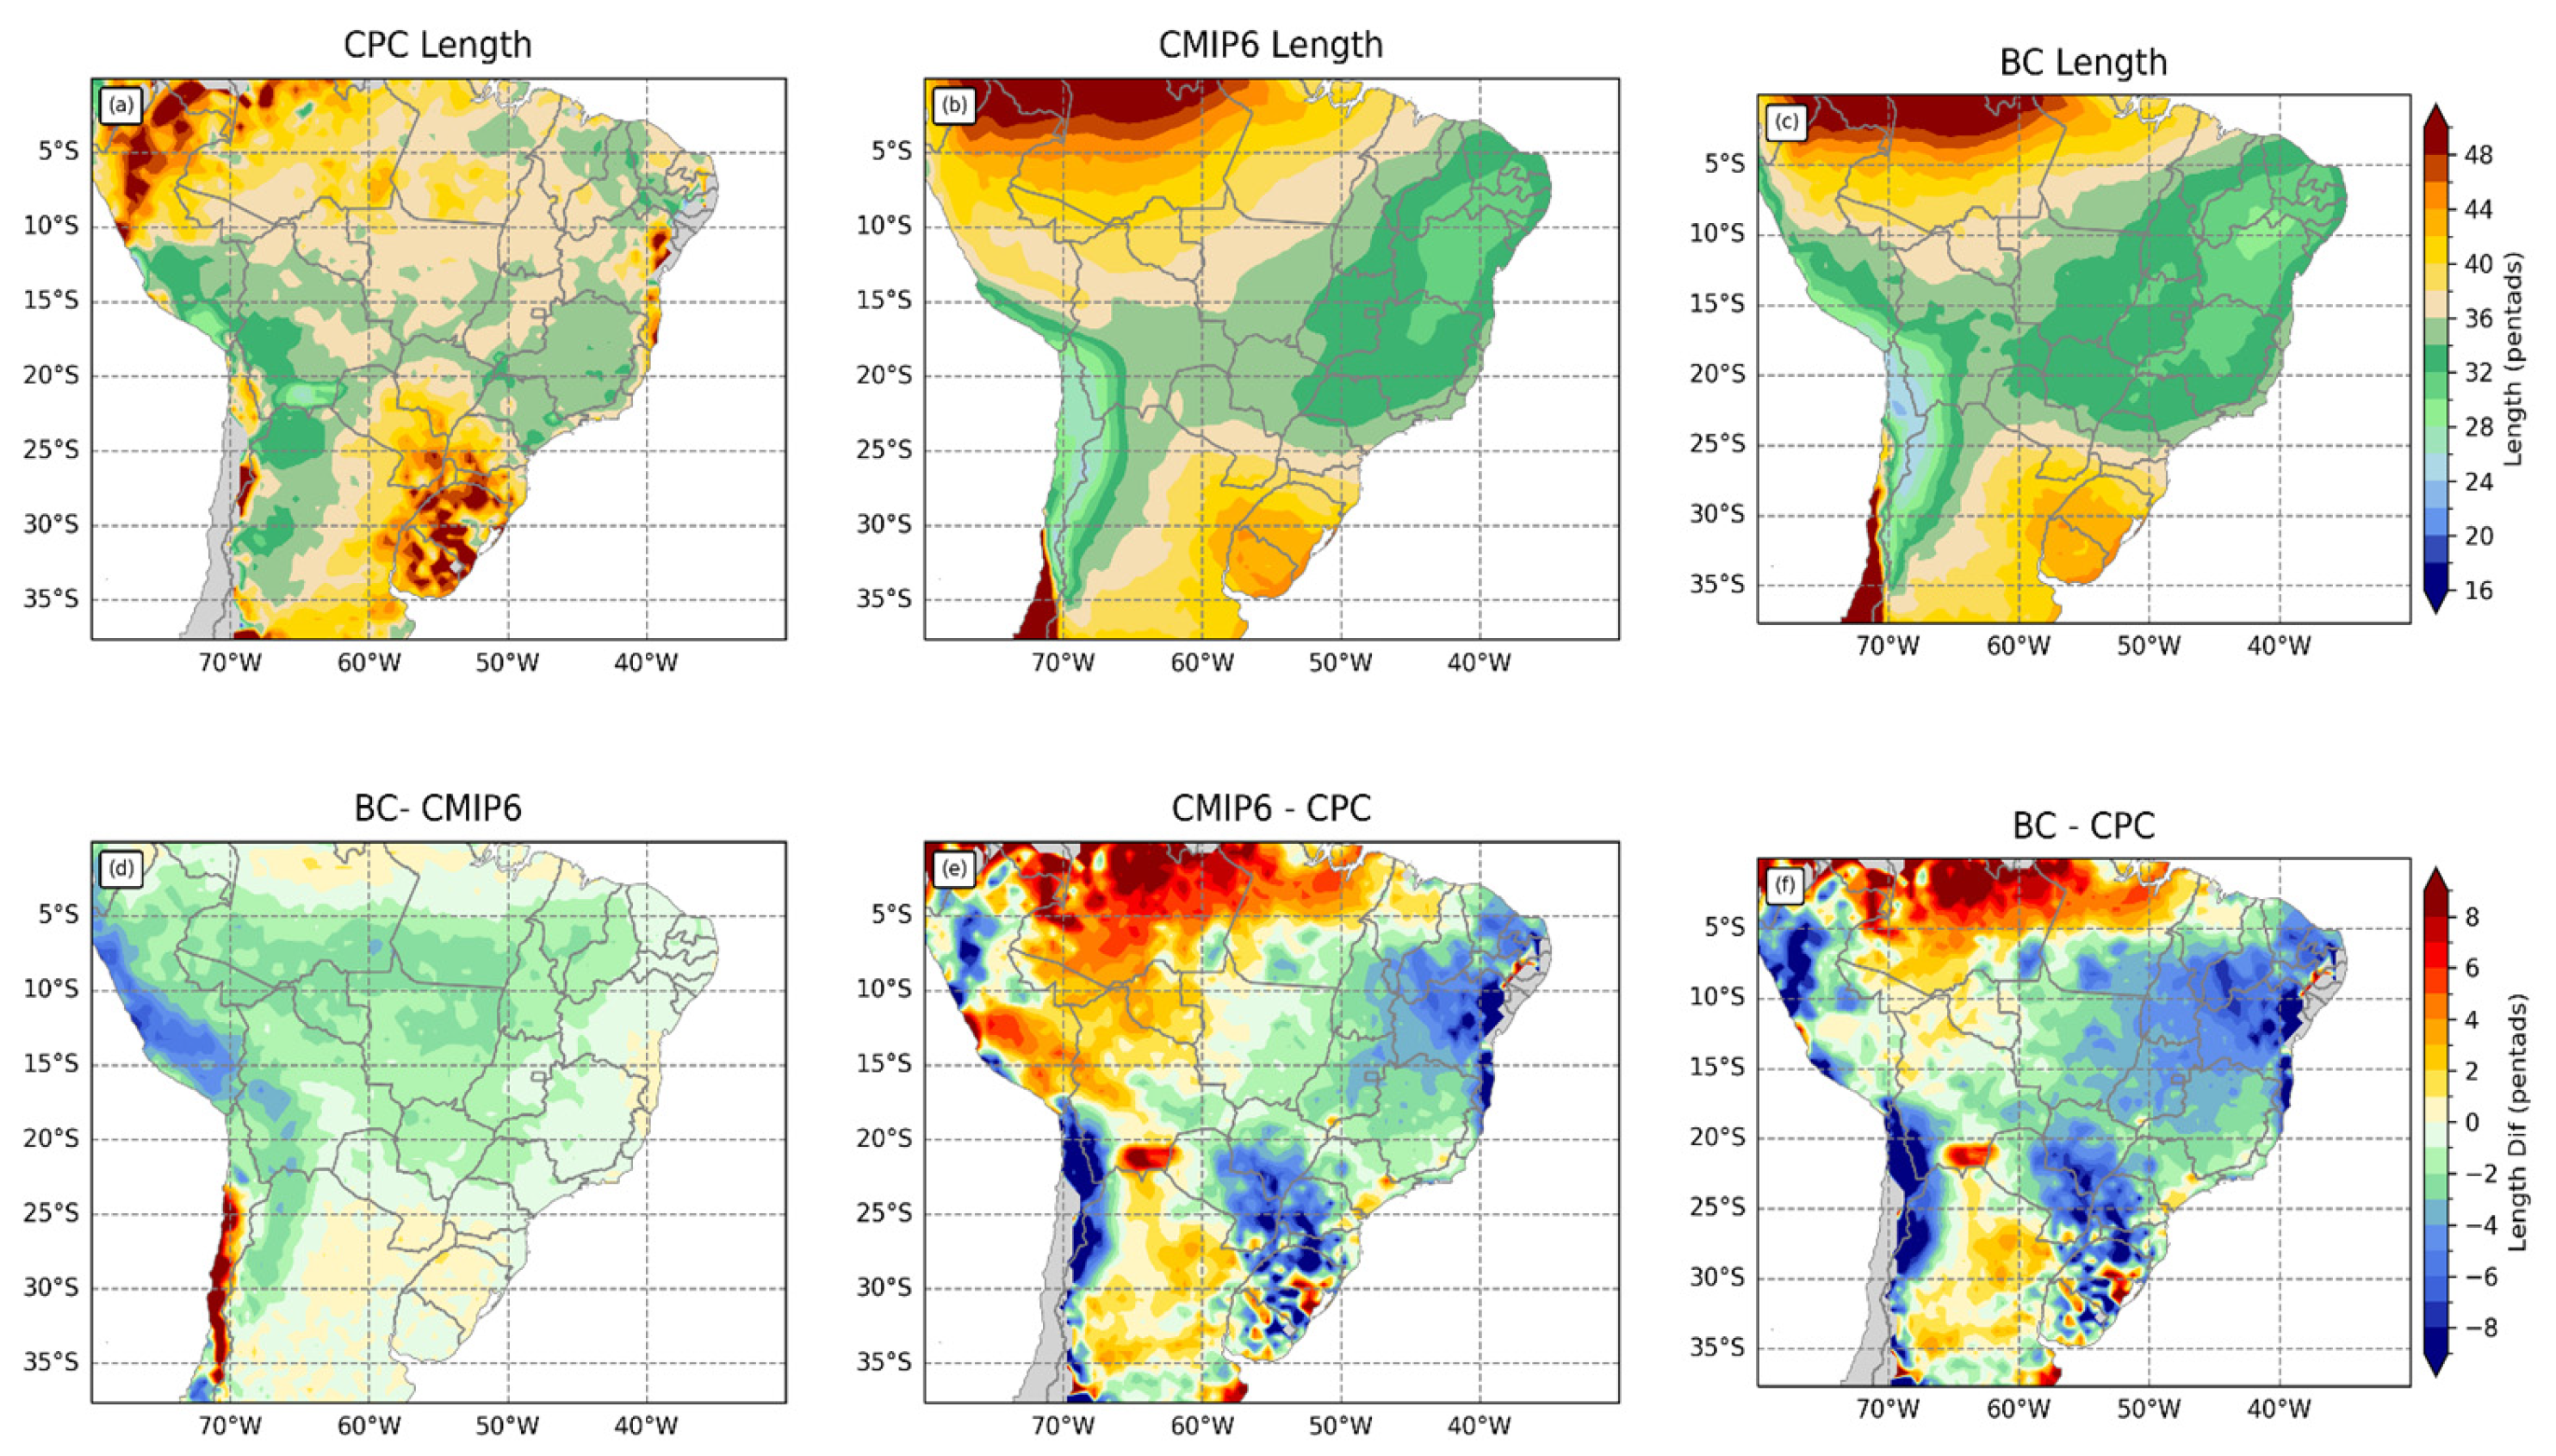
The BCSD ensemble better represents the SAMS onset, demise, and length west of 60° W (Figure 6). Despite this, no significant changes exist between the BCSD and raw ensembles in the other continental regions. In the Brazilian Midwest, both ensembles indicate a SAMS duration of 35–36 pentads, while the CPC indicates 36–37 pentads. Similarly, in the southeastern region, both ensembles underestimate the duration of the monsoon, with a duration of ~32–33 pentads, up to two pentads shorter than that provided by the CPC (~34–35 pentads). Contrarily, in northern Argentina, the ensembles overestimate the duration of the rainy season by up to two pentads, indicating a duration of 40–41 pentads, while the CPC shows a duration of 38–39 pentads.
Overall, it is concluded that despite the modest changes brought about by BCSD in identifying the parameters of the rainy season’s lifecycle, the technique improves the representation of the monsoon onset west of 60° W, as well as the representation of the demise and length in the southwestern Amazonia.

3.2. Climate Projections

Spatial Patterns

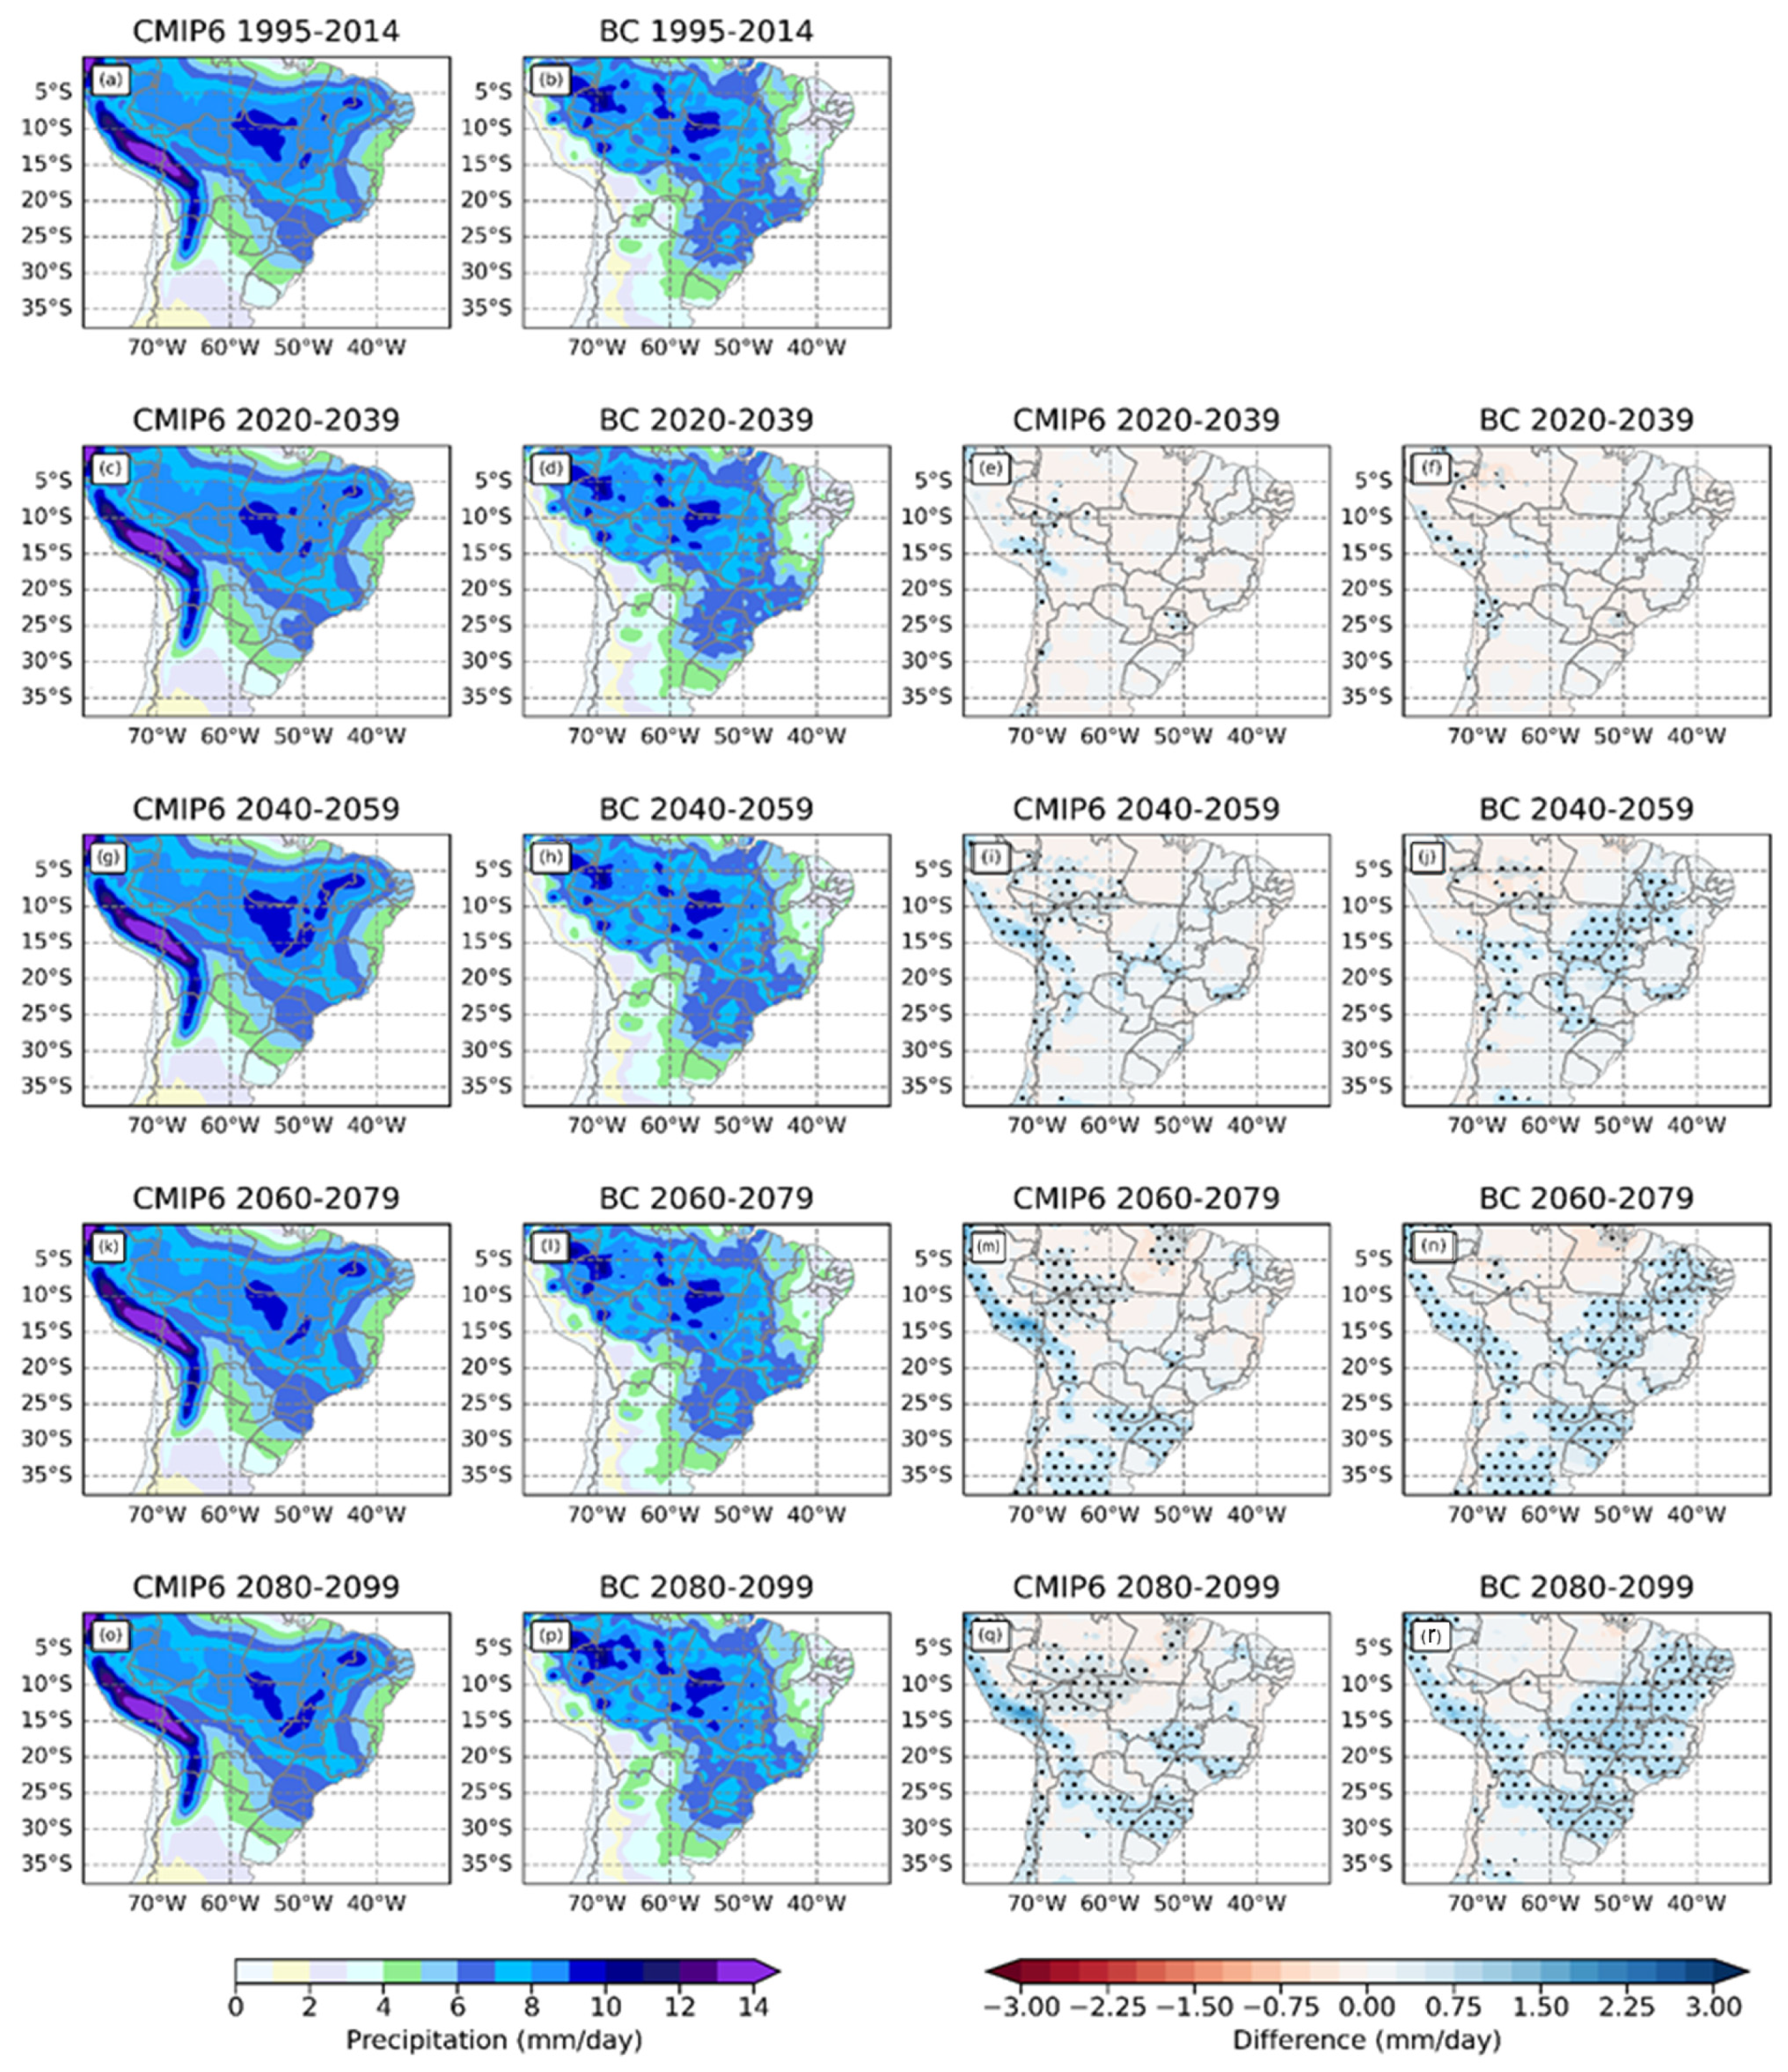
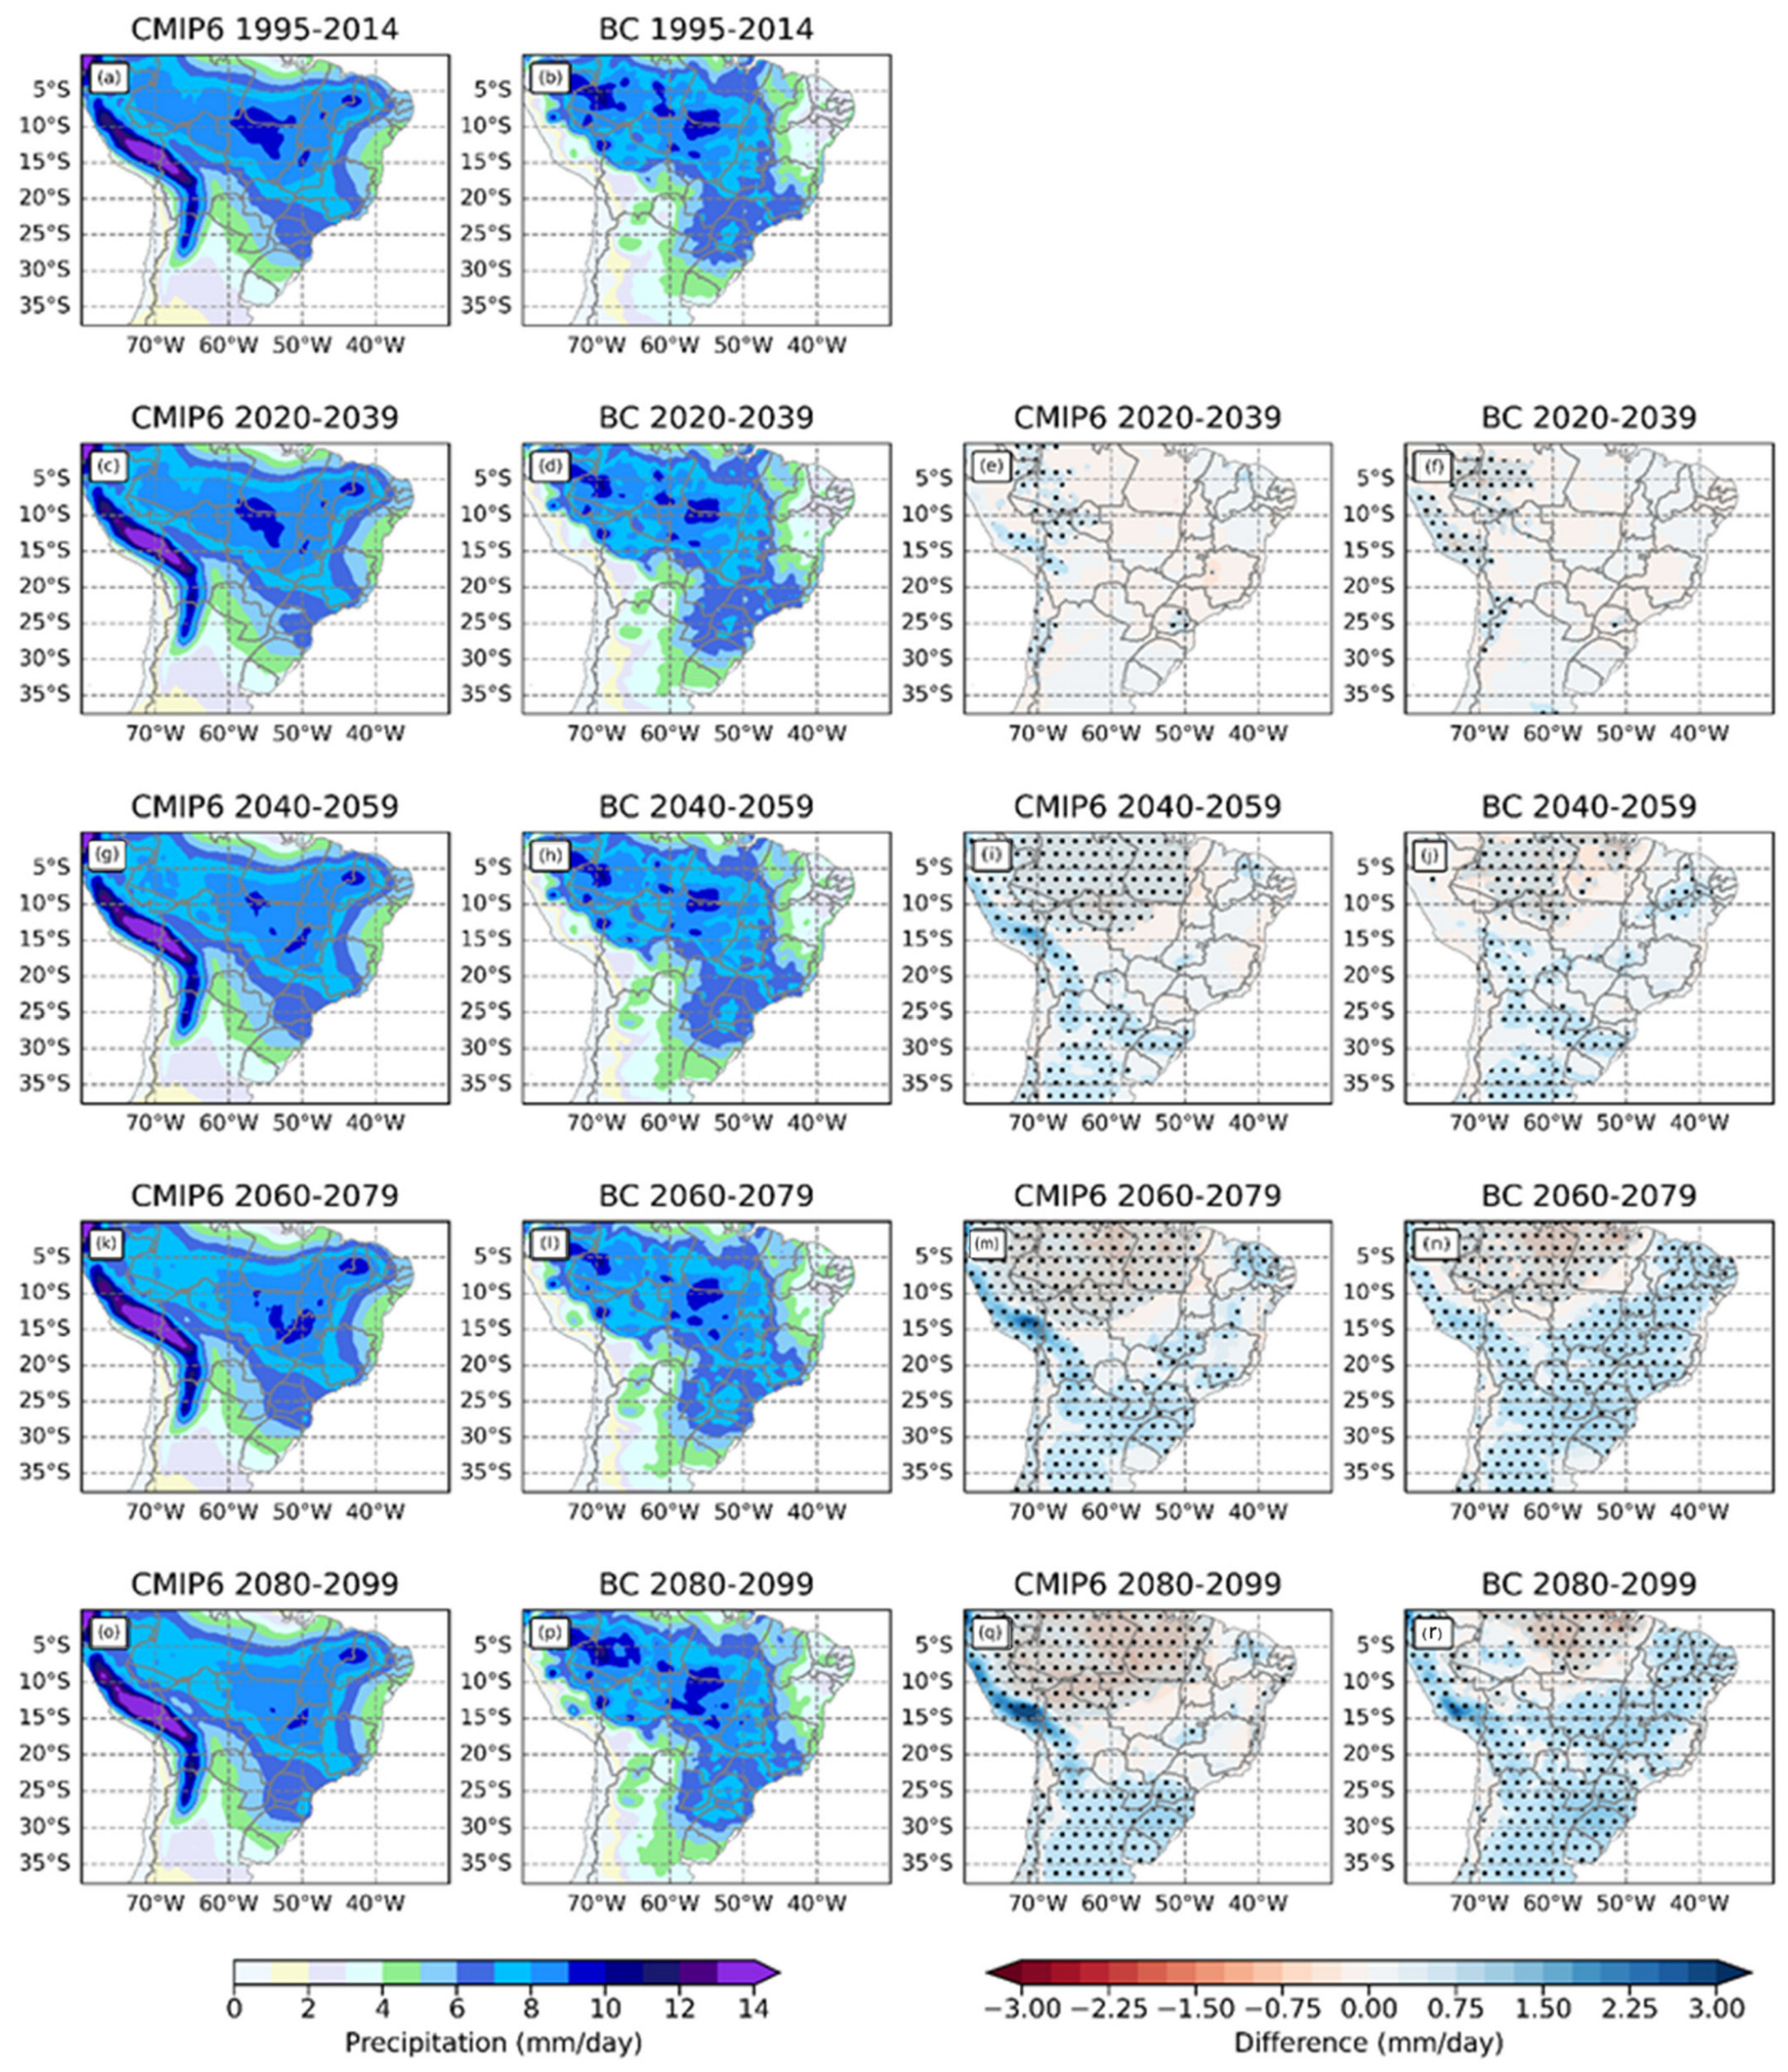
Figure 7 and Figure 8 present the climate projections of precipitation from October to March for four time slices (2020–2039, 2040–2059, 2060–2079, and 2080–2099) and one historical period (1995–2014) obtained by the raw and BCSD ensembles, under the SSP2–4.5 and SSP5–8.5 scenarios, respectively. Under the SSP2–4.5 scenario (Figure 7), the raw ensemble projections maintain their unrealistic representation of the spatial distribution of the rainy season, extending its influence to the northern portion of Northeast Brazil. However, the BCSD ensemble corrects this deficiency and satisfactorily reproduces the rainfall spatial distribution. The projected changes in rainfall volumes in each time slice compared to the historical period show statistically significant increases in precipitation in sectors of the Midwest and the interior of the Northeast, particularly from 2040 onwards. From 2060 onwards, increases in rainfall are also projected in the South, Southeast, and a larger area of Northeast Brazil, as well as in Peru and northern Argentina. Similar results were obtained by studies using CMIP5 models under the RCP-4.5 scenario [91,92] and a large ensemble of CMIP6 models under the SSP2–4.5 scenario [84]. Under the SSP5–8.5 scenario (Figure 8), the changes projected by both ensembles are similar to those provided by the SSP2–4.5 scenario, with the difference of having a more intense change signal and more significant rainfall reductions in the Brazilian North. The raw CMIP6 projections maintain their unrealistic representation of the rainy season, which is corrected by the statistically downscaled projections. The downscaled projections generally provide a stronger change signal than the raw projections. In both datasets, a more intense signal is observed towards the end of the 21st century, particularly under the SSP5–8.5 scenario.
The projections of changes found here corroborate the results of previous studies using models of different CMIP phases. The increase in rainfall in southeastern SA was also observed in studies using CMIP3, CMIP5 [93,94,95,96], and CMIP6 models [84,87,97]. Similarly, the reduction in precipitation in the Amazonia region agrees with the literature [11,84,87,91,92,94,95,96,97]. However, none of these CMIP studies focused on the SAMS lifecycle.
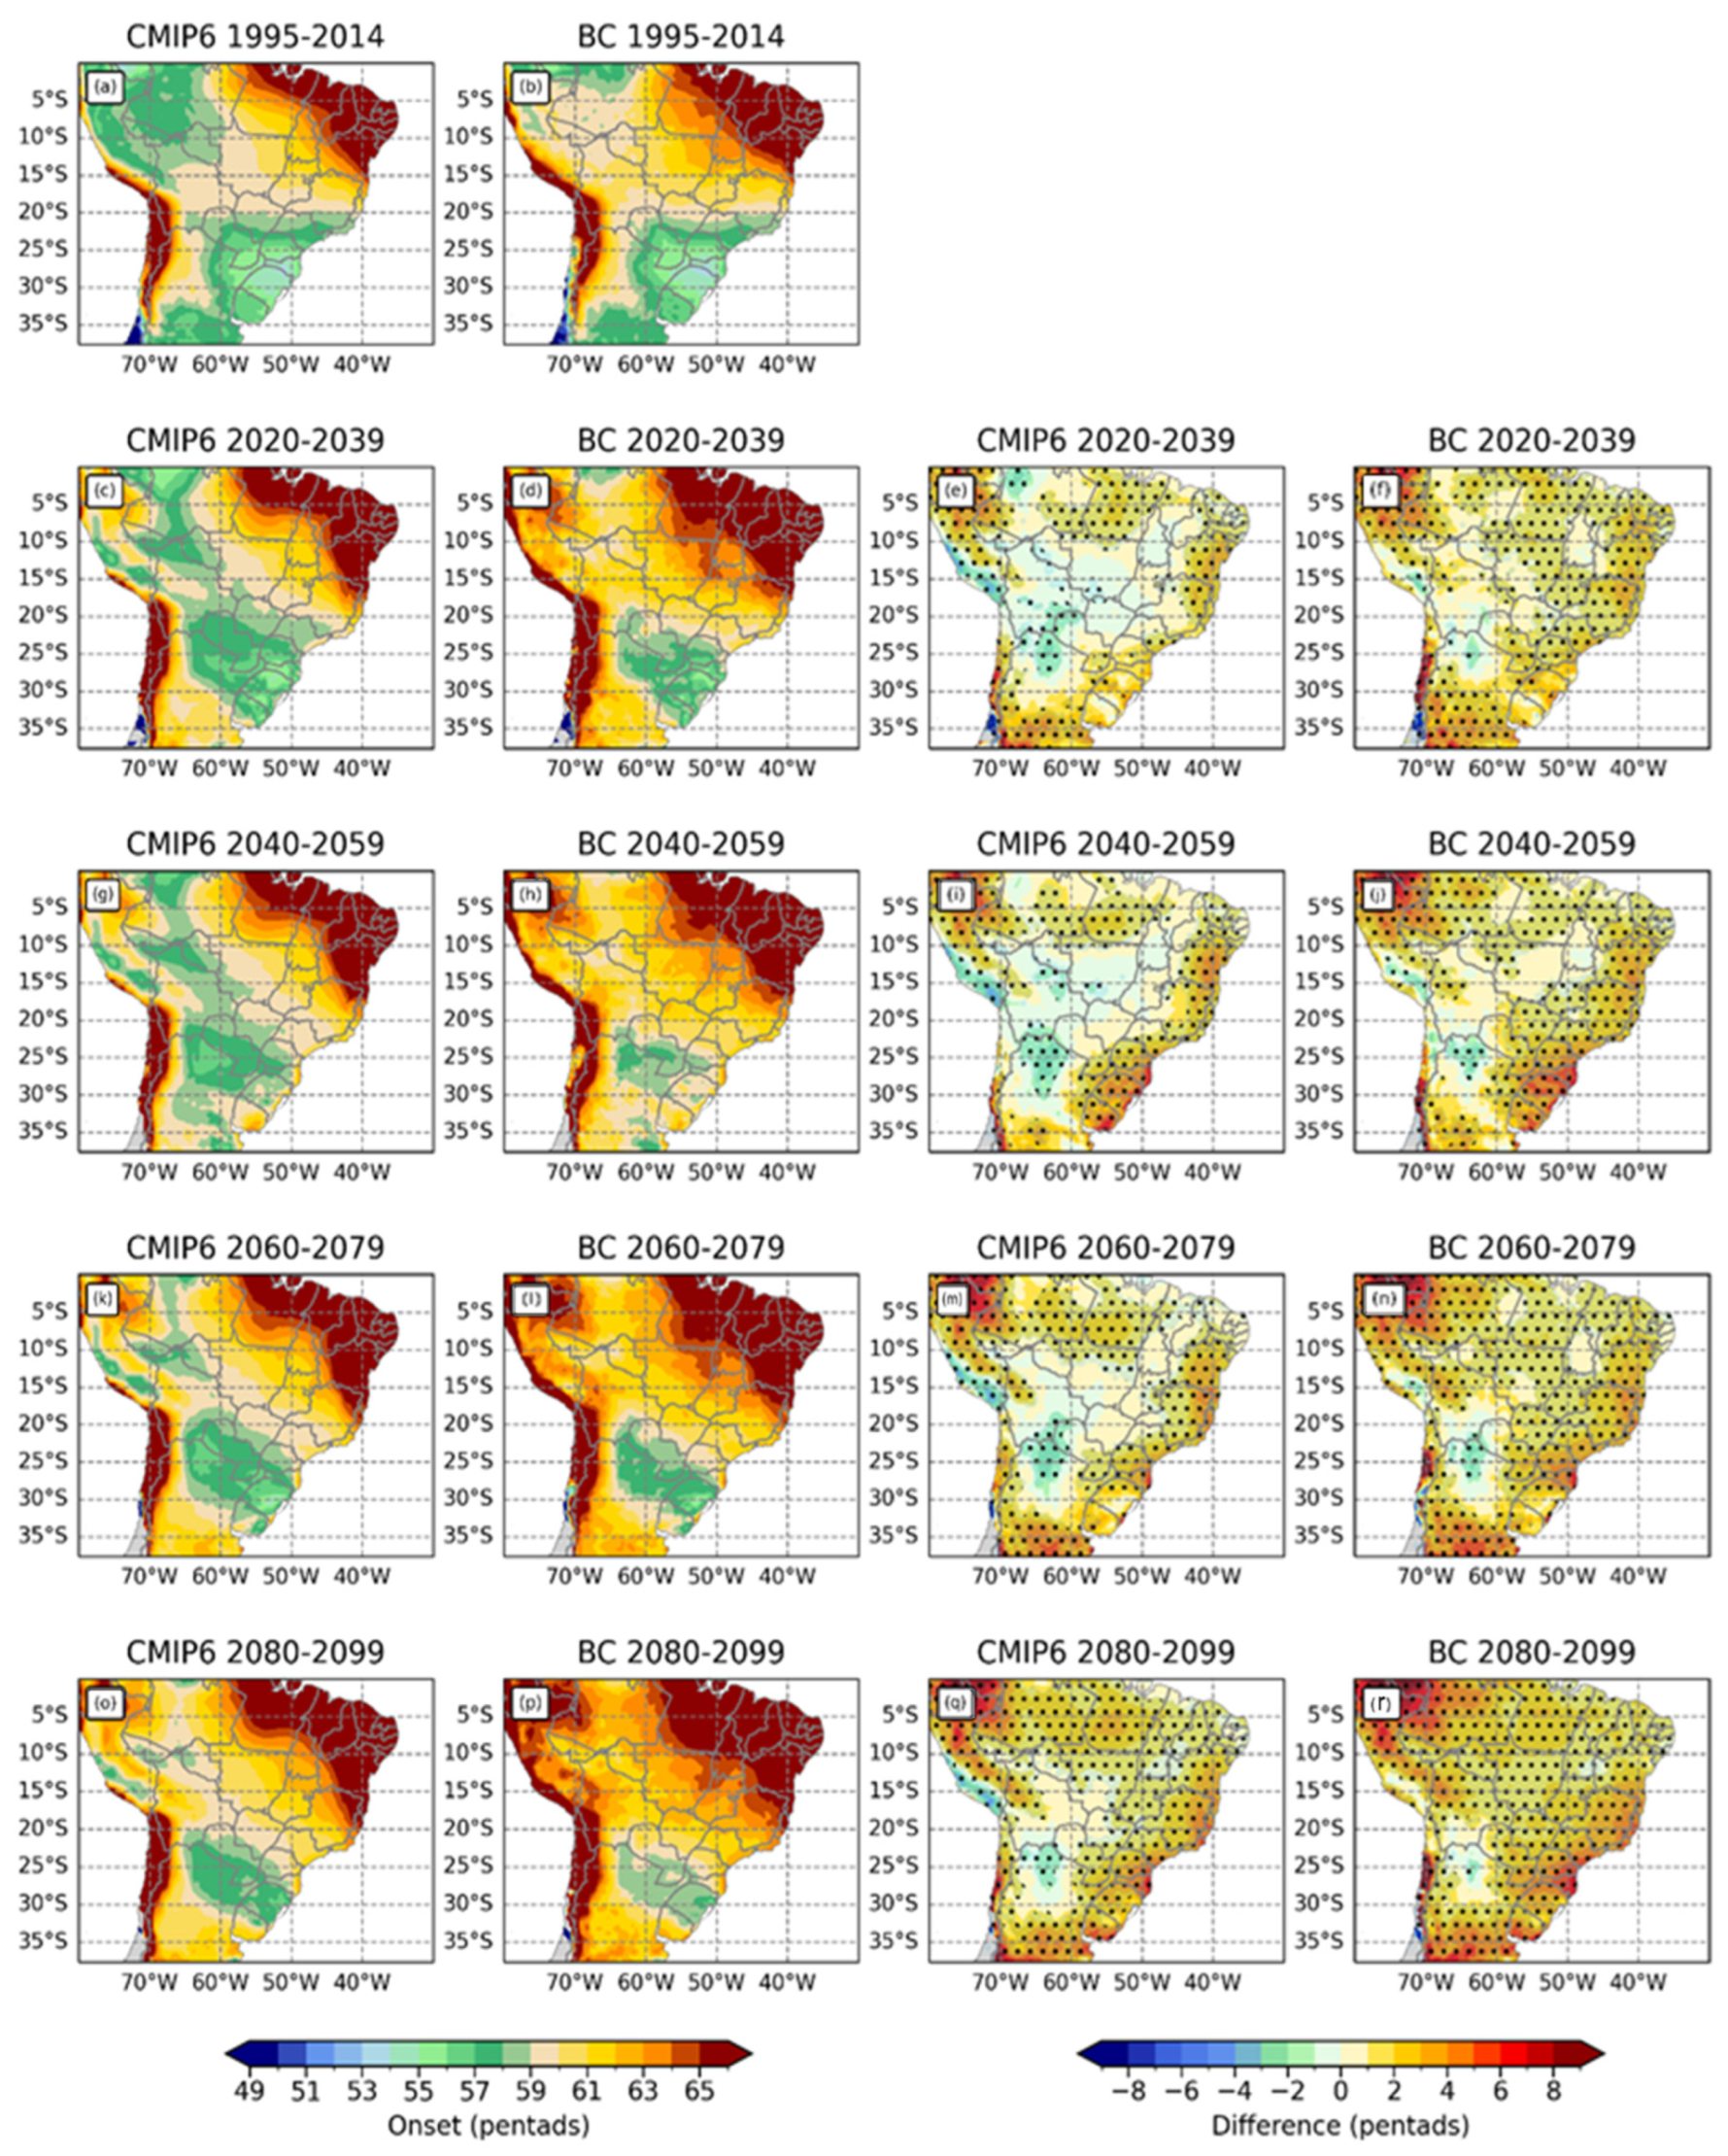
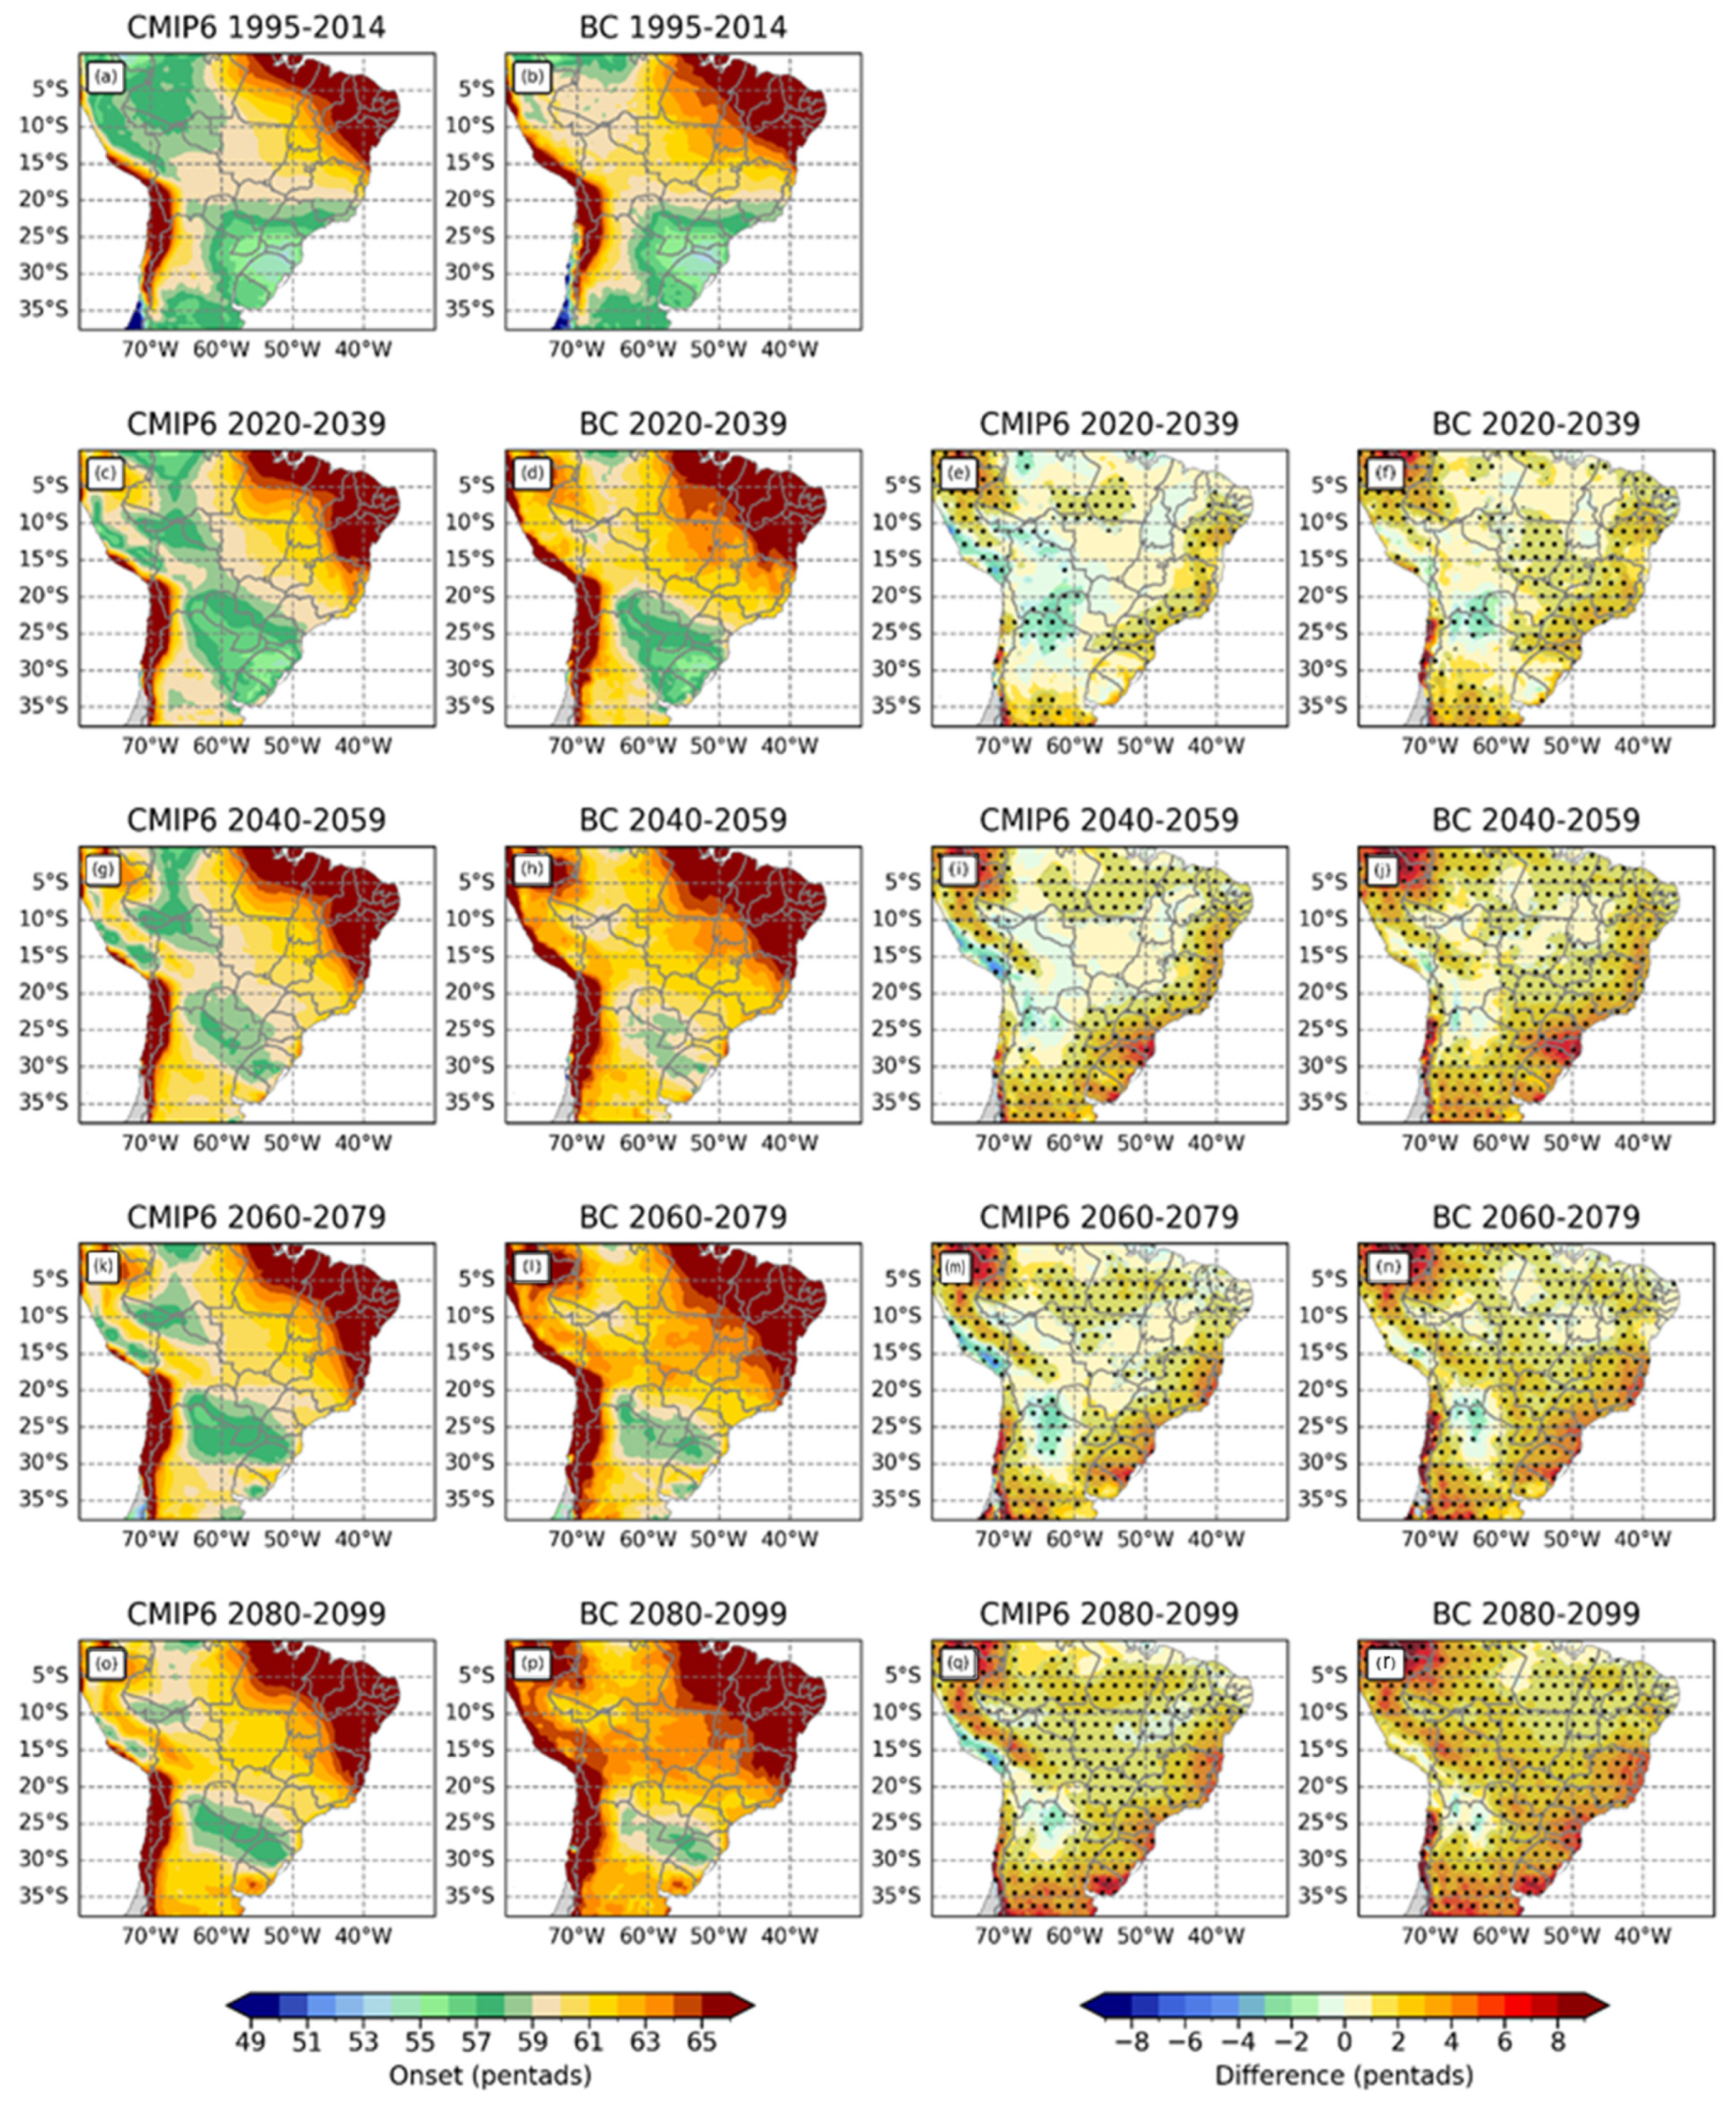
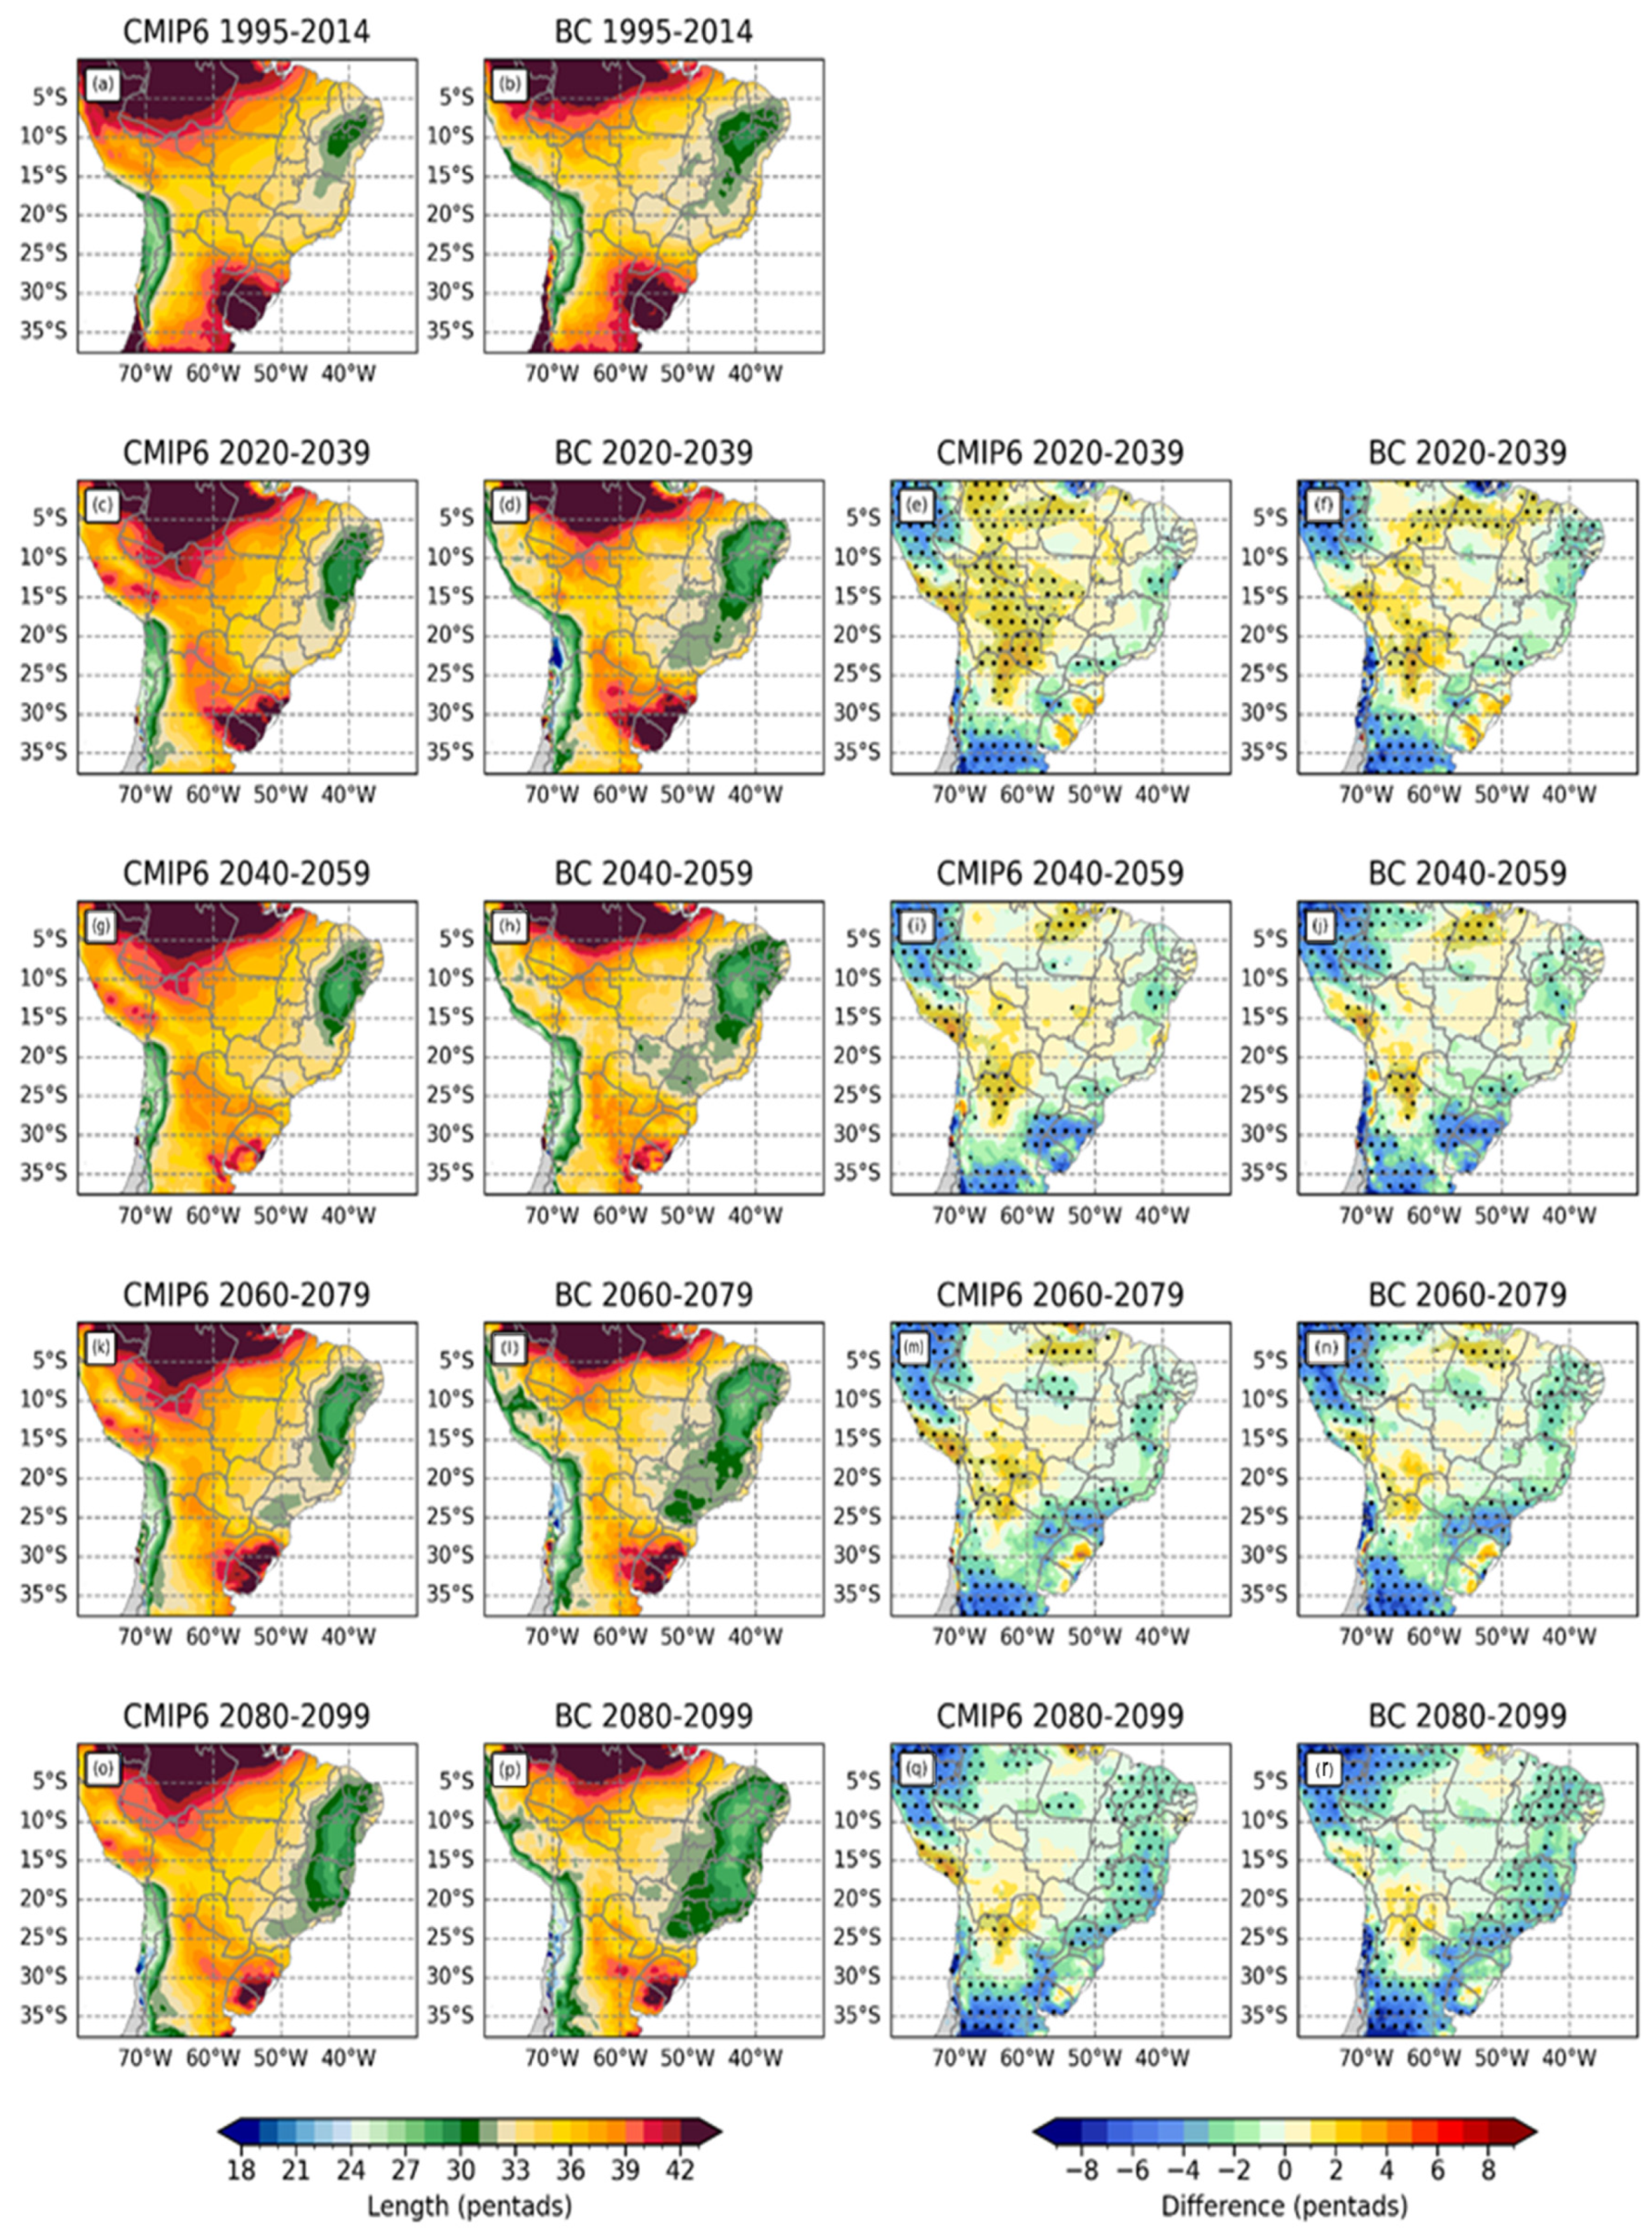
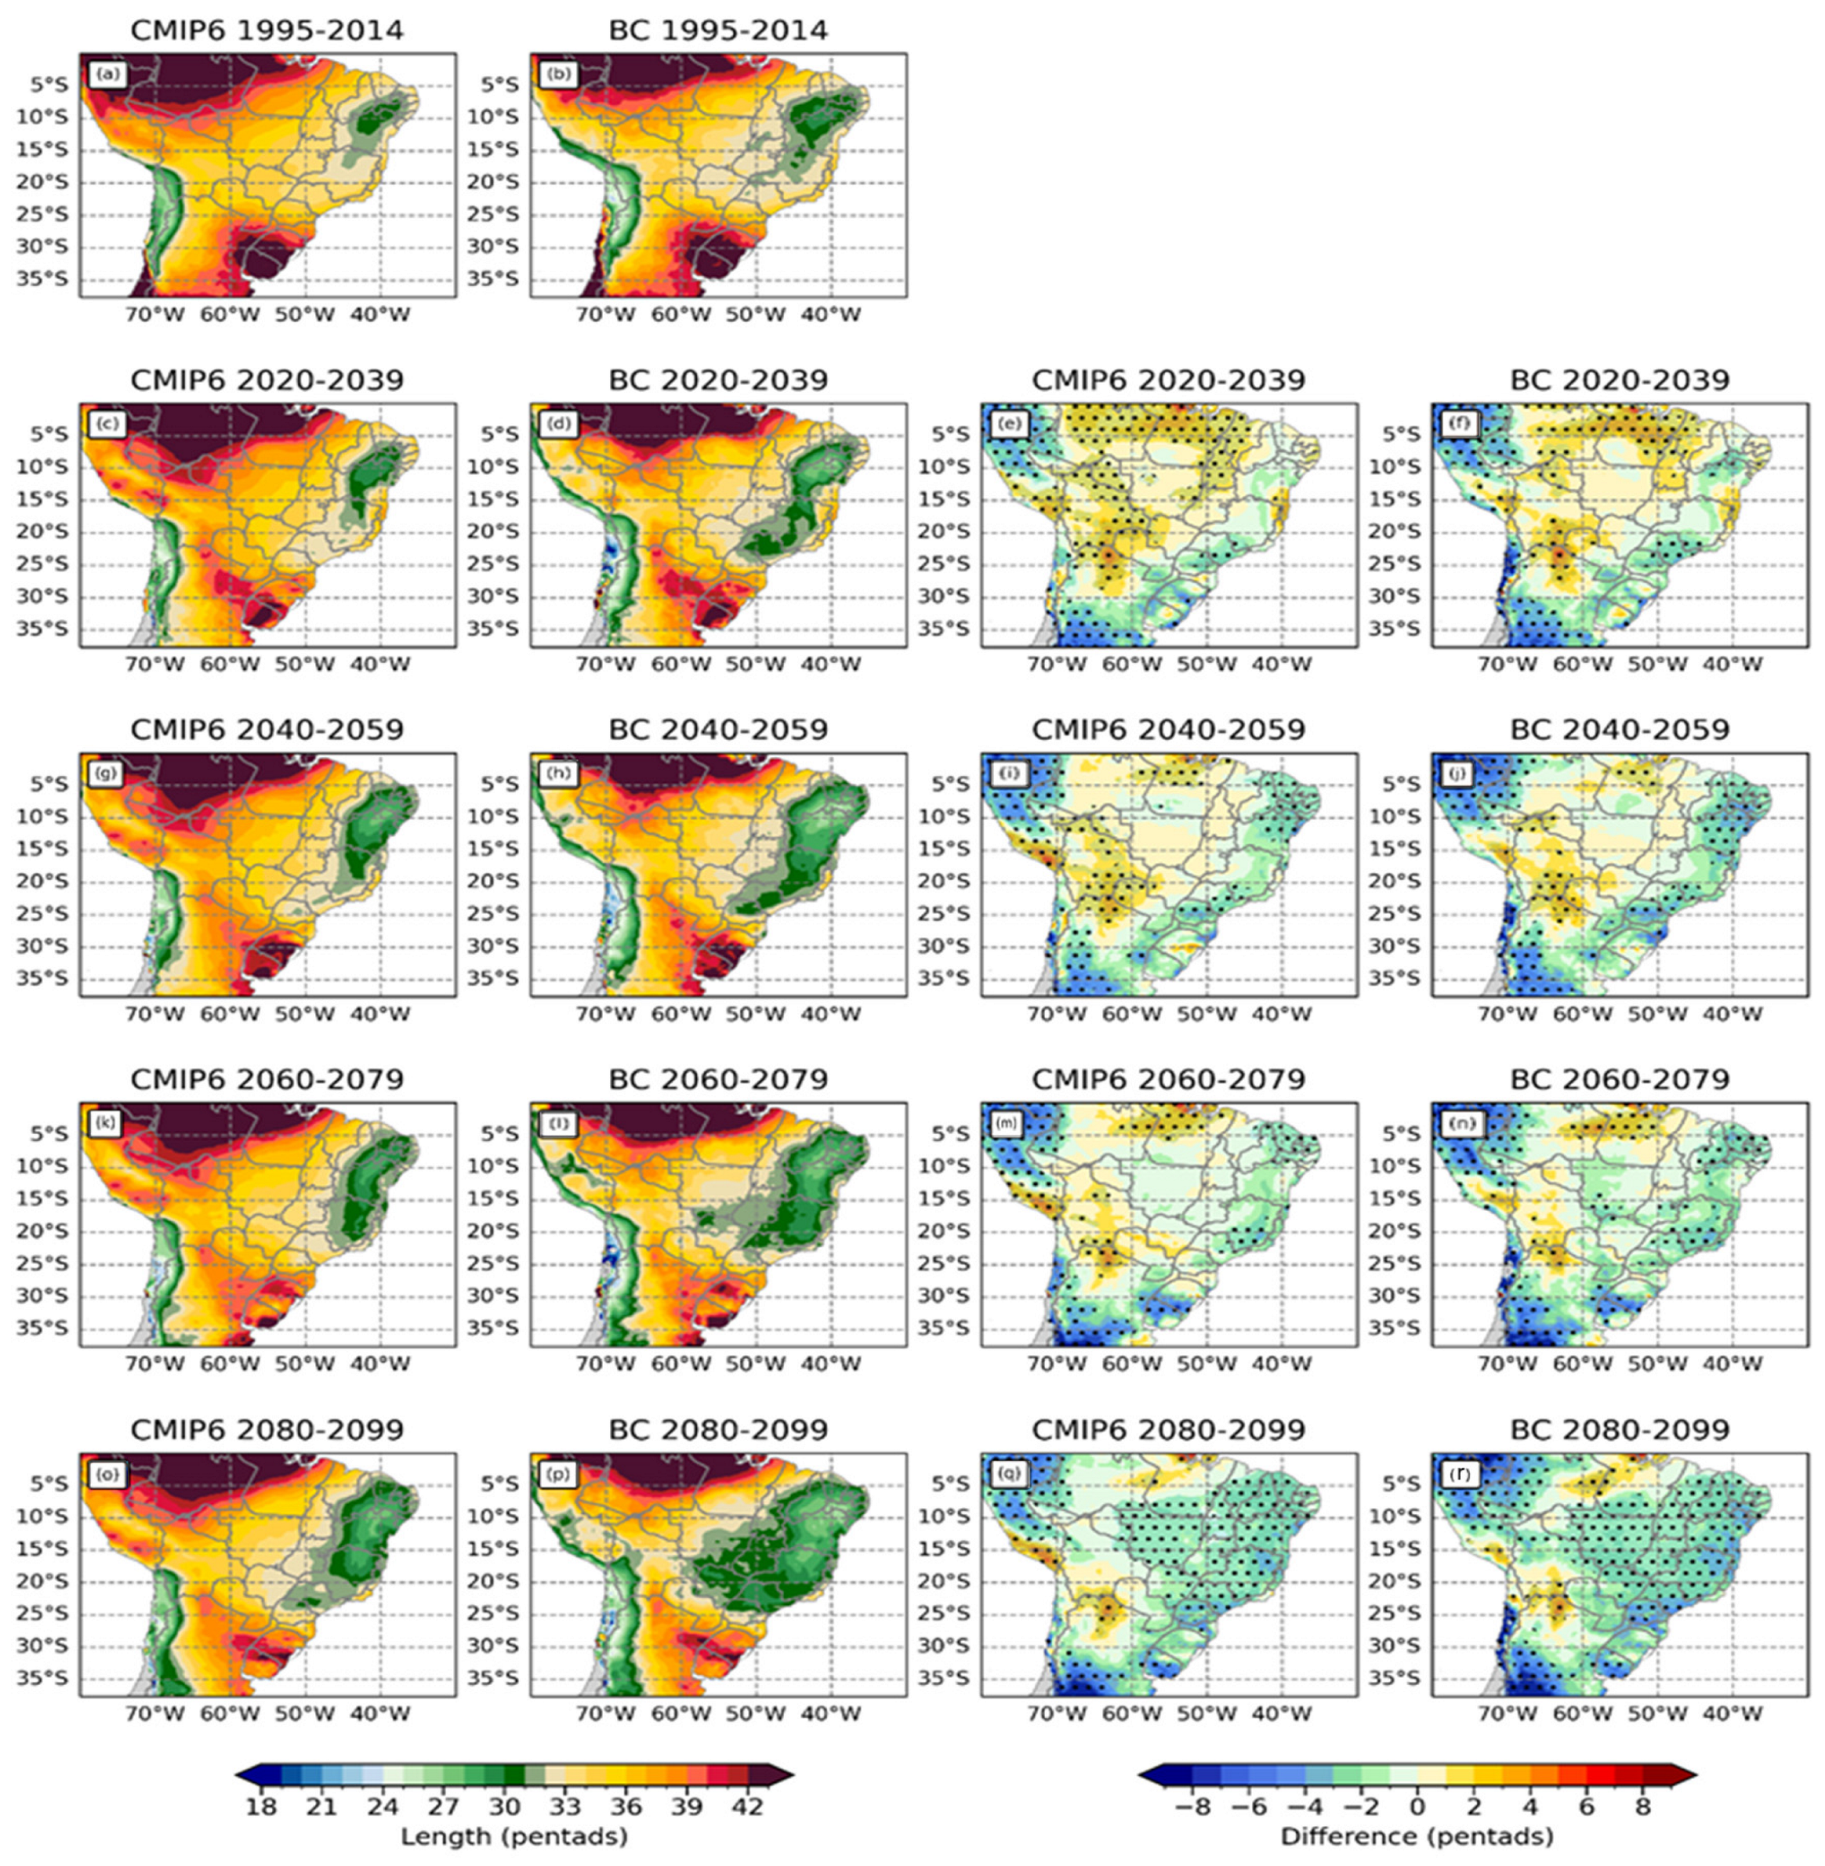
Figure 9, Figure 10, Figure 11, Figure 12, Figure 13 and Figure 14 present the projections of the rainy season’s onset, demise, and length under the SSP2–4.5 and SSP5–8.5 scenarios. Raw and BCSD ensembles, in both scenarios and in all time slices, project a delay in the onset of the rainy season, with a difference of approximately three pentads compared to the onset in the historical period in most of the study area (Figure 9 and Figure 10), reaffirming the results obtained with the dynamical downscaling of CMIP5 models [12]. Over northern Argentina, the monsoon is projected to have an earlier onset. The difference between the ensembles is that the raw ensemble shows an earlier onset over Midwest Brazil and Bolivia in the first three time slices, which BCSD does not project.
In both scenarios and ensembles, the demise of the rainy season (Figure 11 and Figure 12) is projected to delay northward 20° S, with a difference of around two pentads compared to the historical period, but only reaching statistical significance over Amazonia and western SA. Over northern Argentina, while the trend to the end of the century is to delay the demise under SSP2.4–5 (Figure 11), it is to anticipate it under SSP5.8–5 (Figure 12). An interesting signal appears in Midwest Brazil in the BCSD ensemble: under SSP2.4–5, a significant area with late demise spread over the region toward the end of the century, while under SSP5–8.5, from 2020–2039 to 2040–2060 the area decreases with statistical significance and returns to increasing towards the end of the century. Still, the SSP5–8.5 scenario indicates a more intense change signal in the monsoon demise, with a delay of three pentads in Brazilian Amazonia from the second half of the 21st century. Compared to the onset, the monsoon demise generally shows more uncertainties in scenarios and ensembles.
The projected trends of the SAMS onset and demise affect its length. For instance, over southeastern Brazil, there is a delay in the onset and the demise, but as the late onset is longer than the late demise, the monsoon’s length is projected to decrease (Figure 13 and Figure 14). On the other hand, over northern Argentina, the SAMS length is projected to increase. In general, in both scenarios and ensembles, the projection of a shorter SAMS lifecycle spreads in the area. This signal intensifies toward the end of the century, mainly under SSP5.8–5, which projects a reduction of up to three pentads compared to the historical period in most of Brazil and more significant reductions (approximately four pentads) in sectors of the eastern coast of the country (Figure 14). In a nutshell, the projections of the SAMS lifecycle indicate more intense changes in the BCSD ensemble toward the end of the century and under the SSP5–8.5 scenario.
Regarding the onset delay in the rainy season of SA, Ashfaq et al. [12] argue that this delay is directly related to the atmospheric dynamics of the pre-monsoon period. According to the authors, the main mechanisms causing the delay in the monsoon onset are the reduction in precipitation during the pre-monsoon period, the increase in the depth of the atmospheric boundary layer, and the decrease in the relative humidity or saturation level in the lower troposphere in regions where convective precipitation is suppressed during the period preceding the rainy season, which is in agreement with Fu and Li [14]. These factors are due to the progressive warming of the land surface in response to increased radiative forcing, leading to a greater partitioning of the surface energy flux toward sensible heating and an increase in the height of the atmospheric boundary layer, thus requiring an additional buoyancy force for the ascent of air parcels to their free convection level. Furthermore, future atmospheric warming increases the moisture necessary for the atmospheric boundary layer to become convectively unstable. These unfavorable changes in future atmospheric thermodynamics intensify atmospheric stability and reduce convective precipitation during the period preceding the rainy season.
Despite the projections suggesting a contraction of the SAMS lifecycle, an increase in precipitation volumes is also projected, indicating that more rainfall may be concentrated in shorter periods. Consequently, areas under the influence of the monsoon will be more vulnerable to episodes of extreme weather and climate events [92] and, hence, socio-environmental problems such as floods and land-slides in future scenarios. Moreover, changes in the temporal and spatial patterns of the rainy season in SA have numerous socio-economic impacts. For example, the effects on rainfed agriculture (non-irrigated, solely dependent on rainfall, such as sugarcane and corn) are notable, affected by the onset delay in the rainy season or drought conditions, resulting in reduced harvests and increased prices [98]. Additionally, the onset delay of the rainy season or variations in rainfall volumes interfere with the spread of vector-borne diseases (such as cholera, malaria, and dengue) [99]. It is also worth noting that the contraction of the rainy season combined with the increased rainfall volumes found here reinforces the future occurrence of extreme precipitation events in SA, as obtained in other studies [82,91,92,100,101], impacting hydroelectric power generation and the safety of vulnerable populations. In this context, the consequences of extreme rainfall events associated with SACZ are notable, responsible for around 47% of natural disasters in Southeast Brazil [102,103].

3.3. Time Series Analysis

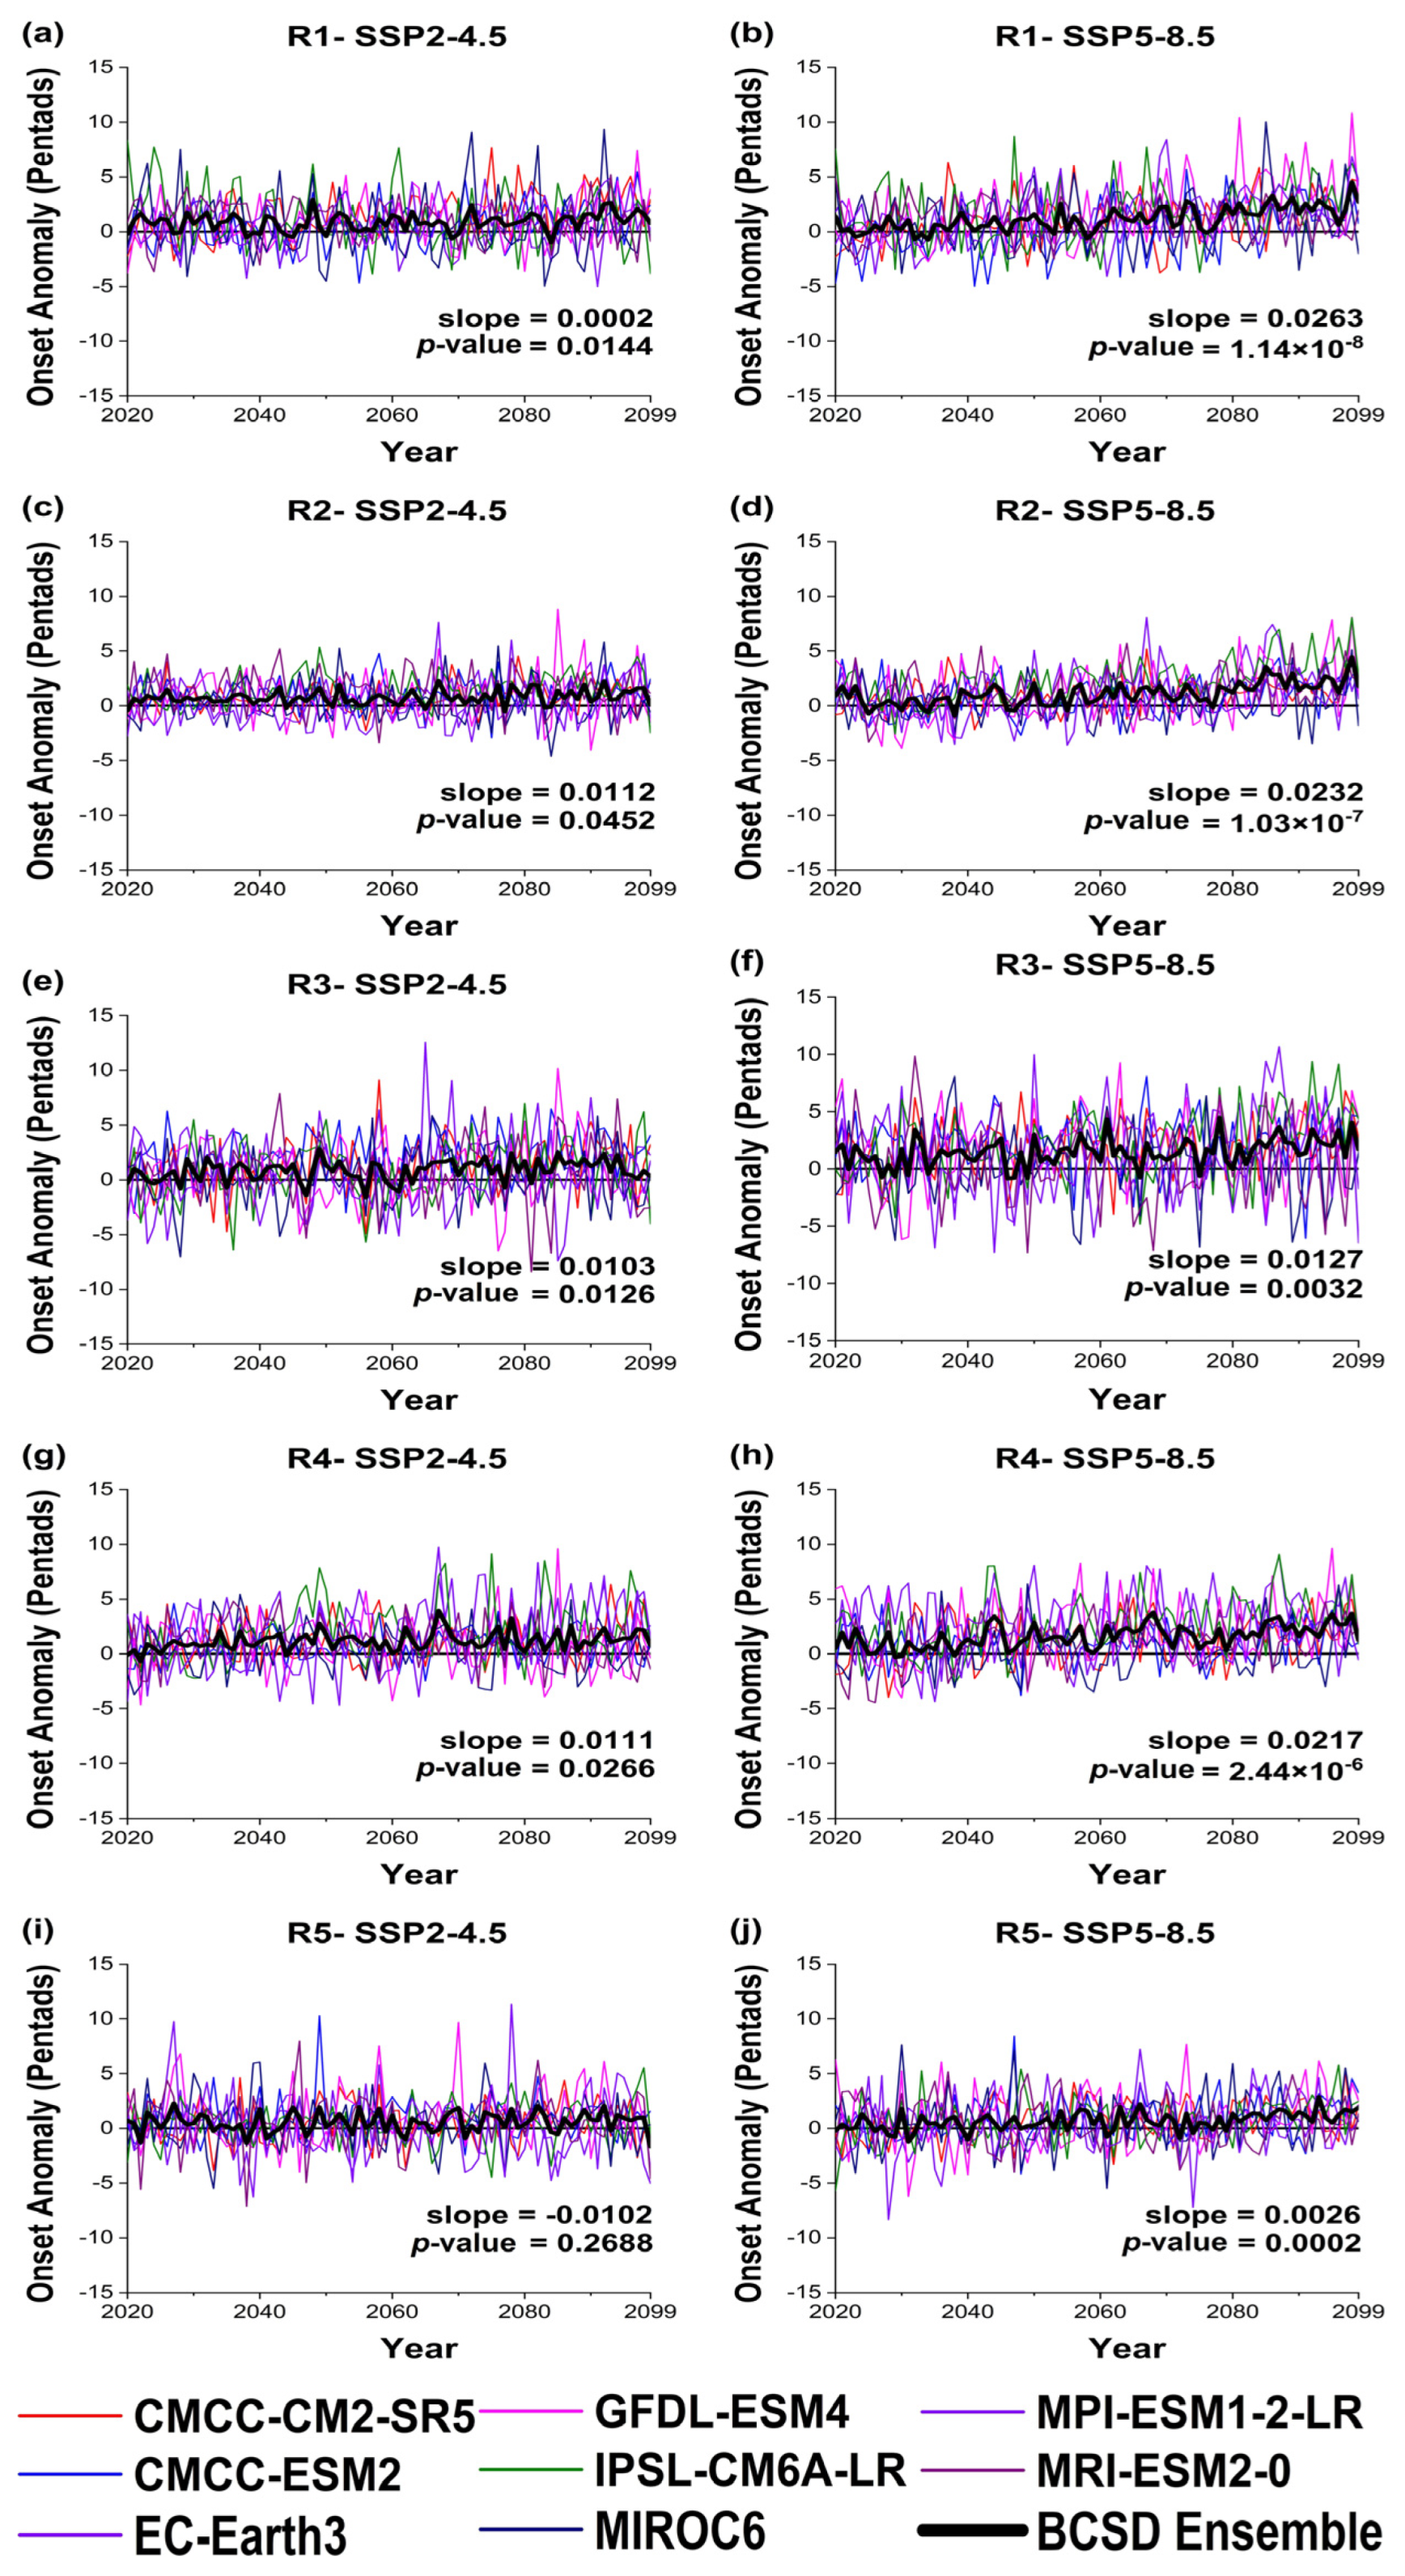
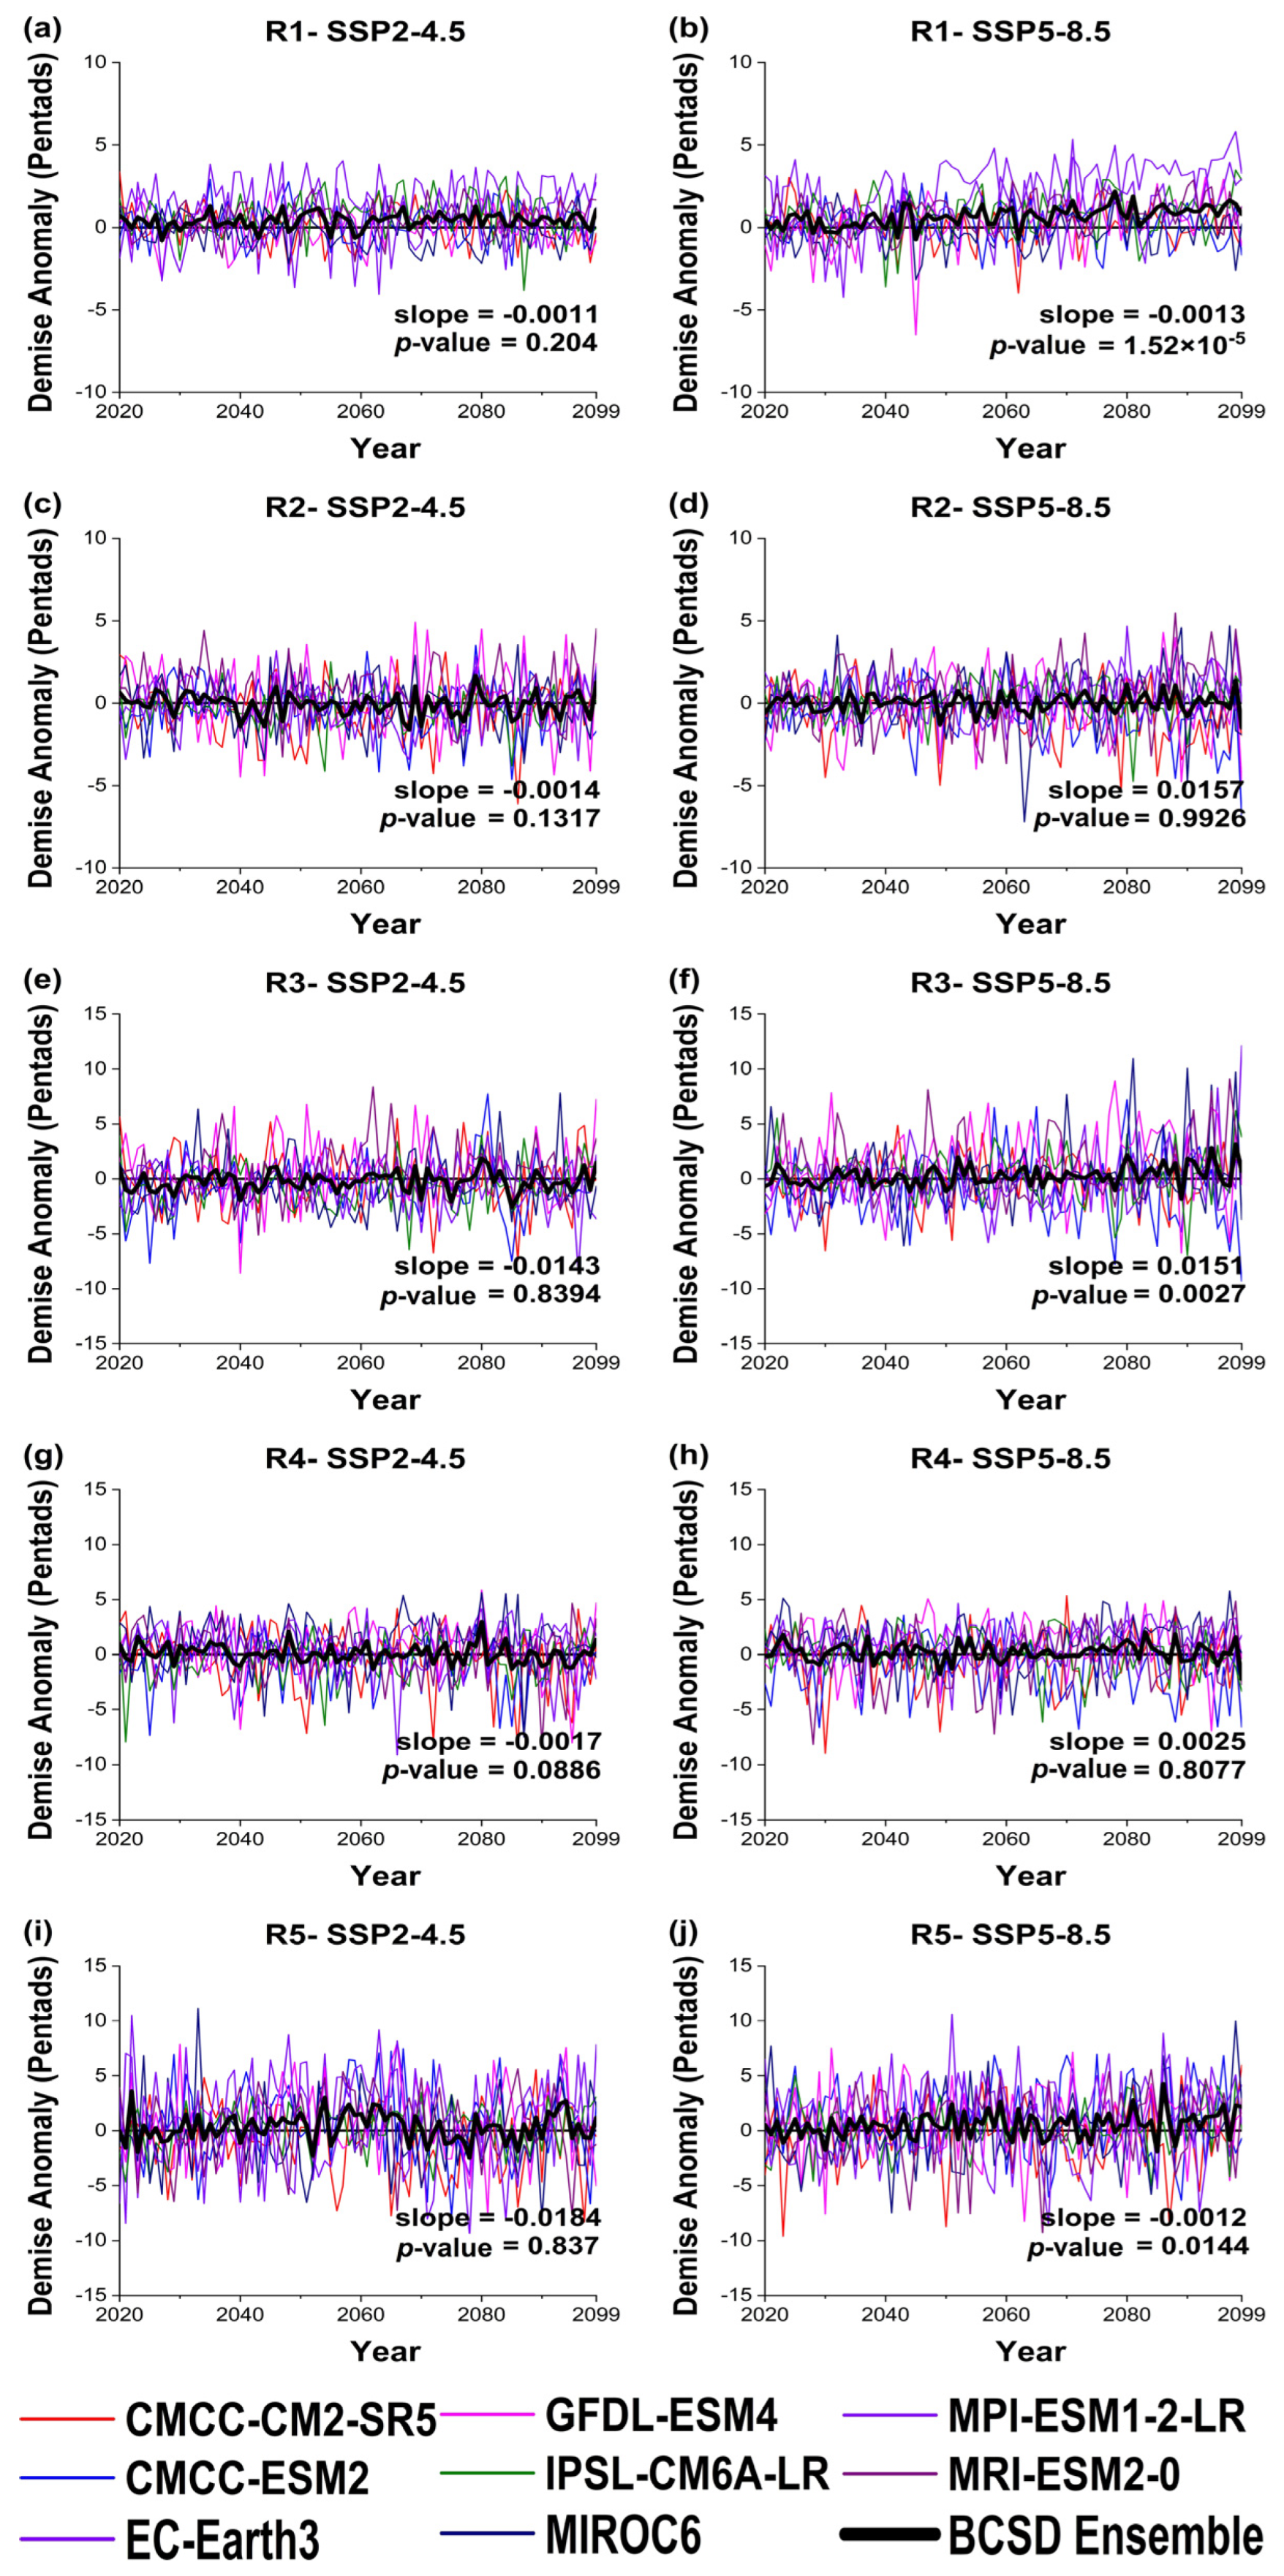
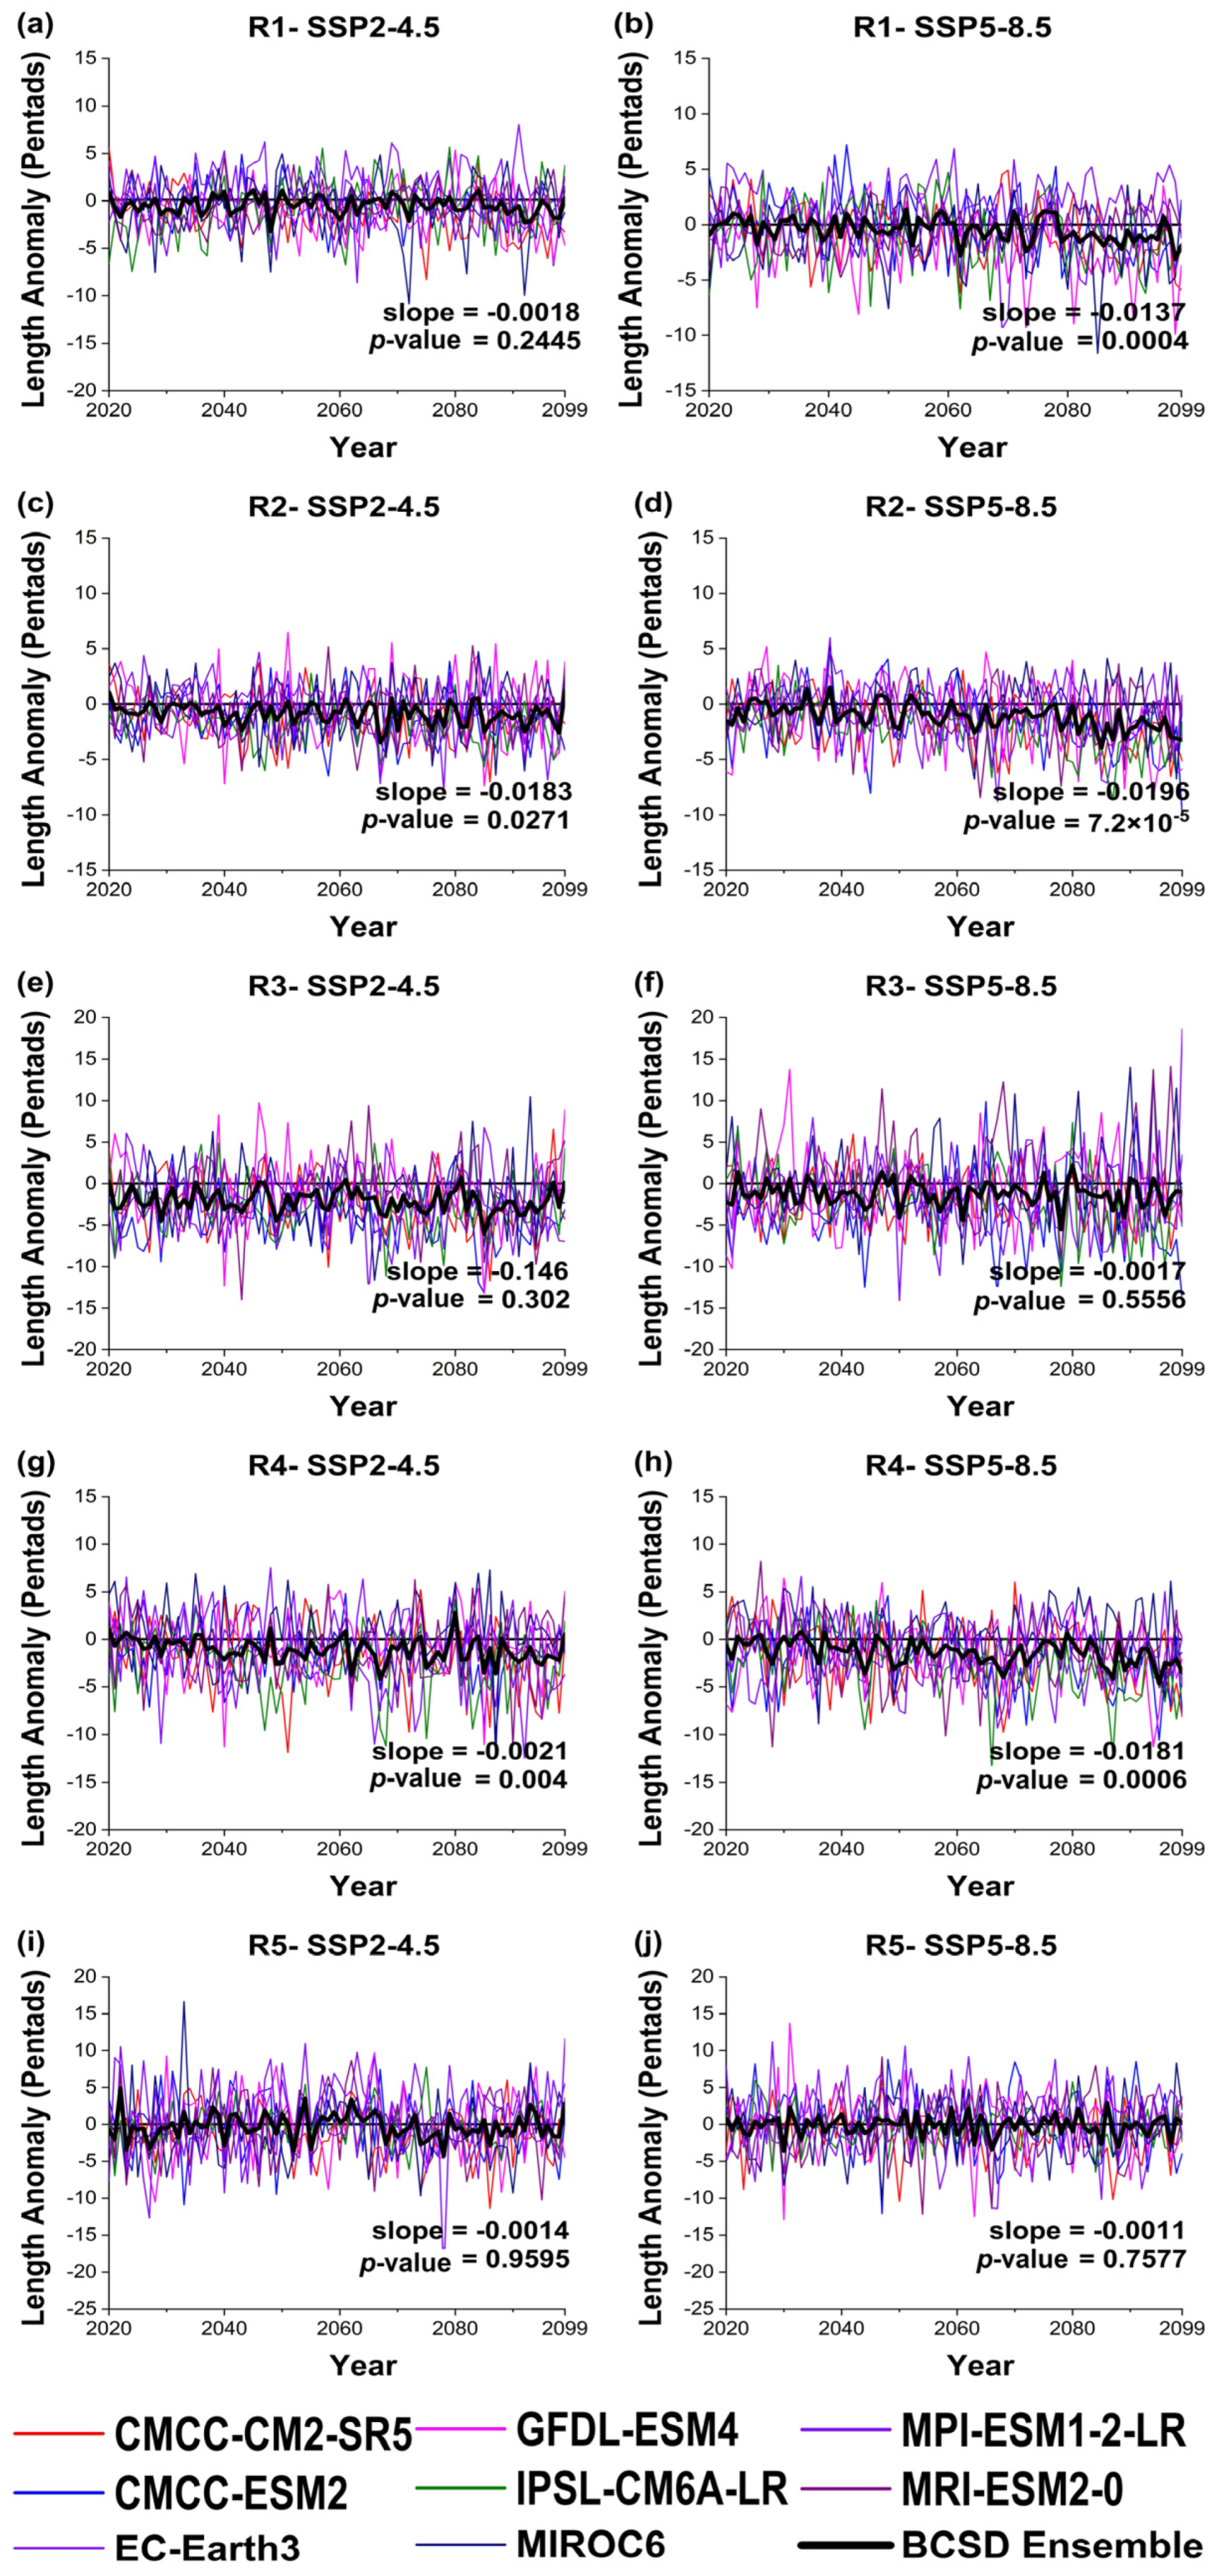
Figure 15, Figure 16 and Figure 17 present the BCSD time series (for both the individual GCMs and multimodel ensemble) of anomalies (in pentads) of the onset, demise, and length of SAMS for five subdomains of SA (Figure 1) under the SSP2–4.5 and SSP5–8.5 scenarios. In addition, Figures S1–S3 (Supplementary Materials) complement the information, showing the projections for the SAMS parameters. The time series shows the projected anomalies of the SAMS lifecycle parameters for 2020–2099 in relation to 1995–2014. Moreover, the results of the Mann–Kendall trend test for the BCSD ensemble projections (bold line) are shown, indicating whether the resulting trends are statistically significant (p-value < 0.05). In addition, Sen’s slopes indicate whether the trends are positive (slope > 0) or negative (slope < 0).
For R1 (Amazonia), the ensemble projects an increase in the onset of the SAMS with statistical significance under both scenarios, which means a regional delay in the monsoon beginning. The ensemble generally shows changes from the SAMS onset ranging from −1 to 5 pentads. On the other hand, the individual models indicate considerable spread in the projections, with the CMCC-ESM2, GFDL-ESM4, and MIROC6 models providing monsoon onset shifts ranging from −5 to 11 pentads. Under the SSP2–4.5 scenario, the ensemble indicates the monsoon onset ranging from Pentads 58–62 (13–17 October to 2–6 November), which is partially similar to the ranges found in the reference periods of other studies [10,12,92]. Under the SSP5–8.5 scenario, the ensemble indicates a larger delay in the SAMS onset, which varies in Pentads 59–64 (18–22 October to 12–16 November), corroborating the results of previous studies [12,92].
Considering the projected changes in the SAMS demise in R1, only the SSP5–8.5 scenario results in a statistically significant increasing trend projected by the BCSD ensemble. While the ensemble projects the monsoon’s demise changes ranging from −1 to 2 pentads, models such as EC-Earth3, GFDL-ESM4, and MPI-ESM1-2-LR provide anomalies ranging from −7 to 6 pentads. Despite this result suggesting an increase in the rainy season in R1, the analysis of the SAMS length shows that, under the SSP5–8.5 scenario, the ensemble projects a statistically significant decrease, with anomalies ranging from −3 to 1 pentad in relation to the historical period.
Moreover, the results found here agree with projections obtained by dynamical downscaling, which yielded a delay of one pentad at the monsoon’s beginning and a reduction of up to two pentads in the duration for the period 2010–2040 [11]. Additionally, a study of the impacts of land use on the monsoon lifecycle in southern Amazonia indicated that deforestation has contributed to a delay of approximately 1 pentad at the beginning, an advance of 2 to 6 pentads at the demise, and a reduction of 2 to 8 pentads in the duration of the rainy season for the period 1998–2012 [104].
In R2 (Midwest Brazil), under both scenarios, the BCSD ensemble projects a statistically significant increase in the monsoon onset, which means a delay in the rainy season beginning over the region. In this sector, the ensemble presents onset anomalies ranging from −1 to 4 pentads, while other models, such as EC-Earth3 and GFDL-ESM4, project variations from −4 to 9 pentads. The BCSD ensemble projections of the rainy season demise in R2 do not result in statistically significant trends in both scenarios. On the other hand, the ensemble provides a statistically significant decreasing trend in the SAMS length in both scenarios, indicating a retraction in the rainy season over R2 during the 21st century. In this region, the ensemble projects anomalies of the monsoon’s length ranging from −4 to 1 pentad, while models like CMCC-ESM2, EC-Earth3, and GFDL-ESM4 project anomalies from −10 to 6 pentads.
For R3 (Southeast Brazil), the ensemble projections result in statistically significant increasing trends in the monsoon onset for both scenarios, indicating that the rainy season’s beginning tends to be delayed over the region during the 21st century. While the ensemble projects anomalies of SAMS onset ranging from −1 to 4 pentads, models such as EC-Earth3, MPI-ESM1-2-LR, and MRI-ESM2-0 estimate changes going from −7 to 11 pentads. Regarding the monsoon demise, the ensemble projects a statistically significant increasing trend only under the SSP5–8.5 scenario, with anomalies ranging from −2 to 3 pentads. For the monsoon’s length projections, neither of the two scenarios results in a statistically significant trend, with the BCSD ensemble providing anomalies of −6 to 2 pentads about the reference period.
In R4 (northern sector of Southeast Brazil), the ensemble projects a statistically significant increase in the monsoon onset under both scenarios, reiterating the delay in the SAMS onset also found in other regions. In this sector, the ensemble shows onset anomalies ranging from 0 to 4 pentads, while models like GFDL-ESM4 and MPI-ESM1-2-LR provide changes from −4 to 10 pentads. The ensemble projections do not result in a statistically significant trend in either scenario regarding the monsoon demise. On the other hand, under the two scenarios, the ensemble projects a statistically significant reduction in the rainy season’s length, with anomalies ranging from −5 to 1 pentad.
Finally, in R5 (northern Argentina), the ensemble only projects a statistically significant increasing trend in the monsoon onset under the SSP5–8.5 scenario. In this region, the ensemble provides anomalies ranging from −1 to 3 pentads, while models such as GFDL-ESM4 and MPI-ESM1-2-LR project anomalies ranging from −8 to 8 pentads. Similarly, for the monsoon demise, the ensemble projects a statistically significant increasing trend only under the SSP5–8.5 scenario, with anomalies ranging from −2 to 4 pentads. On the other hand, neither scenario indicates a statistically significant trend in the monsoon’s length, with the ensemble providing anomalies ranging from −4 to 3 pentads.
In general, the trend analysis shows that the BCSD ensemble projects a delay in the monsoon onset in practically all regions analyzed under the two scenarios employed (except in R5, where only the SSP5–8.5 scenario results in an increasing trend). Contrastingly, the ensemble projections for the SAMS demise provide statistically significant increasing trends only under the SSP5–8.5 scenario and for sectors R1, R3, and R5. Furthermore, the ensemble projections show a statistically significant decreasing trend in monsoon length in the regions R2 and R4 under both scenarios and in R1 only under the SSP5–8.5 scenario. Similarly, a study of deforestation effects in southern Amazonia showed that almost 90% of rainfall gauges in the transition zone between Amazonia and Midwest Brazil showed a decreasing monsoon length from 1971 to 2010, with a later onset and early demise [105].
Regarding the individual projections of the GCMs, there is considerable variability of estimates in all regions. In this context, the GFDL-ESM4 and EC-Earth3 models show significant variability in the SAMS lifecycle parameters in practically all sectors evaluated. In summary, these results suggest that, under both scenarios, the monsoon onset tends to be delayed, but its demise is almost unchanged. Additionally, most evaluated sectors tend to decrease the rainy season’s length during the 21st century.

4. Conclusions

This study applied statistical downscaling to CMIP6 precipitation projections using the CPC data as a reference to evaluate future changes in the monsoon lifecycle and precipitation in SA. To this end, we used the QDM technique developed by Cannon et al. [65], and the method improved the representation of the monsoon onset west of 60°W, as well as the demise and length in southwestern Amazonia. Projections of precipitation showed an increase in rainfall in SESA and a reduction in the Amazonia region during the 21st century, in agreement with previous studies.
Raw and BCSD ensembles, in both scenarios and in all time slices, project a delay in the monsoon onset, with a difference of approximately three pentads compared to the onset in the historical period in most of the study area. Similarly, in both scenarios, the monsoon demise is projected to delay northward 20° S, with a difference of around two pentads compared to the historical period, although this exhibits statistical significance only over Amazonia and western SA. Furthermore, the SSP5–8.5 scenario indicates a more intense change signal in the monsoon demise, with a delay of three pentads in the Brazilian Amazon from the second half of the 21st century.
Additionally, the trend analysis shows that the BCSD ensemble projects a delay in the monsoon onset in practically all regions analyzed under the two scenarios assessed. Moreover, the ensemble projections show a statistically significant decreasing trend in the monsoon’s length in most SACZ regions.
For future studies, we recommend using more forcing scenarios to minimize the uncertainties associated with the projections. Moreover, despite the statistical downscaling technique refining the grid of projections (yielding estimates with an intermediate spatial resolution of 50 km), further research should employ finer climate projections to ensure a greater accuracy. But, for this end, observed data in high resolution are needed. This remains a gap and the subject of much discussion by the scientific community (few monitoring stations, data quality, data availability etc.). Nonetheless, despite the uncertainties associated with projections, our findings can provide helpful information to decision-makers and energy planners for the better management of water resources on the South American continent over the coming decades.

Supplementary Materials

The following supporting information can be downloaded at: https://www.mdpi.com/article/10.3390/atmos14091380/s1, Table S1: Results of the computation of SAMS lifecycle parameters for R1 obtained here (shaded line) compared to previous works; Table S2: Results of the computation of SAMS lifecycle parameters for R3 obtained here (shaded line) compared to previous works; Table S3: Results of the computation of SAMS lifecycle parameters for R4 obtained here (shaded line) compared to previous works; Table S4: Results of the computation of SAMS lifecycle parameters for R5 obtained here (shaded line) compared to previous works; Figure S1: Time series of the monsoon onset (in pentads) provided by eight CMIP6-GCMs and the BCSD ensemble for five SA subdomains under the SSP2–4.5 and SSP5–8.5 scenarios; Figure S2: Similar to Figure S1, except for the monsoon demise (in pentads); Figure S3: Similar to Figure S1, except for the monsoon’s length (in pentads).

Author Contributions

Conceptualization, M.S.R.; methodology, M.S.R.; software, M.S.R., G.W.d.S.F. and J.G.M.R.; formal analysis, M.S.R. and G.W.d.S.F.; writing—original draft preparation, M.S.R. and G.W.d.S.F.; writing—review and editing, M.S.R., G.W.d.S.F., J.G.M.R., R.P.d.R. and V.B.R. All authors have read and agreed to the published version of the manuscript.

Funding

The authors thank the Coordination for the Improvement of Higher Education Personnel (CAPES, Finance Code 001), the National Council for Scientific and Technological Development (CNPq), and the R&D project from Engie Brazil Energy (R&D-00403-0054/2022) regulated by the Brazilian National Electric Energy Agency (ANEEL).

Institutional Review Board Statement

Not applicable.

Informed Consent Statement

Not applicable.

Data Availability Statement

All datasets used in this study are available on public online databases. BCSD models can be provided upon request.

Acknowledgments

The authors thank the Coordination for the Improvement of Higher Education Personnel (CAPES), the Brazilian National Electric Energy Agency (ANEEL), the National Council for Scientific and Technological Development (CNPq), and Engie Brazil Energy for their financial support. The authors also thank the Coupled Model Intercomparison Project (CMIP) and Climate Prediction Center (NOAA–CPC) for providing the datasets used in this study.

Conflicts of Interest

The authors declare no conflict of interest. The funders had no role in the design of the study; in the collection, analyses, or interpretation of the data; in the writing of the manuscript; or in the decision to publish the results.

References

  1. Ramage, C.S. Monsoon Meteorology, 1st ed.; Academic Press: New York, NY, USA, 1971. [Google Scholar]
  2. Wang, B.; Liu, J.; Kim, H.-J.; Webster, P.J.; Yim, S.-Y. Recent change of the global monsoon precipitation (1979–2008). Clim. Dyn. 2012, 39, 1123–1135. [Google Scholar] [CrossRef]
  3. Grimm, A.M.; Dominguez, F.; Cavalcanti, I.F.; Cavazos, T.; Gan, M.A.; Silva Dias, P.L.; Fu, R.; Castro, C.; Hu, H.; Barreiro, M. South and North American Monsoons: Characteristics, life cycle, variability, modeling, and prediction. In The Multiscale Global Monsoon System, 4th ed.; Chang, C.-P., Ha, K.-J., Johnson, R.H., Kim, D., Lau, G.N.C., Wang, B., Eds.; World Scientific: Singapore, 2020; pp. 49–66. [Google Scholar] [CrossRef]
  4. Teodoro, T.A.; Reboita, M.S.; Llopart, M.; da Rocha, R.P.; Ashfaq, M. Climate change impacts on the South American Monsoon System and its surface-atmosphere processes through RegCM4 CORDEX-CORE projections. Earth Syst. Environ. 2021, 5, 825–847. [Google Scholar] [CrossRef]
  5. Silva, V.B.; Kousky, V.E. The South American monsoon system: Climatology and variability. Modern Climatol. 2012, 123, 152. [Google Scholar] [CrossRef]
  6. Carvalho, L.M.V.; Cavalcanti, I.F.A. The South American Monsoon System (SAMS). In The Monsoons and Climate Change, 1st ed.; Carvalho, L.M.V., Jones, C., Eds.; Springer: Sydney, Australia, 2016; pp. 121–148. [Google Scholar]
  7. Liebmann, B.; Marengo, J.A. Interannual variability of the rainy season and rainfall in the Brazilian Amazon Basin. J. Clim. 2001, 14, 4308–4318. [Google Scholar] [CrossRef]
  8. Vera, C.; Higgins, W.; Amador, J.; Ambrizzi, T.; Garreaud, R.; Gochis, D.; Gutzler, D.; Lettenmaier, D.; Marengo, J.A.; Mechoso, C.R.; et al. Toward a unified view of the American Monsoon Systems. J. Clim. 2006, 19, 4977–5000. [Google Scholar] [CrossRef]
  9. Gan, M.A.; Kousky, V.; Ropelewski, C.F. The South America monsoon rainfall over West-Central Brazil. J. Clim. 2004, 17, 47–66. [Google Scholar] [CrossRef]
  10. Bombardi, R.J.; Carvalho, L.M.V. IPCC global coupled model simulations of the South America monsoon system. Clim. Dyn. 2009, 33, 893–916. [Google Scholar] [CrossRef]
  11. Reboita, M.S.; da Rocha, R.P.; Dias, C.G.; Ynoue, R.Y. Climate projections for South America: RegCM43 driven by HadCM3 and ECHAM5. Adv. Meteorol. 2014, 2014, 376738. [Google Scholar] [CrossRef]
  12. Ashfaq, M.; Cavazos, T.; Reboita, M.S.; Torres-Alavez, J.A.; Im, E.-S.; Olusegun, C.F.; Alves, L.; Key, K.; Adeniyi, M.O.; Tall, M.; et al. Robust late twenty-first century shift in the regional monsoons in RegCM-CORDEX simulations. Clim. Dyn. 2021, 57, 1463–1488. [Google Scholar] [CrossRef]
  13. Kousky, V.E. Pentad outgoing longwave radiation climatology for the South American sector. Rev. Bras. Meteorol. 1988, 3, 217–231. [Google Scholar]
  14. Fu, R.; Li, W. The influence of the land surface on the transition from dry to wet season in Amazonia. Theor. Appl. Climatol. 2004, 78, 97–110. [Google Scholar] [CrossRef]
  15. Dias, C.G.; Reboita, M.S.; da Rocha, R.P.; Cuadra, S.V. Validação dos Fluxos Turbulentos de Calor sobre a América do Sul Simulados pelo RegCM3. In IV Simpósio Internacional de Climatologia; SIC: João Pessoa, Brazil, 2011. [Google Scholar]
  16. Carvalho, L.M.V.; Jones, C.; Liebmann, B. The South Atlantic Convergence Zone: Intensity, form, persistence, and relationships with intraseasonal to interannual activity and extreme rainfall. J. Clim. 2004, 17, 88–108. [Google Scholar] [CrossRef]
  17. Gonzalez, P.L.M.; Vera, C.S. Summer precipitation variability over South America on long and short intraseasonal timescales. Clim. Dyn. 2014, 43, 1993–2007. [Google Scholar] [CrossRef]
  18. Bombardi, R.J.; Carvalho, L.M.V.; Jones, C.; Reboita, M.S. Precipitation over eastern South America and the South Atlantic sea surface temperature during neutral ENSO periods. Clim. Dyn. 2014, 42, 1553–1568. [Google Scholar] [CrossRef]
  19. Grimm, A.M. South American monsoon and its extremes. In Tropical Extremes-Natural Variability and Trends, 1st ed.; Venugopal, V., Sukhatme, J., Murtugudde, R., Roca, R., Eds.; Elsevier: Amsterdam, The Netherlands, 2019; pp. 51–93. [Google Scholar] [CrossRef]
  20. Avila-Diaz, A.; Benezoli, V.; Justino, F.; Torres, R.R.; Wilson, A. Assessing current and future trends of climate extremes across Brazil based on reanalyses and earth system model projections. Clim. Dyn. 2020, 55, 1403–1426. [Google Scholar] [CrossRef]
  21. Cai, W.; McPhaden, M.J.; Grimm, A.M.; Rodrigues, R.R.; Taschetto, A.S.; Garreaud, R.D.; Dewitte, B.; Poveda, G.; Ham, Y.G.; Santoso, A.; et al. Climate impacts of the El Niño-Southern Oscillation on South America. Nat. Rev. Earth Environ. 2020, 1, 215–231. [Google Scholar] [CrossRef]
  22. Reboita, M.S.; Ambrizzi, T.; Crespo, N.M.; Dutra, L.M.M.; Ferreira, G.W.S.; Rehbein, A.; Drumond, A.; da Rocha, R.P.; Souza, C.A. Impacts of teleconnection patterns on South America climate. Ann. N. Y. Acad. Sci. 2021, 1504, 116–153. [Google Scholar] [CrossRef]
  23. Mechoso, C.R.; Robertson, A.W.; Ropelewski, C.F.; Grimm, A.M. The American monsoon systems: An introduction. In The Global Monsoon System: Research and Forecast; Chap. 13. WMO lTD No. 1266 (TMRP Report No. 70); Chang, C.-P., Kuo, H.-C., Lau, N.-C., Johnson, R.H., Wang, B., Wheeler, M.C., Eds.; World Scientific: Singapore, 2005; pp. 197–206. [Google Scholar]
  24. Fu, R.; Yin, L.; Li, W.; Arias, P.A.; Dickinson, R.E.; Huang, L.; Chakraborty, S.; Fernandes, K.; Liebmann, B.; Fisher, R.; et al. Increased dry-season length over southern Amazonia in recent decades and its implication for future climate projection. Proc. Natl. Acad. Sci. USA 2013, 110, 18110–18115. [Google Scholar] [CrossRef]
  25. Arias, P.A.; Fu, R.; Vera, C.; Rojas, M. A correlated shortening of the North and South American monsoon seasons in the past few decades. Clim. Dyn. 2015, 45, 3183–3203. [Google Scholar] [CrossRef]
  26. Sena, A.C.T.; Magnusdottir, G. Projected end-of-century changes in the South American Monsoon in the CESM large ensemble. J. Clim. 2020, 33, 7859–7874. [Google Scholar] [CrossRef]
  27. Correa, I.; Arias, P.A.; Rojas, M. Evaluation of multiple indices of the South American monsoon. Int. J. Climatol. 2020, 41, 2801–2819. [Google Scholar] [CrossRef]
  28. Dhakal, S.; Minx, J.C.; Toth, F.L.; Abdel-Aziz, A.; Meza, M.J.F.; Hubacek, K.; Jonckheere, I.G.C.; Kim, Y.-G.; Nemet, G.F.; Pachauri, S.; et al. Emissions Trends and Drivers. In IPCC, 2022: Climate Change 2022: Mitigation of Climate Change. Contribution of Working Group III to the Sixth Assessment Report of the Intergovernmental Panel on Climate Change; Shukla, P.R., Skea, J., Slade, R., Al Khourdajie, A., van Diemen, R., McCollum, D., Pathak, M., Some, S., Vyas, P., Fradera, R., et al., Eds.; Cambridge University Press: Cambridge, UK; New York, NY, USA, 2022. [Google Scholar] [CrossRef]
  29. Llopart, M.; Reboita, M.S.; Coppola, E.; Giorgi, F.; da Rocha, R.P.; Souza, D.O. Land use change over the Amazon Forest and its impact on the local climate. Water 2018, 10, 149. [Google Scholar] [CrossRef]
  30. Rizzo, R.; Garcia, A.S.; Vilela, V.M.F.N.; Ballester, M.V.R.; Neill, C.; Victoria, D.C.; da Rocha, H.R.; Coe, M.T. Land use changes in Southeastern Amazon and trends in rainfall and water yield of the Xingu River during 1976-2015. Clim. Change 2020, 162, 1419–1436. [Google Scholar] [CrossRef]
  31. Marengo, J.A.; Jimenez, J.C.; Espinoza, J.C.; Cunha, A.P.; Aragão, L.E.O. Increased climate pressure on the agricultural frontier in the Eastern Amazonia-Cerrado transition zone. Sci. Rep. 2022, 12, 457. [Google Scholar] [CrossRef] [PubMed]
  32. Jones, C.; Carvalho, L.M. Climate change in the South American monsoon system: Present climate and CMIP5 projections. J. Clim. 2013, 26, 6600–6678. [Google Scholar] [CrossRef]
  33. Khalili, M.; Van Nguyen, V.T. A perfect prognosis approach for daily precipitation series in consideration of space–time correlation structure. Stoch. Environ. Res. Risk. Assess. 2018, 32, 3333–3364. [Google Scholar] [CrossRef]
  34. Di Virgillio, G.; Ji, F.; Tam, E.; Nishant, N.; Evans, J.P.; Thomas, C.; Riley, M.L.; Beyer, K.; Grose, M.R.; Narsey, S.; et al. Selecting CMIP6 GCMs for CORDEX dynamical downscaling: Model performance, independence, and climate change signals. Earth’s Future 2022, 10, e2021EF002625. [Google Scholar] [CrossRef]
  35. Rettie, F.M.; Gayler, S.; Weber, T.K.D.; Tesfaye, K.; Streck, T. High-resolution CMIP6 climate projections for Ethiopia using the gridded statistical downscaling method. Sci. Data 2023, 10, 442. [Google Scholar] [CrossRef]
  36. Maraun, D.; Widmann, M. Statistical Downscaling and Bias Correction for Climate Research; Cambridge University Press: Cambridge, UK, 2018. [Google Scholar]
  37. Lee, T.; Singh, V.P. Statistical Downscaling for Hydrological and Environmental Applications, 1st ed.; Taylor & Francis Group: Boca Raton, FL, USA, 2019. [Google Scholar]
  38. Bettolli, M.L.; Solman, S.A.; da Rocha, R.P.; Llopart, M.; Gutierrez, J.M.; Fernández, J.; Olmo, M.E.; Lavin-Gullon, A.; Chou, S.C.; Rodrigues, D.C.; et al. The CORDEX Flagship Pilot Study in southeastern South America: A comparative study of statistical and dynamical downscaling models in simulating daily extreme precipitation events. Clim. Dyn. 2021, 56, 1589–1608. [Google Scholar] [CrossRef]
  39. Balmaceda-Huarte, R.; Bettolli, M.L. Assessing statistical downscaling in Argentina: Daily maximum and minimum temperatures. Int. J. Climatol. 2022, 42, 8423–8445. [Google Scholar] [CrossRef]
  40. Olmo, M.E.; Bettolli, M.L. Statistical downscaling of daily precipitation over southeastern South America: Assessing the performance in extreme events. Int. J. Climatol. 2022, 42, 1283–1302. [Google Scholar] [CrossRef]
  41. Olmo, M.E.; Balmaceda-Huarte, R.; Bettolli, M.L. Multi-model ensemble of statistically downscaled GCMs over southeastern South America: Historical evaluation and future projections of daily precipitation with focus on extremes. Clim. Dyn. 2022, 59, 3051–3068. [Google Scholar] [CrossRef]
  42. Ballarin, A.S.; Sone, J.S.; Gesualdo, G.C.; Schwamback, D.; Reis, A.; Almagro, A.; Wendland, E.C. CLIMBra—Climate change dataset for Brazil. Sci. Data 2023, 10, 47. [Google Scholar] [CrossRef] [PubMed]
  43. Ferreira, G.W.S.; Reboita, M.S. A new look into the South American precipitation patterns: Observation and forecast. Atmosphere 2022, 13, 873. [Google Scholar] [CrossRef]
  44. Chen, M.; Shi, W.; Xie, P.; Silva, V.B.S.; Kousky, V.E.; Higgins, R.W.; Janowiak, J.E. Assessing objective techniques for gauge-based analyses of global daily precipitation. J. Geophys. Res. 2008, 113, D04110. [Google Scholar] [CrossRef]
  45. Balmaceda-Huarte, R.; Olmo, M.E.; Bettolli, M.L.; Poggi, M.M. Evaluation of multiple reanalyses in reproducing the spatio-temporal variability of temperature and precipitation indices over southern South America. Int. J. Climatol. 2021, 41, 5572–5595. [Google Scholar] [CrossRef]
  46. Lagos-Zúñiga, M.A.; Balmaceda-Huarte, R.; Regoto, P.; Torrez, L.; Olmo, M.; Lyra, A.; Pareja-Quispe, D.; Bettolli, M.L. Extreme indices of temperature and precipitation in South America: Trends and intercomparison of regional climate models. Clim. Dyn. 2022. Under Review. [Google Scholar] [CrossRef]
  47. Martinez, D.M.; Solman, S.A. Synoptic patterns associated with extreme precipitation events over southeastern South America during spring and summer seasons. Int. J. Climatol. 2022, 42, 10387–10406. [Google Scholar] [CrossRef]
  48. Ferreira, G.W.S.; Reboita, M.S.; Ribeiro, J.G.M.; Carvalho, V.S.B.; Santiago, M.E.V.; Silva, P.L.S.S.; Baldoni, T.C.; Souza, C.A. Assessment of the wind power density over South America simulated by CMIP6 models in the present and future climate. Clim. Dyn. 2023; Under Review. [Google Scholar]
  49. Ferreira, G.W.S.; Reboita, M.S.; Ribeiro, J.G.M.; Souza, C.A. Assessment of precipitation and hydrological droughts in South America through statistically downscaled CMIP6 projections. Climate 2023, 11, 166. [Google Scholar] [CrossRef]
  50. Rupp, D.E.; Abatzoglou, J.T.; Hegewisch, K.C.; Mote, P.W. Evaluation of CMIP5 20th century climate simulations for the Pacific Northwest USA. J. Geophys. Res. Atmos. 2013, 118, 10884–10906. [Google Scholar] [CrossRef]
  51. Dias, C.G.; Reboita, M.S. Assessment of CMIP6 simulations over tropical South America. Rev. Bras. Geogr. Fis. 2021, 14, 1282–1295. [Google Scholar] [CrossRef]
  52. Zhang, M.Z.; Xu, Z.; Han, Y.; Guo, W. Evaluation of CMIP6 models toward dynamical downscaling over 14 CORDEX domains. Clim. Dyn. 2022, 1–15. [Google Scholar] [CrossRef]
  53. Admasu, L.M.; Grant, L.; Thiery, W. Exploring global climate model downscaling based on tile-level output. J. Appl. Meteorol. Climatol. 2023, 62, 171–190. [Google Scholar] [CrossRef]
  54. Tram-Anh, Q.; Ngo-Duc, T.; Espagne, E.; Trinh-Tuan, L. A 10-km CMIP6 downscaled dataset of temperature and precipitation for historical and future Vietnam climate. Sci. Data 2023, 10, 257. [Google Scholar] [CrossRef]
  55. Lovato, T.; Peano, D. CMCC CMCC-CM2-SR5 model output prepared for CMIP6 CMIP historical. Version 20200616. Earth Syst. Grid Fed. 2020. [Google Scholar] [CrossRef]
  56. Lovato, T.; Peano, D.; Butenschön, M.; Materia, S.; Iovino, D.; Scoccimarro, E.; Fogli, P.G.; Cherchi, A.; Bellucci, A.; Gualdi, S.; et al. CMIP6 simulations with the CMCC Earth System Model (CMCC1077 ESM2). J. Adv. Model. Earth Syst. 2022, 14, e2021MS002814. [Google Scholar] [CrossRef]
  57. Döscher, R.; Acosta, M.; Alessandri, A.; Anthoni, P.; Arneth, A.; Arsouze, T.; Bergman, T.; Bernardello, R.; Bousetta, S.; Caron, L.P.; et al. The EC-Earth3 Earth System Model for the Climate Model Intercomparison Project 6. Geosci. Model Dev. 2022, 15, 2973–3020. [Google Scholar] [CrossRef]
  58. Krasting, J.P.; John, J.G.; Blanton, C.; McHugh, C.; Nikonov, S.; Radhakrishnan, A.; Rand, K.; Zadeh, N.T.; Balaji, V.; Durachta, J.; et al. NOAA-GFDL GFDL-ESM4 model output prepared for CMIP6 CMIP historical. Version 20190726. Earth Syst. Grid Fed. 2018. [Google Scholar] [CrossRef]
  59. Boucher, O.; Denvil, S.; Levavasseur, G.; Cozic, A.; Caubel, A.; Foujols, M.A.; Meurdesoif, Y.; Cadule, P.; Devilliers, M.; Ghattas, J.; et al. IPSL IPSL-CM6A-LR model output prepared for CMIP6 CMIP historical. Version 20180803. Earth Syst. Grid Fed. 2018. [Google Scholar] [CrossRef]
  60. Tatebe, H.; Watanabe, M. MIROC MIROC6 model output prepared for CMIP6 CMIP historical. Version 20181212. Earth Syst. Grid Fed. 2018. [Google Scholar] [CrossRef]
  61. Wieners, K.H.; Giorgetta, M.; Jungclaus, J.; Reick, C.; Esch, M.; Bittner, M.; Legutke, S.; Schupfner, M.; Wachsmann, F.; Gayler, V.; et al. MPI-M MPI-ESM1.2-LR model output prepared for CMIP6 CMIP historical. Version 20190710. Earth Syst. Grid Fed. 2019. [Google Scholar] [CrossRef]
  62. Yukimoto, S.; Koshiro, T.; Kawai, H.; Oshima, N.; Yoshida, K.; Urakawa, S.; Tsujino, H.; Deushi, M.; Tanaka, T.; Hosaka, M.; et al. MRI MRI-ESM2.0 model output prepared for CMIP6 CMIP historical. Version 20190222. Earth Syst. Grid Fed. 2019. [Google Scholar] [CrossRef]
  63. Riahi, K.; van Vuuren, D.P.; Kriegler, E.; Edmonds, J.; O’Neill, B.C.; Fujimori, S.; Bauer, N.; Calvin, K.; Dellink, R.; Fricko, O.; et al. The Shared Socio-economic Pathways and their energy, land use, and greenhouse gas emissions implications: A review. Glob. Environ. Change 2017, 42, 153–168. [Google Scholar] [CrossRef]
  64. Nguyen, P.A.; Abbott, M.; Nguyen, T.L.T. The development and cost of renewable energy 595 resources in Vietnam. Util. Policy 2019, 57, 59–66. [Google Scholar] [CrossRef]
  65. Cannon, A.J.; Sobie, S.R.; Murdock, T.Q. Bias correction of GCM precipitation by Quantile Mapping: How well do methods preserve changes in quantiles and extremes? J. Clim. 2015, 28, 6938–6959. [Google Scholar] [CrossRef]
  66. Ali, S.; Eum, H.-I.; Cho, J.; Dan, L.; Khan, F.; Dairaku, K.; Shresta, M.L.; Hwang, S.; Nasim, W.; Khan, I.A.; et al. Assessment of climate extremes in future projections downscaled by multiple statistical downscaling methods over Pakistan. Atmos. Res. 2019, 222, 114–133. [Google Scholar] [CrossRef]
  67. Xavier, A.C.F.; Martins, L.P.; Rudke, A.P.; Morais, M.V.B.; Martins, J.A.; Blain, G.C. Evaluation of Quantile Delta Mapping as a bias-correction method in maximum rainfall dataset from downscaled models in Sao Paulo state (Brazil). Int. J. Climatol. 2022, 42, 175–190. [Google Scholar] [CrossRef]
  68. Ibebuchi, C.C.; Schönbein, D.; Adakudlu, M.; Xoplaki, E.; Paeth, H. Comparison of three techniques to adjust daily precipitation biases from regional climate models over Germany. Water 2022, 14, 600. [Google Scholar] [CrossRef]
  69. Fan, L.-J.; Yan, Z.-W.; Chen, D.; Li, Z. Assessment of total and extreme precipitation over central Asia via statistical downscaling: Added value and multi-model ensemble projection. Adv. Clim. Change Serv. 2023, 14, 62–76. [Google Scholar] [CrossRef]
  70. Logan, T.; Aoun, A.; Bourgault, P.; Huard, D.; Lavoie, J.; Rondeau-Genesse, G.; Smith, J.T.; Alegre, R.; Barnes, C.; Biner, S.; et al. Ouranosinc/xclim: v0.37.0 (v0.37.0). Zenodo 2022. [Google Scholar] [CrossRef]
  71. Silva, E.D.; Reboita, M.S. Estudo da Precipitação no Estado de Minas Gerais—MG. Rev. Bras. Climatol. 2013, 13, 120–136. [Google Scholar] [CrossRef]
  72. Reboita, M.S.; da Rocha, R.P.; de Souza, M.R.; Llopart, M. Extratropical cyclones over the southwestern South Atlantic Ocean: HadGEM2-ES and RegCM4 projections. Int. J. Climatol. 2018, 38, 2866–2879. [Google Scholar] [CrossRef]
  73. Gan, M.A.; Rao, V.B.; Moscati, M.C.L. South American monsoon indices. Atmos. Sci. Lett. 2006, 6, 219–233. [Google Scholar] [CrossRef]
  74. Bombardi, R.J.; Kinter, J.L., III; Frauenweld, O.W. A global gridded dataset of the characteristics of the rainy and dry seasons. Bull. Am. Meteorol. Soc. 2019, 100, 1315–1328. [Google Scholar] [CrossRef]
  75. Reboita, M.S.; Teodoro, T.A.; Ferreira, G.W.S.; Souza, C.A. Ciclo de vida do sistema de monção da América do Sul: Clima presente e futuro. Rev. Bras. Geogr. Fis. 2022, 15, 343–358. [Google Scholar] [CrossRef]
  76. Silva, A.E.; Carvalho, L.M.V. Large-scale index for South America Monsoon (LISAM). Atmos. Sci. Lett. 2008, 8, 51–57. [Google Scholar] [CrossRef]
  77. Raia, A.; Cavalcanti, I.F.A. The life cycle of the South American Monsoon System. J. Clim. 2008, 21, 6227–6246. [Google Scholar] [CrossRef]
  78. Rodrigues, M.A.M.; Garcia, S.R.; Kayano, M.T.; Calheiros, A.J.P.; Andreoli, R.V. Onset and demise dates of the rainy season in the South American monsoon region: A cluster analysis result. Int. J. Climatol. 2022, 42, 1354–1368. [Google Scholar] [CrossRef]
  79. Mann, H.B. Nonparametric tests against trend. Econometrica 1945, 13, 245–259. [Google Scholar] [CrossRef]
  80. Kendall, M.G. Rank correlation methods. Br. J. Psychol. 1990, 25, 86–91. [Google Scholar] [CrossRef]
  81. Hamed, K.H. Trend detection in hydrologic data: The Mann-Kendall trend test under the scaling hypothesis. J. Hydrol. 2008, 349, 350–363. [Google Scholar] [CrossRef]
  82. Li, J.; Huo, R.; Chen, H.; Zhao, Y.; Zhao, T. Comparative assessment and future prediction using CMIP6 and CMIP5 for annual precipitation and extreme precipitation simulation. Front. Earth Sci. 2021, 9, 2021. [Google Scholar] [CrossRef]
  83. Huang, F.; Xu, Z.; Guo, W. The linkage between CMIP5 climate models’ abilities to simulate precipitation and vector winds. Clim. Dyn. 2020, 54, 4953–4970. [Google Scholar] [CrossRef]
  84. Almazroui, M.; Ashfaq, M.; Islam, M.N.; Kamil, S.; Abid, M.A.; O’Brien, E.; Ismail, M.; Reboita, M.S.; Sörensson, A.A.; Arias, P.A.; et al. Assessment of CMIP6 performance and projected temperature and precipitation changes over South America. Earth Syst. Environ. 2021, 5, 155–183. [Google Scholar] [CrossRef]
  85. Arias, P.A.; Ortega, G.; Villegas, L.D.; Martínez, J. Colombian climatology in CMIP5/CMIP6 models: Persistent biases and improvements. Rev. Fac. Ing. 2021, 100, 75–96. [Google Scholar] [CrossRef]
  86. Firpo, M.A.F.; Guimarães, B.S.; Dantas, L.G.; Silva, M.G.B.; Alves, L.M.; Chadwick, R.; Llopart, M.P.; Oliveira, G.S. Assessment of CMIP6 models’ performance in simulating present-day climate in Brazil. Front. Clim. 2022, 4, 2022. [Google Scholar] [CrossRef]
  87. Ortega, G.; Arias, P.A.; Villegas, J.C.; Marquet, P.A.; Nobre, P. Present-day and future climate over Central and South America according to CMIP5/CMIP6 models. Int. J. Climatol. 2021, 41, 6713–6735. [Google Scholar] [CrossRef]
  88. Khairoutdinov, M.; Randall, D.; DeMott, C. Simulations of the atmospheric general circulation using a cloud-resolving model as a superparameterization of physical processes. J. Atmos. Sci. 2005, 62, 2136–2154. [Google Scholar] [CrossRef]
  89. Torres, R.R.; Marengo, J.A. Uncertainty assessments of climate change projections over South America. Theor. Appl. Climatol. 2013, 112, 253–272. [Google Scholar] [CrossRef]
  90. Rivera, J.A.; Arnould, G. Evaluation of the ability of CMIP6 models to simulate precipitation over Southwestern South America: Climatic features and long-term trends (1901–2014). Atmos. Res. 2020, 241, 104953. [Google Scholar] [CrossRef]
  91. Reboita, M.S.; Kuki, C.A.C.; Marrafon, V.H.; Souza, C.A.; Ferreira, G.W.S.; Teodoro, T.; Lima, J.W.M. South America climate change revealed through climate indices projected by GCMs and Eta-RCM ensembles. Clim. Dyn. 2021, 58, 459–485. [Google Scholar] [CrossRef]
  92. Reboita, M.S.; da Rocha, R.P.; Souza, C.A.; Baldoni, T.C.; Silva, P.L.L.S.; Ferreira, G.W.S. Future projections of extreme precipitation climate indices over South America based on CORDEX-CORE multimodel ensemble. Atmosphere 2022, 13, 1463. [Google Scholar] [CrossRef]
  93. Ruffato-Ferreira, V.; Barreto, R.C.; Júnior, A.O.; Silva, W.L.; Viana, D.B.; Nascimento, J.A.S.; Freitas, M.A.V. A foundation for the strategic long-term planning of the renewable energy sector in Brazil: Hydroelectricity and wind energy in the face of climate change scenarios. Renew. Sustain. Energy Rev. 2017, 72, 1124–1137. [Google Scholar] [CrossRef]
  94. De Jong, P.; Barreto, T.B.; Tanajura, C.A.S.; Oliveira-Esquerre, K.P.; Kiperstok, A.; Torres, E.A. The impact of regional climate change on hydroelectric resources in South America. Renew. Energy 2021, 173, 76–91. [Google Scholar] [CrossRef]
  95. Torres, R.R.; Benassi, R.B.; Martins, F.B.; Lapola, D.M. Projected impacts of 1.5 and 2 °C global warming on temperature and precipitation patterns in South America. Int. J. Climatol. 2021, 42, 1597–1611. [Google Scholar] [CrossRef]
  96. Tavares, P.S.; Acosta, R.; Nobre, P.; Resende, N.C.; Chou, S.C.; Lyra, A.A. Water balance components and climate extremes over Brazil under 1.5 °C and 2.0 °C of global warming scenarios. Reg. Environ. Change 2023, 23, 40. [Google Scholar] [CrossRef] [PubMed]
  97. Medeiros, F.J.; Oliveira, C.P.; Avila-Diaz, A. Evaluation of extreme precipitation climate indices and their projected changes for Brazil: From CMIP3 to CMIP6. Weather Clim. Extrem. 2022, 38, 100511. [Google Scholar] [CrossRef]
  98. Schroth, G.; Läderach, P.; Martinez-Valle, A.I.; Bunn, C.; Jassogne, L. Vulnerability to climate change of cocoa in West Africa: Patterns, opportunities and limits to adaptation. Sci. Total Environ. 2016, 556, 231–241. [Google Scholar] [CrossRef]
  99. Dhiman, R.C.; Pahwa, S.; Dhillon, G.P.S.; Dash, A.P. Climate change and threat of vector-borne diseases in India: Are we prepared? Parasitol. Res. 2010, 106, 763–773. [Google Scholar] [CrossRef]
  100. Papalexiou, S.M.; Rajulapati, C.R.; Andreadis, K.M.; Foufoula-Georgiou, E.; Clark, M.P.; Trenberth, K.E. Probabilistic Evaluation of drought in CMIP6 simulations. Earth’s Future 2021, 9, e2021EF002150. [Google Scholar] [CrossRef]
  101. Wang, T.; Tu, X.; Singh, V.P.; Chen, X.; Lin, K. Global data assessment and analysis of drought characteristics based on CMIP6. J. Hydrol. 2021, 596, 126091. [Google Scholar] [CrossRef]
  102. Lima, A.O.; Lyra, G.B.; Abreu, M.C.; Oliveira-Júnior, J.F.; Zeri, M.; Cunha-Zeri, G. Extreme rainfall events over Rio de Janeiro state, Brazil: Characterization using probability distribution functions and clustering analysis. Atmos. Res. 2021, 247, 105221. [Google Scholar] [CrossRef]
  103. Aguiar, L.F.; Cataldi, M. Social and environmental vulnerability in southeast Brazil associated with the South Atlantic Convergence Zone. Nat. Hazards 2021, 109, 2423–2437. [Google Scholar] [CrossRef]
  104. Leite-Filho, A.T.; Costa, M.H.; Fu, R. The southern Amazon rainy season: The role of deforestation and its interactions with large-scale mechanisms. Int. J. Climatol. 2019, 40, 2328–2341. [Google Scholar] [CrossRef]
  105. Debortoli, N.S.; Dubreil, V.; Funatsu, B.; Delahaye, F.; de Oliveira, C.H.; Rodrigues-Filho, S.; Saito, C.H.; Fetter, R. Rainfall patterns in the Southern Amazon: A chronological perspective (1971–2010). Clim. Change 2015, 132, 251–264. [Google Scholar] [CrossRef]
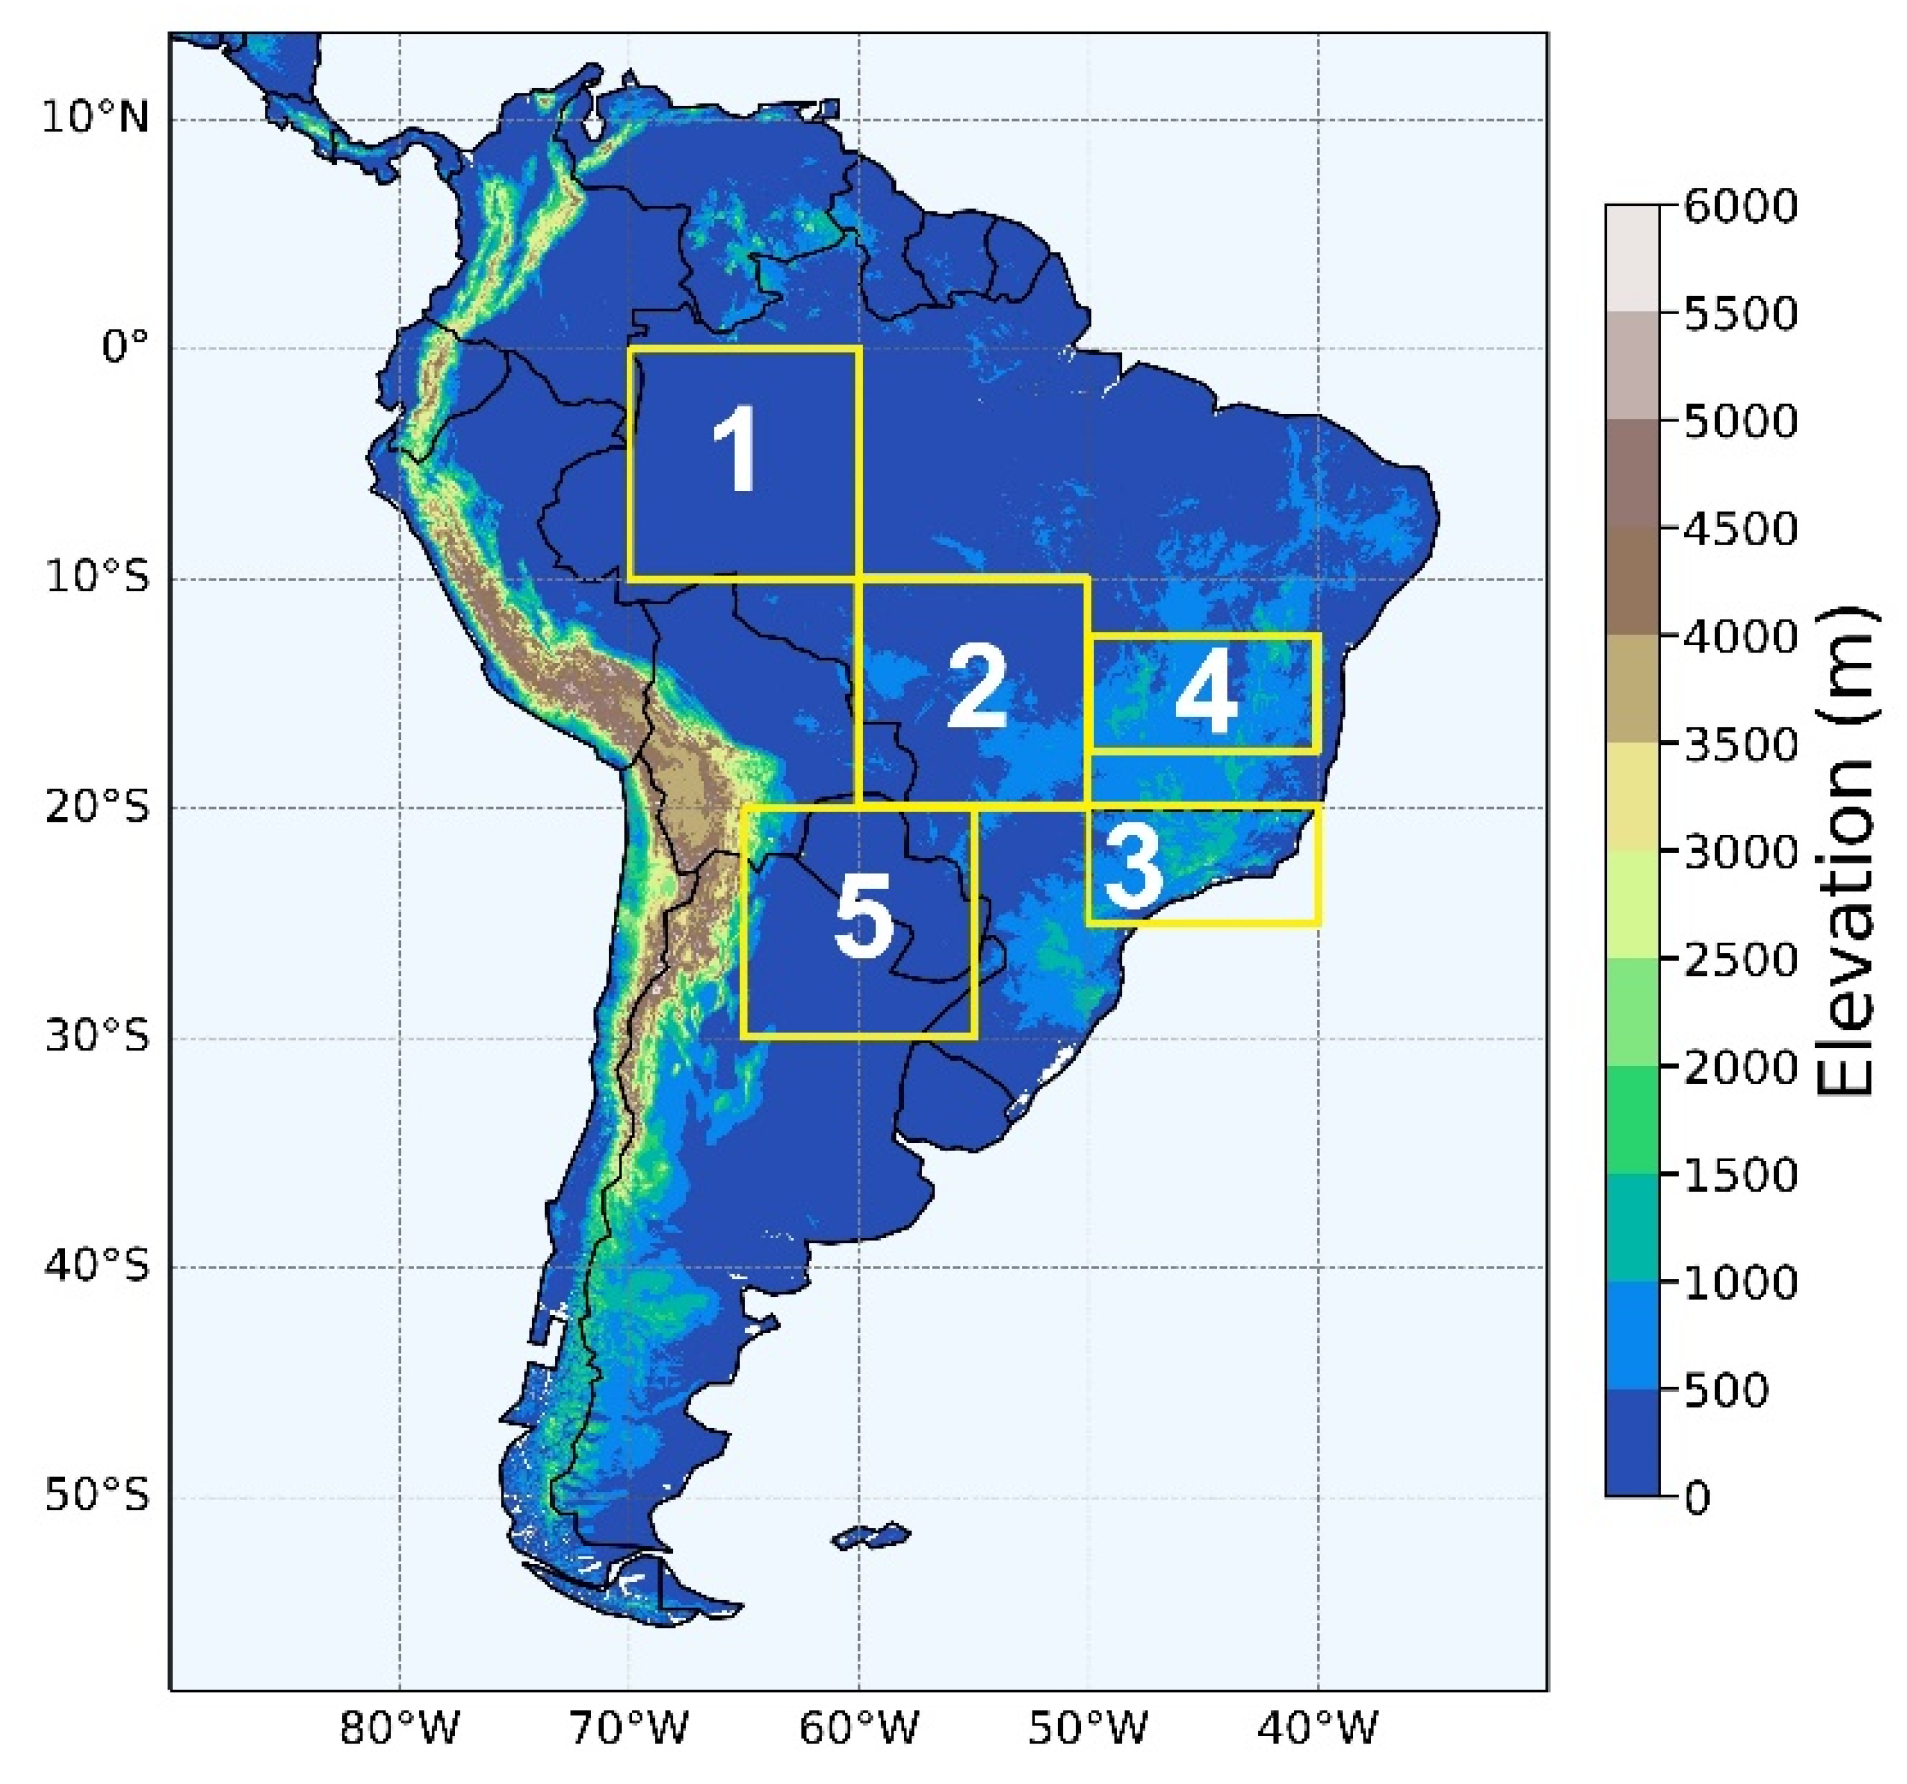
Figure 1. Study area with elevation (m) obtained from the United States Geological Survey-Earth Resources Observation System (EROS) Center. Yellow rectangles indicate subdomains selected for the extraction of time series. R1 covers the area 0° S–10° S and 60° W–70° W; R2, 10° S–20° S and 50° W–60° W; R3, 20° S–25° S and 40° W–50° W; R4, 12.5° S–17.5° S and 40° W–50° W; and R5, 20° S–30° S and 55° W–65° W.
Atmosphere 14 01380 g001
Figure 2. Main steps of the methodology: (a) CMIP6-GCMs selection [50], (b) statistical downscaling, and (c) defining the SAMS lifecycle [7,10].
Atmosphere 14 01380 g002
Figure 3. Seasonal climatology (from October to March) for the historical period (1995–2014) of precipitation (mm day−1; ac) and bias (mm day−1; df), obtained by CPC (a) and simulated by the CMIP6 ensemble before (b,e) and after (c,f) the application of BCSD.
Atmosphere 14 01380 g003
Figure 4. Seasonal climatology (from October to March) for the historical period (1995–2014) of the onset (in pentads) of the rainy season in SA (ac) and bias (in pentads) (df), obtained by CPC (a) and simulated by the CMIP6 ensemble before (b,e) and after (c,f) the application of BCSD.
Atmosphere 14 01380 g004
Figure 5. Seasonal climatology (from October to March) for the historical period (1995–2014) of the demise (in pentads) of the rainy season in SA (ac) and bias (in pentads) (df), obtained by CPC (a) and simulated by the CMIP6 ensemble before (b,e) and after (c,f) the application of BCSD.
Atmosphere 14 01380 g005
Figure 6. Seasonal climatology (from October to March) for the historical period (1995–2014) of the length (in pentads) of the rainy season in SA (ac) and bias (in pentads) (df), obtained by CPC (a) and simulated by the CMIP6 ensemble before (b,e) and after (c,f) the application of BCSD.
Atmosphere 14 01380 g006
Figure 7. October–March precipitation (mm day−1) during the historical period and the SSP2–4.5 scenario for different time slices 1995–2014, (a,b); 2020–2039, (cf); 2040–2059, (gj); 2060–2079, (kn); 2080–2099, (or) and considering the raw and BCSD data (left side) and difference regarding the historical period (right side). From left to right: mean of the raw ensemble, mean of the BCSD ensemble, difference raw ensemble, and difference BCSD ensemble. The dots indicate statistical significance at 95% confidence in the difference fields based on the t-test.
Atmosphere 14 01380 g007
Figure 8. Similar to Figure 7, except for the SSP5–8.5 scenario. October–March precipitation (mm day−1) during the historical period and the SSP2–4.5 scenario for different time slices 1995–2014, (a,b); 2020–2039, (cf); 2040–2059, (gj); 2060–2079, (kn); 2080–2099, (or) and considering the raw and BCSD data (left side) and difference regarding the historical period (right side). From left to right: mean of the raw ensemble, mean of the BCSD ensemble, difference raw ensemble, and difference BCSD ensemble. The dots indicate statistical significance at 95% confidence in the difference fields based on the t-test.
Atmosphere 14 01380 g008
Figure 9. Similar to Figure 7, except for the monsoon onset (pentads) and SSP2–4.5 scenario. October–March precipitation (mm day−1) during the historical period and the SSP2–4.5 scenario for different time slices (1995-2014, (a,b); 2020–2039, (cf); 2040–2059, (gj); 2060–2079, (kn); 2080–2099, (or) and considering the raw and BCSD data (left side) and difference regarding the historical period (right side). From left to right: mean of the raw ensemble, mean of the BCSD ensemble, difference raw ensemble, and difference BCSD ensemble. The dots indicate statistical significance at 95% confidence in the difference fields based on the t-test.
Atmosphere 14 01380 g009
Figure 10. Similar to Figure 7, except for the monsoon onset (pentads) and SSP5–8.5 scenario. October–March precipitation (mm day−1) during the historical period and the SSP2–4.5 scenario for different time slices (1995-2014, (a,b); 2020–2039, (cf); 2040–2059, (gj); 2060–2079, (kn); 2080–2099, (or) and considering the raw and BCSD data (left side) and difference regarding the historical period (right side). From left to right: mean of the raw ensemble, mean of the BCSD ensemble, difference raw ensemble, and difference BCSD ensemble. The dots indicate statistical significance at 95% confidence in the difference fields based on the t-test.
Atmosphere 14 01380 g010
Figure 11. Similar to Figure 7, except for the monsoon demise (pentads) and SSP2–4.5 scenario. October–March precipitation (mm day−1) during the historical period and the SSP2–4.5 scenario for different time slices (1995-2014, (a,b); 2020–2039, (cf); 2040–2059, (gj); 2060–2079, (kn); 2080–2099, (or) and considering the raw and BCSD data (left side) and difference regarding the historical period (right side). From left to right: mean of the raw ensemble, mean of the BCSD ensemble, difference raw ensemble, and difference BCSD ensemble. The dots indicate statistical significance at 95% confidence in the difference fields based on the t-test.
Atmosphere 14 01380 g011
Figure 12. Similar to Figure 7, except for the monsoon demise (pentads) and SSP5–8.5 scenario. October–March precipitation (mm day−1) during the historical period and the SSP2–4.5 scenario for different time slices (1995-2014, (a,b); 2020–2039, (cf); 2040–2059, (gj); 2060–2079, (kn); 2080–2099, (or) and considering the raw and BCSD data (left side) and difference regarding the historical period (right side). From left to right: mean of the raw ensemble, mean of the BCSD ensemble, difference raw ensemble, and difference BCSD ensemble. The dots indicate statistical significance at 95% confidence in the difference fields based on the t-test.
Atmosphere 14 01380 g012
Figure 13. Similar to Figure 7, except for the monsoon length (pentads) and SSP2–4.5 scenario. October–March precipitation (mm day−1) during the historical period and the SSP2–4.5 scenario for different time slices (1995-2014, (a,b); 2020–2039, (cf); 2040–2059, (gj); 2060–2079, (kn); 2080–2099, (or) and considering the raw and BCSD data (left side) and difference regarding the historical period (right side). From left to right: mean of the raw ensemble, mean of the BCSD ensemble, difference raw ensemble, and difference BCSD ensemble. The dots indicate statistical significance at 95% confidence in the difference fields based on the t-test.
Atmosphere 14 01380 g013
Figure 14. Similar to Figure 7, except for the monsoon length (pentads) and SSP5–8.5 scenario. October–March precipitation (mm day−1) during the historical period and the SSP2–4.5 scenario for different time slices (1995-2014, (a,b); 2020–2039, (cf); 2040–2059, (gj); 2060–2079, (kn); 2080–2099, (or) and considering the raw and BCSD data (left side) and difference regarding the historical period (right side). From left to right: mean of the raw ensemble, mean of the BCSD ensemble, difference raw ensemble, and difference BCSD ensemble. The dots indicate statistical significance at 95% confidence in the difference fields based on the t-test.
Atmosphere 14 01380 g014
Figure 15. Time series of the monsoon’s onset anomalies (in pentads) provided by the eight BCSD models and its ensemble (solid black line) for five SA subdomains (R1, (a,b); R2, (c,d); R3, (e,f); R4, (g,h); R5, (i,j) under the SSP2–4.5 (left column) and SSP5–8.5 (right column) scenarios. Anomalies refer to 2020–2099 in relation to 1995–2014. The p-value indicates the Mann–Kendall test result for the BCSD ensemble projections, and Sen’s slopes indicate whether the trends are positive (slope > 0) or negative (slope < 0).
Atmosphere 14 01380 g015
Figure 16. Similar to Figure 15, except for the monsoon’s demise (pentads). Time series of the monsoon’s onset anomalies (in pentads) provided by the eight BCSD models and its ensemble (solid black line) for five SA subdomains (R1, (a,b); R2, (c,d); R3, (e,f); R4, (g,h); R5, (i,j) under the SSP2–4.5 (left column) and SSP5–8.5 (right column) scenarios. Anomalies refer to 2020–2099 in relation to 1995–2014. The p-value indicates the Mann–Kendall test result for the BCSD ensemble projections, and Sen’s slopes indicate whether the trends are positive (slope > 0) or negative (slope < 0).
Atmosphere 14 01380 g016
Figure 17. Similar to Figure 15, except for the monsoon’s length (pentads). Time series of the monsoon’s onset anomalies (in pentads) provided by the eight BCSD models and its ensemble (solid black line) for five SA subdomains (R1, (a,b); R2, (c,d); R3, (e,f); R4, (g,h); R5, (i,j) under the SSP2–4.5 (left column) and SSP5–8.5 (right column) scenarios. Anomalies refer to 2020–2099 in relation to 1995–2014. The p-value indicates the Mann–Kendall test result for the BCSD ensemble projections, and Sen’s slopes indicate whether the trends are positive (slope > 0) or negative (slope < 0).
Atmosphere 14 01380 g017
Table 2. Results of the computation of SAMS lifecycle parameters for R2 obtained here (shaded line) compared to previous works.
R2—Midwest Brazil—10° S–20° S 50° W–60° W
ReferenceOnset (Pentads)Demise (Pentads)Length (Pentads)
This study57–5920–2334–36
Gan et al. [9]51–6322–2533–44
Bombardi and Carvalho [10]58–6118–2136–38
Ashfaq et al. [12]—GPCP5918–2032–34
Ashfaq et al. [12]—RegCM4 ensemble57–6117–1931–35
Gan et al. [73]56–5920–2334–40
Bombardi et al. [74]582035
Reboita et al. [75]57–5920–2232–34
Silva and Carvalho [76]58–6420–2731–41
Raia and Cavalcanti [77]601831
Rodrigues et al. [78]582742
Disclaimer/Publisher’s Note: The statements, opinions and data contained in all publications are solely those of the individual author(s) and contributor(s) and not of MDPI and/or the editor(s). MDPI and/or the editor(s) disclaim responsibility for any injury to people or property resulting from any ideas, methods, instructions or products referred to in the content.