1. Introduction
The Northeast China Cold Vortex (NCCV) is a distinct cut-off low system that typically forms over Northeast China and is frequently detached from the mid-high latitude westerly [
1]. The NCCV exhibits a higher frequency of occurrence during the late spring to early summer period, with a peak in June. This meteorological phenomenon is known to trigger significant weather events, including heavy rainfall, floods, and severe convective weather such as hailstorms and tornadoes [
1,
2,
3,
4,
5,
6]. Chinese meteorologists have designated this period as the “NCCV rainy season” for Northeast China, acknowledging the substantial impact of the NCCV before the onset of the East Asian monsoon [
7,
8]. Monitoring and forecasting NCCV activity during this season is of incredible importance to provide effective meteorological services and implement appropriate measures to mitigate potential hazards.
Impacted by the NCCV and the Okhotsk Blocking high, the total precipitation in northeastern China during June 2022 reached 144.9 mm, surpassing its climatological mean by 62% and setting a new historical record since 1951 [
9,
10]. Between 11–14 June, a significant deep NCCV event occurred over Northeast China, inducing persistent and widespread heavy rainfall, especially in eastern Inner Mongolia. Within Inner Mongolia, three monitoring stations recorded accumulated rainfall amounts exceeding 100 mm, resulting in floods across eight eastern Inner Mongolia regions. This catastrophe affected roughly 134,000 individuals and incurred an economic loss of approximately CNY 430 million. Moreover, Beijing, Shandong, and Hebei provinces reported numerous stations with hourly precipitation surpassing 70 mm·h
−1. Considering the arid and semi-arid climate in northern China, the investigation of water vapor sources and transportation for these intense precipitation occurrences holds vital significance.
A sufficiently large amount of water vapor is crucial for heavy rainfall, influencing both the intensity and coverage of precipitation [
11,
12,
13,
14,
15]. Wei et al. [
16] identified four primary sources of water vapor contributing to NCCV-related rainfall: the western Pacific Ocean and adjacent seas, the Bay of Bengal to the South China Sea, the vicinity of Lake Baikal, and Northeast China. Prior research has emphasized the tropical region as the primary water vapor source for NCCV rainstorms in summer since the East monsoon provides relatively hot and humid air mass [
17,
18,
19,
20,
21]. This moisture is primarily transported by the warm, moist conveyor belt situated on the southeastern side of the NCCV. This conveyor belt not only provides sufficient water vapor but also triggers instability for rainstorms when it encounters the cold, dry air from the western NCCV [
18,
19]. Meanwhile, upward motions frequently occur in the eastern NCCV, fostering the release of convective available potential energy. Considering these factors, substantial precipitation typically occurs in the eastern NCCV, particularly the southeastern region [
17,
19,
22,
23].
The described deep NCCV event led to the occurrence of two notably heavy rainfall episodes, where the more substantial rainfall occurred in its southeastern sector from 12 to 13 June, followed by the rainfall in its northeastern from 13 to 14 June. However, the reason for this difference remains unclear. To address this question, we mainly investigated their respective sources and transport of water vapor using a Lagrangian analysis tool (LAGRANTO), as water vapor is the most important factor for rainstorms in arid and semi-arid areas. Their differences were subsequently interpreted based on water vapor patterns and trigger mechanisms precipitation in terms of stratification stability and vertical motion. The remainder of this study is organized as follows:
Section 2 introduces data and method.
Section 3 presents the results on the sources and transport of water vapor of the northeastern and southeastern NCCV tracked by LAGRANTO and then analyzes the trigger mechanisms of the two precipitation areas, followed by a summary in
Section 4.
3. Results
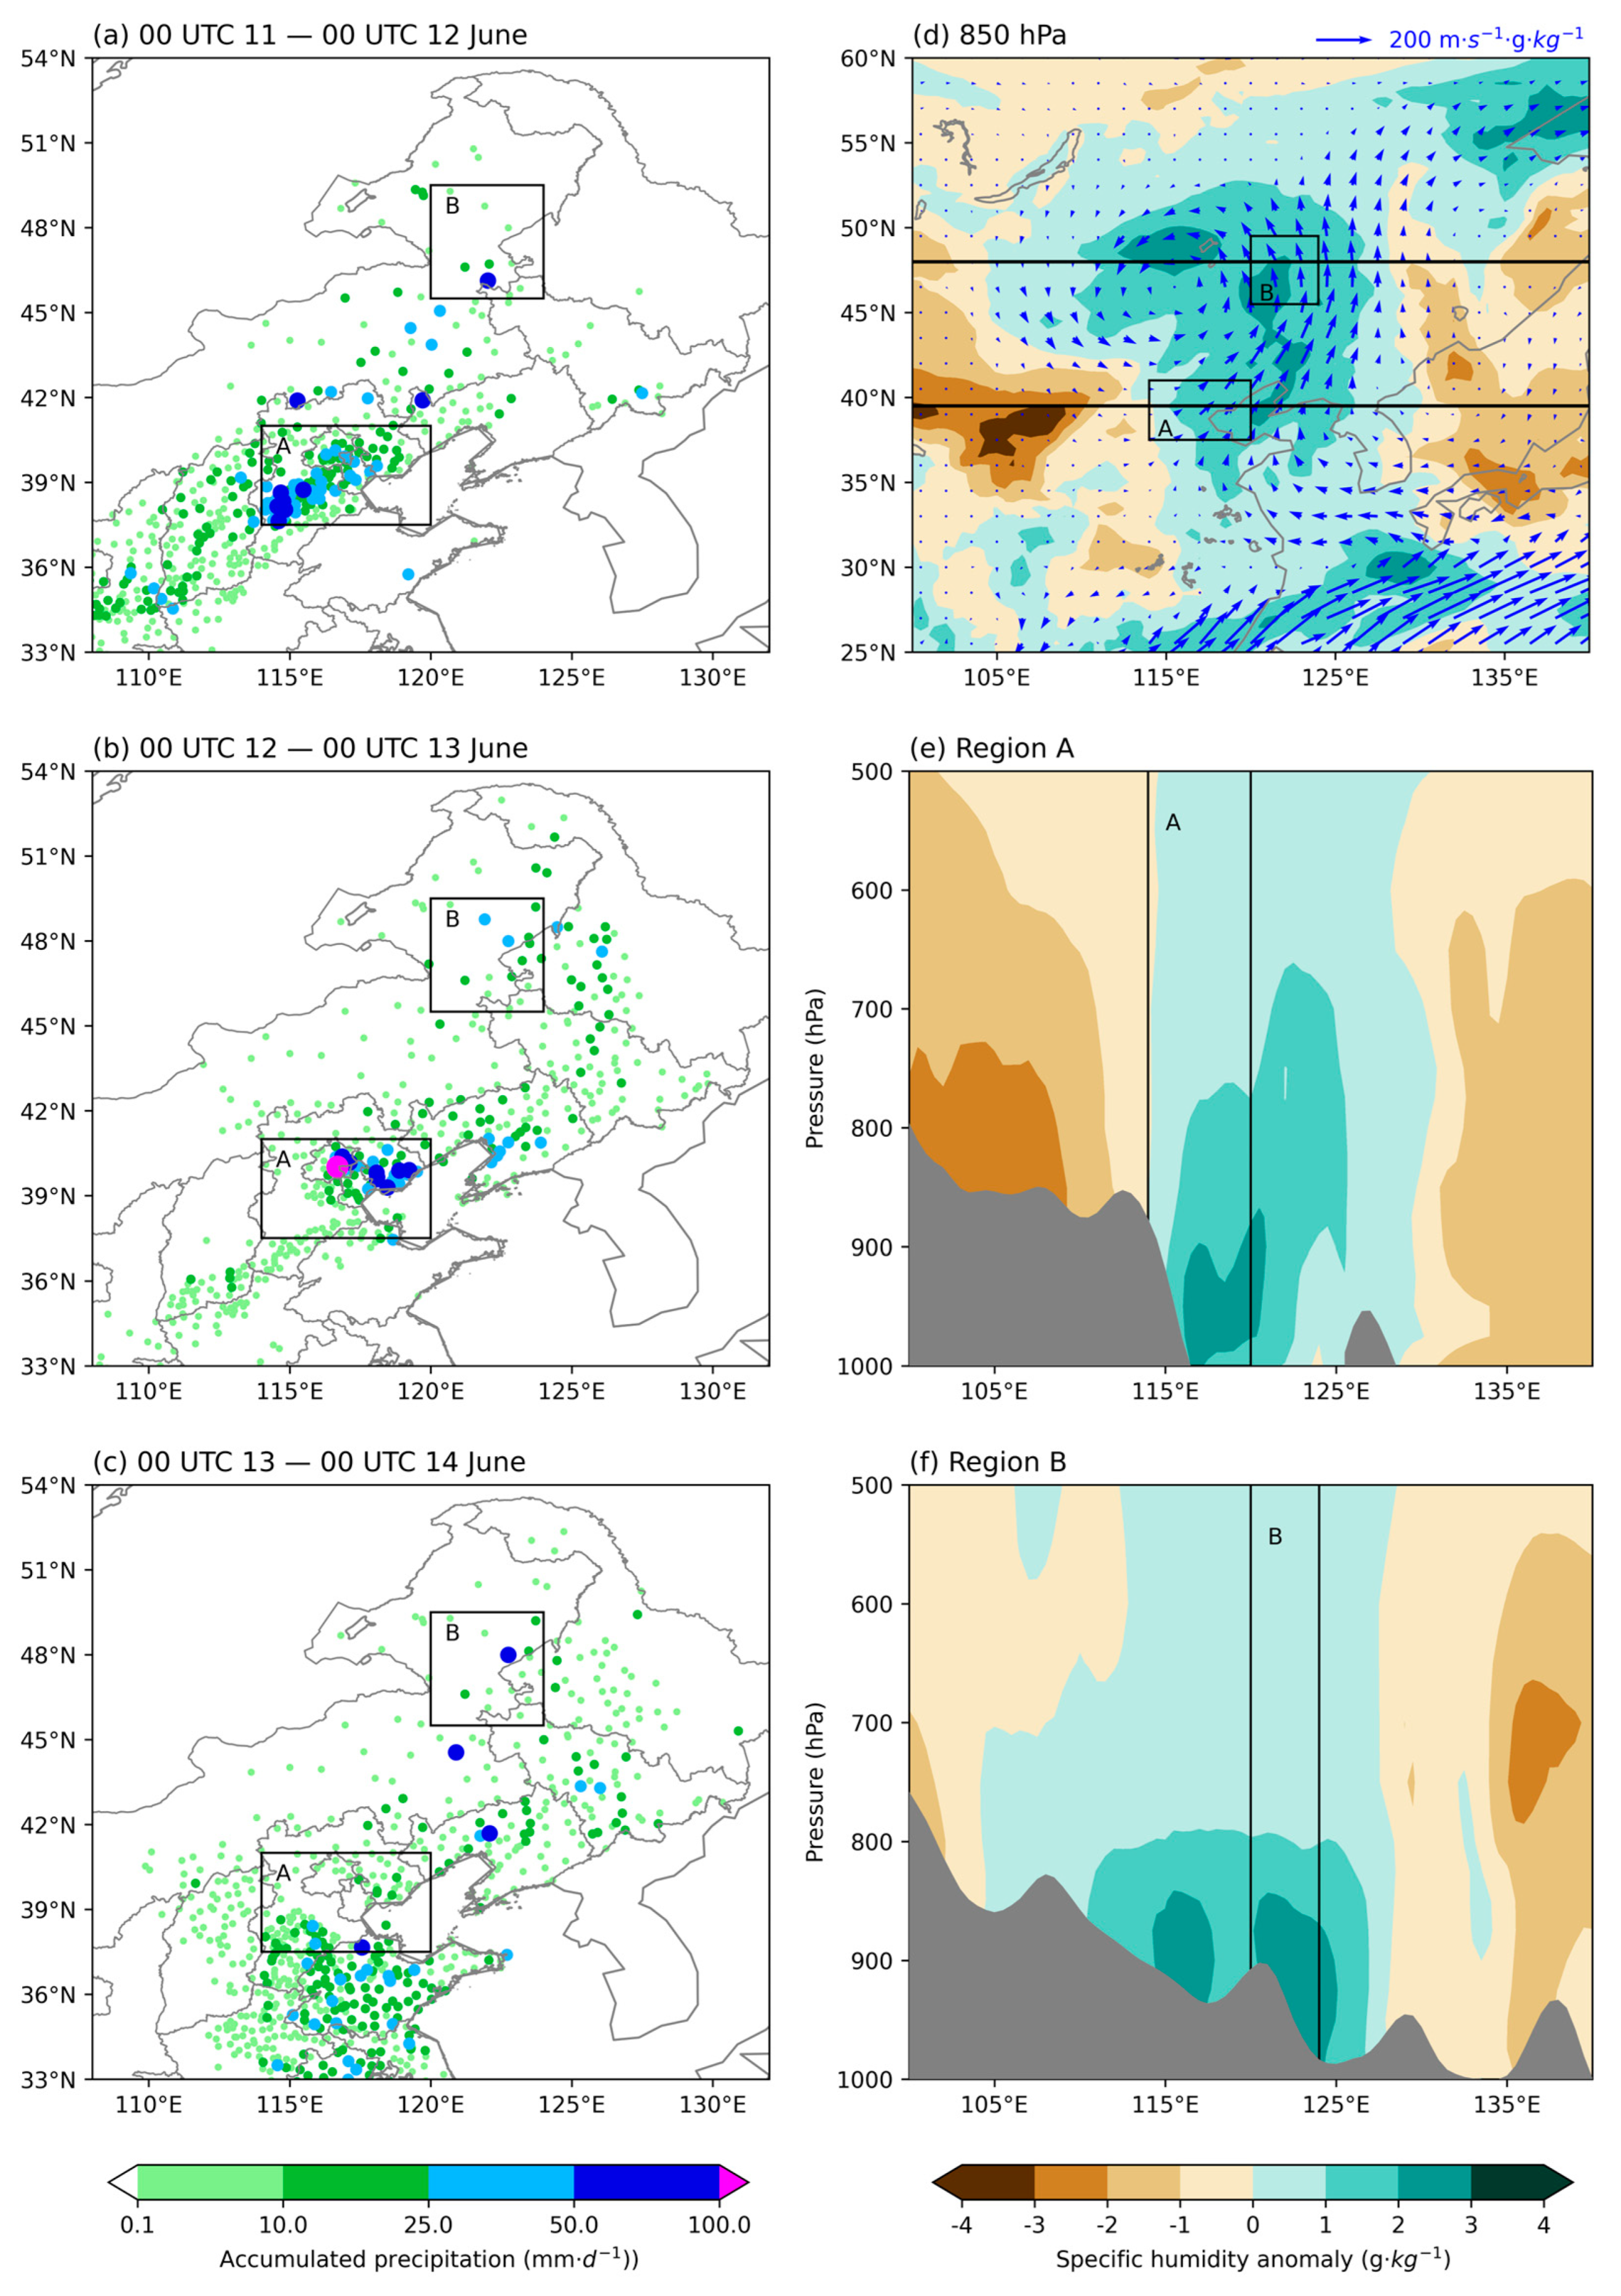
Figure 1 illustrates the spatial distribution of daily accumulated precipitation in northeastern China from 11 to 14 June 2022, along with corresponding time-mean specific humidity anomaly and water vapor flux fields. On 11 June (
Figure 1a), the precipitation was characterized by a northeast–southwest elongated rainfall belt on the lee side of the Mongolian and Loess Plateaus, leading to rainstorms in central and eastern Inner Mongolia, as well as western Liaoning and Hebei provinces. From 12 to 13 June (
Figure 1e,f), the rainfall belt shifted northeastward, triggering sequential rainstorms along the Bohai coast and in eastern Inner Mongolia. The intensity of the rainstorm along the Bohai coast on 12 June was considerably greater compared to that in eastern Inner Mongolia on 13 June. Although the heavy rainfall in eastern Inner Mongolia exhibited a lower intensity, it resulted in more flooding due to the fragile environment of Inner Mongolia. This event exemplified a typical occurrence of NCCV and its associated rainstorms [
17,
18,
19,
20]. The composite heavy-precipitation NCCV results of Chen et al. [
29] showed a concentration of heavy rainfall within a 2000 km radius southeast and northeast of the NCCV. Consequently, we focus on rainstorms in Regions A (37.5–41 °N, 114–120 °E) and B (45.5–49.5 °N, 120–124 °E) encompassing the Bohai coast and eastern Inner Mongolia, respectively. Regions A and B were two typical areas in the southeast and northeast of the NCCV, known for their frequent rainstorm occurrences.
The 850 hPa average water vapor fields summarize a ‘comma’-shaped distribution of positive specific humidity anomalies from the Hulun Lake to the Bohai Sea, overlapped by a cyclonic water vapor flux, indicative of the influence of the NCCV circulation (
Figure 1d). Notably, the northward water vapor flux on the eastern flank of NCCV aligns well with the rainfall belt. This moisture transport not only brought water vapor from the Yellow Sea but also from the East Asia Monsoon. To depict vertical specific humidity anomalies,
Figure 1e,f show zonal mean pressure-longitude cross-sections for regions A and B. The positive anomalies predominantly concentrated on the lee side of the plateaus and below 750 hPa, with centers around 900 hPa. This suggests that the moist air mass likely converged and ascended due to the presence of mountains, thereby creating favorable conditions for the occurrence of rainstorms.
Figure 2 displays the water vapor budget across regions A and B during the period of 11–14 June. Considering Region A first, its northern and eastern boundaries experienced a gradual shift from exporting to importing water vapor, whereas its southern boundary reserved from importing to exporting water vapor. The inflow of water vapor remained along the western boundary throughout the entire duration. The vertically integrated water vapor transports across the northern boundary, southern boundary, western boundary, and eastern boundary of Region A were −79.80 × 10
6 kg·s
–1, 91.77 × 10
6 kg·s
–1, 149.47 × 10
6 kg·s
–1, and −111.11 × 10
6 kg·s
–1, respectively, during the period of 11–14 June. Therefore, during the course of heavy rainfall, the main inflows of water vapor were from the southern and western boundaries, whereas the major outflow occurred at the northern and eastern boundaries.
Compared to Region A, Region B exhibited water vapor efflux at its northern boundary and influx at its southern boundary during periods of heavy rainfall. By 14 June, the role of the western boundary had shifted from water vapor export to import, while the opposite shift occurred on the eastern boundary. From 11 to 14 June, the total vertically integrated water vapor transports across the four boundaries of Region B were −162.55 × 10⁶ kg·s–1, 271.64 × 10⁶ kg·s–1, −73.33 × 10⁶ kg·s–1, and −14.59 × 10⁶ kg·s–1, across the northern, southern, western, and eastern boundaries, respectively. The water vapor primarily entered through the southern boundary and exited through the other three boundaries of Region B.
To investigate the source and transport of water vapor, LAGRANTO was conducted at three different pressure levels: 900, 850, and 800 hPa to trace air trajectories in more detail for regions A and B, respectively. The initial points of trajectories in regions A and B were 104 and 81 per pressure level, respectively. After excluding points below the ground, the total number of initial points became 296 for Region A and 230 for Region B. Subsequently, a three-day backward tracking was conducted from 00 UTC on 13 June for Region A and 00 UTC on 14 June for Regions B. Only trajectories with Qj greater than Qm were retained for each track.
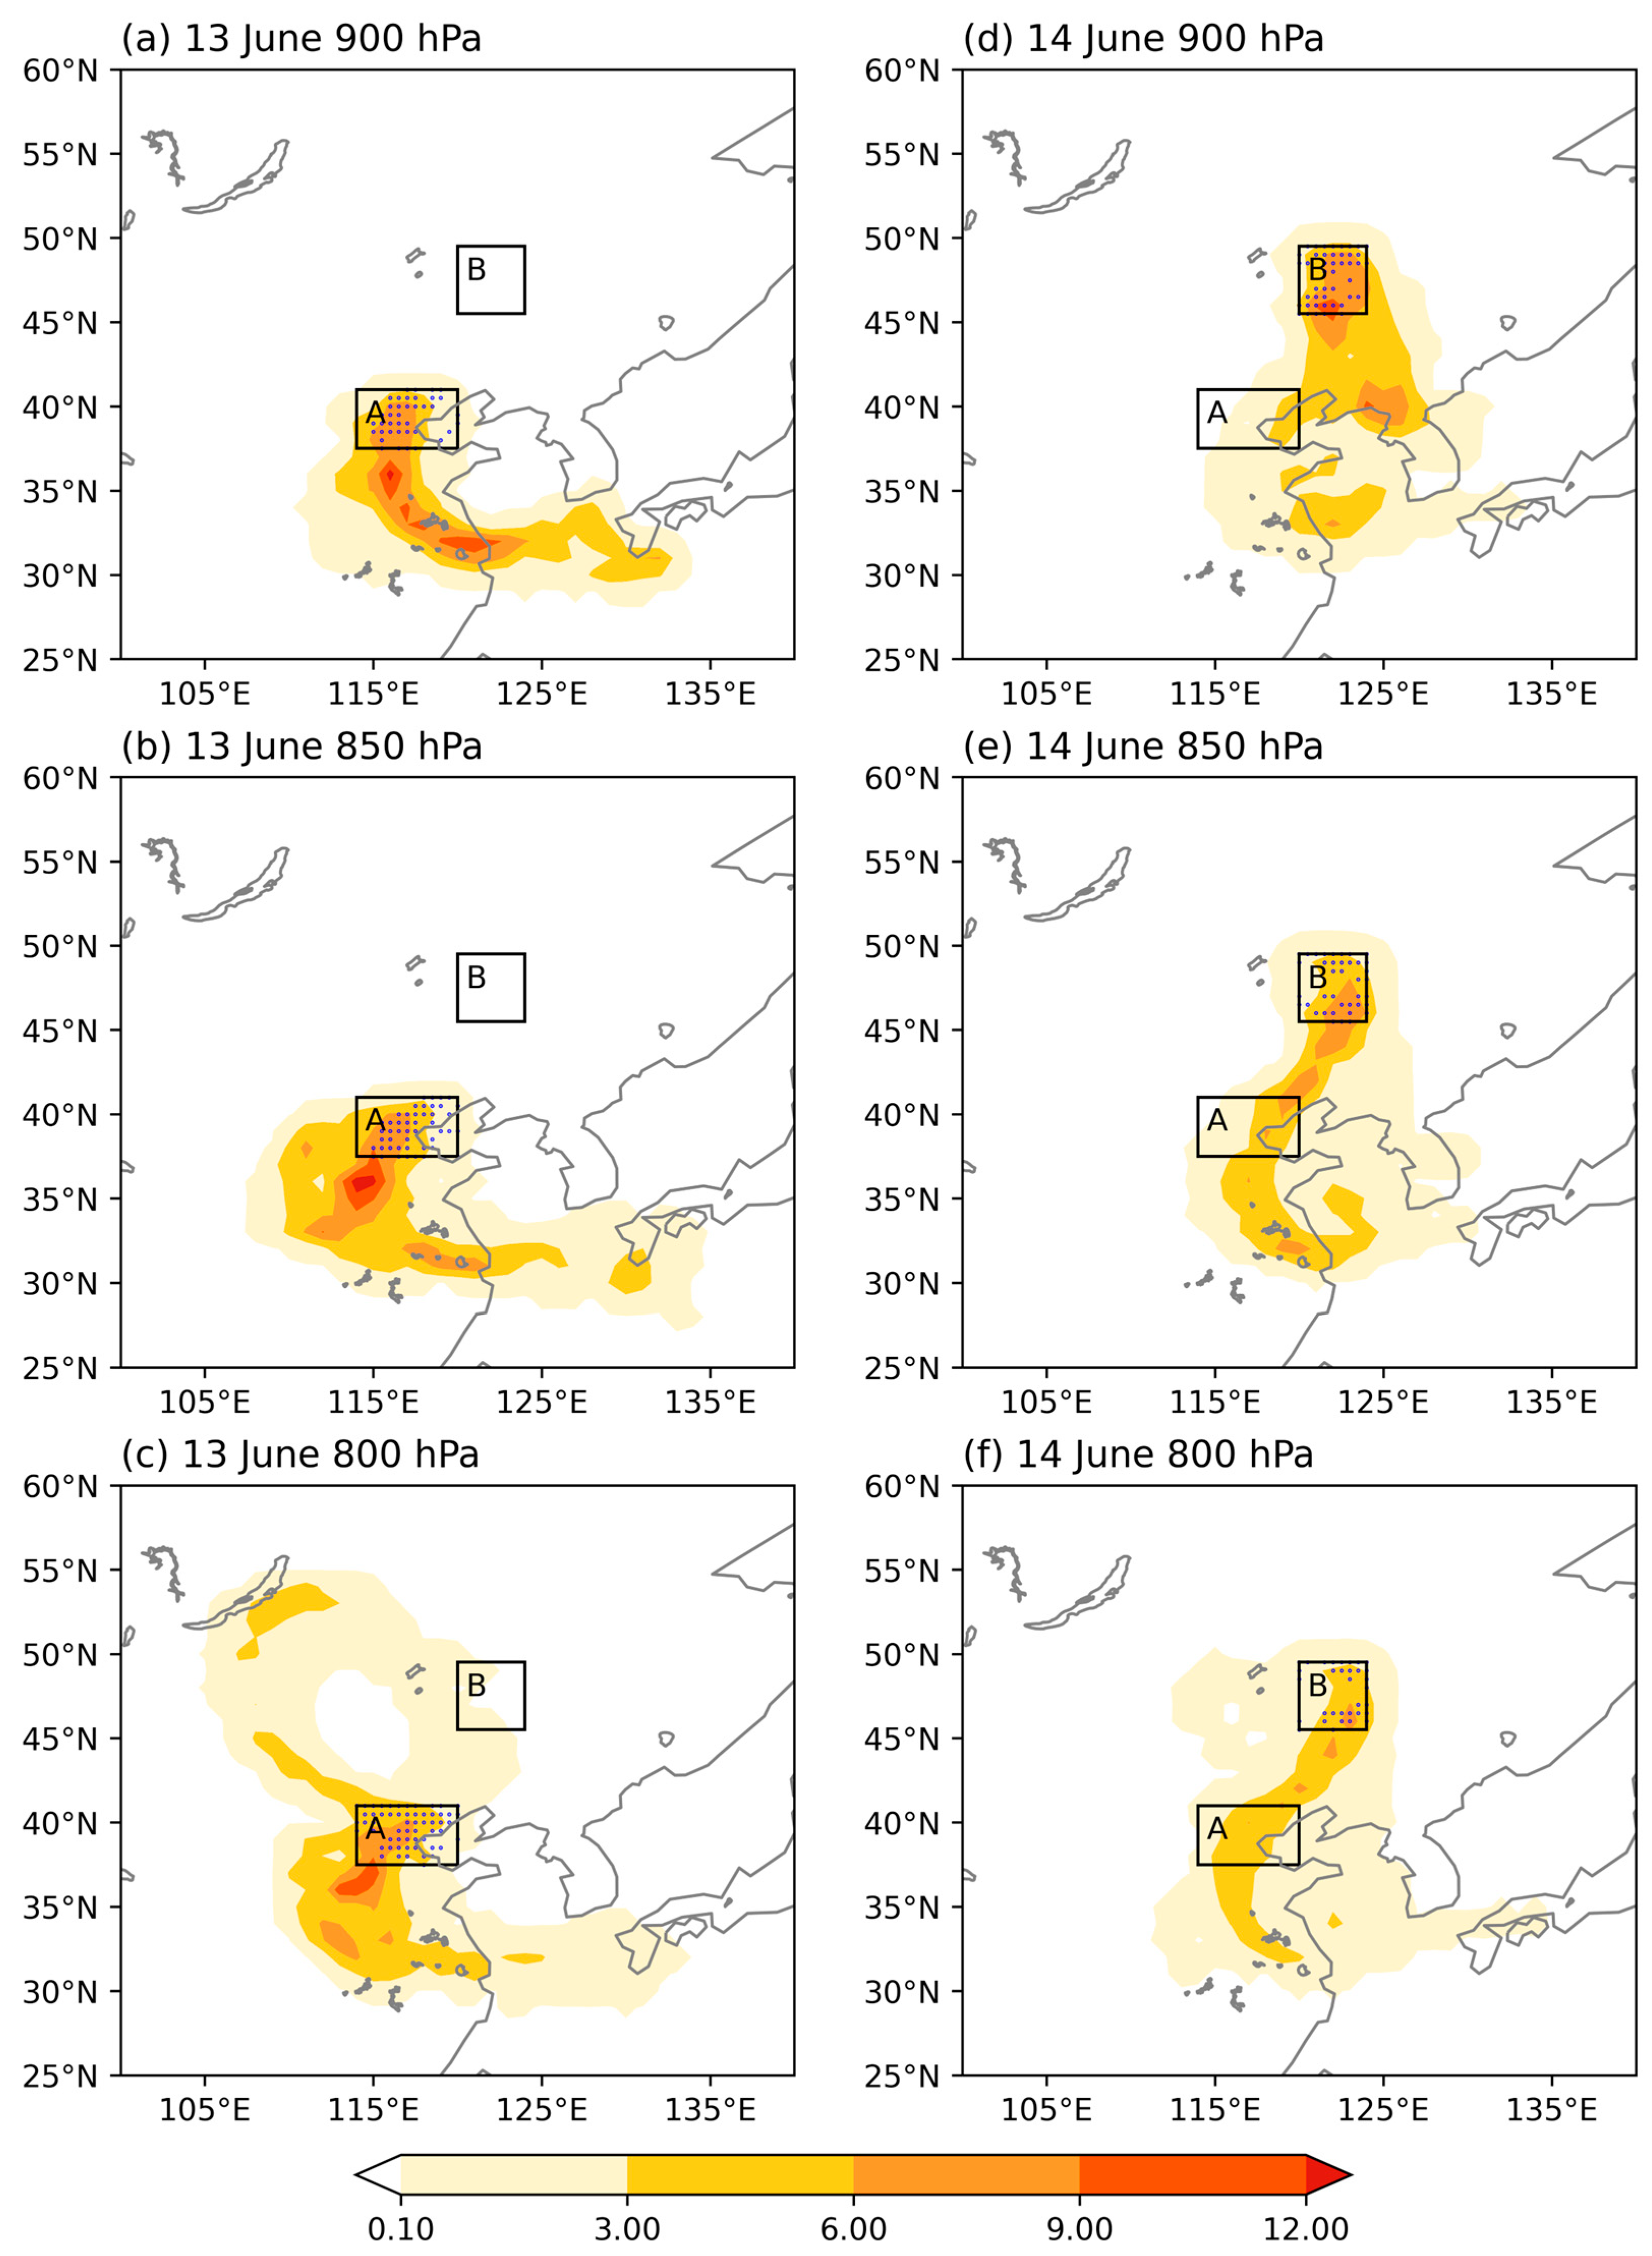
Figure 3 depicts three-day backward trajectory densities of moist air trajectories from 00 UTC on 13 and 14 June for Regions A and B at 800–900 hPa, respectively. Moist air predominantly originated from the Yellow Sea, particularly the Bohai Coast, aligning well with the water vapor flux pattern. Considering Region A, a prominent trajectory density formed an “L” shape originating from the southern Yellow Sea, passing over the Lower Yangtze River Plain and extending towards the North China Plain at 900 hPa (
Figure 3a). At higher pressure levels, trajectory densities of moist air increased over the North China Plain, showing a northeast–southwest pattern, indicative of southwesterly in the southeastern part of the NCCV (
Figure 3b,c). Furthermore, at 800 hPa, a notable southeastward trajectory density of moist air from Lake Baikal converged with the warm, moist air from the North China Plain and the Yellow Sea within Region A.
In comparison to Region A, Region B exhibited a meridional distribution of trajectory density with less variation among the three pressure levels. The notable density of moist air trajectories was primarily observed over the Northeast China Plain, the Bohai Sea, and the northern part of the East China Sea (
Figure 3d–f), implying that moist air was conveyed by the southerly associated with the deepened NCCV. The increased density of moist air trajectories revealed a progressively concentrated and hook-shaped belt extending from the East China Sea, through the North China Plain, and into Region B across pressure levels from 900 hPa to 800 hPa. This outcome signifies a shift in the moist air transport from southerly to southwesterly flows as altitude increases.
To illustrate the vertical variation of trajectory density,
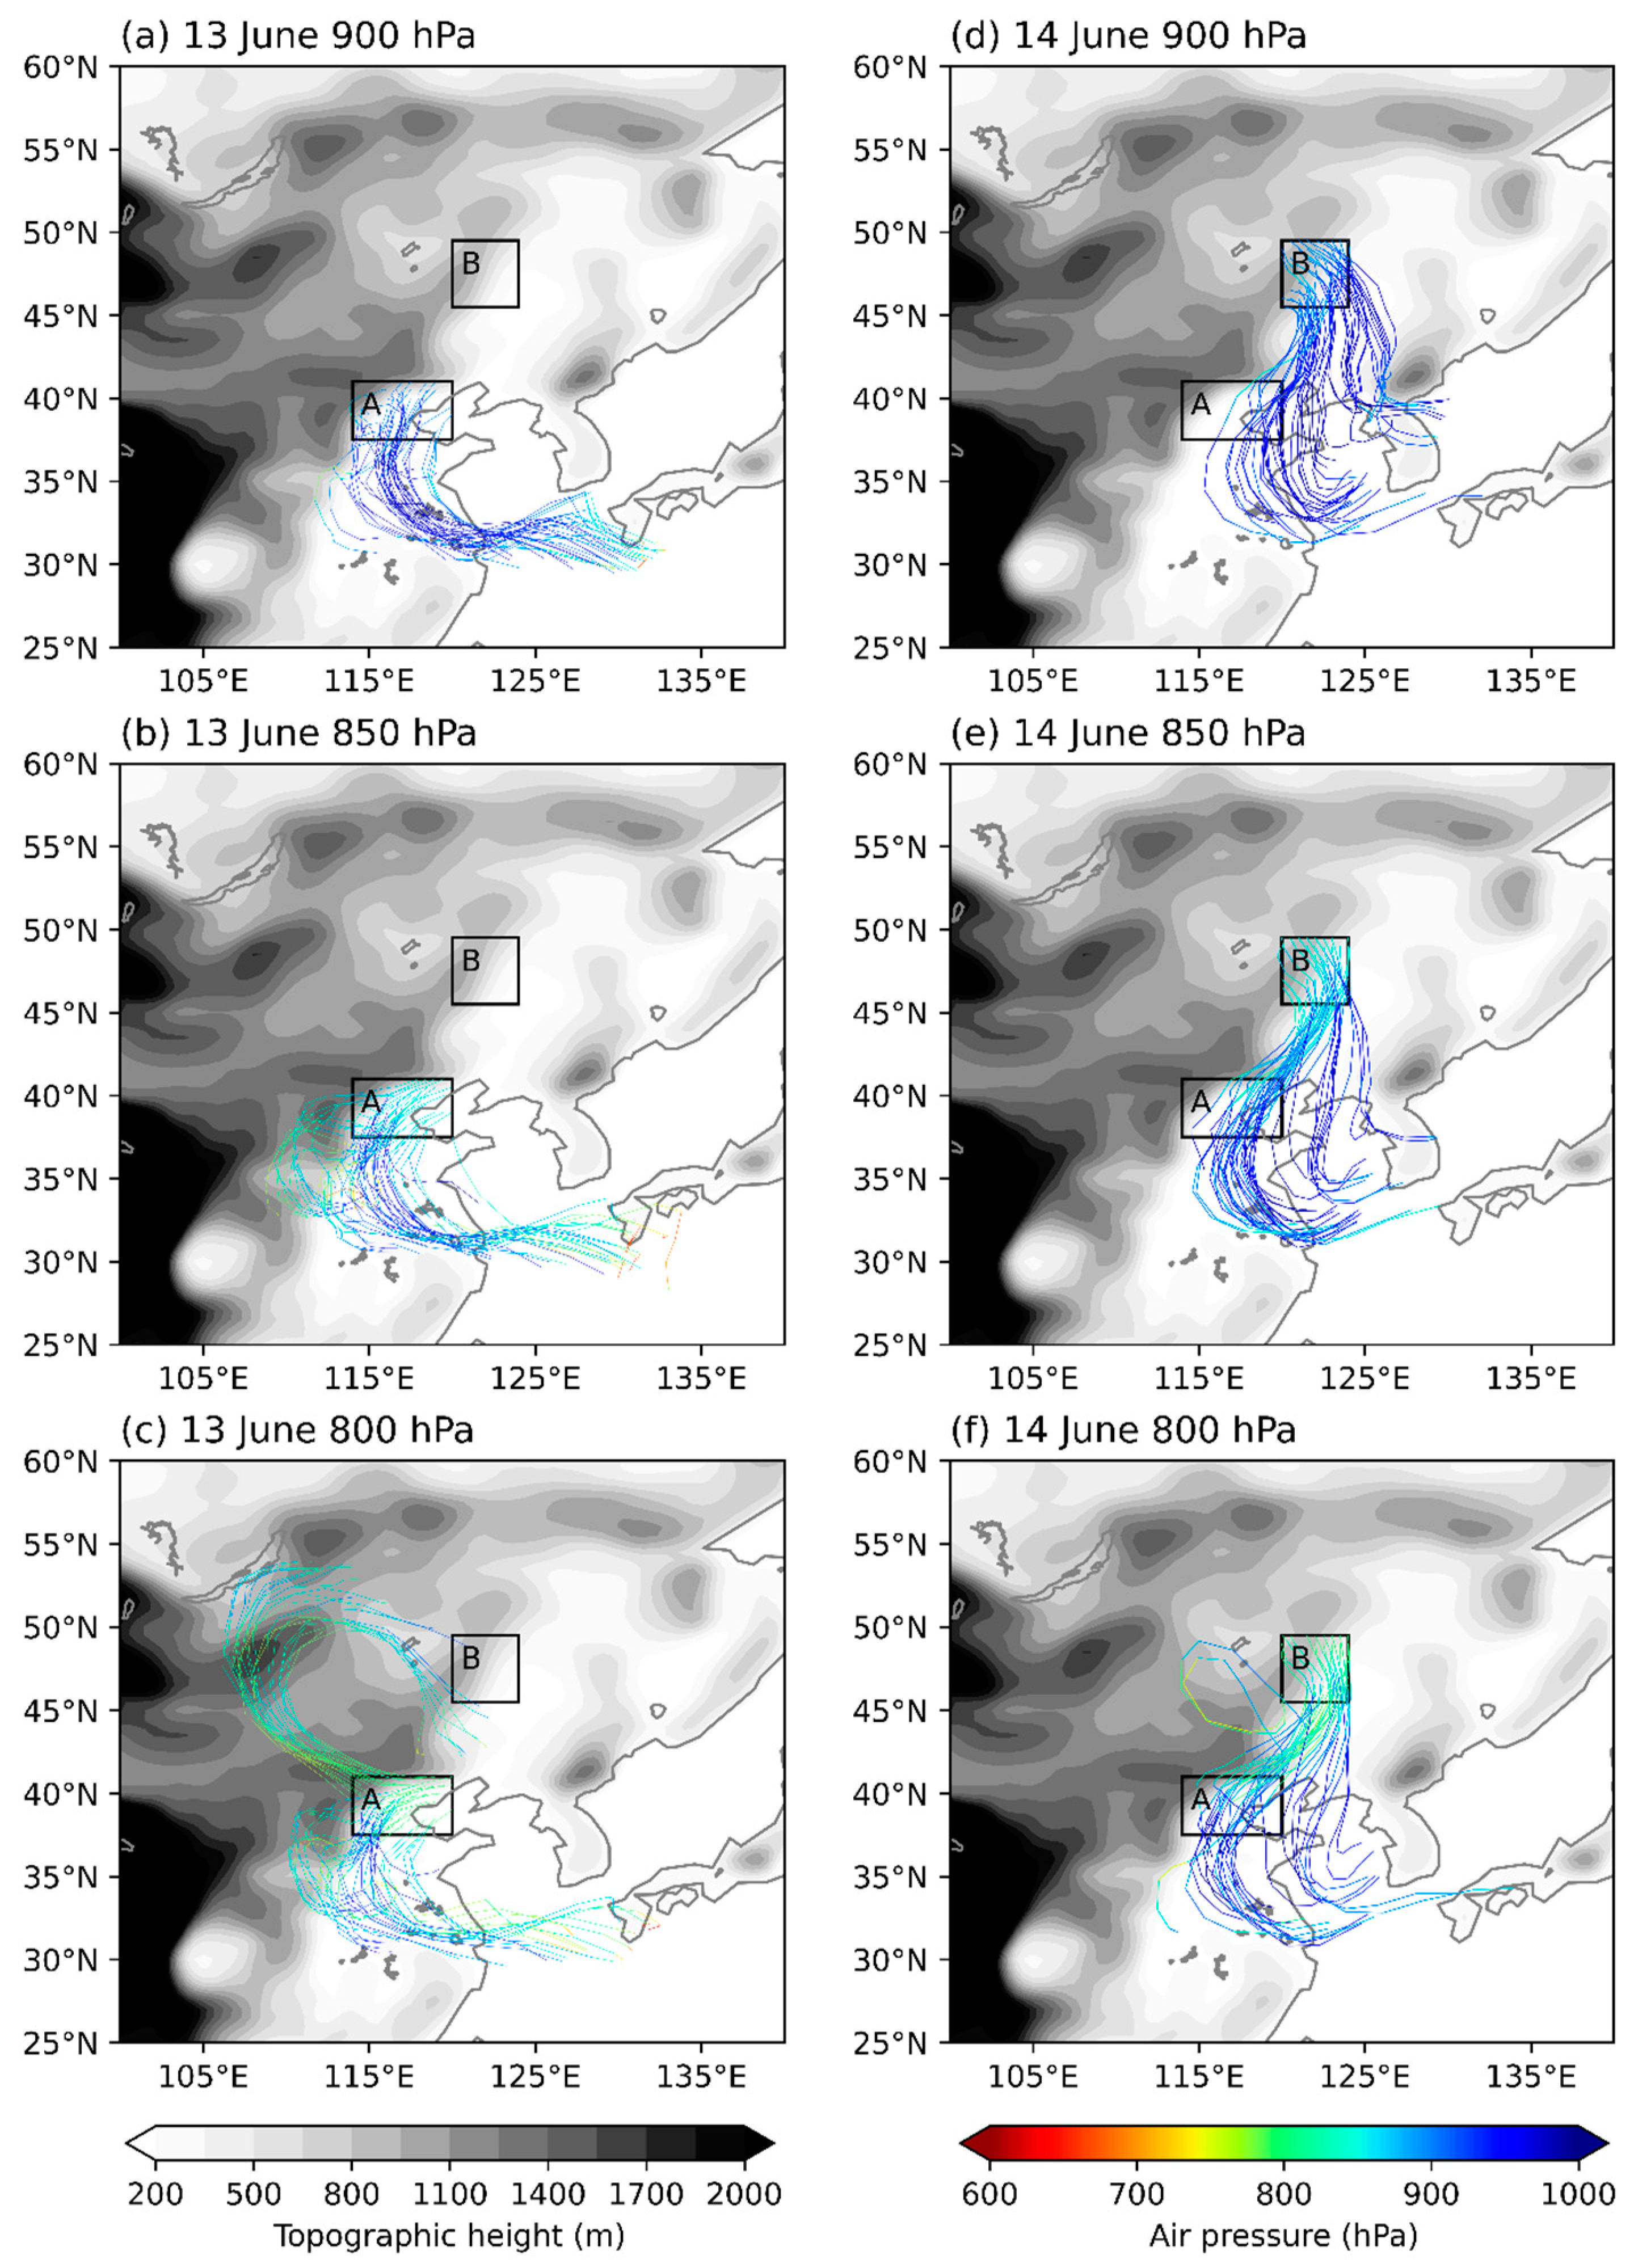
Figure 4 presents the horizontal and vertical positions of each moist air trajectory for the two backward tracks. These trajectories reveal more sources as topological obstructions attenuate with decreasing pressure, particularly noticeable for Region A. Considering Region A initially, the trajectories consistently demonstrated a pattern at 900 hPa where moist air descended from around 800 hPa in the northern part of the East China Sea and then traveled horizontally across the North China Plain (
Figure 4a). However, the count of these trajectories declined from 850 hPa to 800 hPa. Instead, in comparison to 900 hPa, there were more trajectories originating from the Middle and Lower Yangtze River Plain as pressure decreased, surmounting the Taihang Mountains and descending along their leeward slope to Region A (
Figure 4b). To the higher level of 800 hPa (
Figure 4c), additional northward trajectories emerged, depicting moist air ascending from lower levels northwestward, then shifting southeastward over the mountains and reaching Region A.
In contrast, Region B exhibited more coherent features that trajectories were primarily distributed to the east of the mountains (
Figure 4d–f). Moist air originating from the northern part of the East China Sea was transported horizontally northward and then lifted against the Great Khingan Mountains within the precipitation zone. The number of trajectories progressively diminished from 900 hPa to 800 hPa, with a more noticeable decline observed in the case of trajectories originating from the Sea of Japan region. Meanwhile, as the pressure level decreased, trajectories over the North China Plain increasingly displayed an anticyclonic curvature towards the lee side of the Taihang Mountains. Furthermore, at the 800 hPa level, two cyclonic trajectories were identified over the Great Khingan area. Despite these trajectories originating from similar near-ground levels across the three pressure levels, a distinct upward motion was observed in Northeast China for the 800 hPa level. The increasing curvature and upward motion strongly suggest the influence of the NCCV.
The distinction in trajectories between Regions A and B could potentially result from varying NCCV stages. To confirm this hypothesis, we investigated the circulation features.
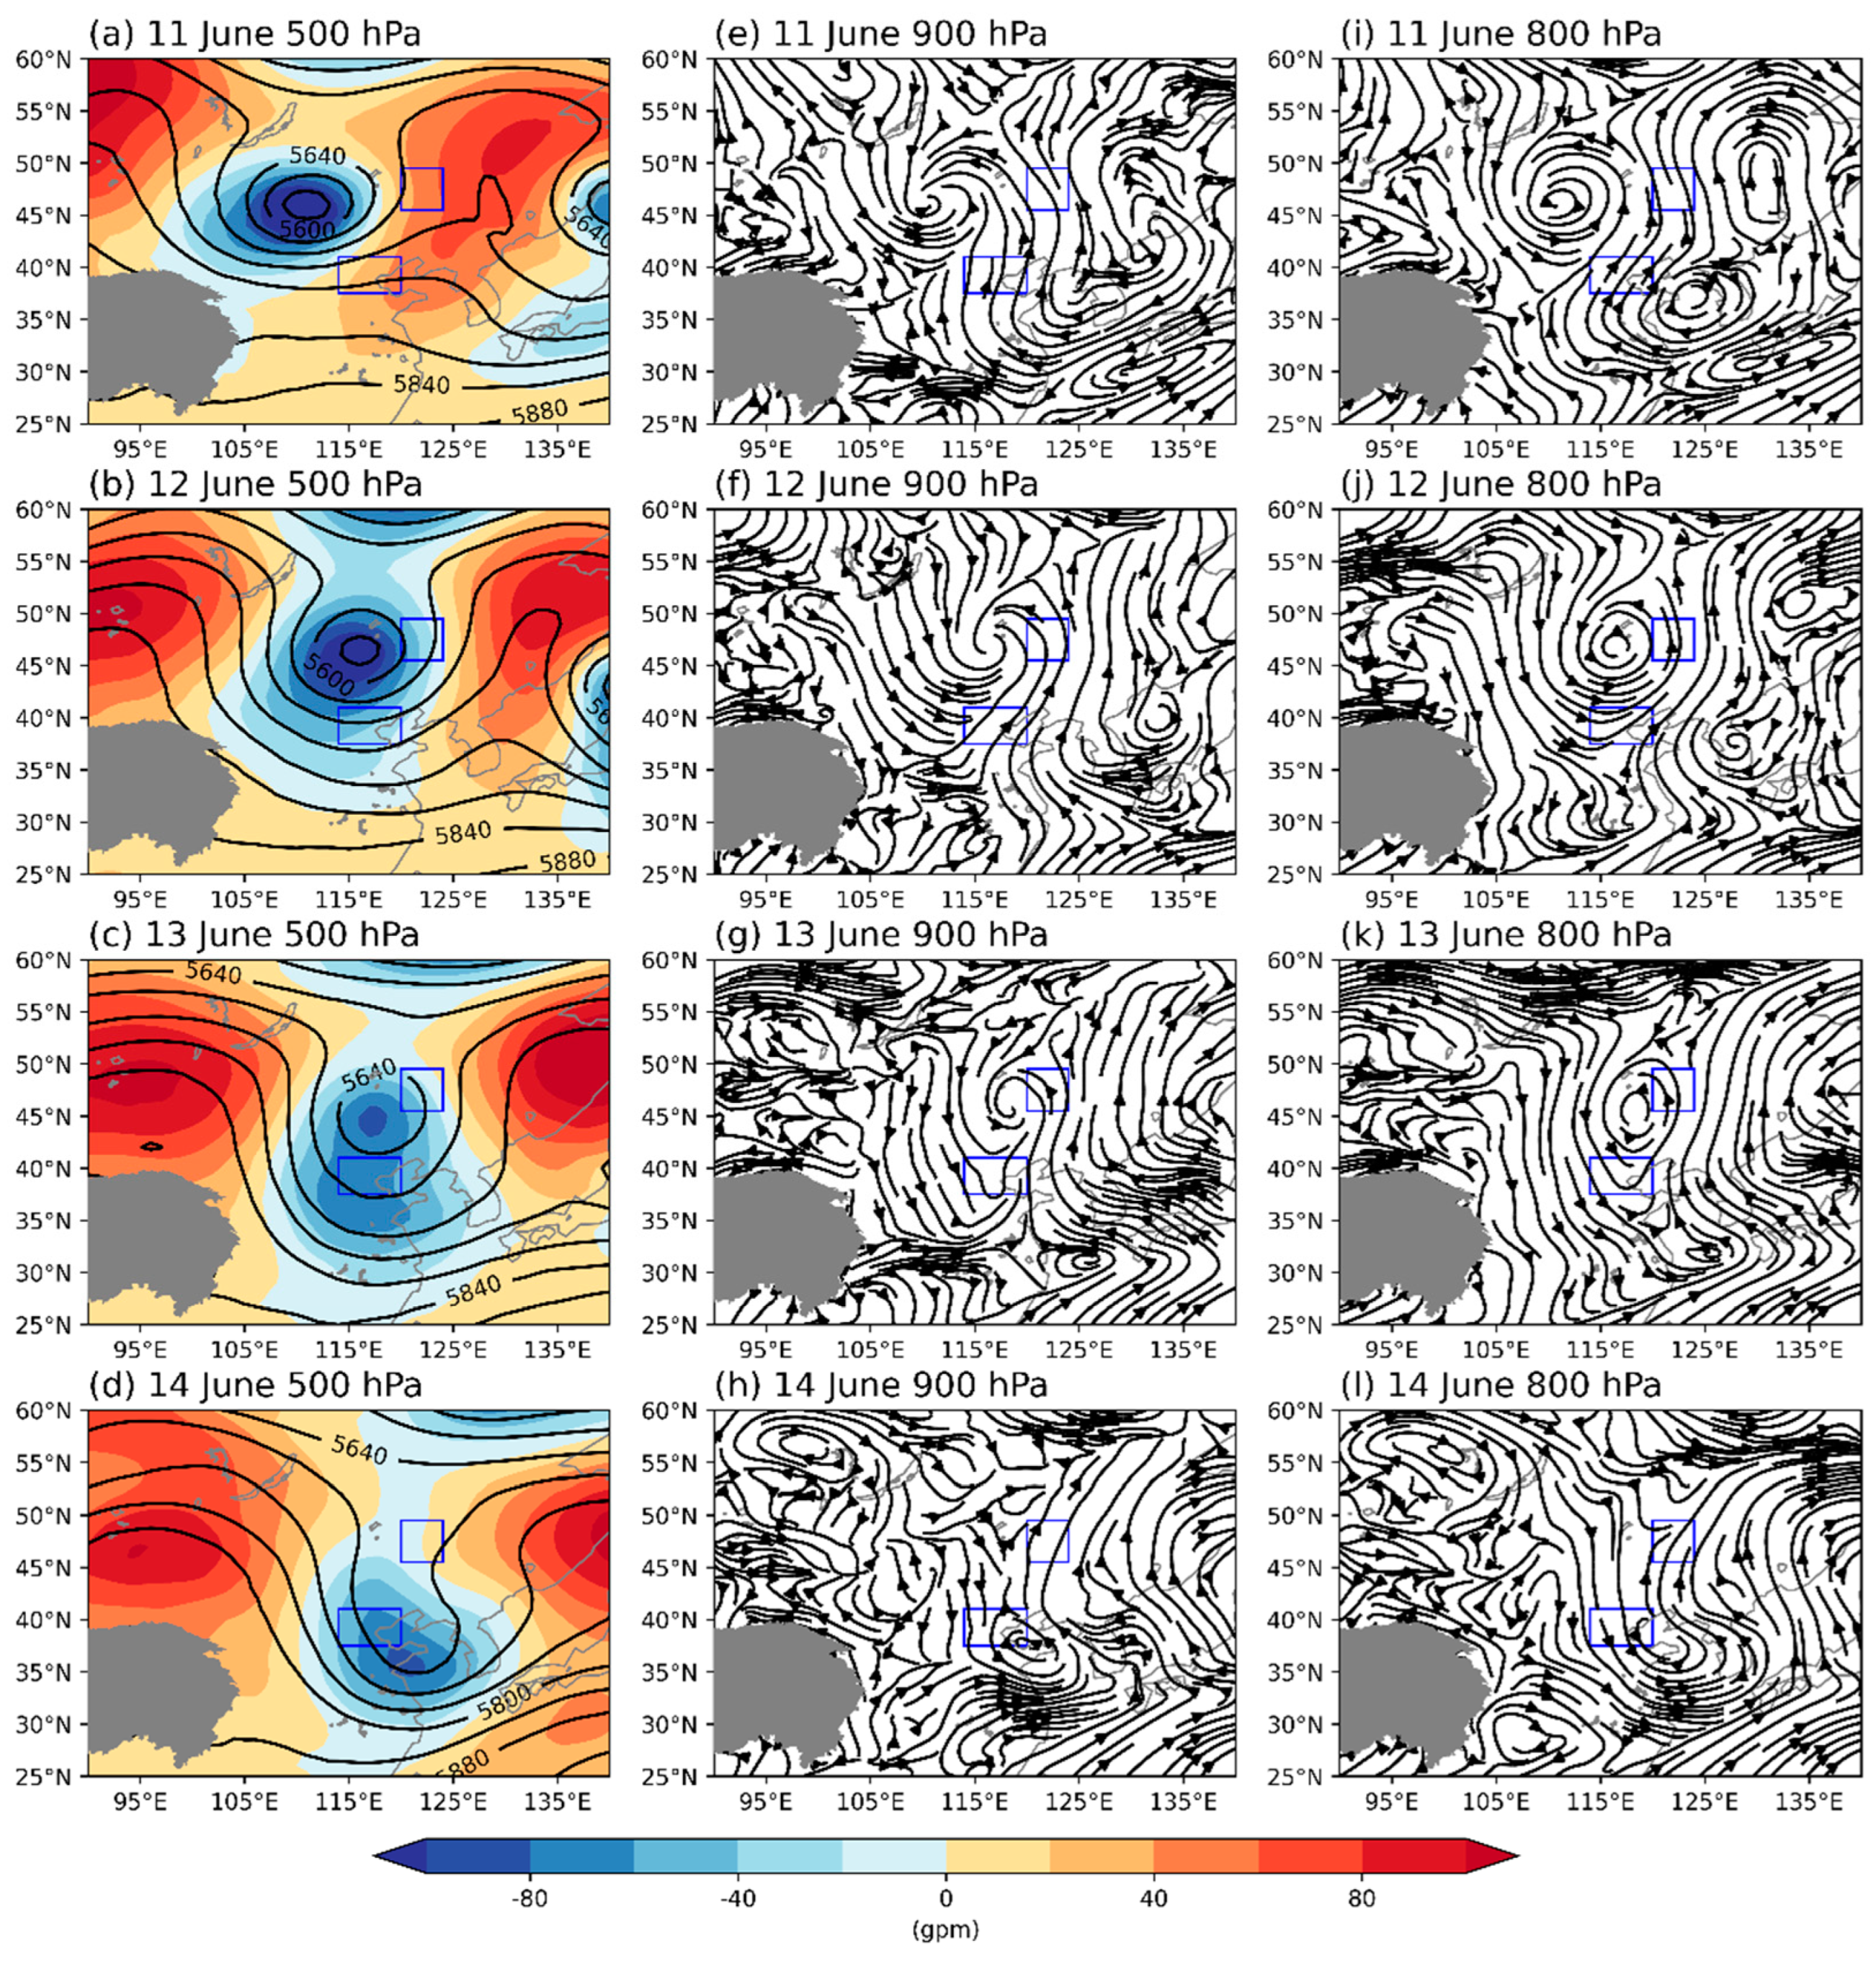
Figure 5 displays daily 500 hPa geopotential height along with 800- and 900 hPa streamlines from 11 to 14 June. In the mid-troposphere (
Figure 5a–d), a quasi-stationary “ridge-trough-ridge” structure dominated northern China. The NCCV gradually moved southeastward from Mongolia to eastern Inner Mongolia, with a trough deepening southward toward the Yangtze River. Lower tropospheric streamlines resembled the geopotential height field patterns, displaying an “anticyclonic-cyclonic-anticyclonic” airflow (
Figure 5e–l), accompanied by an additional cyclonic airflow in the subtropical region. Between this cyclonic pattern and Northeast China, pronounced easterly airflow was evident over the southern Yellow Sea and northern East China Sea on 11 June (
Figure 5e,i), carrying moist air westward to the Yangtze River. As the NCCV continued to deepen and shifted eastward north of Region A (
Figure 5b), southerly airflow dominated over the North China Plain (
Figure 5f,j), consistently conveying moist air from the Yangtze River northward to Region A. Simultaneously, northwesterly airflow prevailed from Lake Baikal toward Region A on the west of the NCCV. As the NCCV further intensified southward, Region A became influenced by northerly airflow, resulting in the southward shift of rainfall (
Figure 1c and
Figure 5c–l). In contrast, Region B was situated between the NCCV (cyclonic flow) and its downstream ridge (anticyclonic flow). Consequently, Region B was under the influence of southerly airflow during the period of rainfall induced by the NCCV. Despite the fact that the NCCV weakened and elongated southward from 13 to 14 June, the convergence of southerly airflow persisted over Region B, contributing to favorable conditions for heavy rainfall, particularly at 800 hPa.
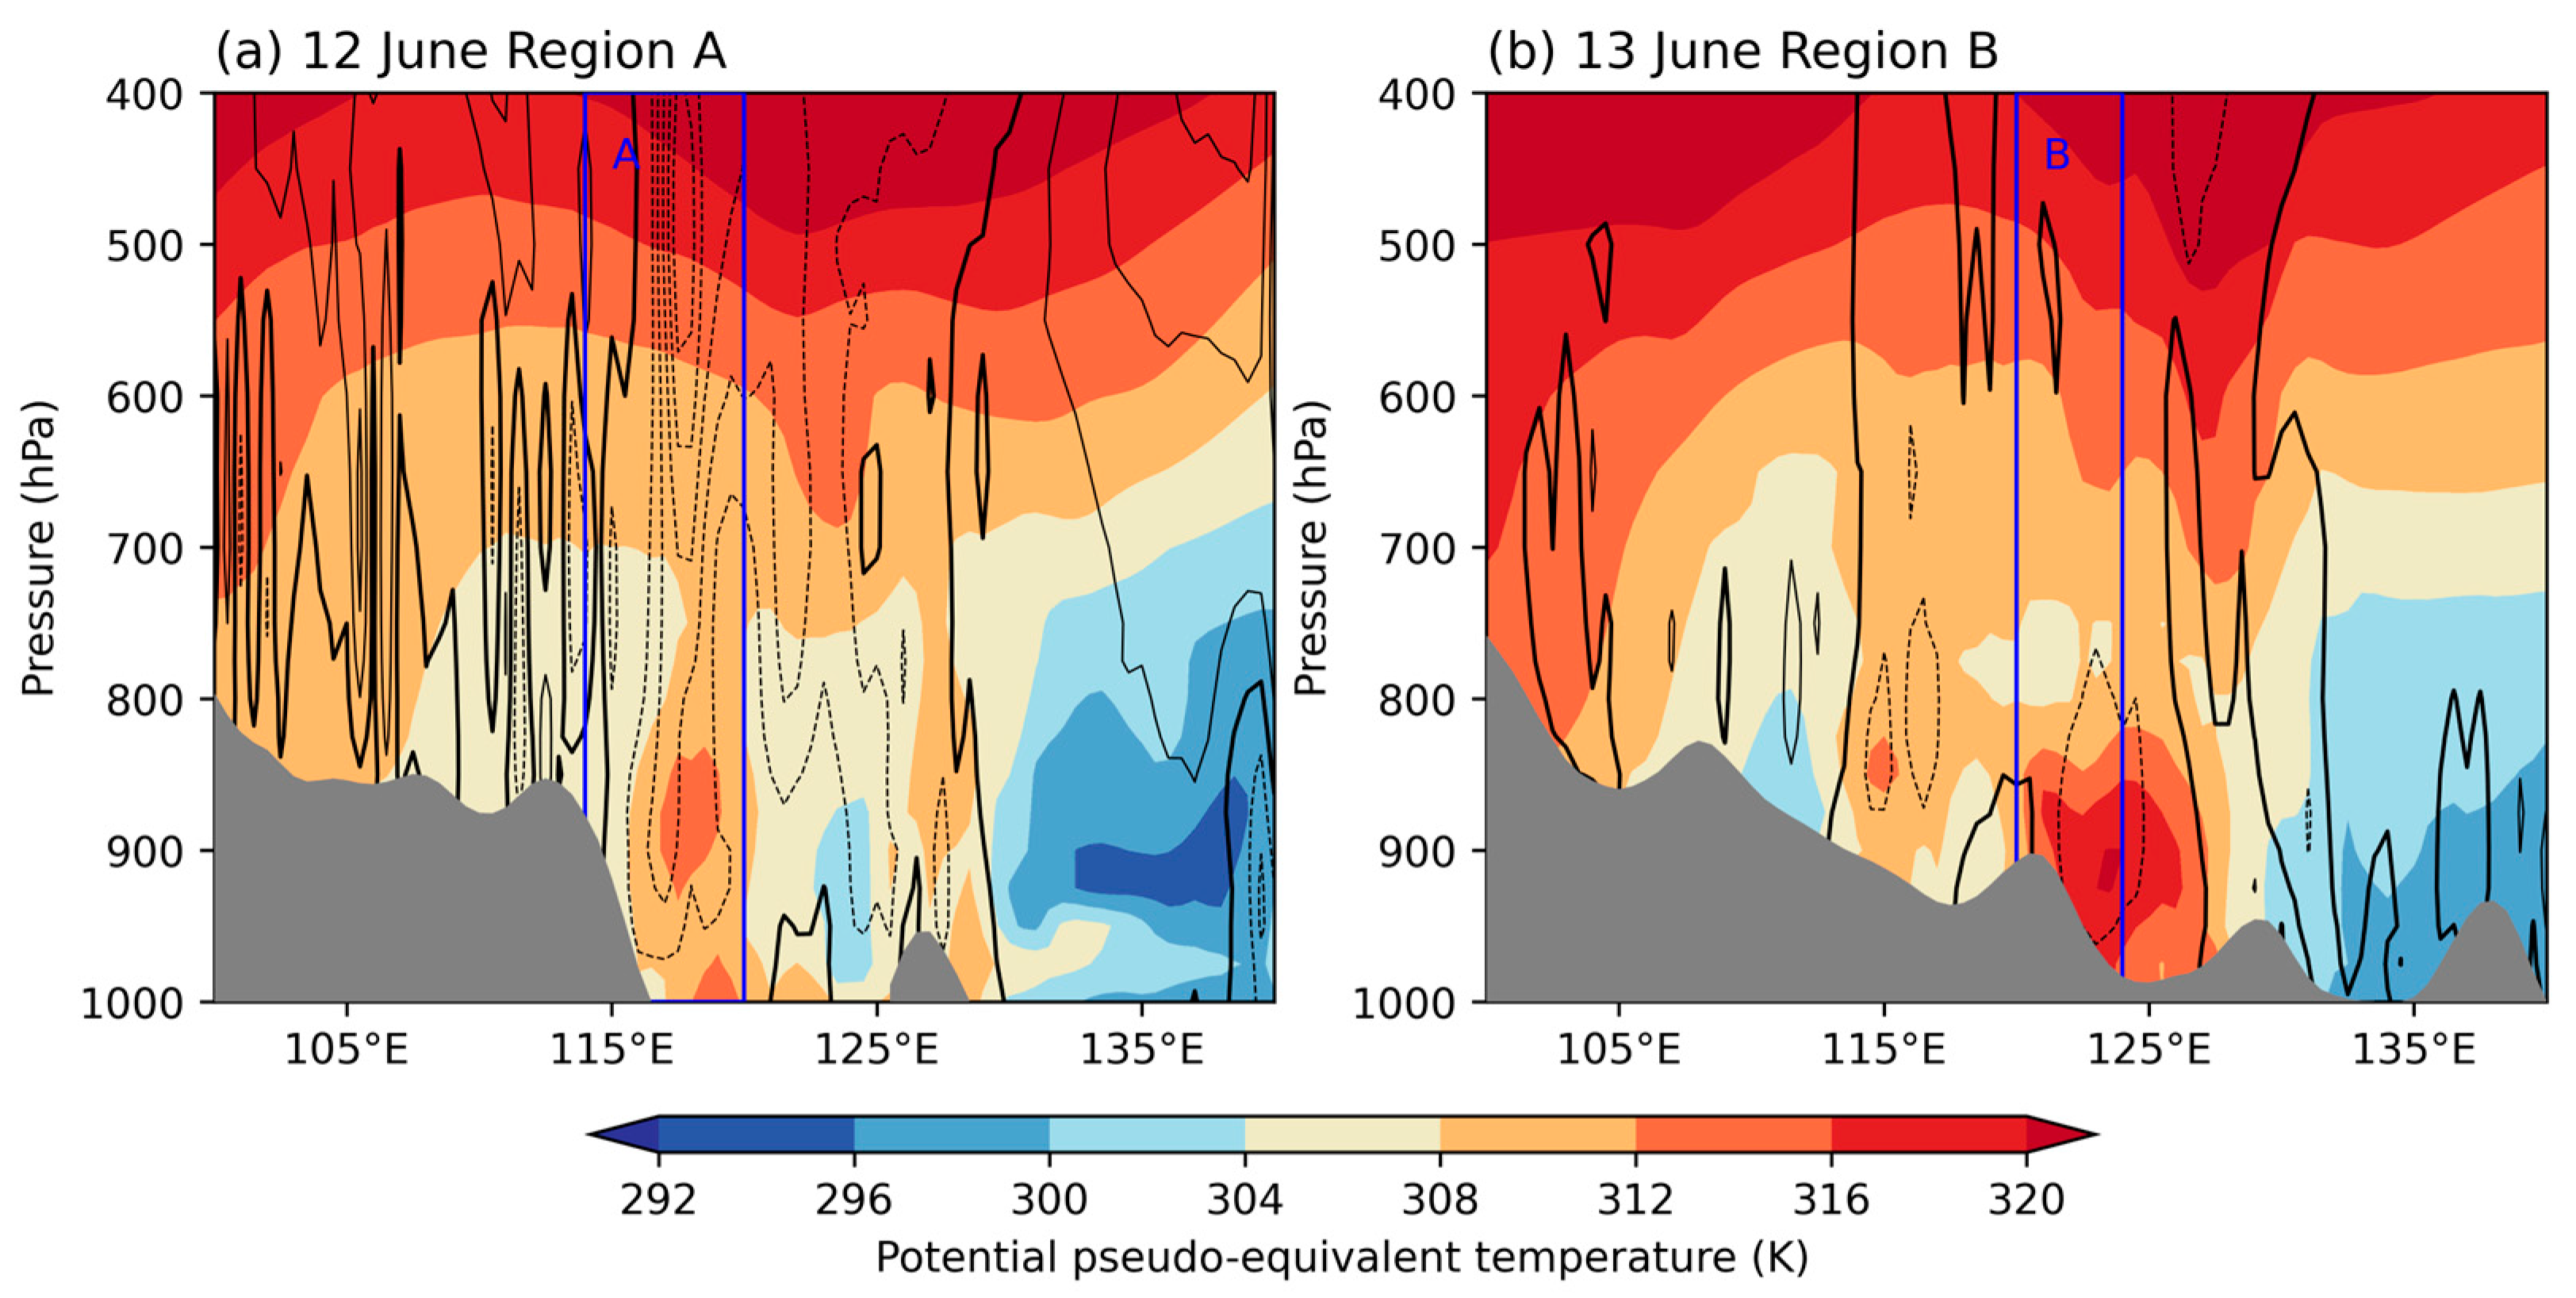
The accumulation of moist air could induce changes in stratification stability within the local environment.
Figure 6 illustrates zonal mean pressure-longitude cross-sections of potential pseudo-equivalent temperature (θ
se) and vertical velocity on 12 June over Region A and 13 June over Region B. The pseudo-equivalent temperature incorporates moisture content, allowing it to effectively encompass the impact of moisture on atmospheric stability and vertical motion. Notably, a maximum of 314.05 K for θ
se was observed around 850 hPa over Region A (
Figure 6a). The θ
se gradually declined from 850 hPa up to 800 hPa, indicating a condition of convective instability that triggers upward motion. A deep neutral stratification was apparent between 800 hPa and 600 hPa, fostering the development of ascending motion. Detailed examination of vertical velocity revealed predominant upward motions in Region A, with a center reaching −0.59 Pa·s
−1 between 600 hPa and 400 hPa, coinciding with a stable stratification layer. This finding suggests that, aside from unstable stratification, the significant vertical shear of positive vorticity advection linked to the NCCV induced notably deep upward motions. Consequently, more intensive and extensive rainfall was associated with the NCCV over the Bohai Coast (
Figure 1a,b).
In contrast to Region A, Region B exhibited a strong maximum of θ
se, reaching 320.20 K, and a deeper convective unstable stratification in the lower troposphere (
Figure 6b). However, the upward motion in Region B was comparatively shallower and weaker, primarily confined within the unstable stratification on the lee side of the Greater Khingan Mountains. Southerly airflow ascended as it encountered the Great Khingan Mountains and then continued to rise within the unstable stratification across Region B. Consequently, heavy precipitation in Region B primarily resulted from a combination of favorable water vapor conditions, terrain-induced uplift, and the release of unstable energy (
Figure 1c).
4. Conclusions
This study focused on the southeast (Region A) and the northeast (Region B) of the NCCV from 11–14 June 2022, utilizing the ERA5 reanalysis data. Throughout this course, the mid-troposphere demonstrated a quasi-stationary “ridge-trough-ridge” pattern dominating over northern China, accompanied by an “anticyclonic-cyclonic-anticyclonic” airflow in the lower troposphere. As the NCCV gradually intensified southward and shifted eastward, there were discernible differences in the source and transport of water vapor between Regions A and B. These variations were studied through three-day backward Lagrangian tracking using the LAGRANTO model. Based on the trajectories of water vapor, we further investigated the precipitation trigger mechanisms, considering factors such as stratification stability, vertical velocity, and terrain effects.
The primary water vapor source for rainstorms associated with the NCCV originated from the Yellow Sea, forming an “L” shape trajectory toward both Regions A and B. However, the trajectories of moist air displayed distinct variations in their horizontal and vertical movements between these two regions. With the decrease in pressure level and the southeastward shift of the NCCV, Region A underwent an increasing influence of southwesterly and northwesterly airflow. Consequently, between approximately 850 and 800 hPa, Region A witnessed the inclusion of two additional trajectories originating from the Yangtze River and Lake Baikal, respectively. In contrast, Region B was situated between cyclonic and anticyclonic airflow and featured more similar trajectories. Moist air was transported horizontally northward from the northern part of the East China Sea due to southerly, and it ascended upon encountering the Great Khingan Mountains.
While the accumulation of moist air did contribute to an unstable stratification conducive to triggering upward motion, the influence of NCCV-driven upward motion through vorticity advection was significantly more impactful. With the NCCV’s southward intensification and eastward shift, it not only caused approximately three primary trajectories of moist air over Region A but also introduced substantial vertical shear of positive vorticity advection toward this area. As a result, a deep and intense upward motion dominated the troposphere in Region A, leading to more extensive and intensive rainstorms. In contrast, Region B was characterized by a dominant southerly airflow pattern, causing moist air to converge on the lee side of the Great Khingan Mountains. While this moist air induced a more pronounced unstable stratification in the lower troposphere, the weak and shallow upward motion remained confined within this unstable layer. Consequently, the rainfall in Region B was weaker and more localized compared to Region A.
This study primarily focused on examining the water vapor transportation and trigger mechanisms of rainstorms within two significant regions influenced by an NCCV event. The discussion regarding upward motion was conducted with a preliminary consideration of the NCCV distribution and stratification stability. In our upcoming research endeavors, we intend to encompass a broader spectrum of rainstorms associated with various NCCV events. Additionally, we aim to quantitatively analyze the contributions of both dynamical and thermal forcings to vertical motion using the quasi-geostrophic omega equation.
