Article

Drought Monitoring of Spring Maize in the Songnen Plain Using Multi-Source Remote Sensing Data

School of Architecture, Nanyang Institute of Technology, Nanyang 473004, China
*
Author to whom correspondence should be addressed.
Atmosphere 2023, 14(11), 1614; https://doi.org/10.3390/atmos14111614
Submission received: 18 September 2023 / Revised: 22 October 2023 / Accepted: 24 October 2023 / Published: 27 October 2023
(This article belongs to the Special Issue Climate Extremes in China)

Abstract

:
Agricultural production is highly susceptible to the impact of drought. How to improve agricultural drought-monitoring capability has always been a research hotspot. Based on multi-source remote-sensing data, a novel comprehensive drought index (CDI) for spring maize was developed using the random forest model, and its feasibility was tested by using agricultural drought indices and agricultural statistics in this study. Then, the spatiotemporal characteristics of spring maize drought in the Songnen Plain from 2001 to 2018 were evaluated using the CDI. The results showed that: (1) the CDI effectively monitored spring maize drought in the Songnen Plain, outperforming other drought indices. (2) The monitoring results indicated that spring maize in the Songnen Plain was affected by large-scale droughts in 2001, 2004, 2007, and 2017, which was consistent with national drought disaster statistics. (3) By changing the drought barycenter, the drought barycenter of spring maize generally tended to the south and west of the Songnen Plain, so drought-prevention measures should be strengthened in these areas in the future. While factors affecting crop yield extended beyond drought, the variations in spring maize yield indirectly reflected the effectiveness of drought monitoring in this study.

1. Introduction

Drought is a serious natural disaster that involves agricultural production, ecological environment, and socio-economic aspects [1,2,3,4]. According to statistics, over the past 20 years, the average annual economic loss caused by drought was around USD 20 billion globally [5]. During the period from 2000 to 2019, drought affected approximately 1.4 billion people [6]. Furthermore, the impact of drought on agriculture is nearly devastating, posing an extreme threat to regional food security [7,8]. With the increasing frequency of drought events, strengthening agricultural drought monitoring and warning has become an urgent issue for all countries and areas [9,10].
Agricultural drought involves multiple factors such as the atmosphere, soil, and crops, and the drought process is very complex. Even at different stages of crop growth, drought can have varied effects on crop yield [11,12,13]. In order to fully understand the process of drought occurrence and development, researchers have been dedicated to the study of drought indices closely related to crops [14]. Due to their high precision and lengthy time series, ground station observation data have traditionally played a positive role in agricultural drought monitoring [15]. The drought indices involved include the standardized precipitation evapotranspiration index (SPEI), which takes temperature and precipitation into account; the precipitation anomaly in percentage (Pa), which only considers precipitation; and the crop water deficiency index (CWDI), which considers crop characteristics [16]. However, due to the unequal spatial distribution of ground stations, it is impossible to adequately depict surface drought information. Recently, remote-sensing technology has shown significant advantages in agricultural drought monitoring, with excellent timeliness, wide spatial coverage, and strong information comprehensiveness [17,18,19]. Currently, scholars mainly carry out agricultural drought monitoring from three perspectives based on remote-sensing technology: soil moisture inversion, crop state index development, and comprehensive drought index construction [20,21]. For soil moisture inversion, the thermal inertia method, characteristic space method, and microwave remote-sensing method were commonly used in research to obtain information for drought monitoring. However, different crops may have varied soil moisture requirements, which may not indicate crop drought, and thus there has been some confusion [22]. For crop state index development, greenness, heat, and other indicators are commonly used to reflect the drought stress on crops. The relevant indices include the normalized vegetation index (NDVI), the vegetation condition index (VCI), the temperature condition index (TCI), and so on [23,24]. Recently, there has been significant progress in the remote-sensing inversion of solar-induced chlorophyll fluorescence (SIF). SIF data can reflect the stress state of plants under drought and is considered a promising drought indicator [25,26,27]. However, agricultural drought involves many factors, and remote-sensing data with a single data source may not accurately reflect crop drought information. At present, it has become mainstream to build comprehensive drought models by integrating multi-source data and comprehensively considering various environmental factors of crop growth [28,29]. This kind of comprehensive drought-monitoring method is theoretical and comprehensive, which has laid a good theoretical basis and technical means for regional agricultural drought monitoring and evaluation. However, there is relatively little research on specific crop drought in agricultural drought monitoring, and most studies do not fully consider the characteristics of the crop growth period, lacking certain accuracy. These need to be further explored.
The Songnen Plain, located in the northeast of China, plays a vital role in guaranteeing China’s food security, with spring maize being its main grain crop [30]. Due to the interference of the monsoon climate and drought trend, spring maize is prone to drought during its growing period in the Songnen Plain, and drought is the main agrometeorological disaster that affects the stability of spring maize yields [31]. Drought disasters occur frequently in the Songnen Plain as a result of global warming, and the risk of spring maize drought disasters will continue to increase [32]. So, it is urgent to strengthen research on spring maize drought monitoring in the Songnen Plain in order to promote the sustainable and stable development of regional agriculture.
In view of the above analysis, a novel comprehensive drought index (CDI) in each growth period for spring maize was developed by integrating multi-source remote-sensing data, and the drought of spring maize in the Songnen Plain from 2001 to 2018 was evaluated using the CDI. The following are the key goals: (1) to develop a novel comprehensive drought index for spring maize by using multi-source remote-sensing data; (2) to verify the feasibility of the CDI by comparing other drought indices and agricultural drought statistics; (3) to monitor and assess spring maize drought in the Songnen Plain based on the CDI.

2. Materials and Methods

2.1. Study Area

The Songnen Plain is the main component of the Northeast China Plain, with abundant agricultural resources (Figure 1) [33]. The annual precipitation of the Songnen Plain is 400–800 mm, with nearly 3000 h of sunshine and an average annual temperature of 2–6 °C [34]. Due to the simultaneous impact of rain and heat, the Songnen Plain is highly susceptible to drought and flood disasters. The Songnen Plain’s water resources are distributed unevenly, with most parts relying on dryland agriculture, while the western region focuses on animal husbandry and mountain forestry. The main crops in the Songnen Plain are wheat, rice, and maize, which are important commodity grain bases in China. The maize belt of the Songnen Plain and the maize belts of the United States and Ukraine are known as the world’s three golden maize belts.

2.2. Data

Crop data: the growth stage data, yield data, and disaster data for spring maize in the study were obtained from the China Meteorological Data Service Centre (CMDC) (http://data.cma.cn/) (accessed on 28 October 2022) and the National Bureau of Statistics of China (http://www.stats.gov.cn/) (accessed on 16 November 2022). The five growth stages of spring maize were determined using the literature [35]: the sowing to the seedling stage (from late April to mid-May), the emergence to the jointing stage (from late May to mid-June), the jointing to the heading stage (from late June to mid-July), the heading to the milk-mature stage (from late July to mid-August), and the milk-mature to the mature stage (from late August to late September). For simplicity of expression, we named the whole growth stage A0 and the five growth stages A1, A2, A3, A4, and A5 respectively [36].
Meteorological data: the meteorological data of 51 stations in the study area from 1981 to 2018 were extracted from the daily value data set of China’s surface climate data (V3.0) provided by CMDC (Figure 1), mainly including temperature, precipitation, atmospheric pressure, relative humidity, wind speed, sunshine and other data. These data have been corrected repeatedly and have been widely used in research [37,38]. The meteorological data in this study were mainly used to calculate various drought indices.
Remote-sensing data: the detailed information on the remote-sensing data used in this study is listed in Table 1. To improve accuracy, all remote-sensing data were processed to a spatial scale of 1 km. Specifically, TRMM and SIF data were downscaled due to their low spatial resolution, while other remote-sensing data were resampled to 1 km. In the study, based on the growth stage of spring maize, remote-sensing products for each growth period of spring maize in the study area from 2001 to 2018 were obtained using the maximum value composite (MVC). In this study, Modis products were mainly preprocessed using Modis Reprojection Tools (MRT); other remote-sensing data were processed using Python, and all remote-sensing data were converted into a unified projection and GeoTIFF format [39]. In addition, this study obtained data on maize planting areas in the Songnen Plain over the years, with a spatial resolution of 1km. The data were derived from existing research results and have certain reliability after testing [40].
Other data: the administrative division data, DEM, climate background data, effective soil moisture and other data in this study were all provided by the Chinese Academy of Sciences (http://www.resdc.cn/) (accessed on 2 October 2022).

2.3. Methods

2.3.1. Principles of Model Construction

The formation and occurrence of drought disasters involve climate conditions, vegetation characteristics, soil properties, land use types and so on, which are the result of multiple environmental factors [41,42,43]. This multifactorial nature leads to the complexity and uncertainty of drought itself. In this study, we built a drought-monitoring model for spring maize that took into account its growth state, climate conditions (precipitation and temperature), environmental parameters, and other factors. The methods involved in model construction are as follows:
The NDVI is commonly used to represent the greenness of vegetation, and its value decreases when the plant is subjected to drought [44,45]. However, the NDVI has hysteresis. The SIF is associated with vegetation photosynthesis and is considered to be more sensitive to drought responses [46]. So, SIF data were used in this study to reflect the growth status of spring maize. According to the construction principle of the vegetation condition index (VCI) [47], the SIF series data were standardized, and the following is the calculation formula:
V C I S I F i = S I F i S I F min S I F max S I F min
where V C I S I F i refers to the crop condition index at i period in a certain year; S I F i represents the SIF value at i period of the year; S I F max , S I F min represent the maximum and minimum values of SIF at the same period. In this study, i refers to growth periods of spring maize. The lower the value of SIF, the more obvious the drought stress of spring maize in this period.
The decrease in precipitation is the most directly determining factor in the occurrence of drought. The precipitation data in this study were standardized to obtain the precipitation condition index (PCI), which reflects the information on precipitation anomaly, as follows:
P C I i = T R M M i T R M M min T R M M max T R M M min
where P C I i refers to the precipitation condition index at i period in a certain year; T R M M i represents the TRMM precipitation value at i period of the year; T R M M max , T R M M min represent the maximum and minimum values of TRMM during the same period. In this study, i refers to growth periods of spring maize. The smaller the value of PCI, the less precipitation in the same period over the years, and the more serious the drought of spring maize.
High temperature is also an important factor that leads to drought. The temperature condition index (TCI) is often used to express drought information in research, as follows:
T C I i = L S T max L S T i L S T max L S T min
where T C I i refers to the temperature condition index at i period in a certain year; L S T i represents the surface temperature at i period of the year; L S T max , L S T min represent the maximum and minimum values of LST in the same period. In this study, i refers to growth periods of spring maize. The lower the value of TCI, the more serious the drought of spring maize.
In addition, the geographical environment is also a key factor determining agricultural drought. Due to different environments (geographical location, altitude, climate background, soil properties, etc.), crops in certain regions are exposed to drought all year, while drought happens less frequently in others. Therefore, in this study, longitude and latitude information were used to reflect the impact of geographical location on crops, DEM was utilized to reflect the impact of terrain on crop growth, dryness was used to reflect the climate conditions of the region where crops are located, and effective soil moisture was taken into account to reflect the water-holding capacity of farmland soil.
The crop water deficit index (CWDI), which is frequently utilized in agricultural drought monitoring, could reveal information about crop water deficit during the crop growth stage [48]. Considering the applicability of CWDI, the standardized crop water deficit index (SCWDI) was calculated to reflect the drought characteristics of spring maize in this study, and the specific calculation method was referred to in the literature [36].
To sum up, the factors mentioned above were comprehensively considered in this study to develop a drought-monitoring model for spring maize.

2.3.2. Random Forest Model

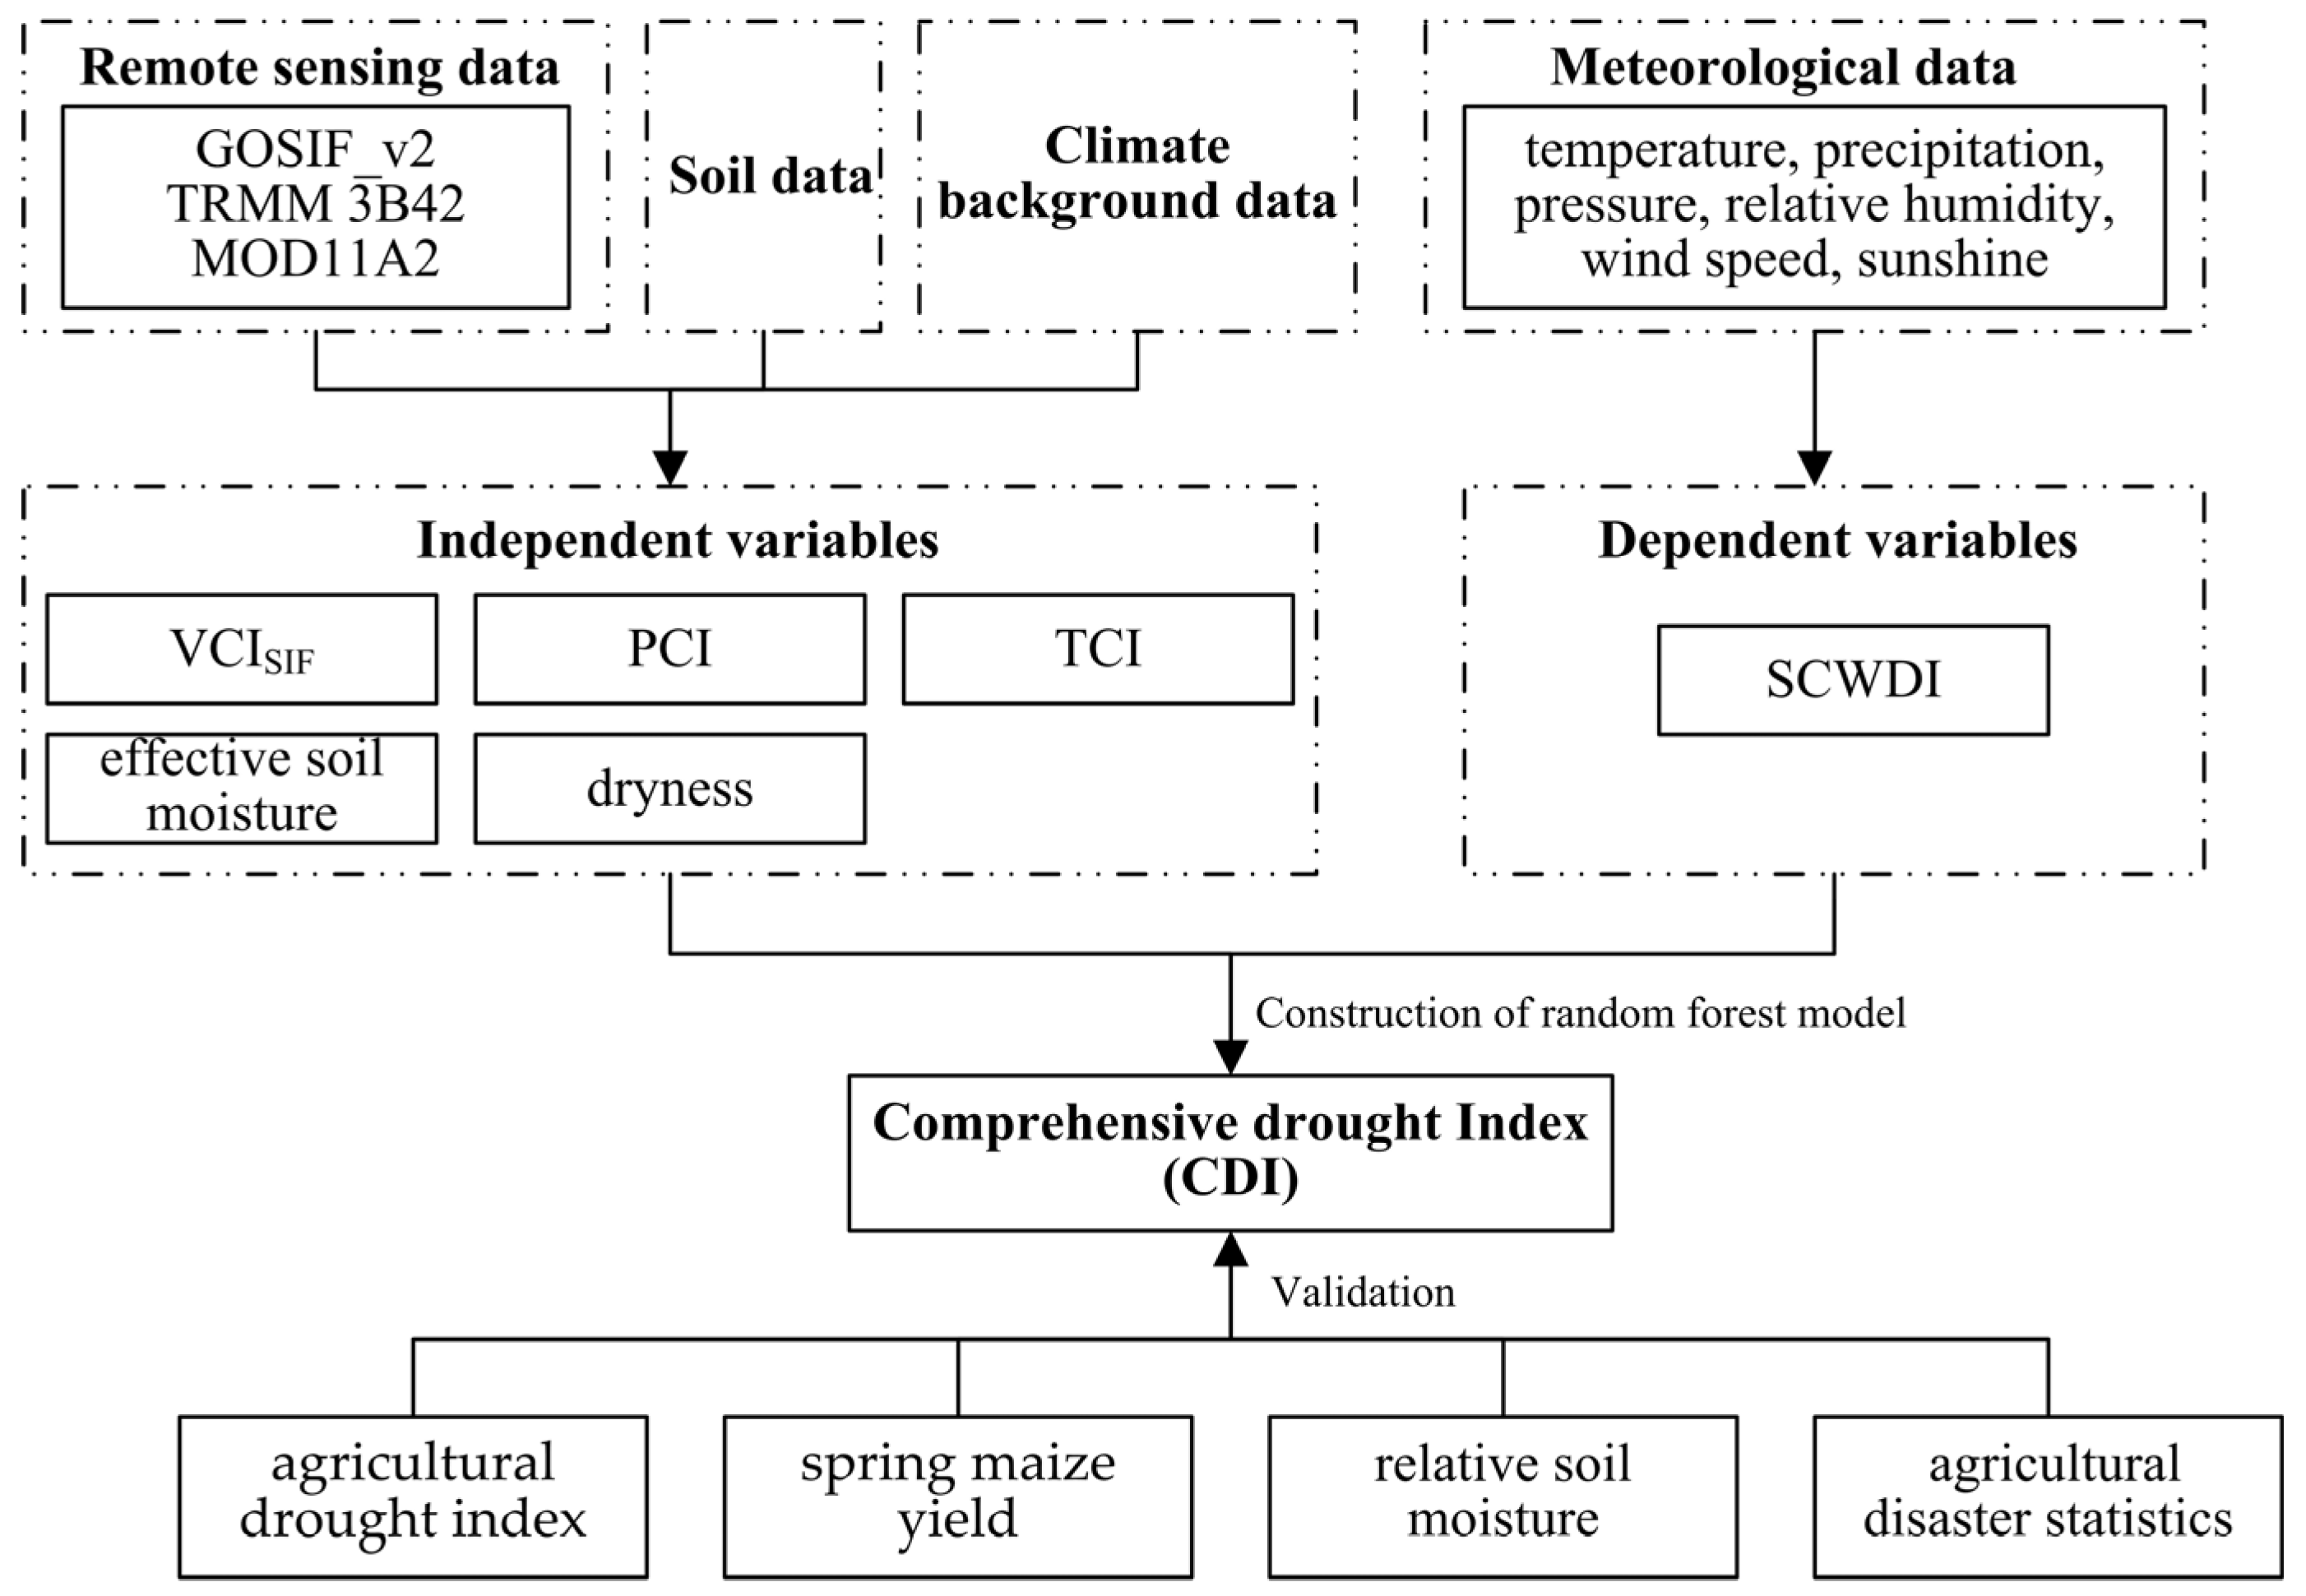
The random forest model is widely used in the construction of drought models, and this study developed a comprehensive drought index for spring maize based on the random forest model [49]. In this study, the growth period of spring maize from 2001 to 2018 was taken as the research period to build the model. According to the importance ranking of factors in random forests, the VCI, PCI, TCI, dryness, and effective soil moisture were selected as independent variables. Then, using the SCWDI as the dependent variable, a comprehensive drought model for each growth stage of spring maize was developed using the random forest model. The model construction process is shown in Figure 2. In this model, the data from 2001 to 2015 were utilized as the training set, while the data from 2016 to 2018 were used as the test set for the construction of the model. In the research, we mainly used the random forest function provided by Python’s Scikit-Learn library to implement model construction.
In this study, the drought level of the comprehensive drought index (CDI) was determined based on the SCWDI drought classification standard [36]. Finally, drought information for each growth period was extracted using data on the spring maize planting area.

2.3.3. Other Methods

In the study, a geologically weighted regression model (GWR) was used to process remote-sensing data in order to obtain consistent spatial resolution [50]. In addition, the barycenter transfer method was applied to explore the characteristics of spring maize drought in the Songnen Plain [51].

3. Results

3.1. Verification of Comprehensive Drought Model

3.1.1. Comparison between the CDI and Other Drought Indices

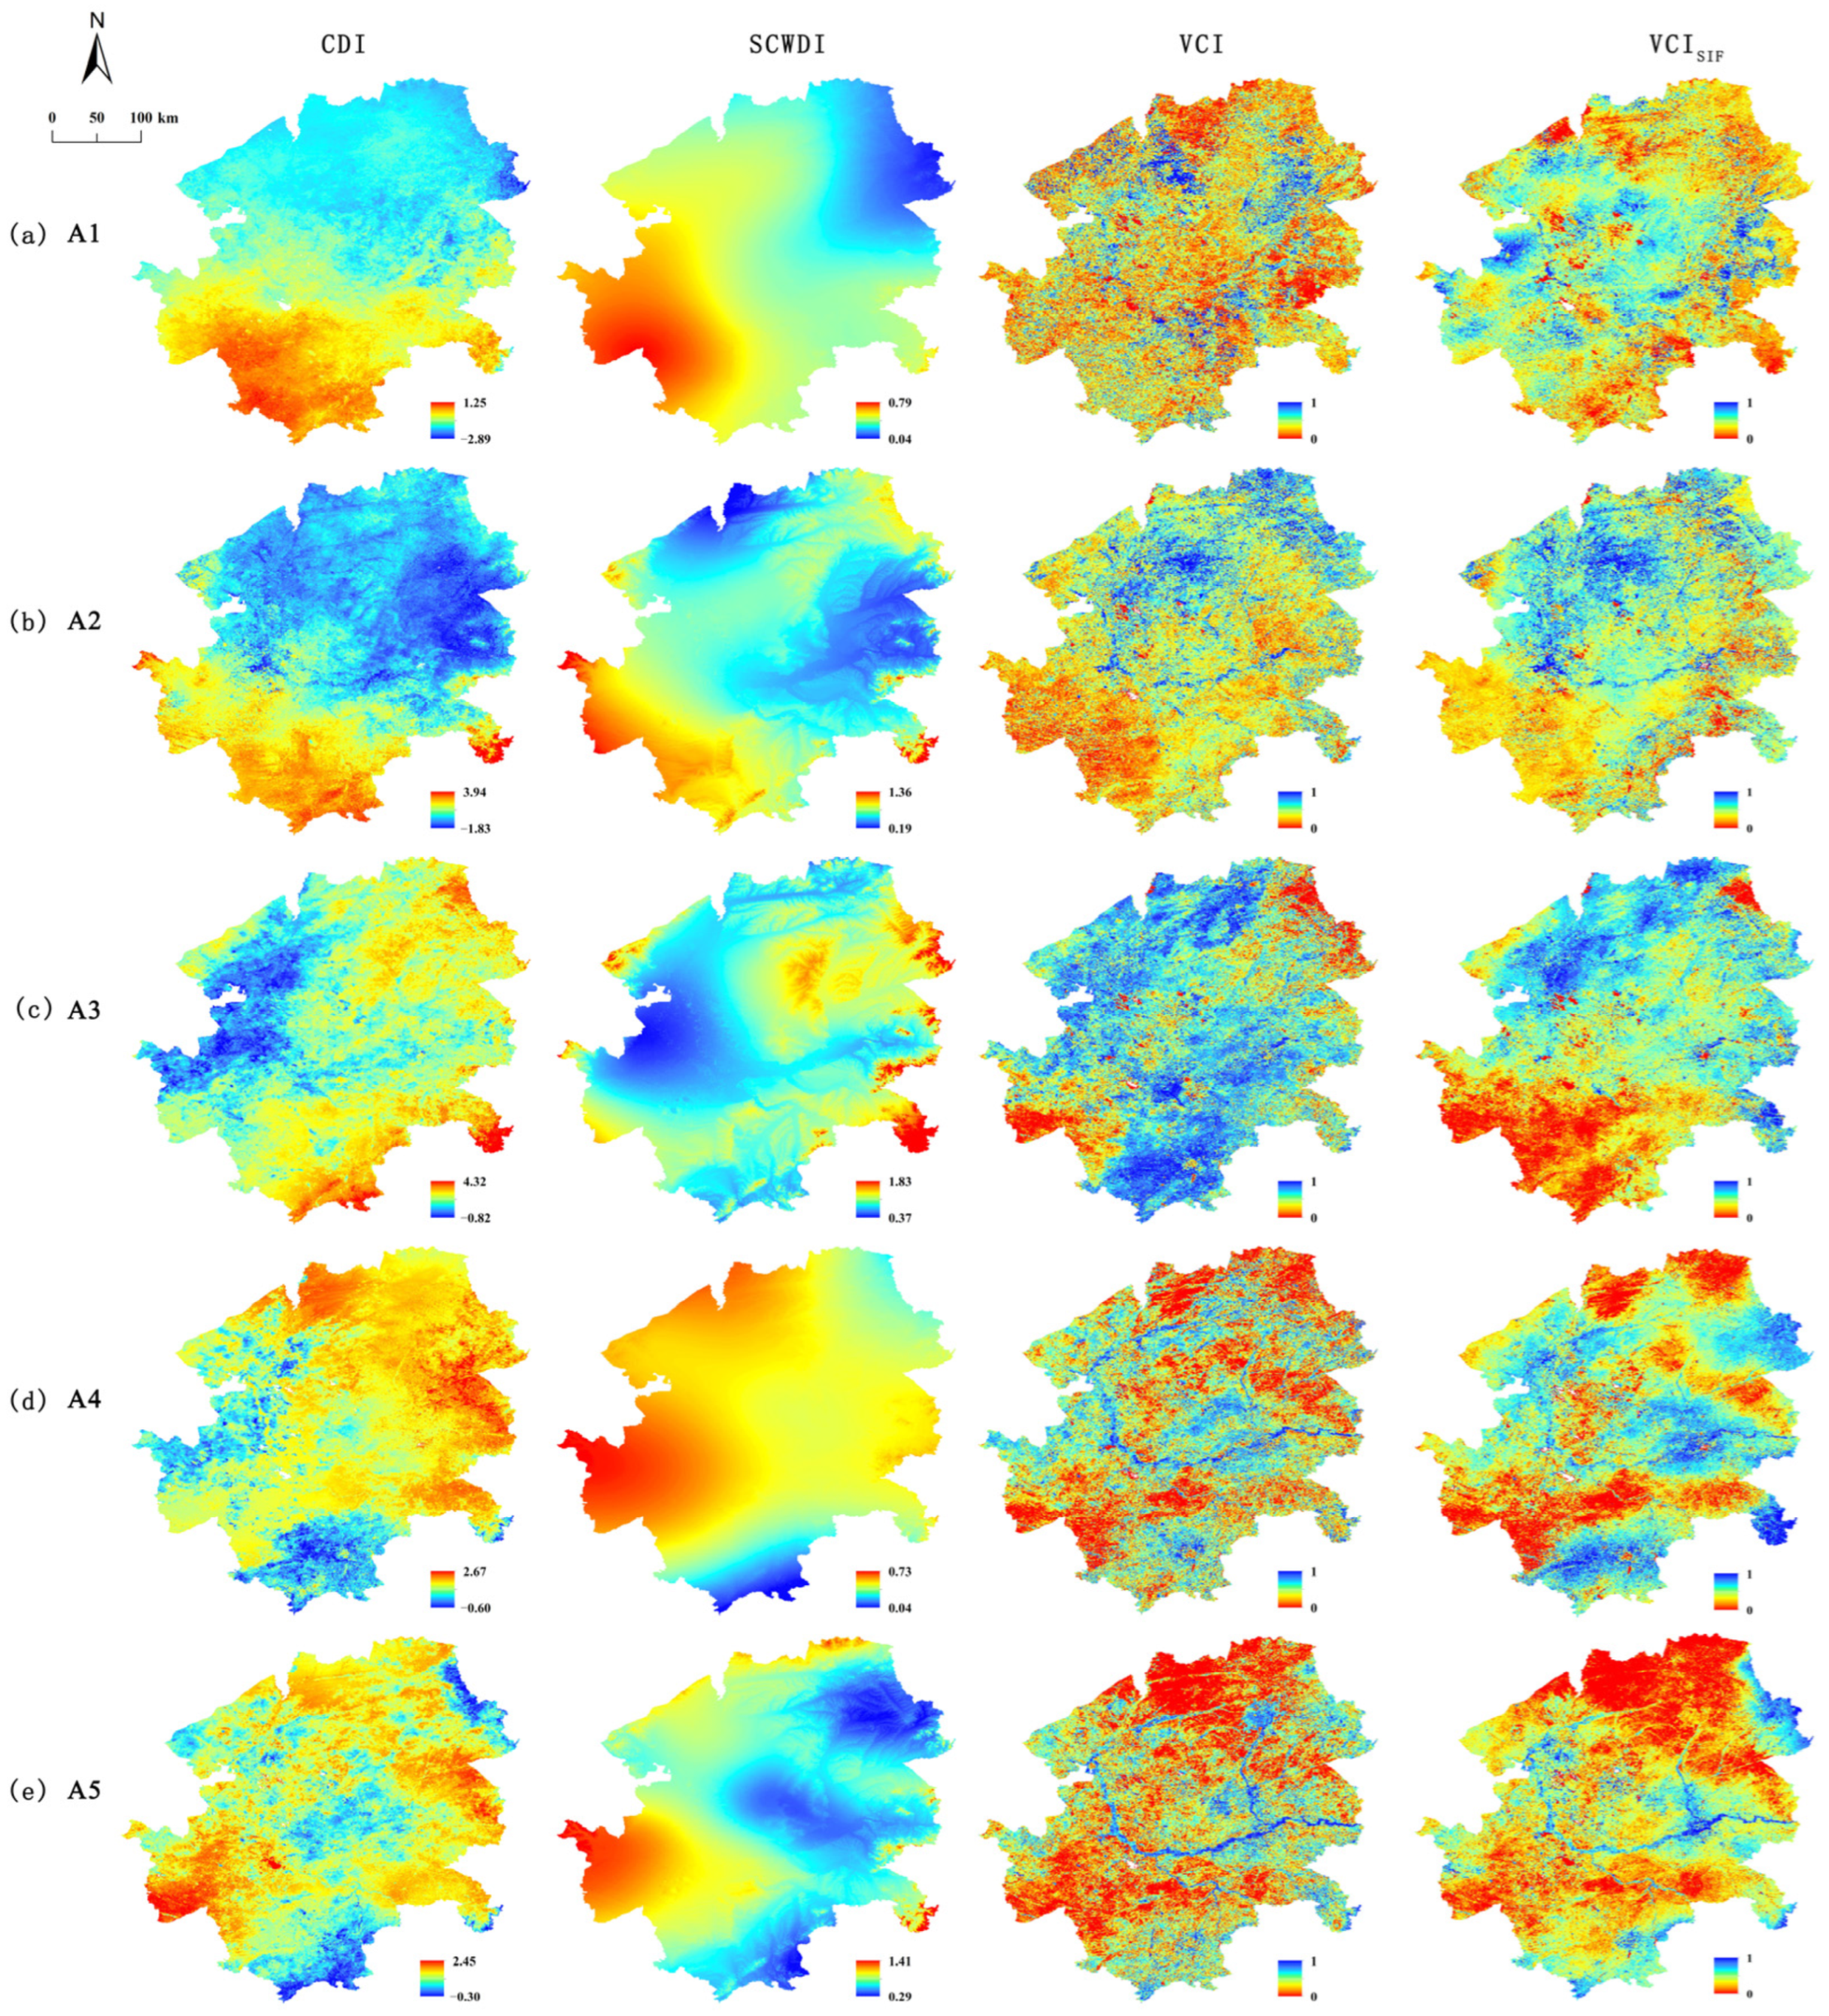
In the study, the comprehensive drought index (CDI) for each growth stage of spring maize in the study area was obtained using the random forest model. Here, to verify the performance of the comprehensive drought model, the standard crop water deficit index (SCWDI) and vegetation condition index (VCI and VCISIF) were selected for comparison (Figure 3). A typical drought year of 2007 was used as an example for drought analysis. In the A1 period, the drought indicated by the SCWDI was mainly concentrated in the southwest of the study area. Due to the recent thawing of the land and low vegetation coverage during this period, the drought shown by the VCI and VCISIF differed from that displayed by the SCWDI. The drought shown by the CDI was primarily located in the south of the study area, which was basically similar to the SCWDI. In the A2 period, the drought described by the SCWDI was comparable to that shown by the VCI and VCISIF and was mainly located in the southwest of the study area, as was the drought reflected by the CDI. In the A3 period, the drought showed by the CDI was mostly concentrated in the northeast and southeast of the study area, and the same was true for the SCWDI, VCI and VCISIF. In the A4 period, the drought distribution showed by the CDI was comparable to that of the VCI and VCISIF. In the A5 period, the drought distribution showed by the CDI was consistent with that of the SCWDI, VCI and VCISIF. In a word, the drought distribution indicated by the CDI in each growth stage of spring maize was generally comparable with that showed by other drought indices, and the CDI can be applied to the drought monitoring of crops.

3.1.2. Correlation between the CDI and Crop Yield and Relative Soil Moisture

To further validate the performance of the CDI in agricultural drought monitoring, we analyzed the relationship between the yield per unit area of spring maize and the CDI at typical agrometeorological stations (Figure 4). The main typical stations were Lishu, Shuangcheng, Yushu and Changling. It can be seen that the CDI was significantly negatively correlated with the yield of spring maize, which has certain potential in reflecting drought disaster information. The relative soil moisture (RSM) at agrometeorological stations was also commonly utilized to assess agricultural drought, which can indicate the drought information of crops to a certain extent. Due to the limited availability of RSM data, this study mainly explored whether the CDI is related to it. From the results, there was also a significant negative correlation between the CDI and RSM in each growth period of spring maize, which further indicated that the CDI can be applied to the drought monitoring of spring maize (Figure 5).

3.2. Drought Monitoring of Spring Maize Based on the CDI in the Songnen Plain

3.2.1. Temporal Variation of Drought Area in Spring Maize

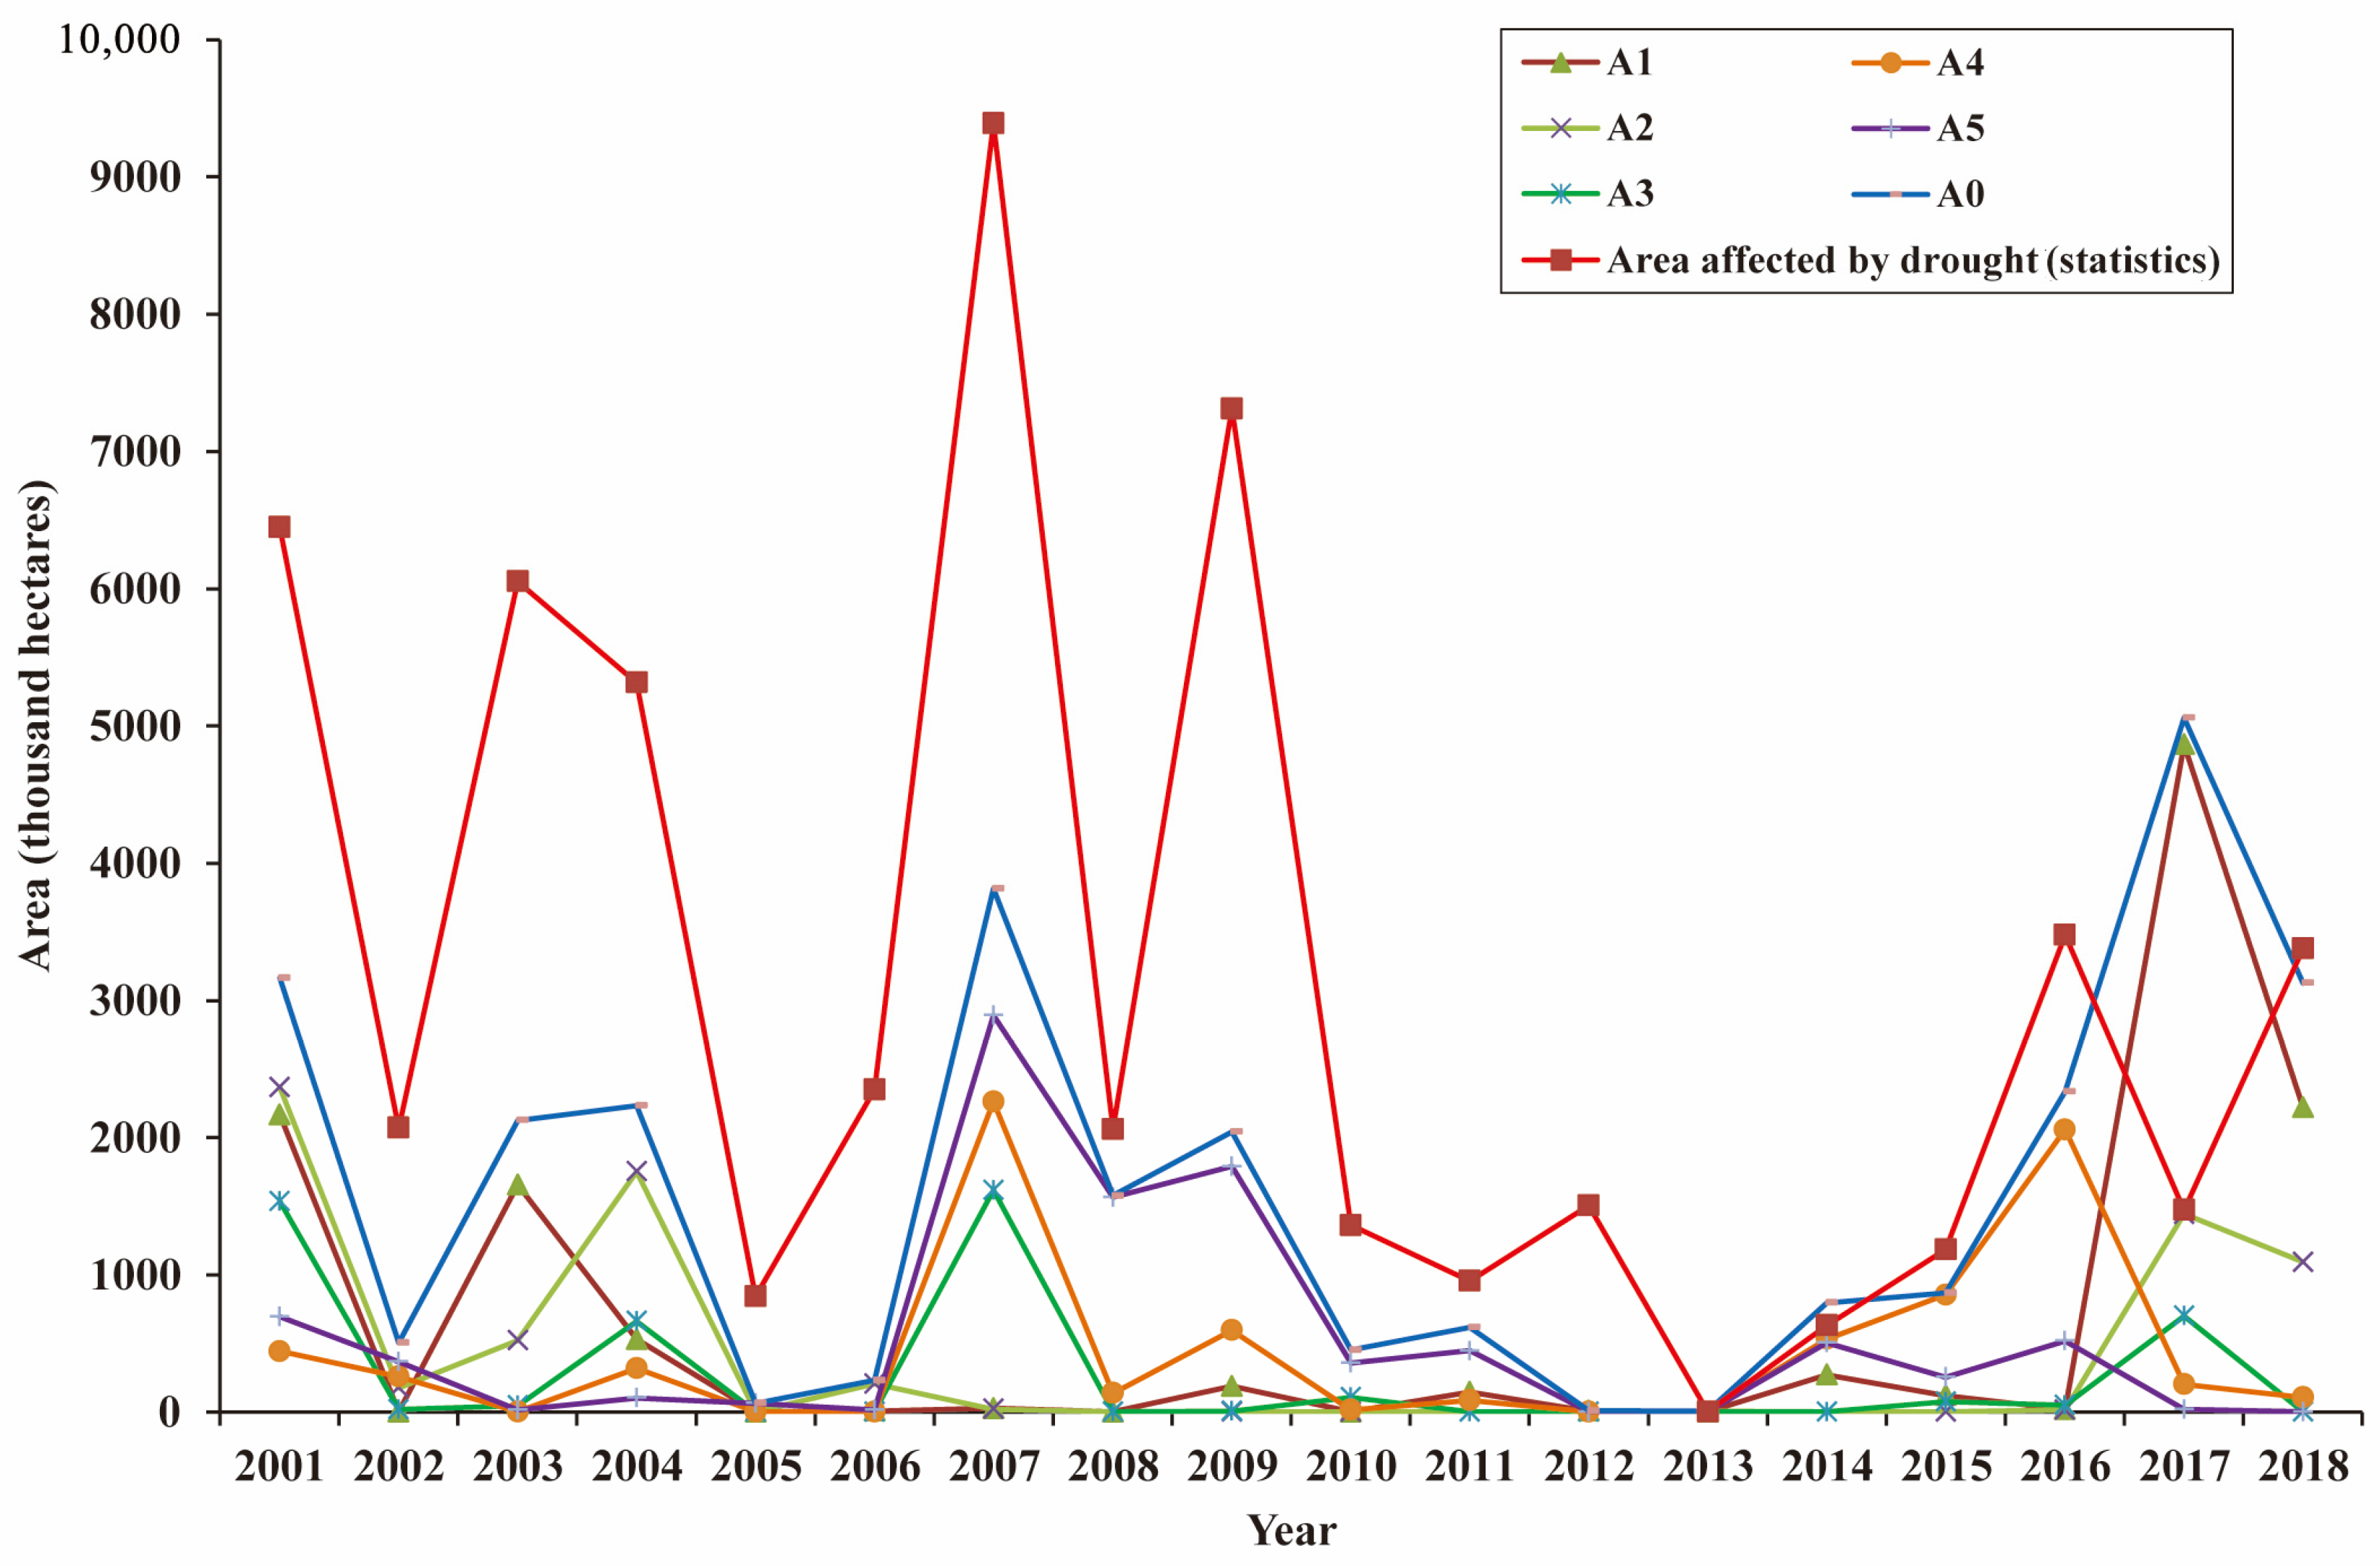
The drought situation of spring maize in each growth period was analyzed from the time series. It can be seen that for spring maize, from 2001 to 2018 (Figure 6), the years with a large area affected by drought in the A1 period were 2001, 2003 and 2017; the years in the A2 period were 2001, 2004 and 2017; the years in the A3 period were 2001, 2004, 2007 and 2017; the years in the A4 period were 2007, 2009 and 2016; and the years in the A5 period were 2007 and 2009. From the perspective of the whole growth period, the years with a large area affected by drought were 2001, 2004, 2007 and 2017.
In order to validate the effectiveness of drought-monitoring results for spring maize, the agricultural drought area released by the National Bureau of Statistics of China was compared with the results of this study. As it is impossible to statistically obtain the drought-affected area of spring maize in the study area, considering that spring maize in Heilongjiang Province and Jilin Province is mainly distributed in the Songnen Plain, the results of drought monitoring for spring maize in the Songnen Plain were indirectly tested by comparing the agricultural drought areas of Heilongjiang and Jilin Province from 2001 to 2018. It can be seen that in the time series (Figure 6), the variation characteristics of spring maize drought area obtained in this study were basically consistent with the statistical disaster area. In 2017, the drought area of spring maize was significantly greater than the statistical area. As the drought in 2017 mainly occurred in the A1 period, during which the Songnen Plain had just thawed and various crops had just begun to be sown, the impact of drought on crops was minimal, which may be slightly inconsistent with statistical data.

3.2.2. Spatial Variation of the Drought Barycenter in Spring Maize

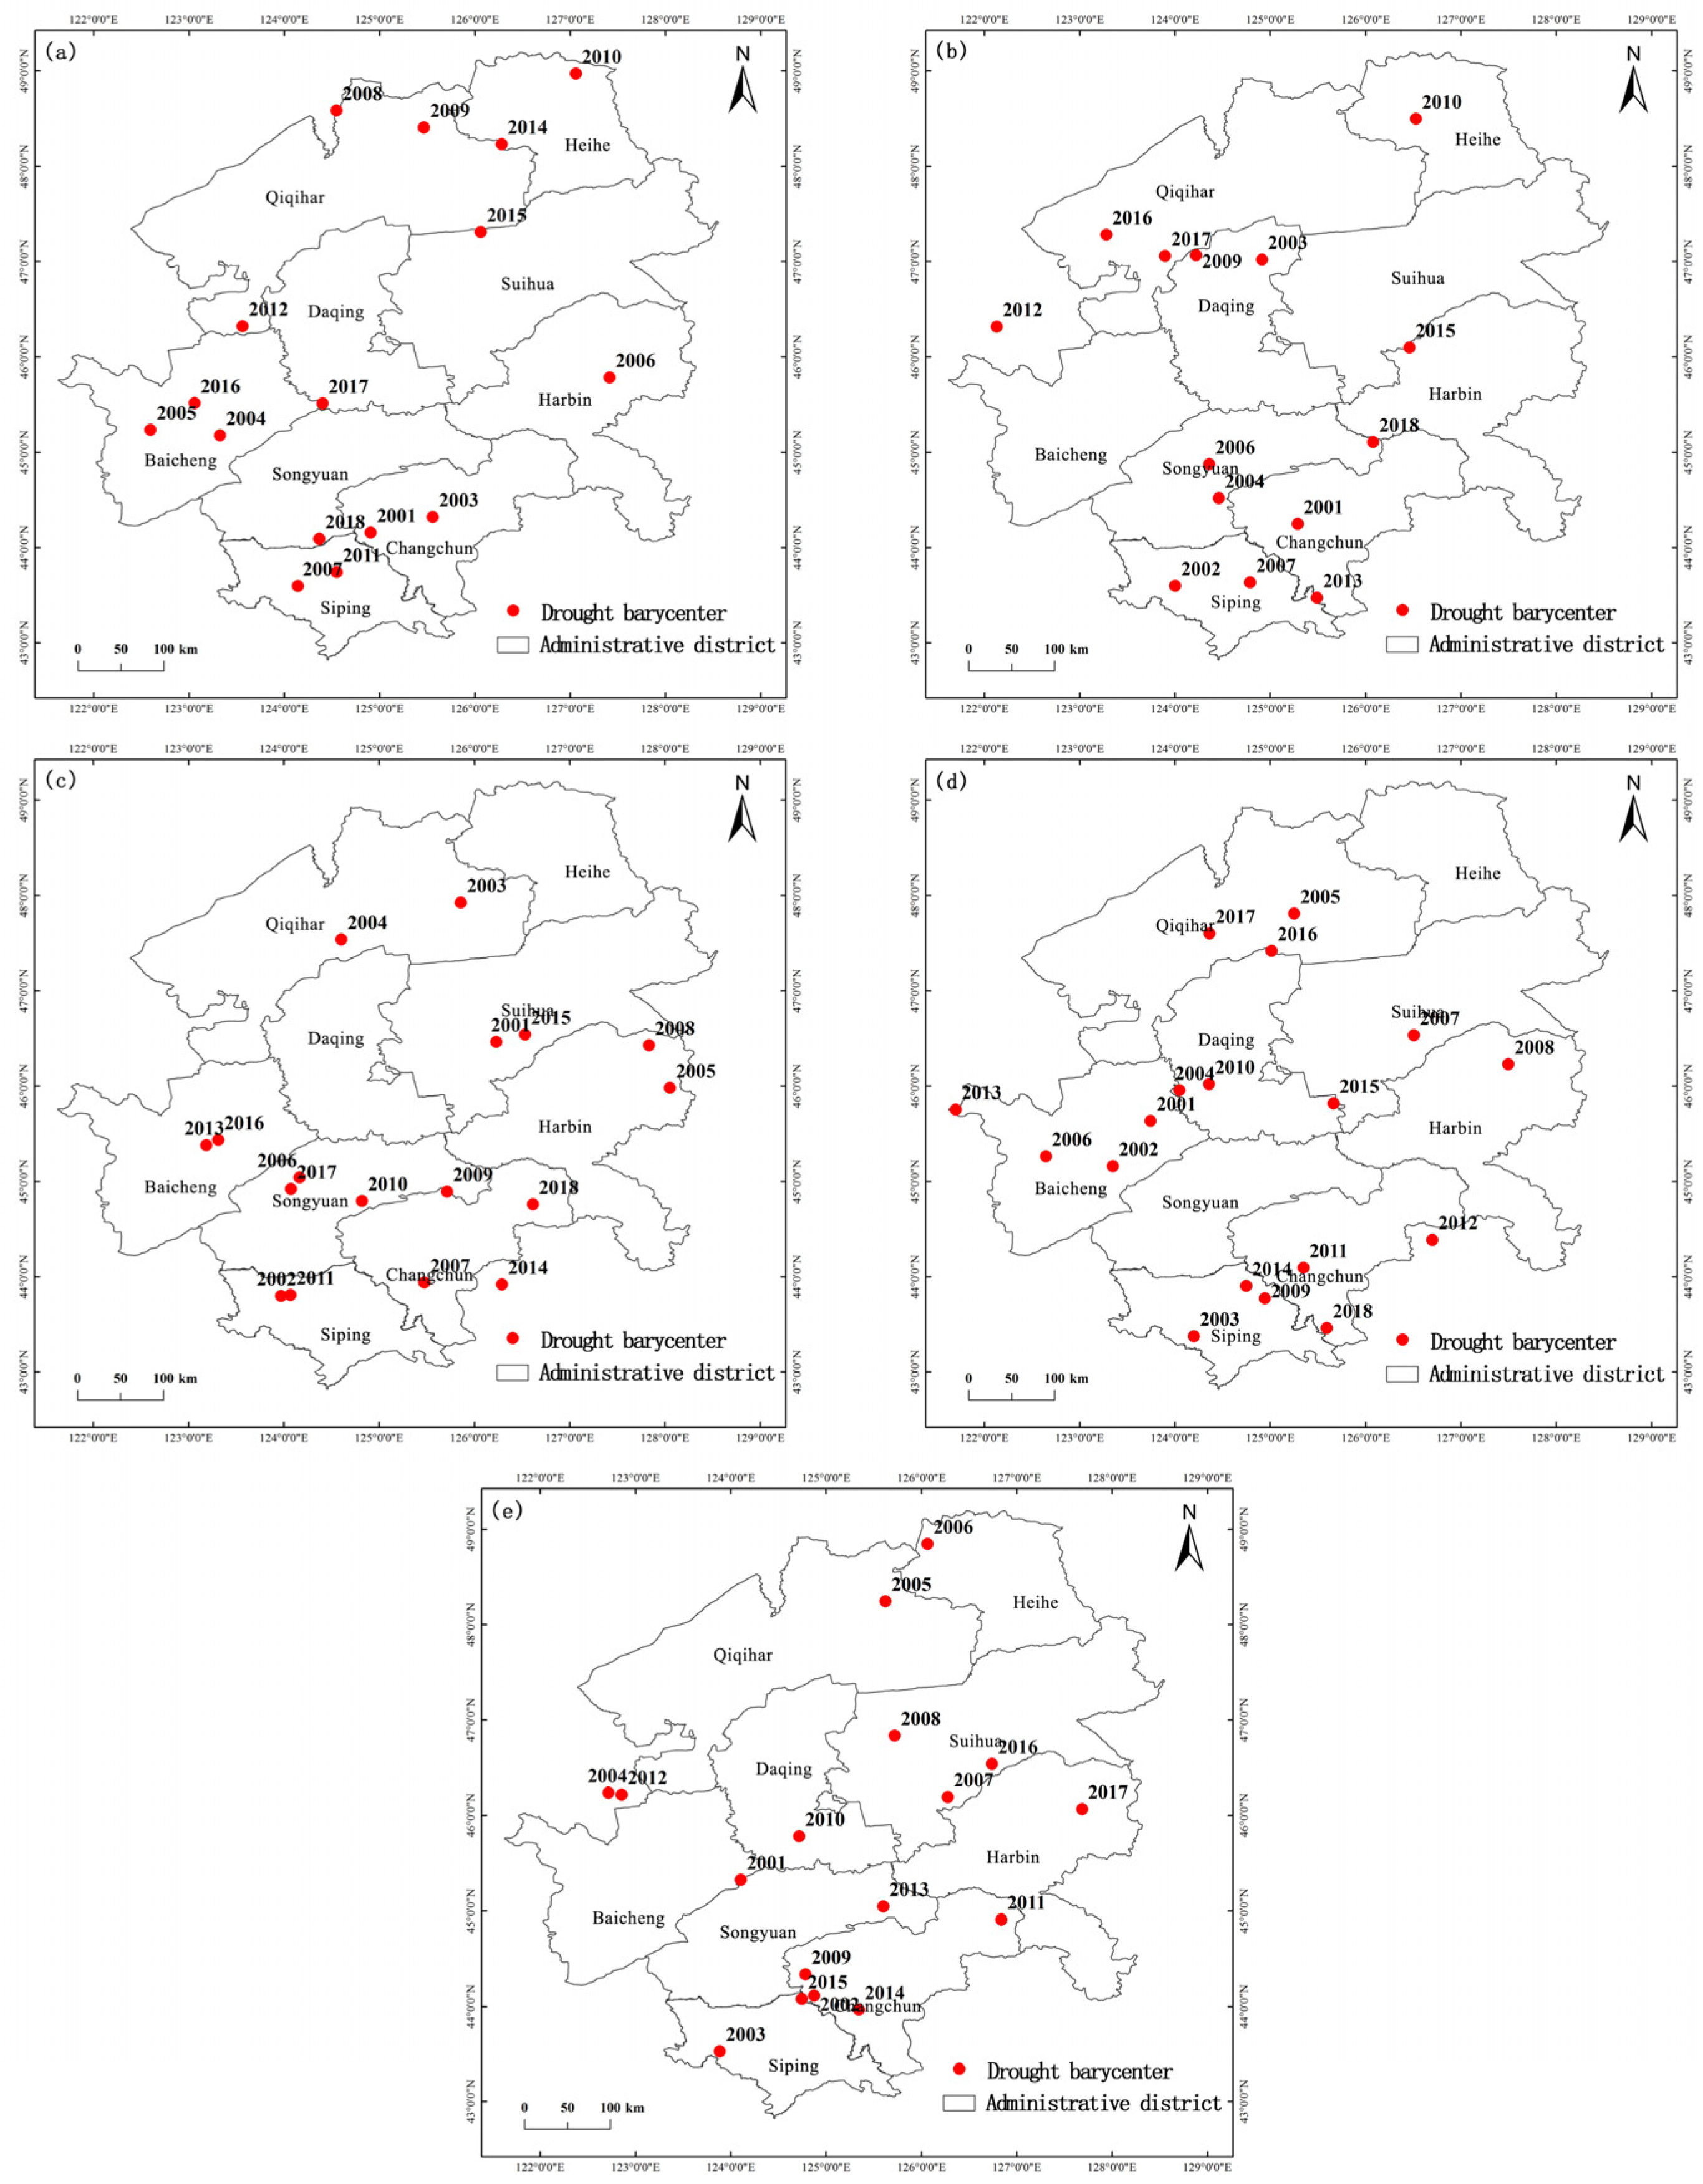
The variation of the drought barycenter in each growth period for spring maize was analyzed in this study from 2001 to 2018 (Figure 7).
In the A1 period, the drought barycenter of spring maize was mostly dispersed in the north of Qiqihar, Baicheng, and the north of Siping, and the transfer path of the drought barycenter was mainly from the south to the southwest, to the north, and then to the southwest. In the A2 period, the drought barycenter of spring maize was mainly concentrated in the south of the study area and the south of Qiqihar. The drought barycenter was located in the south at the beginning and then turned slightly to the northwest. In the A3 period, the drought barycenter of spring maize was primarily concentrated in the south, and after a few years, it was mainly transferred to the south. During the A4 period, the drought barycenter of spring maize was mainly concentrated in Baicheng, Qiqihar and the southeast of the study area. In the A5 period, the drought barycenter of spring maize was relatively scattered, but it was mainly concentrated in the middle and south of the study area. In short, the drought barycenter of spring maize in the study area generally tended to the southern region in each growth period, especially near the junction of Siping and Changchun. In addition, in the west of the study area, especially near Baicheng, the drought barycenter was relatively concentrated, and in time, drought-prevention measures should be implemented in these areas.

3.2.3. Spatial Distribution of Drought in Spring Maize

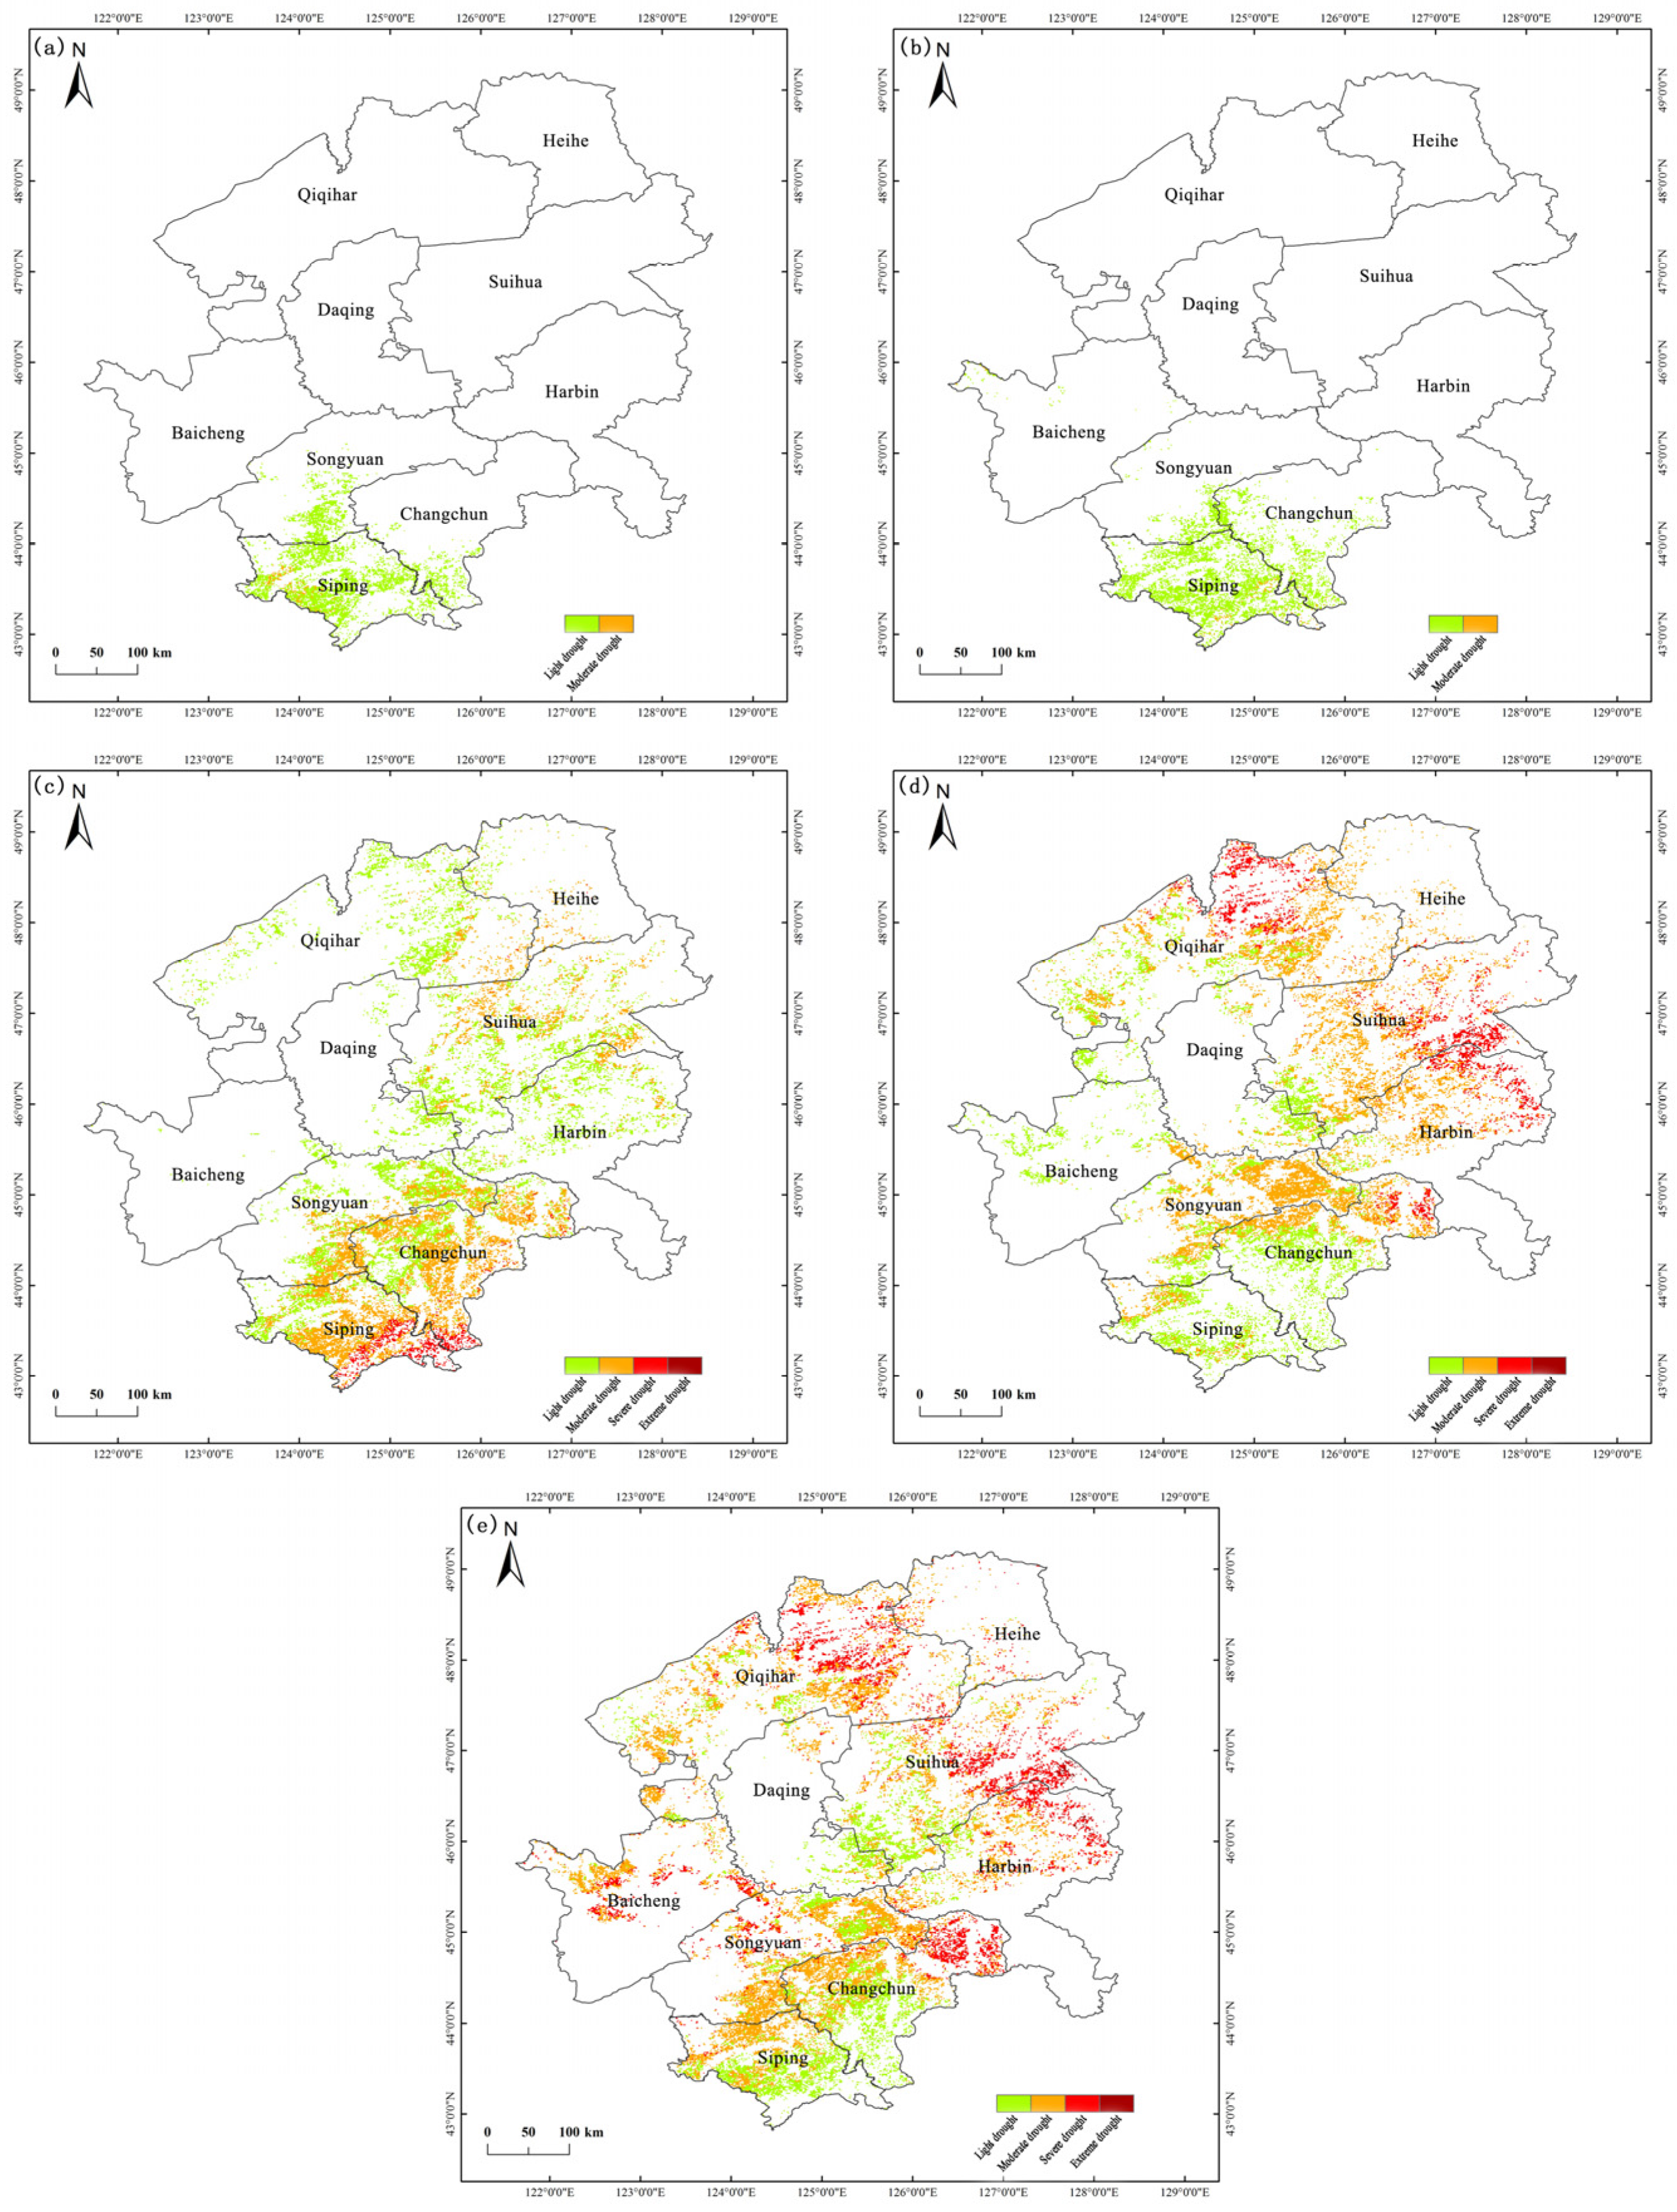
Taking a typical drought year (2007) as an example, the spatial distribution characteristics of spring maize drought in the study area were analyzed. On the whole, with the growth of spring maize, the drought area of spring maize in the study area has been expanding, and the degree of drought gradually increased in 2007 (Figure 8).
In the A1 period, the drought scope of spring maize was relatively small, with most of it spreading in the south of Siping, Songyuan and Changchun. The drought degree was relatively light, with light drought accounting for 96.10% of the total drought area and moderate drought accounting for 3.90% of the total drought area, which was scattered southwest of Siping. No severe drought occurred. In the A2 period, the drought distribution and drought degree of spring maize were similar to those in the A1 period. The light drought area accounted for 97.57% of the total drought area, while the moderate drought area accounted for 2.43%. There was no severe drought or extreme drought. In the A3 period, the light drought area of spring maize accounted for 50.37% of the total drought area, mainly located in the middle and northwest of the study area. The moderate drought area accounted for 45.26%, mainly concentrated in the south and northeast of the study area. The severe drought and extreme drought areas accounted for 4.37%, which were mostly dispersed in Siping and surrounding areas. In the A4 period, spring maize was dominated by moderate drought, accounting for 52.50% of the total drought area. It was mainly concentrated in the middle of the study area and other scattered areas. The light drought area accounted for 34.44%, mainly located in the south and west of the study area. The severe drought and extreme drought areas accounted for 13.06%, mainly concentrated in the north of Qiqihar, northeast of Changchun, northeast of Harbin and northeast of Suihua. In the A5 period, spring maize experienced mainly moderate drought, accounting for 51.23% of the total drought area. It was dispersed in all regions of the study area, with the light drought area accounting for 28.02%, mainly concentrated in the middle and south of the study area, and the severe drought and extreme drought areas accounted for 20.75%, mainly located in the east and north of the study area.

4. Discussion

4.1. Reliability Analysis of Remote Sensing Data Downscaling

In this study, the TRMM and SIF data were mainly dealt with by spatial downscaling.
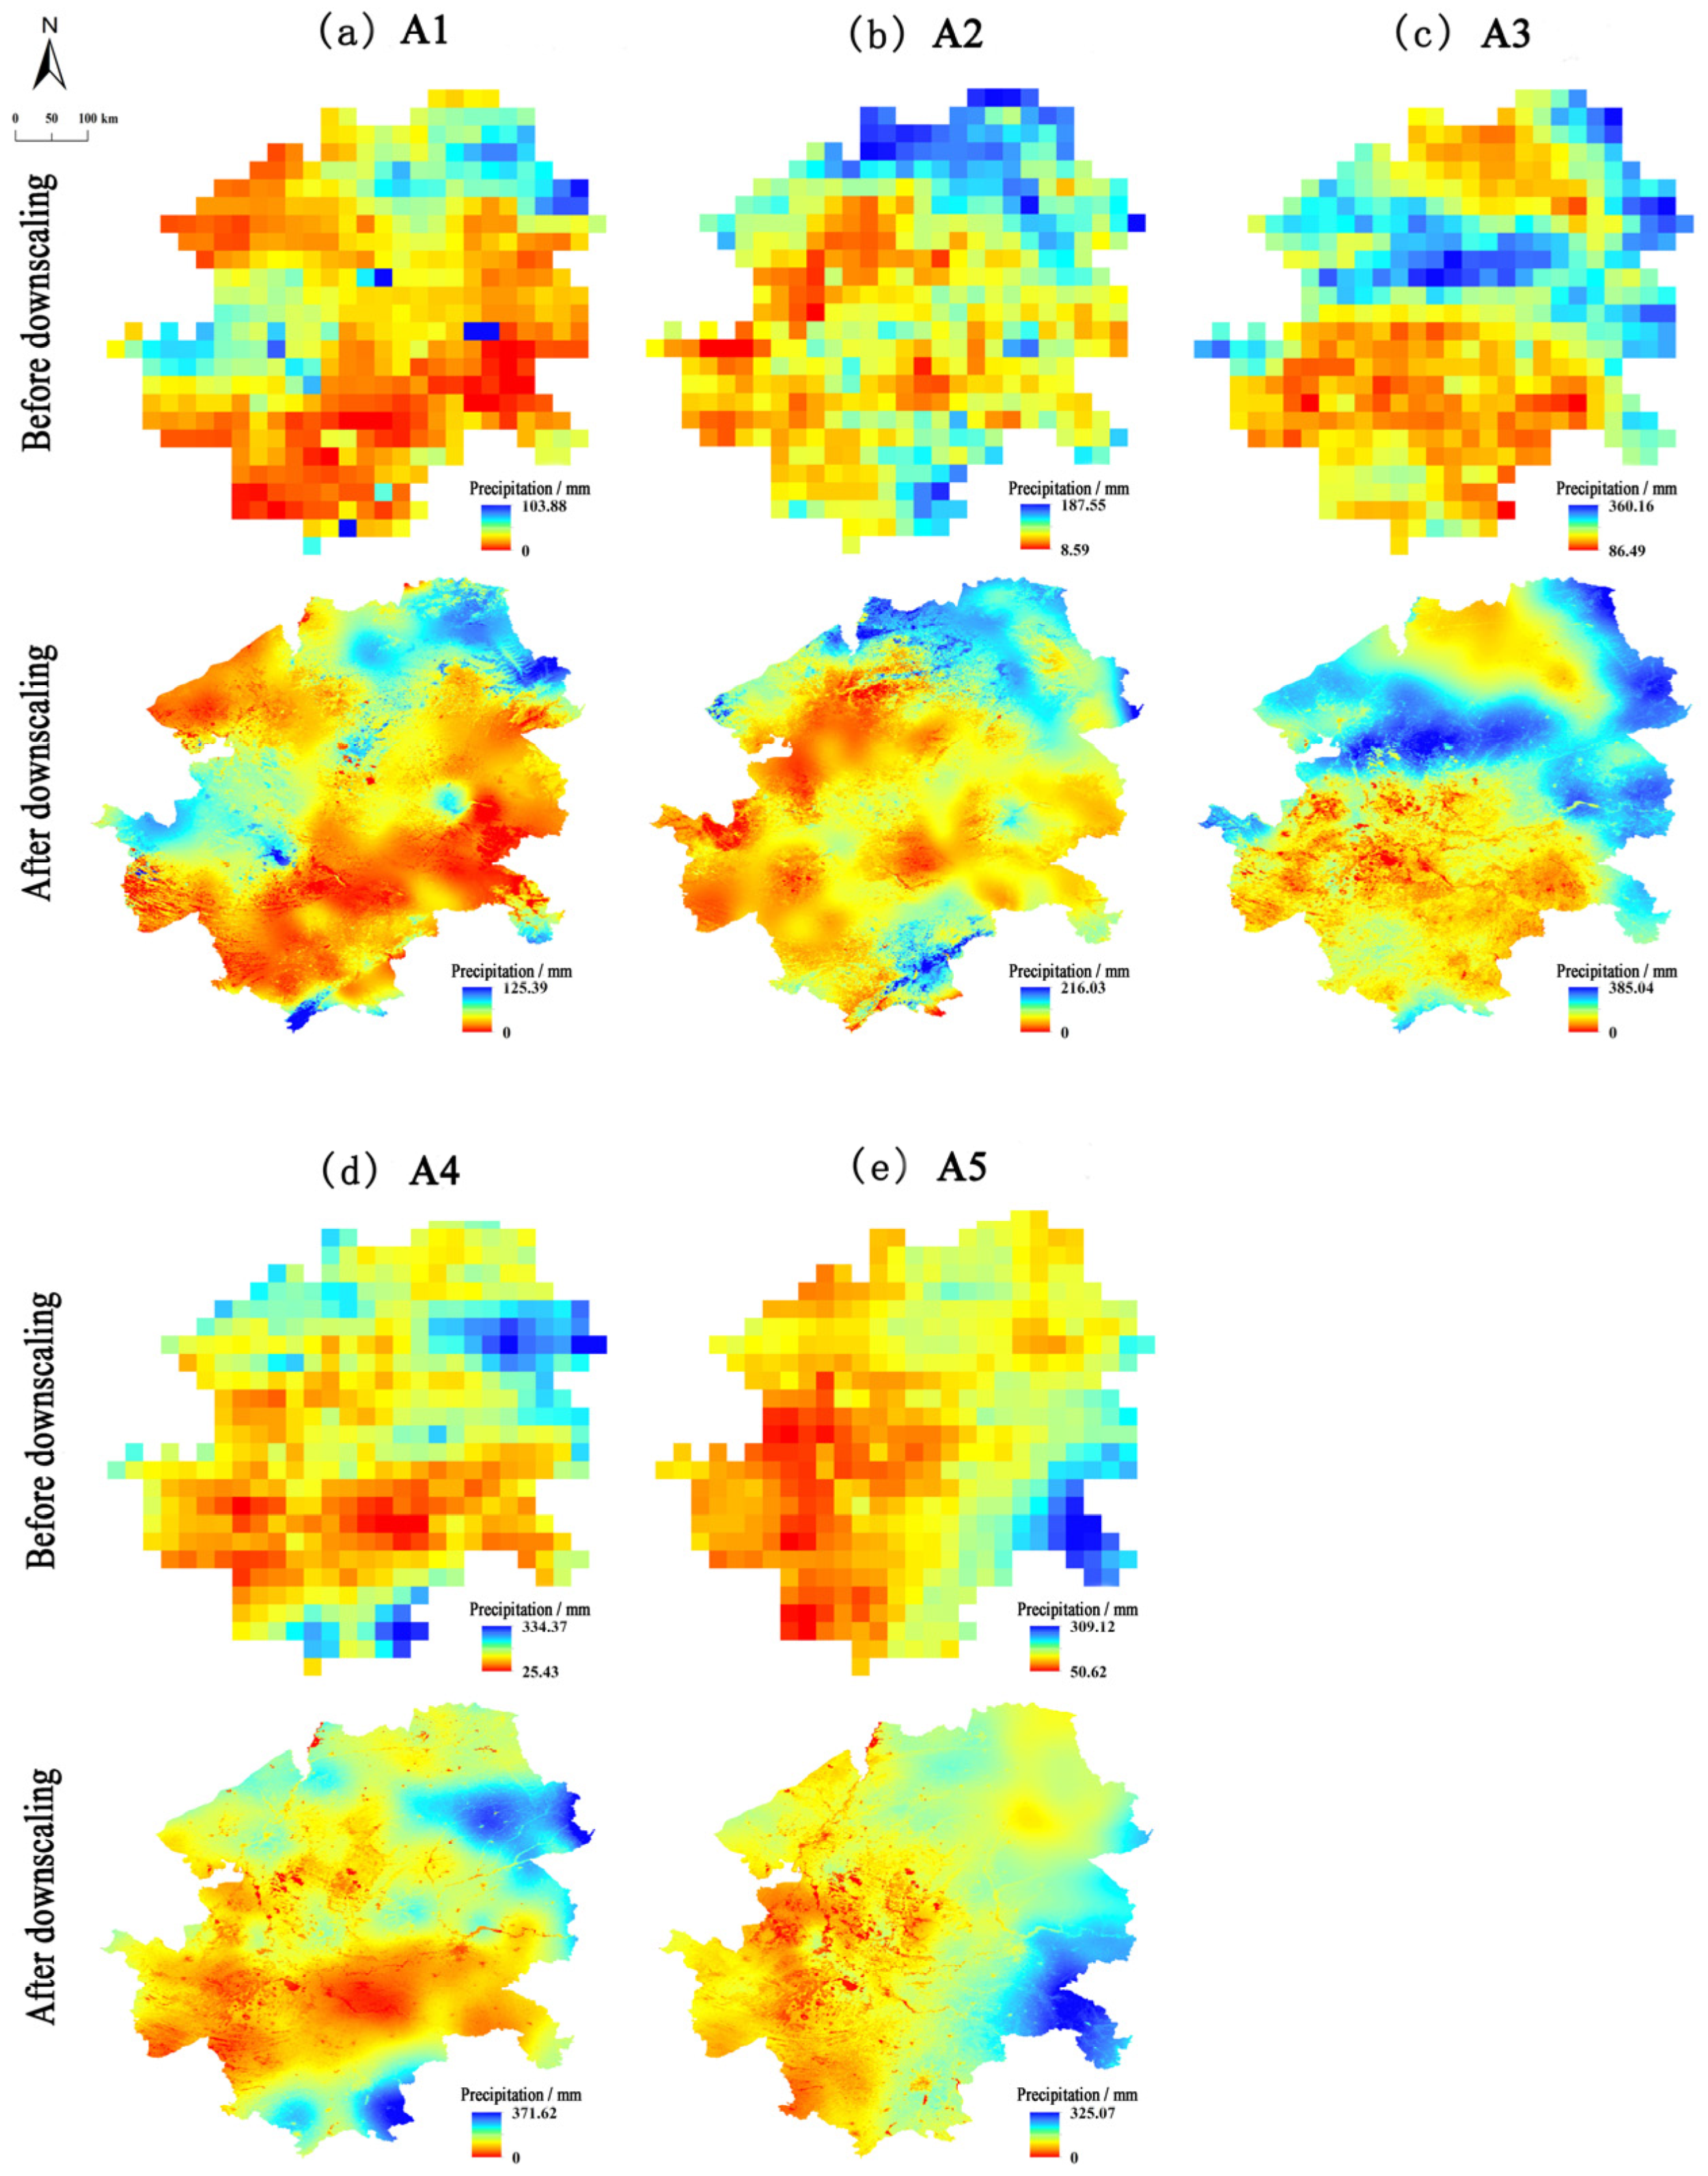
The relationship between precipitation and the underlying surface environment is complex, with spatial non-stationary characteristics [52]. Most studies indicate a close relationship between precipitation and the NDVI [53,54]. Based on GWR, this study constructed the functional relationship between TRMM precipitation data and the NDVI in the study area and realized the spatial downscaling of TRMM data. The downscaling results of TRMM data were compared with the precipitation data of meteorological stations, and the results met the requirements of this study. Taking 2018 as an example, it can be seen that the TRMM data in each growth period of spring maize have achieved good results after downscaling (Figure 9).
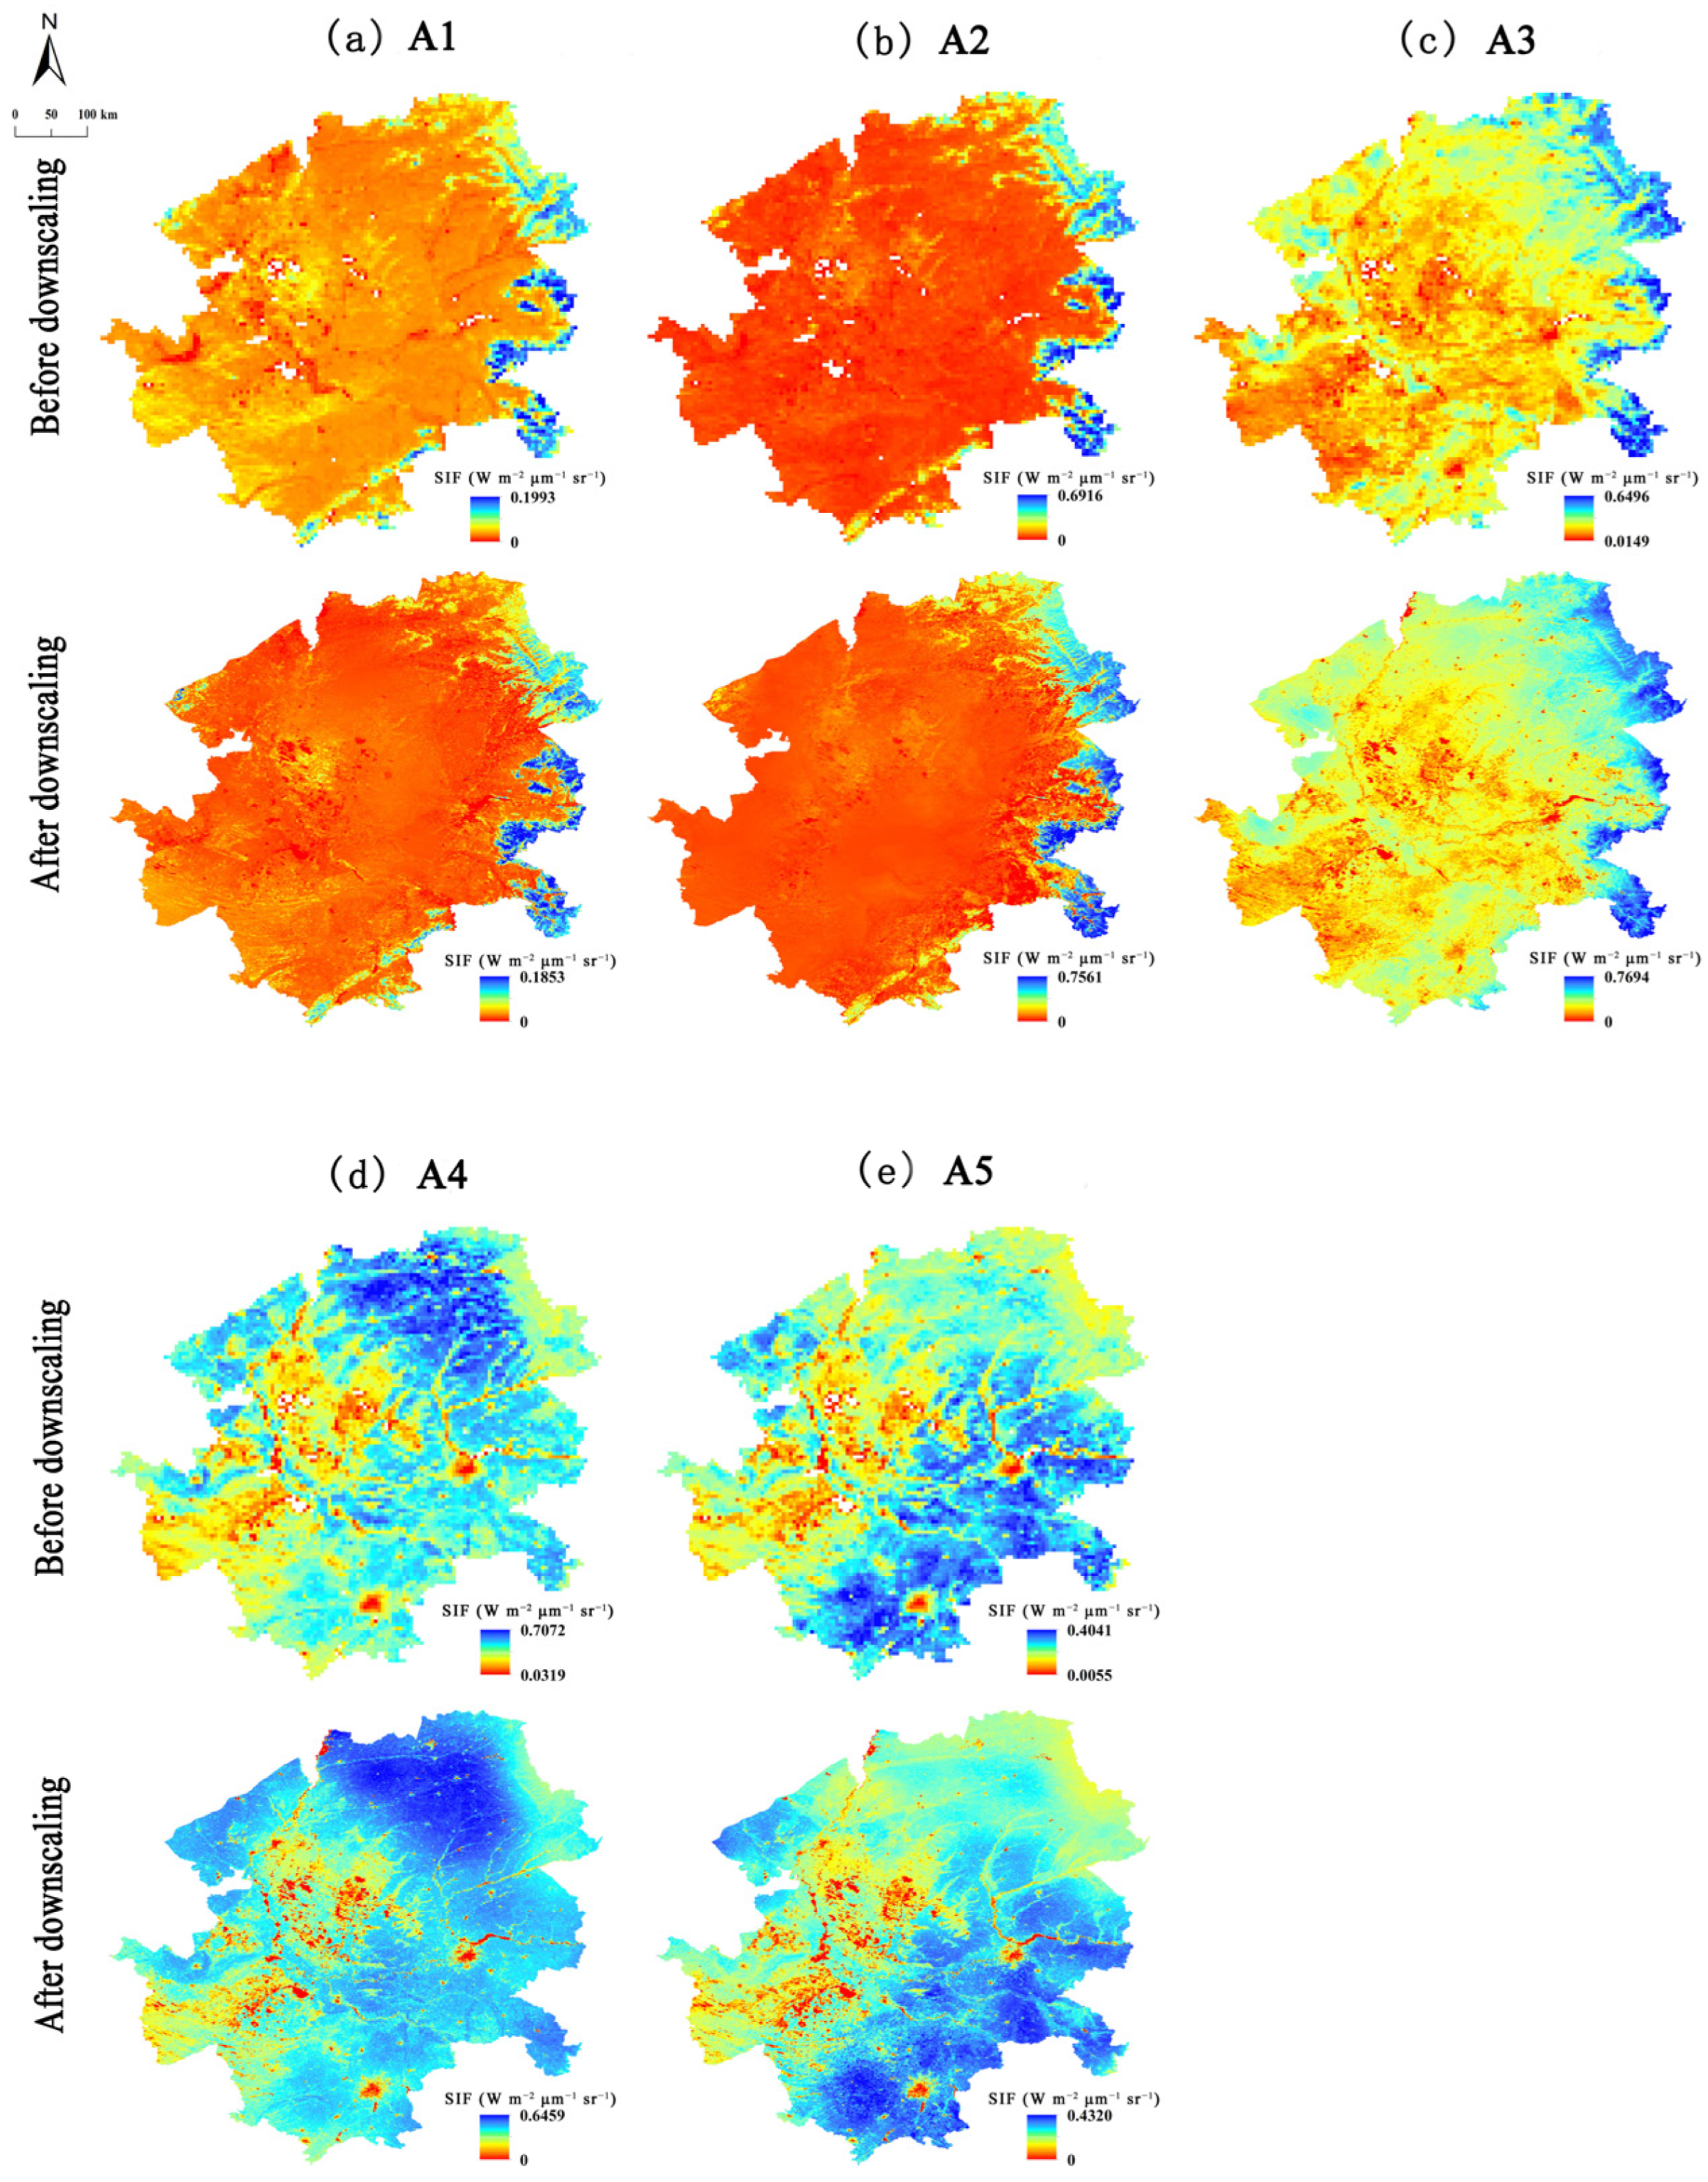
SIF data are also affected by a variety of environmental factors and have complex geographical and spatial characteristics. Since SIF data represent a weak signal, their spatial downscaling is more complex and involves many parameters, which is usually realized based on various physical models or machine learning algorithms in research [55,56]. The spatial resolution of SIF data utilized in this study is 5 km, which is relatively high. According to relevant research, the SIF data can achieve good spatial downscaling results by developing the functional relationship between SIF, the NDVI and temperature [26]. Considering that SIF data in the study were mainly used for drought monitoring, they were subject to spatial downscaling based on the GWR model, and the parameters mainly considered vegetation, temperature and other information [57]. Due to the difficulty of SIF observation, it was difficult to verify SIF data. The research showed that SIF data have a strong linear relationship with GPP [56]. This study tested the accuracy of SIF data after downscaling indirectly by analyzing the relationship between SIF and GPP data, and the findings showed satisfactory performance. We can also note that the SIF data of spring maize in each growth period showed good results after spatial downscaling (Figure 10).

4.2. Reliability Analysis of Drought-Monitoring Results

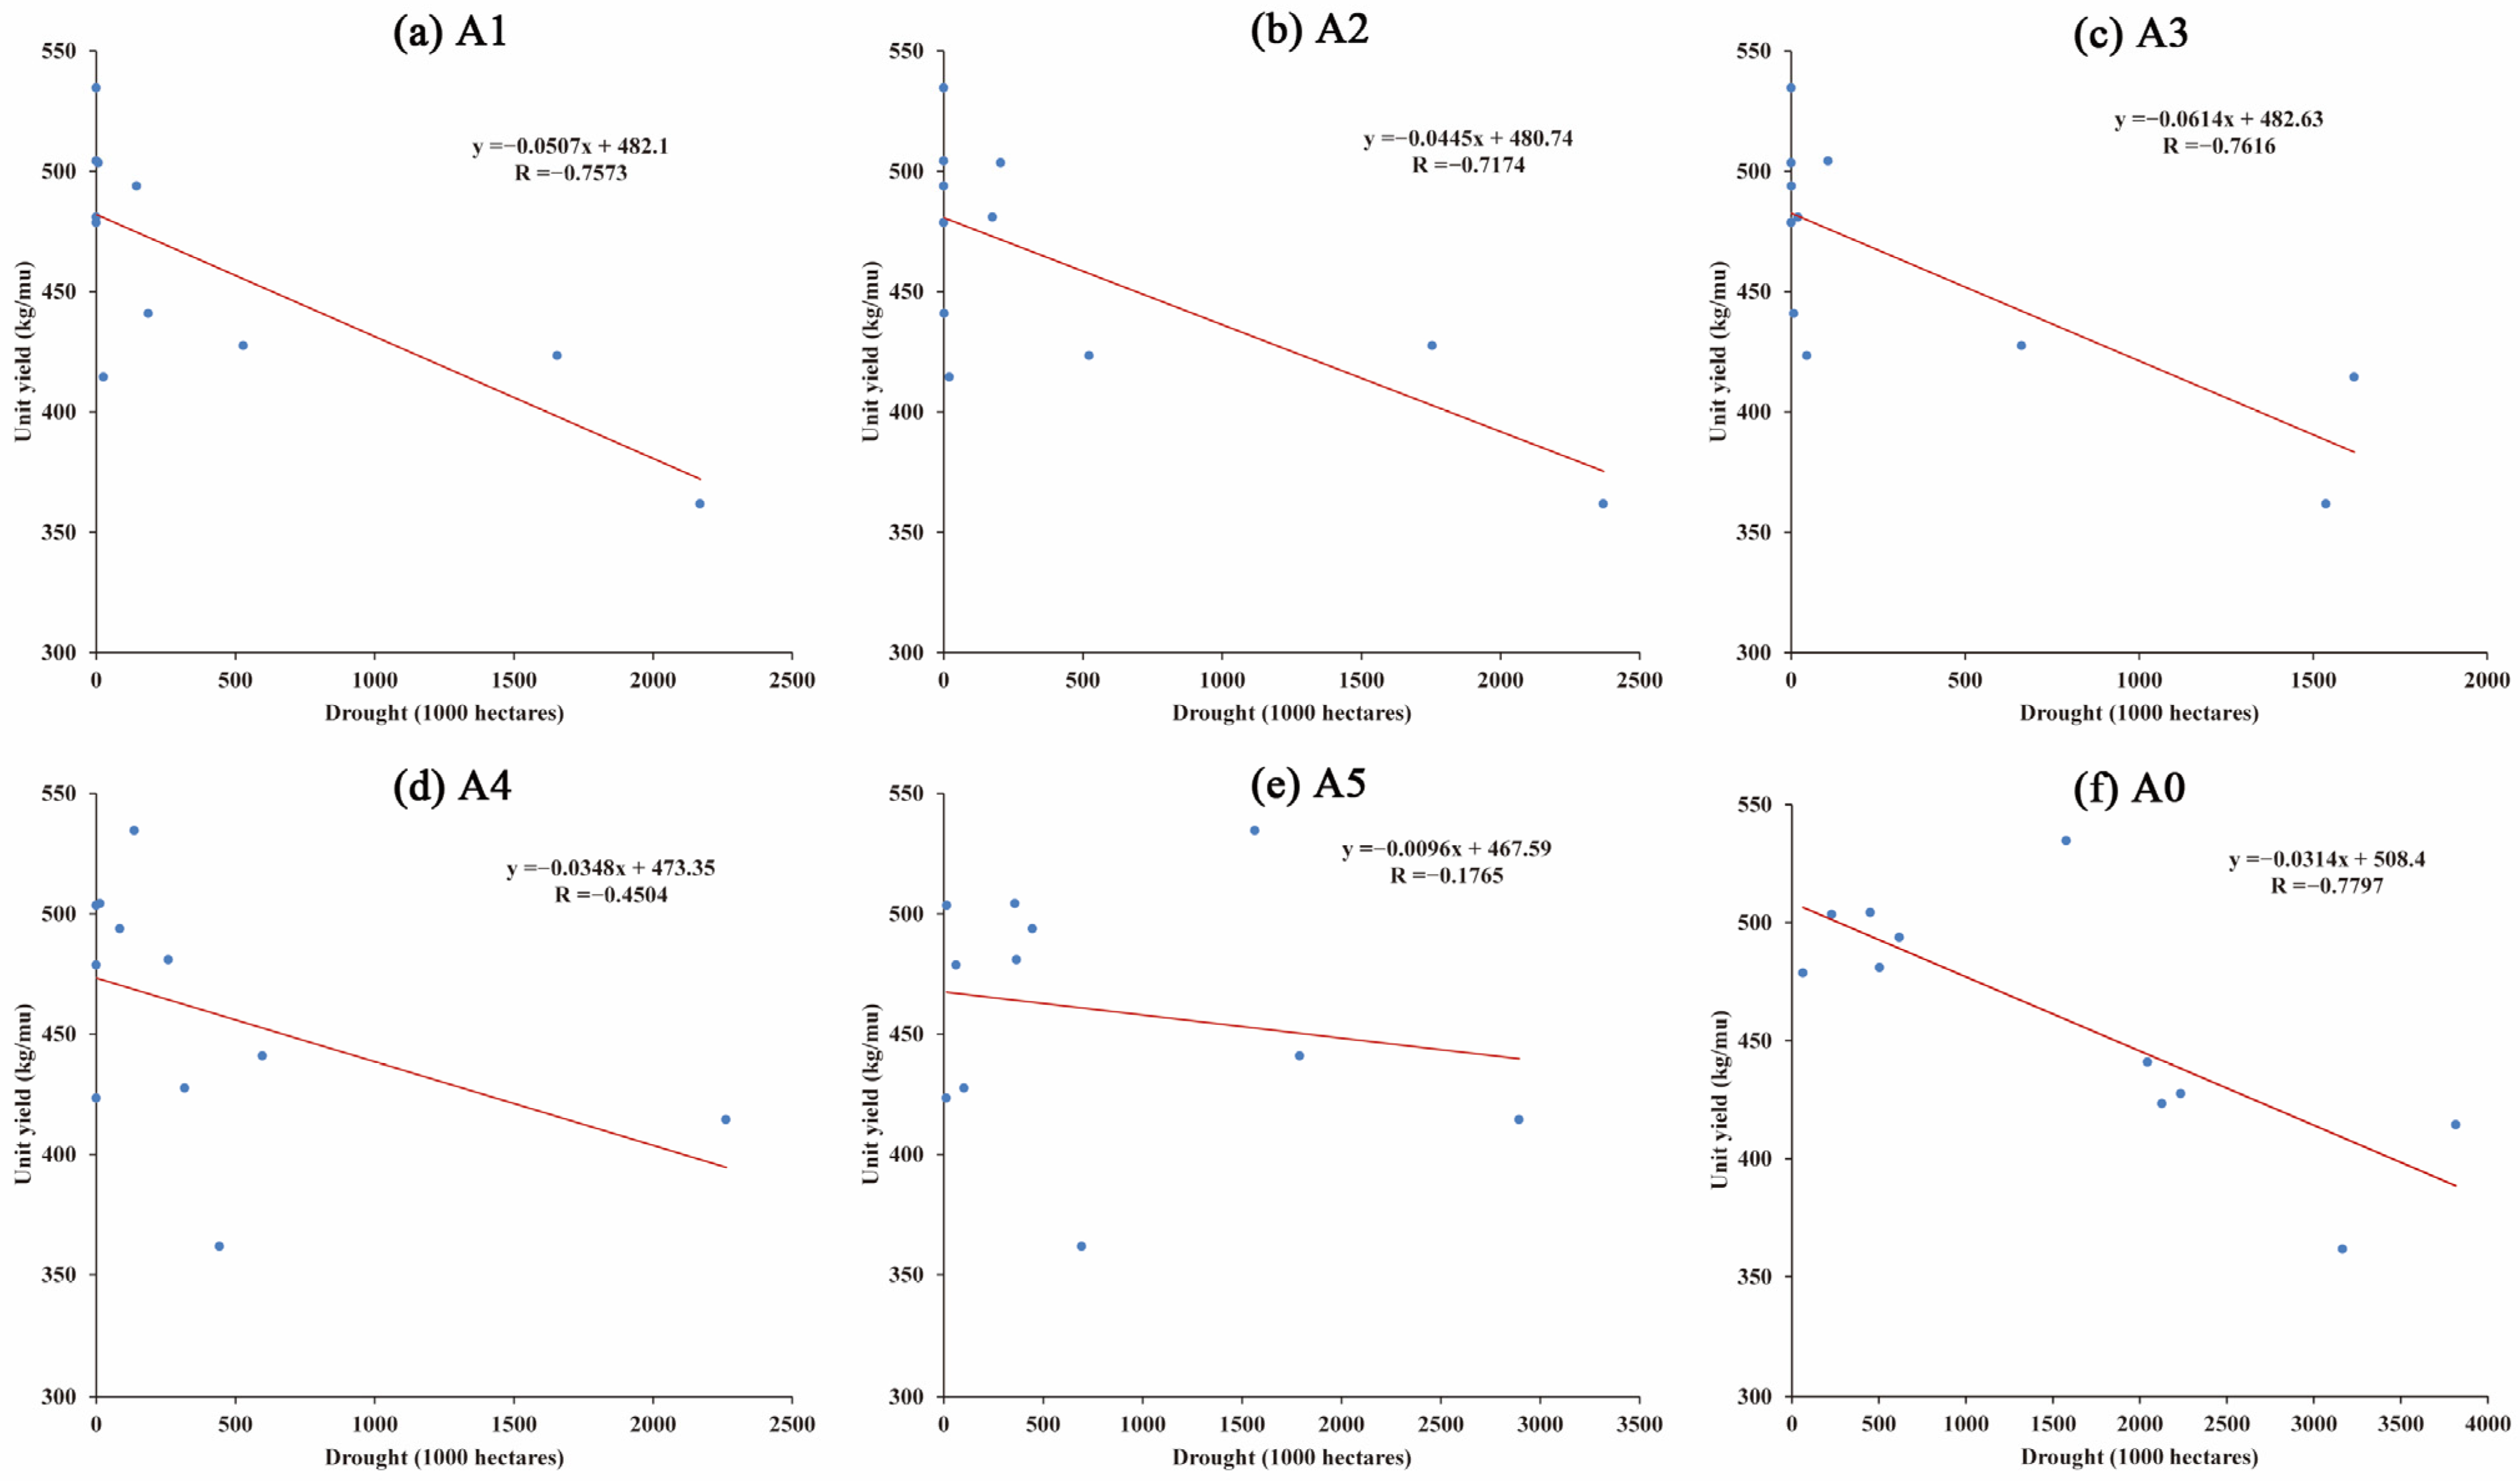
To further evaluate the accuracy of drought monitoring in this study, the relationship between the drought area of spring maize and the statistical average yield per unit area was further discussed in the Songnen Plain (Figure 11). It can be seen that the correlation between the drought area and the yield per unit area of spring maize was relatively high from the jointing to the heading stage, and the correlation between the drought area and the yield per unit area was relatively low from the milk-mature to the mature stage. Most studies also showed that drought from the jointing to the heading stage and from the heading to the milk-mature stage was the main reason for the yield reduction of spring maize [58,59]. Although drought was not the only disaster that caused the decrease in spring maize yield, it also indirectly indicated the effectiveness of drought-monitoring results in this study.
Soil relative moisture is also frequently utilized to indicate agricultural drought [9]. In this study, when developing a comprehensive drought model for spring maize, there was no excessive use of soil relative moisture data. We mainly took into account that the existing soil relative moisture data were discontinuous, and the acquisition time of remote-sensing data in each growth period for spring maize may not be synchronized with those of soil relative moisture, which cannot be compared. Thus, more appropriate soil moisture data will be obtained in future research to further assess the applicability of the CDI in this study.

5. Conclusions

In this study, the comprehensive drought index (CDI) in each growth period for spring maize was developed using multi-source remote-sensing data, and its feasibility was verified. In general, the CDI can be applied to the drought monitoring of spring maize. In the Songnen Plain, for spring maize, the years from 2001 to 2018 affected by drought in large areas were 2001, 2004, 2007 and 2017. Compared with the national statistical drought disaster data, the variation characteristics of spring maize drought areas in this study were generally compatible with the statistical data, which further confirms the effectiveness of the CDI. The drought barycenter of spring maize in 2001–2018 generally tended to the southern region in the Songnen Plain, so drought-prevention measures should be strengthened in these areas in the future. In the typical drought year (2007), the drought area of spring maize in the study area expanded, and the degree of drought gradually increased with the growth of spring maize. Although drought was not the only disaster that caused the decrease in spring maize yield, the study of the relationship between the drought area and the statistical average unit yield of spring maize can indirectly illustrate the effectiveness of drought-monitoring results in this study. The extreme climate events triggered by global climate change have had a huge impact on regional agricultural production. It is of great significance for improving the level of regional agricultural drought-disaster prevention to carry out crop drought-monitoring research. In the future, agricultural drought monitoring should aim for more precision. Due to limitations in the spatial scale of research data and the lack of drought disaster data, this study still has certain limitations, which need to be considered in further research in the future.

Author Contributions

Conceptualization, Z.P.; methodology, Z.P.; validation, Z.P.; formal analysis, B.W.; writing—original draft preparation, Z.P. and Y.F.; writing—review and editing, Z.P.; supervision, B.W.; project administration, B.W.; funding acquisition, Z.P. and Y.F. All authors have read and agreed to the published version of the manuscript.

Funding

This research was funded by the Key Scientific Research Projects of Colleges and Universities of Henan Province (grant number 23A170021), the Doctoral Research Initiation Fund Program of Nanyang Institute of Technology (grant number NGBJ-2022-36), the Interdisciplinary Sciences Project of Nanyang Institute of Technology (grant number NGJC-2022-16), and the Science and Technology Research Project of Henan Province (grant number 212102310225).

Institutional Review Board Statement

Not applicable.

Informed Consent Statement

Not applicable.

Data Availability Statement

The data used in this study are available upon request from the corresponding author. The data are not publicly available due to the needs of the next stage of research.

Acknowledgments

We would like to thank the China Meteorological Data Service Centre for providing the climate database, the National Bureau of Statistics of China for providing the agricultural disaster data, the NASA official website for providing the MODIS and TRMM data, and the Chinese Academy of Sciences for providing basic data used in this study.

Conflicts of Interest

The authors declare no conflict of interest.

References

  1. Gao, Y.; Gao, M.; Damdinsuren, B.; Dorjsuren, M. Early drought warning based on chlorophyll fluorescence and normalized difference vegetation index in Xilingol League of China. J. Appl. Remote Sens. 2021, 15, 032006. [Google Scholar] [CrossRef]
  2. Zhang, R.; Chen, Z.; Xu, L.; Ou, C. Meteorological drought forecasting based on a statistical model with machine learning techniques in Shaanxi province, China. Sci. Total Environ. 2019, 665, 338–346. [Google Scholar] [CrossRef] [PubMed]
  3. Tran, T.V.; Tran, D.; Myint, S.W.; Carmona, P.L.; Duan, H.D.; Tran, P.H.; Hung, D.N. Assessing Spatiotemporal Drought Dynamics and Its Related Environmental Issues in the Mekong River Delta. Remote Sens. 2019, 11, 2742–2764. [Google Scholar] [CrossRef]
  4. Mohseni, F.; Sadr, M.K.; Eslamian, S.; Areffian, A.; Khoshfetrat, A. Spatial and temporal monitoring of drought conditions using the satellite rainfall estimates and remote sensing optical and thermal measurements. Adv. Space Res. 2021, 67, 3942–3959. [Google Scholar] [CrossRef]
  5. Wang, F.; Lai, H.; Li, Y.; Feng, K.; Zhang, Z.; Tian, Q.; Zhu, X.; Yang, H. Dynamic variation of meteorological drought and its relationships with agricultural drought across China. Agric. Water Manag. 2022, 261, 107301. [Google Scholar] [CrossRef]
  6. Wang, S.; Mo, X.; Hu, S.; Liu, S.; Liu, Z. Assessment of droughts and wheat yield loss on the North China Plain with an aggregate drought index (ADI) approach. Ecol. Indic. 2018, 87, 107–116. [Google Scholar] [CrossRef]
  7. Champagne, C.; White, J.; Berg, A.; Belair, S.; Carrera, M. Impact of Soil Moisture Data Characteristics on the Sensitivity to Crop Yields Under Drought and Excess Moisture Conditions. Remote Sens. 2019, 11, 372. [Google Scholar] [CrossRef]
  8. Parsons, D.J.; Rey, D.; Tanguy, M.; Holman, I.P. Regional variations in the link between drought indices and reported agricultural impacts of drought. Agric. Syst. 2019, 173, 119–129. [Google Scholar] [CrossRef]
  9. Wu, X.; Wang, P.; Ma, Y.; Gong, Y.; Wu, D.; Yang, J.; Huo, Z. Standardized relative humidity index can be used to identify agricultural drought for summer maize in the Huang-Huai-Hai Plain, China. Ecol. Indic. 2021, 131, 108222. [Google Scholar] [CrossRef]
  10. Li, W.; Pan, R.; Jiang, Z.; Chen, Y.; Li, L.; Luo, J.-J.; Zhai, P.; Shen, Y.; Yu, J. Future changes in the frequency of extreme droughts over China based on two large ensemble simulations. J. Clim. 2021, 34, 6023–6035. [Google Scholar] [CrossRef]
  11. Cao, M.; Chen, M.; Liu, J.; Liu, Y. Assessing the performance of satellite soil moisture on agricultural drought monitoring in the North China Plain. Agric. Water Manag. 2022, 263, 107450. [Google Scholar] [CrossRef]
  12. Liu, X.; Zhu, X.; Zhang, Q.; Yang, T.; Pan, Y.; Sun, P. A remote sensing and artificial neural network-based integrated agricultural drought index: Index development and applications. Catena 2020, 186, 104394. [Google Scholar] [CrossRef]
  13. Lee, J.; Kim, Y.; Wang, D. Assessing the characteristics of recent drought events in South Korea using WRF-Hydro. J. Hydrol. 2022, 607, 127459. [Google Scholar] [CrossRef]
  14. Wu, D.; Li, Z.; Zhu, Y.; Li, X.; Wu, Y.; Fang, S. A new agricultural drought index for monitoring the water stress of winter wheat. Agric. Water Manag. 2021, 244, 106599. [Google Scholar] [CrossRef]
  15. Chang, J.; Li, Y.; Wang, Y.; Yuan, M. Copula-based drought risk assessment combined with an integrated index in the Wei River Basin, China. J. Hydrol. 2016, 540, 824–834. [Google Scholar] [CrossRef]
  16. Ming, B.; Guo, Y.; Tao, H.; Liu, G.; Li, S.; Wang, P. SPEIPM-based research on drought impact on maize yield in North China Plain. J. Integr. Agric. 2015, 14, 660–669. [Google Scholar] [CrossRef]
  17. Javed, T.; Li, Y.; Rashid, S.; Li, F.; Hu, Q.; Feng, H.; Chen, X.; Ahmad, S.; Liu, F.; Pulatov, B. Performance and relationship of four different agricultural drought indices for drought monitoring in China’s mainland using remote sensing data. Sci. Total Environ. 2020, 759, 143530. [Google Scholar] [CrossRef]
  18. Wu, R.; Liu, Y.; Xing, X. Evaluation of evapotranspiration deficit index for agricultural drought monitoring in North China. J. Hydrol. 2021, 596, 126057. [Google Scholar] [CrossRef]
  19. Zhang, M.; Luo, D.; Su, Y. Drought monitoring and agricultural drought loss risk assessment based on multisource information fusion. Nat. Hazards 2022, 111, 775–801. [Google Scholar] [CrossRef]
  20. Sun, X.; Lai, P.; Wang, S.; Song, L.; Ma, M.; Han, X. Monitoring of Extreme Agricultural Drought of the Past 20 Years in Southwest China Using GLDAS Soil Moisture. Remote Sens. 2022, 14, 1323. [Google Scholar] [CrossRef]
  21. Agutu, N.O.; Awange, J.L.; Zerihun, A.; Ndehedehe, C.E.; Kuhn, M.; Fukuda, Y. Assessing multi-satellite remote sensing, reanalysis, and land surface models’ products in characterizing agricultural drought in East Africa. Remote Sens. Environ. 2017, 194, 287–302. [Google Scholar] [CrossRef]
  22. Watson, A.; Miller, J.; Künne, A.; Kralisch, S. Using soil-moisture drought indices to evaluate key indicators of agricultural drought in semi-arid Mediterranean Southern Africa. Sci. Total Environ. 2022, 812, 152464. [Google Scholar] [CrossRef]
  23. García-León, D.; Contreras, S.; Hunink, J. Comparison of meteorological and satellite-based drought indices as yield predictors of Spanish cereals. Agric. Water Manag. 2019, 213, 388–396. [Google Scholar] [CrossRef]
  24. Jiao, W.; Wang, L.; Novick, K.A.; Chang, Q. A new station-enabled multi-sensor integrated index for drought monitoring. J. Hydrol. 2019, 574, 169–180. [Google Scholar] [CrossRef]
  25. Doughty, R.; Kurosu, T.P.; Parazoo, N.; Köhler, P.; Wang, Y.; Sun, Y.; Frankenberg, C. Global GOSAT, OCO-2, and OCO-3 solar-induced chlorophyll fluorescence datasets. Earth Syst. Sci. Data 2022, 14, 1513–1529. [Google Scholar] [CrossRef]
  26. Zhang, Z.; Xu, W.; Chen, Y.; Qin, Q. Monitoring and Assessment of Agricultural Drought based on Solar-induced Chlorophyll Fluorescence during Growing Season in North China Plain. IEEE J. Sel. Top. Appl. Earth Obs. Remote Sens. 2020, 14, 775–790. [Google Scholar] [CrossRef]
  27. Zhang, Y.; Liu, X.; Jiao, W.; Zeng, X.; Xing, X.; Zhang, L.; Yan, J.; Hong, Y. Drought monitoring based on a new combined remote sensing index across the transitional area between humid and arid regions in China. Atmos. Res. 2021, 264, 105850. [Google Scholar] [CrossRef]
  28. Xu, K.; Zhang, X.; Chen, Z.; Wu, W.; Li, T. Risk assessment for wildfire occurrence in high-voltage power line corridors by using remote-sensing techniques: A case study in Hubei Province, China. Int. J. Remote Sens. 2016, 37, 4818–4837. [Google Scholar] [CrossRef]
  29. Wei, W.; Zhang, J.; Zhou, J.; Zhou, L.; Li, C. Monitoring drought dynamics in China using Optimized Meteorological Drought Index (OMDI) based on remote sensing data sets. J. Environ. Manag. 2021, 292, 112733. [Google Scholar] [CrossRef]
  30. Zhang, B.; Song, X.; Zhang, Y.; Han, D.; Tang, C.; Yu, Y.; Ma, Y. Hydrochemical characteristics and water quality assessment of surface water and groundwater in Songnen plain, Northeast China. Water Res. 2012, 46, 2737–2748. [Google Scholar] [CrossRef]
  31. Yang, H.; Wang, H.; Fu, G.; Yan, H.; Zhao, P.; Ma, M. A modified soil water deficit index (MSWDI) for agricultural drought monitoring: Case study of Songnen Plain, China. Agric. Water Manag. 2017, 194, 125–138. [Google Scholar] [CrossRef]
  32. Wang, L.; Zheng, S.; Wang, X. The Spatiotemporal Changes and the Impacts of Climate Factors on Grassland in the Northern Songnen Plain (China). Sustainability 2021, 13, 6568. [Google Scholar] [CrossRef]
  33. Liu, D.; Wang, Z.; Song, K.; Zhang, B.; Hu, L.; Huang, N.; Zhang, S.; Luo, L.; Zhang, C.; Jiang, G. Land use/cover changes and environmental consequences in Songnen Plain, Northeast China. Chin. Geogr. Sci. 2009, 19, 299–305. [Google Scholar] [CrossRef]
  34. Wang, Y.; Shen, X.; Jiang, M.; Lu, X. Vegetation Change and Its Response to Climate Change between 2000 and 2016 in Marshes of the Songnen Plain, Northeast China. Sustainability 2020, 12, 3569. [Google Scholar] [CrossRef]
  35. Liu, Y.; Qin, Y.; Ge, Q. Spatiotemporal differentiation of changes in maize phenology in China from 1981 to 2010. J. Geogr. Sci. 2019, 29, 351–362. [Google Scholar] [CrossRef]
  36. Pei, Z.; Wu, B. Spatial-Temporal Characteristics of Spring Maize Drought in Songnen Plain, Northeast China. Water 2023, 15, 1618. [Google Scholar] [CrossRef]
  37. Yang, P.; Zhang, S.; Xia, J.; Zhan, C.; Cai, W.; Wang, W.; Luo, X.; Chen, N.; Li, J. Analysis of drought and flood alternation and its driving factors in the Yangtze River Basin under climate change. Atmos. Res. 2022, 270, 106087. [Google Scholar] [CrossRef]
  38. Chen, Y.; Wang, X.; Huang, L.; Luo, Y. Spatial and temporal characteristics of abrupt heavy rainfall events over Southwest China during 1981–2017. Int. J. Climatol. 2021, 41, 3286–3299. [Google Scholar] [CrossRef]
  39. Haroon, M.A.; Zhang, J.; Yao, F. Drought monitoring and performance evaluation of MODIS-based drought severity index (DSI) over Pakistan. Nat. Hazards 2016, 84, 1349–1366. [Google Scholar] [CrossRef]
  40. Luo, Y.; Zhang, Z.; Li, Z.; Chen, Y.; Zhang, L.; Cao, J.; Tao, F. Identifying the spatiotemporal changes of annual harvesting areas for three staple crops in China by integrating multi-data sources. Environ. Res. Lett. 2020, 15, 74003. [Google Scholar] [CrossRef]
  41. Rhee, J.; Im, J.; Carbone, G.J. Monitoring agricultural drought for arid and humid regions using multi-sensor remote sensing data. Remote Sens. Environ. 2010, 114, 2875–2887. [Google Scholar] [CrossRef]
  42. Zhang, A.; Jia, G. Monitoring meteorological drought in semiarid regions using multi-sensor microwave remote sensing data. Remote Sens. Environ. 2013, 134, 12–23. [Google Scholar] [CrossRef]
  43. Han, H.; Bai, J.; Yan, J.; Yang, H.; Ma, G. A combined drought monitoring index based on multi-sensor remote sensing data and machine learning. Geocarto Int. 2021, 36, 1161–1177. [Google Scholar] [CrossRef]
  44. Gu, Y.; Brown, J.F.; Verdin, J.P.; Wardlow, B. A five-year analysis of MODIS NDVI and NDWI for grassland drought assessment over the central Great Plains of the United States. Geophys. Res. Lett. 2007, 34, L06407. [Google Scholar] [CrossRef]
  45. Nanzad, L.; Zhang, J.; Tuvdendorj, B.; Nabil, M.; Zhang, S.; Bai, Y. NDVI anomaly for drought monitoring and its correlation with climate factors over Mongolia from 2000 to 2016. J. Arid Environ. 2019, 164, 69–77. [Google Scholar] [CrossRef]
  46. Xu, H.; Wang, X.; Zhao, C.; Yang, X. Assessing the response of vegetation photosynthesis to meteorological drought across northern China. Land Degrad. Dev. 2021, 32, 20–34. [Google Scholar] [CrossRef]
  47. Kamble, D.B.; Gautam, S.; Bisht, H.; Rawat, S.; Kundu, A. Drought assessment for kharif rice using standardized precipitation index (SPI) and vegetation condition index (VCI). J. Agrometeorol. 2019, 21, 182–187. [Google Scholar] [CrossRef]
  48. Gao, C.; Chen, C.; He, Y.; Ruan, T.; Luo, G.; Sun, Y. Response of Agricultural Drought to Meteorological Drought: A Case Study of the Winter Wheat above the Bengbu Sluice in the Huaihe River Basin, China. Water 2020, 12, 2805. [Google Scholar] [CrossRef]
  49. Feng, P.; Wang, B.; Liu, D.L.; Yu, Q. Machine learning-based integration of remotely-sensed drought factors can improve the estimation of agricultural drought in South-Eastern Australia. Agric. Syst. 2019, 173, 303–316. [Google Scholar] [CrossRef]
  50. Chen, F.; Yu, L.; Liu, Q.; Li, X. Spatial downscaling of TRMM 3B43 precipitation considering spatial heterogeneity. Int. J. Remote Sens. 2014, 35, 3074–3093. [Google Scholar] [CrossRef]
  51. Wang, J.; Zhang, F. Spatial-temporal pattern and gravity center change of fractional vegetation cover in Xinjiang, China from 2000 to 2019. Trans. Chin. Soc. Agric. Eng. 2020, 36, 188–194. [Google Scholar] [CrossRef]
  52. Wang, L.; Wu, Z.; He, H.; Wang, F.; Du, H.; Zong, S. Changes in summer extreme precipitation in Northeast Asia and their relationships with the East Asian summer monsoon during 1961–2009. Int. J. Climatol. 2017, 37, 25–35. [Google Scholar] [CrossRef]
  53. Diao, C.; Liu, Y.; Zhao, L.; Zhuo, G.; Zhang, Y. Regional-scale vegetation-climate interactions on the Qinghai-Tibet Plateau. Ecol. Inform. 2021, 65, 101413. [Google Scholar] [CrossRef]
  54. Ghorbanpour, A.K.; Hessels, T.; Moghim, S.; Afshar, A. Comparison and assessment of spatial downscaling methods for enhancing the accuracy of satellite-based precipitation over Lake Urmia Basin. J. Hydrol. 2021, 596, 126055. [Google Scholar] [CrossRef]
  55. Duveiller, G.; Cescatti, A. Spatially downscaling sun-induced chlorophyll fluorescence leads to an improved temporal correlation with gross primary productivity. Remote Sens. Environ. 2016, 182, 72–89. [Google Scholar] [CrossRef]
  56. Zhang, Z.; Xu, W.; Qin, Q.; Long, Z. Downscaling Solar-Induced Chlorophyll Fluorescence Based on Convolutional Neural Network Method to Monitor Agricultural Drought. IEEE Trans. Geosci. Remote Sens. 2020, 59, 1012–1028. [Google Scholar] [CrossRef]
  57. Shen, Z.; Zhang, Q.; Singh, V.P.; Sun, P.; He, C.; Cheng, C. Station-based non-linear regression downscaling approach: A new monthly precipitation downscaling technique. Int. J. Climatol. 2021, 41, 5879–5898. [Google Scholar] [CrossRef]
  58. Zhu, X.; Xu, K.; Liu, Y.; Guo, R.; Chen, L. Assessing the vulnerability and risk of maize to drought in China based on the AquaCrop model. Agric. Syst. 2021, 189, 103040. [Google Scholar] [CrossRef]
  59. Li, P.; Huang, Q.; Huang, S.; Leng, G.; Peng, J.; Wang, H.; Zheng, X.; Li, Y.; Fang, W. Various maize yield losses and their dynamics triggered by drought thresholds based on Copula-Bayesian conditional probabilities. Agric. Water Manag. 2022, 261, 107391. [Google Scholar] [CrossRef]
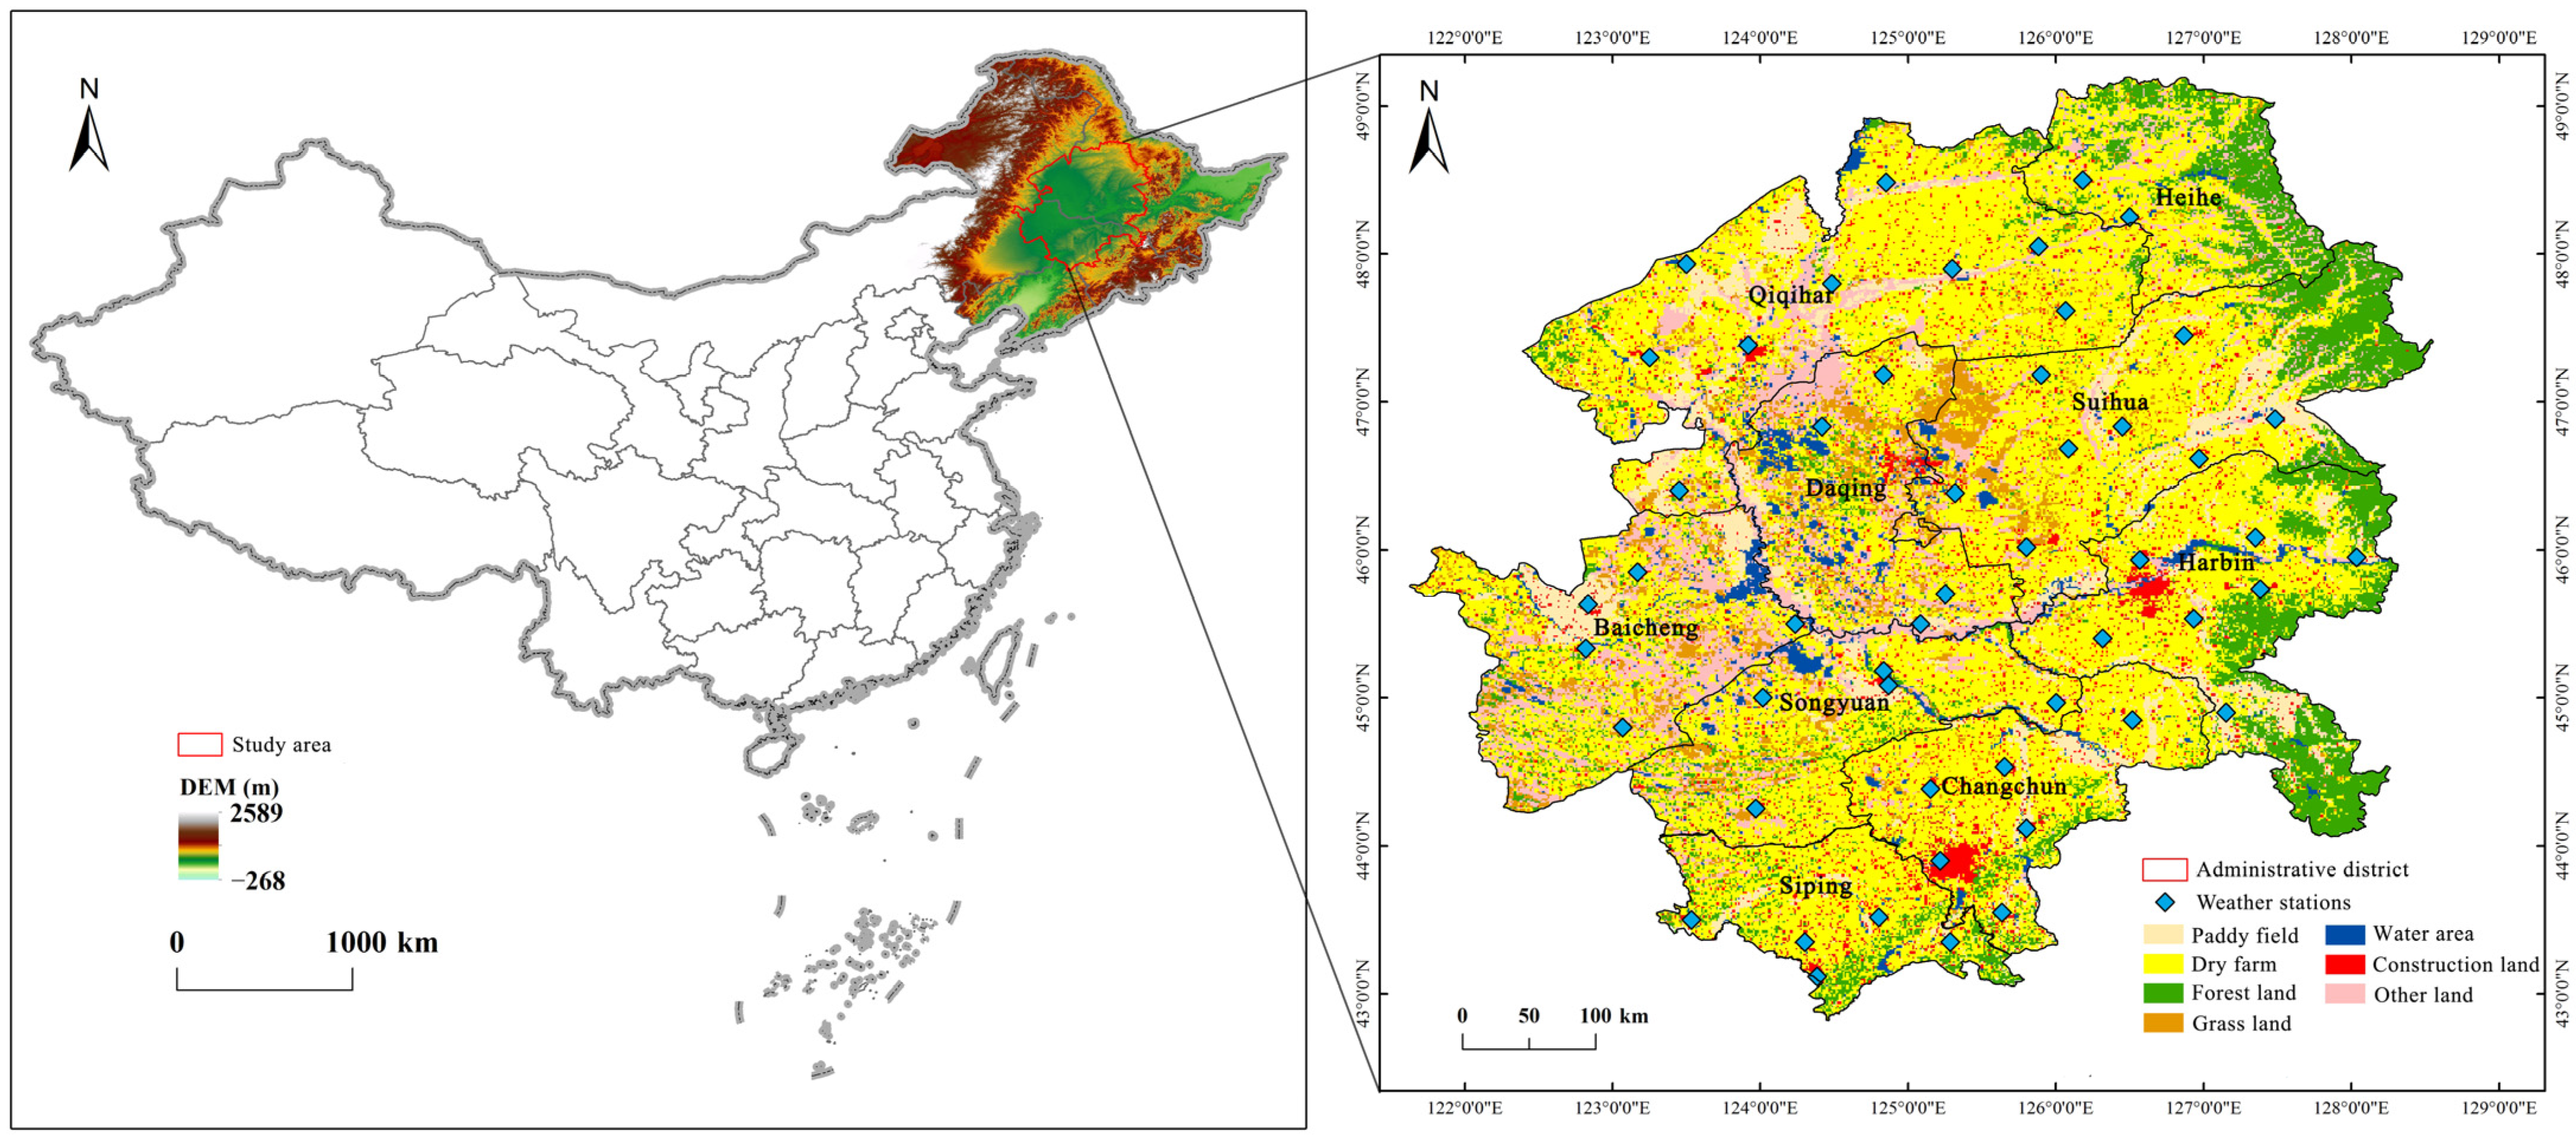
Figure 1. Geographical location, distribution of meteorological stations, and land use types of the Songnen Plain.
Atmosphere 14 01614 g001
Figure 2. Flowchart of drought model construction.
Atmosphere 14 01614 g002
Figure 3. Comparison between the CDI and other drought indices (SCWDI, VCI and VCISIF) in different growth stages of spring maize (Red represents drought, blue represents no drought): (a) the sowing to the seedling stage; (b) the seedling to the jointing stage; (c) the jointing to the heading stage; (d) the heading to the milk-mature stage; (e) the milk-mature to the mature stage.
Atmosphere 14 01614 g003
Figure 4. Correlation between the CDI and crop yield at typical agrometeorological stations (The blue dot represents the relevant point, and the red line represents linear fitting).
Atmosphere 14 01614 g004
Figure 5. Correlation between the CDI and RSM in different growth stages of spring maize (The blue dot represents the relevant point, and the red line represents linear fitting): (a) the sowing to the seedling stage; (b) the seedling to the jointing stage; (c) the jointing to the heading stage; (d) the heading to the milk-mature stage; (e) the milk-mature to the mature stage; (f) the whole growth stage.
Atmosphere 14 01614 g005
Figure 6. The change of drought area in each growth period for spring maize in the Songnen Plain from 1981 to 2018. (A1: the sowing to the seedling stage; A2: the seedling to the jointing stage; A3: the jointing to the heading stage; A4: the heading to the milk-mature stage; A5: the milk-mature to the mature stage; A0: the whole growth stage).
Atmosphere 14 01614 g006
Figure 7. The change of drought barycenter in each growth period for spring maize in the Songnen Plain from 2001 to 2018: (a) the sowing to the seedling stage; (b) the seedling to the jointing stage; (c) the jointing to the heading stage; (d) the heading to the milk-mature stage; (e) the milk-mature to the mature stage.
Atmosphere 14 01614 g007
Figure 8. Spatial distribution of drought in each growth period for spring maize in 2007: (a) the sowing to the seedling stage; (b) the seedling to the jointing stage; (c) the jointing to the heading stage; (d) the heading to the milk-mature stage; (e) the milk-mature to the mature stage.
Atmosphere 14 01614 g008
Figure 9. Comparison of TRMM precipitation data before and after downscaling in each growth period of spring maize: (a) the sowing to the seedling stage; (b) the seedling to the jointing stage; (c) the jointing to the heading stage; (d) the heading to the milk-mature stage; (e) the milk-mature to the mature stage.
Atmosphere 14 01614 g009
Figure 10. Comparison of SIF data before and after downscaling in each growth period of spring maize: (a) the sowing to the seedling stage; (b) the seedling to the jointing stage; (c) the jointing to the heading stage; (d) the heading to the milk-mature stage; (e) the milk-mature to the mature stage.
Atmosphere 14 01614 g010
Figure 11. The relationship between drought area and statistical yield of spring maize in the Songnen Plain (The blue dot represents the relevant point, and the red line represents linear fitting): (a) the sowing to the seedling stage; (b) the seedling to the jointing stage; (c) the jointing to the heading stage; (d) the heading to the milk-mature stage; (e) the milk-mature to the mature stage; (f) the whole growth stage.
Atmosphere 14 01614 g011
Table 1. Products for remote sensing used in this study.
ProductsType of Data ObtainedSpatial
Resolution (km)
Temporal
Resolution (d)
Source
MOD09A1NDVI0.58http://modis.gsfc.nasa.gov/
(accessed on 6 January 2023)
MOD11A2LST18
MOD17A2HGPP0.58
TRMM 3B42 V7Precipitation251http://trmm.gsfc.nasa.gov/
(accessed on 3 December 2022)
GOSIF_v2SIF58http://globalecology.unh.edu/data/GOSIF.html/
(accessed on 8 December 2022)
Disclaimer/Publisher’s Note: The statements, opinions and data contained in all publications are solely those of the individual author(s) and contributor(s) and not of MDPI and/or the editor(s). MDPI and/or the editor(s) disclaim responsibility for any injury to people or property resulting from any ideas, methods, instructions or products referred to in the content.