Abstract
Currently, satellite-based soil moisture (SM) products and land surface model assimilation techniques are widely utilized. However, the presence of systematic errors in the observation process, algorithmic discrepancies between products, and variations in spatial and temporal scales result in diverse accuracy characteristics and applicability. This study evaluates three prominent SM products in China, namely, the Essential Climate Variable Soil Moisture (ECV), the European Centre for Medium-Range Weather Forecasts’ Fifth-Generation Land Surface Reanalysis Data (ERA5-Land), and the Global Land Surface Data Assimilation System (GLDAS). The evaluation was conducted using extended triple collocation (ETC) analysis and in situ validation methods at a monthly scale from 2000 to 2020. The ETC analysis results show that among the three products, GLDAS exhibits the highest correlation coefficient (CC) and the lowest standard deviation of error (ESD), indicating its superior performance in China. ECV and ERA5-Land follow, with slightly lower performance. In the in situ validation results, ERA5-Land displays the highest correlation, capturing the temporal trend of the ground SM well. Comparatively, in terms of overall accuracy, ECV performs the best, with a slightly smaller mean error (ME) and root mean square error (RMSE) than GLDAS, and ERA5-Land has the lowest accuracy. The discrepancy between the in situ validation results and ETC analysis can be attributed to the limited number of sites and their representativeness errors. Notably, ERA5-Land exhibits a highly consistent trend of interannual fluctuations between ESD and precipitation. Furthermore, a strong association is observed between the ME and RMSE of ECV and GLDAS and precipitation. These findings serve as valuable references for future SM studies in China.
1. Introduction
Surface soil moisture (SM) plays a crucial role in the energy exchange between the land and the atmosphere within the Earth system [1]. It exerts strong control over processes such as land surface evapotranspiration, water transport, and the carbon cycle. Consequently, it serves as a critical indicator for assessing drought conditions [2,3] in climate, hydrology [4], ecology [5], and agriculture [6]. Thus, large-scale monitoring of SM is essential for studying agricultural processes and evaluating environmental factors. Moreover, it holds great importance in enhancing regional and global climate models and predicting regional wet and dry conditions.
Conventional SM data are typically acquired through in situ measurements, which offer high accuracy but are limited to specific points and time intervals [7]. To overcome these limitations, remote-sensing-based SM monitoring has gained traction, offering advantages such as real-time data availability, dynamic comparability, long-term large-area monitoring, and improved spatial and temporal resolution. Notable remote-sensing SM products include the Essential Climate Variable Soil Moisture (ECV) [8], the Soil Moisture Operational Product System (SMOS) [9], and the Soil Moisture Active Passive Product (SMAP) [10]. In recent years, the Land Surface Data Assimilation System (LDAS) has emerged as a rapidly developing method that applies four-dimensional assimilation techniques to Earth surface science and hydrology [11]. LDAS provides fast and predictable surface information, although its parameter determination is complex and prone to large estimation errors. Prominent LDAS products include the Global Land Surface Data Assimilation System (GLDAS) [12], the European Centre for Medium-Range Weather Forecasts’ Fifth-Generation Land Surface Reanalysis Data (ERA5-Land) [13], and the China Meteorological Administration Land Surface Data Assimilation System (CLDAS) [14]. Satellite-based SM data capture instantaneous measurements, but uncertainties arise from sensor errors and the influence of vegetation cover. Land surface model assimilation data, on the other hand, often overlook human interference and may differ from ground-based observations. Given the inherent uncertainties associated with these SM products, it becomes crucial to validate and evaluate their performance [15].
In situ measurements serve as a reliable reference for evaluating the accuracy of other SM products. Researchers such as Li et al. have conducted intercomparison and evaluation studies of various SM products, including reanalysis, assimilation, and satellite-based products, across 18 hydroclimatic regions in China at different scales during the period from 2000 to 2018. These evaluations were performed using in situ validation techniques. The findings of Li et al. demonstrated the favorable potential of ERA5 products for applications in China, highlighting their performance compared to other SM products [16]. Similarly, Yang et al. evaluated the performance of ERA-Interim products in the permafrost region of the Qinghai-Tibet Plateau (QTP) from 2013 to 2014. They utilized data collected from five field observation stations with different land cover types. The evaluation involved comparing the performance of four reanalysis SM products, and the results indicated that the ERA-Interim product exhibited superior performance in simulating SM within the QTP permafrost region, outperforming other products. These studies exemplify the use of in situ measurements to assess and validate the performance of different SM products, providing valuable insights into their effectiveness in specific regions and under specific conditions.
In situ measurements serve as a reliable reference for evaluating the accuracy of other SM products [15,17,18,19,20,21]. Ma et al. evaluated five remote-sensing SM products globally using in situ data, and the results showed that ECV outperforms the other products in terms of overall accuracy, with a slightly smaller ubRMSE and bias [22]. Yang et al. evaluated the performance of ERA-Interim products in the permafrost region of the Qinghai-Tibet Plateau (QTP) from 2013 to 2014. They utilized data collected from five field observation stations with different land cover types. The evaluation involved comparing the performance of four reanalysis SM products, and the results indicated that the ERA-Interim product exhibited superior performance in simulating SM within the QTP permafrost region, outperforming other products [23]. Araki et al. evaluated the GLDAS product using an in situ soil moisture network and showed that GLDAS performed well (RMSE = 0.100 m3/m3; ubRMSE = 0.060 m3/m3; R = 0.555) but systematically overestimated soil moisture values (bias = 0.067 m3/m3) [24]. These studies exemplify the use of in situ measurements to assess and validate the performance of different SM products, providing valuable insights into their effectiveness in specific regions and under specific conditions.
In addition to in situ measurements, triple collocation (TC) analysis is an effective method for evaluating SM products. TC analysis involves estimating the random error variances of three collocated datasets of the same geophysical variable [25]. This approach allows for the evaluation of SM products by calculating metrics such as error variance and signal-to-noise ratio, even in the absence of a known reference dataset [26]. Numerous researchers have achieved favorable results in SM evaluation studies using TC methods [27,28,29]. In recent years, an extended triple collocation (ETC) approach has been proposed [29]. ETC does not impose additional assumptions or computational costs compared to TC. Moreover, it enables the derivation of an additional performance metric, namely, the correlation coefficient with the unknown truth. Consequently, ETC has gained wider usage in recent studies [30,31,32]. For instance, Ming et al. (2022) conducted an ETC analysis to assess the uncertainty of ERA5-Land, GLDAS, and SMAP in Yunnan Province. Their findings indicated that GLDAS outperformed SMAP and ERA5-Land. Moreover, a direct comparison with in situ observations yielded similar results, suggesting that ETC analysis is a reasonable approach for comparing and assessing satellite or model-based SM datasets, particularly in areas with limited data availability [31].
To sum up the above arguments, several scholars have conducted SM evaluation studies in various regions of China [14,16,23,31,33,34]. However, there is a lack of comprehensive assessment studies covering different types of SM products for monthly scale long time series across China. Additionally, there are many studies on ERA5 in China [17,20] but relatively few evaluation studies on the latest reanalysis data such as ERA5-Land. At the spatial scale, most studies focus on evaluating SM at the same spatial resolution, disregarding the issue of limited spatial representativeness of the in situ data itself. Given the complex and diverse climatic conditions across China’s vast region, it is crucial to evaluate the performance of different types of SM products in different regions.
In summary, this study was conducted to evaluate the performance of three SM products (ECV, ERA5-Land, and GLDAS) in China at two spatial scales (0.25° × 0.25°, 0.1° × 0.1°). The main objectives of this study were: (1) to evaluate the accuracy and applicability of three SM products in China using ETC and in situ observations; (2) to investigate accuracy features over different regions and land cover types; (3) to study the temporal response of three SM products to precipitation and irrigation. The results obtained from the study can act as a reference for future studies on hydrological and drought-related applications in different regions of China.
2. Materials and Methods
2.1. Study Area
China is situated in eastern Asia, along the western coast of the Pacific Ocean. It stretches from the center of the Heilongjiang River near Mohe in the north to Zengmuansha in the Spratly Islands in the south. From a west-to-east perspective, it extends from the Pamir Plateau to the confluence of the Heilongjiang and Ussuri Rivers. China is a vast country with a land area of 9.6 million square kilometers (3°51′–53°33′ N, 73°33′–135°05′ E). The topography varies, with lower elevations in the east and higher elevations in the west. China experiences a diverse range of climate types and topography, spanning tropical, subtropical, warm temperate, middle temperate, and cold temperate zones from south to north. The country’s land cover types also exhibit significant variation among provinces (Figure 1). Grasslands, for instance, are primarily found in regions such as Inner Mongolia Autonomous Region, Tibet Autonomous Region, and Qinghai Province. Southern provinces of China are predominantly covered by savannas. Central regions, such as Shandong Province and Henan Province, are characterized by arable land, which also serves as the primary distribution area for ground stations. Consequently, the spatial and temporal distribution of SM varies greatly across different provinces and regions of China. To accurately analyze the spatial and temporal variations in SM in different provinces and regions of China, this study evaluated three classical SM products on a province-level basis. This approach enables a more precise examination of SM characteristics across various regions within the country.
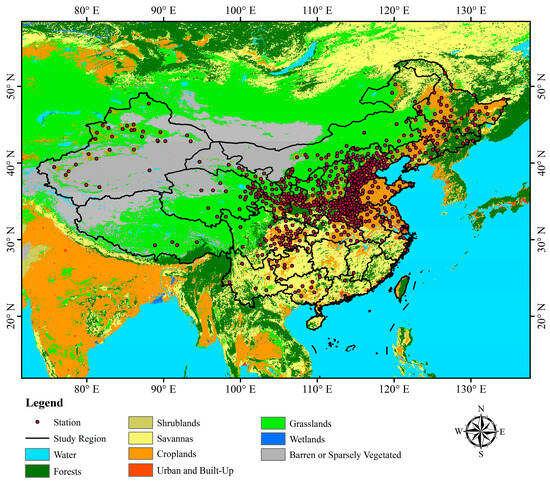
Figure 1.
Spatial distribution of SM stations and land cover types in China.
2.2. Data
Basic information about the datasets used in this study is listed in Table 1.

Table 1.
Main information of the used parameters.
2.2.1. SM Data
The main datasets used in this study consist of three long time-series SM products: GLDAS, ECV, and ERA5-Land. GLDAS, known as a classical and outstanding framework for land surface modeling, is recognized as one of the few global-scale assimilation systems. It provides the best fields of land surface state and fluxes on a global scale in nearly real time [14,15,31]. Extensive studies have comprehensively and systematically evaluated the performance of ECV [8,33,35,36]. The general consensus from these studies is that ECV demonstrates a good agreement with surface observations and reanalysis products. Furthermore, the accuracy and robustness of ECV SM have steadily improved with updates to the dataset versions. In contrast, ERA5-Land offers higher spatial and temporal resolutions. It also utilizes more satellite-based observations to optimize the output results [23,37]. Previous research has indicated that ERA5-Land exhibits higher quality compared to other reanalysis products and represents a significant improvement over its predecessors. These findings imply that ERA5-Land holds great promise for various applications. Given these considerations, the three SM products (GLDAS, ECV, and ERA5-Land) were chosen as the primary datasets for this study.
The ECV (v07.1) [8] SM product, known as Essential Climate Variable-Soil Moisture, is a global dataset that provides daily SM information. It combines data from various active and passive microwave sensors and is the first attempt to create a continuous series of satellite remote-sensing SM data spanning from 1978 to 2020. For this study, the daily dataset covering the period from 1 January 2000 to 31 December 2020 was downloaded, with a spatial resolution of 0.25° × 0.25° and expressed in m³/m³.
The ERA5-Land [13] dataset, produced by the European Centre for Medium Range Weather Forecasts (ECMWF), is a global reanalysis dataset available from 1950 to the present. It includes SM data at four different vertical layers (0–7, 7–28, 28–100, 100–189 cm). For this study, the monthly average surface (0–7 cm) SM dataset covering the period from January 2000 to December 2020 was utilized. The spatial resolution of this dataset is 0.1° × 0.1°, and the units are m³/m³.
The GLDAS (Global Land Data Assimilation System) [12] is a global-scale dataset that integrates satellite remote-sensing data, in situ observations, data assimilation techniques, and complex surface models to estimate water and energy variables. Multiple surface models, including Noah, Mosaic, CLM, and VIC, are employed within GLDAS. The surface SM estimates used in this study were obtained from the GLDAS-2.1 Noah model (referred to as GLDAS). The dataset provides SM estimates at different levels: 0–10, 10–40, 40–100, and 100–200 cm. For this study, the monthly average surface (0–10 cm) SM data for the year 2000 were utilized. The spatial resolution of the GLDAS dataset is 0.25° × 0.25°, and the units are kg/m².
The monthly in situ SM data were sourced from the study by Wang et al. in 2019 [38]. They obtained the original data from the National Meteorological Information Center of the China Meteorological Administration (http://data.cma.cn/ (accessed on 1 July 2023)). SM measurements were collected at five soil depths (10, 20, 50, 70, and 100 cm) on the 8th, 18th, and 28th days of each month. Stations with continuous and reliable data records were selected for inclusion in the study. Specifically, stations with available SM measurements at a depth of 10 cm for more than five growing seasons between 1992 and 2013 were chosen. There were 732 stations with good-quality data. The SM data at a depth of 10 cm with a monthly temporal resolution were used in this study. The unit of measurement for the in situ data is m³/m³.
2.2.2. Auxiliary Data
- (1)
- Precipitation
Multi-Source Weighted Integrated Precipitation (MSWEP) is a recently released global precipitation dataset that provides a 3-hourly temporal resolution, spanning from 1979 to the near present [39]. What sets this dataset apart is its unique approach of utilizing measured, satellite, and reanalysis data to derive high-quality precipitation estimates for each station. Moreover, MSWEP is designed to be compatible with mid-term forecast sets (updated daily) and seasonal forecast sets (updated monthly). In comparison to other precipitation products, MSWEP demonstrates superior performance in both densely observed and ungauged areas.
- (2)
- Land cover
The MODIS Level 3 Data Land Cover Types product (MCD12C1) provides a processed description of land cover types, utilizing data from one year of Terra and Aqua observations [40]. This comprehensive land cover dataset encompasses 17 major land cover types, including 11 natural vegetation types, 3 land development and mosaic land types, and 3 non-herbaceous land type definition classes, as defined by the International Geosphere Biosphere Programme (IGBP). For this study, the MCD12C1 data from 2013 were employed, which are available as a global mosaic in the geographic lat/long projection at a spatial resolution of 0.05°.
- (3)
- Irrigation withdrawal
The irrigation withdrawal data were obtained from a global gridded (0.5°) monthly sectoral withdrawal dataset (1971–2010) [41]. Water withdrawal datasets acquired from the Food and Agriculture Organization AQUASTAT and US Geological Survey were scaled down spatially from country (or state) level to grid scale, and from a 5-year interval to a monthly scale. As for the irrigation data used in this study, four reconstructed irrigation withdrawal datasets were generated based on reported data and gridded monthly irrigation withdrawal values simulated by four global hydrological models (GHMs). Irrigation withdrawals modeled by these four GHMs were in reasonable agreement (correlation coefficient r over 0.7) with FAO AQUASTAT and USGS estimates at the national and U.S. state levels, respectively. Multiple GHMs were considered due to differences in model structure and parameters, with large variations across GHMs at seasonal and regional scales.
2.2.3. Data Pre-Processing
Since the SM data and auxiliary data used have different spatial resolutions and formats, all data need to be pre-processed. All data were converted to “tif” format, geographic coordinates were set to GCS-WGS-1984, and all SM data units were standardized to volumetric water content (m3/m3). The four irrigation withdrawal datasets were averaged. The ERA5-Land and precipitation data were resampled to 0.25° using the nearest neighbor method, and the GLDAS and ECV data were resampled to 0.1° using the bilinear interpolation method. Land cover data and irrigation withdrawal data were also reclassified to two spatial scales. Finally, all data were uniformly cropped to the study area. This resulted in SM data and auxiliary data at both scales. The time-series lengths of the data used in this study are depicted in Figure 2.

Figure 2.
Years of coverage for each dataset.
The MODIS land cover type map was reclassified to nine categories according to Table 2. And the number of stations distributed on different land cover types is listed in Table 2. Since the number of distributed stations on water bodies, shrublands, wetlands, and deserts is very small, the relationship between these land cover types and SM is not considered for the time being. Because urban areas tend to have high-rise buildings and hard surfaces, and most of the monitoring stations are on parks as well as green areas, the in situ data are not a good representation of the urban environment. Therefore, we mainly consider the effect of four land cover types: forest, savanna, grassland, and cropland on SM distribution.

Table 2.
Land cover type reclassification and number of distributed stations.
2.3. Methods
2.3.1. Extended Triple Collocation
The classical triple collocation (TC) method is a statistical approach used to estimate the random error variance of three independent datasets [25]. In the context of evaluating remotely sensed SM datasets globally, TC analysis has become one of the most significant methods [26,27]. The TC method assumes a linear relationship between the three SM products (SMi, where i = 1, 2, 3) and the true SM value (T):
where SMi represents the actual SM value, εi is the random error, and βi and αi are the ME and scaling factors.
The covariances of the different SM datasets are expressed as:
The TC method relies on three key assumptions: (1) the random errors in the three input datasets are mutually independent; (2) the expected values of the random errors are zero; and (3) there is no covariance between the random errors and the unknown true values. Based on these assumptions, the covariances between different SM datasets can be expressed as follows:
where indicates the random error variance of the ith input dataset.
Due to the presence of six equations and seven unknowns, the above equation does not have a unique solution. To address this issue, a new variable is introduced, denoted as θi = βiσT. As a result, the equation can be expressed in the following form:
The error standard deviation (ESD) of the three datasets can be expressed by the following equation:
In recent years, an extended triple collocation (ETC) method has been proposed to obtain correlations with unknown real SM [29]. Here, βi can be expressed as:
where is the correlation coefficient (CC) between T and SMi. Finally, we can obtain a new estimating equation for parameter CC:
2.3.2. Evaluation Metrics Based on In Situ Observations
The previous SM evaluation studies commonly utilize four statistical indicators, namely, Pearson’s correlation coefficient (R), mean error (ME), root mean square error (RMSE), and unbiased root mean square error (ubRMSE). These indicators are employed to quantify the disparity between each SM product and the in situ data, as defined below, where represents the actual station measurement data, and represents the SM product data.
Pearson’s correlation coefficient (R), also known as the product–moment correlation, is a statistical measure introduced by the British statistician Pearson in the 20th century. It is used to assess the linear correlation between variables. In the context of SM evaluation, R is employed to indicate the strength of the linear relationship between the SM product and the station’s measured data. A value of R close to 1 signifies a high correlation, indicating better performance of the SM product. The calculation formula for R is as follows:
ME indicates how close the SM product is to the actual measured data at the station. The closer ME is to 0, the higher the accuracy of the product, calculated by the following formula:
The root mean square error (RMSE) indicates the deviation between the SM product and the actual measured data at the station, and its sensitivity to outliers is high. The RMSE can reflect the accuracy of the data well, and the closer to 0, the higher the accuracy of the product. The calculation formula is:
The unbiased root mean square error (ubRMSE) is an unbiased estimate of the root mean square error and is a commonly used error parameter in SM evaluation studies. The smaller the ubRMSE, the higher the accuracy of the data. The calculation formula is:
3. Results
3.1. ETC-Based Assessment
As can be seen in Figure 3, Figure 4, Figure 5 and Figure 6, the results of the ETC analysis are very similar at both spatial scales. It was also found that almost all the validation results on both spatial scales are consistent. Therefore, in this paper, the validation results are presented on the 0.1° scale as an example. The results for other 0.25° scales are shown in the Supplementary Materials. Figure 3 and Figure 4 show the spatial distribution of the ESD and CC for the three products based on ETC analysis. The results show that ECV has relatively high ESD in Heilongjiang Province and western Tibet, China (Figure 3a). The spatial distribution of ESD for ERA5-Land is very heterogeneous, with larger ESD in most of China but lower ESD in southern Xinjiang than the other products (Figure 3b). The spatial distribution of ESD for GLDAS is generally more uniform, with better performance in Fujian and Zhejiang provinces (Figure 3c). In terms of correlation, both ECV and GLDAS show a high correlation with unknown truth in most regions of China (Figure 4a,c). In contrast, ERA5-Land showed relatively low correlations in Qinghai and Shanxi provinces and regions (Figure 4b). Across China, ERA5-Land had the highest mean ESD, which was higher than ECV and GLDAS (Figure 3d). The mean correlation coefficient results with unknown true values indicated that GLDAS had the highest correlation, and ERA5-Land had the lowest (Figure 4d). In summary, GLDAS has the best overall performance in China, ECV has the second-best performance, and ERA5-Land has the worst performance.
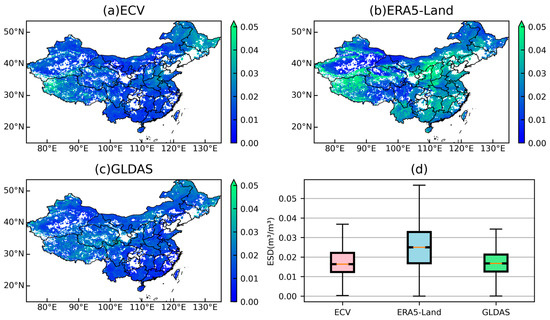
Figure 3.
Spatial distribution of (a) ECV; (b) ERA5-Land; (c) GLDAS; and box plot (d) of ESD at 0.1° based on ETC analysis.
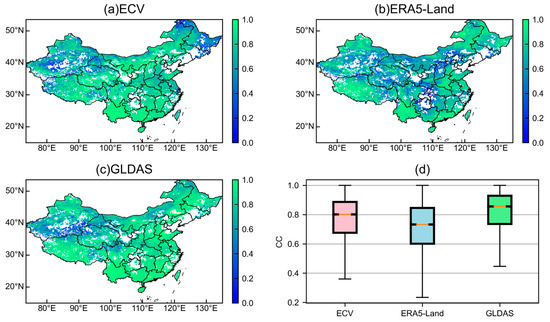
Figure 4.
Spatial distribution of (a) ECV; (b) ERA5-Land; (c) GLDAS; and box plot (d) of CC at 0.1° based on ETC analysis.
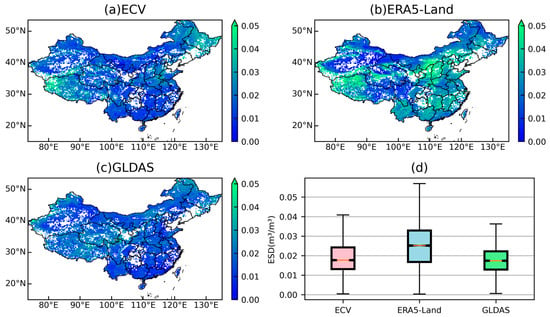
Figure 5.
Spatial distribution of (a) ECV; (b) ERA5-Land; (c) GLDAS; and box plot (d) of CC at 0.25° based on ETC analysis.
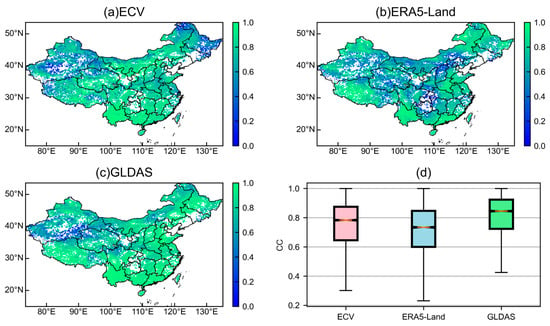
Figure 6.
Spatial distribution of (a) ECV; (b) ERA5-Land; (c) GLDAS; and box plot (d) of CC at 0.25° based on ETC analysis.
Figure 7 depicts the ETC analysis results for different land cover types, offering insights into the relative performance of the SM products across these areas. Among the forest, savanna, and cropland regions, GLDAS demonstrates the most favorable performance, exhibiting the lowest median ESD and the highest median CC. Conversely, in the grassland areas, ECV outperforms the other products, with a lower median ESD value compared to GLDAS. Across all four land cover types, ERA5-Land consistently shows the weakest performance. Notably, both ECV and GLDAS perform exceptionally well on savanna, showcasing their superior performance in this specific land cover type.
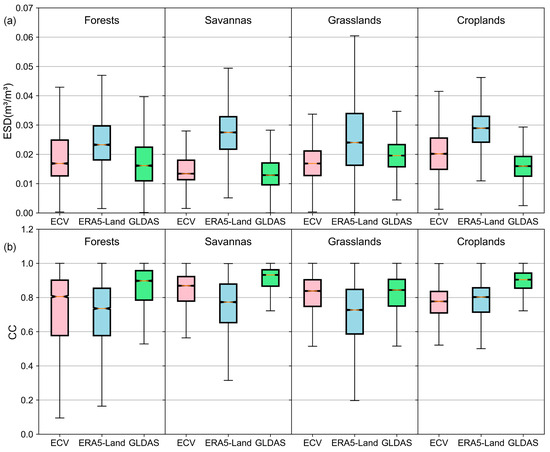
Figure 7.
Box plot of (a) ESD; and (b) CC at 0.1° based on ETC analysis on four land cover types.
3.2. In Situ Measurement-Based Evaluation
The validation results of in situ data at both spatial scales exhibit remarkable similarity. Figure 8, Figure 9, Figure 10 and Figure 11 present the validation results of the three products at a 0.1°-pixel resolution, and the results at a 0.25°-pixel resolution are shown in Figures S3–S9. Figure 8a reveals that ECV demonstrates a strong correlation with the in situ data in Ningxia and southern Gansu Province. Similarly, ERA5-Land shows a high correlation in Ningxia and Henan Province (Figure 8b). Overall, ERA5-Land exhibits the highest median R value of 0.56 with the in situ data in China, slightly outperforming the GLDAS (R = 0.45) and ECV (R = 0.44) products (Figure 8d). Regarding the median ME on the 0.1° scale (Figure 9d), GLDAS displays the lowest absolute value (0.01238 m³/m³), followed closely by ECV (0.01242 m³/m³), whereas ERA5-Land records the highest value (−0.03492 m³/m³). The median RMSE values (Figure 10d) for ECV products (0.0659 m³/m³) are slightly better than those for GLDAS (0.0672 m³/m³) and ERA5-Land (0.0751 m³/m³). Overall, the ubRMSE values (Figure 11d) for all three products are relatively similar, with ECV exhibiting the smallest median ubRMSE (0.0467 m³/m³), followed by ERA5-Land (0.0473 m³/m³) and GLDAS (0.0480 m³/m³). In summary, the ECV products demonstrate relatively good overall performance, characterized by the lowest RMSE and ubRMSE values. ERA5-Land products exhibit the highest correlation with in situ data but have a tendency towards underestimation. GLDAS displays the smallest deviation from the in situ data, and all other statistical indicators fall in the middle, indicating an average overall performance.
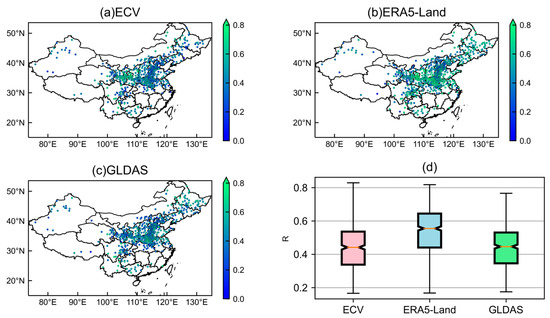
Figure 8.
Spatial distribution of (a) ECV; (b) ERA5-Land; (c) GLDAS; and box plot (d) of R-verified in situ observations on 0.1°.
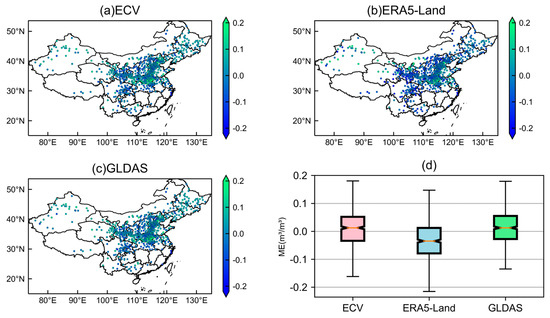
Figure 9.
Spatial distribution of (a) ECV; (b) ERA5-Land; (c) GLDAS; and box plot (d) of ME-verified in situ observations on 0.1°.
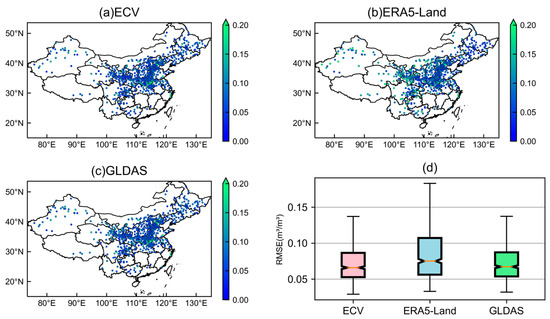
Figure 10.
Spatial distribution of (a) ECV; (b) ERA5-Land; (c) GLDAS; and box plot (d) of RMSE-verified in situ observations on 0.1°.

Figure 11.
Spatial distribution of (a) ECV; (b) ERA5-Land; (c) GLDAS; and box plot (d) of ubRMSE-verified in situ observations on 0.1°.
From the analysis of the R-values of station validation for different products on different land cover types in Figure 12a, it is found that ERA5-Land has the highest correlation with in situ data on all land cover types except grassland. On grassland, ECV has a median R-value slightly higher than GLDAS. For ME, the ERA5-Land product is the worst performer for all four land cover types, with ECV and GLDAS performing well (Figure 12b). The median RMSE is highest for ERA5-Land and slightly lower for ECV than GLDAS for all four land cover types (Figure 12c). The differences in the ubRMSE values of the three products on different land cover types are more pronounced (Figure 12d). The lowest median ubRMSE values are found on forest and savanna for ERA5-Land. The lowest median ubRMSE for ECV and the highest for GLDAS are found on grassland. And the three products perform very similarly on cropland.
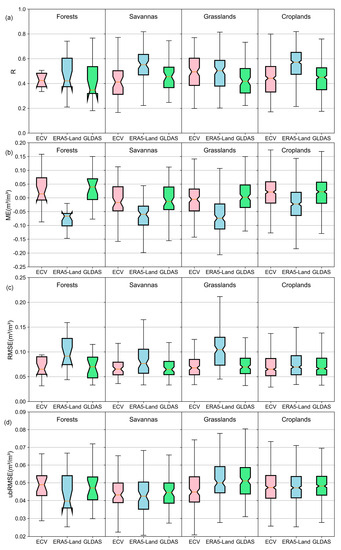
Figure 12.
Box plots of (a) R; (b) ME; (c) RMSE; and (d) ubRMSE against in situ observations on different land cover types.
3.3. Temporal Response to Precipitation and Irrigation Withdrawal
Figure 13 provides insights into the response of the three SM datasets to precipitation changes, highlighting their consistency, albeit with some lag effect. It is noteworthy that contrary to the basic theory, the in situ data consistently exhibit peak values in January of each year (Figure 13a). This could be attributed to the limited number of valid stations during this time, primarily located in southern China where SM tends to be high. Overall, the ERA5-Land product demonstrates slightly higher values compared to the other datasets, while closely resembling the temporal trend of the in situ data. The analysis of the temporal variation in SM across different land cover types in Figure 13 reveals that ECV and GLDAS exhibit highly similar trends. This may be attributed to the ECV product being scaled with the GLDAS Noah model, which consequently affects its absolute accuracy. Notably, the ERA5-Land data show significantly higher values in forest and savanna areas (Figure 13b,c), but its temporal trends align closely with the observed field data in cultivated areas. In savanna areas, ECV and GLDAS exhibit a temporal variation in SM that closely resembles the in situ data (Figure 13c). On the other hand, in grasslands (Figure 13d), the in situ data exhibit unusually high SM values in January, despite low annual precipitation. This can be attributed to the limited number of valid stations (0–5 stations) in the grasslands during this period. To investigate the impact of irrigation withdrawals on SM, the monthly changes in SM and irrigation withdrawals were analyzed specifically on cropland from January 2000 to December 2010, as depicted in Figure 14. It is evident that there is a pronounced trend of decreasing SM during the peak irrigation withdrawal period each year. This can be attributed to the increased water demand for crop growth during this period, resulting in a decline in surface SM content.
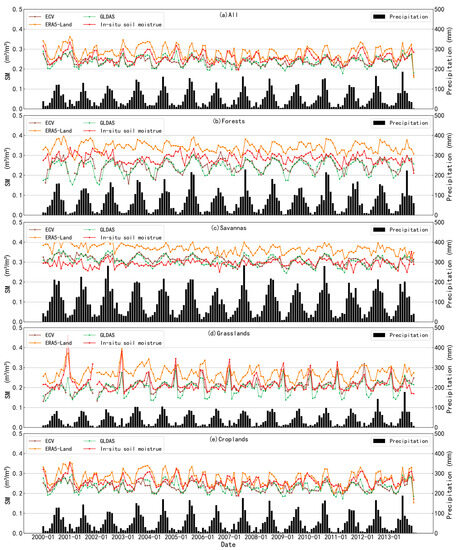
Figure 13.
Time series of station means of four SM products and precipitation data on different land cover types: (a) all; (b) forests; (c) savannas; (d) grasslands and (e) croplands.

Figure 14.
Time series of station means of four SM products and irrigation water withdrawal on cropland.
In Figure 15 and Figure 16, we present the spatial monthly ESD for different products in relation to precipitation and irrigation. Overall, ERA5-Land demonstrates interannual trends that align closely with precipitation patterns (Figure 15a). The ESD of ERA5-Land is highest during months with peak precipitation, indicating increased uncertainty in the product during periods of higher rainfall variability. This suggests that some of the forcing data used by ERA5-Land may not adequately capture the local variability in precipitation. However, in forest and savanna regions (Figure 15b,c), ERA5-Land exhibits a different performance compared to the overall findings, with lower ESD values observed. This could be attributed to the surface scheme and precipitation forcing employed in the ERA5-Land model, which effectively capture changes in vegetation cover. Furthermore, no significant association was observed between the uncertainty of ERA5-Land products and irrigation (Figure 16).

Figure 15.
Time series of ESD of three SM products and precipitation data on different land cover types: (a) all; (b) forests; (c) savannas; (d) grasslands and (e) croplands.

Figure 16.
Time series of ESD of three SM products and irrigation water withdrawal on cropland.
In Figure 17, Figure 18, Figure 19 and Figure 20, we investigate the relationship between the ME and RMSE of the different SM products analyzed in the in situ validation and the amount of precipitation and irrigation water used. From Figure 16, ECV and GLDAS exhibit a noticeable correlation between ME and precipitation. During months with higher precipitation, the ME of ECV and GLDAS tends to approach 0, indicating a closer accuracy to the observed data (Figure 17a). This suggests that the performance of these two products may be influenced by precipitation. This correlation is particularly evident in forest areas (Figure 17b). However, in the savanna region, an opposite pattern is observed (Figure 17c). Negative ME is higher during months with high precipitation, and positive ME is higher during months with low precipitation. The same relationship between the RMSE and precipitation for different SM products can be seen in Figure 19. There is also a strong relationship between ME and RMSE and irrigation water use for the different products, as can be seen in Figure 18 and Figure 20. Both ECV and GLDAS exhibit lower ME and RMSE values in months with high irrigation water withdrawals. Conversely, the ME and RMSE of ERA5-Land do not display a clear trend or correlation with precipitation and irrigation water used.
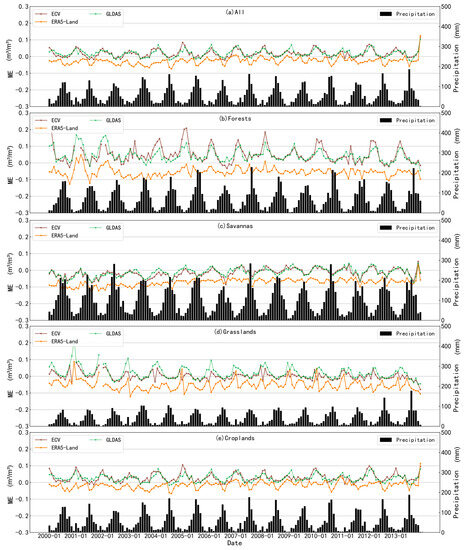
Figure 17.
Time series of ME of three SM products and precipitation data on different land cover types: (a) all; (b) forests; (c) savannas; (d) grasslands and (e) croplands.

Figure 18.
Time series of ME of three SM products and irrigation water withdrawal on cropland.
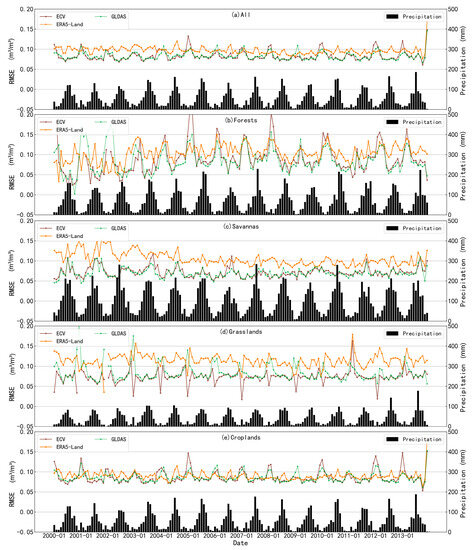
Figure 19.
Time series of RMSE of three SM products and precipitation data on different land cover types: (a) all; (b) forests; (c) savannas; (d) grasslands and (e) croplands.

Figure 20.
Time series of RMSE of three SM products and irrigation water withdrawal on cropland.
By analyzing the relationship between the error parameters of the different products and rainfall and irrigation withdrawals, it can be concluded that ECV and GLDAS have higher accuracy in months with higher rainfall and irrigation withdrawals. However, in the savanna, the performance was the opposite: the higher the precipitation and irrigation withdrawals, the lower the accuracy.
4. Discussion
In this study, we evaluated the performance of three SM products in the Chinese region using a combination of in situ validation and TC analysis. There is a significant difference between the results of in situ validation and TC analysis. Firstly, in these SM datasets, the correlation coefficients obtained from in situ validation and TC analysis differed significantly. This is mainly related to several reasons: (1) The number of valid values is different for the two methods. The number of stations is smaller, and the number of valid pixels for in situ validation is 9.6% of ETC. (2) The in situ data used in this study are monthly-scale data calculated after obtaining the data for the 8th, 18th, and 28th of each month, which do not represent the monthly average SM well. (3) There are representative errors between the point-based observations and the grid-based simulations.
In response to the results of the above evaluation, we analyzed the possible causes of these errors, which are divided into the following issues:
- (1)
- Inconsistent measurement depths: The depth at which SM is measured in situ may not align with the depth represented by the SM products. In this study, the in situ measurements were taken at a depth of 0–10 cm, whereas the ERA5-Land and GLDAS products had measurement depths of 0–7 cm and 0–10 cm, respectively. The ECV product combines multiple sensors, making it challenging to determine the exact measurement depth. These discrepancies in measurement depth can contribute to errors in the comparison and analysis of the SM data.
- (2)
- Disturbances affecting microwave observations: Various factors such as vegetation, surface temperature, surface roughness, and soil physical properties can interfere with the sensitivity of microwave observations to SM [42]. Microwave remote sensing relies on changes in the dielectric constant of the soil due to moisture content, which affects soil emissivity and reflectivity. However, disturbances caused by factors like soil organic carbon enrichment can alter the physical properties and tolerance rates of the soil, leading to errors in the retrieved SM information [43,44,45].
- (3)
- Inaccuracy of retrieval algorithms and input data: The accuracy of retrieval algorithms used in the SM products, as well as the quality of related inputs like soil temperature data, can impact the accuracy of the SM estimates. For example, GLDAS products integrate land surface model simulations and data assimilation techniques. However, the accuracy of land surface models depends on various factors such as model structure, parameter specifications, initial fields, and the quality of meteorological forcing data [46]. Moreover, land cover changes and human activities like irrigation, reservoir operations, and water transfers may not be fully captured by the model, introducing additional uncertainties.
In addition, the applicability of different types of soil moisture products varies. ECV products offer multi-source microwave remote-sensing fusion data, which have the unparalleled time expansion advantage of a single satellite-based sensor. By fusing the microwave signal data from multiple instantaneous transits, the SM data have a better representation of the daily scale time and can more effectively portray the overall state of SM in a day. ECV mainly shows the SM content at about 5 cm depth at the surface, which is suitable for surface soil moisture studies. ERA5-Land and GLDAS give reanalysis and land-surface model assimilation data, including soil moisture at multiple depths. Although this study only evaluated the surface SM data, the data were calculated by modeling, and there is a certain connection between each layer of data. Therefore, it is entirely possible to refer to the results of this study to utilize them for deep SM studies. Notably, ERA5-Land offers a heightened resolution and hourly data, rendering it conducive for meticulous analytical endeavors at a regional scale.
5. Conclusions
In this study, we conducted a comprehensive validation and evaluation of three SM products in the Chinese region, employing the ETC method alongside in situ validation. The results of our ETC analysis show that, on the whole, the GLDAS products exhibit the highest performance in China, followed by ECV, whereas ERA5-Land lags behind as the least optimal choice. However, it is important to note that ECV showcases a slightly better performance than GLDAS on grasslands, owing to its smaller ESD. The in situ validation results revealed that the ERA5-Land product exhibits a high correlation with the in situ data, albeit with noticeable deviations. This observation is further supported by the temporal response analysis, wherein ERA5-Land demonstrates the closest trend to the in situ data, although it consistently indicates higher overall SM content, particularly in forests, savannas, and grasslands. Therefore, it is more suitable for temporal trend analysis of SM, especially in the location of site distribution (i.e., central China). Comparatively, the GLDAS product outperforms the ECV product, exhibiting lower ME and RMSE values in comparison to ERA5-Land. Moreover, our investigation into the temporal response of SM products to precipitation and irrigation has uncovered a close relationship between the errors of different products and precipitation.
Through a combined analysis of in situ validation and ETC, we found that GLDAS has the highest accuracy in China, particularly excelling in savannas. It can be used to perform further SM studies in China such as SM spatial distribution or a drought index, etc. ECV gives the second most accurate results, and ERA5-Land is the worst-performing product. However, ERA5-Land offers a good online time series of monthly SM data in China, and it can be used to analyze the trend of monthly SM changes in China over a long period of time. The findings of this study hold significant implications for the future exploration and utilization of SM data in China. They contribute to a better understanding of the strengths and weaknesses of the evaluated SM products and provide valuable insights to guide their future applications as well as other research endeavors.
Supplementary Materials
The following supporting information can be downloaded at: https://www.mdpi.com/article/10.3390/atmos14091351/s1, Figures S1 and S2: Box plot of ESD and CC at 0.25° based on ETC analysis on four land cover types; Figures S3–S6: Spatial distribution of (a) ECV, (b) ERA5-Land, (c) GLDAS and box plot (d) of ME-, R-, RMSE-, and ubRMSE-verified in situ observations on 0.25°; Figures S7–S10: Box plots of ME, R, RMSE, and ubRMSE against in situ observations on different land cover types on 0.25°.
Author Contributions
Conceptualization, L.Z. and Y.L.; methodology, L.Z.; validation, L.Z.; formal analysis, L.Z.; resources, L.Z.; data curation, L.Z. and Y.L.; writing—original draft preparation, L.Z.; writing—review and editing, L.Z., Y.Y., and Y.L.; visualization, L.Z.; supervision, Y.Y. and Y.L.; project administration, Y.Y. and X.Y.; funding acquisition, Y.Y. and X.Y.; revision, L.Z. All authors have read and agreed to the published version of the manuscript.
Funding
This research was funded by the Second Tibetan Plateau Scientific Expedition and Research Program (2019QZKK09), the Special Program of Network Security and Informatization of the Chinese Academy of Sciences (CAS-WX2021SF-0106–03), the Geographic Resources and Ecology Knowledge Service System of China Knowledge Center for Engineering Sciences and Technology (CKCEST-2022–1-33), and the National Natural Science Foundation of China (42101475).
Institutional Review Board Statement
Not applicable.
Informed Consent Statement
Not applicable.
Data Availability Statement
Publicly available datasets were analyzed in this study. The ECV data can be downloaded from the website https://climate.esa.int/en/projects/soil-moisture/ (accessed on 1 July 2023). The ERA5-Land data can be downloaded from the website https://www.ecmwf.int/en/era5-land (accessed on 1 July 2023). The GLDAS data can be downloaded from the website https://disc.gsfc.nasa.gov/datasets?keywords=GLDAS (accessed on 1 July 2023). The irrigation water use data can be downloaded from the website https://zenodo.org/record/897933 (accessed on 1 July 2023). The MCD12C1 data can be downloaded from the website https://ladsweb.modaps.eosdis.nasa.gov/search/order/1/MCD12C1--61 (accessed on 1 July 2023). The MSWEP data can be downloaded from the website https://www.gloh2o.org/mswep/ (accessed on 1 July 2023).
Conflicts of Interest
The authors declare no conflict of interest.
References
- Babaeian, E.; Sadeghi, M.; Jones, S.B.; Montzka, C.; Vereecken, H.; Tuller, M. Ground, Proximal, and Satellite Remote Sensing of Soil Moisture. Rev. Geophys. 2019, 57, 530–616. [Google Scholar] [CrossRef]
- Baik, J.; Park, J.; Hao, Y.; Choi, M. Integration of multiple drought indices using a triple collocation approach. Stoch. Environ. Res. Risk Assess. 2022, 36, 1177–1195. [Google Scholar] [CrossRef]
- Zhang, R.; Li, L.; Zhang, Y.; Huang, F.; Li, J.; Liu, W.; Mao, T.; Xiong, Z.; Shangguan, W. Assessment of Agricultural Drought Using Soil Water Deficit Index Based on ERA5-Land Soil Moisture Data in Four Southern Provinces of China. Agriculture 2021, 11, 411. [Google Scholar] [CrossRef]
- Dobriyal, P.; Qureshi, A.; Badola, R.; Hussain, S.A. A review of the methods available for estimating soil moisture and its implications for water resource management. J. Hydrol. 2012, 458–459, 110–117. [Google Scholar] [CrossRef]
- Trugman, A.T.; Medvigy, D.; Mankin, J.S.; Anderegg, W.R.L. Soil Moisture Stress as a Major Driver of Carbon Cycle Uncertainty. Geophys. Res. Lett. 2018, 45, 6495–6503. [Google Scholar] [CrossRef]
- Rigden, A.J.; Mueller, N.D.; Holbrook, N.M.; Pillai, N.; Huybers, P. Combined influence of soil moisture and atmospheric evaporative demand is important for accurately predicting US maize yields. Nat. Food 2020, 1, 127–133. [Google Scholar] [CrossRef]
- Zhao, W.; Sánchez, N.; Lu, H.; Li, A. A spatial downscaling approach for the SMAP passive surface soil moisture product using random forest regression. J. Hydrol. 2018, 563, 1009–1024. [Google Scholar] [CrossRef]
- Gruber, A.; Scanlon, T.; van der Schalie, R.; Wagner, W.; Dorigo, W. Evolution of the ESA CCI Soil Moisture climate data records and their underlying merging methodology. Earth Syst. Sci. Data 2019, 11, 717–739. [Google Scholar] [CrossRef]
- Kerr, Y.H.; Waldteufel, P.; Wigneron, J.; Delwart, S.; Cabot, F.; Boutin, J.; Escorihuela, M.; Font, J.; Reul, N.; Gruhier, C.; et al. The SMOS Mission: New Tool for Monitoring Key Elements ofthe Global Water Cycle. Proc. IEEE 2010, 98, 666–687. [Google Scholar] [CrossRef]
- Chan, S.K.; Bindlish, R.; O’Neill, P.; Jackson, T.; Njoku, E.; Dunbar, S.; Chaubell, J.; Piepmeier, J.; Yueh, S.; Entekhabi, D.; et al. Development and assessment of the SMAP enhanced passive soil moisture product. Remote Sens. Environ. 2018, 204, 931–941. [Google Scholar] [CrossRef]
- Huang, C.; Li, X. A Review of Land Data Assimilation System. Remote Sens. Technol. Appl. 2004, 19, 424–430. [Google Scholar] [CrossRef]
- Rodell, M.; Houser, P.R.; Jambor, U.E.A.; Gottschalck, J.; Mitchell, K.; Meng, C.J.; Arsenault, K.; Cosgrove, B.; Radakovich, J.; Bosilovich, M.; et al. The global land data assimilation system. Bull. Am. Meteorol. Soc. 2004, 85, 381–394. [Google Scholar] [CrossRef]
- Muñoz-Sabater, J.; Dutra, E.; Agustí-Panareda, A.; Albergel, C.; Arduini, G.; Balsamo, G.; Boussetta, S.; Choulga, M.; Harrigan, S.; Hersbach, H.; et al. ERA5-Land: A state-of-the-art global reanalysis dataset for land applications. Earth Syst. Sci. Data 2021, 13, 4349–4383. [Google Scholar] [CrossRef]
- Han, S.; Liu, B.; Shi, C.; Liu, Y.; Qiu, M.; Sun, S. Evaluation of CLDAS and GLDAS Datasets for Near-Surface Air Temperature over Major Land Areas of China. Sustainability 2020, 12, 4311. [Google Scholar] [CrossRef]
- Xu, L.; Chen, N.; Zhang, X.; Moradkhani, H.; Zhang, C.; Hu, C. In-situ and triple-collocation based evaluations of eight global root zone soil moisture products. Remote Sens. Environ. 2021, 254, 112248. [Google Scholar] [CrossRef]
- Li, H.; Ye, A.; Zhang, Y.; Zhao, W. InterComparison and Evaluation of MultiSource Soil Moisture Products in China. Earth Space Sci. 2021, 8, e2021EA001845. [Google Scholar] [CrossRef]
- Chen, Y.; Yuan, H. Evaluation of nine sub-daily soil moisture model products over China using high-resolution in situ observations. J. Hydrol. 2020, 588, 125054. [Google Scholar] [CrossRef]
- Ford, T.W.; Quiring, S.M.; Zhao, C.; Leasor, Z.T.; Landry, C. Triple Collocation Evaluation of In Situ Soil Moisture Observations from 1200+ Stations as part of the U.S. National Soil Moisture Network. J. Hydrometeorol. 2020, 21, 2537–2549. [Google Scholar] [CrossRef]
- Lal, P.; Singh, G.; Das, N.N.; Colliander, A.; Entekhabi, D. Assessment of ERA5-Land Volumetric Soil Water Layer Product Using In Situ and SMAP Soil Moisture Observations. IEEE Geosci. Remote Sens. Lett. 2022, 19, 1–5. [Google Scholar] [CrossRef]
- Ling, X.; Huang, Y.; Guo, W.; Wang, Y.; Chen, C.; Qiu, B.; Ge, J.; Qin, K.; Xue, Y.; Peng, J. Comprehensive evaluation of satellite-based and reanalysis soil moisture products using in situ observations over China. Hydrol. Earth Syst. Sci. 2021, 25, 4209–4229. [Google Scholar] [CrossRef]
- Zeng, J.; Li, Z.; Chen, Q.; Bi, H.; Qiu, J.; Zou, P. Evaluation of remotely sensed and reanalysis soil moisture products over the Tibetan Plateau using in-situ observations. Remote Sens. Environ. 2015, 163, 91–110. [Google Scholar] [CrossRef]
- Ma, H.; Zeng, J.; Chen, N.; Zhang, X.; Cosh, M.H.; Wang, W. Satellite surface soil moisture from SMAP, SMOS, AMSR2 and ESA CCI: A comprehensive assessment using global ground-based observations. Remote Sens. Environ. 2019, 231, 111215. [Google Scholar] [CrossRef]
- Yang, S.; Li, R.; Wu, T.; Hu, G.; Xiao, Y.; Du, Y.; Zhu, X.; Ni, J.; Ma, J.; Zhang, Y.; et al. Evaluation of reanalysis soil temperature and soil moisture products in permafrost regions on the Qinghai-Tibetan Plateau. Geoderma 2020, 377, 114583. [Google Scholar] [CrossRef]
- Araki, R.; Mu, Y.; McMillan, H. Evaluation of GLDAS soil moisture seasonality in arid climates. Hydrol. Sci. J. 2023, 68, 1109–1126. [Google Scholar] [CrossRef]
- Stoffelen, A. Toward the true near-surface wind speed: Error modeling and calibration using triple collocation. J. Geophys. Res. 1998, 103, 7755–7766. [Google Scholar] [CrossRef]
- Gruber, A.; Su, C.H.; Zwieback, S.; Crow, W.; Dorigo, W.; Wagner, W. Recent advances in (soil moisture) triple collocation analysis. Int. J. Appl. Earth Obs. 2016, 45, 200–211. [Google Scholar] [CrossRef]
- Gruber, A.; Su, C.H.; Crow, W.T.; Zwieback, S.; Dorigo, W.A.; Wagner, W. Estimating error cross-correlations in soil moisture data sets using extended collocation analysis. J. Geophys. Res. Atmos. 2016, 121, 1208–1219. [Google Scholar] [CrossRef]
- Hu, F.; Wei, Z.; Yang, X.; Xie, W.; Li, Y.; Cui, C.; Yang, B.; Tao, C.; Zhang, W.; Meng, L. Assessment of SMAP and SMOS soil moisture products using triple collocation method over Inner Mongolia. J. Hydrol. Reg. Stud. 2022, 40, 101027. [Google Scholar] [CrossRef]
- McColl, K.A.; Vogelzang, J.; Konings, A.G.; Entekhabi, D.; Piles, M.; Stoffelen, A. Extended triple collocation: Estimating errors and correlation coefficients with respect to an unknown target. Geophys. Res. Lett. 2014, 41, 6229–6236. [Google Scholar] [CrossRef]
- Jia, Y.; Li, C.; Yang, H.; Yang, W.; Liu, Z. Assessments of three evapotranspiration products over China using extended triple collocation and water balance methods. J. Hydrol. 2022, 614, 128594. [Google Scholar] [CrossRef]
- Ming, W.; Ji, X.; Zhang, M.; Li, Y.; Liu, C.; Wang, Y.; Li, J. A Hybrid Triple Collocation-Deep Learning Approach for Improving Soil Moisture Estimation from Satellite and Model-Based Data. Remote Sens. 2022, 14, 1744. [Google Scholar] [CrossRef]
- Qiao, D.; Li, Z.; Zeng, J.; Liang, S.; McColl, K.A.; Bi, H.; Zhou, J.; Zhang, P. Uncertainty Characterization of Ground-Based, Satellite, and Reanalysis Snow Depth Products Using Extended Triple Collocation. Water Resour. Res. 2022, 58, e2021WR030895. [Google Scholar] [CrossRef]
- An, R.; Zhang, L.; Wang, Z.; Quaye-Ballard, J.A.; You, J.; Shen, X.; Gao, W.; Huang, L.; Zhao, Y.; Ke, Z. Validation of the ESA CCI soil moisture product in China. Int. J. Appl. Earth Obs. 2016, 48, 28–36. [Google Scholar] [CrossRef]
- Su, Z.; de Rosnay, P.; Wen, J.; Wang, L.; Zeng, Y. Evaluation of ECMWF’s soil moisture analyses using observations on the Tibetan Plateau. J. Geophys. Res. Atmos. 2013, 118, 5304–5318. [Google Scholar] [CrossRef]
- Dorigo, W.A.; Gruber, A.; De Jeu, R.A.M.; Wagner, W.; Stacke, T.; Loew, A.; Albergel, C.; Brocca, L.; Chung, D.; Parinussa, R.M.; et al. Evaluation of the ESA CCI soil moisture product using ground-based observations. Remote Sens. Environ. 2015, 162, 380–395. [Google Scholar] [CrossRef]
- Dorigo, W.; Wagner, W.; Albergel, C.; Albrecht, F.; Balsamo, G.; Brocca, L.; Chung, D.; Ertl, M.; Forkel, M.; Gruber, A.; et al. ESA CCI Soil Moisture for improved Earth system understanding: State-of-the art and future directions. Remote Sens. Environ. 2017, 203, 185–215. [Google Scholar] [CrossRef]
- Wu, Z.; Feng, H.; He, H.; Zhou, J.; Zhang, Y. Evaluation of Soil Moisture Climatology and Anomaly Components Derived from ERA5-Land and GLDAS-2.1 in China. Water Resour. Manag. 2021, 35, 629–643. [Google Scholar] [CrossRef]
- Wang, A.; Shi, X. A Multilayer Soil Moisture Dataset Based on the Gravimetric Method in China and Its Characteristics. J. Hydrometeorol. 2019, 20, 1721–1736. [Google Scholar] [CrossRef]
- Beck, H.E.; Wood, E.F.; Pan, M.; Fisher, C.K.; Miralles, D.G.; Van Dijk, A.I.; McVicar, T.R.; Adler, R.F. MSWEP V2 Global 3-Hourly 0.1° Precipitation: Methodology and Quantitative Assessment. Bull. Am. Meteorol. Soc. 2019, 100, 473–500. [Google Scholar] [CrossRef]
- Friedl, M.A.; Sulla-Menashe, D.; Tan, B.; Schneider, A.; Ramankutty, N.; Sibley, A.; Huang, X. MODIS Collection 5 global land cover: Algorithm refinements and characterization of new datasets. Remote Sens. Environ. 2010, 114, 168–182. [Google Scholar] [CrossRef]
- Huang, Z.; Hejazi, M.; Li, X.; Tang, Q.; Vernon, C.; Leng, G.; Liu, Y.; Döll, P.; Eisner, S.; Gerten, D.; et al. Reconstruction of global gridded monthly sectoral water withdrawals for 1971–2010 and analysis of their spatiotemporal patterns. Hydrol. Earth Syst. Sci. 2018, 22, 2117–2133. [Google Scholar] [CrossRef]
- Pacheco, A.; McNairn, H.; Mahmoodi, A.; Champagne, C.; Kerr, Y.H. The Impact of National Land Cover and Soils Data on SMOS Soil Moisture Retrieval Over Canadian Agricultural Landscapes. IEEE J. Sel. Top. Appl. Earth Obs. Remote Sens. 2015, 8, 5281–5293. [Google Scholar] [CrossRef]
- Loew, A. Impact of surface heterogeneity on surface soil moisture retrievals from passive microwave data at the regional scale: The Upper Danube case. Remote Sens. Environ. 2008, 112, 231–248. [Google Scholar] [CrossRef]
- Zeng, J.; Chen, K.; Cui, C.; Bai, X. A Physically Based Soil Moisture Index From Passive Microwave Brightness Temperatures for Soil Moisture Variation Monitoring. IEEE Trans. Geosci. Remote Sens. 2020, 58, 2782–2795. [Google Scholar] [CrossRef]
- Zeng, J.; Shi, P.; Chen, K.; Ma, H.; Bi, H.; Cui, C. Assessment and Error Analysis of Satellite Soil Moisture Products over the Third Pole. IEEE Trans. Geosci. Remote Sens. 2022, 60, 1–18. [Google Scholar] [CrossRef]
- Chen, Y.; Yang, K.; Qin, J.; Zhao, L.; Tang, W.; Han, M. Evaluation of AMSR-E retrievals and GLDAS simulations against observations of a soil moisture network on the central Tibetan Plateau. J. Geophys. Res. Atmos. 2013, 118, 4466–4475. [Google Scholar] [CrossRef]
Disclaimer/Publisher’s Note: The statements, opinions and data contained in all publications are solely those of the individual author(s) and contributor(s) and not of MDPI and/or the editor(s). MDPI and/or the editor(s) disclaim responsibility for any injury to people or property resulting from any ideas, methods, instructions or products referred to in the content. |
© 2023 by the authors. Licensee MDPI, Basel, Switzerland. This article is an open access article distributed under the terms and conditions of the Creative Commons Attribution (CC BY) license (https://creativecommons.org/licenses/by/4.0/).