Article

Measurement of Long-Term CH4 Emissions and Emission Factors from Beef Feedlots in Australia

1
Faculty of Science, The University of Melbourne, Melbourne, VIC 3010, Australia
2
Agriculture and Agri-Food Canada, Lethbridge Research and Development Centre, Lethbridge, AB T1J 4B1, Canada
3
Ternes Scientific, Upwey, VIC 3158, Australia
4
Department of Earth and Atmospheric Sciences, University of Alberta, Edmonton, AB T6G 2E3, Canada
5
Centre for Atmospheric Chemistry, University of Wollongong, North Wollongong, NSW 2522, Australia
6
Meat and Livestock Australia, Sydney, NSW 2059, Australia
*
Author to whom correspondence should be addressed.
Atmosphere 2023, 14(9), 1352; https://doi.org/10.3390/atmos14091352
Submission received: 1 July 2023 / Revised: 25 August 2023 / Accepted: 26 August 2023 / Published: 28 August 2023
(This article belongs to the Section Air Quality)

Abstract

:
One of the major challenges for the Australian feedlot and meat sectors is to have accurate and robust long-term greenhouse gas (GHG) emissions data. Long-term measurements of methane (CH4) emissions (2015–2017) were made at two Australian beef feedlots having different climates, cattle types, and management practices. Emissions were measured using the inverse-dispersion model (IDM) micrometeorological technique, using CH4 concentrations measured at the feedlots with a closed-path Fourier transform infrared spectroscopic technique (CP-FTIR). The emissions data were used to evaluate methods used by the Department of Climate Change, Energy, the Environment and Water to estimate CH4 emissions from feedlots in Australian national inventory calculations. Expressed as a CH4 yield (emissions per unit dry matter intake, DMI), the two feedlots had emissions of 13.1 and 18.9 g CH4 kg−1 DMI. The lower-emitting feedlot had emissions that were 30% lower than the national inventory calculations based on feed intakes, while the second feedlot had emissions that were similar to the inventory calculations. The accurate quantification of emissions from feedlots, as demonstrated as part of this study, is important for validating the national accounting methods and therefore the sector’s GHG emissions profile.

1. Introduction

The latest Australian national cattle feedlot survey data [Australian Lot Feeders’ Association (ALFA) and Meat & Livestock Australia (MLA), September 2022] recorded more than 1 million beef cattle on feed in Australian feedlots. The sector is highly efficient in the conversion of feed to high-value protein but there are concerns that large feedlots, which house many thousands of animals, act as hot spots for greenhouse gas (GHG) emissions. Despite this, the feedlot sector in Australia is estimated to be responsible for 2.5 Mt carbon dioxide equivalent (CO2 eq), or only 4.5% of emissions, from the total red meat sector in Australia. The research reported in this short paper provides the first long-term emissions data set for the Australian feedlot industry and allows a re-evaluation of the approaches taken by the Australian National Inventory to estimate GHG emissions from the sector.
Livestock industries contribute about 15% of global GHG emissions. In 2019, it was reported that global CH4 emissions from livestock have increased by a factor of four in the last 130 years, mainly as a result of increased emissions from South Asia, tropical Africa, and Brazil [1]. Feedlots are sources of GHGs due to emissions of methane (CH4) from enteric fermentation [2], CH4 emissions from anaerobiosis in manure stockpiles, and nitrous oxide (N2O) emissions from manure management systems. Ammonia emissions are a significant source of indirect GHGs. Enteric and manure CH4 is believed to be the largest feedlot GHG source, accounting for 63% of the feedlot GHG emissions in Canada [3] and over 70% in Australia [4]. Methane emissions also represent an energy loss from the rumen fermentation process, and thus the reduction of CH4 emissions is not only an important goal of the feedlot industry [3,5] but also contributes to climate mitigation [6]. Recently, the Australian Government signed the State commitment of Global Methane Pledge to collectively reduce global CH4 emissions across the energy and resources, agriculture, and waste sectors. Furthermore, MLA has committed to supporting the red meat industry to become carbon neutral by 2030 [7]. To achieve a pathway to these commitments, both long-term measurement of GHG emissions from feedlots as well as a review of the approaches used by the Australian National Inventory to estimate feedlot emissions are required.
The Australian national inventory methodology for estimating feedlot emissions is based on the Moe and Tyrrell equation [8], which uses the relationship between CH4 production, feed intake, and diet composition. The IPCC method (Tier 2), described in 2006 and refined in 2019 [9,10], estimates feedlot emissions based on the known cattle feed intake values. These approaches provide the basis for the inventory models used in Australia. They also provide baseline estimates used to examine potential management strategies and assess new abatement technologies to reduce the GHG footprint of production and drive long-term sustainability outcomes [5,11].
Previous work has yielded considerable information on CH4 emissions from Australian feedlots [12,13]. Research by our group and others between 2006 and 2015 provided a large feedlot emission data set [14,15,16]. However, the majority of these data were collected over short-duration measurement campaigns (<2 months) using micrometeorological techniques based on open-path laser and FTIR spectroscopic concentration measurements [13,17]. In addition, Velazco et al. [18] deployed the Greenfeed techniques to measure CH4 emissions from a herd of feedlot cattle fed with nitrate and urea supplements over 2 weeks. The problem with these studies is that the emission liabilities are calculated over short periods of time and measured over limited feedlot areas (the measurement footprint is small), with little account for variables such as changes in the number of cattle on feed, ration variability, and regional meteorological effects. Long-term measurements (>6 months) are difficult to undertake but they provide accurate data series that can be interrogated to understand the impact of these factors, such as cattle numbers, rations, and local meteorological conditions.
Methane emissions from cattle feedlots include enteric emissions originating directly from the cattle and emissions from their deposited manure. Manure management at feedlots involves periodically scraping the manure accumulated on pad surfaces for stockpiling (with or without composting) before land application as fertilizer [19]. According to IPCC [9], CH4 emissions from manure management are relatively low compared to enteric emissions, and Bai et al. [13] showed that emissions from an Australian feedlot were dominated by pen emissions, with a minority coming from manure treatment areas and from runoff ponds. Methane emissions from pen manure were as low at approximately 3–4% of total livestock emissions, as reported by Redding et al. [20].
The objectives of this study were to: (1) quantify long-term CH4 emissions from two feedlots (focusing on pen emissions) which represent southern and northern Australian conditions; (2) compare the difference in CH4 emissions between the two feedlots; and (3) calculate CH4 emission factors and compare those with estimates used by national inventory methods.

2. Materials and Methods

2.1. Experimental Sites

2.1.1. Southern Feedlot Site (Victoria)

The southern site was a commercial feedlot 220 km northwest of Melbourne, Victoria. The terrain around the feedlot is typical of the eastern Wimmera region—flat topography, with dry bare soil in summer and crops growing in winter. The climatological average minimum and maximum air temperatures were 8.4 and 21.9 °C, respectively (Bureau of Meteorology, BOM, station ID 080128). Rainfall during the study was 553 mm in 2016, which was much higher than the average annual rate of 431 mm (BOM, station ID 080128). The feedlot is isolated and not impacted by other nearby sources of CH4, as demonstrated by atmospheric sampling surveys reported by Hacker et al. [21]. The main CH4 source areas included cattle pens (23.7 ha), a manure stockpile area (20 ha), and run-off ponds (0.3 ha) (Figure 1). The manure stockpile area consisted of mixed processed manure (with old (cured) and fresh manure), compost windrows, and stabilized sorted compost piles. As mentioned previously, emissions from manure processing areas are small compared to cattle enteric emissions, and therefore manure emissions were not measured in the study.
The average capacity of the feedlot was 16,200 heads over the period 2015–2017, with about 230,400 cattle being finished during the period of the experiment. The major cattle breeds were Angus and Angus crossbreeds (1–1.5 years of age) with an average live weight of 380 kg at entry. The cattle were fed a finishing diet of barley and silage (over 70–100 day finishing cycles), consuming a daily average of 10.6 kg dry matter (DM) per head (Table 1). The daily feeding time was twice a day (09:00 and 16:00). The average production and feed information from the feedlot are given in Table 1 and Table 2.

2.1.2. Northern Feedlot Site (Queensland)

The northern site was a commercial feedlot located in the Darling Downs region of Queensland, 200 km west-northwest of Brisbane. The terrain was relatively flat, and the feedlot was surrounded by cropland (Figure 1). There were no other large CH4 sources nearby. The climatological average minimum and maximum air temperatures were 11.9 and 26.2 °C, respectively, with an average annual rainfall of 676.4 mm (BOM, station ID 041522). The average capacity of the feedlot was ~16,500 heads during this study, with cattle having an average live weight of 483 kg at entry. The animals at this feedlot were custom-fed for 13 different clients. The site managed two major breeds: Angus, long fed for 240–260 days, and Brahman cross cattle, short fed for 10–100 days. All pens received the first feeding between 9:00 and 11:00 and a second feeding before 16:30. The average daily feed intake during the study (ration-dependent) was 11.4 kg DM per head. The average production and feed information from the feedlot are given in Table 1 and Table 2.
Cattle manure is stockpiled in pens and after the closing out of each lot, the manure is removed and applied directly to nearby cropping land owned by the feedlot. No dedicated manure stockpiles are located at this feedlot.

2.2. Methodologies and Instrumentation

2.2.1. Concentration-Profile Inverse-Dispersion Modelling

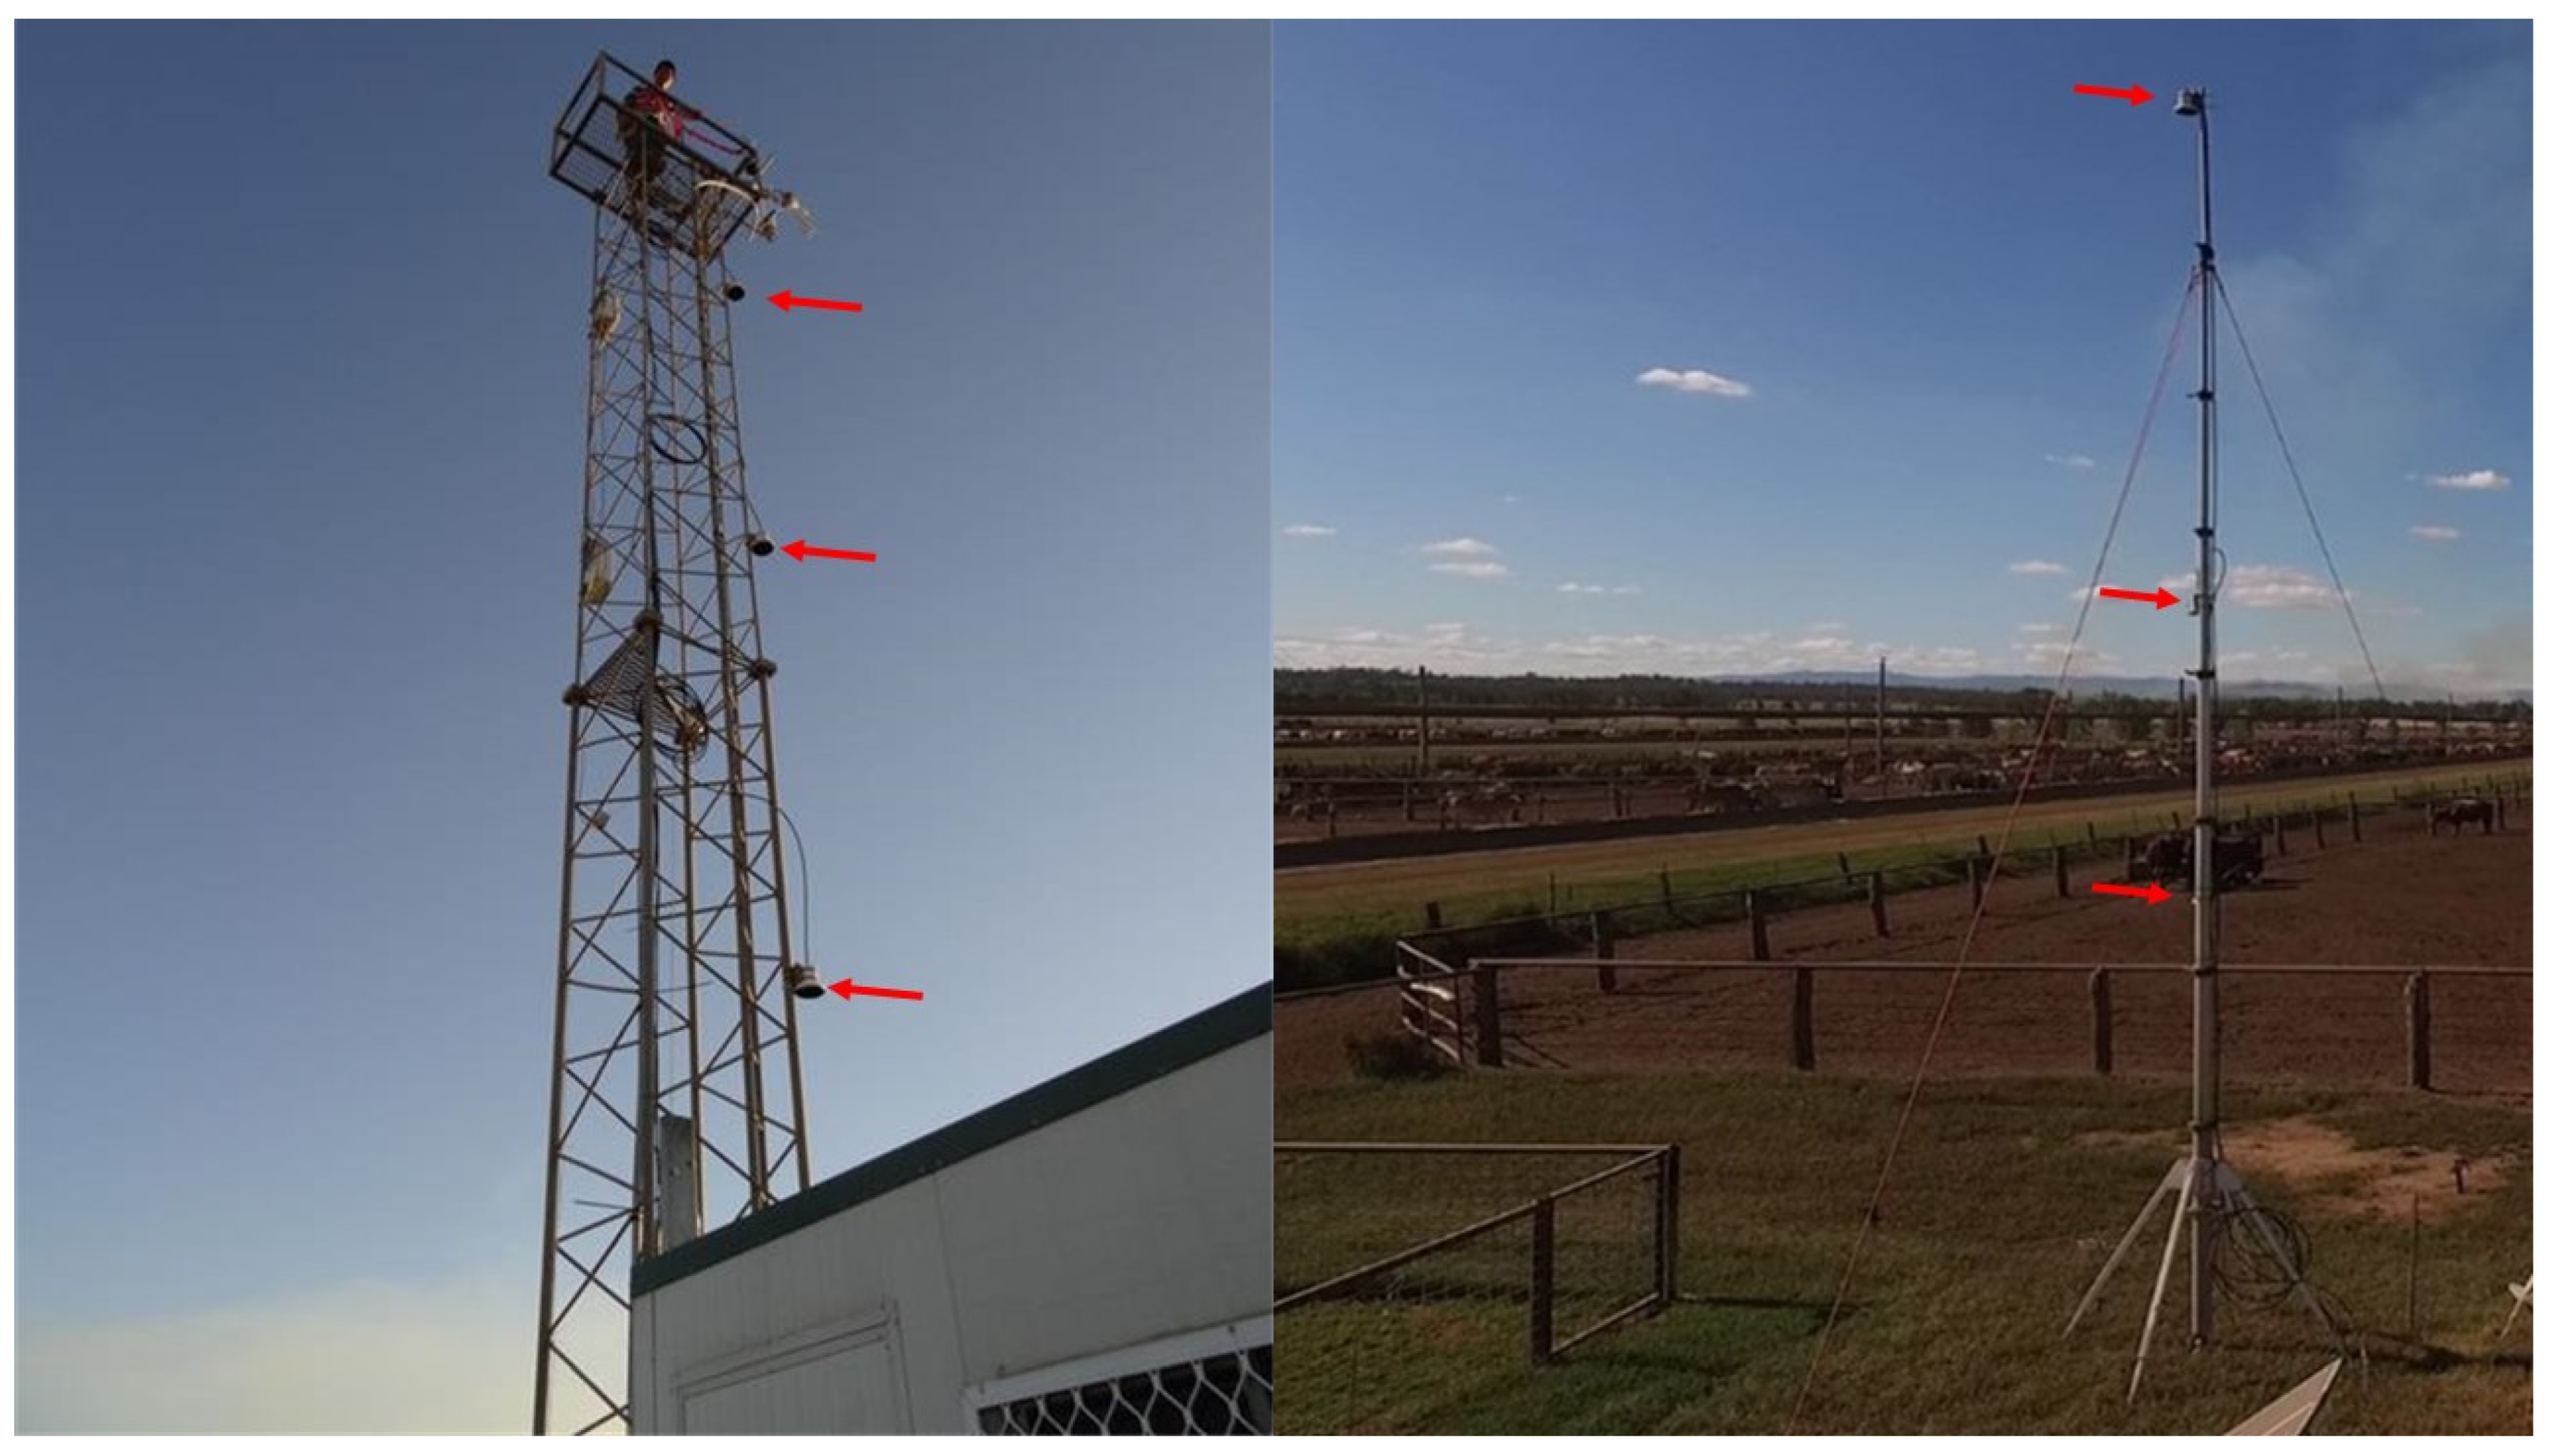
An inverse-dispersion modelling (IDM) measurement technique is used to measure CH4 emissions. This is a flexible technique that calculates emissions from the increased CH4 concentration measured above or downwind of the feedlot, and from local micrometeorological conditions [22]. There is great freedom to choose the measurement locations. In this study, concentrations were measured near-continuously at three heights within (northern site) or adjacent to (southern site) the feedlot (Figure 2). This “vertical-gradient” IDM approach was used by Flesch et al. [23] to calculate soil gas fluxes from spatially limited plots, but is a departure from previous IDM feedlot studies that have used upwind and downwind concentration measurements (“horizontal gradient”). The advantage of the vertical gradient approach is that it better fits our equipment situation, where a single gas analyzer was available to measure CH4 concentration at several heights on a tower. A disadvantage is that vertical concentration differences (over measurable heights) can be smaller than upwind-downwind differences, requiring a more sensitive analyzer.
Methane concentrations were measured with a low-resolution (1 cm−1) closed-path Fourier transform infrared (CP-FTIR) trace gas analyzer (Spectronus, Ecotech Australia) [24]. The CP-FTIR was housed in an air-conditioned hut (Figure 2), and the concentration was measured at three heights above ground at each feedlot. Air was continually drawn from three filtered air inlets placed at heights of 7, 11, and 13 m above ground for the southern feedlot and 3, 5, and 8.5 m at the northern feedlot (Figure 2). A 20 L buffer volume on each line dampened short-term fluctuations and allowed the CP-FTIR to sample from each of these three volumes in succession to obtain a complete average concentration profile every 30 min. Every 10 min, the CP-FTIR initiated a sampling protocol for one inlet which involved flushing and purging the internal sample lines and the sample measurement cell with gas from the new inlet. The sample cell was then evacuated and re-filled at 1 SLPM to 950 hPa. After settling time, the CP-FTIR’s broadband infrared source and detector collected spectral information of the air within the sample cell for a 3 min interval before purging and flushing in preparation for the next measurement period. Gas concentrations were obtained through on-board spectral analysis of collected samples. All collected spectra were stored in a database within the CP-FTIR’s internal computer and data were uploaded daily to a remote server backup. All data that were retrieved and analyzed were based on the best-fitted spectrum using MALT (Multiple-Atmospheric Layer Transmission) [25] and the absorption line database HITRAN (High-resolution Transmission Molecular Absorption) [26], as detailed in [24]. Laboratory calibration of the instrument was performed at the University of Wollongong’s laboratory using SI-traceable gas standards before and after each campaign. A 10L tank was also analyzed at this time and then served as a standard for regular (daily) calibration checks of the CP-FTIR during the field campaigns. Quality control of collected spectra was performed with the cooperation of the University of Wollongong and a post-trial calibration was performed to correct for small drifts over the period of study and to generate an adjusted, quality-checked dataset containing 30-min average concentrations for CH4. Very little drift was noted over many months of continuous measurement. The accuracy of the CH4 measurements was conservatively assessed at 2–4 ppb based on the analyzer specifications [24] and field measurements during times of low variability in the atmospheric measurements.
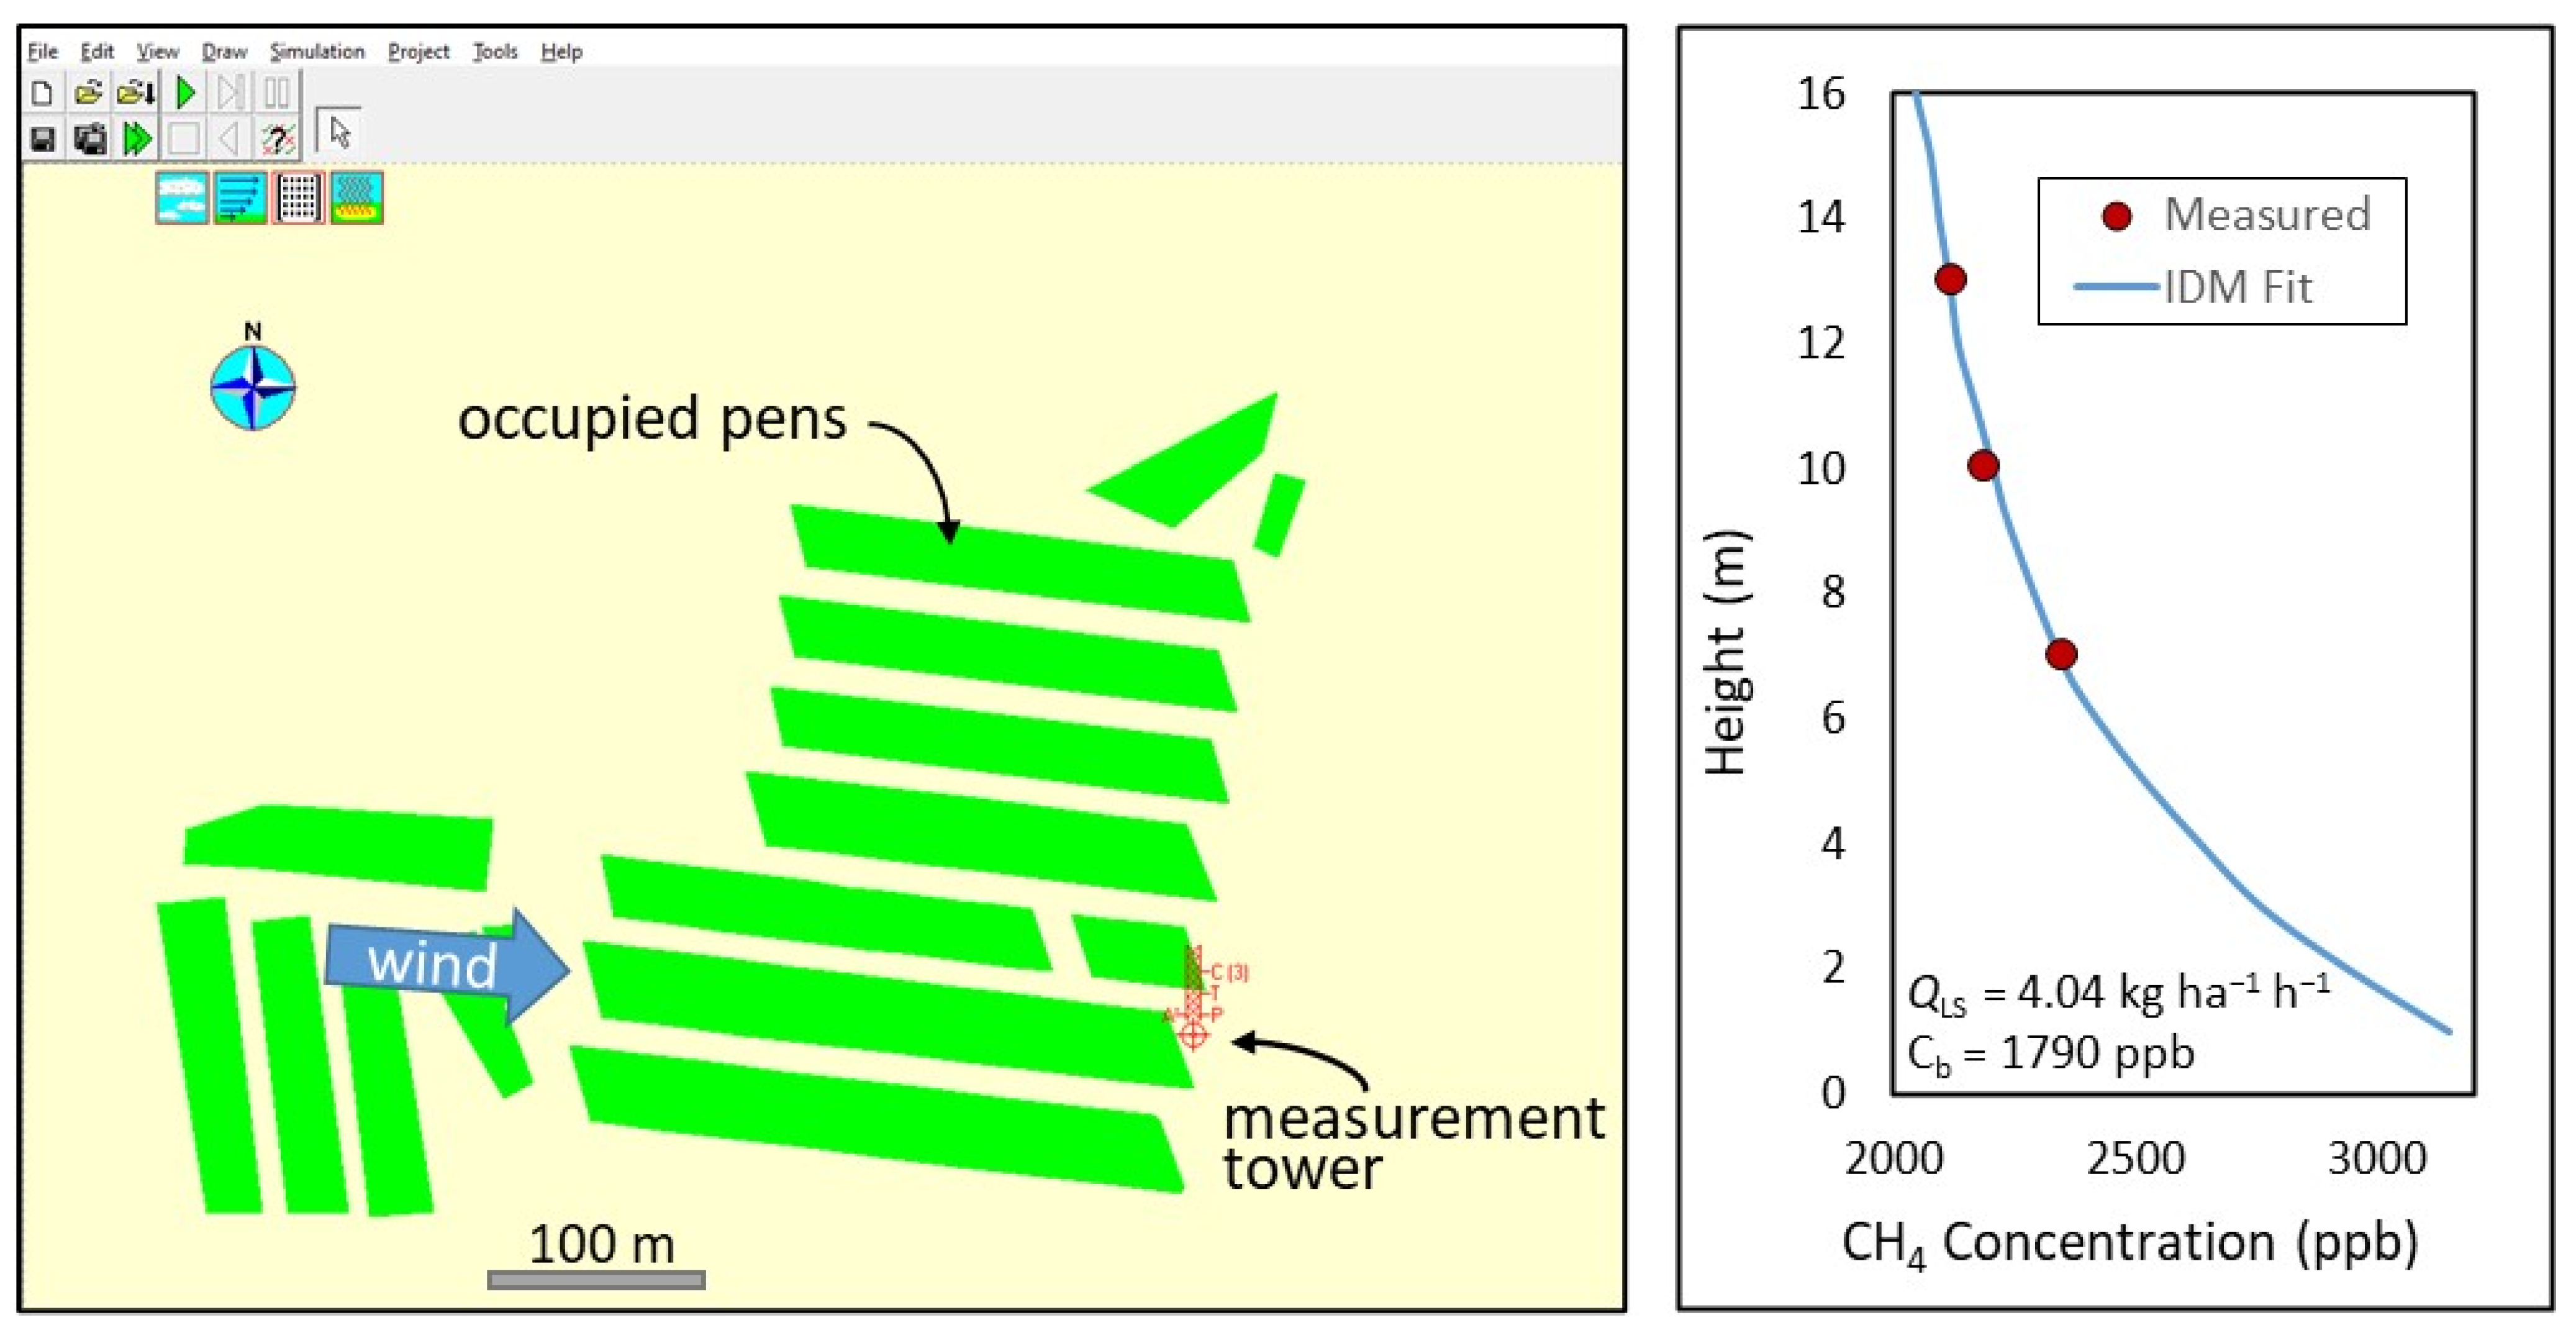
The software “WindTrax” (www.thunderbeachscientific.com (accessed on 5 January 2018)) is used for the IDM calculations of the feedlot emission rate Q. The calculations start with the creation of feedlot maps, where occupied cattle pens are outlined and defined as CH4 area sources. The maps include the location of the concentration measurements (Figure 3). For each 30 min observation, the average CH4 concentration at the three heights (Ci, i = 1, 2, 3) and wind information (friction velocity u*, Obukhov stability length L, the inferred surface roughness length z0, wind direction β, and velocity standard deviations σu,v,w) are input into WindTrax. A Lagrangian stochastic (LS) dispersion model [22] then calculates the theoretical concentrations, minus the atmospheric background concentration Cb, at the three measurement heights ((CiCb)/Q)model for the given wind conditions and source configuration. The result is a three-equation set:
( C i C b Q ) m o d e l Q L S = ( C i   -   C b ) ,
used to get a best-fit solution for the pen emission rate QLS and the ambient background gas concentration Cb. The statistical fit is calculated using the singular value decomposition technique [27]. Figure 3 shows a WindTrax fit for an example set of concentration measurements. Our interest is the emission rate QLS, and the calculated Cb is used only as a diagnostic of the quality of the QLS fit (see below).
Many IDM studies use threshold values for u*, L, z0, etc., to remove periods when the dispersion model calculations are error-prone [23], or the inferred emissions are likely to be unrepresentative of the source average. In this study, we accept QLS estimates meeting the following criteria:
  • u* ≥ 0.1 m s−1. This removes error-prone light wind periods from the analysis. It is common in IDM to remove data when u* falls below a threshold value, and previous studies have used thresholds ranging from 0.05 to 0.20 m s−1.
  • Inferred background concentration: 1.50 ≤ Cb ≤ = 2.10 ppm for CH4. A best-fit Cb outside these realistic ranges indicates the WindTrax model has produced an unrealistic fit to the Ci profile, possibly due to Ci errors, or due to non-ideal wind conditions (e.g., non-stationary winds) or WindTrax errors.
  • Percentage of the LS model trajectories that intersected the cattle pen area (touchdown coverage) ≥ 5% of the feedlot pen area. The touchdown coverage is calculated in WindTrax and provides an estimate of the feedlot area contributing to Ci (the measurement “footprint”). This criterion removes periods where QLS is calculated from a small area of the feedlot.
We did not filter on stratification, surface roughness, or wind direction.
At both feedlots, a three-dimensional sonic anemometer (3-D sonic, CSAT−3, Campbell Scientific, Logan, UT, USA) was used to characterize the wind conditions. The anemometer was mounted 13.5 m above the ground at the southern site (on top of the CH4 sampling tower) and 8.5 m above the ground at the northern site (on a tower ~1 m away from the CH4 sampling tower). Wind measurements were recorded at a frequency of 10 Hz and stored on a datalogger (CR-3000, Campbell Scientific, Logan, UT, USA). Concentration and wind statistics were calculated over 30 min intervals using the SAS program (9.4, SAS Inc., Cary, NC, USA), and the 30 min statistics were used for the emission calculations.

2.2.2. Calculating Daily Emissions Rates

Our measurement data set consists of a discontinuous time series of 30 min average emission rates from the occupied cattle pens. Data gaps occur because of IDM data quality filtering, or equipment downtime. The 30 min data were used to estimate daily emissions in our analysis. To minimize the potential for time-of-day bias in our calculations caused by irregular emission sampling combined with an underlying diel (diurnal) cycle in cattle emissions, our 30 min data were grouped into 4 or 6 h time bins over the course of the day, and daily emissions were calculated from the sum of the bin averages. Only days having measurements in all time bins were used in our analysis.

2.2.3. Animal Modeling

Animal performance data were used to estimate emissions of CH4 using the approaches outlined in the Australian National Inventory [28]. The Australian National Inventory assessment uses the Moe and Tyrrell [8] equation as the basis for the estimation of CH4 emissions from beef feedlot cattle based on feed intake, with feed intake values estimated using simplified IPCC [9] procedures (Tier 2). It should be recognized that the Moe and Tyrrell equation was developed using enteric emissions from dairy cattle and the bio-conversion of various carbohydrate fractions to CH4. The emission estimates from the National Inventory models were adjusted for actual DM intakes measured on a daily basis (group intake) using IPCC methods. Methane emissions from manure were calculated based on the volatile solids (VS) entering the manure management system (MMS) and default IPCC methane conversion factors (MCF). An integrated methane conversion factor (iMCF) was calculated taking into account the proportion of manure managed in each system, the MCF of each system, and VS losses from earlier stages in the MMS. A default VS excretion rate for Oceania was reported in IPCC [10]. Methane emission factors (EFs) have been further disaggregated in 2019 to enable different factors to be used for the different MMS. The 2019 Refinement to the 2006 IPCC Guidelines for National Greenhouse Gas Inventories [10] informed improvements to Australia’s country-specific estimation.

3. Results and Discussion

3.1. CH4 Emissions (g head−1 day−1) and CH4 Yield (g CH4 kg−1 DMI)

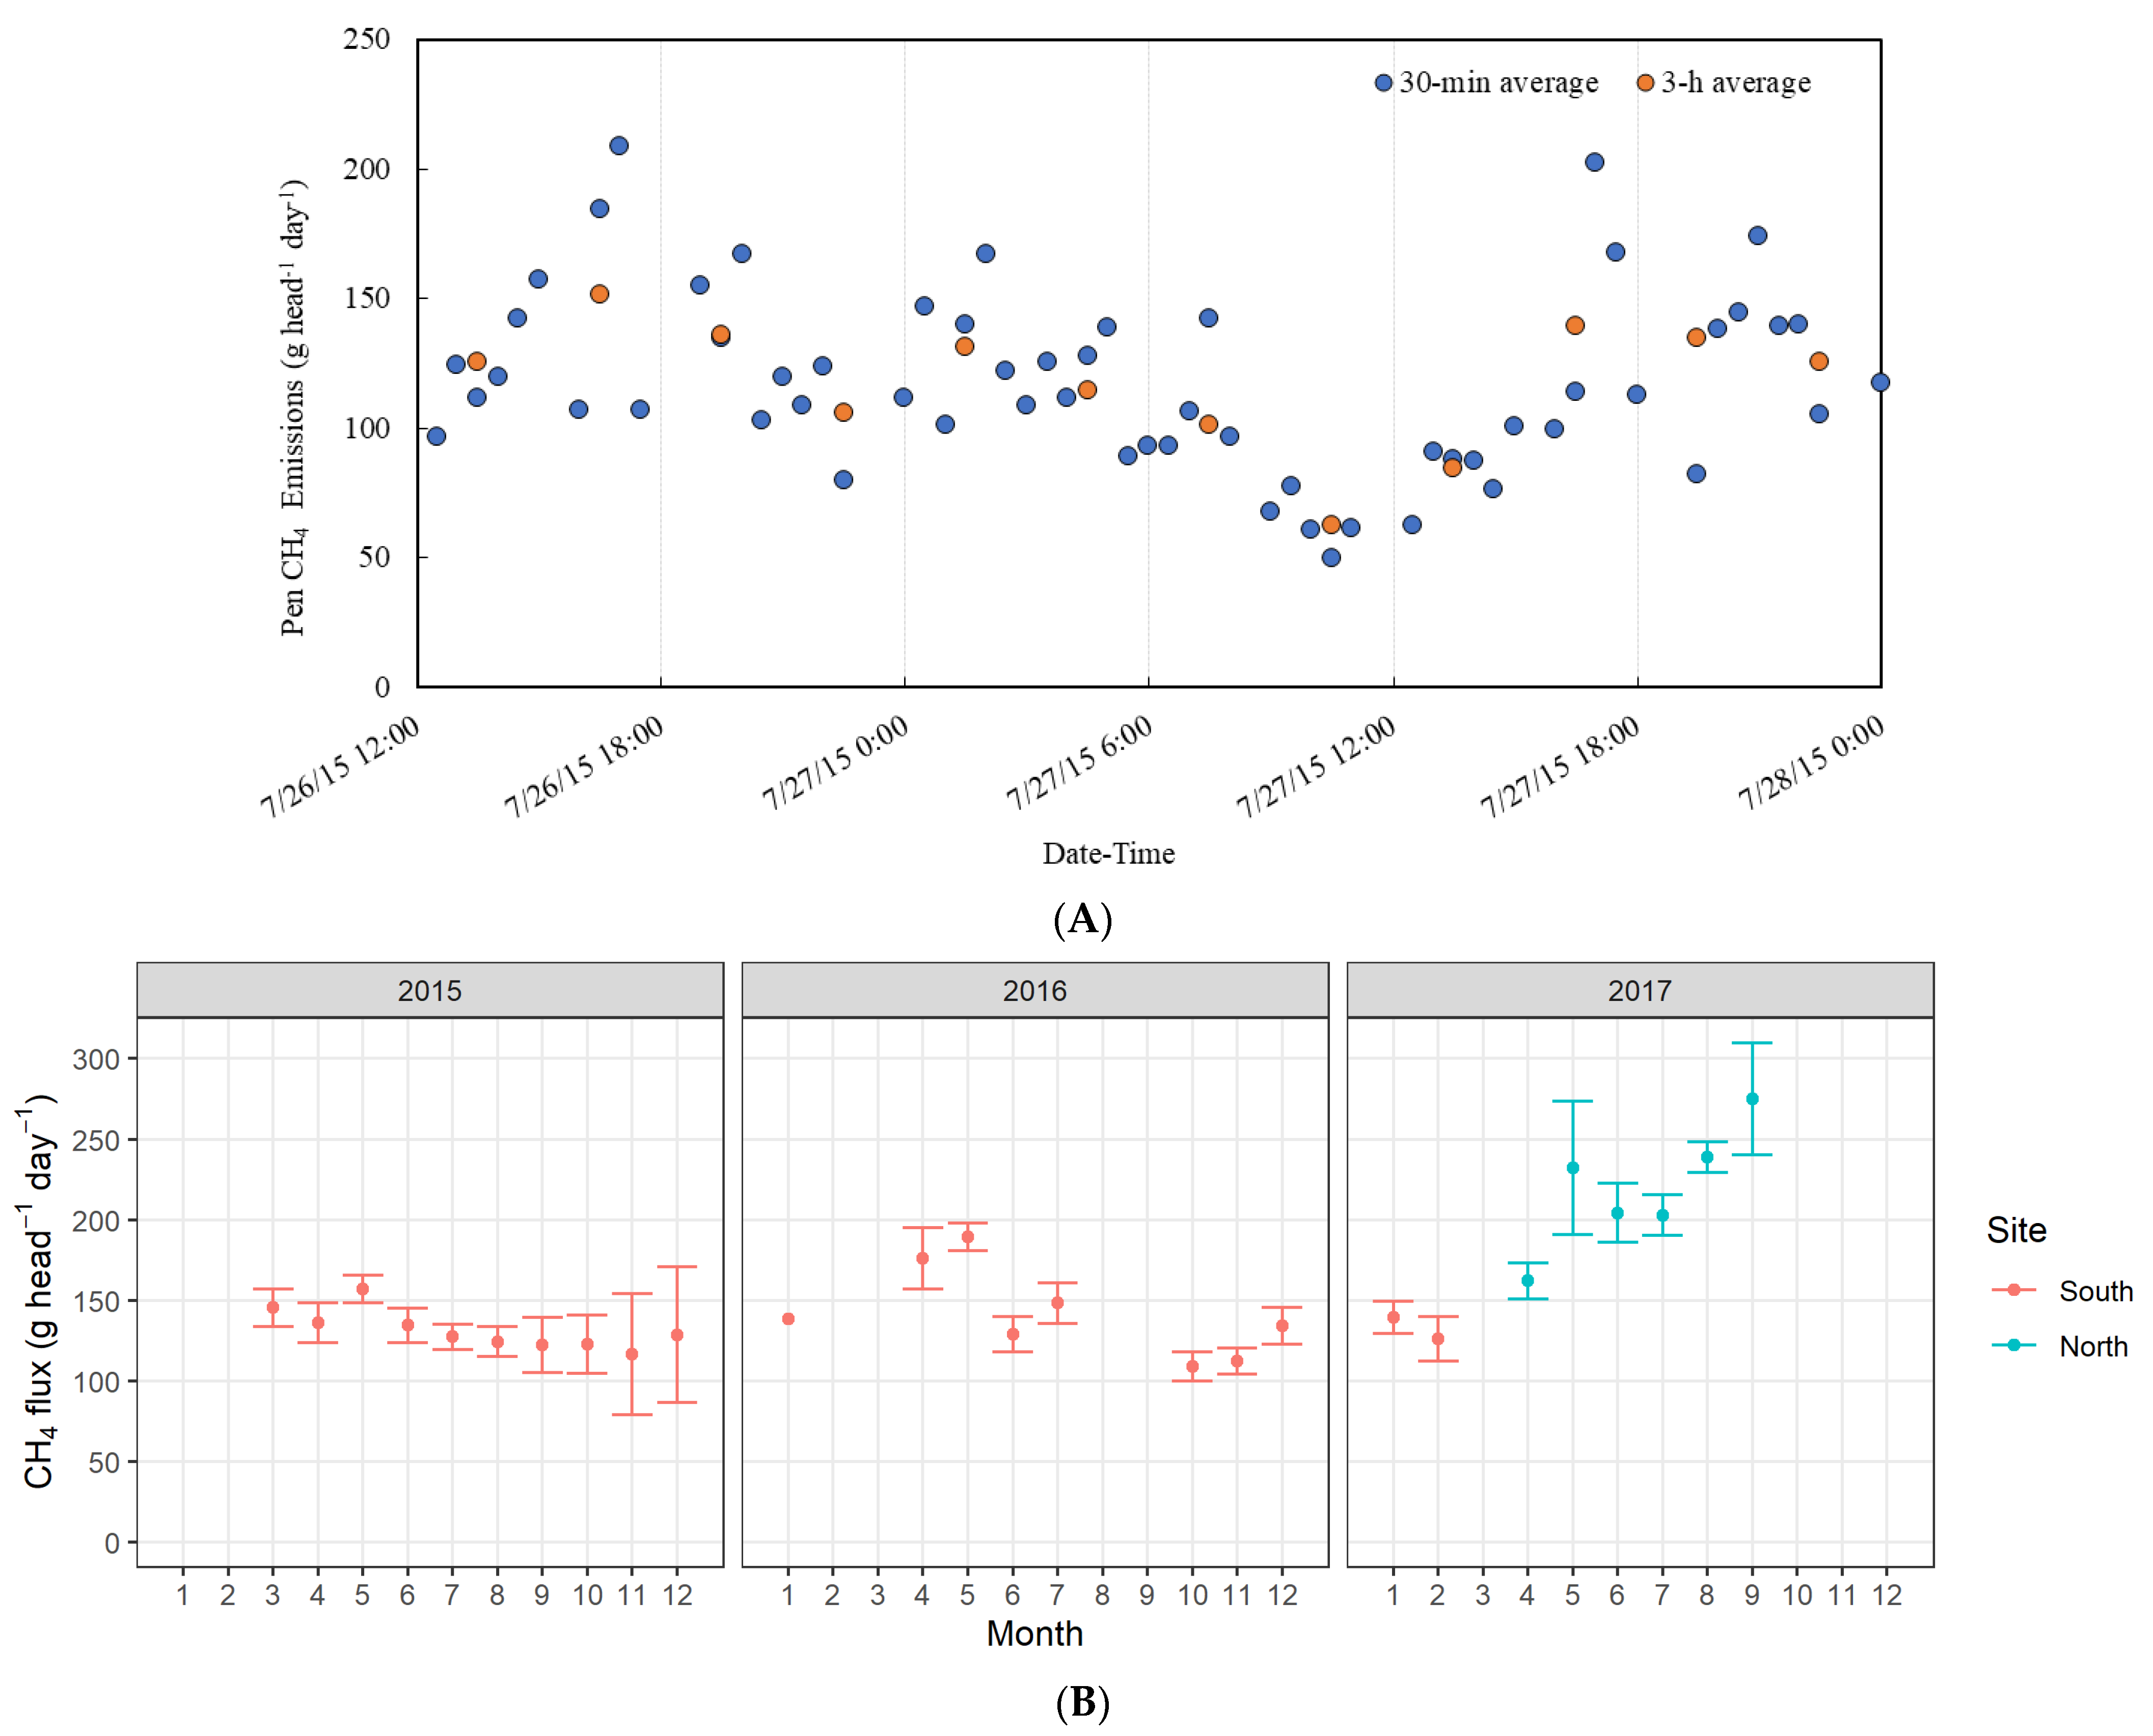
Figure 4A shows an example of the CH4 emission time series calculated for the southern feedlot during a 36 h period. The 30 min data set is not continuous due to data quality filtering. We group the available 30 min data into 3 h (or 6 h) bins and calculate the bin average emission rates, which are used to calculate daily emission rates. The 3 h bin averages (Figure 4A) show the diurnal pattern of emissions from the feedlot, with peak emission rates at ~18:00, and minimum rates in the late morning. This is a typical pattern and is associated with animal feeding times and animal activities, and has been reported in many publications including our previous work by Bai et al. [13].
Daily CH4 emission rates varied between 50 and 200 g head−1 day−1 from the southern feedlot, with a daily average of 138.5 ± 3 (mean ± s.e., n = 287 days) g head−1 day−1 in the period between 14 March 2015 and 23 February 2017. Emission rates from the northern feedlot were larger, ranging between 100 and 250 g head−1 day−1, with a daily average of 215.4 ± 8 (n = 83 days) g head−1 day−1 in the period between 15 April and 30 September 2017. A summary of daily emissions from both feedlots is shown in Table 3. The northern feedlot had a much shorter measurement period than the southern feedlot (6 months vs. 2 years) due to FTIR instrument problems and the de-stocking of the northern feedlot (which led to changing pen occupancies that complicated the measurement interpretation).
The monthly average CH4 emission rates (Figure 4B) showed that the per-animal emission rates at the southern site were relatively constant over time, with values generally between 100 and 150 g head−1 day−1. The northern site gave higher emissions and showed a time trend in emissions: per-animal rates increased from 162 to 275 g head−1 day−1 within 6 months from April to September. The difference in the time trends between the two feedlots could be attributed to the animal type, age, live weight, and the feed (Table 2), and the increasing emissions at the northern site could be associated with a seasonal change from the dry season into the wet season, when the animals likely increased their daily intake. Higher emissions at the northern feedlot may relate to high levels of sorghum in the ration, which is a major source of bypass starch. If the starch is readily degraded in the rumen, sorghum-based diets can cause higher emissions [29]. Monthly meteorological parameters used for emission calculations are shown in Appendix A Table A1.
The long-term average emissions correspond to a CH4 yield of 13.1 and 18.9 g CH4 kg−1 DMI for the southern and northern feedlots, respectively (Table 3). These yields are broadly comparable to the range of 14–17 g CH4 kg−1 DMI based on CH4 reduction with/without feed additive (Mootral), respectively, reported by Roque et al. [30], and at the lower range of 10 to 30 based on a meta-analysis from a range of diets using various forages reported by Grainger and Beauchemin [31].
The CH4 yield at the southern site was similar to that found in several feedlot studies in North America (having a high grain finishing diet): Beauchemin and McGinn [32] found yields of 9.2 and 13.1 for diets of either 91% barley or corn grain [32]; Todd et al. [33] found yields of 9.2 and 11.4 at a Texas feedlot in winter and summer; and McGinn and Flesch [34] found yields of 12.6 and 11.4 at two feedlots in Alberta. The southern feedlot yield is also very similar to the short-term value of 12.9 measured by Bai et al. [13] at this same feedlot.
The CH4 yield for the northern feedlot (18 g kg−1 DMI) is similar to the yield of between 18.0 and 19.2 with a typical low-forage feedlot diet in California [30]. Beauchemin et al. [35] studied the variability and repeatability of enteric CH4 production from feedlot cattle and found that cattle with high CH4 emissions (‘high emitter’) have a higher CH4 yield (17.4), while ‘low emitter’ cattle have a lower CH4 yield (10.9). Beauchemin et al. concluded that the yield difference could be associated with the variable retention time of dietary organic matter that is fermented in the animal rumen. If this same relationship holds for our two feedlots, then we would expect that the higher emitting cattle from the northern feedlot would also have higher CH4 yields, which is what our data show.

3.2. Measurement Uncertainty

There are several potential sources of error in our emission calculations. One is the uncertainty in the CH4 concentration measurements. As described above, the precision (1-sigma) of the FTIR is taken as 2–4 ppb. For the observations used in our emission calculations, the median absolute concentration difference (top–bottom height) was approximately a hundred times higher than the precision, i.e., 250 ppb for the southern feedlot (Appendix A Figure A1). Thus, we expect a relatively small error contribution due to uncertainties in the measured concentrations compared to uncertainties in the IDM modeling as discussed in the next paragraphs.
Our calculations rely on the accuracy of the WindTrax LS dispersion model for relating feedlot emissions to downwind concentration. The model assumes the atmospheric surface layer winds are described by the Monin–Obukhov similarity theory (MOST). Flesch et al. [36] discuss how the feedlot environment does not strictly conform to MOST, but argues that accurate dispersion calculations can still be made assuming idealized winds. Harper et al. [37] compiled a list of tracer-release validation studies of WindTrax IDM taken in various agricultural settings and with different meteorological conditions. These studies indicate a nominal accuracy in the emission calculations of 100 ± 10% (for the average of multiple measurement periods).
Errors can also occur if the occupied pens are not properly mapped in WindTrax. Feedlots are a dynamic mix of occupied and unoccupied pens. Daily records of feedlot populations were used to determine the occupied pens, but within a given day, the time of animal departures and arrivals is unknown, and some level of error in our maps exists. A related source of error would result from CH4 emissions from unoccupied pens. We assume that the large majority of feedlot emissions are of enteric origin (from the animal’s breath) and the only gas source is occupied pens. However, emissions do occur from old manure left in unoccupied pens (before being removed). The IPCC [9] gives Tier 1 emission factors for enteric emissions of 145 g CH4 head−1 day−1, and for manure emissions of 2.7 g head−1 day−1. This suggests a small error in ignoring emissions from unoccupied pens.
Another potential source of error in our calculation of total feedlot emissions is the representativeness of emissions measured within the IDM “measurement footprint”. This footprint corresponds to a subset of the feedlot pens, and the size and location of the footprint depend on wind conditions. We assume the spatial intensity of emissions (g m−2 of area) is the same for all occupied pens. However, this is unlikely, as different pens have different stocking rates and different diets. For our measurements to accurately give total feedlot emissions, the measurement footprint needs to encompass enough pens to reflect an average feedlot pen. For discussion purposes, we estimate the footprint for a single 30 min observation with neutral stratification is a rectangle extending upwind from the tower by 600 m, with a crosswind extent of 40 m (Estimated by modeling concentration differences (top–bottom height) for different-sized area sources. The footprint was defined by the upwind distance (the fetch) over which the surface emissions contribute 90% of the concentration gradient (relative to an infinite source). The crosswind distance was calculated as the footprint dimension that gives 90% of the flux (at the fetch length) relative to an infinite crosswind dimension (so surface emissions within the footprint box give 81% of the flux of an infinite source)). In stable stratification, the footprint would expand in the upwind direction but contract in the crosswind, and vice-versa in unstable conditions. This footprint covers over 10 pens. As we calculate average emissions from many observations with different wind conditions, the averages will correspond to a sizeable portion of the feedlot.

3.3. Model Prediction

The CH4 emissions from the feedlot cattle were modeled (g head−1 day−1) based on the Moe and Tyrrell equations using DMI information. For the southern feedlot, the weighted average emission rate was calculated as 206 g head−1 day−1, and for the northern feedlot, the average was calculated as 216 g head−1 day−1. Average emissions of CH4 from manure management were calculated as 3.5 g head−1 day−1. These calculated emissions correspond to a CH4 yield of 19.1 and 18.6 g CH4 kg−1 DMI for the southern and northern feedlots, respectively. Again, these estimates are in the middle of the range of 10–30 g kg−1 DMI based on the measurements using the respiration chamber and SF6 tracer methods reported by Grainger and Beauchemin [31]. However, emissions from the southern feedlot were 31.4% lower than the value calculated using the Australian National Inventory method (Moe and Tyrrell equation and estimated animal feed intake using the IPCC model). No substantial deviation between the measured and modeled emissions was observed for the northern feedlot, although the northern feedlot data are representative of only the dry season.
There are approximately 400 cattle feedlots in Australia, and we anticipate that each feedlot has its own emission factor. The population of 400 feedlots can be conceptualized as a distribution of emission factors. Future work could be performed to estimate the mean and spread of this distribution and how this varies with feedlot management and climate conditions. In this study, we sampled two feedlots (0.5% of the population) from this distribution. One feedlot had an emission factor 34% below the Australian National inventory model estimate. The other feedlot had an emission factor similar to the Australian National estimate. Sampling additional feedlots should be performed in future work to investigate if the apparent overestimate from the Australian National model generalizes to unsampled feedlots.

4. Conclusions

We collected a unique long-term record of CH4 emissions from two cattle feedlots. The measured CH4 yield at the southern feedlot fell within the range found for feedlot cattle in North America on high-grain diets, and close to previous measurements taken at the same feedlot during a short-term study. However, the yield was much lower (31.4%) than the one given in the current Australian National Inventory estimate. In contrast, the CH4 yield at the northern feedlot agreed well with the national estimate but was 45% higher than that from the southern feedlot (and higher than values measured in North American feedlots). It is difficult to draw a definite conclusion about the mean emission factor for the Australian feedlot sector based on the measurements at these two sites, as they only represent less than 1% of Australian feedlots. The results from this study suggest that long-term measurements are essential to create quality emission factor datasets but more feedlots (e.g., with a focus on Queensland and New South Wales which contain 90% of the feedlots in the country) should be investigated to develop accurate Australian National Inventory estimates. In addition, this information will be useful to guide mitigation strategies at State and National levels.
Based on this study, recommendations for future research or improvements in quantifying GHG emissions from cattle feedlots include refining measurement techniques, addressing uncertainties, and/or exploring additional factors that may influence emissions.

Author Contributions

Conceptualization, T.K.F., T.C., D.W.T.G., M.B., D.C., J.H. and D.R.; methodology, T.K.F., T.C., D.W.T.G., M.B., D.C. and J.H.; data curation, T.K.F., T.C., D.W.T.G. and M.B.; writing—original draft preparation, T.K.F., T.C., D.W.T.G., M.B. and J.H.; writing—review and editing, T.K.F., D.W.T.G., M.B. and M.V.d.S.; supervision, D.C. and J.H.; project administration, M.V.d.S. and D.R. All authors have read and agreed to the published version of the manuscript.

Funding

This research was funded by Meat & Livestock Australia, grant number B.FLT 0396.

Institutional Review Board Statement

Not applicable.

Informed Consent Statement

Not applicable.

Data Availability Statement

Data is contained within the article.

Acknowledgments

Meat & Livestock Australia providing funding for the project. We sincerely acknowledge Jianlei Sun for technical assistance and Raphaël Trouvé for modifying the figures. Many thanks to the Soil and Environment Research group members for the assistance during the field measurements.

Conflicts of Interest

The authors declare no conflict of interest.

Abbreviations

BOM, Bureau of Meteorology; CH4 yield, methane emissions per unit dry matter intake; CP-FTIR, closed-path Fourier transform infrared spectroscopic technique; CO2 eq, carbon dioxide equivalent; DM, dry matter; DMI, dry matter intake; GHG, greenhouse gas; HITRAN, High-resolution Transmission Molecular Absorption; IDM, inverse-dispersion model; IPCC, International Panel on Climate Change; MALT, Multiple-Atmospheric Layer Transmission.

Appendix A

Table A1. The meteorological parameters that are used for flux calculations for both feedlots.
Southern Feedlot
YearMonthAir Temp (°C)u* (m s−1)L (m)z0 (m)SU_USSV_USSW_USAir Pressure (kPa)
2015318.60.4−6786.60.12.92.91.399.1
2015415.70.316.20.23.02.91.399.3
2015511.90.4−301.80.12.62.41.399.7
201569.60.231.90.23.13.11.3100.3
201578.40.3−81.70.12.82.51.399.9
201589.60.3284.20.13.02.91.499.8
2015911.50.3−52.30.22.92.91.499.9
20151023.60.479.80.23.12.91.399.7
20151121.50.5−569.50.23.03.01.399.1
20151227.60.55.60.23.33.31.398.9
2016126.40.4−103.60.23.73.71.598.6
2016225.80.4−29.00.23.53.51.599.1
2016329.60.3−25.40.23.73.91.799.4
2016418.50.3−23.00.23.02.81.499.7
2016513.90.5106.90.12.72.31.399.1
201669.20.4−126.50.12.82.31.398.7
201679.20.4121.10.12.72.31.399.3
201689.70.3−46.10.22.82.51.399.5
2016910.50.3196.40.22.72.41.499.7
20161012.30.4409.80.22.72.51.399.2
20161117.40.5−479.80.22.92.81.398.9
20161223.00.5−12,522.20.23.13.11.498.6
2017124.80.4151.80.23.13.11.498.6
2017222.20.477.90.23.02.91.498.8
Northern Feedlot
YearMonthAir Temp (°C)u* (m s−1)L (m)z0 (m)SU_USSV_USSW_USAir Pressure (kPa)
2017518.20.3−584.40.22.82.51.296.5
2017615.90.310.20.23.02.81.296.8
2017715.10.318.40.23.12.71.296.9
2017819.10.3−159.00.22.92.71.296.7
2017918.30.447.50.23.22.61.296.6
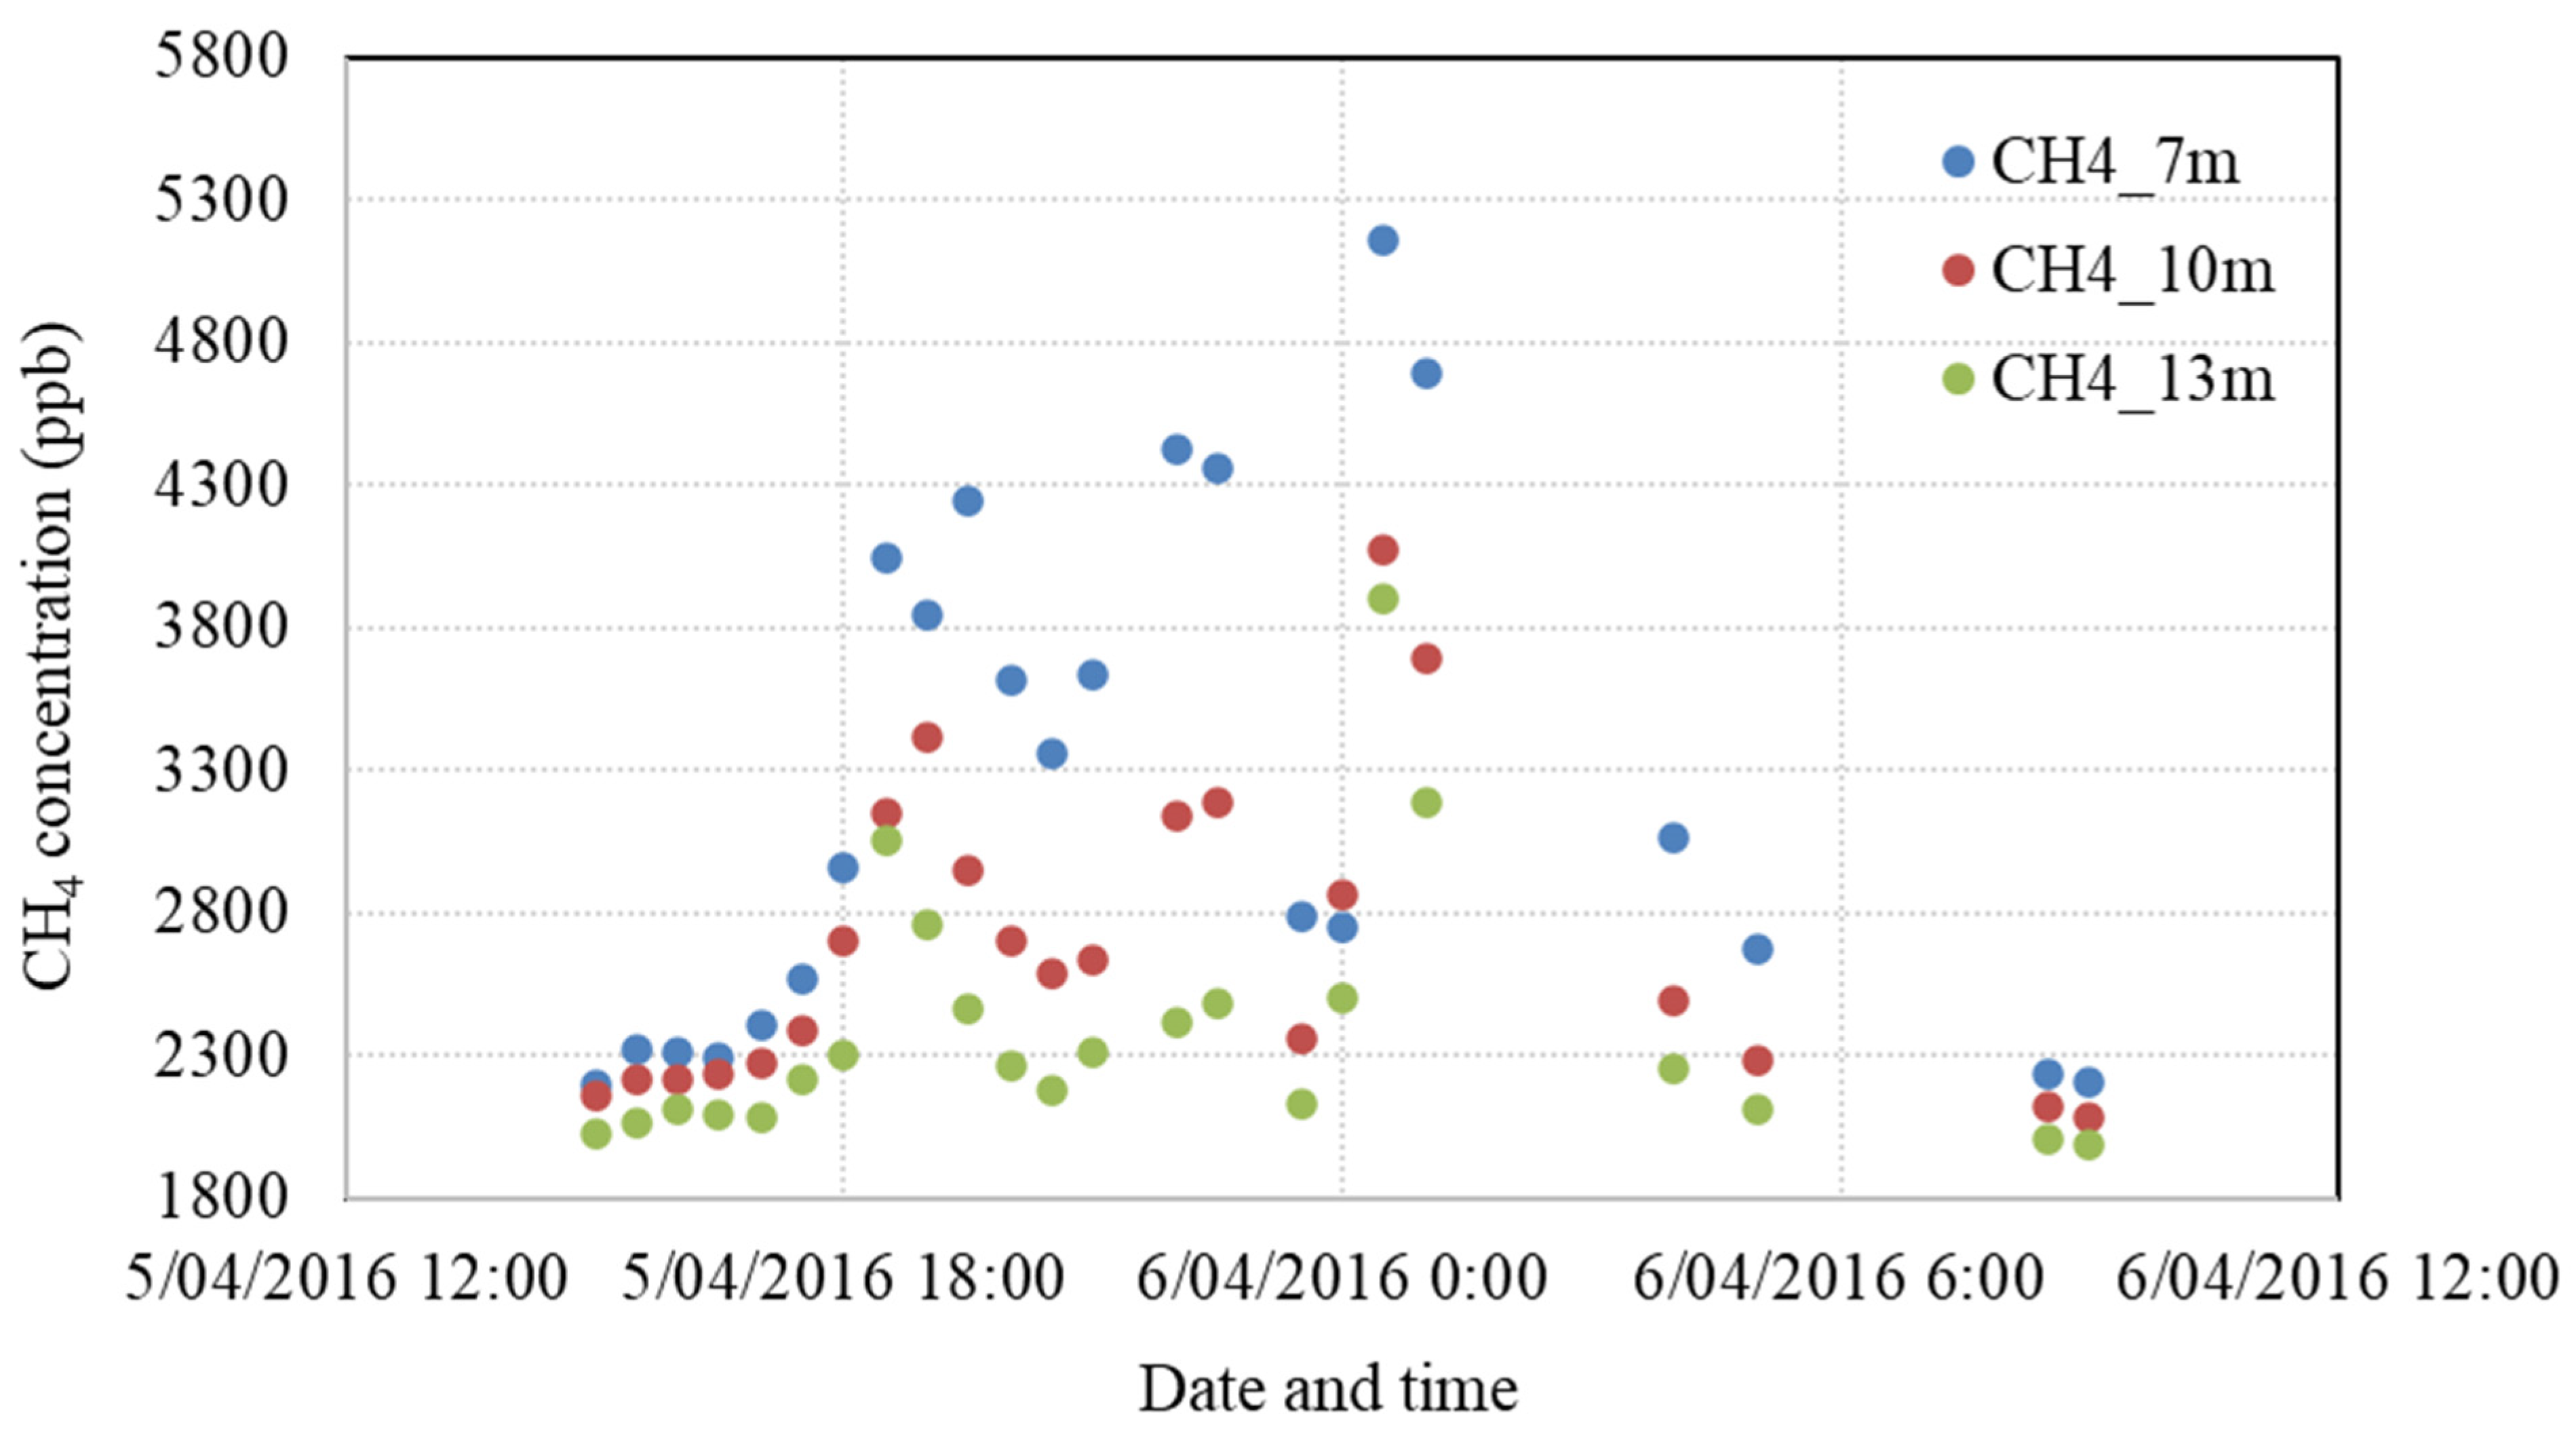
Figure A1. An example of 30 min average CH4 concentrations measured from three heights at the southern feedlot site.
Atmosphere 14 01352 g0a1

References

  1. Zhang, L.; Tian, H.; Shi, H.; Pan, S.; Chang, J.; Dangal, S.R.S.; Qin, X.; Wang, S.; Tubiello, F.N.; Canadell, J.G.; et al. A 130-year global inventory of methane emissions from livestock: Trends, patterns, and drivers. Glob. Chang. Biol. 2022, 28, 5142–5158. [Google Scholar] [CrossRef]
  2. Gerber, P.J.; Steinfeld, H.; Henderson, B.; Mottet, A.; Opio, C.; Dijkman, J.; Falcucci, A.; Tempio, G. Tackling Climate Change through Livestock: A Global Assessment of Emissions and Mitigation Opportunities; Food and Agriculture Organization of the United Nations (FAO): Roma, Italy, 2013. [Google Scholar]
  3. Beauchemin, K.A.; Henry Janzen, H.; Little, S.M.; McAllister, T.A.; McGinn, S.M. Life cycle assessment of greenhouse gas emissions from beef production in western Canada: A case study. Agric. Syst. 2010, 103, 371–379. [Google Scholar] [CrossRef]
  4. Ridoutt, B.; Lehnert, S.A.; Denman, S.; Charmley, E.; Kinley, R.; Dominik, S. Potential GHG emission benefits of Asparagopsis taxiformis feed supplement in Australian beef cattle feedlots. J. Clean. Prod. 2022, 337, 130499. [Google Scholar] [CrossRef]
  5. Black, J.L.; Davison, T.M.; Box, I. Methane Emissions from Ruminants in Australia: Mitigation Potential and Applicability of Mitigation Strategies. Animals 2021, 11, 951. [Google Scholar] [CrossRef] [PubMed]
  6. Scoones, I. Livestock, methane, and climate change: The politics of global assessments. WIREs Clim. Chang. 2023, 14, e790. [Google Scholar] [CrossRef]
  7. MLA. The Australian Red Meat Industries’s Carbon Neutral by 2030 Roadmap; MLA: North Sydney, NSW, Australia, 2020; Available online: https://www.mla.com.au/globalassets/mla-corporate/research-and-development/program-areas/environment-and-sustainability/2689-mla-cn30-roadmap_d3.pdf (accessed on 6 February 2023).
  8. Moe, P.W.; Tyrrell, H.F. Methane Production in Dairy Cows. J. Dairy Sci. 1979, 62, 1583–1586. [Google Scholar] [CrossRef]
  9. IPCC. 2006 IPCC Guidelines for National Greenhouse Gas Inventories, Prepared by the National Greenhouse Gas Inventories Programme; Eggleston, H.S., Buendia, L., Miwa, K., Ngara, T., Tanabe, K., Eds.; IGES: Kanagawa, Japan, 2006. [Google Scholar]
  10. IPCC. 2019 Refinement to the 2006 IPCC Guidelines for National Greenhouse Gas Inventories; Calvo Buendia, E., Tanabe, K., Kranjc, A., Baasansuren, J., Fukuda, M., Ngarize, S., Osako, A., Pyrozhenko, Y., Shermanau, P., Federici, S., Eds.; IPCC: Interlaken, Switzerland, 2019. [Google Scholar]
  11. Moraes, L.E.; Strathe, A.B.; Fadel, J.G.; Casper, D.P.; Kebreab, E. Prediction of enteric methane emissions from cattle. Glob. Chang. Biol. 2014, 20, 2140–2148. [Google Scholar] [CrossRef]
  12. Denmead, O.T.; Chen, D.; Rowell, D.; Loh, Z.; Turner, D.A.; Hill, J.; Muir, S.; Bai, M.; Griffith, D.W.T.; Phillips, F.; et al. Emissions of direct and indirect greenhouse gases from Australian cattle feedlots. Adv. Anim. BioSci. 2013, 4, 400. [Google Scholar]
  13. Bai, M.; Flesch, T.; McGinn, S.; Chen, D. A snapshot of greenhouse gas emissions from a cattle feedlot. J. Environ. Qual. 2015, 44, 1974–1978. [Google Scholar] [CrossRef]
  14. Loh, Z.; Chen, D.; Bai, M.; Naylor, T.; Griffith, D.; Hill, J.; Denmead, T.; McGinn, S.; Edis, R. Measurement of greenhouse gas emissions from Australian feedlot beef production using open-path spectroscopy and atmospheric dispersion modelling. Aust. J. Exp. Agr. 2008, 48, 244–247. [Google Scholar] [CrossRef]
  15. McGinn, S.M.; Chen, D.; Loh, Z.; Hill, J.; Beauchemin, K.A.; Denmead, O.T. Methane emissions from feedlot cattle in Australia and Canada. Aust. J. Exp. Agr. 2008, 48, 183–185. [Google Scholar] [CrossRef]
  16. MLA. Greenhouse Gas Emissions from Australian Beef Cattle Feedlots; Meat & Livestock Australia: North Sydney, NSW, Australia, 2009; p. 42. [Google Scholar]
  17. Chen, D.; Sun, J.; Bai, M.; Dassanayake, K.B.; Denmead, O.T.; Hill, J. A new cost-effective method to mitigate ammonia loss from intensive cattle feedlots: Application of lignite. Sci. Rep. 2015, 5, 16689. [Google Scholar] [CrossRef]
  18. Velazco, J.I.; Cottle, D.J.; Hegarty, R.S. Methane emissions and feeding behaviour of feedlot cattle supplemented with nitrate or urea. Anim. Prod. Sci. 2014, 54, 1737–1740. [Google Scholar] [CrossRef]
  19. Gopalan, P.; Jensen, P.D.; Batstone, D.J. Biochemical Methane Potential of Beef Feedlot Manure: Impact of Manure Age and Storage. J. Environ. Qual. 2013, 42, 1205–1212. [Google Scholar] [CrossRef]
  20. Redding, M.R.; Lewis, R.; Waller, J.; Phillips, F.; Griffith, D. Large-Chamber Methane and Nitrous Oxide Measurements Are Comparable to the Backward Lagrangian Stochastic Method. J. Environ. Qual. 2013, 42, 1643–1651. [Google Scholar] [CrossRef]
  21. Hacker, J.M.; Chen, D.; Bai, M.; Ewenz, C.; Junkermann, W.; Lieff, W.; McManus, B.; Neininger, B.; Sun, J.; Coates, T.; et al. Using airborne technology to quantify and apportion emissions of CH4 and NH3 from feedlots. Anim. Prod. Sci. 2016, 56, 190–203. [Google Scholar] [CrossRef]
  22. Flesch, T.K.; Wilson, J.D.; Harper, L.A.; Crenna, B.P.; Sharpe, R.R. Deducing ground-to-air emissions from observed trace gas concentrations: A field trial. J. Appl. Meteorol. 2004, 43, 487–502. [Google Scholar] [CrossRef]
  23. Flesch, K.T.; Baron, V.; Wilson, J.; Griffith, D.W.T.; Basarab, J.; Carlson, P. Agricultural gas emissions during the spring thaw: Applying a new measuremnt technique. Agric. Forest Meteorol. 2016, 221, 111–121. [Google Scholar] [CrossRef]
  24. Griffith, D.W.T.; Deutscher, N.M.; Caldow, C.; Kettlewell, G.; Riggenbach, M.; Hammer, S. A Fourier transform infrared trace gas and isotope analyser for atmospheric applications. Atmos. Meas. Tech. 2012, 5, 2481–2498. [Google Scholar] [CrossRef]
  25. Griffith, D.W.T. Synthetic calibration and quantitative analysis of gas-phase FT-IR spectra. Appl. Spectrosc. 1996, 50, 59–70. [Google Scholar] [CrossRef]
  26. Rothman, L.S.; Gordon, I.E.; Barbe, A.; Benner, D.C.; Bernath, P.F.; Birk, M.; Boudon, V.; Brown, L.R.; Campargue, A.; Champion, J.P.; et al. The HITRAN 2008 molecular spectroscopic database. J. Quant. Spectrosc. Ra. 2009, 110, 533–572. [Google Scholar] [CrossRef]
  27. Abdi, H. Singular value decomposition (SVD) and generalized singular value decomposition. Encycl. Meas. Stat. 2007, 907, 912. [Google Scholar]
  28. NIR. National Inventory Report 2020; The Australian Government Submission to the United Nations Framework Convention on Climate Change, Australian National Greenhouse Accounts (Released in May 2022); Australian Government: Canberra, Australia, 2022; Volume 1, p. 428. [Google Scholar]
  29. Moate, P.J.; Williams, S.R.O.; Jacobs, J.L.; Hannah, M.C.; Beauchemin, K.A.; Eckard, R.J.; Wales, W.J. Wheat is more potent than corn or barley for dietary mitigation of enteric methane emissions from dairy cows. J. Dairy Sci. 2017, 100, 7139–7153. [Google Scholar] [CrossRef]
  30. Roque, B.M.; Van Lingen, H.J.; Vrancken, H.; Kebreab, E. Effect of Mootral—A garlic- and citrus-extract-based feed additive—On enteric methane emissions in feedlot cattle. Transl. Anim. Sci. 2019, 3, 1383–1388. [Google Scholar] [CrossRef]
  31. Grainger, C.; Beauchemin, K.A. Can enteric methane emissions from ruminants be lowered without lowering their production? Anim. Feed Sci. Tech. 2011, 166–167, 308–320. [Google Scholar] [CrossRef]
  32. Beauchemin, K.A.; McGinn, S.M. Methane emissions from feedlot cattle fed barley or corn diets. J. Anim. Sci. 2005, 83, 653–661. [Google Scholar] [CrossRef]
  33. Todd, R.W.; Altman, M.B.; Cole, N.A.; Waldrip, H.M. Methane Emissions from a Beef Cattle Feedyard during Winter and Summer on the Southern High Plains of Texas. J. Environ. Qual. 2014, 43, 1125–1130. [Google Scholar] [CrossRef] [PubMed]
  34. McGinn, S.M.; Flesch, T.K. Ammonia and greenhouse gas emissions at beef cattle feedlots in Alberta Canada. Agri. Forest Meteorol. 2018, 258, 43–49. [Google Scholar] [CrossRef]
  35. Beauchemin, K.A.; Tamayao, P.; Rosser, C.; Terry, S.A.; Gruninger, R. Understanding variability and repeatability of enteric methane production in feedlot cattle. Front. Anim. Sci. 2022, 3, 1029094. [Google Scholar] [CrossRef]
  36. Flesch, T.K.; Wilson, J.D.; Harper, L.A.; Todd, R.W.; Cole, N.A. Determining ammonia emissions from a cattle feedlot with an inverse dispersion technique. Agr. Forest Meteorol. 2007, 144, 139–155. [Google Scholar] [CrossRef]
  37. Harper, L.A.; Flesch, T.K.; Weaver, K.H.; Wilson, J.D. The effect of biofuel production on swine farm methane and ammonia emissions. J. Environ. Qual. 2010, 39, 1984–1992. [Google Scholar] [CrossRef] [PubMed]
Figure 1. Aerial photos of the southern feedlot in Victoria (left) and the northern feedlot in Queensland, Australia (right). Red stars show the location of the instrument towers at both sites. Highlighted areas: red, cattle pens; blue, manure stockpiles; yellow, run-off ponds; green, dam.
Atmosphere 14 01352 g001
Figure 2. Concentration-profile tower at the southern feedlot with sampling heights of 7, 11, and 13 m (left panel); northern feedlot with sampling heights of 3, 5, and 8.5 m (right panel). Red arrows represent the gas sampling inlets. Closed-path FTIR at both sites was located in a shed office next to the tower (not shown in the northern site). The sonic anemometer was located 13.5 m above the ground (on the top of the tower) for the southern site, and 8.5 m above the ground at the northern site. Photos are created by the author, with the permission of farm owners.
Atmosphere 14 01352 g002
Figure 3. Example of the IDM methodology used to calculate feedlot emissions. The panel on the left is a WindTrax map for one particular 30 min observation period, defining the occupied cattle pens as the emission sources, and showing the wind and concentration measurement location (for the southern feedlot). The right panel shows the measured CH4 concentrations for one particular 30 min period, and the resulting WindTrax fit of the emission rate (QLS) and background concentration (Cb).
Atmosphere 14 01352 g003
Figure 4. An example time series of CH4 emissions measured from the southern feedlot (A). Monthly averaged CH4 emissions from beef cattle at the southern (red) and northern feedlots (blue) measured from March 2015 to September 2017 (B). The error bars represent the standard errors of the mean.
Atmosphere 14 01352 g004
Table 1. Average diet composition fed to the cattle during the measurement period at the southern and northern feedlots.
Composition Southern
Feedlot
Northern
Feedlot
Dry matter (DM)g kg−1760707
Crude proteing kg−1 DM138138
Non-protein nitrogeng kg−1 DM6.96.6
Neutral detergent fiberg kg−1 DM213207
Acid detergent fiberg kg−1 DM9792
Net energy for maintenanceMJ kg−1 DM2.001.94
Net energy for bodyweight gainMJ kg−1 DM1.331.30
Table 2. Animal live weight, weight gain, feed intake, dry matter intake (DMI), and N intake from the southern feedlot between 2015 and 2017, and from the northern feedlot in 2017.
FeedlotNo. of AnimalInduction Live WeightWeight GainDMIN Intake
kg head−1 day−1kg head−1 day−1kg head−1 day−1kg day−1
Southern feedlot16,233381 ± 3.71.510.63.69
Northern feedlot16,881483 ± 1.31.411.43.84
Table 3. Feedlot CH4 emissions (g head−1 day−1) and CH4 yield (g CH4 kg−1 dry matter intake, DMI) at the southern and northern feedlots.
Feedlot Cattle CH4 EmissionsCH4 Yield
g head−1 day−1g CH4 kg−1 DMI
Southern feedlot138.5 (3)13.1
Northern feedlot215.4 (8)18.9
Disclaimer/Publisher’s Note: The statements, opinions and data contained in all publications are solely those of the individual author(s) and contributor(s) and not of MDPI and/or the editor(s). MDPI and/or the editor(s) disclaim responsibility for any injury to people or property resulting from any ideas, methods, instructions or products referred to in the content.