Article

Investigating the Seasonal Effect of Climatic Factors on Evapotranspiration in the Monsoon Climate Zone: A Case Study of the Yangtze River Basin

1
Artificial Intelligence School, Wuchang University of Technology, Wuhan 430223, China
2
School of Geography and Information Engineering, China University of Geosciences (Wuhan), Wuhan 430074, China
3
Hebei Jiuhua Geo-Exploration and Surveying Co., Ltd., Baoding 071051, China
4
Land Satellite Remote Sensing Application Center, Ministry of Natural Resources of the People’s Republic of China, Beijing 100048, China
*
Author to whom correspondence should be addressed.
Atmosphere 2023, 14(8), 1282; https://doi.org/10.3390/atmos14081282
Submission received: 20 July 2023 / Revised: 10 August 2023 / Accepted: 11 August 2023 / Published: 13 August 2023

Abstract

:
Evapotranspiration (ET) plays an essential role in water balance and ecological environment changes. The Yangtze River Basin (YRB) is a typical monsoon climate zone. Most existing studies on the impact of climatic factors on annual ET have overlooked the seasonal effect. This study quantitatively analyzed the spatiotemporal variation characteristics of ET and its relationship with climatic factors at the annual and monthly scales in the YRB using high−spatial−resolution PML_V2 ET data from 2001 to 2020. Results showed that: (1) the spatiotemporal distribution of the regions with significant correlation between ET and individual climatic factors (i.e., air temperature, solar radiation and precipitation) in the YRB showed obvious cyclical changes in month, and the spatial change pattern is strongly related to the elevation; (2) the area proportion of the dominant climatic factors affecting annual ET in the study area was characterized by solar radiation > specific humidity > precipitation > air temperature > wind speed. However, monthly ET in most areas of the YRB was driven by solar radiation and air temperature, especially in summer and autumn, while ET in spring and winter was mainly driven by solar radiation, air temperature, and specific humidity.

1. Introduction

Evapotranspiration (ET) is the total flux of water vapor transferred from surface soil and vegetation to the atmosphere, mainly includes evaporation of soil moisture and transpiration of water in vegetation, and is an essential component of the land–atmosphere hydrological cycle and the surface water and heat balance [1,2]. In the context of global warming and surface environmental changes, investigating the spatiotemporal distribution of ET and its response to climatic factors is pivotal for climate change research [3,4,5], drought monitoring [6,7,8], water resource management [9,10], crop yield estimation [11,12], and environmental protection [13,14]. The Yangtze River Basin (YRB) is the largest basin in China, its water and hydropower resources are the richest in China [15], and its ecological security in the basin is receiving increasing attention as the region with the most rapid economic and social development in China in recent years. It is facing the new impact of the transformation from large-scale development to large-scale protection in the future [16]. Its hydroelectric resources are vulnerable and sensitive to environmental changes [17,18]. Therefore, it is very challenging and significant to accurately study the spatiotemporal distribution of ET in the YRB and its response to the influencing factors.
In recent decades, many efforts have been devoted to investigating the trend of evapotranspiration in the YRB, mainly involving two kinds of evapotranspiration, namely actual evapotranspiration and reference evapotranspiration ( E T 0 ) [19,20,21,22]. E T 0 is defined as “the evapotranspiration of a hypothetical crop with a plant height of 12 cm, at a ground resistance of 70 s/m and an albedo of 0.23” [23], which is a good indicator of the variability of evapotranspiration and its causes. Based on the E T 0 measurement in meteorological stations in the YRB, many studies had found that the annual E T 0 in this region had an obvious downward trend during 1961–2000 [20,24]. Xu et al. studied the annual E T 0 over 46 stations located in the Yangtze River Delta in stages and found that within 1957–1989, nearly 85% of the stations showed a decreasing trend, while within 1990–2014, more than half of the stations showed a significant increasing trend, except for February and September. However, overall, 73.91% of the stations showed an increasing annual trend from 1957 to 2014 and were mainly distributed in the southeast [25]. Imali Kaushalya Herath et al. studied the E T 0 in the Jialing River Basin (located in the upper reaches of the YRB) from 1964 to 2014 and found that the annual  E T 0 showed a slight downward trend [26]. Wang et al. found that the E T 0 of the whole Upper Yangtze River Basin (UYRB) increased significantly by 3.3 mm/year from 1951 to 2020, and the stations with significant increases in annual E T 0 were concentrated in the central part of the UYRB [19]. Based on the above findings, it could be inferred that the E T 0 in the YRB during 1951–2020 showed a trend of first decreasing and then increasing in a fluctuating pattern, and the variation pattern was different in different regions.
Compared with the E T 0 , actual ET has a better representation of the true amount of water evaporated from a watershed [27]. A few studies have been conducted to analyze the trend of actual ET in YRB. Su et al. simulated the actual ET of the YRB from 1961 to 2000 by using the advection−aridity (AA) model and found that the annual actual ET of the upper and mid-lower reaches of the YRB showed a downward trend [21]. Liu et al. studied actual ET from 1960 to 2007 based on 72 meteorological stations in the UYRB and found that the annual average actual ET in the region increased slightly in the first decade, then decreased, followed by fluctuations and low growth, and then showed a sharp decline in the latest ten years, but overall showed a slight downward trend [28]. Lu et al. used GLEAM ET data to analyze the changes and dynamic characteristics of actual ET and its components in the YRB from 1980 to 2014 and found that the actual ET showed a significant increasing trend, especially in the middle and lower reaches of the YRB [22]. Therefore, it was not difficult to speculate that the overall actual ET in the YRB from 1960 to 2014 showed a trend of first decreasing and then increasing in a fluctuating pattern, but the change patterns varied from region to region, which was similar to the change trend of E T 0 in the YRB. However, most existing studies used station-based actual ET measurement and ET actual data with low spatial resolution to investigate the spatiotemporal characteristics of ET in the YRB with high spatial heterogeneity, which may lead to some uncertainties. The understanding of ET change trend in the YRB in recent years has been lacking.
Several studies have shown that ET in China is mainly influenced by meteorological elements such as wind speed, air humidity, precipitation, temperature, and sunshine duration; however, the vast territory and complex topography of China lead to different climatic influences on ET in different regions [29,30,31,32]. Further, the response of ET to climatic factors in the YRB has been explored in several studies. Gong et al. analyzed the sensitivity of E T 0 to key climate variables in the YRB during 1960−2000 and found that relative humidity was the most sensitive variable, followed by short wave radiation, air temperature, and wind speed, and the ranking of sensitivity of the four climatic variables varied with seasons and regions [33]. Xu et al. found that relative humidity, wind speed, and sunshine duration were the main meteorological variables affecting annual E T 0 changes in the Yangtze River Delta during 1957−2014 [25]. Lu et al. found that the spatial pattern of actual ET in the YRB during 1980–2014 was jointly determined by air temperature and precipitation, while solar radiation was the dominant controlling factor of actual ET in most regions [22]. Wang et al. quantified the influence of climatic variables on E T 0 in the UYRB from 1951 to 2020 and found that relative humidity was the main factor affecting E T 0 changes, and the contribution of climatic variables to E T 0 changes in each sub-basin was different [19]. Combining previous studies, it is found that the ET variation in the YRB is highly influenced by climatic and geomorphological factors such as air temperature, precipitation, wind speed, solar radiation, and specific humidity. However, the effects of climatic factors on ET variation are only explored at the annual scale in the existing studies. The YRB has a typical monsoon climate with four distinct seasons, and climatic factors have obvious seasonal variation characteristics [17]; thus, the response of ET driven by climatic factors varies with the seasons.
In order to explore the actual ET changes and their driving mechanisms in the YRB in the last two decades, this study quantitatively analyzed the spatiotemporal characteristics of annual and monthly ET using the Theil−Sen median trend analysis and the Mann−Kendall test based on the ET dataset of the PML_V2 model from 2001 to 2020. In addition, combined with air temperature, solar radiation, precipitation, specific humidity, and wind speed time series data, this study further explored the effect of climate change on ET at different spatial and temporal levels using correlation analysis, normalized multiple linear regression analysis, and other methods to provide scientific reference for ecological protection, rational development, and utilization of water resources and climate change in the YRB. This study aims to answer: (1) What are the temporal and spatial characteristics of annual and monthly ET changes in the YRB during 2001−2020? (2) What are the driving mechanisms of climatic factors affecting ET change in the YRB at the annual and monthly scale?

2. Materials and Methods

2.1. Study Area

As the largest basin in China, the Yangtze River Basin is an important water resource supply region in China. The water resource supply of the watershed ecosystem not only serves the interior of the basin but also supports some northern regions through the South−to−North Water Diversion [34]. Its main stream crosses Central China from west to east, ranging from 90° to 123° E and 24° to 36° N (Figure 1).
The total area of the basin is about 1.8 million square kilometers, which is about 1/5 of the total area of China. With a total length of 6397 km and hundreds of tributaries radiating from north to south, there are abundant natural resources in the basin. Except for the Jiangyuan region, the climate of the YRB is a typical monsoon climate. The annual average temperature in most areas of the basin is between 16 and 18 ℃, the annual average precipitation is 1067 mm, and the average annual evaporation is 592.58 mm. Under the influence of local circulation and topography, the spatial distribution and intra-annual distribution of annual precipitation in the basin are extremely uneven, showing a decreasing distribution pattern from southeast to northwest in general [35]. The basin spans more than 6000 m in elevation from west to east, and the landforms in the basin are complex and diverse, including plateaus, basins, hills, and plains, with significant spatial differences influenced by climate, landforms, and human social activities [36].

2.2. Study Data

2.2.1. ET Data

The YRB has strong spatial heterogeneity and requires high−resolution data. The PML_V2 ET remote sensing product used in this study is currently the only ET and GPP coupling data product with 500 m resolution, and the data period is from 2001 to 2020. The temporal resolution is 8−day, and the ET data with two timescales of months and years are synthesized for subsequent analysis.
The PML_V2 ET dataset was generated based on the Penman−Monteith−Leuning (PML) model by inputting leaf area index (MCD15A3H), albedo (MCD43A3), surface specific radiance (MOD11A2), and land use (MCD12Q1) data from MODIS satellite data and the air temperature, specific humidity, wind speed, surface pressure, precipitation, and shortwave radiation from the meteorological dataset of the CMA Land Data Assimilation System (CLDAS−V2.0) [37]. The dataset includes five components: gross primary production (GPP), vegetation transpiration (Ec), soil evaporation (Es), vaporization of intercepted rainfall (Ei), and water, ice, and snow evaporation (ET_water), coupling the two internal processes of GPP and vegetation evapotranspiration, making GPP and ET check and balance each other, making PML_V2 a great improvement in ET simulation accuracy compared with previous models.

2.2.2. Meteorological Data

The meteorological data used in this study were derived from ERA5 meteorological reanalysis data released by the European Center for Medium−Range Weather Forecasts (ECWMF), including monthly products of precipitation (P, mm), air temperature (T, °C), solar radiation (SR, M J · m 2 ), and wind speed at 10 m height ( U , m · s 1 ). The spatial resolution of the data is 0.1°. In addition, the specific humidity (SH, K g · K g 1 ) data used in this study were obtained from the Global Land Data Assimilation System (GLDAS−2.1) with a spatial resolution of 0.25°, all meteorological data above ranged from 2001 to 2020, and their spatial resolution was resampled to 500 m by using the nearest-neighbor interpolation method. The spatialized meteorological data were employed to perform correlation analysis and multiple linear regression analysis with ET data to investigate climate driving types of ET in the YRB.

2.2.3. Elevation Data

The digital elevation model (DEM) data were obtained from the Resource and Environmental Science Data Center of the Chinese Academy of Sciences. This dataset is based on the latest SRTM V4.1 (Shuttle Radar Topography Mission, SRTM) data and was resampled to generate a DEM with a spatial resolution of 500 m to ensure uniform spatial resolution for calculations and analysis.

2.3. Methodology

2.3.1. ET Trend Analysis in the YRB

In this study, the interannual and intra-annual trends of ET in the YRB were analyzed by combining the Theil−Sen median trend analysis and the Mann−Kendall test. The combination of the two methods has become an important method to judge the trend and significance of long-time series data [38,39,40]. Theil−Sen median trend analysis [41] is used to quantify the trend of change, indicating the amount of change per unit time. The calculation formula is:
β = m e d i a n X i X j i j ,
where 1 < j < i < n, and n is the number of data. β is the trend of change: when β > 0, it indicates an upward trend. When β < 0, it indicates a downward trend. When β = 0, the trend is unchanged.
The β obtained by the Sen trend cannot be used to judge the trend significance of time series. Therefore, the Mann−Kendall method is introduced to analyze the significance of the trend [42]. This method has no requirement for data distribution of sequence and is insensitive to outliers [43]. For a time series of ET, the statistic Z is defined as:
Z = S 1 V S , S > 0         0         , S = 0 S + 1 V S , S < 0 .
where S = k = 1 n 1 j = k + 1 n S g n ( X j X k ) , Var(S) = n × (n − 1) × (2n + 5)/18,
S g n ( X j X k ) = + 1 , X j X k > 0 0 , X j X k = 0 1 , X j X k < 0   ,
In the bilateral trend test, there is significant variation in the time series data when the Mann–Kendall statistic |Z| ≧ Z 1 α / 2 . Confidence intervals in this study were calculated at two levels of significance (α = 0.01 and α = 0.05), which the trend of change to be classified into five levels (Table 1).

2.3.2. Correlation Analysis

The correlation analysis of single influence factor between ET based on pixel scale and driving factors (P, T, SR, SH, and U ) was carried out [44,45]. The calculation formula of correlation coefficient is as follows:
R x y = i = 1 n x i x ¯ y i y ¯ i n x i x ¯ 2 · i = 1 n y i y ¯ 2
where R x y represents the correlation coefficient of variables x and y, x i represents the ET value/mm of the i−th year, y i represents the value of driving factors in year i, and x ¯ and y ¯ represent the average values of ET and drivers in n years, respectively. The value of correlation coefficient R x y is between [−1, 1], and R x y = 0 indicates that the two variables are not correlated. The closer the R x y value is to 1, the stronger the positive correlation is; the further it is from 1, the stronger the negative correlation is.
The significance of the correlation coefficients between each driver and ET was tested on the pixel scale by consulting the table of critical values of correlation coefficients.

2.3.3. Normalized Multiple Linear Regression Analysis

The normalized multiple linear regression analysis can analyze the combined effects of various influencing factors on ET and their respective weights, which had been used previously with good results [46,47]. In this study, the normalized multiple linear regression analysis was used to distinguish the influence of each climatic driving factor (P, T, SR, SH, and U ) on ET, and the driving factor with the highest absolute value of the standard regression coefficient was selected as the dominant factor influencing the ET change in the image element, so as to quantify the relative contribution of climatic factors to ET change. The calculation formula is as follows:
Y = β p r e c × P + β t e m p × T + β s r a d × S R + β s h u m × S H + β w i n d × u 10 + ε
where Y represents ET, and P, T, SR, SH, and U represent precipitation, air temperature, solar radiation, specific humidity, and wind speed, respectively. β p r e c , β t e m p , β s r a d , β s h u m , and β w i n d are standard regression coefficients, and ε is the error term.

3. Results

3.1. Temporal and Spatial Variation Characteristics of ET in the YRB

3.1.1. Interannual Variation Characteristics of ET

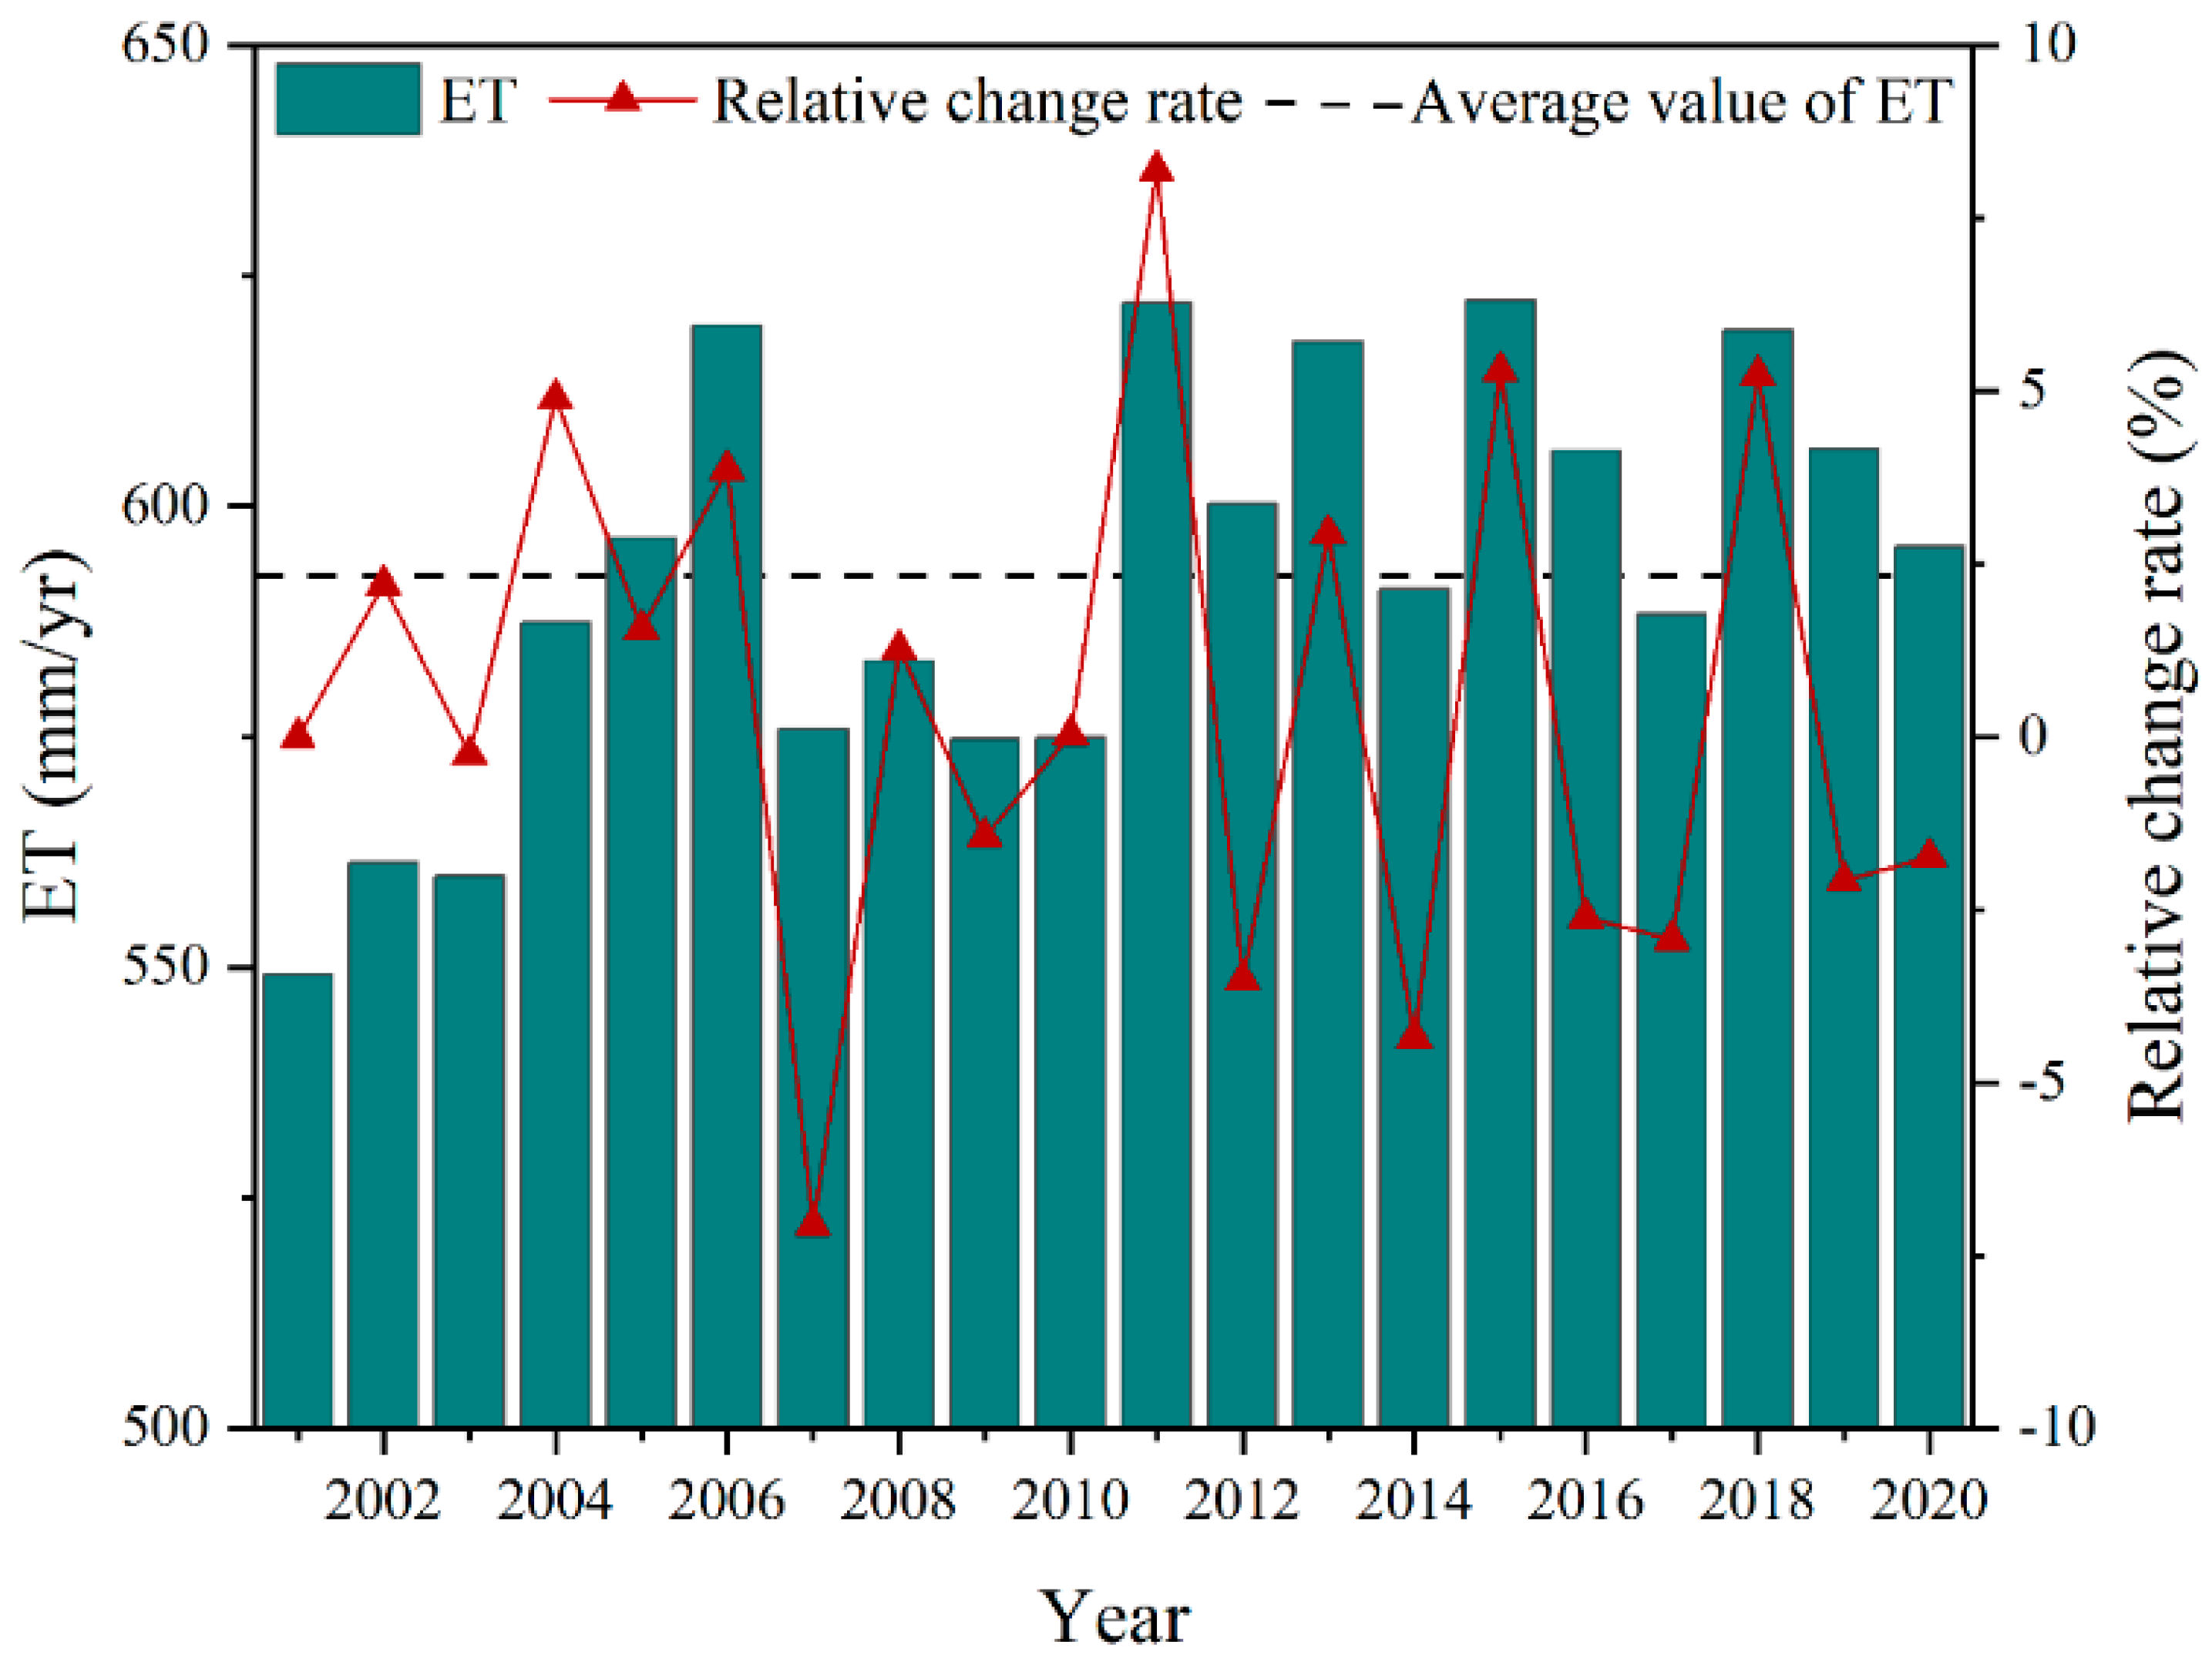
The annual distribution of ET and the interannual variation of average ET in the YRB from 2001 to 2020 are shown in Figure 2. The varied range of the annual average value of ET in the YRB from 2001 to 2020 was 549.23−622.34 mm/yr, and the average value of multi-year average annual ET was 592.58 mm/yr (dotted line in Figure 2). The years in which the annual average ET values exceeded the multi-year average annual ET value were 2005 (596.53 mm/yr), 2006 (619.59 mm/yr), 2011 (622.07 mm/yr), 2012 (600.26 mm/yr), 2013 (617.87 mm/yr), 2015 (622.34 mm/yr), 2016 (606.09 mm/yr), 2018 (619.10 mm/yr), 2019 (606.19 mm/yr), and 2020 (595.64 mm/yr). The minimum ET value occurred in 2001 with 549.23 mm, and the maximum value was 622.34 mm in 2015, and the difference between the highest and lowest interannual ET values was 73.11 mm. The relative change rate of the interannual average ET fluctuated significantly over the study time period, with a maximum of 8.20% (2011) and a minimum of −7.06% (2007). The average relative change rate was 0.48%, showing an overall upward trend.
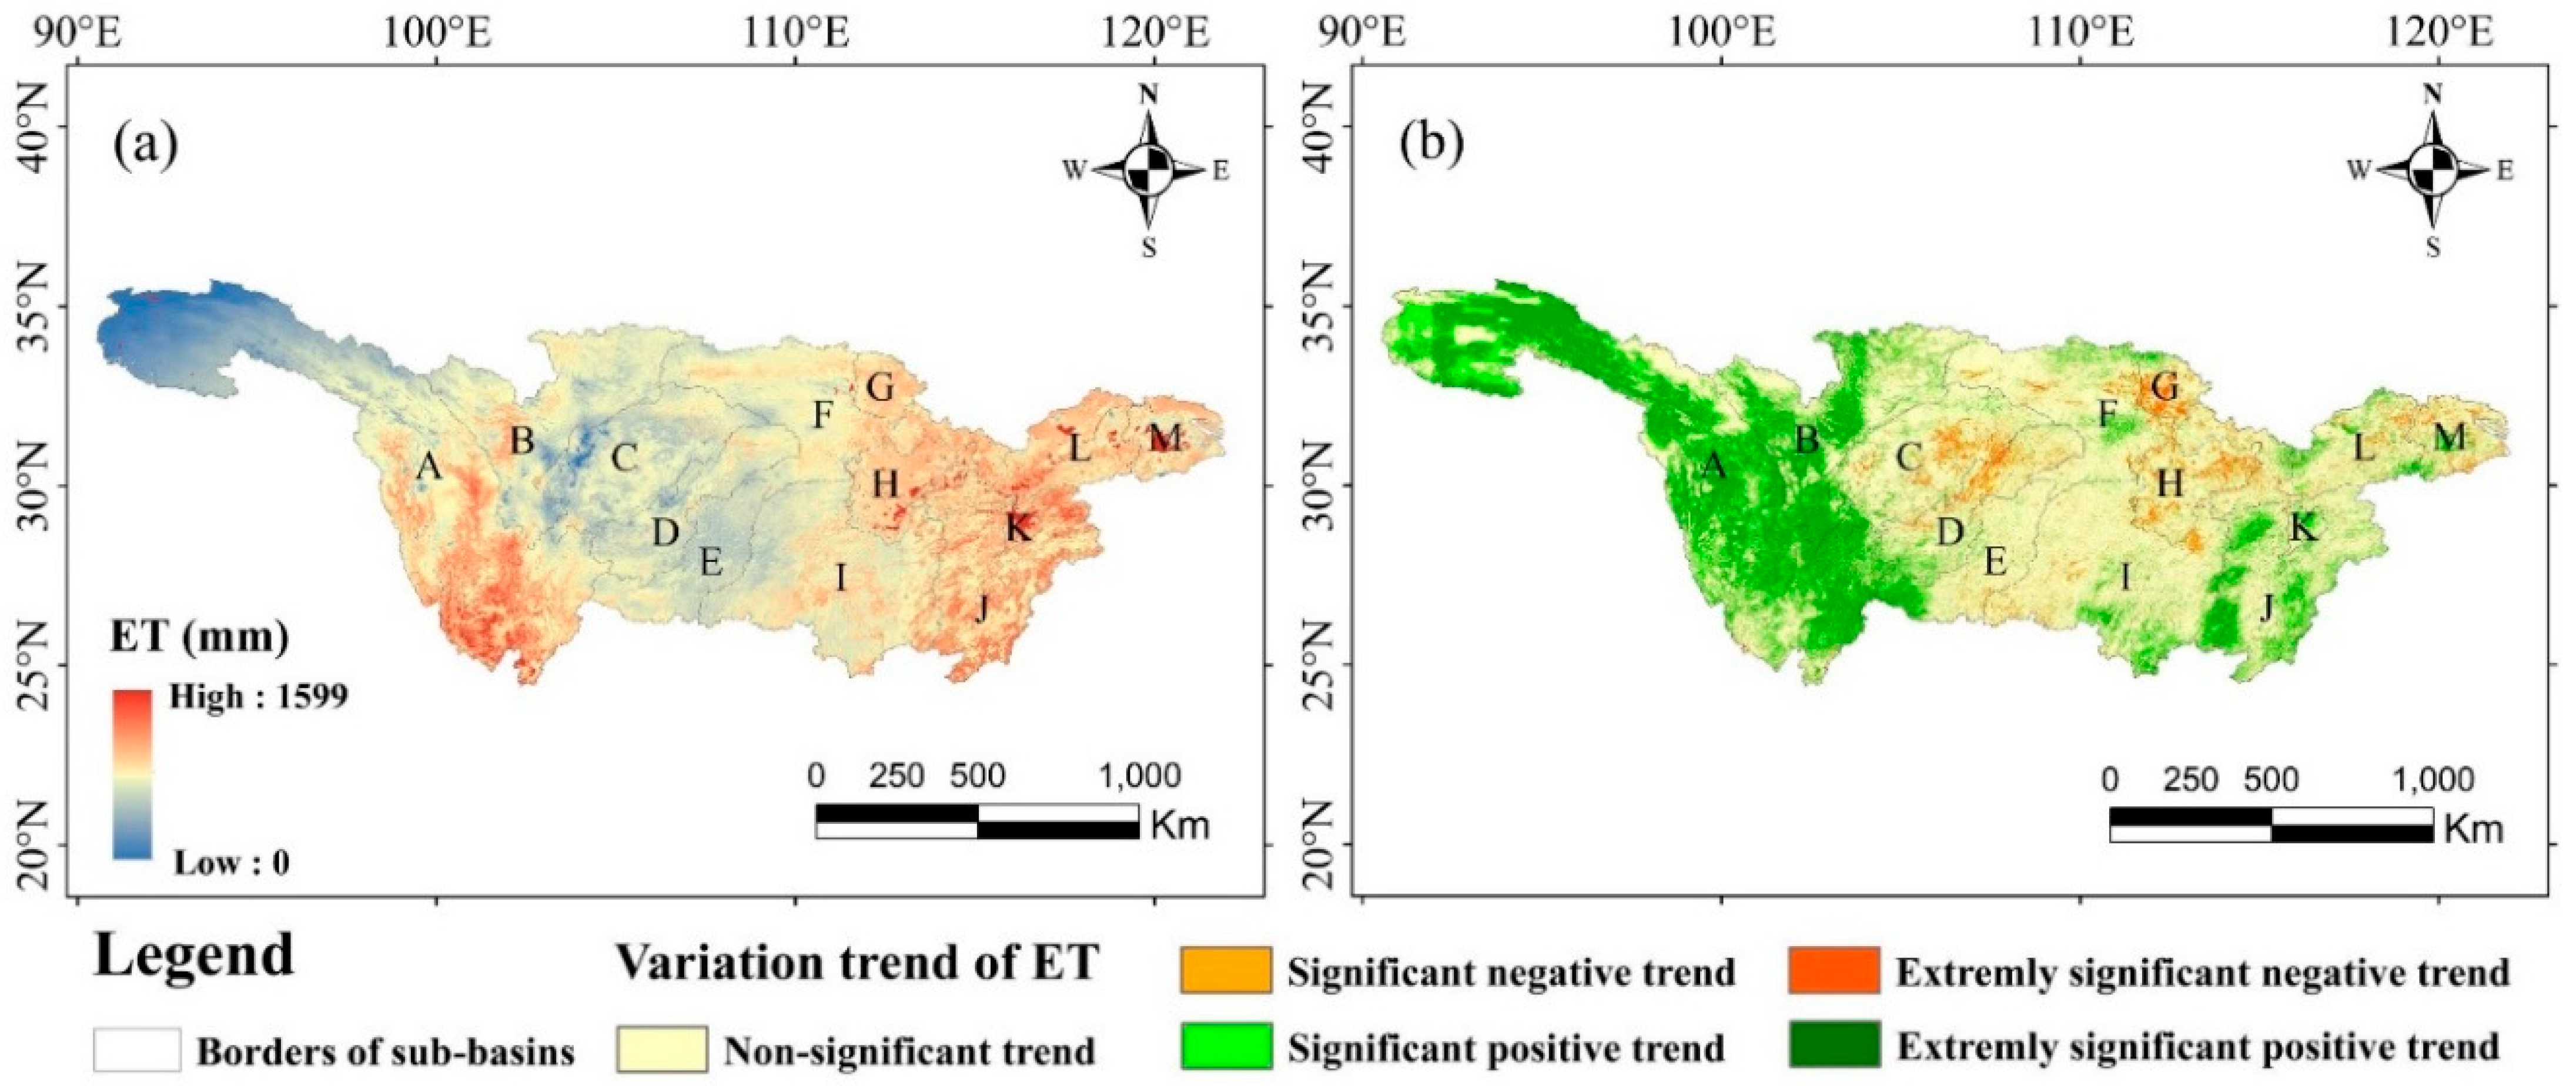
As shown in Figure 3a, the average value of ET in the YRB in the last 20 years ranged from 0 to 1599 mm, with significant geographical differences, generally showing high values in the east and southwest and low values in the central and northwest. Among them, the five sub-basins with the largest annual ET were K (831.8 mm), H (688.88 mm), L (684.86 mm), J (684.54 mm), and M (671.64 mm) in order from large to small. From the perspective of spatial distribution, these five sub-basins were all distributed in the eastern part of the YRB. The sub-basins with the smallest annual ET were C (531.19 mm), E (532.55 mm), and D (550.13 mm) from small to large, all of which were located in the middle of the YRB. It is worth noting that the plateau peaks in the northern high−altitude regions of sub-basin A were covered with snow all the year round, which made the average annual ET in this area generally lower than 500 mm, while the average annual ET was generally higher in the southern area of this sub-basin.
As shown in Figure 3b, the variation trend of ET in most areas of the YRB was not significant, accounting for 58.10% of the total area. The ET of 34.99% of the areas showed a significant or extremely significant increase trend, of which the significant increase area accounted for 12.50%, and the extremely significant increase area accounted for 22.49%, which were mainly distributed in most areas of sub-basin A, B, and J. The ET of 6.90% of the areas showed a significant or extremely significant decrease trend, of which the significant reduction area accounted for 3.83%, and the extremely significant reduction area accounted for 3.07%, which were mainly distributed in parts of sub-basin C, H, and G. In general, the average value of the Z statistic was 0.97, which showed a certain increasing trend.

3.1.2. Variation Characteristics of ET during the Year

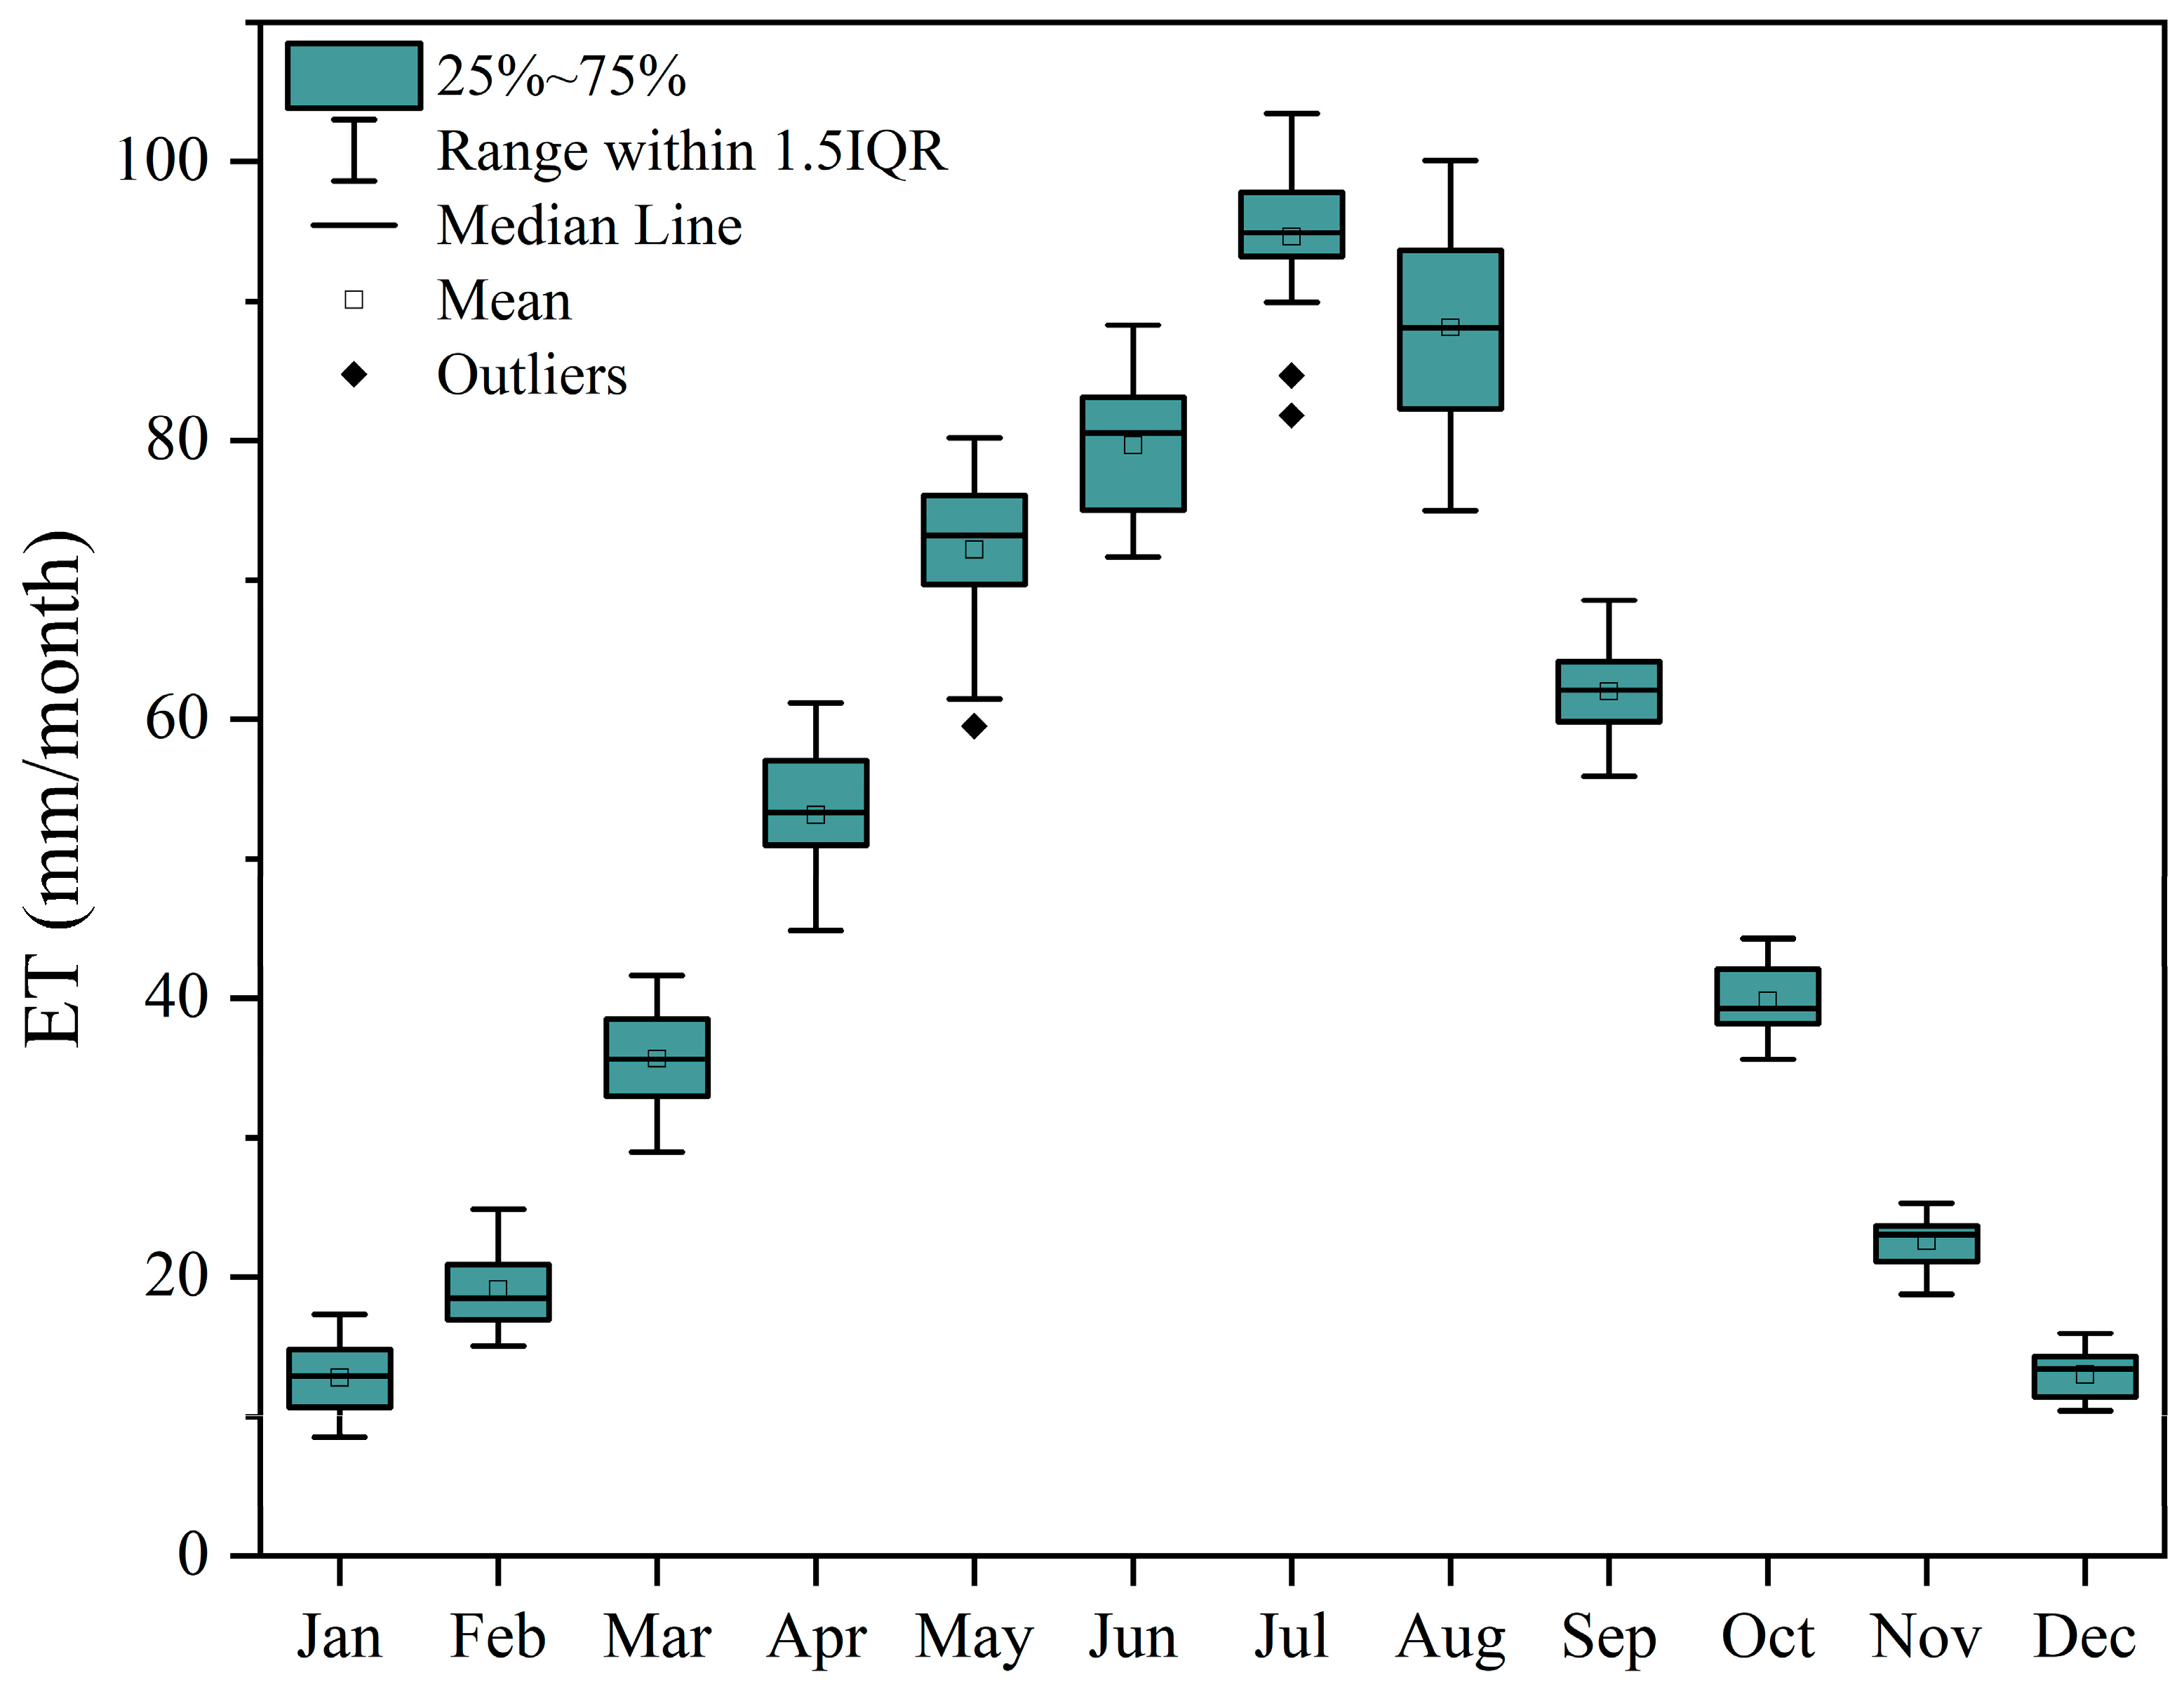
As shown in Figure 4, the monthly average ET values in the study area for the past 20 years ranged from 12.79 to 94.63 mm and presented a single peak periodic variation trend. ET showed an increase followed by a decrease from January to December, i.e., it fluctuated up from January, reached a maximum in July, and fluctuated down from August to November, while the value of ET from December to February was generally low, with a monthly average value of only about 15 mm.
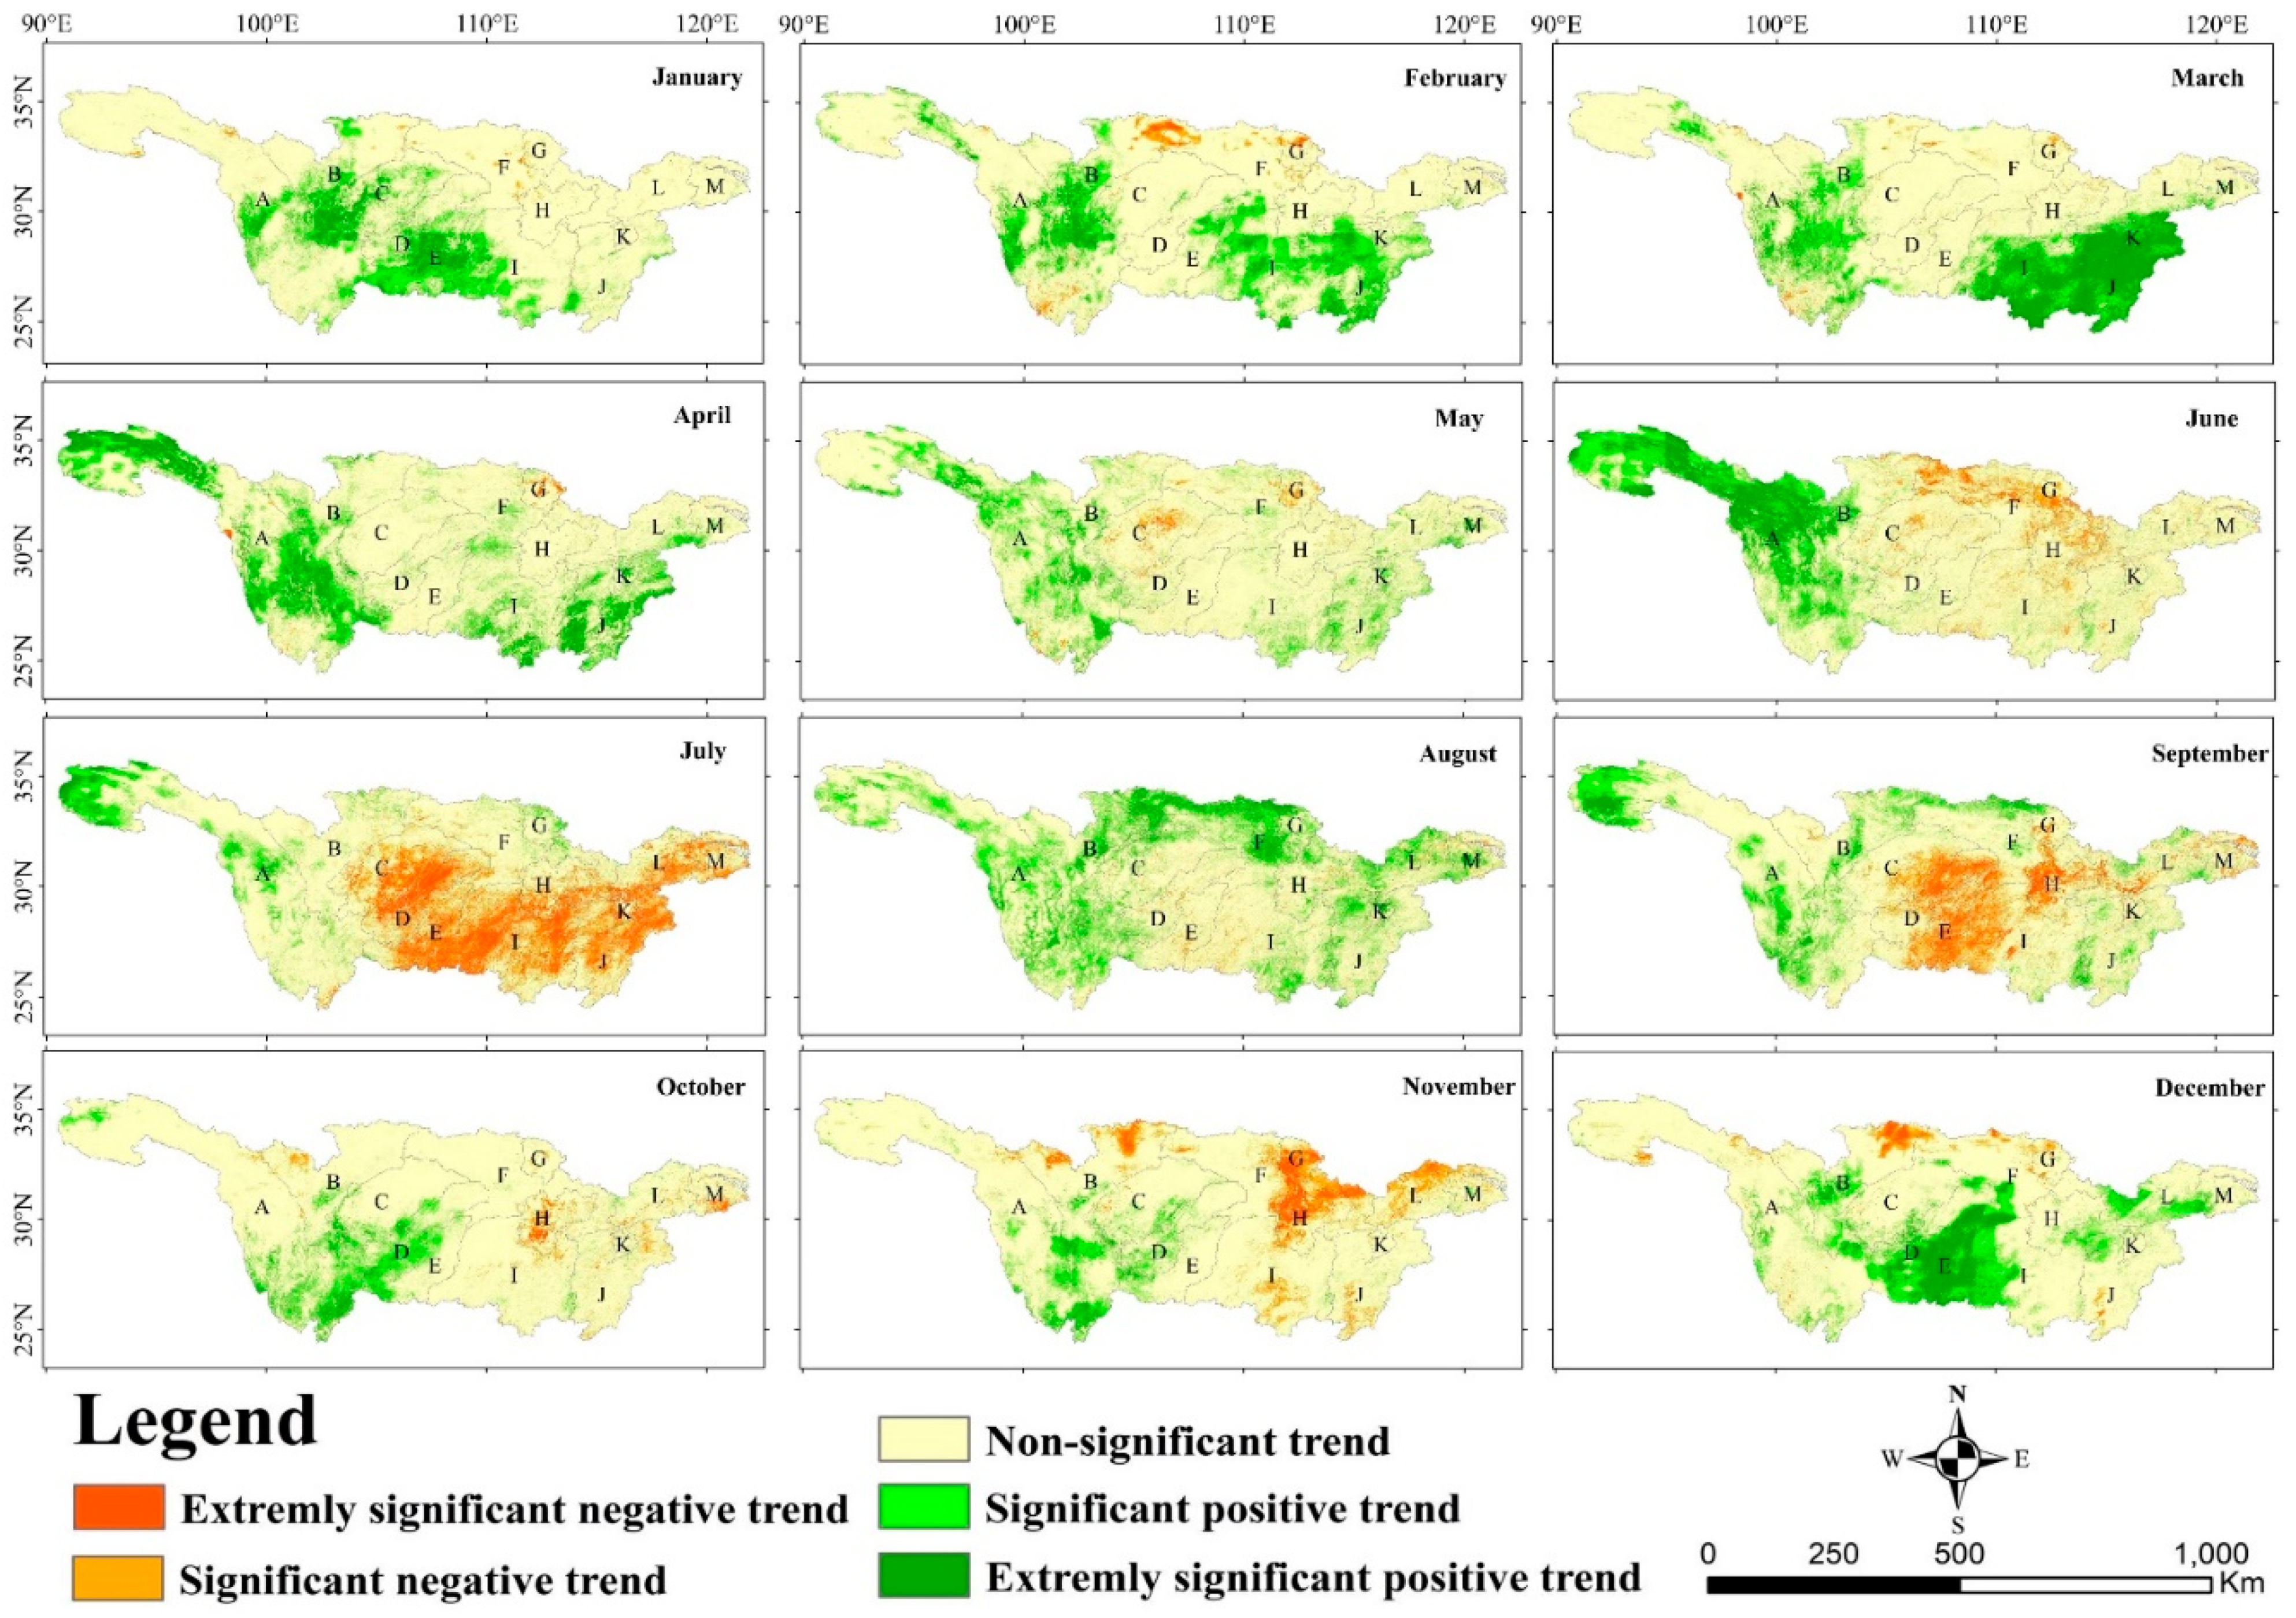
It could be found that the variation of ET in the YRB was significantly different in different months (Figure 5), and there was a trend of significant or extremely significant increase in January to April, June, and December in a large area. ET decreased significantly or extremely significantly in July and November and was mainly distributed in the middle and lower reaches of the YRB. However, the change in ET was not obvious in most regions. The interannual variation trend of ET showed an increasing trend in most regions of the headwaters of the YRB. However, the trend of monthly ET variation in the headwaters of the YRB mostly showed an increase or non-significant change. In April, June, July, and September, ET in the headwaters of the YRB showed an increasing trend in large areas, and, only in December, ET in a very few areas showed a decreasing trend. At the annual scale, the ET changes in most of the middle reaches of the YRB were not obvious, and there were also a few regions with decreasing ET changes, and they were mainly distributed in sub−basin C. However, at the monthly scale, the ET in the middle reaches of the YRB decreased intensively in July, September, and November and increased intensively in January, February, and December. At the annual scale, ET change in the lower reaches of the YRB mainly showed a non-significant trend, and there were a few areas in sub-basin J where the ET showed an increasing trend. There were very few areas with decreasing ET change, and they were sporadically distributed in sub−basin L and the Yangtze River Delta. The study showed that the ET in the lower reaches of the YRB decreased intensively in July and increased intensively in in March, April, and August. Compared with the study of interannual ET trends in the YRB, it can be found that the study of monthly ET variation shows the variation of ET in more detail.

3.2. Correlation Analysis between ET and Driving Factors

3.2.1. Correlation Analysis between Air Temperature and ET

As shown in Figure 6a, the statistical analysis showed that the correlation coefficient between ET and T ranged from −0.55 to 0.77 at the annual scale, with a spatially averaged correlation coefficient of 0.19, which meant the correlation between ET and T was more often positive. According to the distribution diagram of significance test of the correlation between T and ET at the annual scale (Figure 6b), it could be seen that the area with significant and extremely significant positive correlation between ET and T accounted for 12.46% in the study area, and the area with extremely significant positive correlation accounted for 3.04%, concentrated in the middle of the YRB. There was no extremely significant negative correlation between T and ET in the whole YRB, and the area with significant negative correlation only accounted for 0.17% of the total area of the basin. However, there were more areas with non-significant correlation between ET and T, accounting for 87.38% of the total area of the YRB.
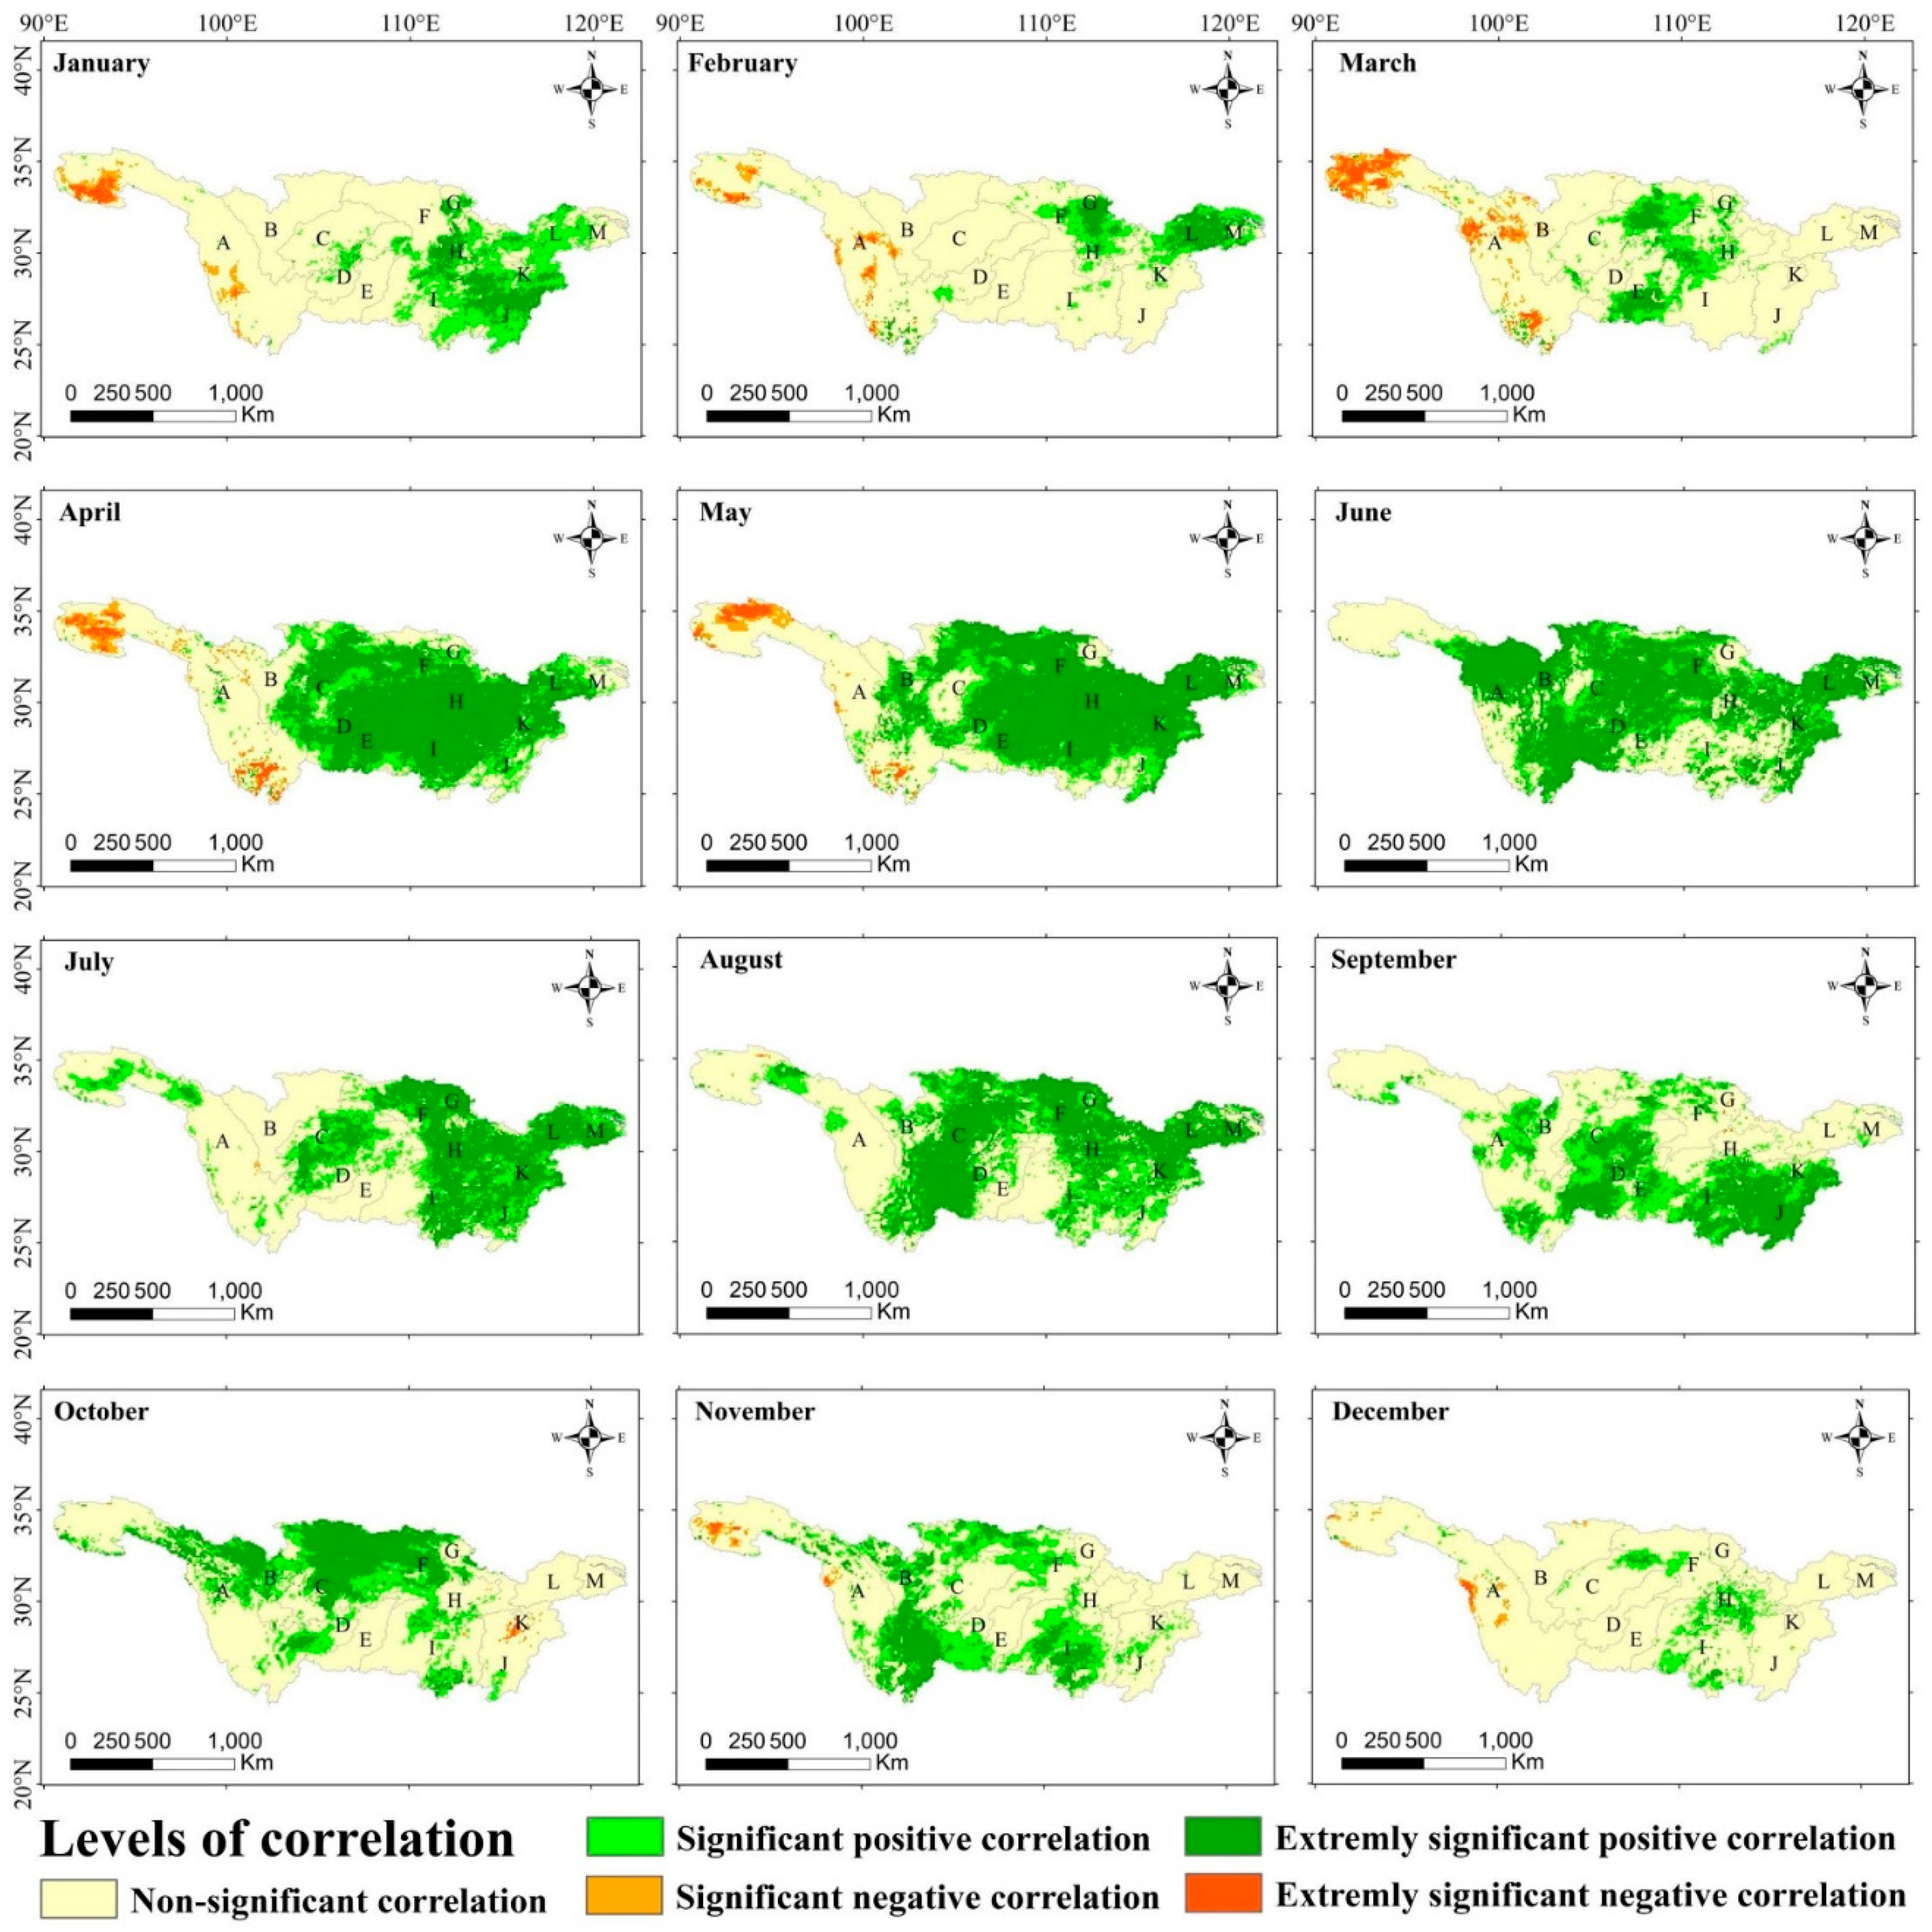
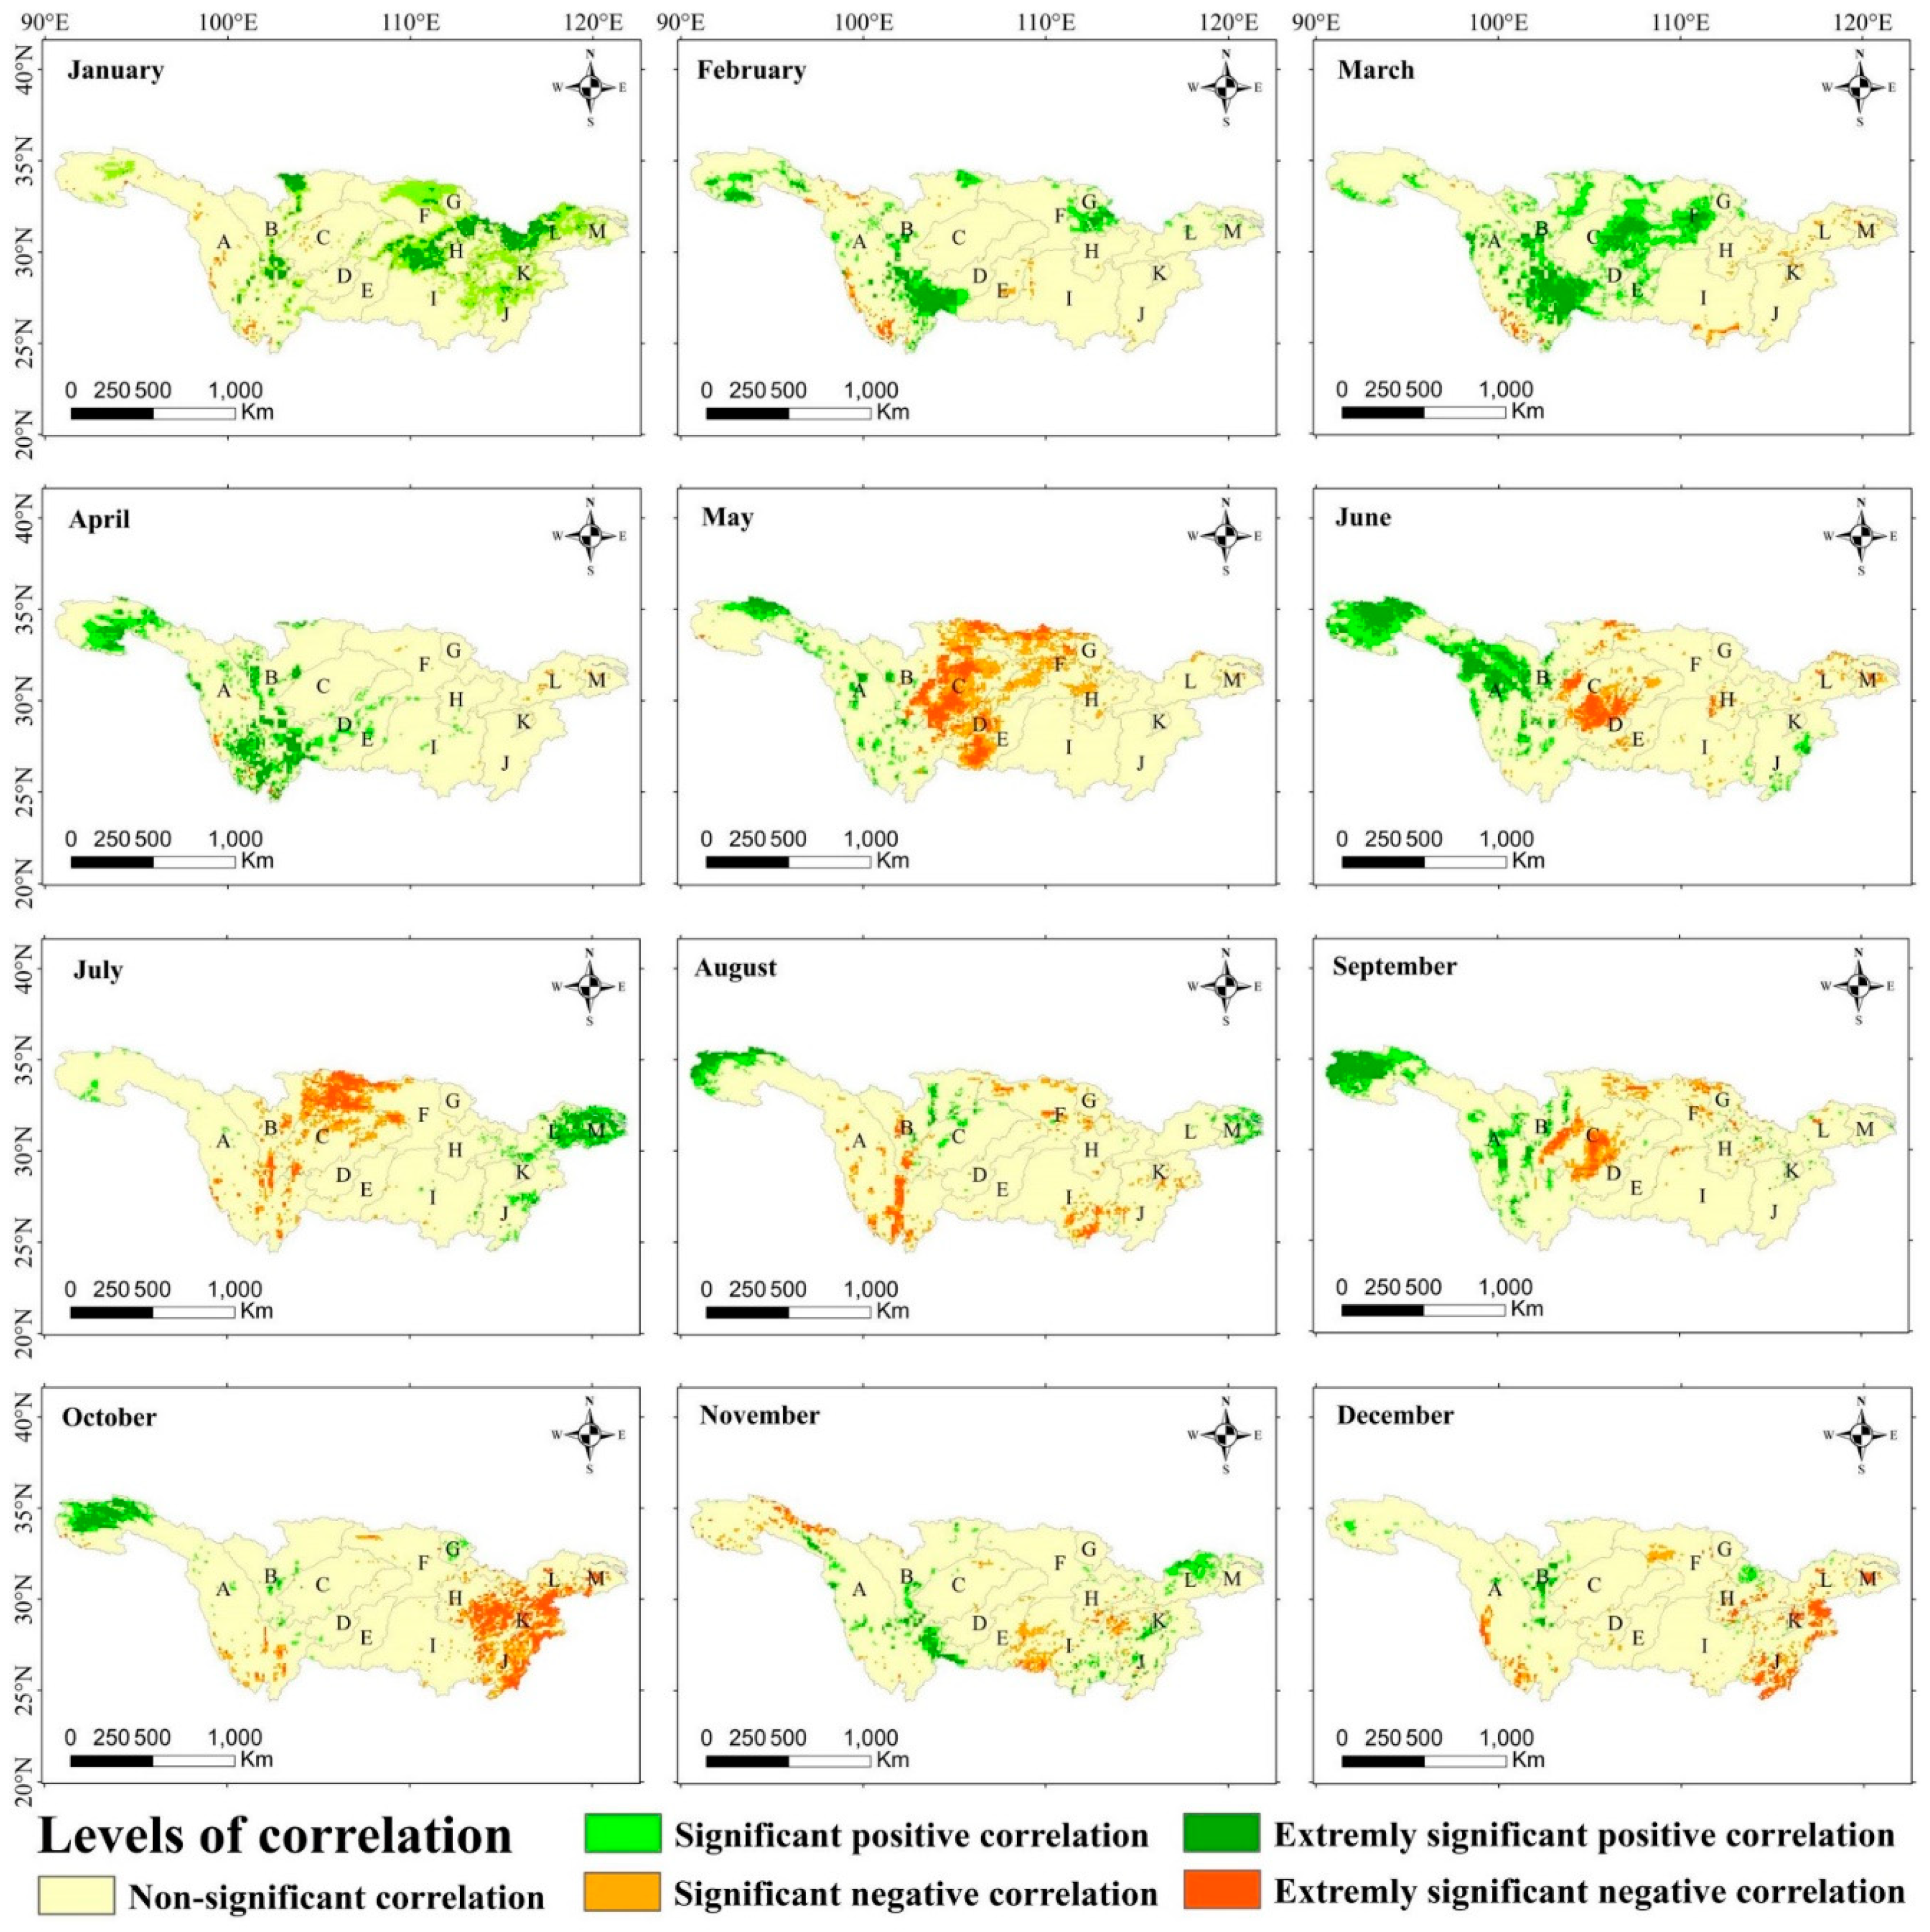
As shown in Figure 7, it could be seen that the heterogeneity of the correlation between ET and T for the 12 months in the YRB was significant. The regions with positive correlation between T and ET in January were mainly distributed in the lower reaches of the YRB. With the change in months, the T in the YRB gradually increased, and the area where they were positively correlated gradually expanded to the middle and upper reaches until summer (June to August). It could be seen that the regions with positive correlation between the two occupied the vast majority of the YRB, about 60%. Then, as the month increased, the T in the YRB began to decrease, and the area where the two were positively correlated began to gradually decrease, while in the following January, the area where the T and ET were positively correlated began to gradually expand again, and the correlation between the two showed an obvious cyclical change.

3.2.2. Correlation Analysis between Precipitation and ET

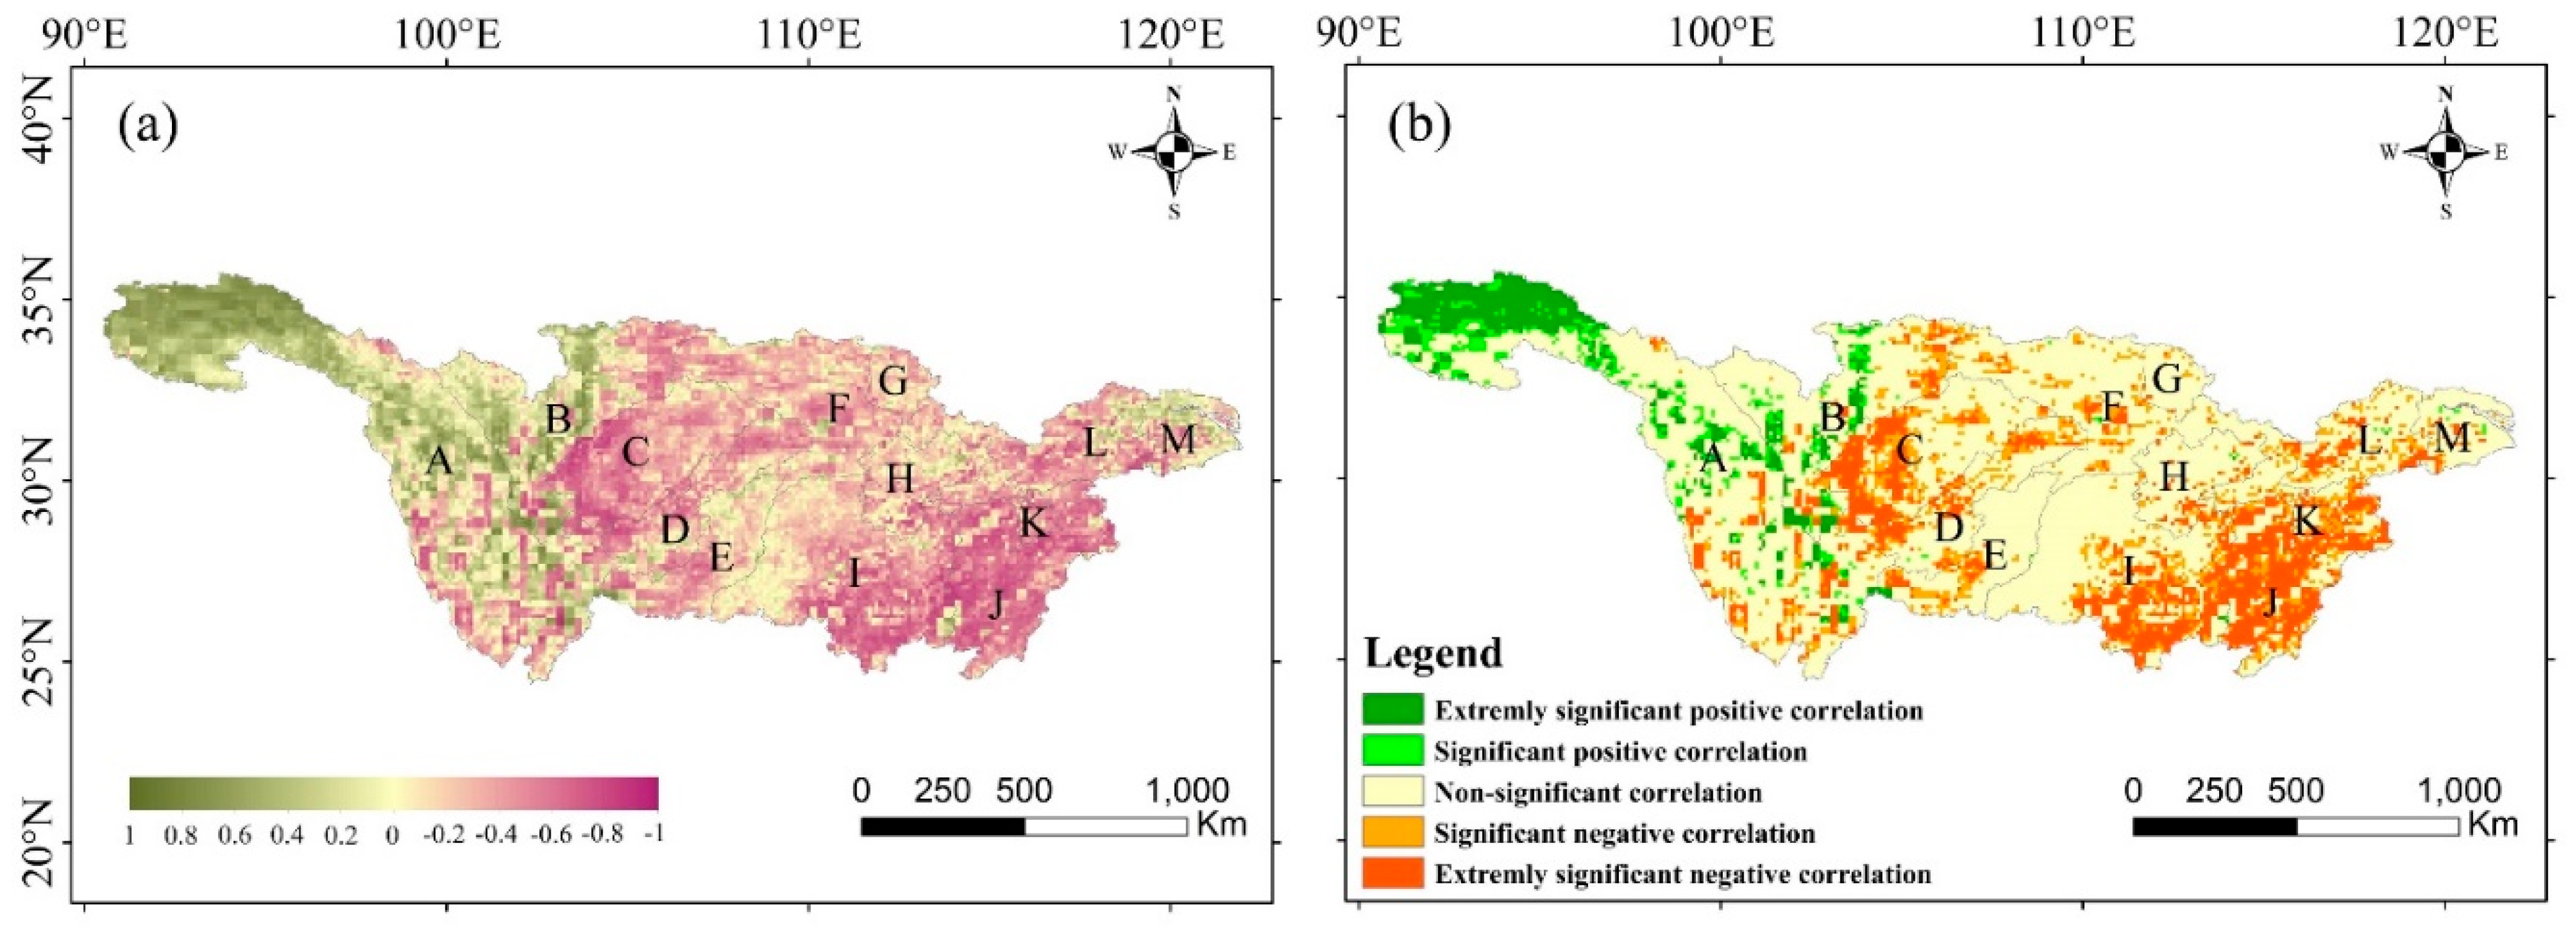
As shown in Figure 8a, the correlation coefficient between ET and P ranged from −0.86 to 0.75, with a spatially averaged correlation coefficient of −0.25, which meant the correlation between ET and P was more often negative. The area with significant and extremely significant positive correlation between ET and P accounted for 2.34% in the study area, and the area with extremely significant positive correlation accounted for 0.49%; they were concentrated in the source of the YRB (Figure 8b). The areas with significant and extremely significant negative correlation accounted for 25.43% of the total area, and the regions with extremely significant negative correlation accounted for only 10.16%, mainly distributed in the middle and lower reaches of the YRB and the southwest part of sub−basin A. However, there were more areas with non-significant correlation between ET and P accounting for 72.23% of the YRB.
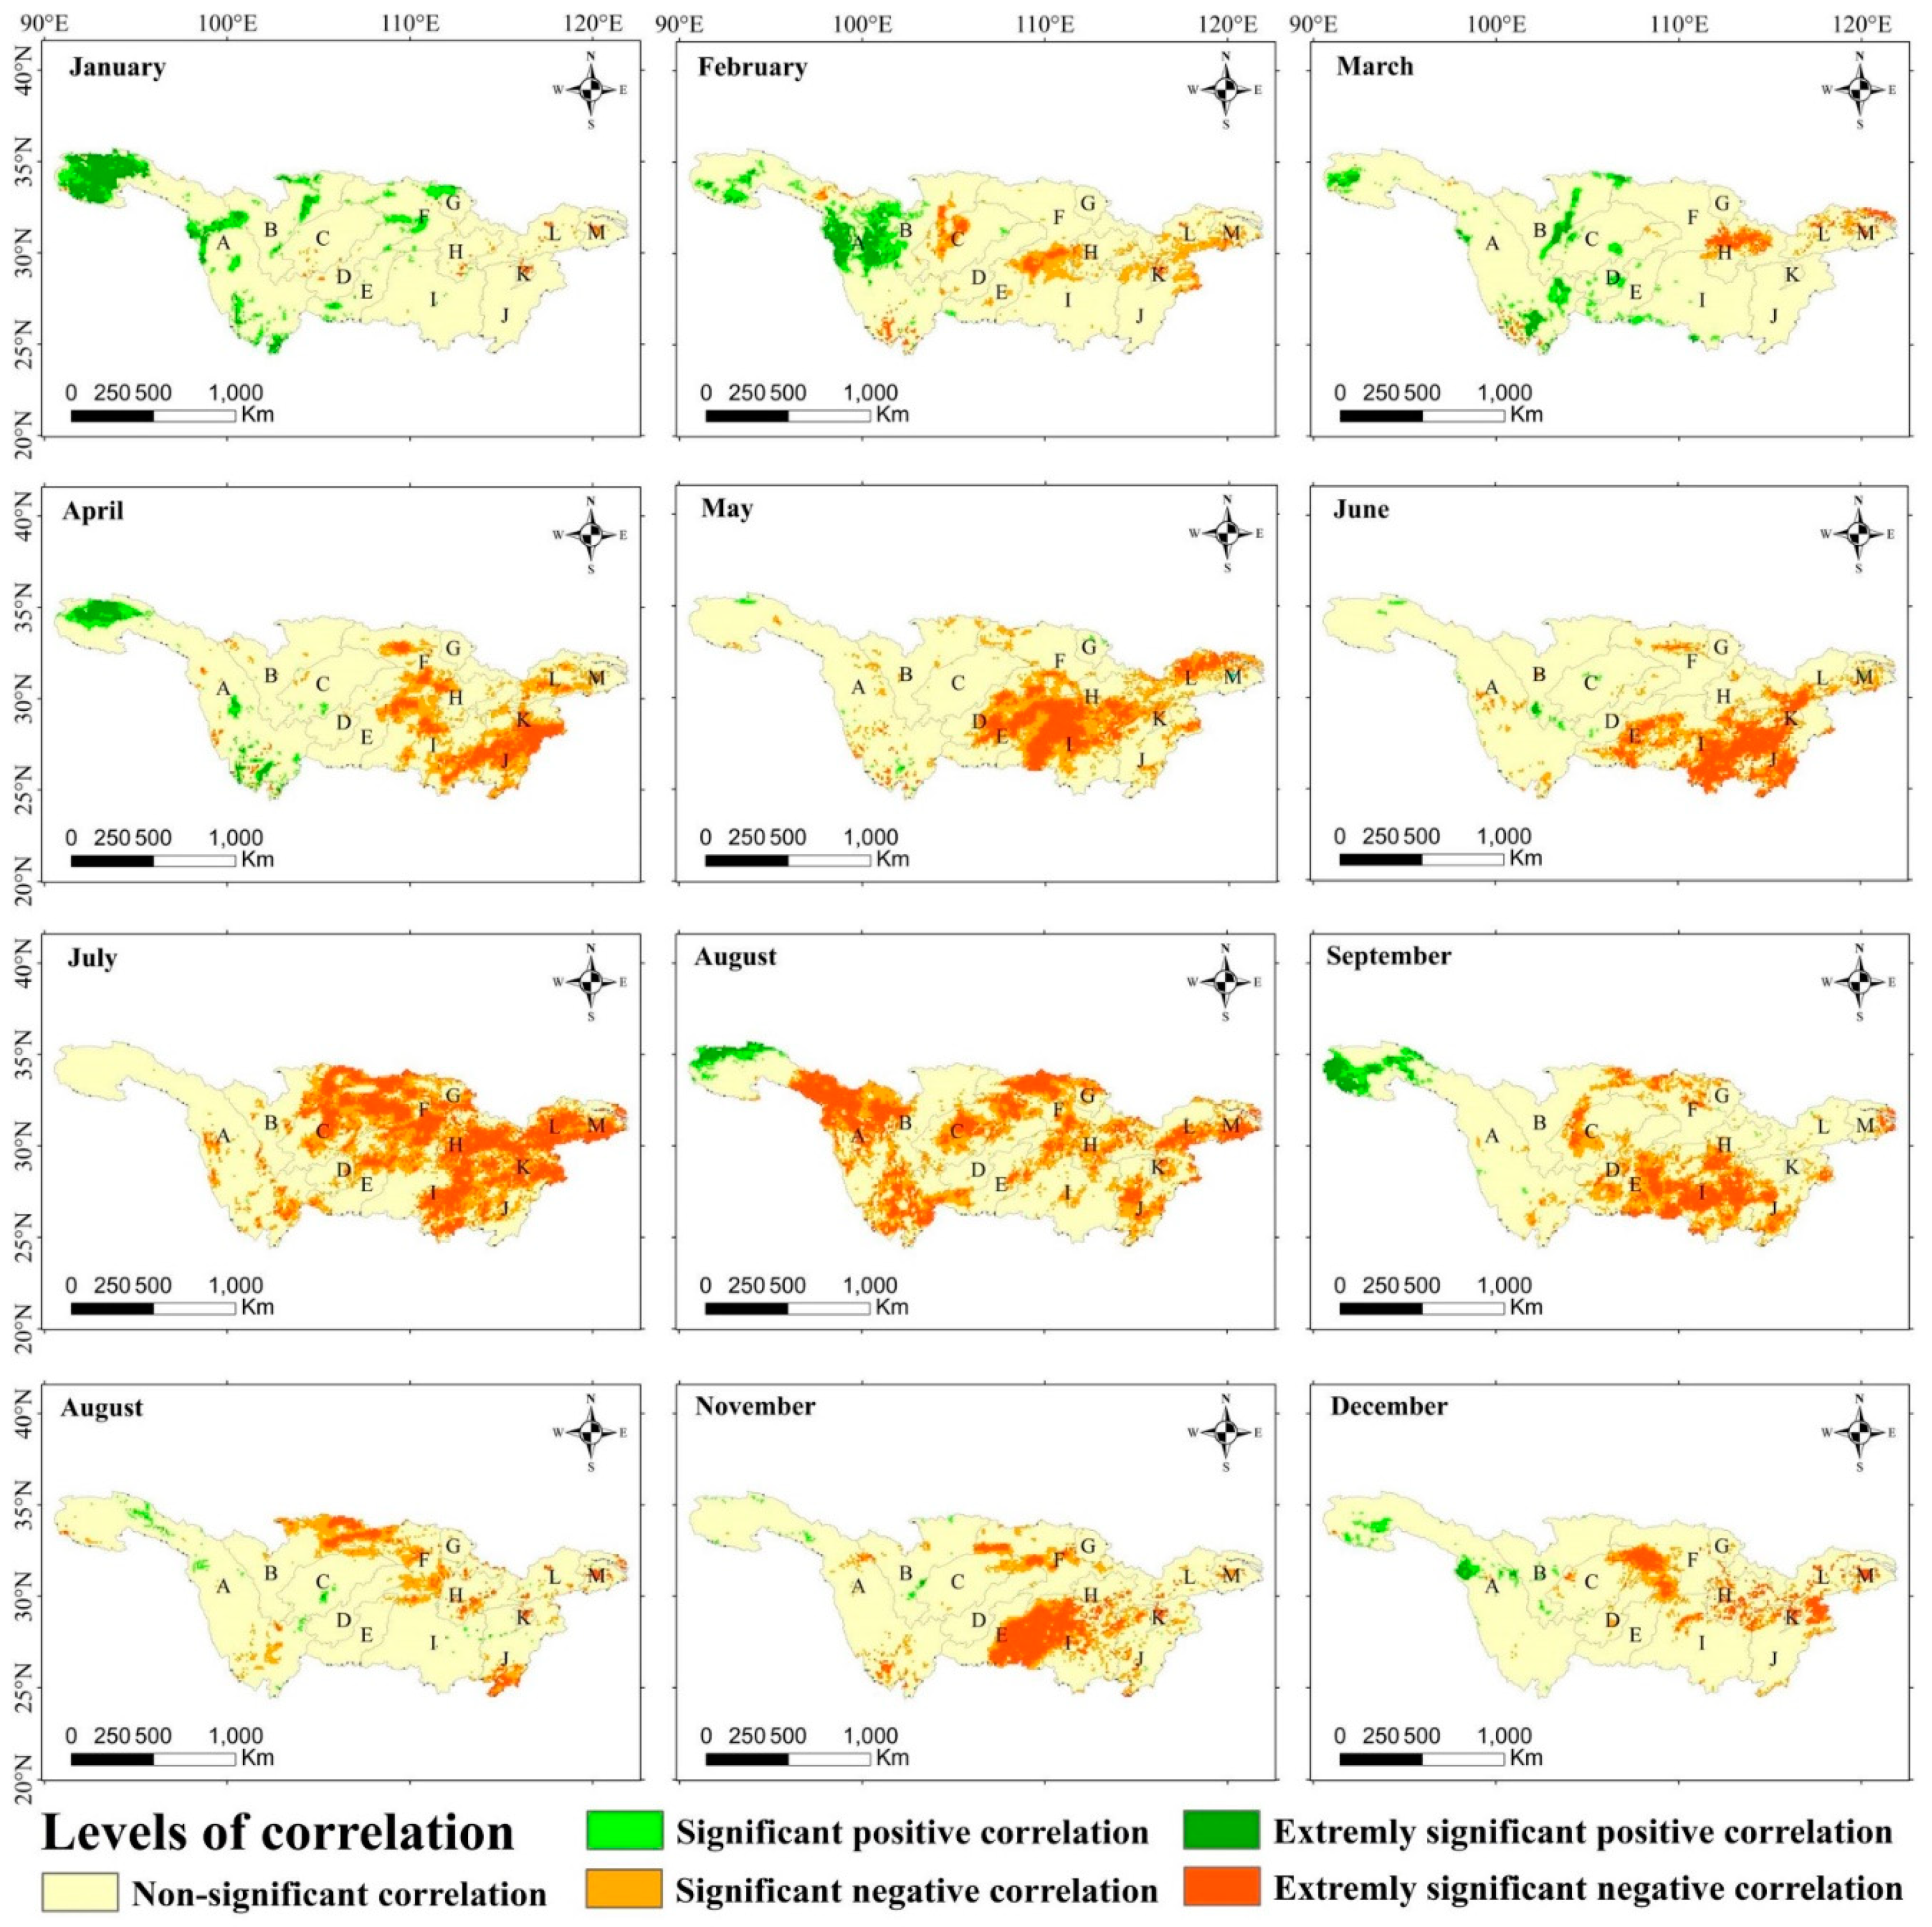
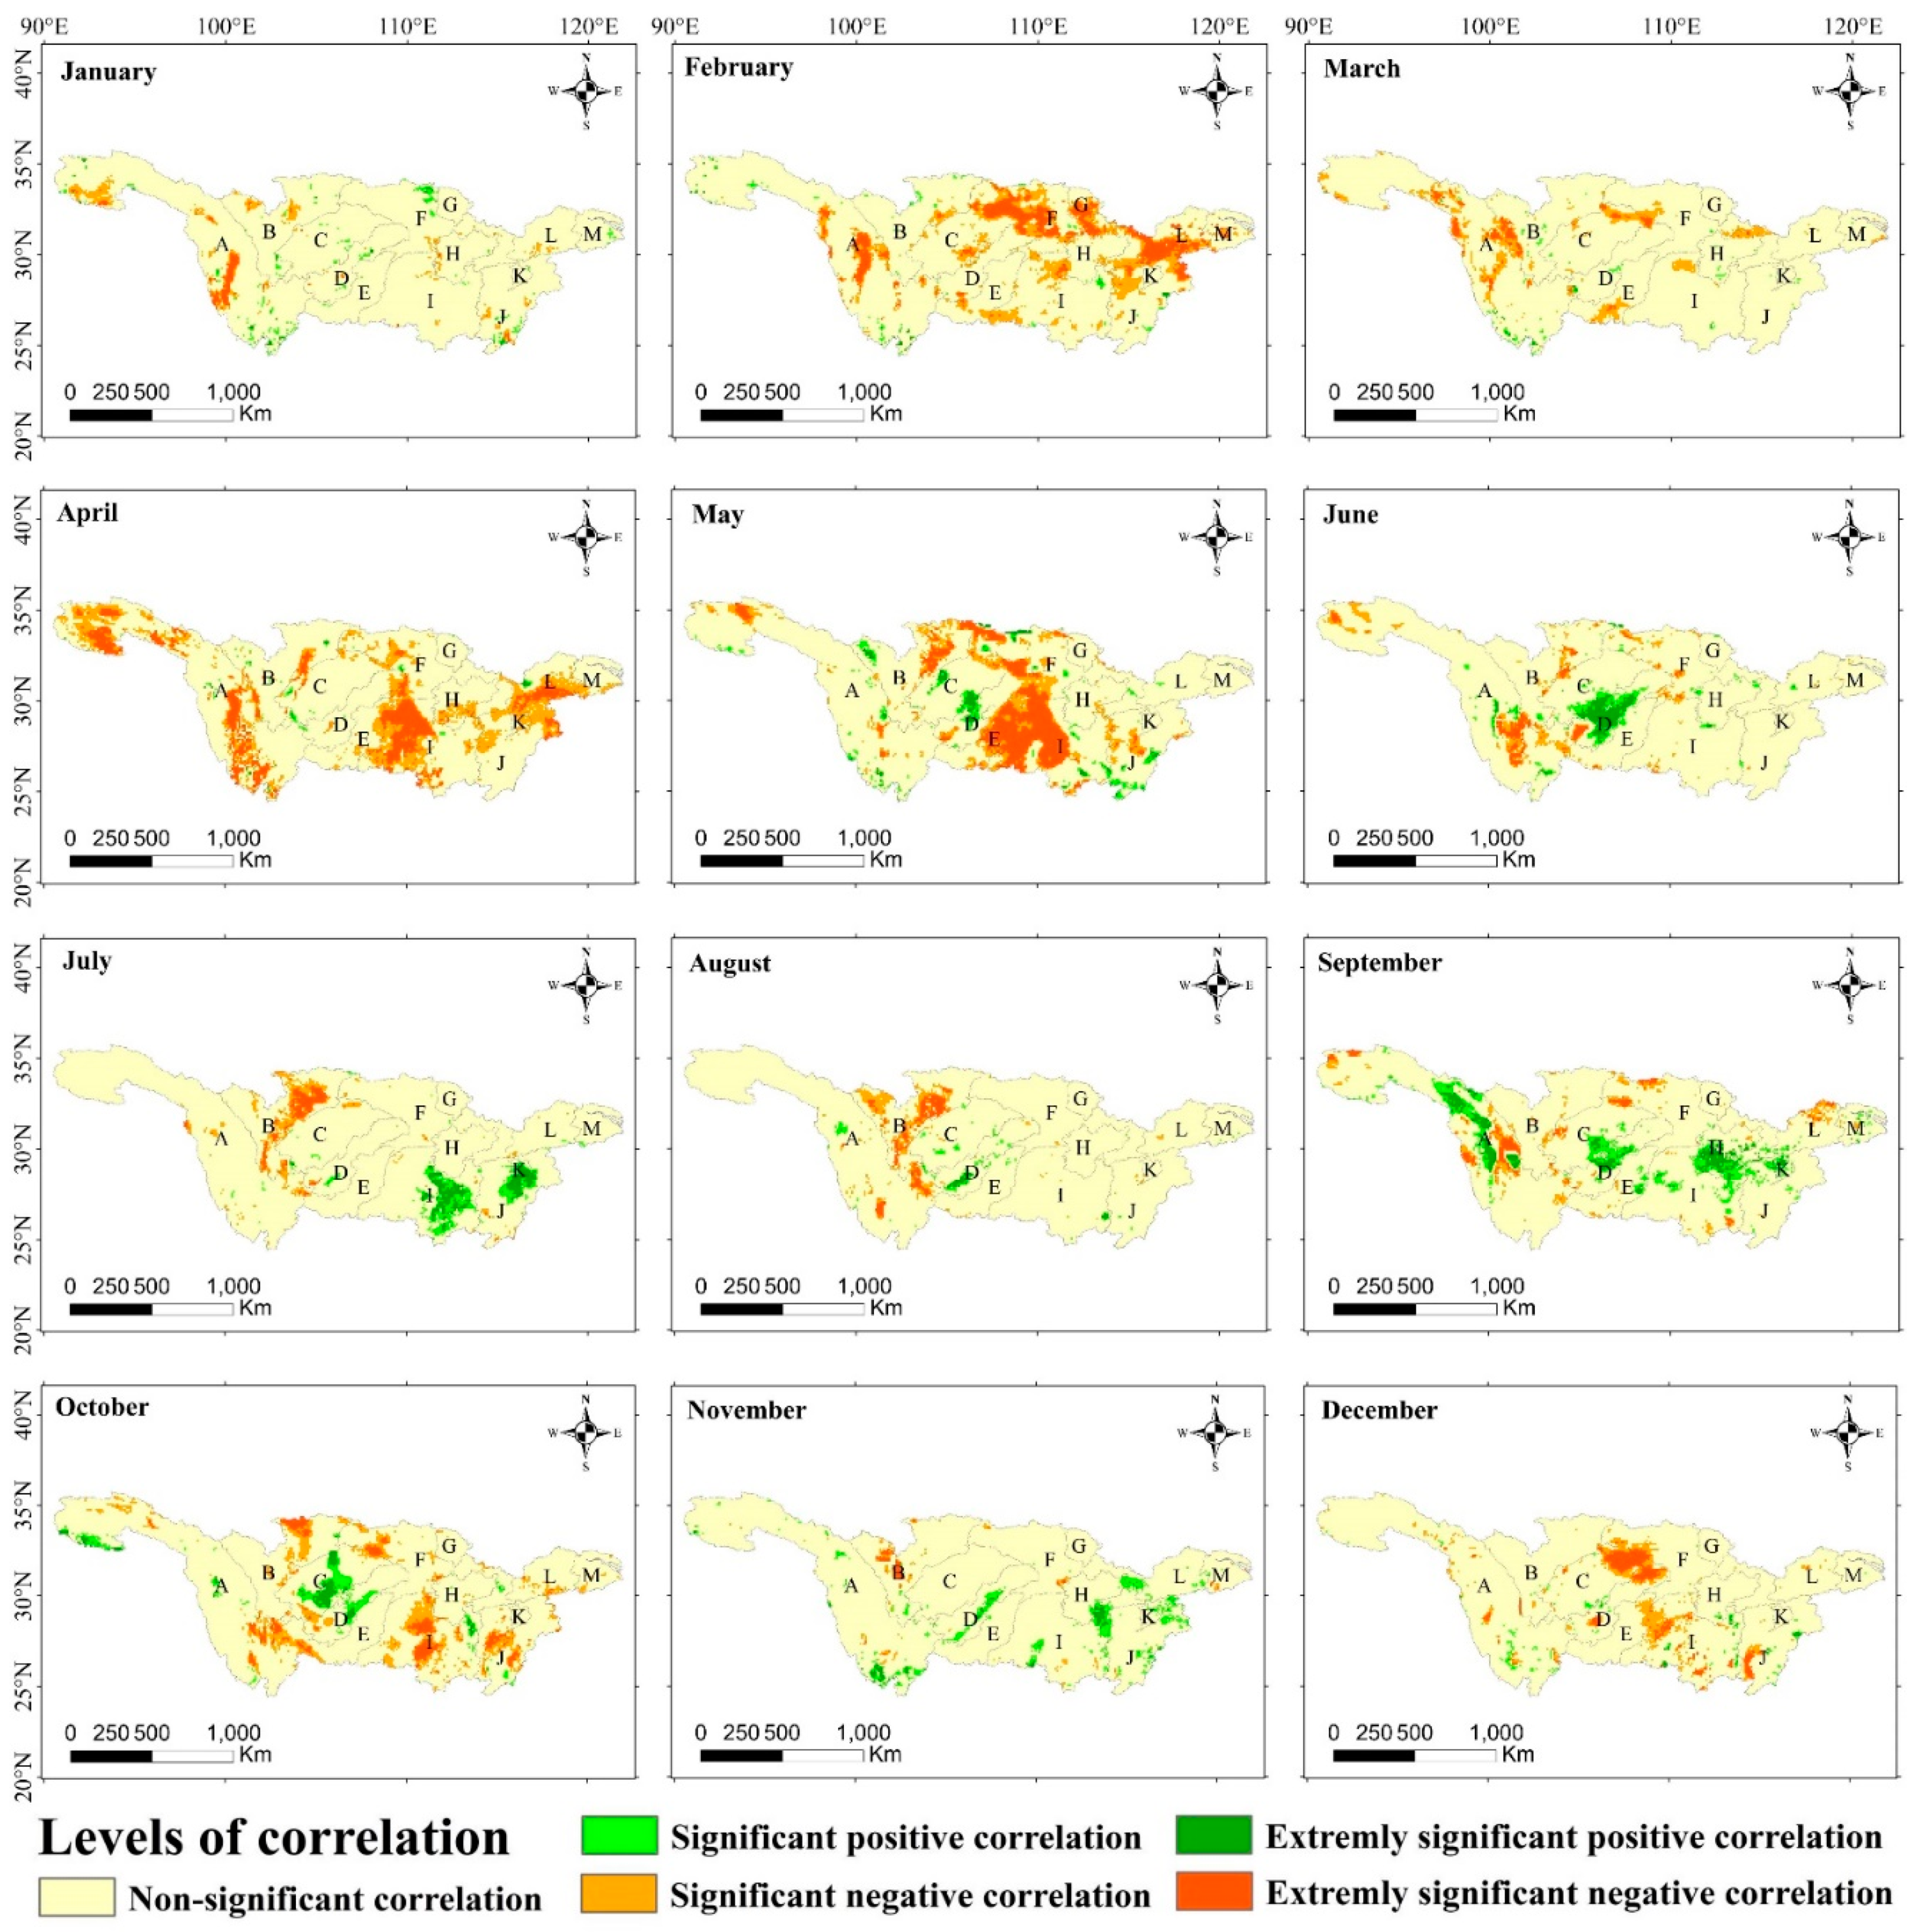
Similarly, the heterogeneity of the correlation between ET and P for the 12 months in the YRB was significant (Figure 9). There were few areas where P was positively correlated with ET, and most of them were distributed in the headwaters and upper reaches of the YRB, with the highest proportion of 12% in January and then gradually decreased until July, which was the lowest in the whole year, accounting for only 0.02% of the total basin area, and then fluctuated below 4%. The area with significant positive correlation between P and ET mainly existed from January to April of the year with low T in time and was mainly distributed in the headstream of the YRB in spatial pattern.
As a whole, P was mainly negatively correlated with ET, and the proportion of the regions with negative correlation was the lowest in January, accounting for only 1.11%, then fluctuated up to July, reaching 45.2%, and then fluctuated down from August to December. The regions with negative correlation were mainly in the middle and lower reaches of the YRB, while they were also distributed in the upper reaches in July and August.

3.2.3. Correlation Analysis between Solar Radiation and ET

The correlation coefficient between ET and SR ranged from −0.58 to 0.90, with a spatially averaged correlation coefficient of 0.32, which meant the correlation between ET and SR was more often positive (Figure 10a). According to statistics 33.61% of the area with significant and extremely significant positive correlation between ET and SR, and 20.15% of the area with extremely significant positive correlation was concentrated in the central region of the YRB (Figure 10b). The areas with significant and extremely significant negative correlation were very few, accounting for only 0.81%, among which the areas with extremely significant negative correlation tended to be close to 0, accounting for only 0.06% of the area, mainly distributed in the UYRB. However, the areas with non−significant correlation between ET and SR accounted for 65.57% of the YRB.
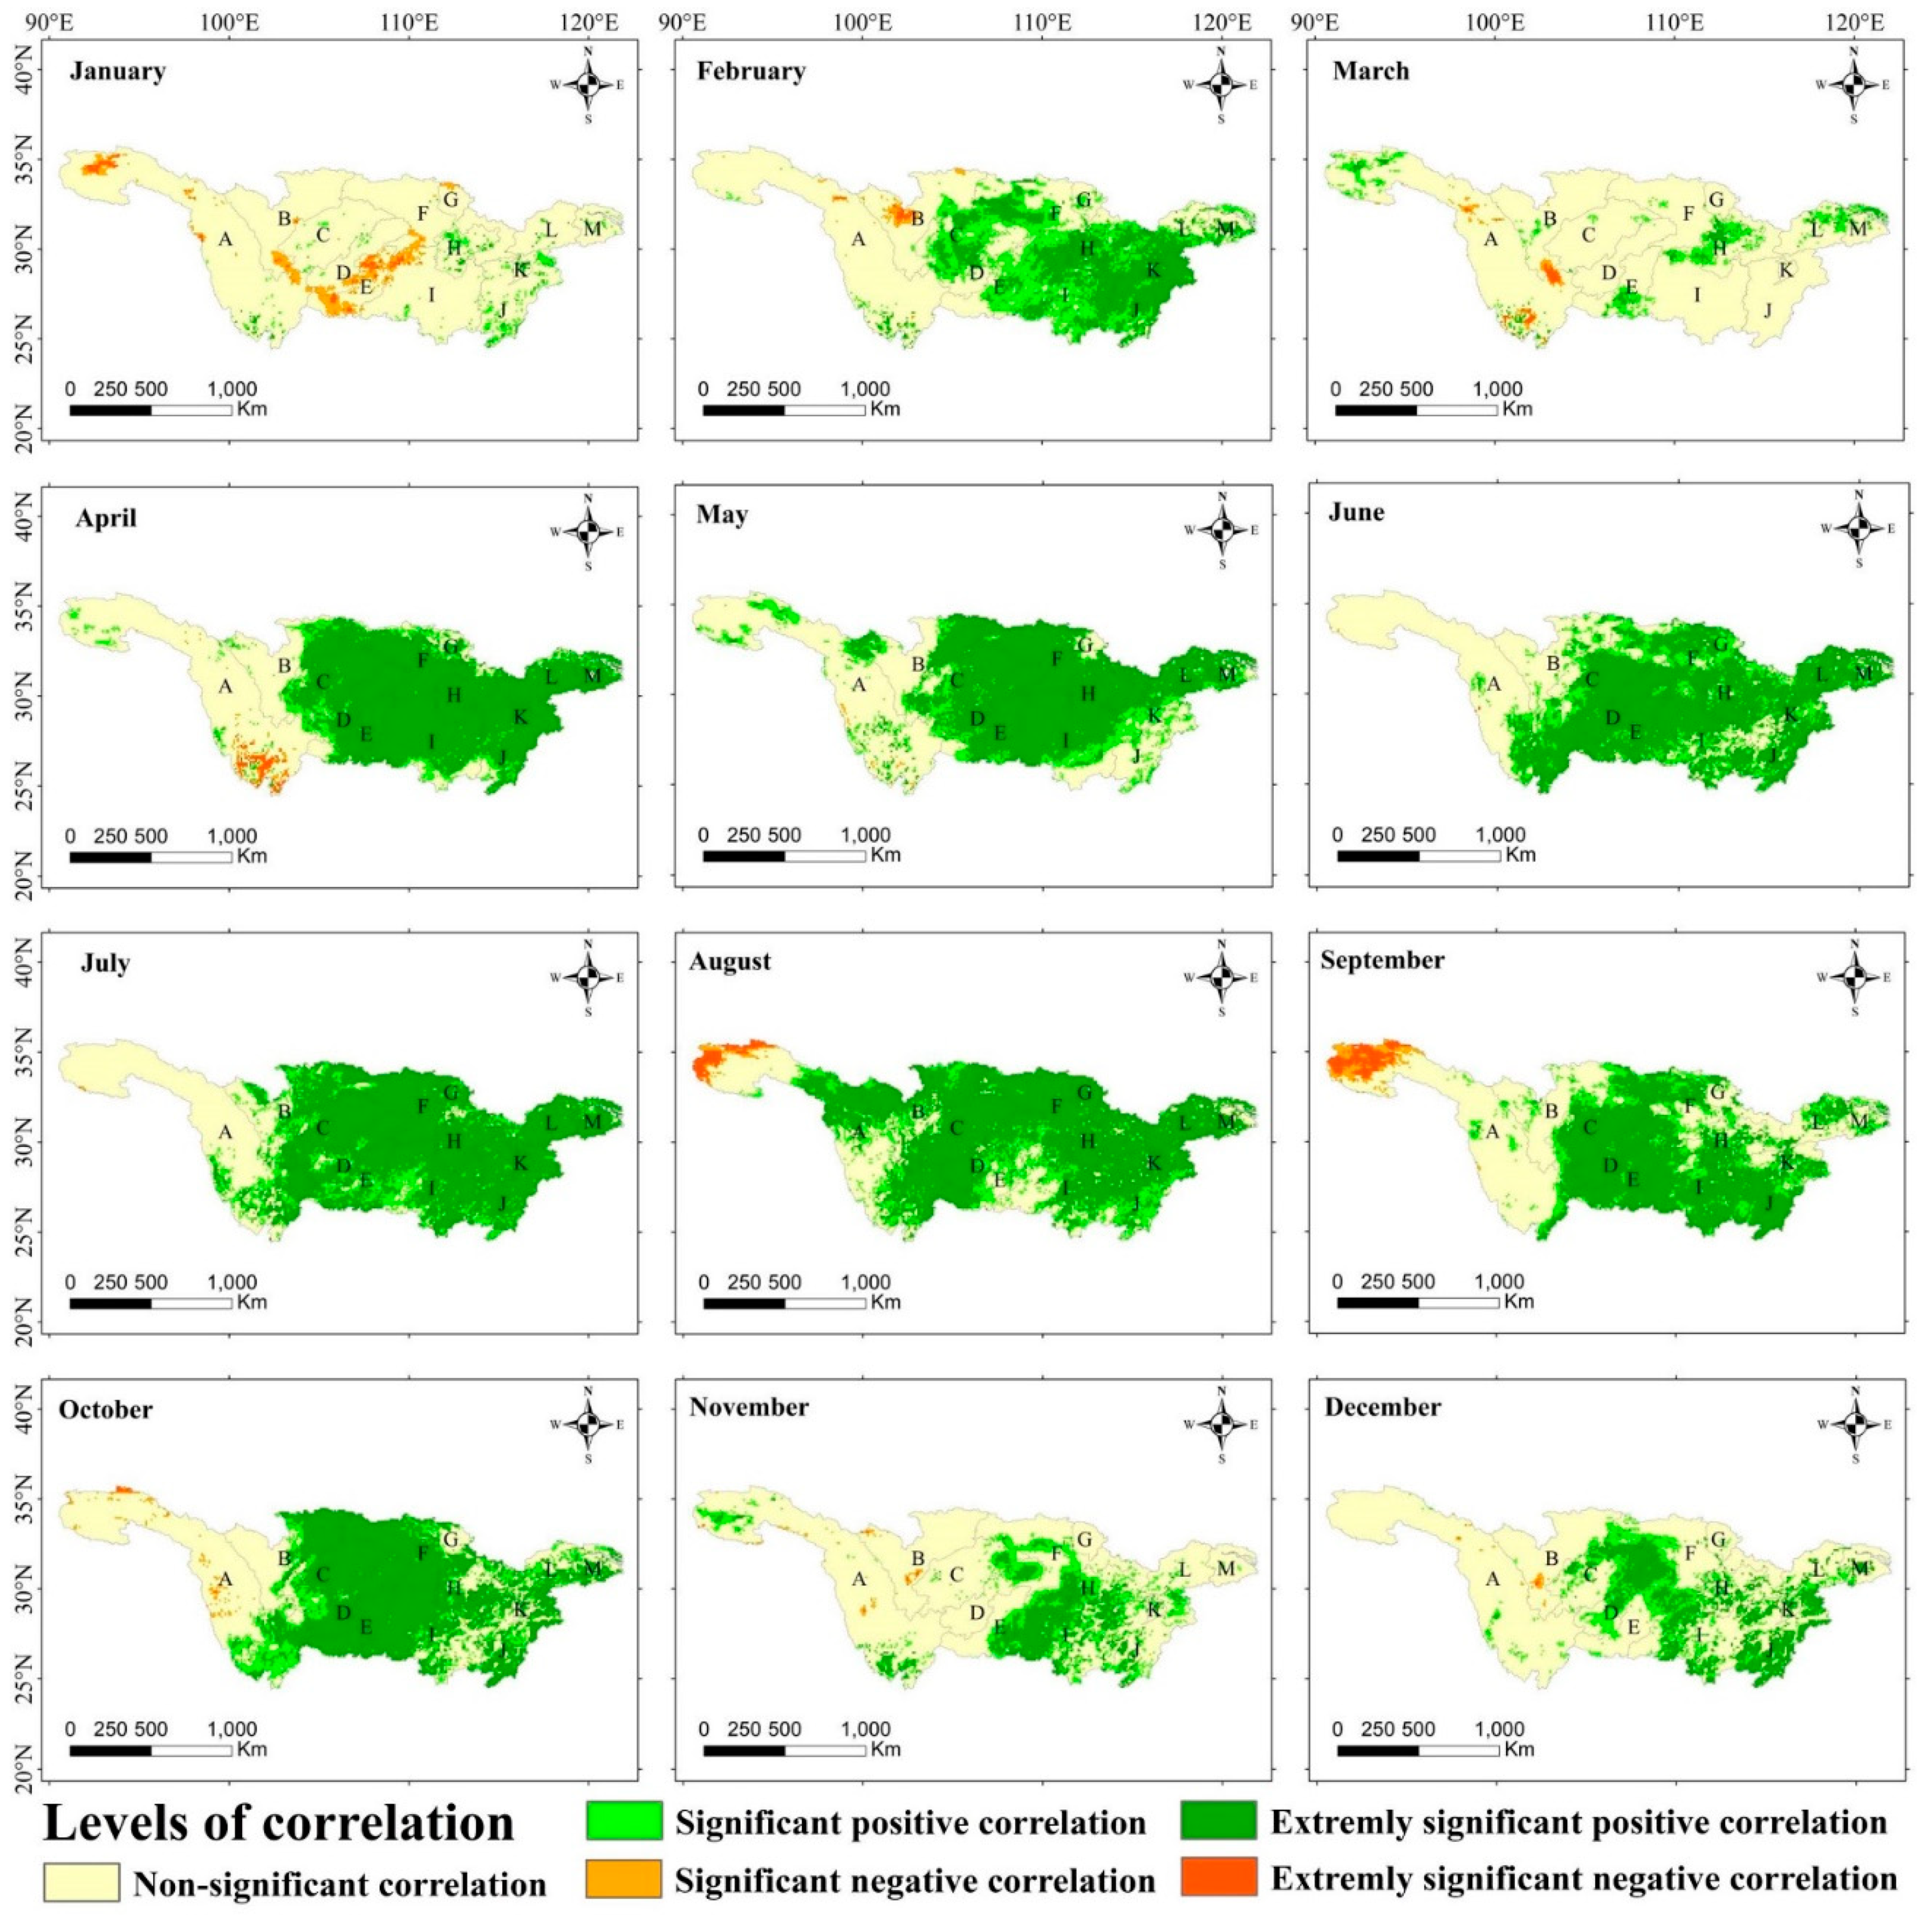
The correlation between ET and SR in the YRB showed significant differences in 12 months (Figure 11), and the correlation between the two was more similar to that between ET and T. The correlation between SR and ET is non−significant in most regions of the YRB in January, with the area accounting for about 89.83%. At the same time, the area where the two were significantly positively correlated was smaller than the area where they were significantly negatively correlated and was mainly distributed in the lower reaches of the YRB. With the change in months, the areas with significant positive correlation also gradually expanded to the middle and upper reaches (except March) and reached the peak in August, when the areas with significant positive correlation occupied about 77.69% of the YRB. After that, with the increase in the months, the area where the two were positively correlated also began to gradually decrease, while in January of the following year it began to gradually expand again, and the correlation between the two showed a more obvious cyclical change. In addition, the areas with significant negative correlation between ET and SR were mostly located in the UYRB, but in August and September, they were concentrated in the source of the YRB.

3.2.4. Correlation Analysis between Specific Humidity and ET

The correlation coefficient between ET and SH ranged from −0.92 to 0.89 at the annual scale, and the spatial average correlation coefficient was −0.15, which meant the correlation between ET and SH was more often negative (Figure 12a). As shown in Figure 12b, it could be seen that the area of regions with significant and extremely significant positive correlation between ET and SH was 10.15%, of which 6.27% was an extremely significant positive correlation, which was concentrated in the middle and upper reaches of the YRB. The areas with significant and extremely significant negative correlation accounted for 26.09% of the total area of the basin, of which the area of extremely significant negative correlation was 14.67%, mainly distributed in the middle and lower reaches of the YRB and sub-basin C, and the areas with non-significant correlation between ET and SH was relatively large, accounting for 63.76% of the total area of the YRB.
Similarly, the heterogeneity of the correlation between ET and SH for the 12 months in the YRB was significant (Figure 13). Fewer regions showed a significant positive correlation between SH and ET, with the highest percentage of 19.08% in March. From February to October (except July), the regions with positive correlation were mainly distributed in the middle and upper reaches of the YRB. From July, November, to January of the next year, the regions with positive correlation were mainly distributed in the middle and lower reaches of the YRB. However, the regions where SH and ET were negatively correlated were almost absent from January to April and concentrated in the middle and upper reaches of the YRB from May to September and in the middle and lower reaches of the YRB from October to December. At the same time, it could be observed that there was very little negative correlation between the two in the headwaters of the YRB. In summary, the correlation between the two did not show obvious cyclical change.

3.2.5. Correlation Analysis between Wind Speed and ET

The correlation coefficient between ET and U ranged from −0.67 to 0.83, and the spatial average correlation coefficient was 0.01 (Figure 14a). As shown in Figure 10b, it could be seen that the area of regions with significant and extremely significant positive correlation between ET and U was 3.53%, of which only 0.75% was extremely significant positive correlation, which was concentrated in sub-basin D and H. The areas with significant and extremely significant negative correlation accounted for 1.78% of the total area of the basin, of which the area of extremely significant negative correlation was only 0.33% and was sporadically distributed in the middle and upper reaches of the YRB. In contrast, the non-significant correlated region between ET and U was relatively large, accounting for 94.69% of the total area of the YRB. In conclusion, only a few regions had significant correlation between U and ET at the annual scale.
At the monthly scale, U and ET mainly showed non-significant correlation, followed by significant negative correlation, such as in February, April, and May, with the highest percentage of areas with significant negative correlation between U and ET in April, about 26.03%, distributed in the upper and middle reaches of the YRB (Figure 15). However, there were few areas where U was significantly positively correlated with ET, but the highest percentage was only about 10% in September. Similar to the performance at the annual scale, monthly ET and U were significantly correlated with ET in only a few regions in several months, such as January, March, August, and November. In particular, there were almost no areas with significant correlation between ET and U in July, August, and December in the headwaters of the YRB. In conclusion, the correlation between the two did not show obvious cyclical change.

3.3. Driving Analysis of Temporal and Spatial Variation of ET in the YRB

From Section 3.2, it was clear that each climatic factor had different effects on ET variation, but such effects were not singular but interactive and had a joint influence, and the relationships among them were complex [48]. Therefore, it was important to analyze the common influence of these driving factors on ET and to identify the dominant climatic factors on ET changes.
As shown in Figure 16, it could be seen that the driving mechanisms of climatic factors affecting ET had strong spatial differences at the annual scale, and the area proportion of the dominant factors affecting ET in the study area was SR (35.16%) > SH (34.51%) > P (16.84%) > T (7.96%) > U (5.52%). In terms of spatial distribution, SR and SH occupied the largest area as the dominant factors, and they were distributed in the upper, middle, and lower reaches of the YRB. The regions where precipitation was the dominant factor of ET variation were distributed near the rivers. However, the regions where T and U were the dominant factors of ET variation covered a smaller area, mainly distributed in the middle and upper reaches of the YRB and scattered in the lower reaches of the YRB.
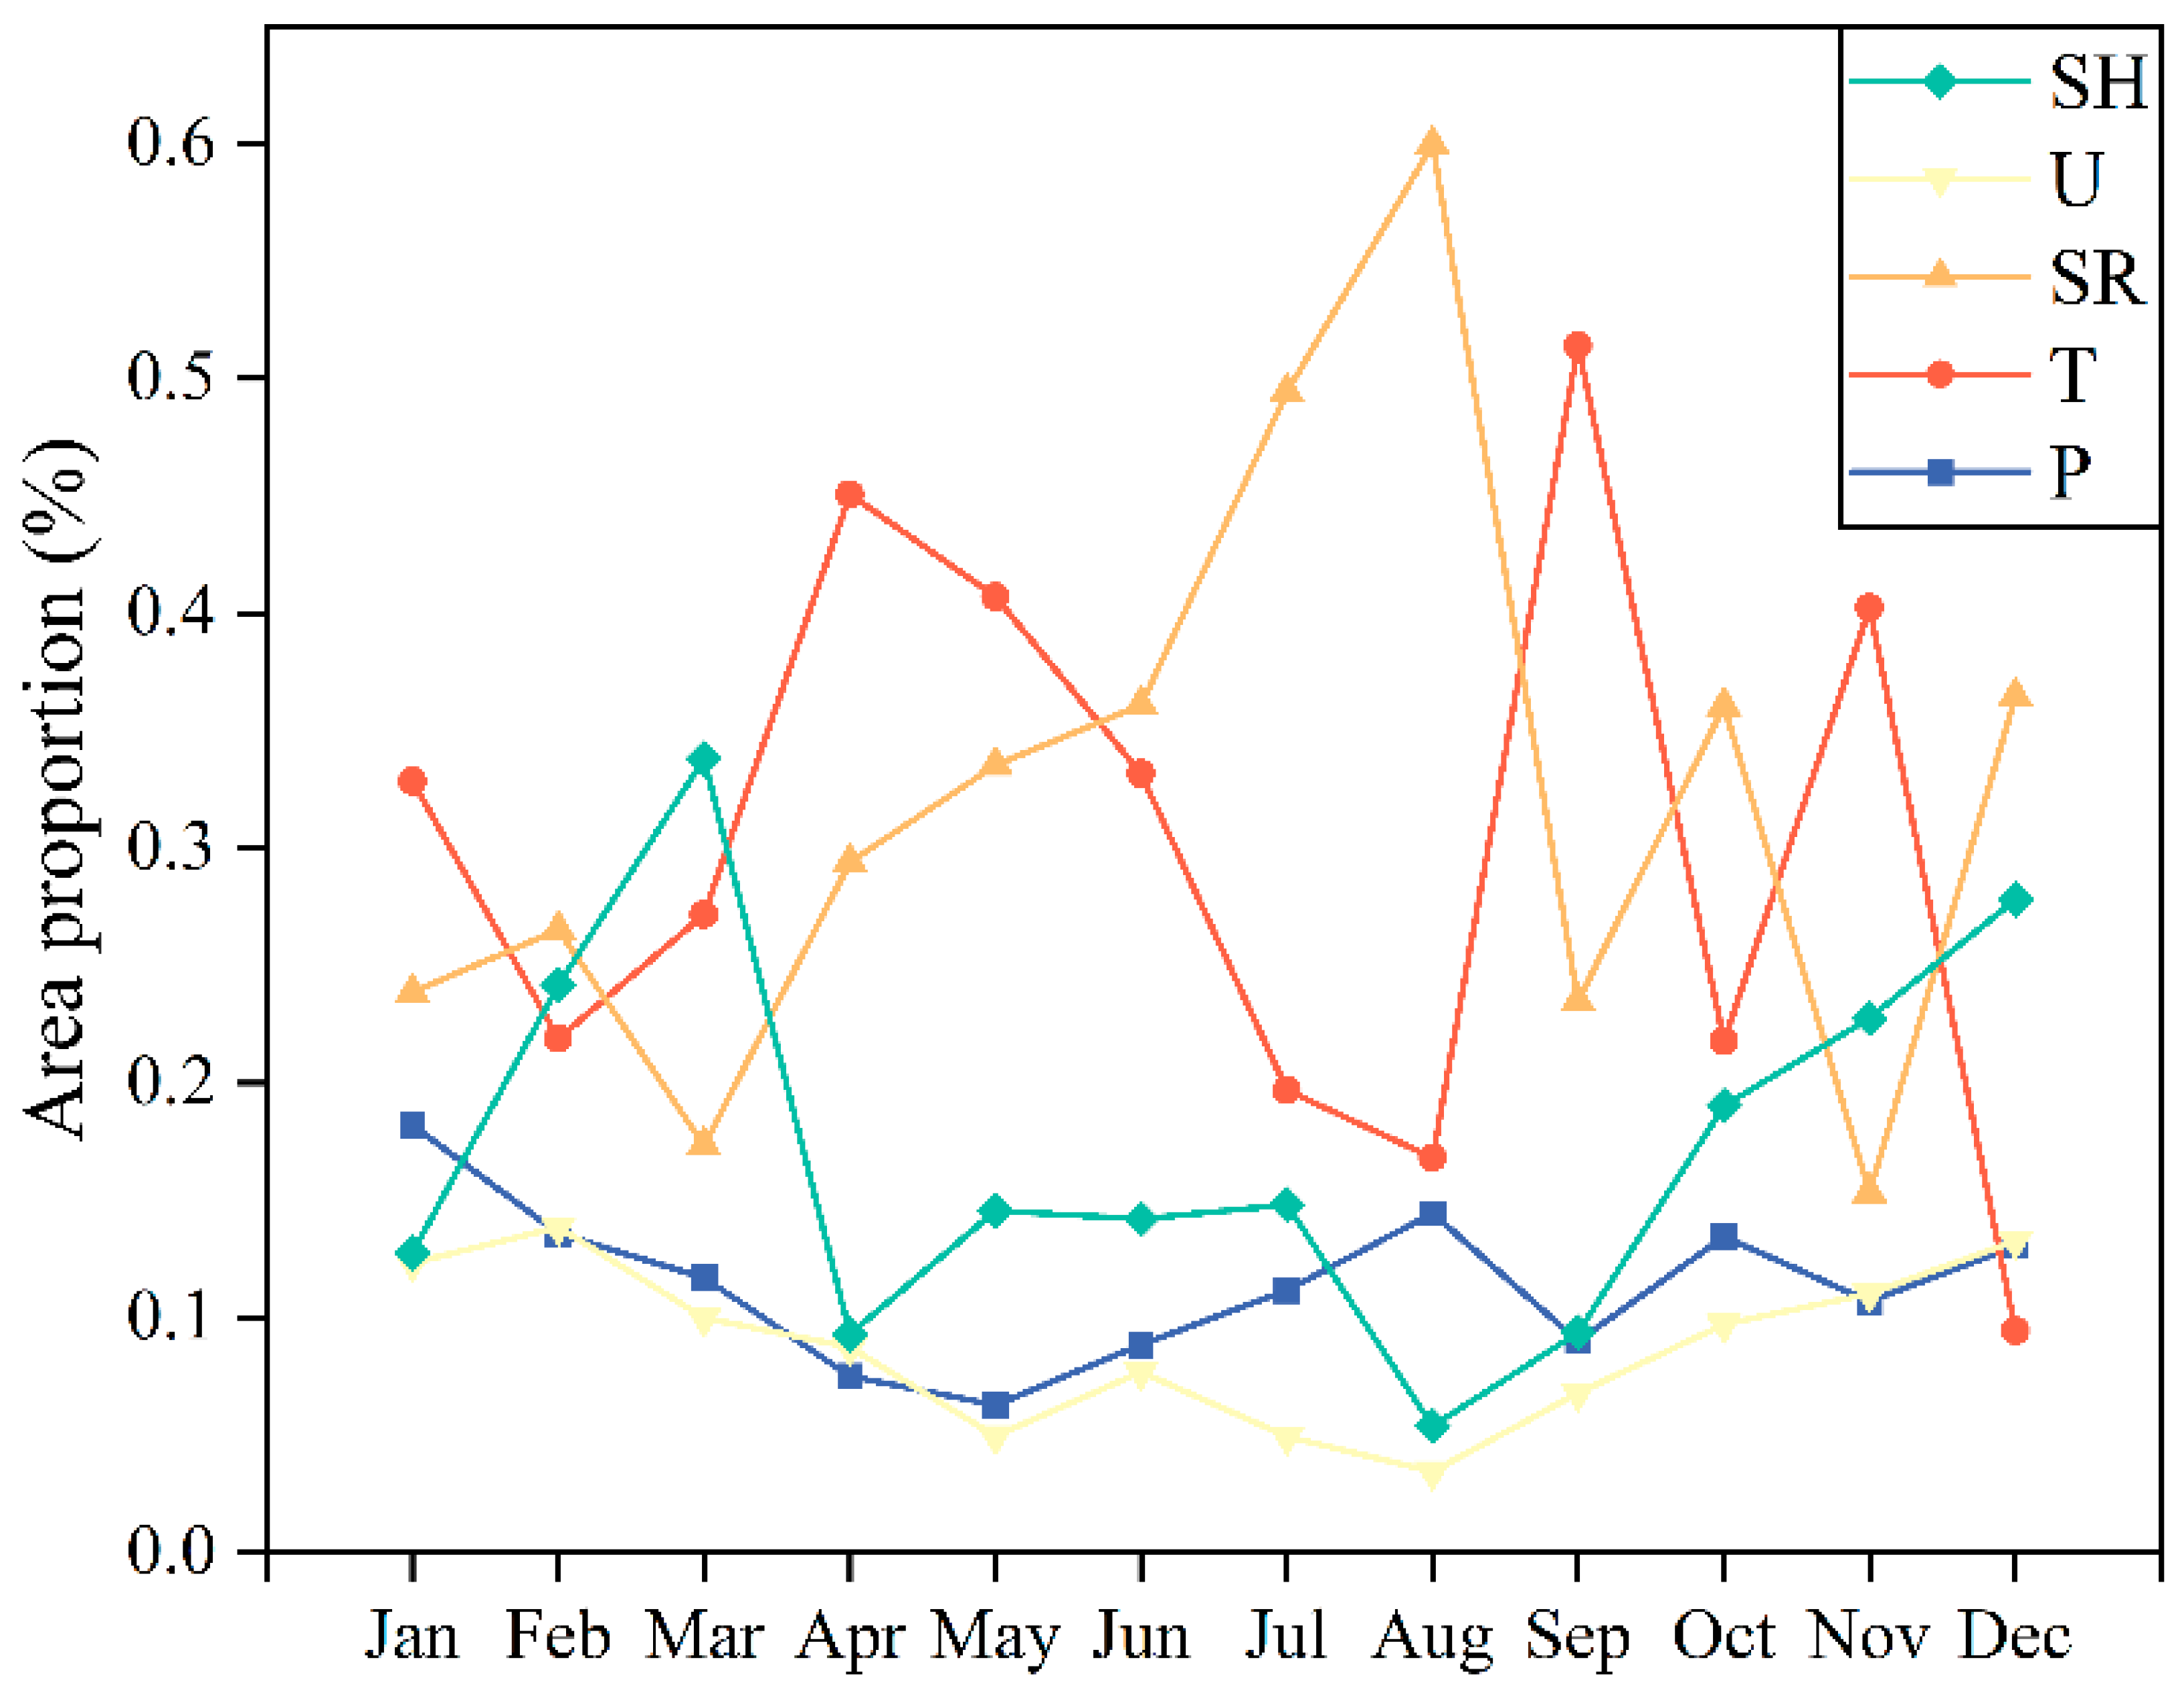
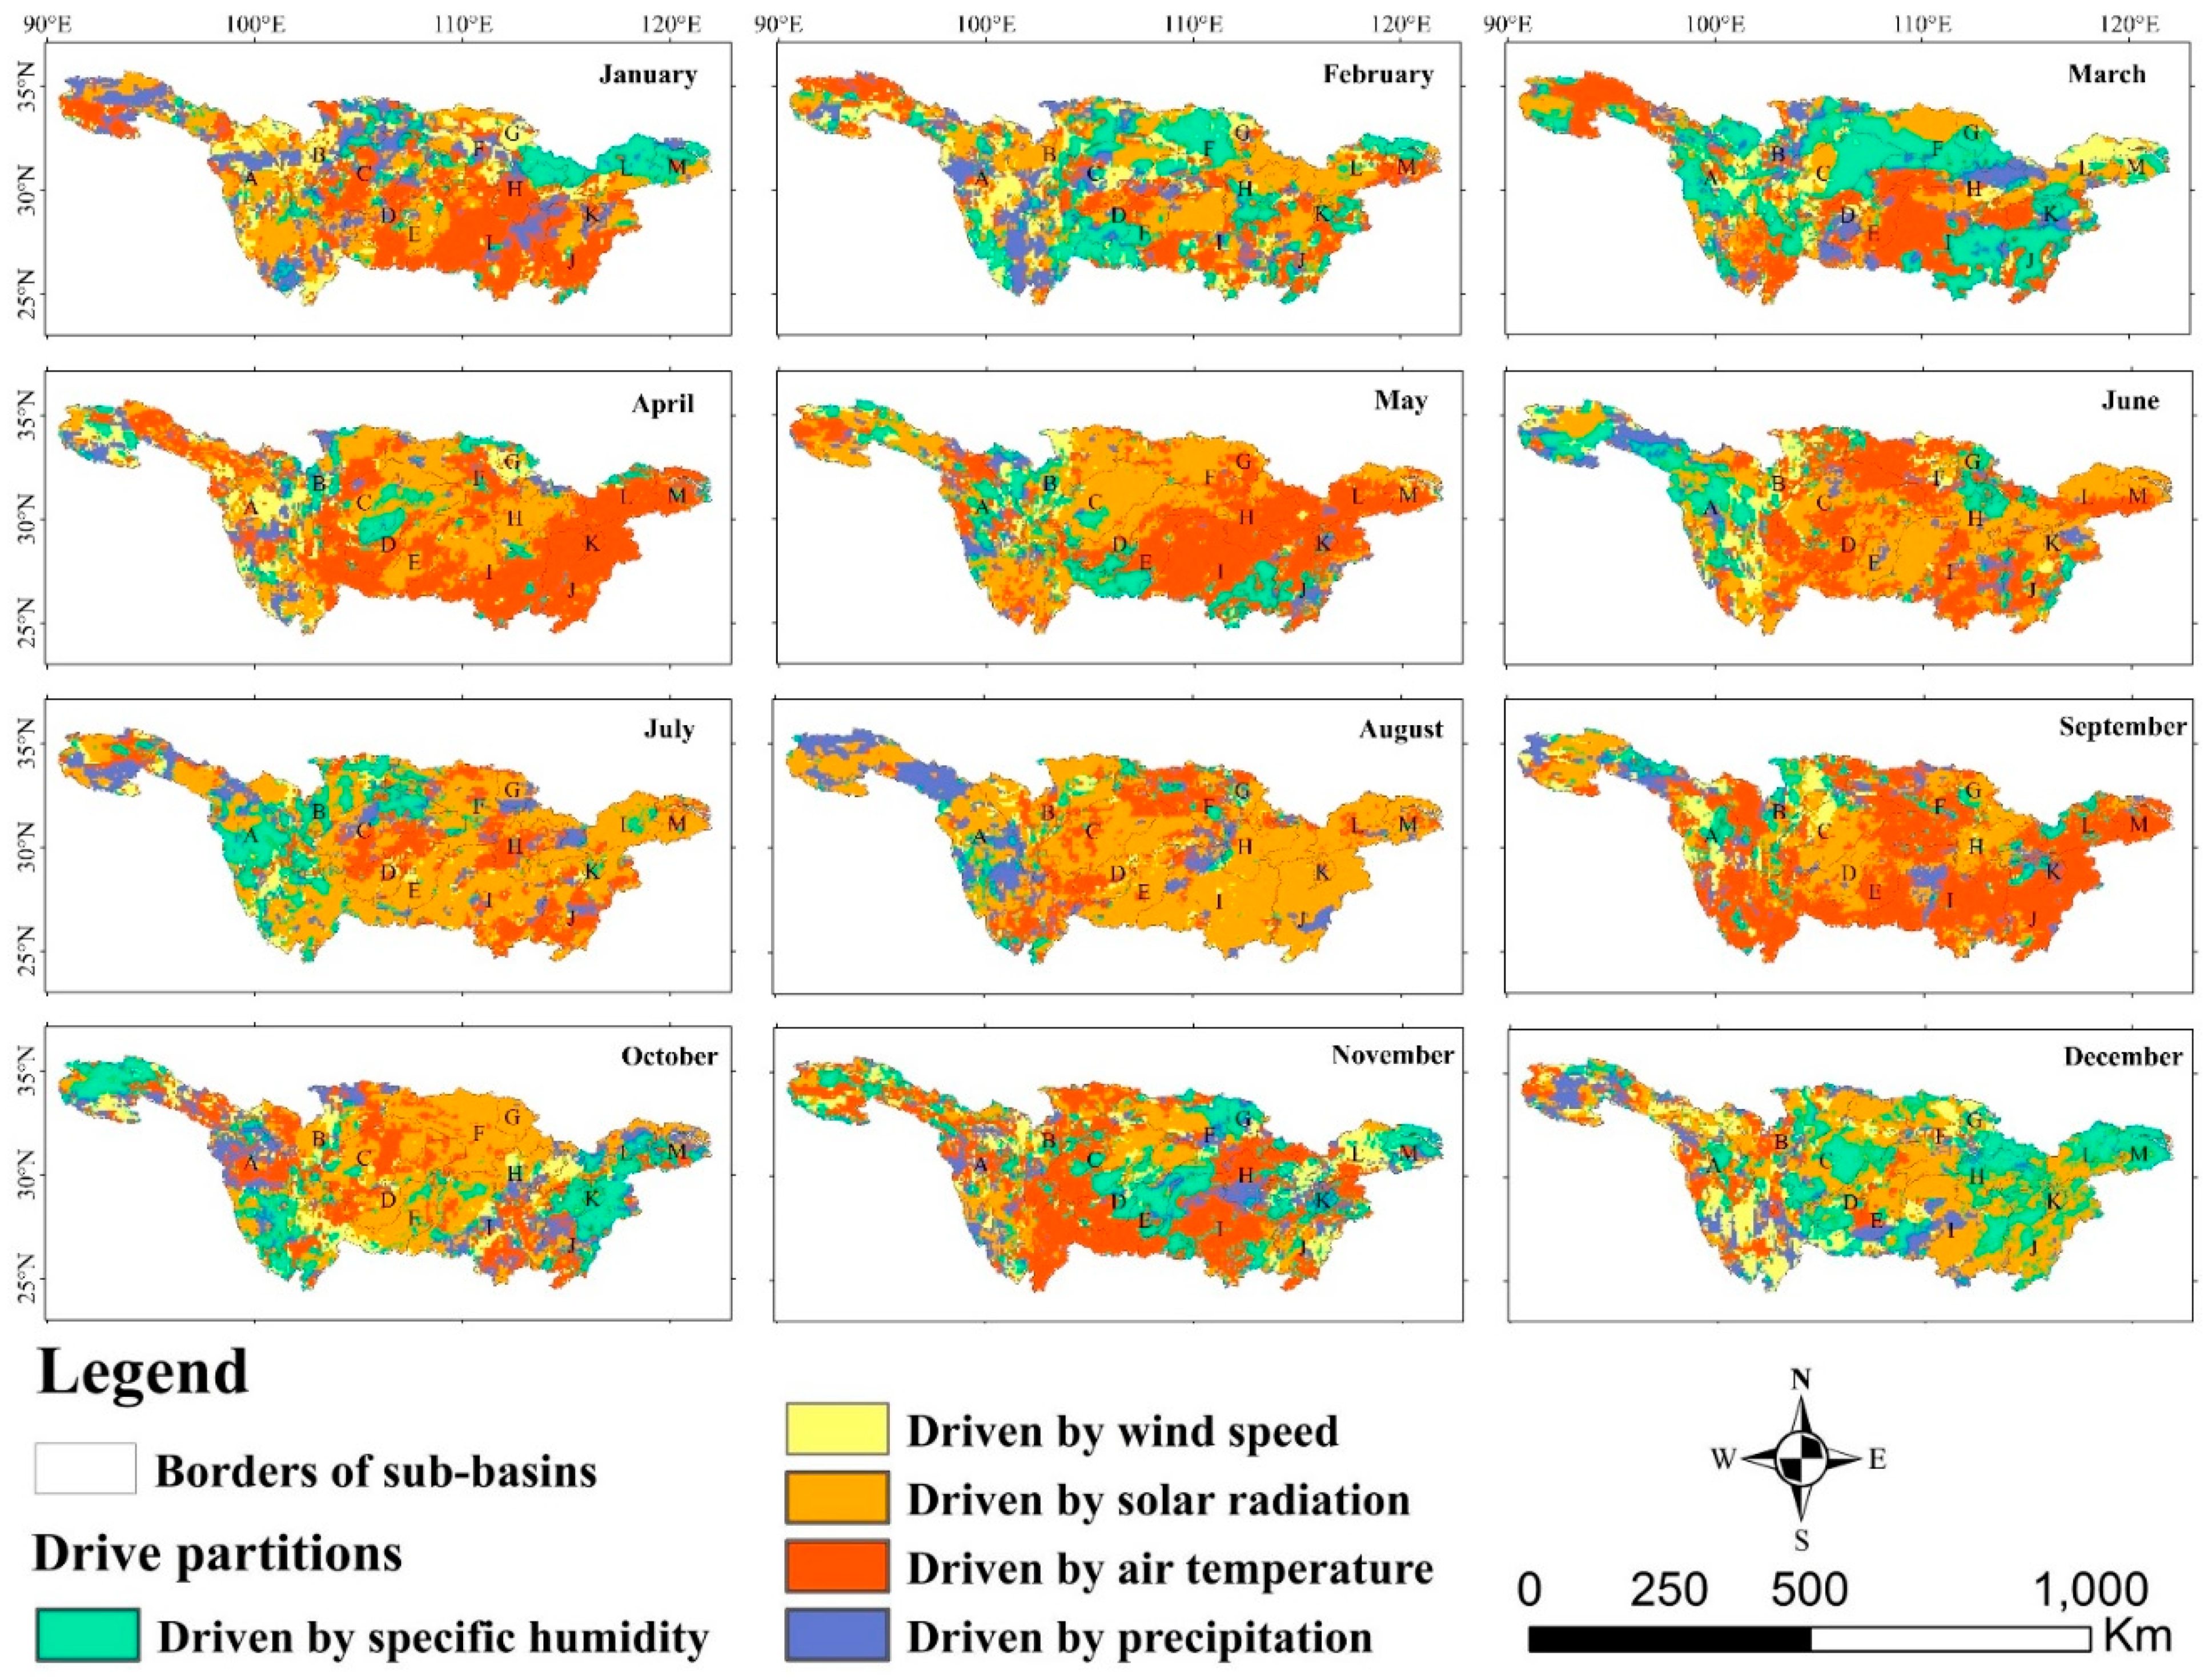
Combined with the area proportion (Figure 17) and spatial distribution (Figure 18) of the dominant climatic factors of monthly ET in the YRB, we found that the spatiotemporal heterogeneity of ET affected by climatic factors in 12 months in the YRB was significantly different from that at the annual scale. The annual ET variation in the YRB was mainly driven by SR and SH, and only 7.96% of the ET variation in the region was mainly driven by T. However, the climatic factor−driven partition showed that monthly ET in most regions was mainly driven by SR or T, especially in summer and autumn. The regions where ET was mainly driven by SR and T were mostly distributed in the middle and lower reaches of the YRB, and they were only distributed in the headwaters of the YRB in individual months. Combined with Figure 7 and Figure 11, it could be seen that SR and T were significantly positively correlated with ET in the middle and lower reaches of the YRB, while they were significantly negatively correlated with ET in the headwaters of the YRB. In addition, the highest proportion of SR−driven area occurred in August, about 60%, and the lowest occurred in November, about 15%. The highest proportion of the T−driven area occurred in September, about 51%, and the lowest occurred in December, about 9%.
The SH−driven regions were also discretely distributed in the YRB at the monthly scale. However, the area proportion of the SH−driven regions generally ranked the third, which was different from that at the annual scale, with a relatively high proportion in spring and winter, with the highest proportion in March (about 34%) and the lowest proportion in August (about 5%). For the P−driven regions, the area proportion generally ranked the fourth at the monthly scale, which was different from that at the annual scale, with the highest proportion of about 18% in January, and then fluctuated down to May (6%), and then increased linearly to August (14%), when P−driven regions occupied most of the UYRB, and then fluctuated up to January of the following year. For the U−driven regions, the area proportion of those regions generally ranked fifth at the monthly scale as well as at the annual scale, showing a decrease followed by an increase from February to January of the next year, fluctuating down from February (14%), reaching a minimum in August (3%), and fluctuating up from September to January. In addition, from the perspective of spatial distribution, U−driven regions were overwhelmingly distributed in the middle and upper reaches of the YRB from April to September and December, while they were discretely distributed in the YRB in other months.

4. Discussion

4.1. Climatic Factors Drive Monthly ET Influenced by Elevation

Altitude strongly influenced climatic conditions and consequently influenced ET and its sensitivity to climatic factors [49]. In order to facilitate analysis and statistics, this paper divided the elevation of the YRB into regions (Table 2). As analyzed in Section 3.2, the correlation between climatic factors (T, SR, and P) and ET showed a spatial evolution from west to east, and the elevation of the YRB was high in the west and low in the east. From the perspective of monthly changes, the area of the positive correlation between ET and T gradually increased from February to June and then fluctuated and decreased (Figure 19d). Figure 19a showed that the area proportion of the region with significant positive correlation between T and ET showed a decreasing trend from elevation I to XI, and it increased again in the region of elevation XII. This indicated that the sensitivity of ET to T decreased with the increase in altitude, being consistent with Sun et al.’s study in which the sensitivity of E T O to T was negatively correlated with altitude at the annual and seasonal scales [49]. It should be noted that the area proportions closed to 0% in the range of elevation V to XI, indicating a significant positive correlation between ET and T in very few areas within these regions in individual months. This could explain the spatial distribution and area of the regions with significant positive correlation between ET and T in Section 3.2.1, which varied from month to month, mainly related to altitude.
By studying the performance of the region with significant positive correlation between ET and SR at the monthly scale (Figure 19d), it was found that the area of this region gradually increased from March to July and then fluctuated and decreased from August to January of the next year, but it was significantly higher in February than in January and March. In terms of spatial distribution (Figure 19b), the regions with significant positive correlation between ET and SR were usually found in the low-elevation region, i.e., the proportion of area in this region was above 90% in the range of elevation I to III, after which its trend decreased in the range of elevation III and IX, and the proportion of area in the range of elevation IX to XII was generally low, below 20%. This was probably due to the extended duration of snow cover and convective clouds at higher altitudes that may lead to the reduction in absorbed shortwave radiation [50], making ET less sensitive to SR, which could explain the spatial variation in the region with significant positive correlation between ET and SR in Section 3.2.3, mainly related to altitude.
Generally speaking, topographic conditions have obvious influence on precipitation distribution [51], so the relationship between the effect of P on monthly ET and elevation should also be considered. Based on the monthly scale (Figure 19d), the area of the regions with significant negative correlation between the two first fluctuated upward from January to December and then fluctuated downward, achieving a maximum value of about 45.2% in July, and the percentage of area was significantly lower than that of the regions where ET was significantly positively correlated with T or SR, which was consistent with the results in Section 3.2.3. From the perspective of spatial distribution (Figure 19c), the regions with significant negative correlation between ET and P mainly existed in the regions with high elevation (within elevation classes X to XII), and the area proportion was more than 10%. The area proportion of this area fluctuated and increased in the range of elevation classes I to XI and then decreased in the region of elevation classes XI to XII. This indicated that the negative correlation between ET and P increased with increasing altitude, which could explain the spatial variation in the region of significant negative correlation between ET and P in Section 3.2.2, mainly related to altitude.
In this study, the correlation between ET and climatic factors in the YRB showed a complex pattern at the monthly scale, so it was necessary to explore the impact of climate on ET at different altitudes.

4.2. Strengths and Limitations

The PML_V2 ET data used in this study comprise ET-GPP coupling data with 500 m resolution [37]. The GPP and ET in PML_V2 ET dataset are mutually restricted and limited, which greatly improves the accuracy of ET compared with the previous models [32,52,53]. Meanwhile, several scholars have investigated the applicability of PML_V2 ET data in the Chinese region. He et al. compared and estimated ET and its components in 10 major river basins in China during 2001−2020 and found that PML_V2 ET products were superior to other typical products (MOD16A2, SEBAL, GLEAM, MOD17A2H, VPM and EC-LUE) in estimating ET and GPP [54]. Ji et al. validated the PML_V2 ET using MOD16 ET in the Three Gorges Reservoir Area (TGRA), and the validation results showed that the performance in the TGRA was slightly better than that of the PML_V2 ET in Northern China, which also confirmed the reliability of the data [55]. In addition, the PML_V2 ET product has a relatively high spatial and temporal resolution, which can extract more detailed information of the ET change at the spatial and temporal scales. Therefore, the PML_V2 ET data are promising in ET analysis over the YRB with strong spatial heterogeneity. This study using PML_V2 ET data found that the annual average ET in the YRB showed a significant upward trend from 2001 to 2020, which was consistent with the previous research results in the YRB. For example, Zhan et al. found that the annual ET increased significantly at a rate of 1.94 mm/a during 1998–2017 [56]. The ET during 1990–2019 estimated by Ye et al. based on the generalized evaporation complementarity relationship showed an upward trend of 0.21 mm/a [57], and the ET estimated by Li et al. from 1982 to 2015 based on the machine learning method also showed an upward trend [58]. The difference in the magnitude of ET trends in these studies was mainly caused by the different research periods.
There was spatial variability in the role of climatic factors on ET [56,59], and this study found that the top three climatic factors dominating ET changes in the basin were SR, SH, and P. This has also been explored in other studies. Zhan et al. found that the ET in the Dongting Lake and Poyang Lake basins, located in the southeastern part of the YRB, was mainly influenced by relative humidity from 1998 to 2017 [56]. Wang et al. found that the annual E T 0 in UYRB from 1951 to 2020 was most affected by relative humidity [19]. Lu et al. found that the spatial pattern of ET in the YRB from 1980 to 2014 was determined by both T and P, while, in most areas, SR was the dominant climatic factor of actual ET [22]. Meanwhile, this study found that regions where T or U was the dominant factor for ET variability occupied a smaller area, which was consistent with the findings of Gong et al., who found the sensitivity of E T 0 to four major climatic variables within the YRB from 1960–2000 and found that relative humidity was the most sensitive variable in the basin, followed by shortwave radiation and T, both with similar sensitivity, and the impact of U was the smallest [33]. In addition, the influence of climatic variables on ET varied from month to month [33]. Previous studies in the YRB mainly focused on the variation of annual ET, while we further analyzed the characteristics of monthly ET variation and its influencing factors. Also, this study explored the correlation between ET and individual climatic factors in the YRB and found that it exhibited a complex pattern in response to elevation at the monthly scale. The main contribution of this study is to provide new ideas for further research considering the driving mechanisms of ET changes at the monthly scale, and the response relationship with elevation that should not be neglected.
PML_V2 ET, ERA5, and GLDAS-2.1 datasets were used in this study, and the ET changes were attributed using correlation analysis and normalized multiple linear regression. However, there may be some limitations and uncertainties that should be taken into account in future research. First of all, there are significant differences in the estimation of ET by different models [60]; however, we only studied the impact of climate change on the ET changes in the PML_V2 dataset in this study. In order to quantify the uncertainty, further comparisons between individual results from different ET datasets may be required. In addition, the nearest-neighbor interpolation method was used to uniformly resample to 500 m, which will inevitably bring uncertainty to the results. Future studies can use meteorological data with higher spatial resolution to improve the research accuracy of the contribution of ET changes. Finally, the normalized multiple linear regression method was used to attribute the ET changes, and the regression coefficients of different climatic factors reflect the degree of their influence on ET. Different data sources may have different sensitivity and amplitude to the changes in climatic factors, which may bring uncertainty to the separation results.
ET itself is a complex physical process, and many factors need to be considered. In addition, the large altitude span and complex landform of the YRB increase the difficulty of investigating the driving mechanism of climatic factors affecting ET changes. In this study, only five climatic factors, namely air temperature, precipitation, solar radiation, specific humidity, and wind speed, were selected as the main climatic drivers to drive the analysis of ET changes in the YRB, and the influence of human activities on ET changes was not considered. Future studies can combine more meteorological data, topographic data, land use type data, etc., and comprehensively explore and analyze the interaction between meteorology and land cover types to conduct further research on ET influencing factors in the YRB and reduce the uncertainty of the above relationships and then develop a model to predict the future “spatiotemporal variation in ET“ with respect to average climate conditions; this will be crucial for climate change research and water management in the context of global warming.

5. Conclusions

This article presents a comprehensive analysis of the variation patterns of ET in the YRB from 2001 to 2020 at annual and monthly scales and the mechanisms influenced by climate change at different spatial and temporal scales. The main conclusions found in this study are as follows:
(1)
The annual average ET was 592.58 mm, the interannual ET variation fluctuated significantly, and the average value of the interannual ET statistic Z was 0.97, with an overall increasing trend. Among them, the ET of 6.90% of the areas showed a significant decrease trend, while the ET of 34.99% of the areas showed a significant increase trend. Monthly ET increased significantly in January to April, June, and December. Monthly ET decreased significantly in July and November, mainly distributed in the middle and lower reaches of the YRB.
(2)
The spatiotemporal distribution of the regions with significant correlation between ET and T, SR, and P in the YRB showed obvious evolution patterns, and the spatial change pattern was strongly related to the elevation. Nevertheless, the regions with significant correlations between monthly ET and SH and U in the YRB did not show obvious cyclical changes in months.
(3)
At the annual scale, the area proportion of the dominant climatic factors affecting ET in the study area was SR (35.16%) > SH (34.51) > P (16.84%) > T (7.96%) > U (5.52%). However, monthly ET in most areas of the YRB was driven by SR and T, especially in summer and autumn, while ET in spring and winter was mainly driven by SR, T, and SH.

Author Contributions

Conceptualization, M.L. and M.W.; methodology, M.L.; software, Z.Z.; investigation, M.L. and M.W.; data curation, Q.A.; writing—original draft preparation, M.L.; writing—review and editing, M.W., Z.Z., Q.A. and J.L.; supervision, M.W., Z.Z., Q.A. and J.L.; funding acquisition, M.W. and Z.Z. All authors have read and agreed to the published version of the manuscript.

Funding

This research was funded by the funded the Key Laboratory of Land Satellite Remote Sensing Application, Ministry of Natural Resources of the People’s Republic of China, which is an open fund without a funding number. It is also supported by the National Natural Science Foundation of China under grants 61801443 and 41801348.

Institutional Review Board Statement

Not applicable.

Informed Consent Statement

Not applicable.

Data Availability Statement

No new data were created or analyzed in this study. Data sharing is not applicable to this article.

Conflicts of Interest

The authors declare no conflict of interest.

References

  1. Jung, M.; Reichstein, M.; Ciais, P.; Seneviratne, S.I.; Sheffield, J.; Goulden, M.L.; Bonan, G.; Cescatti, A.; Chen, J.; De Jeu, R. Recent decline in the global land evapotranspiration trend due to limited moisture supply. Nature 2010, 467, 951–954. [Google Scholar] [CrossRef] [PubMed]
  2. Wang, K.; Dickinson, R.E. A review of global terrestrial evapotranspiration: Observation, modeling, climatology, and climatic variability. Rev. Geophys. 2012, 50, 1–54. [Google Scholar] [CrossRef]
  3. Valipour, M.; Bateni, S.M.; Gholami Sefidkouhi, M.A.; Raeini-Sarjaz, M.; Singh, V.P. Complexity of forces driving trend of reference evapotranspiration and signals of climate change. Atmosphere 2020, 11, 1081. [Google Scholar] [CrossRef]
  4. Dinpashoh, Y.; Jahanbakhsh-Asl, S.; Rasouli, A.; Foroughi, M.; Singh, V. Impact of climate change on potential evapotranspiration (case study: West and NW of Iran). Theor. Appl. Climatol. 2019, 136, 185–201. [Google Scholar] [CrossRef]
  5. Wang, M.; Li, M.; Zhang, Z.; Hu, T.; He, G.; Zhang, Z.; Wang, G.; Li, H.; Tan, J.; Liu, X. Land Surface Temperature Retrieval from Landsat 9 TIRS-2 Data Using Radiance-Based Split-Window Algorithm. IEEE J. Sel. Top. Appl. Earth Obs. Remote Sens. 2022, 16, 1100–1112. [Google Scholar] [CrossRef]
  6. Guo, L.; Sun, F.; Liu, W.; Zhang, Y.; Wang, H.; Cui, H.; Wang, H.; Zhang, J.; Du, B. Response of ecosystem water use efficiency to drought over China during 1982–2015: Spatiotemporal variability and resilience. Forests 2019, 10, 598. [Google Scholar] [CrossRef]
  7. Jiang, S.; Wei, L.; Ren, L.; Xu, C.-Y.; Zhong, F.; Wang, M.; Zhang, L.; Yuan, F.; Liu, Y. Utility of integrated IMERG precipitation and GLEAM potential evapotranspiration products for drought monitoring over mainland China. Atmos. Res. 2021, 247, 105141. [Google Scholar] [CrossRef]
  8. Wang, M.; He, C.; Zhang, Z.; Hu, T.; Duan, S.-B.; Mallick, K.; Li, H.; Liu, X. Evaluation of Three Land Surface Temperature Products from Landsat Series Using in Situ Measurements. IEEE Trans. Geosci. Remote Sens. 2023, 61, 5000119. [Google Scholar] [CrossRef]
  9. Jovic, S.; Nedeljkovic, B.; Golubovic, Z.; Kostic, N. Evolutionary algorithm for reference evapotranspiration analysis. Comput. Electron. Agric. 2018, 150, 1–4. [Google Scholar] [CrossRef]
  10. Condon, L.E.; Maxwell, R.M. Simulating the sensitivity of evapotranspiration and streamflow to large-scale groundwater depletion. Sci. Adv. 2019, 5, eaav4574. [Google Scholar] [CrossRef]
  11. Khan, A.; Stöckle, C.O.; Nelson, R.L.; Peters, T.; Adam, J.C.; Lamb, B.; Chi, J.; Waldo, S. Estimating biomass and yield using metric evapotranspiration and simple growth algorithms. Agron. J. 2019, 111, 536–544. [Google Scholar] [CrossRef]
  12. Mahmoodi-Eshkaftaki, M.; Rafiee, M.R. Optimization of irrigation management: A multi-objective approach based on crop yield, growth, evapotranspiration, water use efficiency and soil salinity. J. Clean. Prod. 2020, 252, 119901. [Google Scholar] [CrossRef]
  13. Zhang, F.; Geng, M.; Wu, Q.; Liang, Y. Study on the spatial-temporal variation in evapotranspiration in China from 1948 to 2018. Sci. Rep. 2020, 10, 17139. [Google Scholar] [CrossRef]
  14. Feng, K.; Tian, J. Forecasting reference evapotranspiration using data mining and limited climatic data. Eur. J. Remote Sens. 2021, 54, 363–371. [Google Scholar] [CrossRef]
  15. Zhang, Y.; Wang, M.; Chen, J.; Zhong, P.-a.; Wu, X.; Wu, S. Multiscale attribution analysis for assessing effects of changing environment on runoff: Case study of the Upstream Yangtze River in China. J. Water Clim. Chang. 2021, 12, 627–646. [Google Scholar] [CrossRef]
  16. Lu, S.; Tang, X.; Guan, X.; Qin, F.; Liu, X.; Zhang, D. The assessment of forest ecological security and its determining indicators: A case study of the Yangtze River Economic Belt in China. J. Environ. Manag. 2020, 258, 110048. [Google Scholar] [CrossRef]
  17. Huang, T.; Xu, L.; Fan, H. Drought characteristics and its response to the global climate variability in the yangtze river basin, China. Water 2018, 11, 13. [Google Scholar] [CrossRef]
  18. Jiang, W.; Wang, L.; Feng, L.; Zhang, M.; Yao, R. Drought characteristics and its impact on changes in surface vegetation from 1981 to 2015 in the Yangtze River Basin, China. Int. J. Climatol. 2020, 40, 3380–3397. [Google Scholar] [CrossRef]
  19. Wang, M.; Zhang, Y.; Lu, Y.; Gong, X.; Gao, L. Detection and attribution of reference evapotranspiration change (1951–2020) in the Upper Yangtze River Basin of China. J. Water Clim. Chang. 2021, 12, 2624–2638. [Google Scholar] [CrossRef]
  20. Wang, Y.; Jiang, T.; Bothe, O.; Fraedrich, K. Changes of pan evaporation and reference evapotranspiration in the Yangtze River basin. Theor. Appl. Climatol. 2007, 90, 13–23. [Google Scholar] [CrossRef]
  21. Wang, Y.; Liu, B.; Su, B.; Zhai, J.; Gemmer, M. Trends of calculated and simulated actual evaporation in the Yangtze River basin. J. Clim. 2011, 24, 4494–4507. [Google Scholar] [CrossRef]
  22. Lu, J.; Wang, G.; Gong, T.; Hagan, D.F.T.; Wang, Y.; Jiang, T.; Su, B. Changes of actual evapotranspiration and its components in the Yangtze River valley during 1980–2014 from satellite assimilation product. Theor. Appl. Climatol. 2019, 138, 1493–1510. [Google Scholar] [CrossRef]
  23. Wang, W.; Shao, Q.; Peng, S.; Xing, W.; Yang, T.; Luo, Y.; Yong, B.; Xu, J. Reference evapotranspiration change and the causes across the Yellow River Basin during 1957–2008 and their spatial and seasonal differences. Water Resour. Res. 2012, 48, 1–27. [Google Scholar] [CrossRef]
  24. Xu, C.-y.; Gong, L.; Jiang, T.; Chen, D.; Singh, V. Analysis of spatial distribution and temporal trend of reference evapotranspiration and pan evaporation in Changjiang (Yangtze River) catchment. J. Hydrol. 2006, 327, 81–93. [Google Scholar] [CrossRef]
  25. Xu, Y.; Xu, Y.; Wang, Y.; Wu, L.; Li, G.; Song, S. Spatial and temporal trends of reference crop evapotranspiration and its influential variables in Yangtze River Delta, eastern China. Theor. Appl. Climatol. 2017, 130, 945–958. [Google Scholar] [CrossRef]
  26. Herath, I.K.; Ye, X.; Wang, J.; Bouraima, A.-K. Spatial and temporal variability of reference evapotranspiration and influenced meteorological factors in the Jialing River Basin, China. Theor. Appl. Climatol. 2018, 131, 1417–1428. [Google Scholar] [CrossRef]
  27. Al-Sudani, H.I.Z. Study of Morphometric Properties and Water Balance Using Thornthwaite Method in Khanaqin Basin, East of Iraq. J. Univ. Babylon Eng. Sci. 2018, 26, 165–175. [Google Scholar]
  28. Bo, L.; Qi, H.; Wenpeng, W.; Xiaofan, Z.; Jianqing, Z. Variation of actual evapotranspiration and its impact on regional water resources in the Upper Reaches of the Yangtze River. Quat. Int. 2011, 244, 185–193. [Google Scholar] [CrossRef]
  29. Yang, L.; Feng, Q.; Zhu, M.; Wang, L.; Alizadeh, M.R.; Adamowski, J.F.; Wen, X.; Yin, Z. Variation in actual evapotranspiration and its ties to climate change and vegetation dynamics in northwest China. J. Hydrol. 2022, 607, 127533. [Google Scholar] [CrossRef]
  30. Lv, X.; Zuo, Z.; Sun, J.; Ni, Y.; Wang, Z. Climatic and human-related indicators and their implications for evapotranspiration management in a watershed of Loess Plateau, China. Ecol. Indic. 2019, 101, 143–149. [Google Scholar] [CrossRef]
  31. Ma, Z.; Yan, N.; Wu, B.; Stein, A.; Zhu, W.; Zeng, H. Variation in actual evapotranspiration following changes in climate and vegetation cover during an ecological restoration period (2000–2015) in the Loess Plateau, China. Sci. Total Environ. 2019, 689, 534–545. [Google Scholar] [CrossRef]
  32. Li, C.; Zhang, Y.; Shen, Y.; Kong, D.; Zhou, X. LUCC-driven changes in gross primary production and actual evapotranspiration in northern China. J. Geophys. Res. Atmos. 2020, 125, e2019JD031705. [Google Scholar] [CrossRef]
  33. Gong, L.; Xu, C.-y.; Chen, D.; Halldin, S.; Chen, Y.D. Sensitivity of the Penman–Monteith reference evapotranspiration to key climatic variables in the Changjiang (Yangtze River) basin. J. Hydrol. 2006, 329, 620–629. [Google Scholar] [CrossRef]
  34. Qu, X.; Chen, Y.; Liu, H.; Xia, W.; Lu, Y.; Gang, D.-D.; Lin, L.-S. A holistic assessment of water quality condition and spatiotemporal patterns in impounded lakes along the eastern route of China’s South-to-North water diversion project. Water Res. 2020, 185, 116275. [Google Scholar] [CrossRef]
  35. Chen, Y.; Fok, H.S.; Ma, Z.; Tenzer, R. Improved remotely sensed total basin discharge and its seasonal error characterization in the Yangtze River Basin. Sensors 2019, 19, 3386. [Google Scholar] [CrossRef]
  36. Kong, L.; Zheng, H.; Xiao, Y.; Ouyang, Z.; Li, C.; Zhang, J.; Huang, B. Mapping ecosystem service bundles to detect distinct types of multifunctionality within the diverse landscape of the yangtze river basin, China. Sustainability 2018, 10, 857. [Google Scholar] [CrossRef]
  37. Zhang, Y.; Kong, D.; Gan, R.; Chiew, F.H.; McVicar, T.R.; Zhang, Q.; Yang, Y. Coupled estimation of 500 m and 8-day resolution global evapotranspiration and gross primary production in 2002–2017. Remote Sens. Environ. 2019, 222, 165–182. [Google Scholar] [CrossRef]
  38. Wu, D.; Wu, H.; Zhao, X.; Zhou, T.; Tang, B.; Zhao, W.; Jia, K. Evaluation of spatiotemporal variations of global fractional vegetation cover based on GIMMS NDVI data from 1982 to 2011. Remote Sens. 2014, 6, 4217–4239. [Google Scholar] [CrossRef]
  39. Dinpashoh, Y.; Mirabbasi, R.; Jhajharia, D.; Abianeh, H.Z.; Mostafaeipour, A. Effect of short-term and long-term persistence on identification of temporal trends. J. Hydrol. Eng. 2014, 19, 617–625. [Google Scholar] [CrossRef]
  40. Jiang, W.; Yuan, L.; Wang, W.; Cao, R.; Zhang, Y.; Shen, W. Spatio-temporal analysis of vegetation variation in the Yellow River Basin. Ecol. Indic. 2015, 51, 117–126. [Google Scholar] [CrossRef]
  41. Sen, P.K. Estimates of the regression coefficient based on Kendall’s tau. J. Am. Stat. Assoc. 1968, 63, 1379–1389. [Google Scholar] [CrossRef]
  42. Mondal, A.; Kundu, S.; Mukhopadhyay, A. Rainfall trend analysis by Mann-Kendall test: A case study of north-eastern part of Cuttack district, Orissa. Int. J. Geol. Earth Environ. Sci. 2012, 2, 70–78. [Google Scholar]
  43. Yang, L.; Feng, Q.; Yin, Z.; Wen, X.; Si, J.; Li, C.; Deo, R.C. Identifying separate impacts of climate and land use/cover change on hydrological processes in upper stream of Heihe River, Northwest China. Hydrol. Process. 2017, 31, 1100–1112. [Google Scholar] [CrossRef]
  44. Salas, J.D. Applied Modeling of Hydrologic Time Series; Water Resources Publications: Littleton, CO, USA, 1980. [Google Scholar]
  45. Kendall, M.G.; Stuart, A. The Advanced Theory of Statistics: Design and Analysis, and Time-Series; Griffin: Duxbury, MA, USA, 1958. [Google Scholar]
  46. Yadeta, D.; Kebede, A.; Tessema, N. Potential evapotranspiration models evaluation, modelling, and projection under climate scenarios, Kesem sub-basin, Awash River basin, Ethiopia. Model. Earth Syst. Environ. 2020, 6, 2165–2176. [Google Scholar] [CrossRef]
  47. Shamshirband, S.; Hashemi, S.; Salimi, H.; Samadianfard, S.; Asadi, E.; Shadkani, S.; Kargar, K.; Mosavi, A.; Nabipour, N.; Chau, K.-W. Predicting standardized streamflow index for hydrological drought using machine learning models. Eng. Appl. Comput. Fluid Mech. 2020, 14, 339–350. [Google Scholar] [CrossRef]
  48. Sun, S.; Song, Z.; Chen, X.; Wang, T.; Zhang, Y.; Zhang, D.; Zhang, H.; Hao, Q.; Chen, B. Multimodel-based analyses of evapotranspiration and its controls in China over the last three decades. Ecohydrology 2020, 13, e2195. [Google Scholar] [CrossRef]
  49. Sun, J.; Wang, G.; Sun, X.; Lin, S.; Hu, Z.; Huang, K. Elevation-dependent changes in reference evapotranspiration due to climate change. Hydrol. Process. 2020, 34, 5580–5594. [Google Scholar] [CrossRef]
  50. Wang, Q.; Wang, J.; Zhao, Y.; Li, H.; Zhai, J.; Yu, Z.; Zhang, S. Reference evapotranspiration trends from 1980 to 2012 and their attribution to meteorological drivers in the three-river source region, China. Int. J. Climatol. 2016, 36, 3759–3769. [Google Scholar] [CrossRef]
  51. Collados-Lara, A.J.; Pardo-Igúzquiza, E.; Pulido-Velazquez, D.; Jiménez-Sánchez, J. Precipitation fields in an alpine Mediterranean catchment: Inversion of precipitation gradient with elevation or undercatch of snowfall? Int. J. Climatol. 2018, 38, 3565–3578. [Google Scholar] [CrossRef]
  52. Pei, Y.; Dong, J.; Zhang, Y.; Yang, J.; Zhang, Y.; Jiang, C.; Xiao, X. Performance of four state-of-the-art GPP products (VPM, MOD17, BESS and PML) for grasslands in drought years. Ecol. Inf. 2020, 56, 101052. [Google Scholar] [CrossRef]
  53. Bai, H.; Ming, Z.; Zhong, Y.; Zhong, M.; Kong, D.; Ji, B. Evaluation of evapotranspiration for exorheic basins in China using an improved estimate of terrestrial water storage change. J. Hydrol. 2022, 610, 127885. [Google Scholar] [CrossRef]
  54. He, S.; Zhang, Y.; Ma, N.; Tian, J.; Kong, D.; Liu, C. A daily and 500 m coupled evapotranspiration and gross primary production product across China during 2000–2020. Earth Syst. Sci. Data Discuss. 2022, 14, 5463–5488. [Google Scholar] [CrossRef]
  55. Ji, Y.; Tang, Q.; Yan, L.; Wu, S.; Yan, L.; Tan, D.; Chen, J.; Chen, Q. Spatiotemporal Variations and Influencing Factors of Terrestrial Evapotranspiration and Its Components during Different Impoundment Periods in the Three Gorges Reservoir Area. Water 2021, 13, 2111. [Google Scholar] [CrossRef]
  56. Zhan, Y.; Zhang, W.; Yan, Y.; Wang, C.; Rong, Y.; Zhu, J.; Lu, H.; Zheng, T. Anaysis of actual evapotranspiration evolution and influencing factors in the Yangtze River Basin. Acta Ecol. Sin. 2021, 41, 1–12. [Google Scholar]
  57. Ye, X.; Li, X.; Liu, J.; Xu, C.Y.; Zhang, Q. Variation of reference evapotranspiration and its contributing climatic factors in the Poyang Lake catchment, China. Hydrol. Process. 2014, 28, 6151–6162. [Google Scholar] [CrossRef]
  58. Li, X.; He, Y.; Zeng, Z.; Lian, X.; Wang, X.; Du, M.; Jia, G.; Li, Y.; Ma, Y.; Tang, Y. Spatiotemporal pattern of terrestrial evapotranspiration in China during the past thirty years. Agric. For. Meteorol. 2018, 259, 131–140. [Google Scholar] [CrossRef]
  59. Li, Q.; Luo, Z.; Zhong, B.; Zhou, H. An improved approach for evapotranspiration estimation using water balance equation: Case study of Yangtze River Basin. Water 2018, 10, 812. [Google Scholar] [CrossRef]
  60. Chen, Y.; Xia, J.; Liang, S.; Feng, J.; Fisher, J.B.; Li, X.; Li, X.; Liu, S.; Ma, Z.; Miyata, A. Comparison of satellite-based evapotranspiration models over terrestrial ecosystems in China. Remote Sens. Environ. 2014, 140, 279–293. [Google Scholar] [CrossRef]
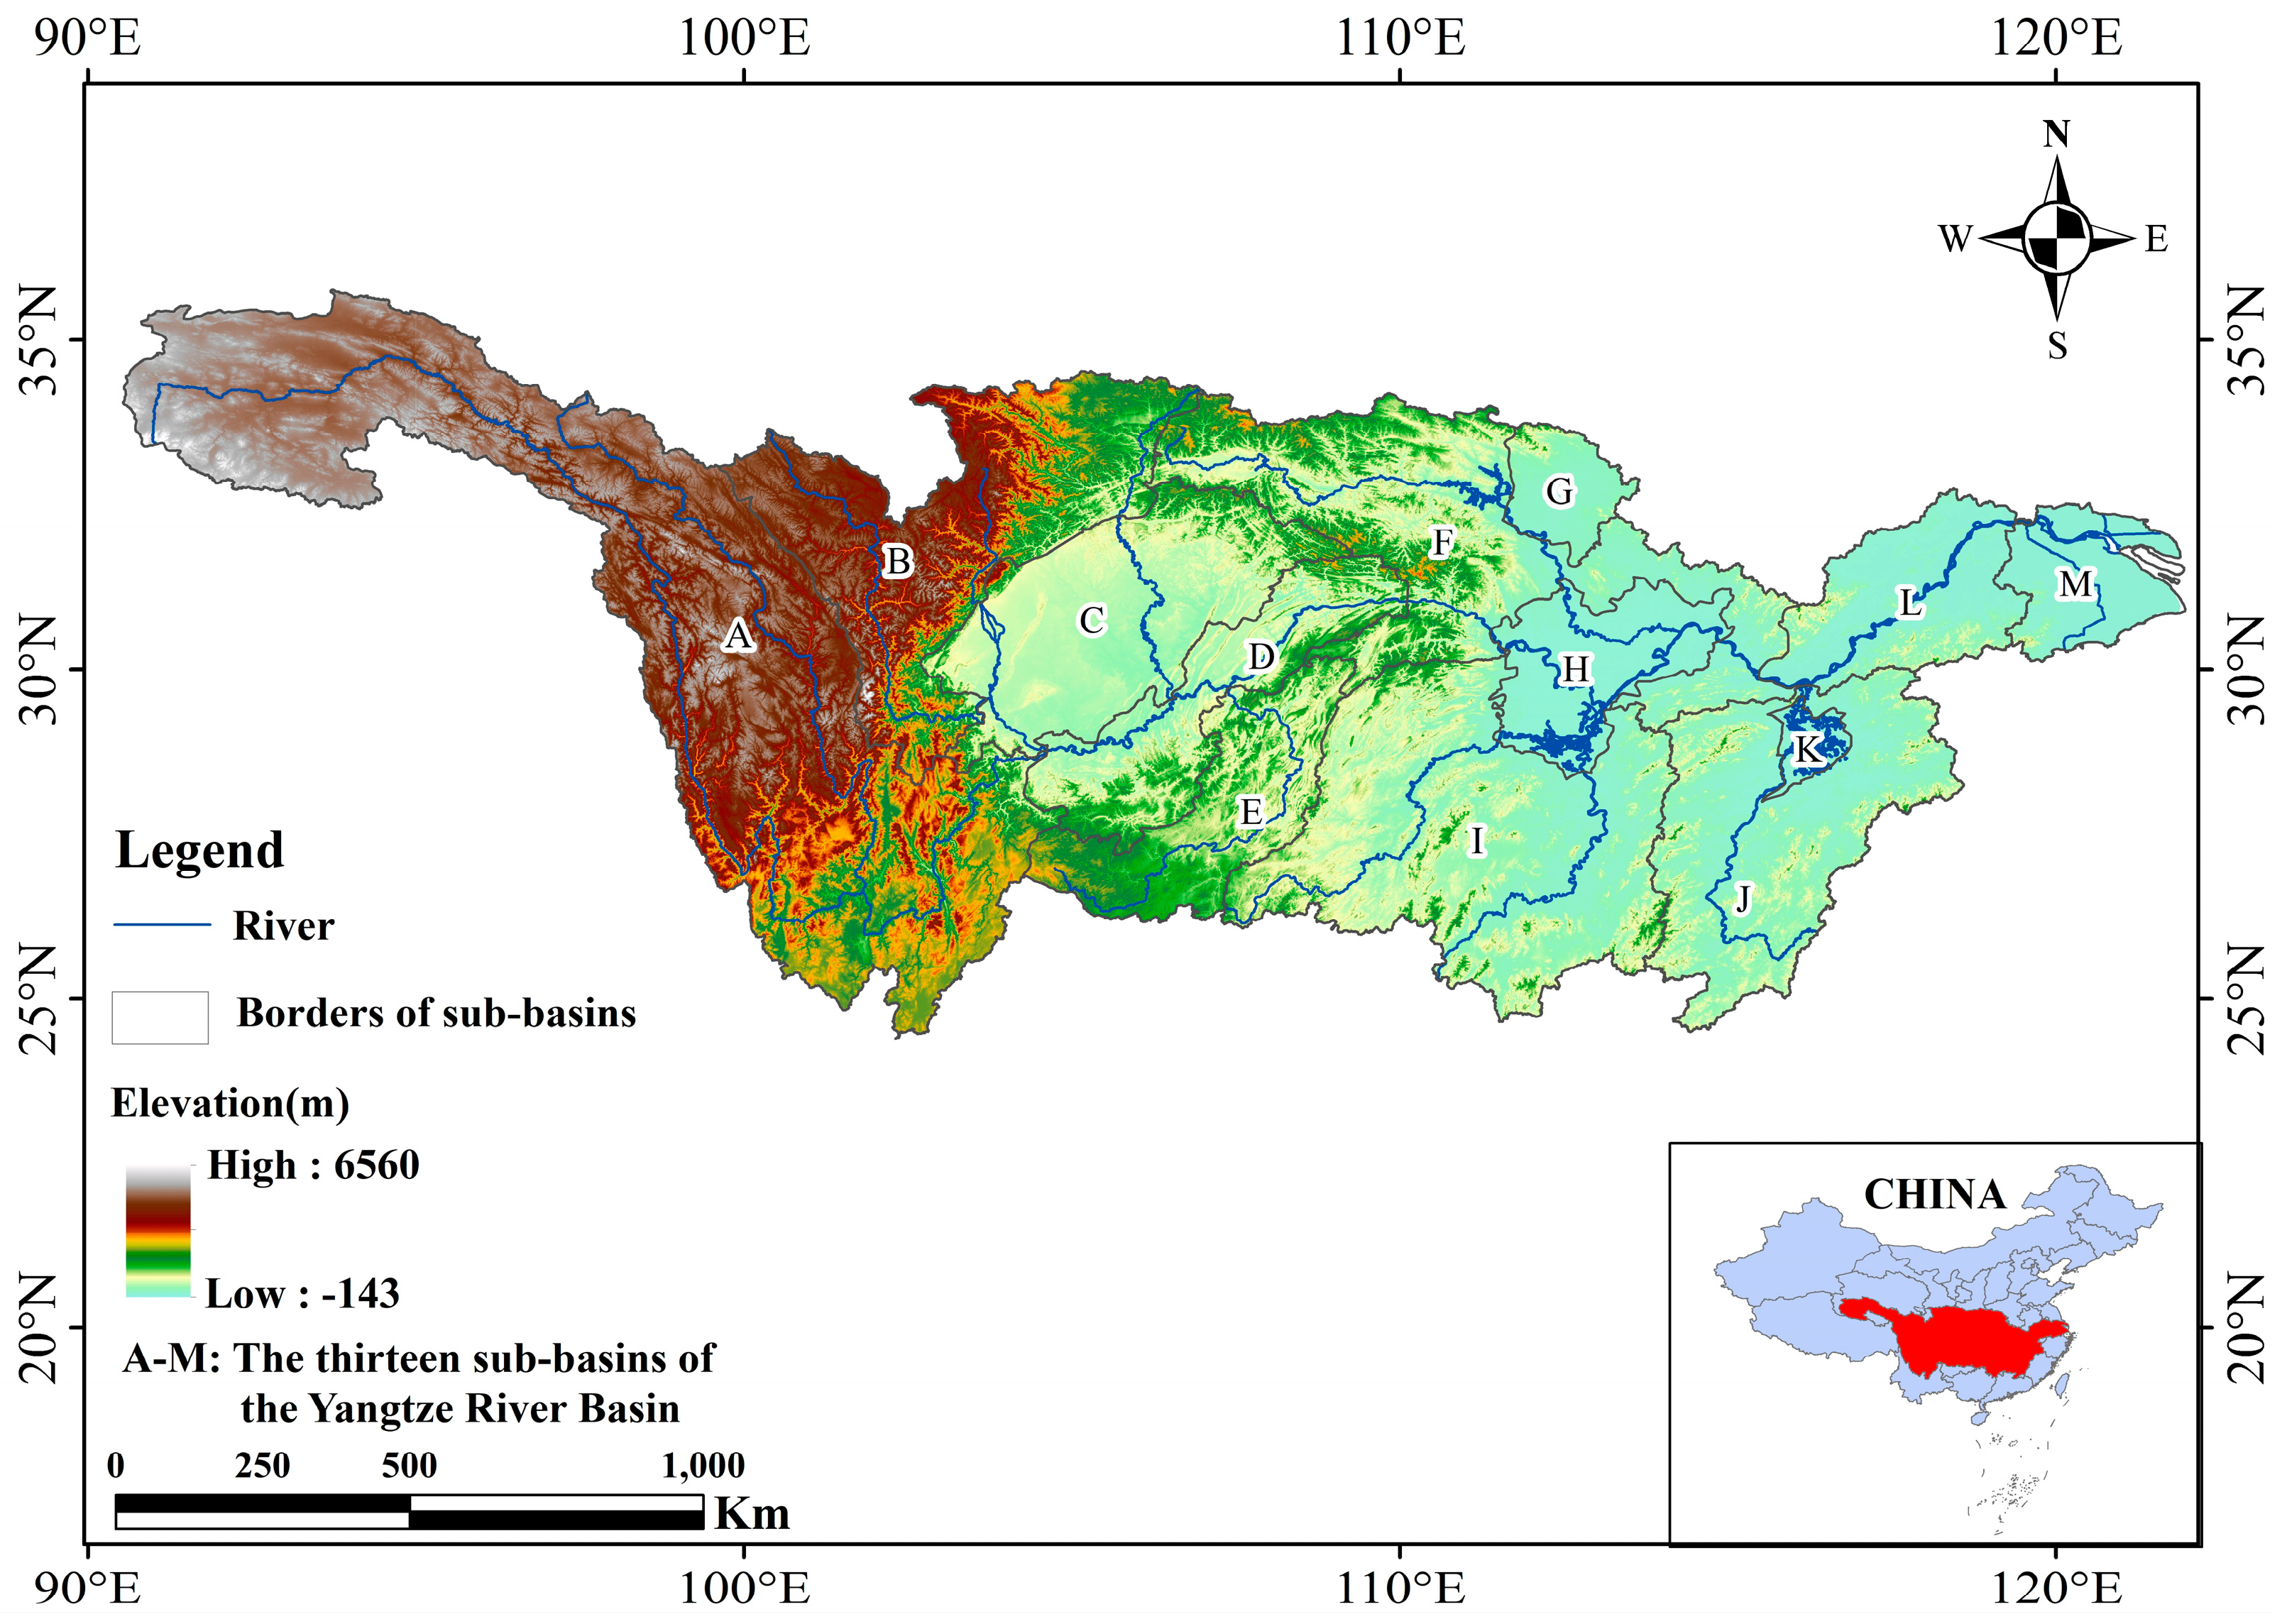
Figure 1. Topographic conditions and sub-basin distribution in the YRB. A−M represent 13 sub-basins of the YRB, which are as follows: the Jinsha River Basin; the mountainous areas in the upper reaches of Dadu River and Jialing River; the confluence area of Sichuan Basin; the main stream area in the upper−middle reaches of the Yangtze River; the Wujiang River Basin; the middle reaches of the Yangtze River; the confluence area of Nanyang Basin; the Jianghan−Dongting Lake Plain; the Dongting Lake Basin; the mountainous area of Ganjiang River Basin; the Poyang Lake Plain; the confluence area of Chao Lake and the plain along Wanjiang River; and the confluence area of the Yangtze River Delta.
Atmosphere 14 01282 g001
Figure 2. Interannual variation of average ET in the YRB from 2001 to 2020.
Atmosphere 14 01282 g002
Figure 3. (a) Spatial distribution of mean ET on a per pixel basis and (b) spatial distribution of ET change trend in the YRB from 2001 to 2020. A−M represent 13 sub-basins of the YRB, which are as follows: the Jinsha River Basin; the mountainous areas in the upper reaches of Dadu River and Jialing River; the confluence area of Sichuan Basin; the main stream area in the upper−middle reaches of the Yangtze River; the Wujiang River Basin; the middle reaches of the Yangtze River; the confluence area of Nanyang Basin; the Jianghan−Dongting Lake Plain; the Dongting Lake Basin; the mountainous area of Ganjiang River Basin; the Poyang Lake Plain; the confluence area of Chao Lake and the plain along Wanjiang River; and the confluence area of the Yangtze River Delta.
Atmosphere 14 01282 g003
Figure 4. Box plot of monthly ET in the YRB from 2001 to 2020.
Atmosphere 14 01282 g004
Figure 5. Spatial distribution of monthly ET trend in the YRB from 2001 to 2020. A−M represent 13 sub-basins of the YRB, which are as follows: the Jinsha River Basin; the mountainous areas in the upper reaches of Dadu River and Jialing River; the confluence area of Sichuan Basin; the main stream area in the upper−middle reaches of the Yangtze River; the Wujiang River Basin; the middle reaches of the Yangtze River; the confluence area of Nanyang Basin; the Jianghan−Dongting Lake Plain; the Dongting Lake Basin; the mountainous area of Ganjiang River Basin; the Poyang Lake Plain; the confluence area of Chao Lake and the plain along Wanjiang River; and the confluence area of the Yangtze River Delta.
Atmosphere 14 01282 g005
Figure 6. Spatial distribution map (a) and significance test results (b) of correlation coefficient between T and ET at the annual scale in the YRB. A−M represent 13 sub-basins of the YRB, which are as follows: the Jinsha River Basin; the mountainous areas in the upper reaches of Dadu River and Jialing River; the confluence area of Sichuan Basin; the main stream area in the upper−middle reaches of the Yangtze River; the Wujiang River Basin; the middle reaches of the Yangtze River; the confluence area of Nanyang Basin; the Jianghan−Dongting Lake Plain; the Dongting Lake Basin; the mountainous area of Ganjiang River Basin; the Poyang Lake Plain; the confluence area of Chao Lake and the plain along Wanjiang River; and the confluence area of the Yangtze River Delta.
Atmosphere 14 01282 g006
Figure 7. Correlation significance test results of monthly T and ET in the YRB. A−M represent 13 sub-basins of the YRB, which are as follows: the Jinsha River Basin; the mountainous areas in the upper reaches of Dadu River and Jialing River; the confluence area of Sichuan Basin; the main stream area in the upper−middle reaches of the Yangtze River; the Wujiang River Basin; the middle reaches of the Yangtze River; the confluence area of Nanyang Basin; the Jianghan−Dongting Lake Plain; the Dongting Lake Basin; the mountainous area of Ganjiang River Basin; the Poyang Lake Plain; the confluence area of Chao Lake and the plain along Wanjiang River; and the confluence area of the Yangtze River Delta.
Atmosphere 14 01282 g007
Figure 8. Spatial distribution map (a) and significance test results (b) of correlation coefficient between P and ET at the annual scale in the YRB. A−M represent 13 sub-basins of the YRB, which are as follows: the Jinsha River Basin; the mountainous areas in the upper reaches of Dadu River and Jialing River; the confluence area of Sichuan Basin; the main stream area in the upper−middle reaches of the Yangtze River; the Wujiang River Basin; the middle reaches of the Yangtze River; the confluence area of Nanyang Basin; the Jianghan−Dongting Lake Plain; the Dongting Lake Basin; the mountainous area of Ganjiang River Basin; the Poyang Lake Plain; the confluence area of Chao Lake and the plain along Wanjiang River; and the confluence area of the Yangtze River Delta.
Atmosphere 14 01282 g008
Figure 9. Correlation significance test results of monthly P and ET in the YRB. A−M represent 13 sub-basins of the YRB, which are as follows: the Jinsha River Basin; the mountainous areas in the upper reaches of Dadu River and Jialing River; the confluence area of Sichuan Basin; the main stream area in the upper−middle reaches of the Yangtze River; the Wujiang River Basin; the middle reaches of the Yangtze River; the confluence area of Nanyang Basin; the Jianghan−Dongting Lake Plain; the Dongting Lake Basin; the mountainous area of Ganjiang River Basin; the Poyang Lake Plain; the confluence area of Chao Lake and the plain along Wanjiang River; and the confluence area of the Yangtze River Delta.
Atmosphere 14 01282 g009
Figure 10. Spatial distribution map (a) and significance test results (b) of correlation coefficient between SR and ET at the annual scale in the YRB. A−M represent 13 sub-basins of the YRB, which are as follows: the Jinsha River Basin; the mountainous areas in the upper reaches of Dadu River and Jialing River; the confluence area of Sichuan Basin; the main stream area in the upper−middle reaches of the Yangtze River; the Wujiang River Basin; the middle reaches of the Yangtze River; the confluence area of Nanyang Basin; the Jianghan−Dongting Lake Plain; the Dongting Lake Basin; the mountainous area of Ganjiang River Basin; the Poyang Lake Plain; the confluence area of Chao Lake and the plain along Wanjiang River; and the confluence area of the Yangtze River Delta.
Atmosphere 14 01282 g010
Figure 11. Correlation significance test results of monthly SR and ET in the YRB. A−M represent 13 sub-basins of the YRB, which are as follows: the Jinsha River Basin; the mountainous areas in the upper reaches of Dadu River and Jialing River; the confluence area of Sichuan Basin; the main stream area in the upper−middle reaches of the Yangtze River; the Wujiang River Basin; the middle reaches of the Yangtze River; the confluence area of Nanyang Basin; the Jianghan−Dongting Lake Plain; the Dongting Lake Basin; the mountainous area of Ganjiang River Basin; the Poyang Lake Plain; the confluence area of Chao Lake and the plain along Wanjiang River; and the confluence area of the Yangtze River Delta.
Atmosphere 14 01282 g011
Figure 12. Spatial distribution map (a) and significance test results (b) of correlation coefficient between SH and ET at the annual scale in the YRB. A−M represent 13 sub-basins of the YRB, which are as follows: the Jinsha River Basin; the mountainous areas in the upper reaches of Dadu River and Jialing River; the confluence area of Sichuan Basin; the main stream area in the upper−middle reaches of the Yangtze River; the Wujiang River Basin; the middle reaches of the Yangtze River; the confluence area of Nanyang Basin; the Jianghan−Dongting Lake Plain; the Dongting Lake Basin; the mountainous area of Ganjiang River Basin; the Poyang Lake Plain; the confluence area of Chao Lake and the plain along Wanjiang River; and the confluence area of the Yangtze River Delta.
Atmosphere 14 01282 g012
Figure 13. Correlation significance test results of monthly SH and ET in the YRB. A−M represent 13 sub-basins of the YRB, which are as follows: the Jinsha River Basin; the mountainous areas in the upper reaches of Dadu River and Jialing River; the confluence area of Sichuan Basin; the main stream area in the upper−middle reaches of the Yangtze River; the Wujiang River Basin; the middle reaches of the Yangtze River; the confluence area of Nanyang Basin; the Jianghan−Dongting Lake Plain; the Dongting Lake Basin; the mountainous area of Ganjiang River Basin; the Poyang Lake Plain; the confluence area of Chao Lake and the plain along Wanjiang River; and the confluence area of the Yangtze River Delta.
Atmosphere 14 01282 g013
Figure 14. Spatial distribution map (a) and significance test results (b) of correlation coefficient between U and ET at the annual scale in the YRB. A−M represent 13 sub-basins of the YRB, which are as follows: the Jinsha River Basin; the mountainous areas in the upper reaches of Dadu River and Jialing River; the confluence area of Sichuan Basin; the main stream area in the upper−middle reaches of the Yangtze River; the Wujiang River Basin; the middle reaches of the Yangtze River; the confluence area of Nanyang Basin; the Jianghan−Dongting Lake Plain; the Dongting Lake Basin; the mountainous area of Ganjiang River Basin; the Poyang Lake Plain; the confluence area of Chao Lake and the plain along Wanjiang River; and the confluence area of the Yangtze River Delta.
Atmosphere 14 01282 g014
Figure 15. Correlation significance test results of monthly U and ET in the YRB. A−M represent 13 sub-basins of the YRB, which are as follows: the Jinsha River Basin; the mountainous areas in the upper reaches of Dadu River and Jialing River; the confluence area of Sichuan Basin; the main stream area in the upper−middle reaches of the Yangtze River; the Wujiang River Basin; the middle reaches of the Yangtze River; the confluence area of Nanyang Basin; the Jianghan−Dongting Lake Plain; the Dongting Lake Basin; the mountainous area of Ganjiang River Basin; the Poyang Lake Plain; the confluence area of Chao Lake and the plain along Wanjiang River; and the confluence area of the Yangtze River Delta.
Atmosphere 14 01282 g015
Figure 16. The spatial regions of ET driven by climatic factors in the YRB from 2001 to 2020 at the annual scale. A−M represent 13 sub-basins of the YRB, which are as follows: the Jinsha River Basin; the mountainous areas in the upper reaches of Dadu River and Jialing River; the confluence area of Sichuan Basin; the main stream area in the upper−middle reaches of the Yangtze River; the Wujiang River Basin; the middle reaches of the Yangtze River; the confluence area of Nanyang Basin; the Jianghan−Dongting Lake Plain; the Dongting Lake Basin; the mountainous area of Ganjiang River Basin; the Poyang Lake Plain; the confluence area of Chao Lake and the plain along Wanjiang River; and the confluence area of the Yangtze River Delta.
Atmosphere 14 01282 g016
Figure 17. Area proportion of dominant climatic factors of monthly ET in the YRB from 2001 to 2020.
Atmosphere 14 01282 g017
Figure 18. Spatial regions of ET driven by climatic factors in the YRB from 2001 to 2020 at the monthly scale. A−M represent 13 sub-basins of the YRB, which are as follows: the Jinsha River Basin; the mountainous areas in the upper reaches of Dadu River and Jialing River; the confluence area of Sichuan Basin; the main stream area in the upper−middle reaches of the Yangtze River; the Wujiang River Basin; the middle reaches of the Yangtze River; the confluence area of Nanyang Basin; the Jianghan−Dongting Lake Plain; the Dongting Lake Basin; the mountainous area of Ganjiang River Basin; the Poyang Lake Plain; the confluence area of Chao Lake and the plain along Wanjiang River; and the confluence area of the Yangtze River Delta.
Atmosphere 14 01282 g018
Figure 19. Regional area proportion statistics of significant positive correlation between ET and T (a) on each elevation gradient in the YRB; regional area proportion statistics of significant positive correlation between ET and SR (b) on each elevation gradient in the YRB; regional area proportion statistics of significant negative correlation between ET and P (c) on each elevation gradient in the YRB; the area proportion statistics of the regions with significant positive correlation between ET and T (PC_ET&T), positive correlation between ET and SR (PC_ET&SR), and negative correlation between ET and P (NC_ET&P) in the YRB on the monthly scale (d).
Atmosphere 14 01282 g019
Table 1. Level of variation trend.
Level of
variation
Extremely
significant
negative trend
Significant
negative trend
Non-significant trendSignificant
positive trend
Extremely
significant
positive trend
Case β < 0 and α ≤ 0.01 β < 0 and
0.01 < α ≤ 0.05
α > 0.05 β > 0 and
0.01 < α ≤ 0.05
β > 0 and α ≤ 0.01
Table 2. Elevation classification in the YRB.
LevelElevation Interval/mArea/km2Percentage/%
I−143~50069.9038.83%
II500~100028.0215.56%
III1000~150016.088.94%
IV1500~20009.285.15%
V2000~25008.204.55%
VI2500~30005.162.86%
VII3000~35004.882.71%
VIII3500~40007.073.93%
IX4000~450013.057.25%
X4500~500015.948.86%
XI5000~55002.231.24%
XII>55000.190.11%
Disclaimer/Publisher’s Note: The statements, opinions and data contained in all publications are solely those of the individual author(s) and contributor(s) and not of MDPI and/or the editor(s). MDPI and/or the editor(s) disclaim responsibility for any injury to people or property resulting from any ideas, methods, instructions or products referred to in the content.