Abstract
Severe typhoon “In-Fa” passed through the northwestern region of East China Sea (ECS) in July 2021, affecting oceanic variables such as seawater temperature, salinity, and chlorophyll-a (Chl-a) concentration over the upwelling area. In this study, we analyzed the influence of the passage of typhoon “In-Fa” on the marine environment over the Upwelling Area off the Yangtze River Estuary (UAYRE) and the Upwelling Area of Zhoushan (UAZS). The results showed a significant decrease in sea surface temperature (SST) during the “In-Fa” typhoon, with maximum SST reductions of 2.98 °C in the UAYRE and 1.46 °C in the UAZS, which showed a “right bias” (indicating a greater cooling effect on the right side of the typhoon path compared to the left side). “In-Fa” influenced the temperature and salinity structure of the study areas and deepened the mixed layer depth (MLD). The MLD varied from the shallowest values of 2.02 m (18 July) to the deepest values of 19.4 m (26 July) in the UAYRE and from 2.43 m (18 July) to 16.79 m (25 July) in the UAZS. Furthermore, “In-Fa” led to an increase in sea surface Chl-a concentration, with a maximum Chl-a concentration enhancement of 285.58% (from 20 July to 28 July) in the UAYRE and 233.33% (from 20 July to 27 July) in the UAZS. The Ekman suction effect of “In-Fa” strengthened the upwelling, facilitating the transport of deep-sea nutrients to the upper ocean and providing favorable conditions for the growth of phytoplankton, thus benefiting the reproduction and survival of zooplankton, fish, and shrimp. This study contributes to understanding the mechanisms by which typhoons impact the ocean environment in upwelling area and provides valuable insights for the sustainable development of marine fisheries resources.
1. Introduction
Tropical cyclones are intense weather systems occurring over tropical and subtropical oceanic regions. Along the Northwest Pacific Coast, tropical cyclones with wind speeds reaching or exceeding 12 on the Beaufort scale are referred to as typhoons [1,2]. Over the past few decades, increasing carbon dioxide emissions from human activities have caused global warming, resulting in weakened summer tropical circulation, leading to an increase in the frequency and intensity of typhoons with a diminution in their movement [3,4,5]. Typhoons significantly influence the oceanic dynamical system, generating vigorous vertical mixing and inducing substantial heat, energy, and material exchange between the upper and deeper water masses [6]. On one hand, typhoons induce strong physical and biological responses at the sea surface, causing a decrease in SST and an increase in surface Chl-a concentration [5]. On the other hand, typhoon passages lead to upwelling and turbulent mixing, altering the seawater temperature and salinity structure, and deepening the oceanic mixed layer [7,8]. Additionally, the intense precipitation associated with typhoons can increase river runoff, affecting seawater temperature, salinity, and Chl-a concentration over the coastal areas [9].
The East China Sea (ECS), as a marginal sea of the Northwest Pacific, and in its northwestern part, exhibits an upwelling area influenced by the combined effects of wind, topography, the Taiwan Warm Current, etc. [10,11,12]. This region is frequently influenced by typhoons. Over a 30-year period from 1990 to 2019, a total of 20 typhoons traversed the upwelling area in the Northwestern ECS, with 9 occurring between 2010 and 2019 [13]. Despite occupying only 5% of the world’s ocean area, the upwelling area contributes to 25% of the global fish catches [14]. The upwelling brings up a substantial amount of nutrients to the sea surface, enhancing primary productivity and promoting an increase in fish abundance and diversity. The main fishing grounds in the ECS are predominantly located within the upwelling area in the Northwestern ECS [15]. The upwelling plays a crucial role in facilitating energy flow within the food web, sustaining air–sea CO2 exchange, and carbon cycling [16]. Potential changes in the upwelling area could have significant socio-economic and ecological implications [12].
During typhoon periods, cloud cover can cause data gaps in remote sensing observations [17]; fishing activities are quite frequent in the ECS, making it challenging to conduct long-term on-site mooring observations [18]; additionally, the adverse sea conditions during typhoons make it unfavorable for conducting observational voyages and in situ observations at sea [19]. Generally, reanalysis/model products combined multi-source satellite remote sensing data with observations from across the world into a globally complete and consistent dataset using the laws of physics have advantages of providing high resolution and vertical information [20,21,22]. In this study, the reanalysis data from ERA5 (the fifth generation ECMWF (European Centre for Medium-Range Weather Forecasts) atmospheric reanalysis of the global climate) and model products from Global Ocean 1/12 Physics Analysis and Forecast updated Daily are used to analyze the effects of “In-Fa” on the wind field, seawater temperature, salinity, MLD, and Chl-a concentration in the upwelling areas of the Northwestern ECS (region: 121.0 to 124.0 E, 28.5 to 32.5 N). The study aims to elucidate the mechanisms through which “In-Fa” influenced the marine environment of the upwelling areas in the Northwestern ECS. The findings of this study will provide valuable insights into the conservation of the ecological environment and the development of the fisheries economy in the ECS.
2. Materials and Methods
2.1. Study Area
This study focuses on the two upwelling areas in the Northwestern East China Sea (see Figure 1). The first area is the Upwelling Area off the Yangtze River Estuary (UAYRE), which is located in the east of the Yangtze River Estuary, and UAYRE is formed by the rise in Taiwan Warm Current due to various dynamic factors such as the offshore Ekman transport, baroclinic effect, and tidal mixing [23,24,25,26]; the second area is the Upwelling Area of Zhoushan (UAZS), which is located along the northern coast of Zhejiang Province, is formed by a combination of southwestern monsoon, frontal upwelling, and tidal mixing [10,11,27,28]. In Figure 1, the two red dashed boxes represent the UAYRE (area: 122.5 to 123.0 E, 31.0 to 31.5 N, maximum depth of 64.91 m, north) and the UAZS (area: 122.5 to 123.0 E, 29.5 to 30.0 N, maximum depth of 69.61 m, south). Moreover, in the following figures, the two boxes also represent the two upwelling areas. UAZS is situated along the path of “In-Fa”, and UAYRE is located to the right side of the “In-Fa” path (see Figure 2). In Figure 1, the color variation in the ocean from white to blue indicates the increasing ocean depth, and in this figure and the other figures below, white–gray indicates land.
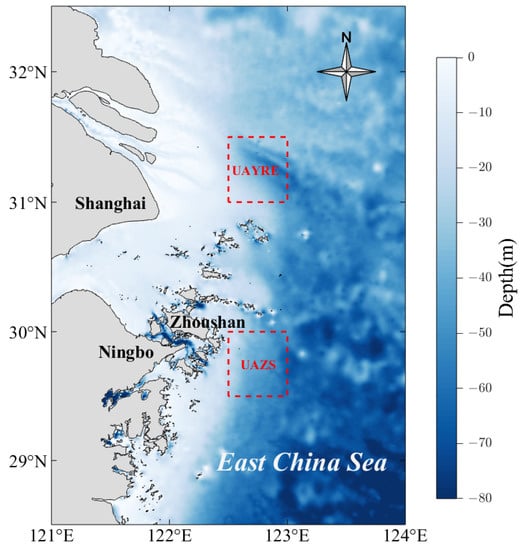
Figure 1.
Study areas. The two red dashed boxes are UAYRE (region: 122.5 to 123.0 E, 31.0 to 31.5 N, maximum depth of 64.91 m, the northern box) and UAZS (region: 122.5 to 123.0 E, 29.5 to 30.0 N, maximum depth of 69.61 m, the southern box).
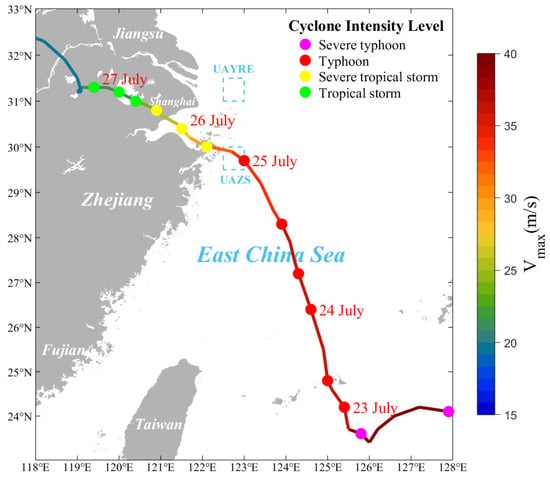
Figure 2.
The partial path of “In-Fa”. Different color lines and dots represent and cyclone intensity levels (the magenta dots represent strong typhoon, the red dots represent typhoon, the yellow dots represent strong tropical storm, and the green dots represent tropical storm).
2.2. Typhoon “In-Fa”
The No. 6 typhoon in the year 2021, “In-Fa”, was generated in the Northwestern Pacific, east of the Philippines, at 18:00 UTC (Coordinated Universal Time, all times shown below are in UTC) on 17 July, and moved westward for four days. On 21 July, “In-Fa” intensified into a severe typhoon with a maximum central wind speed () of 42 m/s and a minimum pressure of 955 hPa at the typhoon center. After reaching the ECS, “In-Fa” changed its trajectory to northwestward. At 04:30 on 25 July, “In-Fa” made its initial landfall ( was 35 m/s and the minimum pressure was 968 hPa) at Putuo, Zhoushan, Zhejiang Province, then reduced in intensity (severe tropical storm). It then continued moving towards Hangzhou Bay. It made a second landfall in Pinghu, Zhejiang Province, on 26 July. Subsequently, “In-Fa” entered Zhejiang, Jiangsu, Anhui, Shandong and Hebei provinces, and dissipated at 12:00 on 30 July. Typhoon path is shown in Figure 2 [29,30]. In Figure 2, the multicolor line represents the path of “In-Fa” and , with the color change from blue to red represents the variation in wind speed from low to high; the different colors of dots indicate different cyclone intensity levels. The path of “In-Fa” was complex, characterized by slow movement, heavy precipitation, widespread impact, and long residence time (it lasted 95 h on land, the longest since 1949). It caused significant loss of life and inflicted severe economic damages in the East China region [31].
2.3. Data
Typhoon-related data (time, longitude/latitude position, minimum central pressure, , intensity level) are from the Tropical Cyclone Data Center of China Meteorological Administration (http://tcdata.typhoon.org.cn, accessed on 20 July 2023) and China Meteorological Administration Typhoon Online (http://typhoon.nmc.cn/web.html, accessed on 20 July 2023). The detailed information of typhoon “In-Fa” from 00:00 on 21 July to 00:00 on 27 July 2021, is given in Table 1.

Table 1.
The path, minimum central pressure, , and intensity level of “In-Fa”.
The precipitation and wind field data of 10 m above sea surface including wind speed and direction are obtained from ERA5. The temporal and spatial resolution of precipitation and wind field data are hourly and 0.1° × 0.1°, and the time period of data is from 17 to 31 July 2021. The river discharge data of Yangtze River used in the analysis are from the Global Flood Awareness System (GloFAS). The temporal and spatial resolution of river discharge data are daily and 0.05° × 0.05°, and the time period of data is from 22 to 30 July 2021. Detailed information can be found in Table 2 (http://cds.climate.copernicus.eu/cdsapp#!/dataset/reanalysis-era5-single-levels?tab=form, accessed on 20 July 2023), (https://cds.climate.copernicus.eu/cdsapp#!/dataset/cems-glofas-historical?tab=form, accessed on 20 July 2023).

Table 2.
The wind, precipitation, seawater temperature, seawater salinity, and chlorophyll-a concentration information of “In-Fa”.
Temperature, salinity, and Chl-a concentration data are derived from Global Ocean 1/12 Physics Analysis and Forecast updated Daily model product, which covers 0.4940 to 5727.9170 m (divided into 50 layers) below the sea surface. The temporal and spatial resolution are 1 day and 0.083 degrees, respectively. The data used in this study consists of temperature, salinity, and Chl-a concentration measurements at different depths (0.4940 to 55.7643 m, divided into 19 layers) from 17 to 31 July 2021. Table 2 reveals the detail information (http://data.marine.copernicus.eu/product/GLOBAL_ANALYSIS_FORECAST_PHY_001_024/, accessed on 20 July 2023).
2.4. Method
2.4.1. The Calculation Method of Ekman Pumping Velocity (EPV)
The strong vortex shear of typhoon can cause Ekman pumping/suction (i.e., downward/upward velocity) in ocean [32]. In this study, Ekman pumping velocity (EPV) is adopted to represent the strength and direction of typhoon-induced vertical transport of seawater. The value of EPV represents the vertical transport velocity of seawater, indicating either downward convergence or upward divergence. When EPV is negative, it indicates an anticyclonic wind pattern above the ocean, exerting a pumping effect on the seawater and causing it to descend. Conversely, when EPV is positive, it indicates a cyclonic wind pattern above the ocean, exerting a suction effect on the seawater and causing it to ascend [32,33,34].
The Climate Data Toolbox for MATLAB [35,36,37] is used to calculate the EPV, and it can be calculated based on the Formula (1):
in Formula (1), is the seawater density, and in this paper, it is 1028 kg/m3 [36]. is Coriolis frequency (, is the angular velocity of the earth rotation, is the latitude). is the wind stress, and it can be calculated using the zonal and meridional wind speed of 10 m above the sea surface, calculated using the Formula (2) given below:
in Formula (2), kg/m3 [36]. (m/s) and (m/s) are the zonal and meridional wind speed of 10 m above the sea surface, respectively. specifies a drag coefficient for wind stress calculation [36], and it can be a scalar or a matrix whose dimensions match and .
2.4.2. The Calculation Method of Mixed Layer Depth (MLD)
There are two methods used to calculate the MLD: the difference method and the gradient method [38]. In this study, the difference method is used, where the density is calculated from the sea surface salinity and the temperature that is one (temperature difference criterion, measured in °C) lower than the sea surface temperature, and the depth associated with this density is considered as the MLD. In this paper, the temperature difference criterion is set at 0.5 °C for the ECS [18].
The algorithm is implemented by using the ra_mld function of MATLAB [39]. The density difference (the unit is kg/m3) can be calculated using Formula (3):
in Formula (3), is density excess (or density anomaly, the unit is kg/m3); S is practical salinity (PSU), and is pressure (the unit is decibars), where S and are set to zero; is seawater temperature (the unit is °C). The density difference is obtained from Formula (4):
in Formula (4), is the density of seawater (the unit is kg/m3), the calculation method is shown in Formula (5):
in Formula (5), is the density of seawater at a standard atmosphere, and is the secant bulk modulus.
2.4.3. Min–Max Normalization
To facilitate the analysis of the relationship between seawater temperature and surface wind speed, both datasets were subjected to normalization. The Min–Max Normalization is shown in Formula (6):
in Formula (6), and represent the data before and after conversion, respectively, and and represent the maximum and minimum values of the dataset, respectively [17].
3. Results
3.1. EPV
The EPV is an essential index for characterizing the vertical movement of seawater [40]. Based on wind vector data at 10 m above the sea surface, the EPV in the Northwestern ECS was calculated using the Formulas (1) and (2), and the results are illustrated in Figure 3. Figure 3a–d are the variations in EPV, wind speed, and wind direction before the impact of “In-Fa” (03:00 on 17 July), during the peripheral influence of spiral rain band of “In-Fa” (05:00 on 21 July), the imminent landing of “In-Fa” (23:00 on 24 July), and after the transit of “In-Fa” (11:00 on 28 July), respectively. In Figure 3 and the following figures, the colored area is the ocean. In Figure 3, the color change from green to red indicates the variations in EPV, in which the green represents negative values and the red represents positive values. The magnitude is in the order of 10−5 and the unit is m/s. The blue arrows represent the wind direction, and the length of the arrows indicates the wind speed (shorter to longer indicating increasing wind speed). In Figure 3 and the following figures, the grey line indicates the path of “In-Fa”, and the white dot on the path of “In-Fa” in Figure 3c represents the typhoon center.
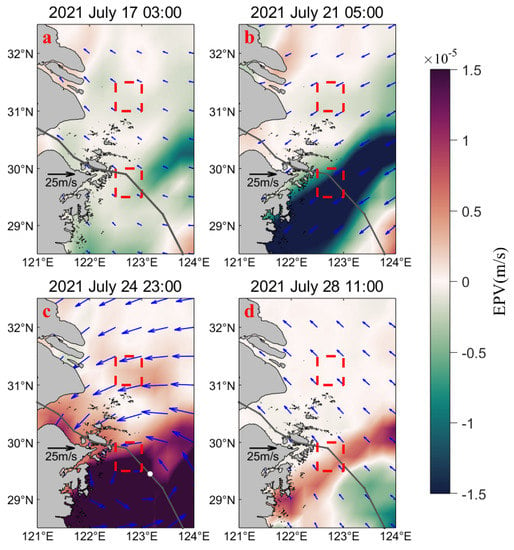
Figure 3.
Variations in wind speed, wind direction, and EPV before, during, and after “In-Fa”. (a–d) are the wind speed, wind direction, and EPV changes at 03:00 on 17 July, 05:00 on 21 July, 23:00 on 24 July, and 11:00 on 28 July, respectively. The red dashed boxes represent upwelling areas, and the white dot on the path of “In-Fa” in Figure 3c represents the typhoon center.
Before arrival of “In-Fa” (Figure 3a, 17 July), the predominant wind direction in the Northwestern ECS was southeast, with wind speeds ranging from 3.5 to 7.14 m/s; the EPV was relatively small and mostly negative, and the ocean was under less wind stress at that time. When the Northwestern ECS was under the peripheral influence of the spiral rain band of “In-Fa” (Figure 3b, 21 July), the wind direction shifted northeasterly, and the wind speed increased compared to that before “In-Fa” (Figure 3a, 17 July), ranging from 5.35 to 13.1 m/s; and the EPV of UAZS increased. While the EPV in UAYRE changed little, similar to the condition on 17 July, and during this time, the wind field above the sea surface exerted a stronger pumping effect on the ocean. At the imminent landing of “In-Fa” (Figure 3c, 24 July), the wind field in the Northwestern ECS strengthened, with wind speeds ranging from 6 to 25 m/s; the EPV became positive in both upwelling areas, with the EPV in UAZS exceeding m/s, while the EPV in UAYRE remained relatively small. On the third day after the landfall of “In-Fa” (Figure 3d, 28 July), the wind direction in the Northwestern ECS returned to its state before “In-Fa” (southeasterly winds), and the wind speed decreased, ranging from 4.4 to 10.7 m/s; the EPV in both upwelling areas gradually decreased.
3.2. The Change in Seawater Temperature during “In-Fa” Period
3.2.1. SST
The intense air–sea interaction during the typhoon can have an impact on SST [5]. We analyzed the spatial variations in daily average SST in the Northwestern ECS before (from 17 to 23 July), during (from 24 to 26 July), and after (from 27 to 31 July) the transit of “In-Fa”, and the results are presented in Figure 4. In Figure 4a–c, the color of the ocean from blue to red represents the SST variation (range: 23 to 30 °C). Before the transit of “In-Fa” (Figure 4a, from 17 to 23 July), there was a narrow “cold water belt” (region: 122.5 to 123.0 E, 31.0 to 31.5 N) in the Northwestern ECS, which contrasted with the warm water areas near the coast and in the southeastern part of UAZS. During the transit of “In-Fa” (Figure 4b, from 24 to 26 July), the SST dropped extensively in the Northwestern ECS, while a “cool pool” appeared in the eastern waters of Shanghai, and the SST in UAYRE was lower compared to UAZS. After the transit of “In-Fa” (Figure 4c, from 27 to 31 July), the SST in both upwelling areas gradually increased, but there still remained a widespread low-temperature waters in the north of the Yangtze River Estuary, and the warm water area in the southeastern part of UAZS gradually expanded.
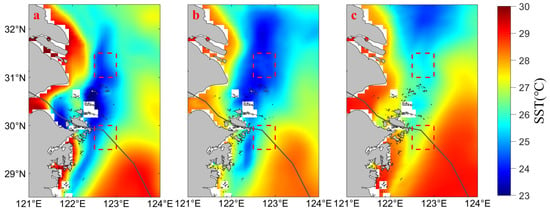
Figure 4.
Changes of SST before, during, and after “In-Fa”. (a–c) are daily average SST in the Northwestern ECS before (from 17 to 23 July), during (from 24 to 26 July), and after (from 27 to 31 July) the transit of “In-Fa”, respectively. The red dashed boxes represent upwelling areas.
To illustrate the variation in SST during “In-Fa” period, the diurnal SST of the Northwestern ECS, UAYRE, and UAZS were analyzed separately and the results are given in Figure 5. In Figure 5, the green, blue, and red curves represent the diurnal variations in SST in the Northwestern ECS, UAYRE, and UAZS from 17 to 31 July, respectively. The red dashed ellipse indicates the time when “In-Fa” passed through the Northwestern ECS (same applies to the following). As displayed in Figure 5, the SST increased in the Northwestern ECS and both upwelling areas from 17 to 19 July. The SST in the two upwelling areas began to decline on 19 July and reached its minimum value in UAYRE on 26 July and in UAZS on 27 July. The maximum decrease in SST was 2.98 °C in UAYRE and 1.46 °C in UAZS. UAYRE, located on the right side of the typhoon’s path, experienced a greater impact from “In-Fa”. The SST of UAYRE and UAZS began to recover after 26 and 27 July, respectively.
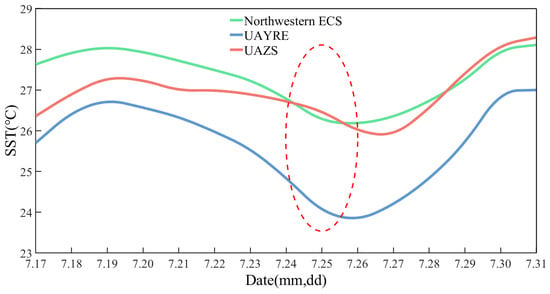
Figure 5.
Variations in SST in the Northwestern ECS and the two upwelling areas from 17 to 31 July. Green, blue, and red curves are the diurnal variations in SST in the Northwestern ECS, UAYRE, and UAZS, respectively. The red dashed ellipse indicates the time when “In-Fa” passed through the Northwestern ECS.
3.2.2. Vertical Distribution of Seawater Temperature
The decrease in SST during the typhoon process is not only caused by strong wind stress-induced evaporation and wind-induced cooling but also related to the uplift of cold deep water caused by Ekman suction [41]. The effect of “In-Fa” on the water temperature below the sea surface was analyzed by using the daily average seawater temperature at a depth of 10 m below the sea surface (10 m SWT) in the Northwestern ECS, and the results are displayed in Figure 6. In Figure 6a–c, the color of the ocean changes from blue to red to indicate an increase in temperature (range: 22 to 30 °C). The blank areas near the coast represent the continental shelf, where data for 10 m SWT are not available. Before the transit of “In-Fa” (Figure 6a, from 17 to 23 July), the 10 m SWT was lower in the nearshore and higher in the offshore areas. During the transit (Figure 6b, from 24 to 26 July), the low-temperature area near UAYRE gradually expanded; however, the low-temperature area of 10 m SWT near UAZS gradually decreased, and the seawater temperature increased. After the transit of “In-Fa” (Figure 6c, from 27 to 31 July), the low-temperature area of UAYRE sea area expanded, the low-temperature area gradually extended northward, while the seawater temperature in the UAZS region began to recover.
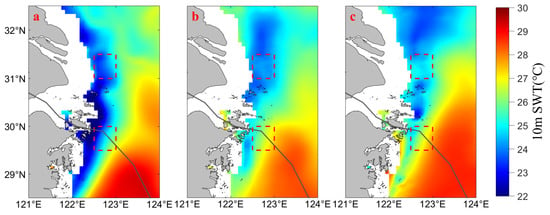
Figure 6.
Changes of 10 m SWT before, during, and after “In-Fa”. (a–c) are daily average 10 m SWT in the Northwestern ECS before (from 17 to 23 July), during (from 24 to 26 July), and after (from 27 to 31 July) the transit of “In-Fa”, respectively. The red dashed boxes represent upwelling areas.
To elucidate further influence of “In-Fa” on seawater temperature, the Min–Max Normalization was applied to the 10 m SWT and 10 m wind speed above the sea surface within the two upwelling areas, and the results are exhibited in Figure 7a,b. In Figure 7a,b, the red curve represents the 10 m SWT, and the cyan curve represents the wind speed. The 10 m SWT in both upwelling areas began to increase on 17 July and continued to rise until 23 July. From 23 to 26 July, the 10 m SWT in UAYRE experienced a decline, followed by a gradual increase after 26 July. While the 10 m SWT in UAZS showed a decline from 23 to 27 July, followed by a gradual increase after 27 July. The maximum 10 m wind speed above the sea surface of UAYRE and UAZS appeared on 25 July and 24 July, respectively.
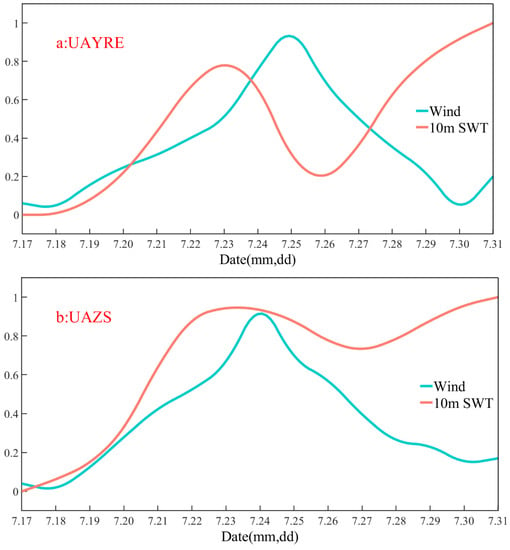
Figure 7.
Min–Max Normalization of the 10 m SWT and the 10 m wind speed above the sea surface in the two upwelling areas from 17 to 31 July. The results of Min–Max Normalization are shown as (a,b), and the red curve represents the 10 m SWT and the cyan curve represents the wind speed.
Two sections were selected at 31.5 N (located in the northernmost part of UAYRE) and 30.0 N (located in the northernmost part of UAZS) to analyze the vertical variations in seawater temperature (0 to −55.76 m, divided into 19 layers) in the two upwelling areas during different phases of “In-Fa” process (before, from 17 to 23 July; during, from 24 to 26 July; after, from 27 to 31 July), and the results are presented in Figure 8. Figure 8a,d are the vertical distributions of daily average seawater temperature in the two upwelling areas before the transit of “In-Fa”, Figure 8b,e are the vertical distributions during the transit of “In-Fa”, and Figure 8c,f are the vertical distributions after the transit of “In-Fa”. In Figure 8, the change in color of the ocean from blue to red indicates an increase in seawater temperature (range: 20 to 28 °C), and the white dotted ellipses represent the two upwelling areas. From Figure 8a,d, it can be observed that the seawater temperature in the horizontal direction before the transit of “In-Fa” (from 17 to 23 July) indicated “high value near the shore, low value in the upwelling areas, high value offshore,” with the presence of a “cool water tongue” in both upwelling areas. During the transit (from 24 to 26 July), the upwelling of cold water from the bottom of the ocean due to the stirring effect of “In-Fa” caused the upwelling area to become a “cold pool”, and the seawater temperature in the non-upwelling area also decreased significantly (Figure 8b,e). After the transit of “In-Fa”, the seawater temperature gradually returned to its pre-transit state (Figure 8c,f).
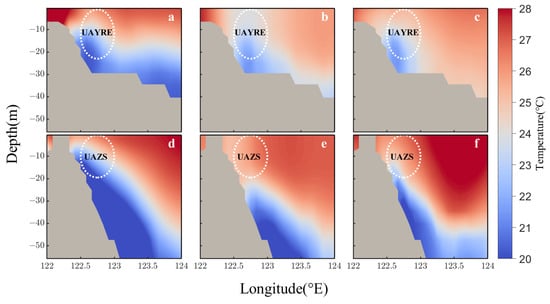
Figure 8.
The vertical distribution of seawater temperature in two upwelling areas during the “In-Fa” period. (a–c) are the sea temperature of the 31.5 N section before (from 17 to 23 July), during (from 24 to 26 July), and after (from 27 to 31 July) the transit of “In-Fa”; (d–f) correspond to the seawater temperature of the 30.0 N section in the three stages of UAZS, respectively. The white dotted circles are two upwelling areas.
3.3. Variation in Sea Surface Salinity (SSS) during “In-Fa” Period
The SSS affected by precipitation, evaporation, mixing, and Ekman pumping when typhoon passes. The intense or slow-moving typhoon can cause widespread increases in SSS, and the response of SSS to typhoons exhibits asymmetry [42]. In this study, we analyzed the impact of “In-Fa” on SSS in the sea areas passed through, and the results are given in Figure 9. In Figure 9, the green, blue, and red curves represent the diurnal variations in SSS in the Northwestern ECS, UAYRE, and UAZS from 17 to 31 July, respectively. The SSS in both upwelling areas was higher than that in the Northwestern ECS, and before the transit of “In-Fa” (17 July), the SSS in the Northwestern ECS, UAYRE, and UAZS were 29.29, 33.07, and 33.82, respectively. Affected by “In-Fa”, SSS in the Northwestern ECS demonstrated an increasing trend from 17 to 25 July, reaching its peak on 25 July, and the SSS of UAYRE conformed a similar trend to that of the Northwestern ECS, while the SSS of UAZS did not change significantly during this period. When the center of the “In-Fa” passed UAZS (after 25 July), SSS decreased in all three regions. After 28 July, the SSS decreased significantly in the Northwestern ECS and UAYRE, with a decrease of 1.02 and 1.99, respectively, by 31 July. However, the SSS in UAZS decreased by only 0.19. The SSS extreme values of UAYRE and UAZS were 2.07 and 0.75, respectively, indicating that the SSS of UAYRE was more significantly affected by “In-Fa”.
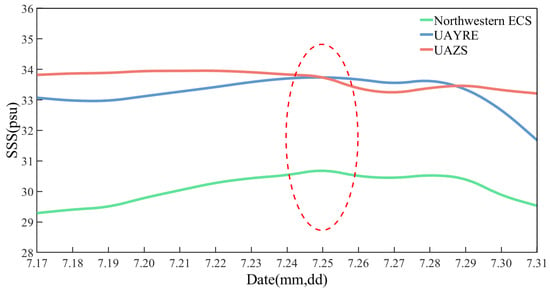
Figure 9.
Variations in SSS in the Northwestern ECS and the two upwelling areas from 17 to 31 July. Green, blue, and red curves are the diurnal variations in SSS in the Northwestern ECS, UAYRE, and UAZS, respectively. The red dashed ellipse indicates the time when “In-Fa” passed through the Northwestern ECS.
3.4. The Change in Mixed Layer Depth (MLD) during the “In-Fa” Period
The air–sea interaction occurs through the exchange of heat and momentum between the atmosphere and the mixed layer of ocean [43]. Typhoons can alter the temperature and salt structure of seawater and thus affect the MLD [8]. Using the Formula (3)–(5), the MLD in the Northwestern ECS was calculated based on seawater temperature and salinity, and the results are presented in Figure 10. Figure 10a–c represent the MLD of the three days before (19 July), during (25 July), and after (30 July) the transit of “In-Fa”, respectively. In Figure 10, the color of the ocean region changes from yellow to blue, representing an increase in MLD (range: 0 to 30 m). The MLD in the coastal water cannot be calculated due to severe wind and cooling, precipitation, and increased runoff during “In-Fa”. Therefore, the MLD information in the nearshore seas is lacking during this period. Before “In-Fa” (Figure 10a), the MLD in both upwelling areas was less than 5 m. During the transit of “In-Fa” (Figure 10b), the MLD in the Northwestern ECS deepened. After the passage of “In-Fa” (Figure 10c), the MLD in the Northwestern ECS returned to a similar state as before the typhoon. Whether or not affected by “In-Fa”, the nearshore MLD in the Northwestern ECS is smaller than that in the offshore region.
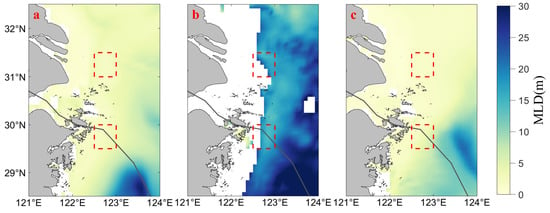
Figure 10.
Spatial variation in MLD in the sea affected by “In-Fa”. (a–c) are the MLDs of the three days before (19 July), during (25 July), and after (30 July) the transit of “In-Fa”, respectively. The red dashed boxes represent upwelling areas.
To better understand the diurnal variations in MLD during the “In-Fa” transit, the daily average MLD analysis of the Northwestern ECS and the two upwelling areas are shown in Figure 11. From Figure 11, it can be observed that the MLD in UAYRE increased from its shallowest value of 2.02 m (18 July) before “In-Fa” to its deepest value of 19.4 m (26 July), while the MLD in UAZS increased from 2.43 m (18 July), its shallowest value, to a maximum depth of 16.79 m (25 July). The increase in MLD was greater in UAYRE compared to UAZS. The maximum MLD in UAZS occurred on 25 July, while in UAYRE, it reached the highest value on 26 July. After the transit of “In-Fa” (30 July), the MLD of UAYRE and UAZS decreased to 1.57 m and 3.64 m, respectively. Overall, the results indicate that “In-Fa” had a greater impact on the MLD of UAYRE.
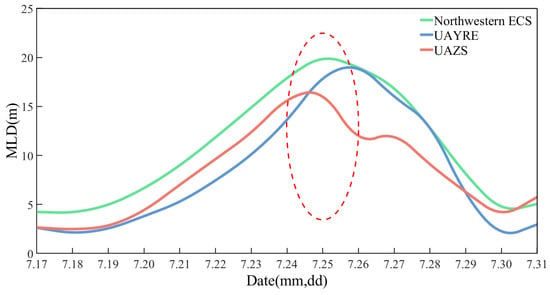
Figure 11.
Variations in MLD in the Northwestern ECS and two upwelling areas from 17 to 31 July. Green, blue, and red curves are the diurnal variations in MLD in the Northwestern ECS, UAYRE, and UAZS, respectively. The red dashed ellipse indicates the time when “In-Fa” passed through the Northwestern ECS.
3.5. The Change in Chl-a during “In-Fa” Period
Typhoon processes are accompanied by change in sea surface Chl-a concentration, which is more pronounced for the Northwestern ECS near the Yangtze River Delta [44]. Using the monthly average sea surface Chl-a concentration in July as the reference, the deviations of the daily average concentration from the reference (July average) were analyzed for the periods before (from 17 to 23 July), during (from 24 to 26 July), and after (from 27 to 31 July) the “In-Fa” transit. The positive values of Chl-a indicate an increase compared to the reference (July average), while negative values indicate a decrease compared to the reference. The analysis results are depicted in Figure 12a–c. The transition from blue to green color in the ocean area in Figure 12 represents a decrease in sea surface Chl-a concentration (negative values) and the transition from orange to red represents an increase in sea surface Chl-a concentration (positive values), with a range of −2 to 2 mg/m3. Before the transit of “In-Fa” (Figure 12a), compared to the monthly average sea surface Chl-a concentration in July, the sea surface Chl-a concentration in the Northwestern ECS was generally decreasing, except for the area west of UAYRE, near the Yangtze River estuary, where the Chl-a concentration was increasing. During the transit of “In-Fa” (Figure 12b), the pattern of sea surface Chl-a concentration change reversed compared to before the transit of “In-Fa”. In the Northwestern ECS, especially in the coastal waters, the Chl-a concentration increased. The Hangzhou Bay and the western region of UAZS experienced significant increases in Chl-a concentration, while the Chl-a concentration in the Yangtze River Estuary decreased. After the transit of “In-Fa” (Figure 12c), the Chl-a concentration in the Northwestern ECS continued to increase, with UAYRE exhibiting a predominant increase compared to UAZS.
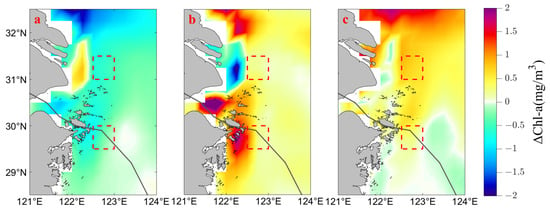
Figure 12.
Variation in the sea surface Chl-a concentration from reference (July average). (a–c) are variations in the sea surface Chl-a concentration in the Northwestern ECS before (from 17 to 23 July), during (from 24 to 26 July) and after (from 27 to 31 July) the transit of “In-Fa”, respectively. The red dashed boxes represent upwelling areas.
To analyze the effect of “In-Fa” on sea surface Chl-a concentration, the daily variations in Chl-a concentration in the Northwestern ECS and the two upwelling areas were analyzed and the results are shown in Figure 13, where the green, blue and red curves represent the diurnal variations in Chl-a concentration in the Northwestern ECS, UAYRE and UAZS from 17 to 31 July, respectively. From 17 to 20 July, the sea surface Chl-a concentration in both upwelling areas decreased. After 20 July, the concentration of Chl-a began to rise, and the sea surface Chl-a concentration of UAYRE reached its first peak on 24 July, and the concentration decreased within two days (from 24 to 26 July) of “In-Fa” reaching the Northwestern ECS, while the sea surface Chl-a concentration of UAZS was still rising during this period. After “In-Fa” (after 26 July), the Chl-a concentration of UAYRE continued to rise, reaching the second peak on 28 July, and the Chl-a concentration of UAZS reached the peak on 27 July. The sea surface Chl-a concentration of both upwelling areas did not reach the peak on the day of the arrival of “In-Fa” (25 July), indicating a delayed response of Chl-a concentration to the typhoon. The maximum increase in the sea surface Chl-a concentration was 285.58% in UAYRE (compared to 20 July and 28 July), and 233.33% in UAZS (compared to 20 July and 27 July).
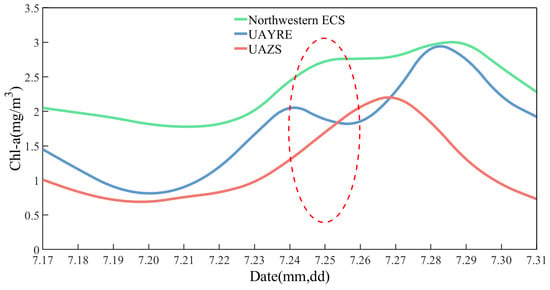
Figure 13.
Variations in the sea surface Chl-a concentration in the Northwestern ECS and the two upwelling areas from 17 to 31 July. Green, blue, and red curves are the diurnal variations in the sea surface Chl-a concentration in the Northwestern ECS, UAYRE, and UAZS, respectively. The red dashed ellipse indicates the time when “In-Fa” passed through the Northwestern ECS.
3.6. The Change in Precipitation
Extreme heavy precipitation can occur due to the influence of various typhoon intensities, paths, and underlying surface conditions, and the heavy precipitation exhibits a significant asymmetry [45]. The variation in precipitation during the “In-Fa” period was analyzed using precipitation data in the Northwestern ECS and along the coast, and the results are presented in Figure 14. Figure 14a,b illustrate the spatial distribution of daily average precipitation before (from 20 to 23 July) and during (from 24 to 27 July) the transit of “In-Fa”. Before the transit of “In-Fa”, there was relatively low precipitation in the Northwestern ECS and the adjacent coastal areas (Figure 14a), with a daily average precipitation of 3.25 mm for UAYRE and 10.24 mm for UAZS. During the transit of “In-Fa”, the precipitation increased (Figure 14b), and the daily average precipitation rose to 62.28 mm in UAYRE, 45.85 mm in UAZS, 83.55 mm in Shanghai and near the Yangtze River Estuary, and 65.47 mm in the south coast of Hangzhou Bay. The daily average precipitation in the region along the typhoon path was relatively lower, with heavier precipitation on the right side of the typhoon path compared to the left side. Higher rainfall occurred over the coastal area.
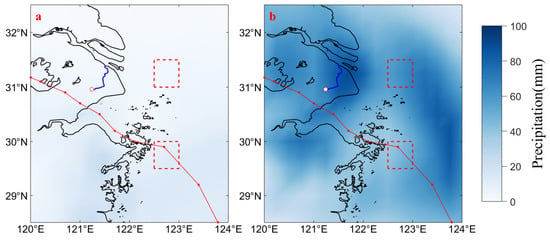
Figure 14.
Precipitation distribution before and during the transit of “In-Fa”. (a,b) are the average daily precipitation before (from 20 to 23 July) and during (from 24 to 27 July) the typhoon, respectively. The red line represents the typhoon path. The blue line represents the Huangpu River, and the white dot on the Huangpu River represents the Mishidu Station. The red dashed boxes represent upwelling areas.
From 23 to 27 July, 2021, Shanghai experienced continuous heavy to torrential rainfall, and the Mishidu Hydrologic Station, located in the upper stream of the Huangpu River in Shanghai, was at a high level of water rise from 25 to 27 July (see Figure 15) [46]. In this study, data from the section located at 121.025° E near the Yangtze River Estuary were used to analyze the river discharge. As shown in Figure 15, the river discharge of the Yangtze River increased during the “In-Fa” period. It rose from m3/s on 22 July to m3/s when the center of “In-Fa” reached the study area (25 July). Even after the passage of “In-Fa”, the river discharge of the Yangtze River remained at a relatively high level (the river discharge remained above m3/s from 25 to 30 July).
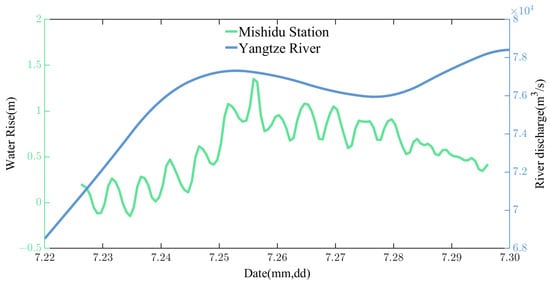
Figure 15.
Process of water rise at Mishidu Station and river discharge variation in the Yangtze River from 22 to 30 July. Green and blue curves are the process of water rise at Mishidu Station and river discharge variation at 121.025 E section of the Yangtze River, respectively.
4. Discussion
The passage of a typhoon induces Ekman suction/pumping, leading to vertical mixing of seawater, which drastically affects the marine dynamic environment, resulting in changes in seawater temperature, salinity, and Chl-a concentration [47,48,49]. Before the transit of “In-Fa” (Figure 3a), most of the regions above the two upwelling areas were dominated by anticyclonic wind, where the EPV was relatively small and mostly negative, indicating a weak Ekman pumping effect of the wind field and a minor influence on the strength of the upwelling. Under the peripheral influence of spiral rain band of “In-Fa” (Figure 3b), the EPV in UAZS exceeded m/s and was negative, indicating that the wind field exerted a pumping effect on UAZS, suppressing the upwelling intensity. During the transit of “In-Fa” (Figure 3c), most regions over the study area were dominated by cyclonic wind, resulting in positive EPV values. The wind field acted as a suction force and strengthened the upwelling intensity in the study area. After the transit of “In-Fa” (Figure 3d), the EPV in UAYRE returned to a lower value. Compared to UAYRE, UAZS exhibited higher EPV values, indicating that the wind field continued to strengthen the upwelling intensity at UAZS. Ekman suction promotes oceanic upwelling, so the upwelling during a typhoon is much stronger than usual, facilitating the transport of subsurface nutrients to the upper ocean layers [17,50].
Typhoons cause modifications in oceanic elements by influencing the oceanic dynamical system, and the cooling of SST is one of the main features of “In-Fa” transiting the upwelling areas in the Northwestern ECS (Figure 4 and Figure 5). In Figure 5, the increase in SST in both upwelling areas from 17 July to 19 July was attributed to the thermal advection mixing of non-upwelling warm water driven by the peripheral wind before the center of “In-Fa” reached the study area [51,52,53]. The effect of thermal advection mixing on the SST will be replaced by vertical mixing with the approaching typhoon [54,55]. After 19 July, as “In-Fa” gradually approached the study area, the upwelling caused by “In-Fa” and the vertical mixing of seawater transported the deep cold water to the sea surface. However, the intensified sea surface evaporation during typhoon can release more oceanic latent heat into the atmosphere [51,56]. Under the combined effects of vertical mixing and strong evaporation, the SST in the study area started to decline on 19 July. In other studies, a strong correlation between the decrease in SST and the Ekman effect has been observed [55,57,58]. However, the SST of UAYRE and UAZS began to recover from 26 July and 27 July, respectively. This was due to the decrease in offshore wind and weakened vertical mixing of seawater after the transit of “In-Fa”, causing the previously upwelled cold, high-density water to sink to deep layer and an increase in solar radiation on the ocean surface after the typhoon [59]. Consequently, the SST in both upwelling areas gradually increased. As for the subsurface temperature at 10 m (Figure 7), from 17 to 23 July, before the center of “In-Fa” reached the study areas, the peripheral wind field vertically mixed the water below the sea surface with the warmer surface water, leading to an increase in 10 m SWT. The seawater temperature decreased during 23 to 26 July for UAYRE and 23 to 27 July for UAZS, which reflected that the wind field enhanced the vertical mixing of seawater as “In-Fa” reached the study areas, causing deeper cold water to rise. After the transit of “In-Fa”, with the decrease in offshore wind, weakened vertical mixing of seawater and the increase in heat transfer from the sea surface, the 10 m SWT of UAYRE and UAZS began to rise on 26 July and 27 July, respectively.
The increase in sea surface Chl-a concentration is another feature of “In-Fa” transiting the upwelling areas in the Northwestern ECS (Figure 12 and Figure 13). The Chl-a concentration in the subsurface layer of the ocean is relatively high [60], and the intense vertical mixing during the “In-Fa” period carried the Chl-a from the subsurface layer to the sea surface, leading to an increase in sea surface Chl-a concentration in both upwelling areas. On the other hand, the vertical mixing can transport large amounts of nutrients from the subsurface to the sea surface, promoting the growth of phytoplankton [9,61], thereby increasing the Chl-a concentration at the sea surface. Phytoplankton reproduction requires appropriate temperatures [62,63], and during the “In-Fa” period, the mixed layer depth in the study areas deepened (Figure 10 and Figure 11) and the seawater temperature gradient was lower than normal, which was more suitable for increase in phytoplankton blooms. With the increase in phytoplankton, the abundance of zooplankton and other marine organisms that feed on phytoplankton also increases [64]. Phytoplankton rely on the nutrient supply in the surface layer of the ocean for their growth and reproduction, and the supply of nutrients decreased after “In-Fa” [5], both of which limited the growth and reproduction of phytoplankton. Therefore, after the transit of “In-Fa”, the sea surface Chl-a concentration started to decrease with the decrease in phytoplankton and the weakening of vertical mixing (Figure 13, UAYRE and UAZS on 28 July and 27 July, respectively). And the suspended matters concentration increases after typhoon, which leads to the decrease in seawater transparency, while the deficiency light could also limit the growth of phytoplankton in high turbidity areas [65]. In summary, after experiencing a typhoon, the sea surface Chl-a concentration tends to increase. However, as the typhoon moving away and under the influence of various factors, the Chl-a concentration gradually returns to normal levels [9,40,61,66].
There was a delay in the response of Chl-a concentration to “In-Fa” compared to SST (the SST began to decline on 19 July, and the sea surface Chl-a concentration began to rise on 20 July), and this is attributed to the fact that phytoplanktons need a period of time to grow and their reproduction is affected by nutrients, temperature, and other factors [64]. In contrast to Chl-a concentration, the change in SST is mainly affected by physical factors and is more evident. Spatially, before the arrival of “In-Fa” (Figure 5, 17 July), the average SST in the Northwestern ECS, UAYRE, and UAZS were 25.27 °C, 23.46 °C, and 22.91 °C respectively, which were lower compared to non-upwelling areas. During the period of “In-Fa”, in the non-upwelling area (region: 123.0 to 123.5 E, 29.0 to 29.5 N) along the typhoon, the maximum and minimum SST were 29.12 °C and 28.11 °C, respectively, with a maximum SST decrease of 1.01 °C. Compared to UAZS, the SST change in this non-upwelling sea area was relatively less affected by “In-Fa” (Figure 4 and Figure 5). From Figure 12 and Figure 13, it can be observed that, similar to the spatial variation in SST, the increase in sea surface Chl-a concentration in the upwelling areas is more pronounced when compared to non-upwelling areas.
During typhoons, heavy precipitation and extensive cloud cover are typically observed [66], leading to changes in temperature, salinity, and Chl-a concentration in the Northwestern ECS. Due to the continuous precipitation during the transit of typhoons, the air temperature decreases and the solar radiation weakens, so that the ocean heat transport will reduce [67,68], which also leads to the decrease in SST in the two upwelling areas during the period of “In-Fa” (Figure 5). Heavy precipitation can cause an increase in runoff from rivers [66]. The variation in river discharge of Yangtze River and the water rise at the Mishidu station on the Huangpu River indicate that the heavy precipitation associated with “In-Fa” has significantly increased the amount of freshwater transported from the Yangtze River into the ECS (Figure 15), which affect the SST of both upwelling areas after 19 July. Typhoon-induced vertical mixing will increase SSS, while precipitation leads to a decrease in SSS [69,70,71]. The heavy precipitation and its resulting increase in runoff from the Yangtze and Qiantang rivers brought the freshwater into the ECS and reduced the SSS (from 24 to 27 July). With the decrease in salinity, the ocean stratification is strengthened, which inhibits the vertical mixing of seawater [72], and the SSS will gradually decrease, which is the indirect effect of precipitation on the modifications of SSS. Typhoon-induced heavy precipitation can increase river runoff and terrestrial nutrient input and can bring a large amount of terrestrial nutrients into coastal areas [61,66], promoting the growth of phytoplankton, and enhancing nearshore Chl-a concentration.
5. Conclusions
The variations in oceanic variables within the upwelling areas can have implications for the marine ecosystem, which in turn affects fishery resources. In recent years, climate anomalies have increased the frequency of typhoons, which will have an impact on the temperature and salinity structure of the upwelling areas and the marine ecosystem. In this study, we analyzed the effects of “In-Fa” on temperature, salinity, MLD, and Chl-a concentration in the two upwelling areas in Northwestern ECS using reanalysis data and model products. The results indicate that during the “In-Fa” process, the SST in the upwelling areas of Northwestern ECS decreased due to the combined effect of the strong vertical mixing, the widespread heavy precipitation, and the rising river runoff. The SST decrease was more pronounced in UAYRE, located on the right side of the typhoon path, compared to UAZS. Cooling delays and gradual temperature recovery were observed after the typhoon passage. The salinity within the two upwelling areas exhibited asymmetric changes affected by precipitation, evaporation, mixing, and Ekman effects, with a more significant impact observed in SSS at UAYRE, located on the right side of the typhoon path. The temperature of seawater below the sea surface was affected by typhoon, resulting in the upwelling of cold deep water and mixing of subsurface and surface waters, leading to deepened MLD. The deepening of MLD was more pronounced in UAYRE compared to UAZS. The increase in nutrient concentration due to Ekman processes and river-borne nutrients resulted in elevated surface Chl-a concentration. “In-Fa” strengthened the upwelling intensity in the Northwestern ECS, increased the nutrient concentration in the region, enhanced the primary productivity, provided favorable environment for the growth and reproduction of fish, improved fishing yields within the upwelling areas, and accelerated the nutrients cycle and marine energy conversion process. This study provides important data support and theoretical reference for the ecological conservation and fisheries economic development in the ECS. The severe weather conditions during “In-Fa” made it challenging to conduct in situ observations or utilize remote sensing methods in the upwelling areas along its path. Although relatively accurate reanalysis and model products provided support for our research findings, we hope that with the advancement of technology and continuous progress in data analysis techniques, we will have more precise methods and data available for analyzing oceanic elements under extreme and adverse weather conditions in the future.
Author Contributions
Conceptualization, Y.C., B.G., J.W. and Z.J.; methodology, Y.C.; software, Y.C.; validation, Y.C., B.G. and V.S.M.; formal analysis, Y.C.; investigation, Y.C.; resources, B.G.; data curation, Y.C.; writing—original draft preparation, Y.C.; writing—review and editing, B.G. and V.S.M.; visualization, Y.C.; supervision, B.G.; project administration, B.G.; funding acquisition, B.G. All authors have read and agreed to the published version of the manuscript.
Funding
This work was mainly supported by the open research fund program of State Key Laboratory of Hydroscience and Engineering, Tsinghua University (sklhse-2021-B-01); the National Natural Science Foundation of China (Grant No. 51979264 and 51479179); Consultation and Evaluation Program of the Department of Chinese Academy of Science (2020-ZW11-A-023); and Zhejiang Provincial Virtual Simulation Experiment Projects (virtual simulation experiment project of monitoring of suspended sediment in coastal waters using remote sensing).
Institutional Review Board Statement
Not applicable.
Informed Consent Statement
Not applicable.
Data Availability Statement
Not applicable.
Conflicts of Interest
The authors declare no conflict of interest.
References
- Zhou, X.; Yang, X.; Li, Z.; Yu, Y.; Bi, H.; Ma, S.; Li, X. Estimation of tropical cyclone parameters and wind fields from SAR images. Sci. China Earth Sci. 2013, 56, 1977–1987. [Google Scholar] [CrossRef]
- Huo, L.; Guo, P.; Zhang, F. Impact of summer tropical Atlantic SST anomaly on western North Pacific tropical cyclone genesis. Trans. Atmos. Sci. 2016, 39, 55–63. [Google Scholar]
- He, J.; Soden, B.J. Anthropogenic weakening of the tropical circulation: The relative roles of direct CO2 forcing and sea surface temperature change. J. Clim. 2015, 28, 8728–8742. [Google Scholar] [CrossRef]
- Kossin, J.P. Author Correction: A global slowdown of tropical-cyclone translation speed. Nature 2018, 564, E11–E16. [Google Scholar] [CrossRef] [PubMed]
- Wang, Y. Composite of Typhoon-Induced Sea Surface Temperature and Chlorophyll—A Responses in the South China Sea. J. Geophys. Res. Ocean. 2020, 125, e2020JC016243. [Google Scholar] [CrossRef]
- Potter, H.; Drennan, W.M.; Graber, H.C. Upper ocean cooling and air-sea fluxes under typhoons: A case study. J. Geophys. Res. Ocean. 2017, 122, 7237–7252. [Google Scholar] [CrossRef]
- Pan, J.; Sun, Y. Estimate of ocean mixed layer deepening after a typhoon passage over the South China Sea by using satellite data. J. Phys. Oceanogr. 2013, 43, 498–506. [Google Scholar] [CrossRef]
- Pan, S.; Shi, J.; Gao, H.; Xu, Z.; Yan, X. Impacts of Typhoon on Ocean Parimary Production and Nutrients Transport. Period. Ocean. Univ. China 2016, 46, 120–133. [Google Scholar]
- Chen, Y.; Tang, D. Eddy-feature phytoplankton bloom induced by a tropical cyclone in the South China Sea. Int. J. Remote Sens. 2012, 33, 7444–7457. [Google Scholar] [CrossRef]
- Jing, Z.; Qi, Y.; Hua, Z. Numerical study on upwelling and its seasonal variation along Fujian and Zhejiang coast. J. Hohai Univ. (Nat. Sci.) 2007, 165, 464–470. [Google Scholar]
- Hu, M.; Zhao, C. Upwelling in Zhejiang Coastal Areas during Summer Detected by Satellite Observations. Natl. Remote Sens. Bull. 2008, 12, 297–304. [Google Scholar]
- Hu, J.; Wang, X.H. Progress on upwelling studies in the China seas. Rev. Geophys. 2016, 54, 653–673. [Google Scholar] [CrossRef]
- Lu, X.; Yu, H.; Ying, M.; Zhao, B.; Zhang, S.; Lin, L.; Bai, L.; Wan, R. Western North Pacific tropical cyclone database created by the China Meteorological Administration. Adv. Atmos. Sci. 2021, 38, 690–699. [Google Scholar] [CrossRef]
- Narvekar, J.; Roy Chowdhury, R.; Gaonkar, D.; Kumar, P.D.; Prasanna Kumar, S. Observational evidence of stratification control of upwelling and pelagic fishery in the eastern Arabian Sea. Sci. Rep. 2021, 11, 7293. [Google Scholar] [CrossRef] [PubMed]
- Luo, Y.; Shi, J.; Guo, X.; Mao, X.; Yao, P.; Zhao, B.; Chen, L.; Wang, Y. Yearly variations in nutrient supply in the East China Sea due to the Zhejiang coastal upwelling and Kuroshio intrusion. J. Geophys. Res. Ocean. 2023, 128, e2022JC019216. [Google Scholar] [CrossRef]
- McGregor, H.V.; Dima, M.; Fischer, H.W.; Mulitza, S. Rapid 20th-century increase in coastal upwelling off northwest Africa. Science 2007, 315, 637–639. [Google Scholar] [CrossRef]
- Li, X.; Zhang, X.; Fu, D.; Liao, S. Strengthening effect of super typhoon Rammasun (2014) on upwelling and cold eddies in the South China Sea. J. Oceanol. Limnol. 2021, 39, 403–419. [Google Scholar] [CrossRef]
- Ren, Z. Upper Oceanic Response of East China Sea to Typhoon. Master’s Thesis, Zhejiang University, Hangzhou, China, 2019. [Google Scholar]
- Liu, Z.; Xu, J.; Sun, C.; Wu, X. An upper ocean response to Typhoon Bolaven analyzed with Argo profiling floats. Acta Oceanol. Sin. 2014, 33, 90–101. [Google Scholar] [CrossRef]
- Jiang, Q.; Li, W.; Fan, Z.; He, X.; Sun, W.; Chen, S.; Wen, J.; Gao, J.; Wang, J. Evaluation of the ERA5 reanalysis precipitation dataset over Chinese Mainland. J. Hydrol. 2021, 595, 125660. [Google Scholar] [CrossRef]
- Hersbach, H.; Bell, B.; Berrisford, P.; Biavati, G.; Horányi, A.; Muñoz Sabater, J.; Nicolas, J.; Peubey, C.; Radu, R.; Rozum, I. ERA5 hourly data on single levels from 1979 to present. Copernic. Clim. Change Serv. (C3s) Clim. Data Store (Cds) 2018, 10, 10.24381. [Google Scholar]
- Lellouche, J.-M.; Galloudec, O.L.; Regnier, C.; Gennip, S.V.; Chune, S.L.; Levier, B.; Greiner, E.; Drevillon, M.; Szczypta, C. Global Production Centre, GLO_ANALYSISFORECAST_PHY_001_024,Quality Information Document. Available online: https://catalogue.marine.copernicus.eu/documents/QUID/CMEMS-GLO-QUID-001-024.pdf (accessed on 23 July 2023).
- Zhu, J. Dynamic mechanism of the upwelling on the west side of the submerged river valley off the Changjiang mouth in summertime. Chin. Sci. Bull. 2003, 48, 2754–2758. [Google Scholar] [CrossRef]
- Lü, X.; Qiao, F.; Xia, C.; Zhu, J.; Yuan, Y. Upwelling off Yangtze River estuary in summer. J. Geophys. Res. Ocean. 2006, 111, C11S08. [Google Scholar] [CrossRef]
- Yao, J.; Wang, Z. Monthly variation of upwelling area off the Changjiang River Estuary in spring. Mar. Sci. 2017, 41, 1–9. [Google Scholar]
- Chen, L.; Li, F.; Liu, J.; Duan, X.; Xu, G.; Qin, M.; He, X.; Liu, Y. Long-chain alkyl diols as indicators of local riverine input, temperature, and upwelling in a shelf south of the Yangtze River Estuary in the East China Sea. Mar. Geol. 2021, 440, 106573. [Google Scholar] [CrossRef]
- Pan, Y.; Sha, W. Numerical Study on the Summer Coastal Upwelling off Fujian and Zhejiang. Mar. Sci. Bull. 2004, 23, 1–11. [Google Scholar]
- He, Q.; Zhang, C.; Gao, G.; Wei, Y.; An, B. Study on the temporal and spatial characteristics of Zhoushan coastal upwelling and relationship with wind field in Summer period. J. Shanghai Ocean. Univ. 2016, 25, 142–151. [Google Scholar]
- Tang, F.; Chen, F.; Zhu Ge, X.y.; Wu, F.; Yu, L.; Yao, B. Analysis of influence process of Typhoon In-fa (202106) based on satellite remote sensing data. Trans. Atmos. Sci. 2021, 44, 703–716. [Google Scholar]
- Shen, X.; Li, F. Analysis of extreme precipitation in Zhejiang caused by typhoon “In-Fa”. Mar. Forecast. 2022, 39, 37–47. [Google Scholar]
- Bueh, C.; Zhu Ge, A.; Xie, Z.; Gao, Z.; Lin, D. Water Vapor Transportation Features and Key Synoptic-scale Systems of the “7.20” Rainstorm in Henan Province in 2021. Chin. J. Atmos. Sci. 2022, 46, 725–744. [Google Scholar]
- Halpern, D. Offshore Ekman transport and Ekman pumping off Peru during the 1997–1998 El Nino. Geophys. Res. Lett. 2002, 29, 19-1–19-4. [Google Scholar] [CrossRef]
- Wirasatriya, A.; Setiawan, J.D.; Sugianto, D.N.; Rosyadi, I.A.; Haryadi, H.; Winarso, G.; Setiawan, R.Y.; Susanto, R.D. Ekman dynamics variability along the southern coast of Java revealed by satellite data. Int. J. Remote Sens. 2020, 41, 8475–8496. [Google Scholar] [CrossRef]
- Tan, S.; Shi, J.; Wang, G.; Xing, X.; Lü, H. A case study of the westward transport of Chorophyll-a entrained by ocean eddies during a tropical cyclone. Reg. Stud. Mar. Sci. 2022, 52, 102256. [Google Scholar] [CrossRef]
- Kessler, W.S. Mean three-dimensional circulation in the northeast tropical Pacific. J. Phys. Oceanogr. 2002, 32, 2457–2471. [Google Scholar] [CrossRef]
- Greene, C.A.; Blankenship, D.D.; Gwyther, D.E.; Silvano, A.; van Wijk, E. Wind causes Totten Ice Shelf melt and acceleration. Sci. Adv. 2017, 3, e1701681. [Google Scholar] [CrossRef]
- Greene, C.A.; Thirumalai, K.; Kearney, K.A.; Delgado, J.M.; Schwanghart, W.; Wolfenbarger, N.S.; Thyng, K.M.; Gwyther, D.E.; Gardner, A.S.; Blankenship, D.D. The climate data toolbox for MATLAB. Geochem. Geophys. Geosyst. 2019, 20, 3774–3781. [Google Scholar] [CrossRef]
- An, Y.; Zhang, R.; Wang, H.; Chen, J.; Chen, Y. Study on calculation and spatio-temporal variations of global ocean mixed layer depth. Chin. J. Geophys. 2012, 55, 2249–2258. [Google Scholar]
- Patel, R. To Compute Mixed Layer Depth Based on Subjective Method. Available online: https://ww2.mathworks.cn/matlabcentral/fileexchange/53370-to-compute-mixed-layer-depth-based-on-subjective-method (accessed on 12 October 2022).
- Zhao, H.; Tang, D.; Wang, Y. Comparison of phytoplankton blooms triggered by two typhoons with different intensities and translation speeds in the South China Sea. Mar. Ecol. Prog. Ser. 2008, 365, 57–65. [Google Scholar] [CrossRef]
- Xiu, P.; Dai, M.; Chai, F.; Zhou, K.; Zeng, L.; Du, C. On contributions by wind-induced mixing and eddy pumping to interannual chlorophyll variability during different ENSO phases in the northern South China Sea. Limnol. Oceanogr. 2019, 64, 503–514. [Google Scholar] [CrossRef]
- Wu, L.; Ling, Z. Analysis of sea surface salinity response to typhoon in the Northwest Pacific based on Argo data. J. Mar. Sci. 2015, 33, 1–6. [Google Scholar]
- Wang, X.; Wang, X.; Chu, P.C. Air-sea interactions during rapid intensification of typhoon Fengshen (2008). Deep. Sea Res. Part I Oceanogr. Res. Pap. 2018, 140, 63–77. [Google Scholar] [CrossRef]
- Liu, G. Spatial and Temporal Variability of Chlorophyll-a Patterns and Its Mechanisms off the Yangtze River Estuary. Master’s Thesis, East China Normal University, Shanghai, China, 2014. [Google Scholar]
- Ding, C. The Formation Mechanism and Prediction Application of Tropical Cyclone Accumulated Rainfall Structure Over China. Ph.D. Thesis, Nanjing University of Information Science & Technology, Nanjing, China, 2022. [Google Scholar]
- Yi, W.; Yu, H.; Wei, H.; Nie, Y.; Wen, X. Analysis of flood process and high water levels in upper stream Huangpu River during typhoon In-fa. Express Water Resour. Hydropower Inf. 2023, 44, 18–22. [Google Scholar]
- Wada, A.; Niino, H.; Nakano, H. Roles of vertical turbulent mixing in the ocean response to Typhoon Rex (1998). J. Oceanogr. 2009, 65, 373–396. [Google Scholar] [CrossRef]
- Sanford, T.B.; Price, J.F.; Girton, J.B. Upper-ocean response to Hurricane Frances (2004) observed by profiling EM-APEX floats. J. Phys. Oceanogr. 2011, 41, 1041–1056. [Google Scholar] [CrossRef]
- Pan, J.; Huang, L.; Devlin, A.T.; Lin, H. Quantification of typhoon-induced phytoplankton blooms using satellite multi-sensor data. Remote Sens. 2018, 10, 318. [Google Scholar] [CrossRef]
- Suzuki, S.-i.; Niino, H.; Kimura, R. The mechanism of upper-oceanic vertical motions forced by a moving typhoon. Fluid Dyn. Res. 2011, 43, 025504. [Google Scholar] [CrossRef]
- Cheung, H.-F.; Pan, J.; Gu, Y.; Wang, Z. Remote-sensing observation of ocean responses to Typhoon Lupit in the northwest Pacific. Int. J. Remote Sens. 2013, 34, 1478–1491. [Google Scholar] [CrossRef]
- Glenn, S.; Miles, T.; Seroka, G.; Xu, Y.; Forney, R.; Yu, F.; Roarty, H.; Schofield, O.; Kohut, J. Stratified coastal ocean interactions with tropical cyclones. Nat. Commun. 2016, 7, 10887. [Google Scholar] [CrossRef] [PubMed]
- Kim, T.; Choo, S.-H.; Moon, J.-H.; Chang, P.-H. Contribution of tropical cyclones to abnormal sea surface temperature warming in the Yellow Sea in December 2004. Dyn. Atmos. Ocean. 2017, 80, 97–109. [Google Scholar] [CrossRef]
- Prasad, T.; Hogan, P.J. Upper-ocean response to Hurricane Ivan in a 1/25 nested Gulf of Mexico HYCOM. J. Geophys. Res. Ocean. 2007, 112, C04013. [Google Scholar] [CrossRef]
- Zhang, H.; Chen, D.; Zhou, L.; Liu, X.; Ding, T.; Zhou, B. Upper ocean response to typhoon Kalmaegi (2014). J. Geophys. Res. Ocean. 2016, 121, 6520–6535. [Google Scholar] [CrossRef]
- Subrahmanyam, M.; Shengyan, Y.; Raju, P.V.S. Typhoon Haikui induced sea surface temperature cooling and rainfall influence over Zhejiang coastal waters. Atmósfera 2021, 34, 385–394. [Google Scholar]
- Wu, R.; Li, C. Upper ocean response to the passage of two sequential typhoons. Deep. Sea Res. Part I Oceanogr. Res. Pap. 2018, 132, 68–79. [Google Scholar] [CrossRef]
- Fu, D.; Luan, H.; Pan, D.; Zhang, Y.; Wang, L.a.; Liu, D.; Ding, Y.; Li, X. Impact of two typhoons on the marine environment in the Yellow Sea and East China Sea. Chin. J. Oceanol. Limnol. 2016, 34, 871–884. [Google Scholar] [CrossRef]
- Guan, S.; Zhao, W.; Sun, L.; Zhou, C.; Liu, Z.; Hong, X.; Zhang, Y.; Tian, J.; Hou, Y. Tropical cyclone-induced sea surface cooling over the Yellow Sea and Bohai Sea in the 2019 Pacific typhoon season. J. Mar. Syst. 2021, 217, 103509. [Google Scholar] [CrossRef]
- Fu, D.; Pan, D.; Wang, D.; Zhang, Y.; Ding, Y.; Liu, D. The analysis of phytoplankton blooms off the Yangtze River Estuary in the spring of 2007. Aquat. Ecosyst. Health Manag. 2014, 17, 221–232. [Google Scholar] [CrossRef]
- Zhao, H.; Tang, D.; Wang, D. Phytoplankton blooms near the Pearl River estuary induced by Typhoon Nuri. J. Geophys. Res. Ocean. 2009, 114, C12027. [Google Scholar] [CrossRef]
- Gabric, A.; Parslow, J. Effect of physical factors on the vertical distribution of phytoplankton in eutrophic coastal waters. Mar. Freshw. Res. 1989, 40, 559–569. [Google Scholar] [CrossRef]
- Behrenfeld, M.J.; O’Malley, R.T.; Siegel, D.A.; McClain, C.R.; Sarmiento, J.L.; Feldman, G.C.; Milligan, A.J.; Falkowski, P.G.; Letelier, R.M.; Boss, E.S. Climate-driven trends in contemporary ocean productivity. Nature 2006, 444, 752–755. [Google Scholar] [CrossRef] [PubMed]
- Chen, G.; Xiu, P.; Chai, F. Physical and biological controls on the summer chlorophyll bloom to the east of Vietnam. J. Oceanogr. 2014, 70, 323–328. [Google Scholar] [CrossRef]
- Diez-Minguito, M.S.; Huib, E. Relationships Between Chlorophyll-a and Suspended Sediment Concentration in a High-Nutrient Load Estuary: An Observational and Idealized Modeling Approach. J. Geophys. Res. Ocean. 2020, 125, e2019JC015188. [Google Scholar] [CrossRef]
- YongQiang, C.; DanLing, T. Remote sensing analysis of impact of typhoon on environment in the sea area south of Hainan Island. Procedia Environ. Sci. 2011, 10, 1621–1629. [Google Scholar] [CrossRef]
- Cui, X.-p.; Li, X. Effects of sea surface temperature and its diurnal variation on diurnal variation of rainfall: A partitioning analysis based on surface rainfall budget. J. Trop. Meteorol. 2012, 18, 89–97. [Google Scholar]
- Subrahmanyam, M. Impact of typhoon on the north-west Pacific sea surface temperature: A case study of Typhoon Kaemi (2006). Nat. Hazards 2015, 78, 569–582. [Google Scholar] [CrossRef]
- Perigaud, C.; McCreary, J.P., Jr.; Zhang, K.Q. Impact of interannual rainfall anomalies on Indian Ocean salinity and temperature variability. J. Geophys. Res. Ocean. 2003, 108, 3319. [Google Scholar] [CrossRef]
- Bond, N.A.; Cronin, M.F.; Sabine, C.; Kawai, Y.; Ichikawa, H.; Freitag, P.; Ronnholm, K. Upper ocean response to Typhoon Choi-Wan as measured by the Kuroshio Extension Observatory mooring. J. Geophys. Res. Ocean. 2011, 116, C02031. [Google Scholar] [CrossRef]
- Kil, B.; Burrage, D.; Wesson, J.; Howden, S. Sea surface signature of tropical cyclones using microwave remote sensing. In Proceedings of the Ocean Sensing and Monitoring V, Baltimore, MD, USA, 3 June 2013; pp. 370–384. [Google Scholar]
- Liu, G.; Li, X.; Wang, J.; Kou, Y.; Wang, X. Research on the statistical characteristics of typhoon frequency. Ocean Eng. 2020, 209, 107489. [Google Scholar] [CrossRef]
Disclaimer/Publisher’s Note: The statements, opinions and data contained in all publications are solely those of the individual author(s) and contributor(s) and not of MDPI and/or the editor(s). MDPI and/or the editor(s) disclaim responsibility for any injury to people or property resulting from any ideas, methods, instructions or products referred to in the content. |
© 2023 by the authors. Licensee MDPI, Basel, Switzerland. This article is an open access article distributed under the terms and conditions of the Creative Commons Attribution (CC BY) license (https://creativecommons.org/licenses/by/4.0/).