Article

PM2.5 Characterization and Source Apportionment Using Positive Matrix Factorization at San Luis Potosi City, Mexico, during the Years 2017–2018

1
Catedrático CONACYT-Coordinación para la Innovación y Aplicación de la Ciencia y la Tecnología (CIACYT), Universidad Autónoma de San Luis Potosí, Avenida Sierra Leona No. 550, San Luis Potosí 78210, Mexico
2
Laboratorio Nacional de Geoprocesamiento de Información Fitosanitaria, Universidad Autónoma de San Luis Potosí, Avenida Sierra Leona No. 550, San Luis Potosí 78210, Mexico
3
División de Ciencias Básicas e Ingeniería, Universidad Autónoma Metropolitana—Azcapotzalco, Avenida San Pablo 180, Azcapotzalco, Cd. México 02200, Mexico
4
Instituto de Física, Universidad Nacional Autónoma de Mexico, Circuito Investigación Científica S/N, Ciudad Universitaria, Coyoacán, Cd. México 04510, Mexico
*
Author to whom correspondence should be addressed.
Atmosphere 2023, 14(7), 1160; https://doi.org/10.3390/atmos14071160
Submission received: 16 June 2023 / Revised: 7 July 2023 / Accepted: 12 July 2023 / Published: 17 July 2023
(This article belongs to the Section Air Quality)

Abstract

:
In growing Mexican cities, there are few studies on air pollution, especially on the topic of characterization for the chemical composition of Particulate Matter (PM). This work presents an X-ray Fluorescence (XRF) analysis and Total Carbon analysis of PM2.5 in a two-year monitoring campaign from 20 May 2017 to 30 July 2018, collecting 96 daily samples in the northeast area of San Luis Potosi city to reconstruct the gravimetric mass and perform a source apportionment study using the Positive Matrix Factorization model (PMF). Concentration differences were due to different yearly seasons. In the year 2017, there was a major influence on heavy metals (V, Cr, Mn, Ni, Cu, Zn, Pb), and for the year 2018, there was a major crustal elements concentration (Na, Al, Si, P). Heavy metal concentrations are higher than any worldwide regulation limit. After applying these methods to the 49 samples collected for the year 2017, the mass reconstruction was nearly 70% of the gravimetric mass. XRF analysis quantified 17 elements (Na, Mg, Al, Si, P, S, Cl, K, Ca, Ti, V, Cr, Mn, Fe, Ni, Cu, Zn) in addition to Total Carbon (Organic Carbon (OC) + Elemental Carbon (EC)). PMF receptor model was applied to identify possible contribution sources and resolved seven physically interpretable factors that contributed to the ambient particulate pollution at the sampling site: Urban Dust (24.2%), Mobile Sources (22.2%), Chemical industry (18.2%), Oil combustion (16.3%), Smelting Industry (12.4%), Fuel Oil + Ceramic Industry (4.4%), and Braking (2.3%). However, the brick kiln’s emissions may be present in at least four of the emission sources due to several types of combustible employed.

1. Introduction

Air pollution has become a major concern in the main cities throughout the world. This is due to its negative impacts on environmental quality and human health, assuming that nearly 80% of the world population lives in urban areas and due to the constant increment of the number of emission sources that enhance the growth concentrations of ambient particulate matter (PM). This term is used to describe solid or liquid particles with dimensions smaller than 50 µm (<50 µm), which are directly emitted or formed by precursor gases and dispersed in the atmosphere. PM is created by different mechanisms, principally nucleation, a subsequent condensation, growth by coagulation, or due to multi-phase chemical reactions [1], that can modify the number of particles, surface, and volume/mass size distribution, and can still grow with different gases and biological compounds, acting as a carrier of viruses, bacteria or pollen through the human respiratory system. PM can be mainly divided into inorganic and carbonaceous particles, which can also react and transform depending on thermodynamic properties, (natural or anthropogenic) emission sources, and geographical and meteorological conditions [2].
PM2.5 are particles with an aerodynamic diameter of less than 2.5 µm and can also be identified as a fine fraction. They are mainly produced as secondary particles due to anthropogenic sources, especially in the cities, and present a daily or weekly residence life in the local atmosphere and can be transported for long distances, going from hundreds to thousands of miles. Because of this, they can produce regional or global impacts, such as climate forcing and global warming. Their influence on atmospheric processes includes cloud condensation nuclei (CCN) [3], acidification of clouds, snow, and ice [4], induced and dissolved acid rain induction or dissolved [5], reduction in visibility [6], and general disturbances to terrestrial and marine ecosystems, as well as their impact on the cultural heritage, all of which are well documented [7]. But the most important aspect associated with PM2.5 and its chemical composition is related to different negative effects on human health, affecting the respiratory and cardiovascular system and enhancing mortality and morbidity ranges in both acute and chronic effects [8,9,10,11,12]. PM effects have been found in the inorganic fraction; heavy metals (As, Hg, Sb, Pb, Cd, Cr, and Be) have been designated by the United States Environmental Protection Agency (EPA) as ‘‘toxic air pollutants’’ due to their effects as metabolic poisons and/or carcinogens, as well as many compounds co-issued in the carbonaceous PM fraction. Adverse effects of high concentrations of metal (loid)s in blood, such as Pb and Cd, As in China’s children population, have been detected in their nervous systems, causing a subsequent decrease in their intelligence quotient (IQ), particularly in those who lives in industrialized towns in comparison with a reference town [13]. Therefore, they are possible culprits of health risks in zinc smelting districts in northeast China [14]. Also, high Mn concentrations exposure in the State of Hidalgo, Mexico, reported damage to the neurocognitive, neurological, reproductive, and pulmonary affections [15,16].
Furthermore, there exists a major concern about the PM carbonaceous fraction nowadays because it covers thousands of individual compounds from secondary and primary origins; on the other hand, OC contains PAHs and polyacids, while EC is an aggregate of smaller spheres, highly polymerized, refractory, and insoluble in water and common organic solvents [4]; it is mainly produced or derived for anthropogenic sources like chemical industry and fossil fuel burning, as well natural sources like biomass burning and biogenic sources.
Thus, Mexico has adopted PM as an air quality standard and has its own national limits since 1993, which has been readjusted for PM10 and included for the first time PM2.5 in 2014. Nevertheless, it has always been a discussion if these daily limits or even the annual limits represent a true indicator to evaluate air quality. In Mexico, just a few city governments have the resources to measure air pollutants such as PM10 and PM2.5 in all the monitoring sites. Apart from the foregoing, Mexican government authorities have focused on reducing particle concentrations in the PM10 and PM2.5 sizes; recently, they have proposed in the Mexican official standard (NOM-025-SSA1-2021) [17] a gradual reduction in the forthcoming years, even though only a few cities are required to measure these pollutants according to NOM-156-SEMARNAT-2012 [18] and only half of them comply with monitoring the two size fractions. Another recent effort has been the NOM-172-SEMARNAT-2019 [19], which provides a risk communication daily signal for the criteria pollutants. Nonetheless, not much progress has been made regarding the particulate matter characterization in the main cities of the country.
San Luis Potosi Metropolitan Area (SLPMA) has been growing in the last decade due to rapid industrialization and wide urbanization. Nowadays, SLPMA is an urban area with large metallurgical and mining activities with high concentrations of fluorite, and calcium sulfate has been documented, as well as a large industrial zone with more than 250 manufacturing industries in the south of the city. At NW, there is one of the biggest zinc processing plants in Latin America, which owns a sulfuric acid plant and is responsible for the generation of other metals as subproducts. Meanwhile, in the East, there are more than 150 brick kilns with minimum control. Consequently, they burn all kinds of waste, such as plastics, wood, coke, or even electronic waste. However, it is necessary to identify the real contribution of the main emission sources in the city to provide scientific support for emissions control in order to reduce particulate matter, establish mitigation strategies, and make effective corrective decisions with respect to environmental management policies and majorly to improve air quality. This work presents a PM2.5 in a two-year monitoring campaign in the northeast area of San Luis Potosi city to reconstruct the gravimetric mass with X-ray Fluorescence (XRF) analysis and Total Carbon Analysis and perform a source apportionment study using the Positive Matrix Factorization model.

2. Materials and Methods

San Luis Potosi City Metropolitan Area is located in the central zone of the country, being the 11th metropolitan area, most populated in Mexico, covering San Luis Potosi City and its conurbation area (Soledad de Graciano Sánchez). It covers an area of nearly 1776 km2 and has about 1.25 million inhabitants. Population density is 700 inhab•km−2 for SLPMA [20]. It is located at an average altitude of 1864 m above sea level (a.s.l), at the central portion of two mountain ranges: on the Northwest side, there is the Sierra de San Miguelito and, on the East, the Sierra de Alvarez, generating a partial air basin in a well-documented semi-arid climate.
By and large, the wind flows transport predominantly occurs from the south to the north zone, but also local effects like convergence and divergence processes produced by mountain-valley circulation cause regional easterly winds and recirculation through the urban area that is unfavorable for the dispersion and transport of atmospheric PM beyond the urban area [21]. SLPMA monitoring site was the “Estación Biblioteca”, from the Department of Ecology and Environmental Management (SEGAM, for its acronym in Spanish), located at 22°10′34″ N and 100°59′22″ W, in the northeast part of the city. This monitoring station is situated at a suburban site with low vehicular density and moderate diesel bus density. In the proximities, there are also more than 100 brick kilns, some old chemical industries, and a one-rail train impact zone. Figure 1a shows the monitoring zone location at SLP city, and Figure 1b shows the principal industries in the city according to the National Statistical Directory of Economic Units (DENUE, by its acronym in Spanish) from 2021.

2.1. Sampling

PM2.5 samples (from midnight to midnight) were collected on a 24 h sampling base for two years divided into two periods, the first one from 20 May 2017 to 30 July 2018 and the second period from 20 May 2018 to 25 July 2019. Two MiniVol Air samplers (MiniVol TAS, Airmetrics, Springfield, OR, USA) were used every two days, operating at a low volume of 5 L min−1, with a type B uncertainty of 0.5 L min−1 and equipped with a 47 mm diameter inlet to collect into a Teflon filter (Pall Corp., New York, NY, USA, 1.0 µm pore size) for inorganic aerosols and in another one to collect with a Quartz filter (Whatman Int. Ltd., Maidstone, UK, 47 mm) for carbonaceous aerosols. Subsequently, air samplers were located at the roof level (between 5 m to 8 m) of the “Estación Biblioteca” site from the local monitoring network, from SEGAM to obtain their meteorological data. Meteorological data were obtained from the Anderson weather station. All sensors are calibrated annually.

2.2. Measurements

Gravimetric mass concentrations were determined by weighing the Teflon filters using an electronic microbalance (BA2105, Sartorius, Goettingen, Germany) with a resolution of 0.01 mg in controlled conditions of temperature (20 to 25 ± 1 °C) and relative humidity (35 to 45 ± 5%) both previously and after monitoring. Carbonaceous samples were collected on a 47 mm quartz fiber filter and pre-combusted for 3 h in a 450 °C condition. Samples were analyzed in a laboratory-based thermal-optical EC-OC analyzer (Sunset Laboratory Model-4, Tigard, OR, USA) using the EPA-NIOSH protocol to measure the concentrations of Total Carbon (TC), Organic Carbon (OC), and Elemental Carbon (EC). Detection limits (DLs) were in a low (1 ng/m3 to 50 ng/m3) range. This PM2.5 carbonaceous analysis was determined at the “Universidad Autónoma Metropolitana, Azcapotzalco”, and the analytical procedure was recently explained [22].
Inorganic elemental analysis was performed in the custom-built XRF spectrometer for environmental applications at the “Instituto de Física, Universidad Nacional Autónoma de México”, equipped with an X-ray tube with an Rh anode (Oxford Instruments, Mountain View, CA, USA), operated at 50 keV and 500 µA, with a detection system composed by an Amptek X-123SDD spectrometer with a resolution of 120 eV at 5.9 keV. The filters were then placed in the analysis chamber at a high vacuum (10–6 torr). Each sample was irradiated for 900 s. A filter scan was carried out to analyze most of the deposit filter area to measure the concentrations of all the elements with atomic numbers Z > 10. XRF spectra were fitted using the QXAS-AXIL computer code [23], and elemental concentrations were obtained by comparison with a calibration curve from a set of Micromatter standards of known areal density.
XRF Limits of Detection (LOD) were calculated on the basis of background radiation for the Teflon filter, and also a standard NIST SRM 8785 (National Institute of Standards and Technology, Gaithersburg, MD, USA) was irradiated to measure the detection system efficiency for XRF analytical procedure; these steps were described previously [22]. Uncertainties were determined according to the method described by Espinosa et al. [24].

2.3. PMF Analysis and Procedure

Receptor Modelling techniques are a widely used approach applied to chemical speciation data in aerosols. The fundamental receptor model is that mass conservation can be assumed, and a mass balance analysis can be used to identify and apport sources of atmospheric particulate matter [25]. PMF is one of the most widely used receptor models based on a weighted least square fit approach that employs realistic error estimates to weigh data values and imposes non-negativity constraints in the factor computational process [26].
This PMF model may be written as X = G • F + E, where X (matrix elements Xij) is a known n by m matrix of the m measured chemical species in n samples; G (matrix elements gik) is a matrix of source contributions to the samples (i.e., time variations of the p factor scores) and F (matrix elements fjk) is a matrix of chemical factors composition (often called source profiles). G and F are factoring matrices to be determined, and E (matrix elements eij) is defined as a residual error matrix or the difference between measured and modeled values. The PMF equation of a bilinear problem is defined as follows.
X i j   = k = 1 p g i k f j k + e i j      
Xij concentration (x) for a species (j) in a sample (i).
gik contribution (g) of the source (k) in a sample (i).
fjk fraction (f) of a species (j) at the source (k).
eij residual error.
p is the number of factors.
Factor analysis can give a number of possible solutions, all mathematically correct. However, the best solution in PMF analysis should be supported by quantitative indicators, especially the number of factors [27]. One method to select the correct number of factors is by the evaluation of the Q-value, which can provide useful indications when the data-point uncertainties are well determined. A theoretical Qvalue determined by the product of (Qtrue/Qrobust), both output by each run of the PMF [28,29], can indicate consistent modeling data if this value is approximate to 1 and does not exceed 1.5, where Qrobust is calculated by excluding all outliers and Qtrue includes all points [30], and the near approach to the theoretical Qvalue can suggest a better fit.
PMF was applied to 49 samples from the year 2017. These concentrations were prepared using the input data procedure, including uncertainties and data below minimum detection limits suggested by Polissar et al. [31], using the EPA PMFv5 software. To obtain absolute source profiles and contributions, matrices G and F were normalized by setting the PM2.5 mass concentration as a “total variable” (with 400% uncertainty); in this way, the PM mass is apportioned, based on its similarities with the identified sources, without influencing the fitting process [31,32,33].
To determine the results, a diverse number of factors (from 4 to 9) was systematically explored to find out the most reasonable solution (25 pseudorandom initializations were run for each test), looking for the best Qvalue and an explained contribution for all the factors in the PM2.5 mass.
After defining the most appropriate number of factors, interpreted as the main emission sources considering different aspects, such as geographic location, meteorological data, as well as the type of industrial zone, mobile sources, and other local emission sources in the area (local database for the study site). Each factor was analyzed on the basis of the chemical species that compose it to determine the known source(s) to which it is associated in the literature and verified using the monitoring database. Each factor was then also modeled with the Open-air program from R-studio [34] to corroborate the origin of the different emission sources, and the ArcGIS computer code [35] to georeference the factors in the monitoring zone by using the meteorological data from the local network and locate a diameter distance of 5 km from the monitoring site ubication. Finally, results were overviewed with the reconstruction of back-trajectories, using the open access model HYSPLIT [36] at different end-point altitudes (100 m, 500 m, 1000 m, 1500 m a.g.l) and at different hours of the day (0, 6, 12, 18, UTC) for all the monitoring periods, to determine the possible origin of episodes with high concentrations or to identify local emission sources contribution.

3. Results

3.1. PM2.5 Gravimetric Mass

Nearly 100 valid PM2.5 samples were collected for the total sampling period at the Biblioteca-SEGAM site, with a 30.7 (6.6) µg m−3 24 h average gravimetric mass, not exceeding the national standard PM2.5 daily mean value of 45 µg m−3 (NOM-025-SSA1-2014), when the monitoring campaign was made [37] but surpassing the 25 µg m−3 WHO recommendation (Figure 2).
The campaign was then divided into the 2017 period from 20 May 2017 to 22 November 2017, which covers the summer and autumn seasons, and the 2018 period from 27 January 2018 to 30 July 2018, covering winter, spring, and summer seasons. During the 2017 campaign, 47 valid samples were collected at the site with a gravimetric mass average of 33.2 (7.0) µg m−3, while in the year 2018, the 49 samples collected had a mass average of 28.2 (6.1) µg m−3, with the daily mean value exceeded in the first campaign for 7 days and the second a total of 4 days (Figure 2). However, if the WHO recommendation for the PM2.5 concentration is applied, almost 60% of the total samples will exceed this regulation.
Comparing both years, concentration mass data were analyzed to contrast the hypothesis of normality with the Shapiro–Wilk statistical test (α = 0.05) and the Bartlett of homogeneity of variances test, and after concluded that all data presented a non-parametric distribution; the Mann-Whitney statistical test was used to compare the sampling years for gravimetric mass. Therefore, the PM2.5 concentration mass for the year 2018, compared with the one from the year 2017, is significant (p = 0.0028).
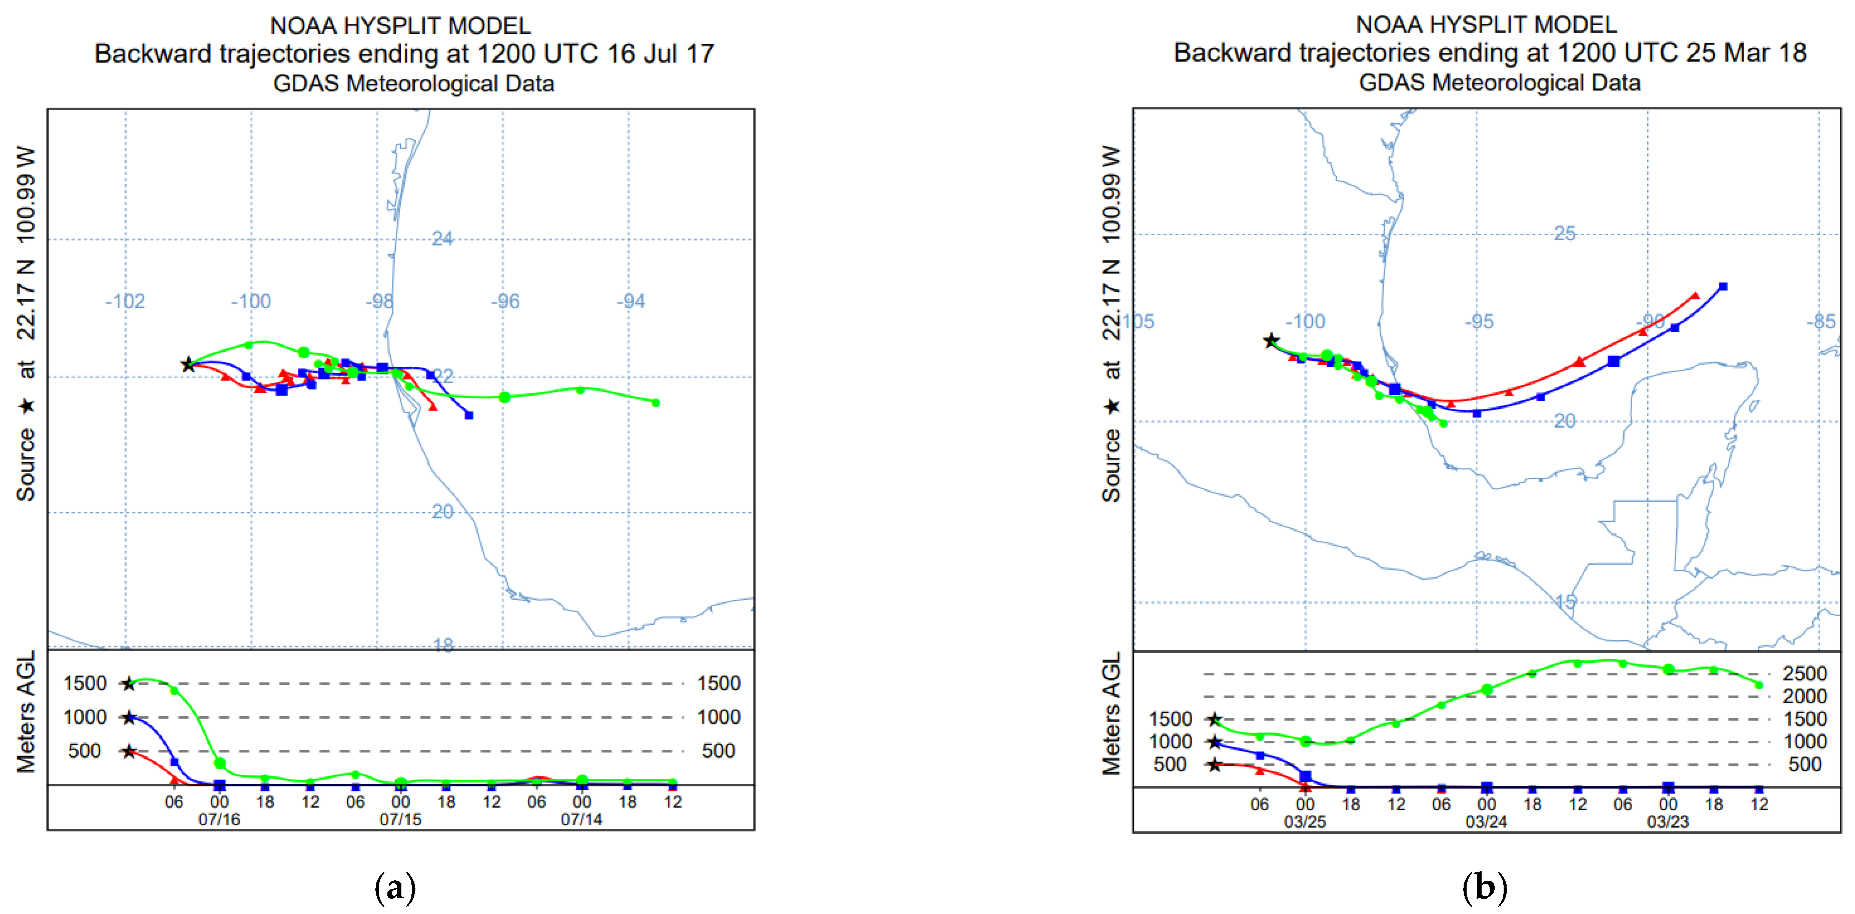
Finally, the maximum PM2.5 concentration values were registered on 16 July 2017 and 25 March 2018, with 102.4 (20.6) µg m−3 and 104.2 (20.9) µg m−3, respectively. Back-trajectory analysis was made to check the meteorology and the connections between these high concentrations and air mass trajectories. HYSPLIT showed for July 16th a strong influence from the northeast emissions where the brick-kiln zones are located; also, calm wind conditions produced the accumulation of the PM2.5 concentrations during this day. Moreover, on March 25th, the main emissions came from the Southeast, where the industrial zone is located (Figure 3).
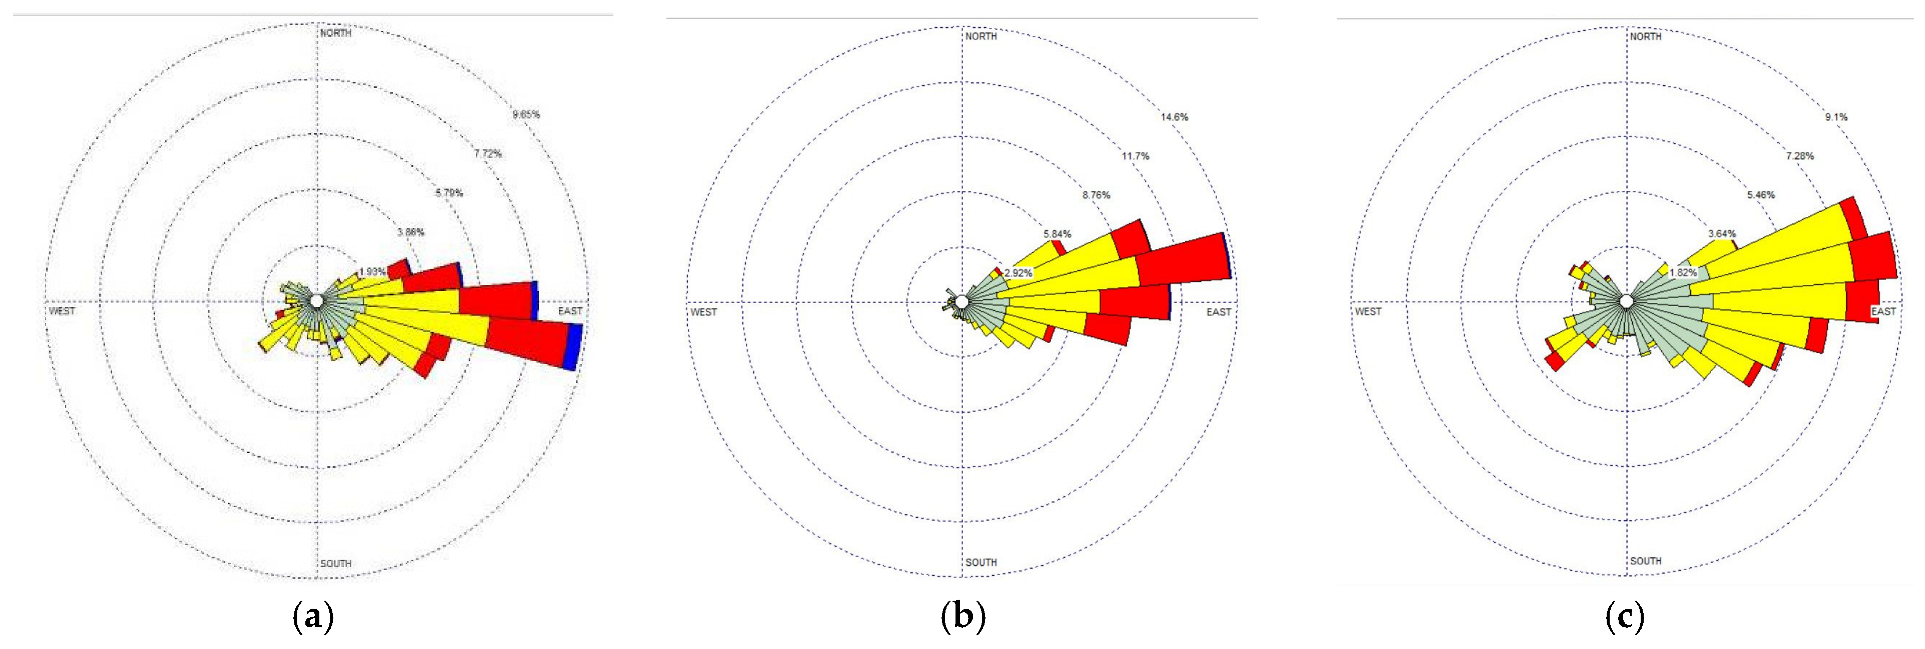
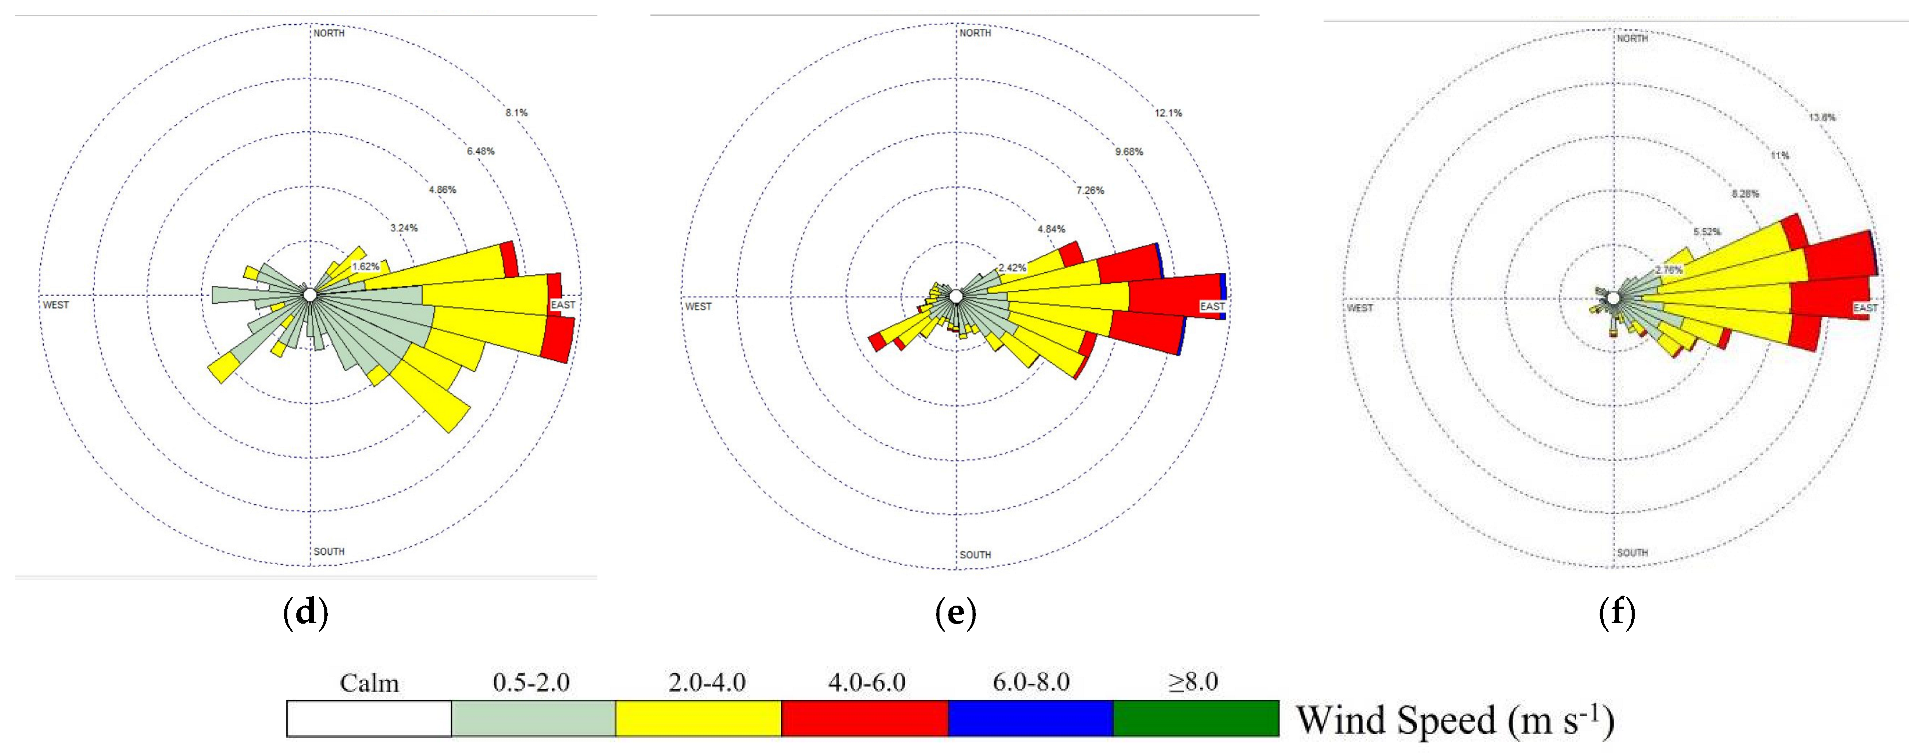
A natural barrier is composed due to the presence of mountains in the western zone and another one in the southeastern zone. Because of that, the most important winds came mostly from the eastern zone of the city, which is partially arid and in its vicinity to the monitoring site is surrounded by different semi-industrial zones, train tracks, automobile road axes, and mainly the brick zone. Autumn 2017, Winter 2017–2018, and Spring 2018 also showed a secondary wind pattern: the SE winds are associated with its entrance through the south, where the main industrial zone of the ZMSLP is located (Figure 4).
The highest wind speeds are generated during the spring and summer seasons (wind speed > 2.2 m s−1), as can be seen in both years, while the least wind speed occurs during the winter, preventing the dispersion of air pollutants. Even the calm percentage value for this period is reported at 21% with an average wind speed of 1.3 m s−1. Autumn 2017 registered an 8.5% of calm values and an average wind speed of 1.8 m s−1. Finally, the calm percentage value for spring and summer in 2017 was lesser than 1.6%, and for the year 2018, lesser than 3.9%. The data were obtained through the SEGAM network at the Biblioteca site (SINAICA, 2018) [38].
The SLPMA local network has just one PM10 and one PM2.5 monitoring equipment, not covering all of the Metropolitan Area, but the main problem is that it does not generate the minimum data concentrations for a valid year PM evaluation according to the NOM-025-SSA1-2014, neither the actualization of this regulation adjusted during the year 2021, because of that it was not possible to compare the PM concentration data from this study to the data showed by SEGAM.

3.2. PM2.5 Chemical Composition

The contribution of main aerosol components to PM2.5 was estimated based on the measured chemical composition according to the two analysis methods already mentioned. Table 1 shows the differences in chemical compositions in the two years due to different monitoring seasons and emission sources. Also, the differences between the average concentrations of the elements caused by anthropogenic sources and those generated by the Earth’s crust are easily observed. For the year 2017, heavy metals (V, Cr, Mn, Cu, and Pb) were at least 50% higher than for the year 2018 due to the dryer season (Spring and Summer); however, crustal elements such as Na, Al, and Si, presented higher values during 2018.
Also, comparing both years, the same period from 20 May to 30 July, gravimetric mass and the %XRF measured, anthropogenic elements for the year 2017 were higher than for the year 2018, even V and Pb were the double concentration value, and for the year 2018 just the crustal element as Si, P, and Al were higher an at least 70% than those from the year 2017. The Mann-Whitney non-parametric test was performed for the comparison of independent samples (α = 0.05), which indicates that the variation in the average gravimetric mass concentration of PM2.5 in 2018 (27.46 µg m−3) compared to the year 2017 (27.46 µg m−3) was significant (p = 0.019). And for the XRF concentration mass measured, the year 2018 (7.77 µg m−3) sized up with the year 2017 (9.52 µg m−3) was also significant (p = 0.024). Meteorological data also showed cooler and dryer conditions for the same period in the year 2018 than the data from the year 2017 [38].
On average, the total XRF mass represents nearly 30% of the gravimetric mass in the site during a two-year monitoring period. It was possible to identify at least 18 elements (Na, Mg, Al, Si, P, S, Cl, K, Ca, Ti, V, Cr, Mn, Fe, Ni, Cu, Zn, and Pb). There are high concentrations of elements emitted mainly by anthropogenic sources, such as those from fossil fuels, like S, V, Ni, and TC, as well as heavy metals from mineral extraction processes (Cr, Fe, Ni, Mn, Cu, Zn, and Pb). There are no Mexican regulations, and only a few international agencies present air quality standards for some heavy metals, such as annual limit values for Ni = 20 ng m−3 (EU, directive 2004/107/CE for 2013) and for Pb = 500 ng m−3 (EU, Directive 1999/30/CE for 2005; also, the WHO recommended the same concentrations values). For a daily period, just the Indian air quality standards present a limit value for Pb = 1000 ng m−3 [39].
The concentration values obtained during the total sampling of this monitoring exceeded all limit values concentrations, especially for the metals elements, and compared with previous PM2.5 studies from Mexico City, as showed by Hernández-López et al., the elemental concentration for Cr, Fe, was at least twice the ones collected from that urban area, while for elements as Ca, V, Mn, Ni, Cu, and Zn, were more than five times the concentrations values. As for Ca, the concentration values are attributed to the fluorite mining zone near the city. Other geological or crustal elements such as Al, Si, and Cl are in the same range as the PM2.5 collected in the south zone from Mexico City. S and K concentrations also require special consideration, thinking about the different possible sources.
After applying the Total Carbon analysis, the carbonaceous fractions in PM2.5 for the year 2017 consisted of 32.3% OC and 5.7% EC. Particulate Organic Matter (POM), i.e., the sum of all the carbonaceous compounds, was estimated by multiplying the OC concentration by a specific POM/OC factor to consider the contribution of the other light elements contained in these compounds (like H, N, and O), that could not be measured by this analytical technique. Different POM/OC factors can be applied according to the type of monitoring site, with increasing values from traffic to rural sites, taking into account the high quantity of natural VOC emissions in rural areas. However, for this semi-urban site, the factor used in agreement with the literature was 1.6 [40]. For the year 2017, the POM concentration average was 17.2 µg m−3 plus 1.9 µg m−3 due to EC, adding up to 60% of the total contribution to PM2.5, which is consistent with this type of semi-rural locations, for example, Tepeji and Jaso, Hidalgo, reported by Vega et al. [41]. Nevertheless, a difference in concentrations between the seasons of the sampling year could not be distinguished. The OC/EC average ratio was 7.36, indicating that the carbonaceous aerosol is mainly organic and suggests the presence of various combustion emission sources, such as biomass burning, possible fires in the area, the presence of a large chemical industry or even the brick kiln zone but also considering the low traffic emission zone near the monitoring site.
Total Carbon seasonal concentrations in the year 2017 were 14.99 µg m−3, 11.65 µg m−3, and 12.22 µg m−3, and OC/EC was 5.86, 6.13, and 4.87 for spring, summer, and autumn, respectively, which indicates the highest EC in spring due to the biomass burning present in the fires at the city, the lowest EC in summer caused by the rainy season and the lowest OC/EC ratio in autumn produced by the low wind speed movement. Elemental Carbon concentrations were for the spring 2.19 µg m−3, for the summer 1.63 µg m−3, and 2.08 µg m−3 for the autumn.

3.3. PMF Source Apportionment Model Results

For the year 2017, a total of 49 PM2.5 samples were used as the input data for the PMF model to analyze 20 variables, which represented nearly 70% of the total PM2.5 concentration mass, and the only data with the carbonaceous fraction. The chemical species selected as inputs were previously tested and validated, considering those with more than 50% of the data set below the detection limit of the method (MDL) were excluded (Mn), and those species with a significant correlation with PM2.5 were retained and subsequently classified according to the signal/noise ratio (S/N) criteria [42].
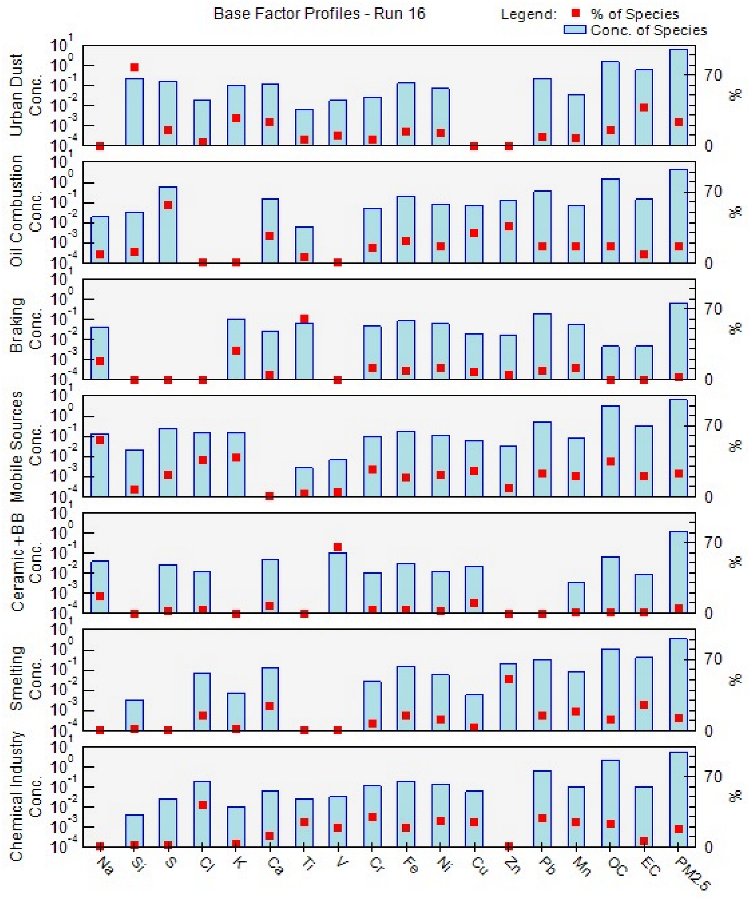
Then, PMF was used to find out the results for the different number of factors (from 4 to 9), looking for the best Qvalue to determine the most reasonable solution (25 pseudorandom initializations were run for each test). After that, 18 chemical species (Na, Si, S, Cl, K, Ca, Ti, V, Cr, Mn, Fe, Ni, Cu, Zn, Pb, OC, and EC) were classified as “strong”, according to the method previously described and with a presence in more than 90% of total samples and only two elements, (Al, P) as “bad” variables (i.e., species with a signal to noise ratio lower than 0.2 and/or below the detection limit in more than 90% of the cases). This combination of chemical speciation and source apportionment by PMF allowed the identification of seven factors or main emission sources as the best fit and reasonable solution for the studied site. Qvalue was 1.3. A good conceptual understanding of the total emission sources in the monitoring area is important for establishing aerosol sources (Figure 5). Table 2 shows the PMF source apportionment for the “Biblioteca” monitoring site.
Source 1 was identified as Urban Dust. It was traced by typical crustal species, mineral dust or also called soil as composed of Si, Fe, Ca, and K [43,44,45] added with a high contribution by S [46] and another significant influence of resuspended dust composed of OC, EC, and Pb (produced by anthropogenic fuels and asphalt, brakes, and tire wear); because of this combination, it was called Urban Dust. This source may be the result of local resuspension by wind and convective processes and contributed to 24.2% of the total PM2.5 composition. Similar profiles have been found in previous works in the north of Mexico City in PM2.5 [45] and PM10 [46].
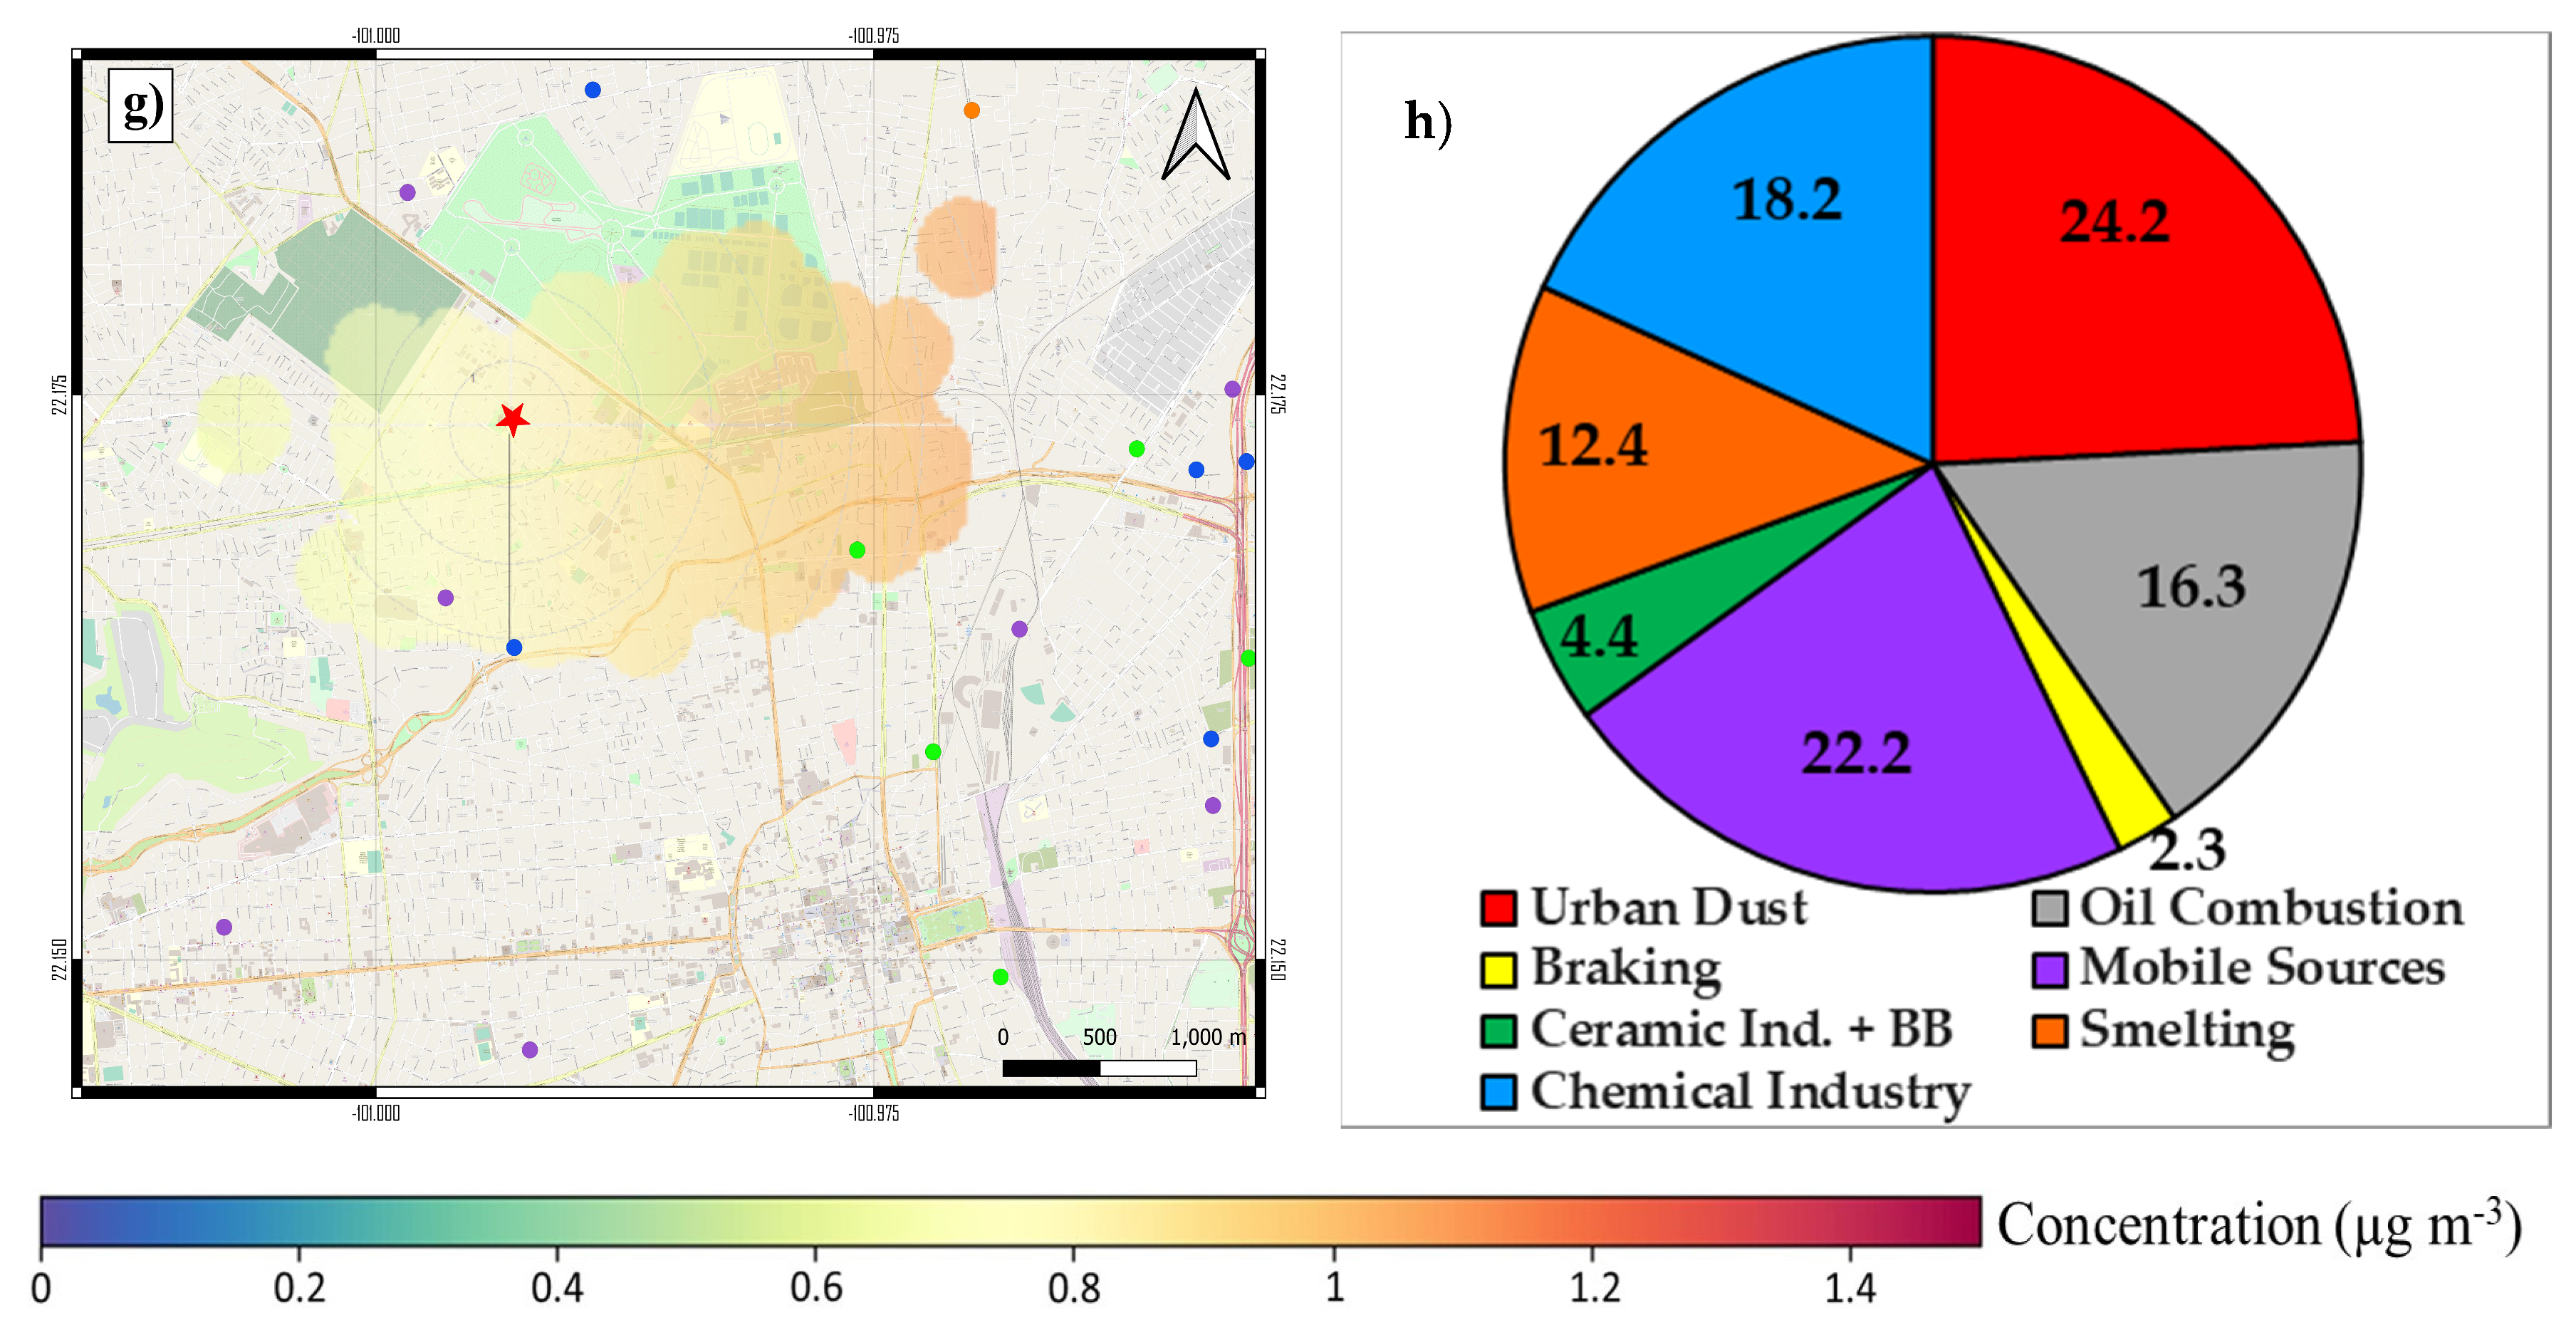
The second source was associated with Oil Combustion. Majorly composed by S [43] and OC, which is highly marked by OC [47], with a contribution of Ni, Fe, Ca, and Zn [44,48] related to industrial emissions [49] and a possible impact of the brick kiln zone. Additionally, EC was identified in this source. Anthropogenic fuels and residual oils with a high quantity of sulfur are included in this emission source. Figure 6b shows this source at the NE from the monitoring site, and according to DENUE 2021, there are some industries and the main brick kiln zone.
Source 3 was associated with the brakes of mobile sources, mainly the train brakes near the monitoring zone. This source was composed of Ti, Mn, K, Ni, Cr, Na, and Pb. This is the first time this source has been identified in a Mexican city, even though its contribution is very small, nearly 2%. Figure 6c shows, in color red, the main emissions for this source near the railroads. Some studies have found this source in railroads or subways and their resuspended emissions, composed of Mn, Cr, and Fe, being generated by the abrasion of the railroad tracks and brakes in New York City [50], Barcelona [51] and Seoul [52,53].
Source 4 is considered as vehicular emission-related, containing S, Ni, [46] traced by OC, EC [48,54] and a contribution of other elements (Na, K, Cl, Fe, Cr, and Pb) produced not just by combustion, but also by tires and brakes [22,45,49,55,56,57]. Also, this source can contain diesel or a fuel combustion mixture due to a nearby car racing circuit in “Parque Tangamanga” and a bus station at the zone. Figure 6d shows the principal contributions in color red across the main avenue of Rio Santiago but also at Hernan Cortes and Damian Carmona Avenues.
The fifth one was a mixture emission source. On the one hand, the presence of Cl, S, and Ca suggest the brick-making process for a specific kind of regional clay. Gonzalez [58] showed that elemental composition could vary on the kind of raw material used for the bricks, firing temperature, time, and kiln used. Also, this composition could be particular of a kind of brick with some glaze to make it in this zone, and on the other hand, the presence of S, V, and Cu suggested a mix of Fuel Oil with other trace elements marked with biomass burning like Na, Ca, Cl, Fe, and V [33,41,46], especially for episodes reported on 27 June, 8 August, and 17 October, for the year 2017. Vega et al. [41] also identified OC and K were not found in this source, as other studies have shown (explained later).
Source 6 is associated with a smelting industry source and has high correlations among Zn, Ca, Fe, Pb, and OC, with an enrichment with Mn and EC. Figure 6f shows the main high concentrations at three different zones, but also DENUE locates some smelting industries there. This source has been widely identified in zinc and lead smelters [59,60]. Zn, Pb, and Mn are referred to as steel processes and zinc metallurgy [61], but also Zn and Pb can be related to municipal solid waste incinerators and cement production [62]. Johnson [63] also observed this source with a high Zn and Mn correlation in three different stages contained in PM2.5 in Mexico City during the MILAGRO Campaign.
The seventh source corresponds to the Chemical Industry composed of OC, Cl, and EC with high industrial markers contribution as Mn, Cr, Fe, Ni, and Pb. This source is identified in Mexican industrial zones, in Mexico City in the north zone [22,46], and in Queretaro [64].
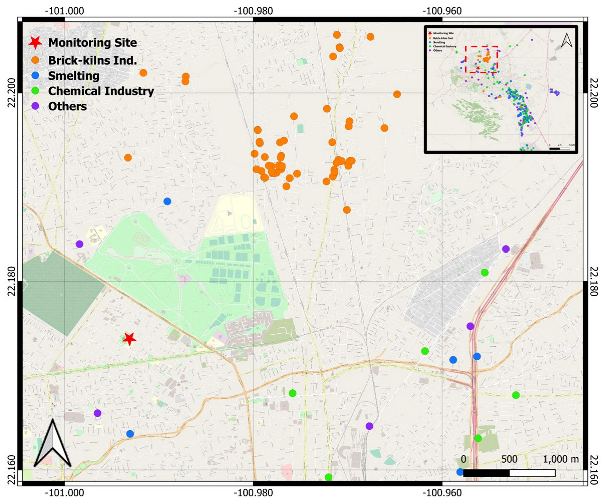
Figure 6 displays the main emission zones for each factor for the year 2017, revealing that these areas had highly active hotspot disturbances; further studies are in progress to corroborate their existence. Finally, dots in colors represent the same type of industries shown in DENUE and with the same classification as Figure 1b.

4. Discussion

In Mexico, air pollution local networks only evaluate the gravimetric mass. Thus, there is a lot to know about the chemical composition of the PM pollutant in large Mexican cities, such as San Luis Potosi; predominantly in the fine fraction of PM2.5 in order to create new air pollutants indicators and provide a new understanding of the interactions and processes of the PM fractions in their different sizes and growing processes to decrease the emission of source precursors, but mainly to reduce the health risks in the population.
Although San Luis Potosí is a growing city of just over 1.2 million inhabitants, the PM2.5 mass concentrations do not frequently exceed the official regulations for this pollutant [37]; the obtained PM2.5 composition for this northern area of the city of San Luis Potosi showed a strong chemical reactivity and a high toxic composition due to the presence of heavy metals (Pb, As, Zn, and Cu) which have been reported since decades [65], and linked to cancer and non-cancer health risk [2]. Heavy metals concentrations surpassing for other studies carried out in larger cities such as Mexico City [22,49], Monterrey [66], Queretaro [64], and Hidalgo [15]. Also, strong chemical reactivity is due to high concentrations of carbonaceous compounds, a high amount of S due to fuel combustion, and a high concentration of Ca due to the soil resuspension towards the city and the main fluorite industry in Mexico produced at Villa de Zaragoza (near 40 km from SLP City), which is widely used in the metal-mechanic, chemical and construction industries. Also, K was very abundant during the two years, and a deeper analysis is necessary because this element has multiple emission sources, such as biomass burning, soil dust, waste incineration, coal fire, industry, meat cooking, and smelting [67]. In this study, K was also associated with at least five emission sources.
The application of PMF to these PM2.5 samples showed the main emission sources at this monitoring zone. Mobile sources represent a percentage (≈20%) because there are only a few high avenues with moderate vehicular traffic, and high traffic happens just in the mornings from 7 to 9 A.M. near the site. The urban dust source represents a considerable emission percentage (≈25%) because, in this area, there are still many unpaved streets, producing the resuspension of the soil with other particles resulting from other pollution processes, for example, the braking of train tracks around the study area. This braking source was founded for the first time in Mexico cities, and it was verified with other international studies in cities with railways.
Finally, the northern zone of the city has suffered a serious problem in terms of contamination and effects on public health for decades due to the presence of a brick-making area, which has about 100 kilns that work intermittently. This study showed the emission of highly toxic air pollutants such as Cu, Fe, Zn, Mn, V, and Pb, while the carbonaceous fraction presents high emissions with OC and EC that could be an indicator for black carbon (BC) and associated with other carbonaceous compounds like Polycyclic Aromatic Hydrocarbons (PAHs), generally correlated, as well as a high amount of S. This can be associated with the incomplete combustion of different anthropogenic compounds, and biomass burning, but also with the presence of all kinds of waste (municipal, industrial, electric, and/or electronic). Because of that, four emission sources were associated: Chemical Industry, Oil Combustion, Smelting, and Fuel Oil + Ceramic Industry, corresponding to the brick manufacturing zone, as can be seen in Figure 6. As such, there is no brick kiln characteristic chemical composition source since it depends on the fuel used for the combustion. Therefore, it was possible to georeference and verify the presence of other industrial sources that produce the chemical associations proposed by the PMF analysis (Figure 7) through the DENUE. Also, these emissions can expand quickly from the north zone to downtown in the morning and may dissipate at night when the winds blow through the East.
The most similar source determined for PM2.5 in Mexico was reported in Hidalgo by [41] Vega (2021), using ICP/MS and identified the Cement Kilns source through the presence of Cr, Co, Zn, Cd, Pb, Hg, OC, and EC. Also, Aldape et al. [68], in a PM2.5 study, detected and determined the presence of an incinerator and coal-burning source (Mn, Zn, Pb) in Mexico City. Herrera-Murillo et al. [69] identified, in a PM2.5 study in Salamanca, Mexico, the presence of a ceramic and brick manufacturing source composed of Al, Si, Ca, Fe, Zn, OC, EC, and Sulfates, plus a garbage-burning source; however, heavy metals were majorly associated by others anthropogenic sources in the PMF analysis. And recently, Quiroz-Carranza [70] reported a compilation of the contribution of some elements such as (Mg, Fe, Cu, Zn, Cd, As, Ba, Se, Sr, and Hg) and compounds such as (CO, CO2, NO, NO2, SO2, dioxins, furans, and polychlorinated biphenyls, etc.), emitted according to different fuels used in a brick kilns zone in Queretaro, Mexico.
In other countries, the waste incinerator source is distinguished by the combustion of municipal solid and chemical industry waste. Therefore, many studies showed the presence of Cl, Cu, Zn, Cd, Hg, OC, and EC associated with this source [54,62,71,72,73,74]. As it has been identified at the zone, the brick kilns industry uses all kinds of waste, as well as incinerators, and because of that, there is a similar correlation in the chemistry species.
Meteorological conditions, rainfall, natural forest fires, and the emissions of precursors are associated with PM2.5 concentrations in different seasons. The highest PM2.5 concentrations were registered in the summer season due mainly to the brick kiln zone. During winter, stationary conditions accumulate particulate matter, mostly in the city (Figure 4d).
It is necessary to pay more attention to these growing Mexican cities (at least there are more than 10 with nearly the same population), which also present similar emission sources like chemical, construction, and mining industries, not overpassing the national particulate standards frequently, making local authorities not to take care of the pollution issues.

5. Conclusions

Legislation of PM concentration mass limits has been established worldwide in the last fifty years as an indicator of air quality. As observed in SLP city, PM2.5 can overpass the national standards for a few days during the year. However, it is necessary to pay special attention to the particulate matter chemical composition and generate new air pollutants indicators.
In two years of PM2.5 monitoring, concentrations of trace elements and total organic compounds were analyzed by different techniques and divided into two data sets. Concentrations differences in the two years were due to different yearly seasons when the contributions of different emission sources showed in the year 2017 a major influence on heavy metals (V, Cr, Mn, Ni, Cu, Zn, Pb), a significant decrement in the next year also due to a dry weather year, and a major crustal elements concentration (Na, Al, Si, P) in the year 2018. Heavy metal concentrations are higher than any worldwide regulation limit. Other elements like Ca, K, and Cl varied according to their main emission sources. The combination of an X-ray spectrometric technique and the Total Carbon method allowed the identification of possible sources of PM2.5 in the SLPMA during the year 2017.
With the above, it was possible to determine the seven main emission sources as well as their contribution percentages to the sample area. This work carried out a PM2.5 campaign in the city of San Luis Potosí, which is mainly influenced by a brick-making center and by some other chemical industries near the test point that impact the entire city.
The recognition of the contributing sources was supported by similar studies from other urban areas, especially from other countries. However, it is necessary to conduct more studies in different cities in Mexico to determine the concentrations of pollutants, source contributions patterns for anthropogenic fuels (industries, mobile sources), and natural sources (Biomass Burning, Resuspended Soils) to create a national source database. The most significant contributions to air pollution were caused by resuspended urban dust, mobile sources, and the main combination of oil combustion and chemical industry, caused by the brick kiln zone and other local industries were explained by the application of positive matrix factorization. Some specific and area sources at the north of SLP impact multiple areas of the city; however, geography and meteorology generally cause air pollution to disperse throughout it gradually. Finally, it is necessary to pay special attention to the brick kiln zone to prohibit the use of some of the materials in the combustion, and a major program to relocate not just the brick kiln industry but also some industries located inside the common suburbs to improve the air quality all over the city.
Future works on this issue must include another PMF analysis for different zones of the San Luis Potosi metropolitan zone to determine the influences of the main industrial zones in the south and the emissions produced downtown in order to know the main mix of chemicals emissions in the city, but also to expand the database in this kind of growing Mexican urban zones.

Author Contributions

Conceptualization, V.B. and C.C.; Formal Analysis, J.M. and V.M.-A.; Investigation, V.B., J.M. and V.M.-A.; Methodology, V.B., R.F. and C.C.; Measurements: V.B. and R.F.; Data Curation, V.B. and J.M.; Writing—Original Draft Preparation, V.B.; Writing—Review and Editing, J.M. and V.M.-A.; Visualization, V.B., C.C., R.F., V.M.-A. and G.G.; Supervision, J.M., C.C., G.G. and V.M.-A.; Project Administration, V.B., G.G. and C.C.; Funding Acquisition, V.B. All authors have read and agreed to the published version of the manuscript.

Funding

This research was funded by “Proyecto CONACYT de Problemas Nacionales 2016 (CONACYT National Problems Projects, 2016) (#01-3849), “Evaluación de la fracción orgánica presente en las partículas atmosféricas en el estado de San Luis Potosí y su impacto en el cambio climático y la salud pública”.

Institutional Review Board Statement

Not applicable.

Informed Consent Statement

Not applicable.

Data Availability Statement

Sent a message to corresponding author.

Acknowledgments

This work was supported by CONACYT National Problems Projects, 2016 (01-3849), “Evaluación de la fracción orgánica presente en las partículas atmosféricas en el estado de San Luis Potosí y su impacto en el cambio climático y la salud pública”. Also, recognize the support of CONACYT through the scholarships for C. Muñiz and A Saucedo. The authors gratefully acknowledge the technical assistance of J.C. Pineda, C.L. Garcia-Guerrero, and A. Ruiz-Ramirez. Additionally, recognizing the NOAA Air Resources Laboratory (ARL) for the provision of the HYSPLIT transport and dispersion model and/or READY website (https://www.ready.noaa.gov (accessed on 15 June 2023)), as well as the support of the SEGAM-SLP for the meteorological data used in this publication.

Conflicts of Interest

The authors declare no conflict of interest.

References

  1. Kulmala, M.; Laakso, L.; Lehtinen, K.E.J.; Riipinen, I.; Dal Maso, M.; Antilla, T.; Kerminen, V.M.; Hörrak, U.; Vana, M.; Tammet, H. Initial steps of aerosol growth. Atmos. Chem. Phys. 2004, 4, 2553–2560. [Google Scholar] [CrossRef] [Green Version]
  2. WHO. WHO Health Aspects of Air Pollution with Particulate Matter, Ozone and Nitrogen Dioxide; Report on a WHO Working Group; World Health Organization Regional Office for Europe: Copenhagen, Denmark, 2013.
  3. Seinfeld, J.H.; Pandis, S.N. Atmospheric Chemistry and Physics: From Air Pollution to Climate Change, 2nd ed.; John Wiley & Sons, Inc.: Hoboken, NJ, USA, 2006. [Google Scholar]
  4. Bond, T.C.; Dhoerty, S.J.; Fahey, D.W.; Forster, P.M.; Berntsen, T.; DeAngelo, B.J.; Flanner, M.G.; Ghan, S.; Kärcher, B.; Koch, D.; et al. Bounding the role of black carbon in the climate system: A scientific assesment. J. Geophys. Res. 2013, 118, 5380–5552. [Google Scholar] [CrossRef]
  5. Qu, R.; Han, G. A critical review of the variation in rainwater acidity in 24 Chinese cities during 1982–2018. Elem. Sci. Anthr. 2021, 9, 00142. [Google Scholar] [CrossRef]
  6. Watson, J.G. Visibility: Science and Regulation. J. Air Waste Manag. 2002, 52, 628–713. [Google Scholar] [CrossRef] [PubMed] [Green Version]
  7. Nava, S.; Becherini, F.; Bernardi, A.; Bonazza, A.; Chiari, M.; García-Orellana, I.; Lucarelli, F.; Ludwig, N.; Migliori, A.; Sabbioni, C.; et al. An integrated approach to assess air pollution threats to cultural heritage in a semi-confined environment: The case study of Michelozzo’s Courtyard in Florence (Italy). Sci. Total Environ. 2010, 408, 1403–1413. [Google Scholar] [CrossRef]
  8. Santibáñez-Andrade, M.; Quezada-Maldonado, E.M.; Osornio-Vargas, Á.; Sánchez-Pérez, Y.; García-Cuellar, C. Air pollution and genomic instability: The role of particulate matter in lung carcinogenesis. Environ. Pollut. 2017, 229, 412–422. [Google Scholar] [CrossRef]
  9. Michael, S.; Montag, M.; Dott, W. Pro-inflammatory effects and oxidative stress in lung macrophages and epithelial cells induced by ambient particulate matter. Environ. Pollut. 2013, 183, 19–29. [Google Scholar] [CrossRef]
  10. Gualtieri, M.; Øvrevik, J.; Holme, J.A.; Perrone, M.G.; Bolzacchini, E.; Schwarze, P.E.; Camatini, M. Differences in cytotoxicity versus pro-inflammatory potency of different PM fractions in human epithelial lung cells. Toxicol. Vitr. 2010, 24, 29–39. [Google Scholar] [CrossRef]
  11. Hoffman, B.; Moebus, S.; Dragano, N.; Stang, A.; Möhlenkamp, S.; Schmermund, A.; Memmesherimer, M.; Bröcker, M.; Mann, K.; Erbel, R.; et al. Chronic Residential Exposure to Partticulate Matter Air Pollution and Systemic Inflammatory Markers. Environ. Health Perspect. 2009, 117, 1302–1308. [Google Scholar] [CrossRef] [Green Version]
  12. Pope, C.A., III; Dockery, D.W. Health Effects of Fine Particulate Air Pollution: Lines that Connect. J. Air Waste Manag. Assoc. 2006, 56, 709–742. [Google Scholar] [CrossRef]
  13. Pan, S.; Lin, L.; Zeng, F.; Zhang, J.; Dong, G.; Yang, B.; Jing, Y.; Chen, S.; Zhang, G.; Yu, Z.; et al. Effect of lead, cadmium, arsenic, and mercury co-exposure on children’s intelligence quotient in an industrialized area of southern China. Environ. Pollut. 2018, 235, 47–54. [Google Scholar] [CrossRef]
  14. Zheng, N.; Liu, J.; Wang, Q.; Liang, Z. Health risk assessment of heavy metal exposure to street dust in the zinc smelting district, Northeast of China. Sci. Total Environ. 2010, 408, 726–733. [Google Scholar] [CrossRef]
  15. Cortez-Lugo, M.; Riojas-Rodríguez, H.; Moreno-Macías, H.; Montes, S.; Rodríguez-Agudelo, Y.; Hernández-Bonilla, D.; Catalán-Vázquez, M.; Díaz-Godoy, R.; Rodríguez-Dozal, S. Evaluation of the effect of an environmental management program on exposure to manganese in a mining zone in Mexico. Neurotoxicology 2017, 64, 142–151. [Google Scholar] [CrossRef]
  16. Riojas, H.; Solís, R.; Schilmann, A.; Montes, S.; Rodriguez, S.; Ríos, C.; Rodríguez, Y. Intellectual Function in Mexican Children Living in a Mining Area and Environmentally Exposed to Manganese. Environ. Health Perspect. 2010, 118, 1465–1470. [Google Scholar] [CrossRef] [Green Version]
  17. Diario Oficial de la Federación. Norma Oficial Mexicana NOM-025-SSA1-2021; Salud Ambiental. Criterio Para Evaluar la Calidad del Aire Ambiente con Respecto a las Partículas Suspendidas PM10 y PM2.5. Valores Normados para la Concentración de Partículas Suspendidas PM10 y PM2.5 en el Aire Ambiente, Como Medida de Protección a la Salud de la Población. Secretaria de Salud: Mexico City, Mexico, 2021. Available online: https://www.dof.gob.mx/nota_detalle.php?codigo=5633855&fecha=27/10/2021#gsc.tab=0 (accessed on 15 June 2023).
  18. Diario Oficial de la Federación. Norma Oficial Mexicana NOM-156-SEMARNAT-2012; Establecimiento y Operación de Sistemas de Monitoreo de la Calidad del Aire. Secretaria de Medio Ambiente y Recursos Renovables: Mexico City, Mexico, 2012. Available online: https://www.dof.gob.mx/nota_detalle.php?codigo=5259464&fecha=16/07/2012#gsc.tab=0 (accessed on 15 June 2023).
  19. Diario Oficial de la Federación. Norma Oficial Mexicana NOM-172-SEMARNAT-2019; Lineamientos para la Obtención y Comunicación del Índice de Calidad del Aire y Riesgos a la Salud. Secretaria de Medio Ambiente y Recursos Renovables: Mexico City, Mexico, 2019. Available online: https://www.dof.gob.mx/nota_detalle.php?codigo=5579387&fecha=20/11/2019 (accessed on 15 June 2023).
  20. Instituto Nacional de Estadística y Geografía. San Luis Potosí División Municipal. Censo de Población y Vivienda. 2020. Available online: https://cuentame.inegi.org.mx/monografias/informacion/slp/territorio/divmunicipal.aspx?tema=me&e=24 (accessed on 15 June 2023).
  21. Pineda-Martinez, L.F.; Carbajal, N.; Ramos, A.; Aragon-Piña, A.; García, A.R. Dispersion of atmospheric coarse particulate matter in the San Luis Potosí, México, urban area. Atmosfera 2014, 27, 5–19. [Google Scholar] [CrossRef] [Green Version]
  22. Hernández-López, A.E.; Miranda Martín del Campo, J.; Mugica-Álvarez, V.; Hernández-Valle, B.L.; Mejía-Ponce, L.V.; Pineda-Santamaría, J.C.; Reynoso-Cruces, S.; Mendoza-Flores, J.A.; Rozanes-Valenzuela, D. A study of PM2.5 elemental composition in southwest Mexico City and development of receptor models with positive matrix factorization. Rev. Int. Contam. Ambient. 2021, 37, 67–88. [Google Scholar] [CrossRef]
  23. Bernasconi, G.; Tajani, A.; Kregsamer, P. Manual for QXAS-AXIL. Version 3.5 International Atomic Energy Agency, Vienna International Council on Clean Transportation and Diesel. 2000. Available online: https://www.transportpolicy.net/topic/air-quality-standards (accessed on 15 June 2023).
  24. Espinosa, A.A.; Miranda, J.; Pineda, J.C. Evaluation of uncertainty in correlated quantities: Application to elemental analysis of atmospheric aerosols. Rev. Mex. Fís. E 2010, 56, 134–140. [Google Scholar]
  25. Hopke, P.K. Recent developments in receptor modeling. J. Chemom. 2003, 17, 255–265. [Google Scholar] [CrossRef]
  26. Paatero, P.; Tapper, U. Positive Matrix Factorization: A Non-negative Factor Model with Optimal Utilization of Error Estimates of Data Values. Environmetrics 1994, 5, 111–126. [Google Scholar] [CrossRef]
  27. Hopke, P.K. A Review of Receptor Modeling Methods for Source Apportionment. J. Air Waste Manag. Assoc. 2016, 66, 237–259. [Google Scholar] [CrossRef]
  28. Environmental Protection Agency. Positive Matrix Factorization (PMF) 5.0 Model. 2014. Available online: https://www.epa.gov/air-research/positive-matrixfactorization-model-environmental-data-analyses (accessed on 15 June 2023).
  29. Belis, C.A.; Larsen, B.R.; Amato, F.; El Haddad, I.; Favez, O.; Harrison, R.M.; Hopke, P.K.; Nava, S.; Paatero, P.; Prévôt, A.; et al. European Guide on with Receptor Models Air Pollution Source Apportionment; JRC Reference Reports; EU: European Commission, Joint Research Centre, Institute for Environment and Sustainability: Ispra, Italy, 2014; Available online: http://www.jrc.ec.europa.eu (accessed on 15 June 2023).
  30. Brown, S.G.; Hafner, H. Multivariate Receptor Modeling Workbook; Sonoma Technology Inc.: Petaluma, CA, USA, 2005; p. 236. Available online: http://www.sonomatechdata.com/sti_workbooks/ (accessed on 15 June 2023).
  31. Polissar, A.V.; Hopke, P.K.; Paatero, P.; Malm, W.C.; Sisler, J.F. Atmospheric aerosol over Alaska, 2. Elemental composition and sources. J. Geophys. Res. 1998, 103, 19045–19057. [Google Scholar] [CrossRef]
  32. Norris, G.A.; Vedantham, R.; Wade, K.; Zhan, P.; Brown, S.; Paatero, P.; Eberly, S.I.; Foley, C. Guidance Document for PMF Applications with the Multilinear Engine; EPA/600/R-09/032; US Environmental Protection Agency: Washington, DC, USA, 2009.
  33. Lucarelli, F.; Nava, S.; Calzolai, G.; Chiari, M.; Giannoni, M.; Traversi, R.; Udisti, R. On the autarchic use of solely PIXE data in particulate matter source apportionment studies by receptor modeling. Nucl. Instrum. Methods Phys. Res. B 2015, 363, 105–111. [Google Scholar] [CrossRef]
  34. Carslaw, D.C.; Ropkins, K. Openair—An R package for air quality data analysis. Environ. Model. Softw. 2012, 27–28, 52–61. [Google Scholar] [CrossRef]
  35. Clarke, K.C. Advances in geographic information systems, computers, environment and urban systems. Comput. Environ. Urban Syst. 1986, 10, 175–184. [Google Scholar] [CrossRef]
  36. Draxler, R.R.; Rolph, G.D. HYSPLIT (HYbrid Single-Particle Lagrangian Integrated Trajectory) Model Access via NOAA ARL READY Website. 2010. Available online: https://ready.arl.noaa.gov/HYSPLIT.php (accessed on 15 June 2023).
  37. Diario Oficial de la Federación. Mexican Official Standard NOM-025-SSA1-2014; Salud Ambiental. Valores Límite Permisibles para la Concentración de Partículas Suspendidas PM10 y PM2.5 en el Aire Ambiente y Criterios para su Evaluación. Secretaría de Salud: Mexico City, Mexico, 2014.
  38. SINAICA. National Monitoring Network Datasets. 2018. Available online: http://sinaica.ine.gob.mx/ (accessed on 15 June 2023).
  39. Air Quality Standards. Transport Policy. 2022. Available online: https://www.transportpolicy.net/topic/air-quality-standards/ (accessed on 4 October 2021).
  40. Turpin, B.J.; Lim, H. Species Contributions to PM2.5 Mass Concentrations: Revisiting Common Assumptions for Estimating Organic Mass. Aerosol Sci. Technol. 2001, 35, 602–610. [Google Scholar] [CrossRef]
  41. Vega, E.; López-Veneroni, D.; Ramírez, O.; Chow, J.C.; Watson, J.G. Particle-bound PAHs and Chemical Composition, Sources and Health Risk of PM2.5 in a Highly Industrialized Area. Aerosol Air Qual. Res. 2021, 21, 210047. [Google Scholar] [CrossRef]
  42. Paatero, P. User’s Guide for Positive Matrix Factorization Programs PMF2 and PMF3, Part 1: Tutorial. 2015. Available online: https://www.helsinki.fi/~paatero/PMF/pmf2.zip (accessed on 15 June 2023).
  43. Miranda, J.; Andrade, E.; Lopez-Suarez, A.; Ledesma, R.; Cahill, T.A.; Wakabayashi, P.H. A receptor model for atmospheric aerosols from a southwestern site in Mexico City. Atmos. Environ. 1996, 30, 3471–3479. [Google Scholar] [CrossRef]
  44. Miranda, J. Analysis of atmospheric aerosols in large urban areas with particle induced X-ray emission. In Aerosol Chemical Processes in the Environment; Spurny, K.R., Ed.; CRC Press: Boca Raton, FL, USA, 2000; pp. 405–413. [Google Scholar]
  45. Querol, X.; Pey, J.; Minguillón, M.C.; Pérez, N.; Alastuey, A.; Viana, M.; Moreno, T.; Bernabé, R.M.; Blanco, S.; Cárdenas, B.; et al. PM speciation and sources in Mexico during the MILAGRO-2006 Campaign. Atmos. Chem. Phys. 2008, 8, 111–128. [Google Scholar] [CrossRef] [Green Version]
  46. Barrera, V.A.; Miranda, J.; Espinosa, A.A.; Meinguer, J.; Martínez, J.N.; Cerón, E.; Morales, J.R.; Miranda, P.A.; Días, J.F. Contribution of soil, sulfate, and biomass burning sources to the elemental composition of PM10 from Mexico City. Int. J. Environ. Res. 2012, 6, 597–612. [Google Scholar] [CrossRef]
  47. Nava, S.; Calzolai, G.; Chiari, M.; Giannoni, M.; Giardi, F.; Becagli, S.; Severi, M.; Traversi, R.; Lucarelli, F. Source Apportionment of PM2.5 in Florence (Italy) by PMF Analysis of Aerosol Composition Records. Atmosphere 2020, 11, 484. [Google Scholar] [CrossRef]
  48. Barrera, V.; Calzolai, G.; Chiari, M.; Lucarelli, F.; Nava, S.; Giannoni, M.; Becagli, S.; Frosini, D. Study of air pollution in the proximity of a waste incinerator. Nucl. Instrum. Methods Phys. Res. Sect. B Beam Interact. Mater. Atoms 2015, 363, 112–118. [Google Scholar] [CrossRef]
  49. Mejía-Ponce, L.V.; Hernández-López, A.E.; Miranda-Martín-del-Campo, J.; Pineda-Santamaría, J.C.; Reynoso-Cruces, S.; Mendoza-Flores, J.A.; Espinosa-Guzmán, A.A. Elemental analysis of PM10 in southwest Mexico City and source apportionment using positive matrix factorization. J. Atmos. Chem. 2022, 79, 167–198. [Google Scholar] [CrossRef]
  50. Chillrud, S.N.; Epstein, D.; Ross, J.M.; Sax, S.N.; Pederson, D.; Spengler, J.D.; Kinney, P.L. Elevated airborne exposures of teenagers to manganese, chromium, and iron from steel dust and New York City’s subway system. Environ. Sci. Technol. 2004, 38, 732–737. [Google Scholar] [CrossRef]
  51. Minguillón, M.C.; Reche, C.; Martins, V.; Amato, F.; de Miguel, E.; Capdevila, M.; Centelles, S.; Querol, X.; Moreno, T. Aerosol sources in subway environments. Environ. Res. 2018, 167, 314–328. [Google Scholar] [CrossRef] [PubMed]
  52. Park, D.; Oh, M.; Yoon, Y.; Park, E.; Lee, K. Source identification of PM10 pollution in subway passenger cabins using positive matrix factorization. Atmos. Environ. 2012, 29, 180–185. [Google Scholar] [CrossRef]
  53. Park, D.; Lee, T.; Hwang, D.; Jung, W.; Lee, Y.; Cho, K.; Kim, D.; Lee, K. Identification of the sources of PM10 in a subway tunnel using positive matrix factorization. J. Air Waste Manag. Assoc. 2014, 64, 1361–1368. [Google Scholar] [CrossRef]
  54. Lucarelli, F.; Barrera, V.; Becagli, S.; Chiari, M.; Giannoni, M.; Nava, S.; Traversi, R.; Calzoilai, G. Combined use of daily and horly data sets for the source apportionment of particulate matter near a waste incinerator plant. Environ. Pollut. 2019, 247, 802–811. [Google Scholar] [CrossRef] [Green Version]
  55. Vega, E.; Lowenthal, D.; Ruiz, H.; Reyes, E.; Watson, J.G.; Chow, J.C.; Viana, M.; Querol, J.; Alastuey, A. Fine particle receptor modeling in the atmosphere of México city. J. Air Waste Manag. Assoc. 2009, 59, 1417–1428. [Google Scholar] [CrossRef]
  56. Morton, O.; Garza, R.; Hernandez, E.; Amador, O.; García, M.E.; Ordoñez, S.L.; Beramendi, L.; Santos, G.L.; Miranda, J.; Rosas, I. Recognition of the importance of geogenic sources in the content of metals in PM2.5 collected in the México city Metropolitan Area. Environ. Monit. Assess. 2018, 190, 83. [Google Scholar] [CrossRef]
  57. Garza-Galindo, R.; Morton-Bermea, O.; Hernández-Álvarez, E.; Ordoñez-Godínez, S.L.; Amador-Muñoz, O.; Beramendi-Orosco, L.E.; Retama, A.; Miranda, J.; Rosas-Pérez, I. Spatial and temporal distribution of metals in PM2.5 during 2013: Assessment of wind patterns to the impacts of geogenic and anthropogenic sources. Environ. Monit. Assess. 2019, 191, 165. [Google Scholar] [CrossRef]
  58. Gonzalez, I.; Galán, E.; Fabbri, B. Problemática de las emisiones de flúor, cloro y azufre durante la cocción de materiales de la industria ladrillera. Bol. Soc. Esp. Cerám. Vidrio 1998, 37, 307–313. [Google Scholar]
  59. Amato, F.; Hopke, P.K. Source apportionment of the ambient PM2.5 across St. Louis using constrained positive matrix factorization. Atmos. Environ. 2012, 46, 329–337. [Google Scholar] [CrossRef]
  60. Lim, J.-M.; Lee, J.-H.; Moon, J.-H.; Chung, Y.-S.; Kim, K.-H. Source apportionment of PM10 at a small industrial area using Positive Matrix Factorization. Atmos. Res. 2010, 95, 88–100. [Google Scholar] [CrossRef]
  61. Querol, X.; Viana, M.; Alastuey, A.; Amato, F.; Moreno, T.; Castillo, S.; Pey, J.; de la Rosa, J.; Sánchez de la Campa, A.; Artíñano, B.; et al. Source origin of trace elements in PM from regional background, urban and industrial sites of Spain. Atmos. Environ. 2007, 41, 7219–7231. [Google Scholar] [CrossRef]
  62. Pacyna, J.M.; Pacyna, E.G. An assessment of global and regional emissions of trace metals to the atmosphere from anthropogenic sources worldwide. Environ. Rev. 2001, 9, 269–298. [Google Scholar] [CrossRef]
  63. Johnson, K.S.; de Foy, B.; Zuberi, B.; Molina, L.T.; Molina, M.J.; Xie, Y.; Laskin, A.; Shutthanandan, V. Aerosol composition and source apportionment in the Mexico City Metropolitan Area with PIXE/PESA/STIM and multivariate analysis. Atmos. Chem. Phys. 2006, 6, 4591–4600. [Google Scholar] [CrossRef] [Green Version]
  64. Olivares-Salazar, S.E.; Alvarez-Ospina, H.; Aguillón-Vazquez, C.; Salcedo, D. Source Apportionment of Particulate Matter in the Metropolitan Area of Queretaro (Central Mexico): First Case Study. ACS Earth Space Chem. 2021, 5, 2347–2355. [Google Scholar] [CrossRef]
  65. Aragón-Piña, A.; Torres Villasenor, G.; Santiago Jacinto, P.; Monroy Fernandez, M. Scanning and transmission electron microscope of suspended lead-rich particles in the air of San Luis Potosi, Mexico. Atmos. Environ. 2002, 36, 5235–5243. [Google Scholar] [CrossRef]
  66. Mancilla, Y.; Hernandez-Paniagua, I.Y.; Mendoza, A. Spatial differences in ambient coarse and fine particles in the Monterrey metropolitan area, Mexico: Implications for source contribution. J. Air Waste Manag. Assoc. 2019, 69, 548–564. [Google Scholar] [CrossRef] [Green Version]
  67. Pachon, J.E.; Weber, R.J.; Zhang, X.; Mulholland, J.A.; Russell, A.G. Revising the use of potassium (K) in the source apportionment of PM2.5. Atmos. Pollut. Res. 2013, 4, 14–21. [Google Scholar] [CrossRef] [Green Version]
  68. Aldape, F.; Flores, M.J.; Flores, A.; Retama-Hernandez, A.; Rivera-Hernandez, O. Elemental Composition and Source Identification of PM2.5 particles collected in downtown Mexico City. Int. J. PIXE 2005, 15, 263–270. [Google Scholar] [CrossRef]
  69. Herrera Murillo, J.; Campos Ramos, A.; Ángeles García, F.; Blanco Jiménez, S.; Cárdenas, B.; Mizohata, A. Chemical composition of PM2.5 particles in Salamanca, Guanajuato Mexico: Source apportionment with receptor models. Atmos. Res. 2012, 107, 31–41. [Google Scholar] [CrossRef]
  70. Quiroz-Carranza, J.A.; Cantú, C.; Garcia, R. Entre Humo y Arcilla: Contaminación Ambiental y Sobrevivencia Humana en la Producción Artesanal de Ladrillos; Instituto de Ciencias de la Atmósfera y Cambio Climático, Universidad Nacional Autónoma de México: Mexico City, Mexico, 2021; ISBN 978-607-30-5227-6. [Google Scholar]
  71. Zhang, H.; He, P.J.; Sha, L.M. Fate of heavy metals during municipal solid waste incineration in Shanghai. J. Hazard. Mater. 2008, 156, 365–373. [Google Scholar] [CrossRef] [PubMed]
  72. Morishita, M.; Keeler, G.J.; Kamal, A.S.; Wagner, J.G.; Harkema, J.R.; Rohr, A.C. Identification of ambient PM2.5 sources and analysis of pollution episodes in Detroit, Michigan using highly time-resolved measurements. Atmos. Environ. 2011, 45, 1627–1637. [Google Scholar] [CrossRef]
  73. Jeong, C.; McGuire, M.L.; Herod, D.; Dann, T.; Dabek–Zlotorzynska, E.; Wang, D.; Ding, L.; Celo, V.; Mathieu, D.; Evans, G. Receptor model based identification of PM2.5 sources in Canadian cities. Atmos. Pollut. Res. 2011, 2, 158–171. [Google Scholar] [CrossRef] [Green Version]
  74. Venturini, E.; Vassura, I.; Ferroni, L.; Raffo, S.; Passarini, F.; Beddows, D.C.S.; Harrison, R.M. Bulk deposition close to a Municipal Solid Waste incinerator: One source among many. Sci. Total Environ. 2013, 456–457, 392–403. [Google Scholar] [CrossRef]
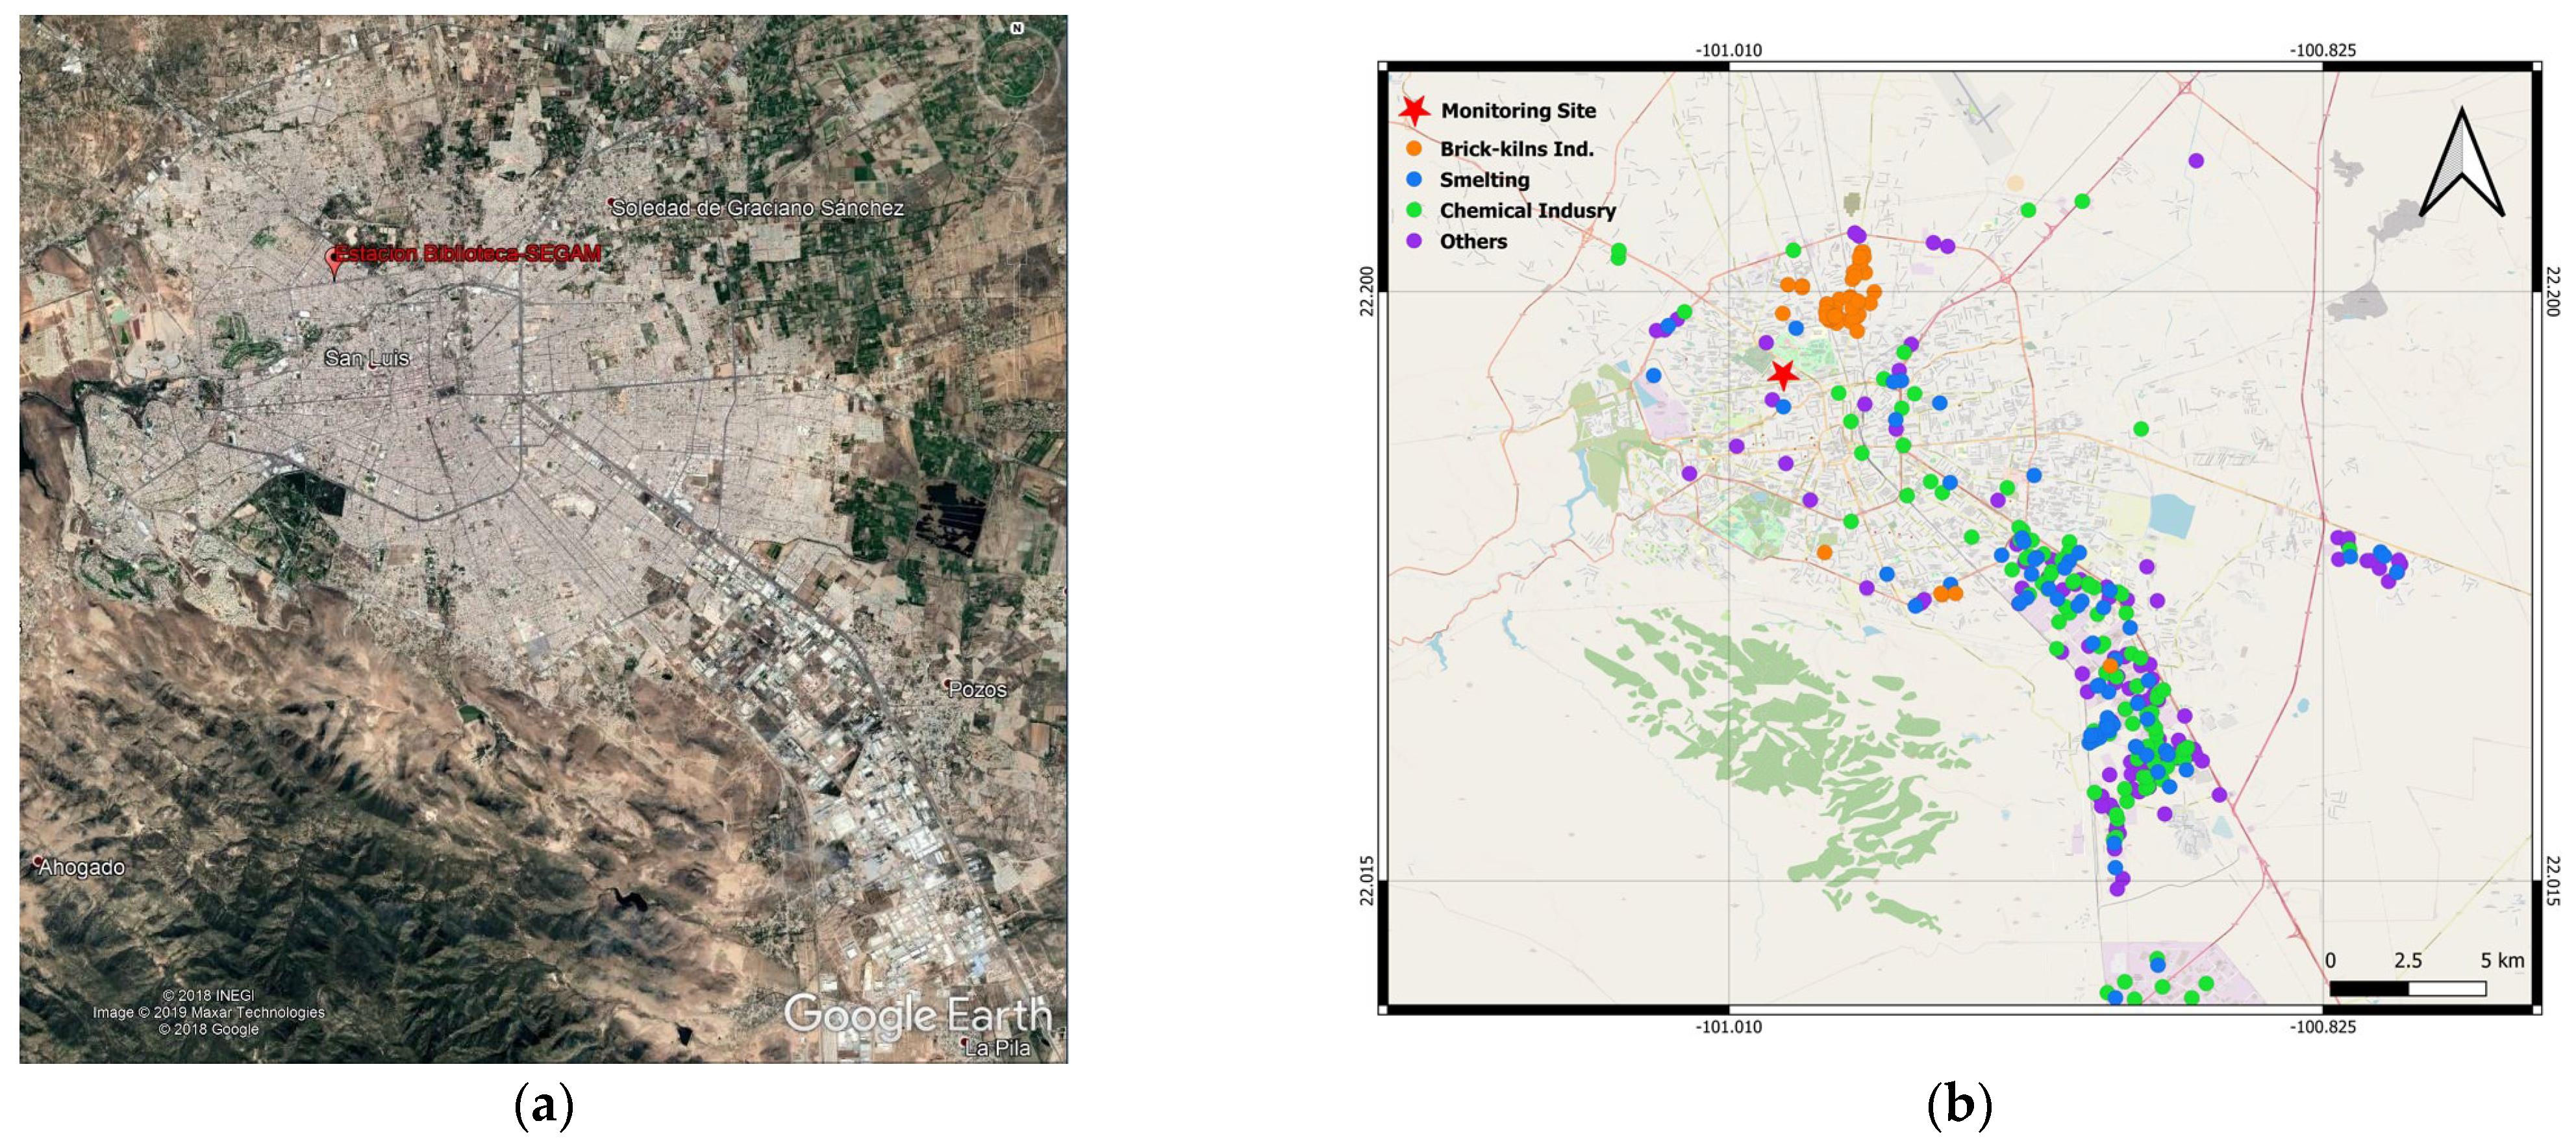
Figure 1. (a) San Luis Potosi monitoring site during the 2017–2018 campaign. (Source: Google Earth®). (b) SLP Industrial sources according to DENUE, 2021.
Atmosphere 14 01160 g001
Figure 2. PM2.5 daily concentrations (µg m−3). NOM limit value of 45 µg m−3 (dashed blue line), and WHO recommendation of 25 µg m−3 (dotted red line).
Atmosphere 14 01160 g002
Figure 3. PM2.5 episodes in daily monitoring. (a) 16 July 2017 (b) 25 March 2018. Monitoring Site (black star).
Atmosphere 14 01160 g003
Figure 4. Wind roses for the PM2.5 campaign. (a) 2017 Spring; (b) 2017 Summer; (c) 2017 Autumn; (d) 2017–2018 Winter; (e) 2018 Spring and (f) 2018 Summer. The radial scale represents the frequency of the wind speed measurement results.
Atmosphere 14 01160 g004aAtmosphere 14 01160 g004b
Figure 5. Source profiles were obtained by PMF analysis. Contribution of each species to the chemical profile composition of each source (µg/µg, blue bars) and average percentage contribution of each source to the concentration of each element (%, red dots).
Atmosphere 14 01160 g005
Figure 6. PM2.5 main emission sources obtained by the PMF model for ZMSLP in the year 2017. (a) Urban Dust (b) Oil Combustion (c) Braking (d) Mobile Sources (e) Fuel Oil + Ceramic Industry (f) Smelting (g) Chemical Industry (h) PM2.5 percentage emission per source. Monitoring Site (red star).
Atmosphere 14 01160 g006aAtmosphere 14 01160 g006b
Figure 7. Brick Kilns Industry and other emission sources at the North zone from the SLPMA. Monitoring site (red star) and Figure 6 and Figure 7 ubication zone from Figure 1b (dotted red line).
Atmosphere 14 01160 g007
Table 1. PM2.5 Chemical composition for the total monitoring campaign (µg m−3).
SpeciesYear 2017Year 2018
NMeanIncMedianStd DevNMeanIncMedianStd Dev
Na420.2830.0220.2970.108380.3420.03250.3280.210
Mg<LOD<LOD<LOD<LOD<LOD40.05380.00050.05380.025
Al270.07690.00150.05410.0589320.2220.01330.1180.308
Si460.3050.01120.2770.194370.5300.04530.3700.576
P400.01980.00010.01550.0204350.04500.00040.03830.0330
S461.650.2591.441.05381.860.3061.651.01
Cl460.4490.01740.4550.115380.3240.01050.2960.135
K460.3880.01300.3880.119380.2490.00700.2120.146
Ca460.6030.03810.5760.189380.4080.02070.3600.175
Ti420.1140.00230.1130.0542300.06360.00100.04960.0467
V450.1490.00340.1430.0655270.07390.00130.06650.0622
Cr460.3900.01530.3840.0807380.2170.00660.1700.119
Mn460.5500.05680.4190.682380.2670.01170.1530.244
Fe461.020.08351.010.131381.00340.10260.82620.5932
Ni460.5690.02850.5690.080380.3870.01510.3650.103
Cu460.2420.00670.2290.0611380.1290.00270.09630.0777
Zn460.3780.01450.3680.103380.2580.00820.2380.110
Pb462.350.4442.280.290381.160.1840.9160.412
OC4410.71.8510.03.04NDNDNDNDND
EC441.890.3281.461.42NDNDNDNDND
POM4417.22.9816.04.86NDNDNDNDND
PM2.54733.26.9931.214.74928.26.1122.615.8
ND = Not Determined. <LOD = Bellow Limit of Detection.
Table 2. PMF source apportionment for the Biblioteca-SEGAM monitoring site.
Monitoring SiteFit%
Contribution
Emission SourcesMain Chemical Species
BIBLIOTECA SITE, 2017.18 Species
7 Sources.
24.2(1) Urban Dust(OC, EC, Si, S, Pb, Fe, Ca, K)
16.3(2) Oil Combustion(S, OC, Fe, Pb, EC, Ca, Zn, Ni)
2.30(3) Braking(Ti, Pb, Mn, K, Ni, Cr, Na, Ca, Cu, Fe)
22.2(4) Mobile Sources(OC, EC, S, Pb, Fe, Cl, Na, K, Ni, Cr)
4.40(5) Ceramic Industry + Biomass Burning (OC, Ca, Na, V, Fe, S, Cu, Cl)
12.4(6) Smelting(Zn, OC, EC, Pb, Fe, Ca, Mn)
18.2(7) Chemical Industry(OC, Cl, Fe, Pb, Ni, Cr, Mn, EC)
Disclaimer/Publisher’s Note: The statements, opinions and data contained in all publications are solely those of the individual author(s) and contributor(s) and not of MDPI and/or the editor(s). MDPI and/or the editor(s) disclaim responsibility for any injury to people or property resulting from any ideas, methods, instructions or products referred to in the content.