1. Introduction
Sounding data, which can represent the temperature, humidity structure, and dynamic properties of the atmosphere over the local area prior to the occurrence of severe convective weather, have already been considered as essential reference materials for severe weather forecasting [
1]. Sounding data can be utilized to identify favorable circumstances for convection occurrence and development [
2,
3]. Convective parameters derived from sounding data can be used to categorize the characteristics of strong convection [
4,
5,
6,
7,
8], thereby constructing an objective prediction model for strong convection [
9]. Furthermore, sounding data can be used to pattern interpretation [
10], and assimilation can improve the meso-scale numerical forecast model [
11].
However, the standard radiosonde network's spatial layout is insufficient, making it difficult to capture short-term local changes in environmental factors with a detection frequency of twice a day. Simultaneously, the drift in the sounding ball reduces the regional representativeness of conventional sounding data [
12,
13]; thus, obtaining high-resolution data on temperature, pressure humidity, and wind by other means has become the primary way to overcome the limitations of conventional sounding data. Europe took the lead in strengthening the application of commercial aircraft observation systems (AMDAR) [
14] while the China Meteorological Administration (CMA) carried out sounding with high-altitude large unmanned aerial vehicles (UAVs) [
15]. The observation methods of airship- and rocket-carried sounders have also been developed at home and abroad, but there are different degrees of different types of problems, such as the high demand for suitable environment conditions, lack of professional control, poor deployment flexibility, and high costs. Some researchers combined reanalysis data with ground automatic station data to build model temperature and humidity profiles [
16,
17], but reanalysis data are insufficient to describe small- and medium-scale thermal changes, and model temperature and humidity data frequently do not reflect real atmospheric conditions. The USA took the lead in developing occultation soundings to realize the construction of high-quality atmospheric observation systems, and many countries have strengthened their vertical remote sensing based on satellites in recent years [
18,
19]. The FY-4 satellite has been developed in China, but there are few effective samples affected by the immature inversion method [
20,
21]. In recent years, many researchers have focused on ground-based remote sensing detection technology with high temporal and spatial resolution and have directly constructed remote sensing temperature and humidity profiles using microwave radiometers, cloud radars, wind profile radars, and other types of detection equipment. However, due to the large errors in the humidity profiles retrieved by microwave radiometers [
22,
23], the wind field data retrieved by wind profile radars are frequently severely distorted or missing during precipitation, making the business applications of remote sensing temperature and humidity profiles difficult to realize.
Nonetheless, the time/space density advantage of ground-based remote sensing data cannot be ignored. Both wind profile radars and microwave radiometers can perform continuous automatic observations [
24], which are useful for short-term forecasting. Microwave radiometers can provide temperature and humidity profiles from the ground to a height of 10 km [
25,
26], and the temperature profile correlates well with conventional sounding values [
11,
23]. Therefore, we tried to make use of the advantages of ground-based remote sensing data and carry out quality control pertaining to the shortcomings of the detection data to obtain effective inversion results of temperature, humidity, and wind profiles, allowing for us to capture the fine thermodynamic structure of small- and medium-sized systems. Wind profile radar inversion data obtained by the wind profile radar horizontal wind (WPR-HW) method [
27] can, after quality control, still provide rapid evolution information regarding the horizontal wind field, vertical velocity field, and other factors of rainy weather [
28], as well as providing the continuous and detailed change process of small- and medium-sized systems [
29,
30] with high reliability [
31,
32]. At the same time, several academics have validated the feasibility of fusing wind profile radar data with other temperature profile data to obtain atmospheric specific humidity profiles [
33,
34,
35,
36,
37,
38,
39] based on the influence of specific humidity changes in turbulent scattering.
In this paper, the FAS is described by reprocessing wind profile radar data, microwave radiometer data, and ground automatic station data, with the goal of reflecting local thermal and water vapor conditions and dynamic mechanisms with high timeliness, while compensating for the low spatial and temporal resolution of conventional sounding data. The FAS inversion results in Beijing were estimated from May 2021 to September 2022, and the correctness of the inversion results was evaluated using conventional sounding data in Beijing. The FAS’s application effect was assessed by selecting 40 severe convective processes in the Beijing Plain, and its operational usefulness in short-term and immediate forecasting was further investigated.
2. Materials and Methods
2.1. Selection of Instruments and Data
The foundation remote sensing air sounding profile System is built using wind profile radar power spectrum data, and its related product data, as well as microwave radiometer temperature and humidity profile data from Beijing Observatory (station 54511, 39.806° N, 116.469° E). The temperature, relative humidity, dew point temperature, and ground pressure data from the same location’s national reference weather station were chosen as boundary conditions, and the conventional sounding at the same location was chosen as the FAS comparative inspection standard. The low-mode-altitude range of the wind profile radar is 150–3630 m, with a height resolution of 120 m, and the high-mode height range is 3150–10110 m, with a height resolution of 240 m and a time resolution of 2–3 min. The microwave radiometer has a detection range of 0–10 km, with a height resolution of 25 m for 0–500 m, 50 m for 500 m–2 km, and 250 m for 2–10 km, as well as a time resolution of 2 min.
2.2. Specific Humidity Profile Inversion Method
Through multi-channel brightness temperature observations, microwave radiometers can indirectly obtain water vapor stratification information such as water vapor density and relative humidity [
40]. However, the measurement accuracy of microwave radiometers is greatly influenced by rainy weather, and it is difficult to remove the influence of water vapor on the radiometer housing [
41], meaning that humidity profile data have poor usability [
42]. A relevant study has revealed that merging ground-based remote sensing data based on turbulence scattering theory can yield the atmospheric specific humidity profile [
32,
33,
34,
35,
36,
37]. Based on this technology, this article integrates 54,511 station wind profile radar data, microwave radiometer temperature data, and ground automated station data to obtain a vertical specific humidity profile with high time precision, laying the groundwork for FAS development.
To obtain the specific humidity profile, we should calculate Brunt–Vaisala N using Formula (1). Firstly, parameters characterizing the static stability of the atmosphere are determined. Then, we calculate turbulence dissipation rate ε using Formula (2),a parameter representing the intensity of turbulence. In the next step, we calculate atmospheric refractive index gradient M using Formula (3). In the last step, we calculate stratified specific humidity using Formulas (4) and (5). At this point, we can obtain an improved specific humidity profile.
g = 9.8 m/s
2 is the gravitational acceleration,
T is the layer-by-layer temperature retrieved by microwave radiometer,
z is the height, and Γ = 9.8 K/km is the dry adiabatic direct reduction rate of temperature.
a ≈ 0.6 and
σ2 is the width of the velocity spectrum calculated from wind profile radar data.
where b is a dimensionless constant varying with height, with the range of 0.01–0.1, and
is the refractive index structure constant calculated from wind profile radar data.
where
B is the intermediate variable,
q is the specific humidity value,
P is the air pressure,
θ is the potential temperature,
Z0 is the initial height, and
q0 and
θ0 are the initial values of the specific humidity and potential temperature provided by the automatic station.
Further investigation reveals that the boundary conditions have an effect on the vertical distribution of relative humidity, and the single control variables were set as the initial value of relative humidity at the boundary, the initial temperature, and the initial ground pressure. The experimental results show that the initial relative humidity value can roughly determine the numerical range of the entire layer of the relative humidity profile, which can be mutually confirmed by fitting the entire layer of atmospheric water vapor content to the ground water vapor pressure [
43]. The initial temperature affects the change rate of specific humidity with height, and the specific humidity profile shifts to the large-value area by about 0.15 g/kg for every 1 °C decrease in temperature. The smaller the sea-level pressure, the bigger the change rate of specific humidity with height, although its sensitivity is poorer than the initial value of temperature and humidity.
2.3. WPR-HW [27], Method of Horizontal Wind Inversion
Sounding data reflect not only the local temperature and humidity structure, but also the dynamic properties. Real-time and accurate horizontal wind field data are required for the construction of FAS. As wind profile radar receives both atmospheric turbulence echo and precipitation particle scattering echo during precipitation, it is difficult to extract turbulence information from the power spectrum of the superposition of the two signals, resulting in a severe lack or distortion of the horizontal wind field data displayed by wind profile radar during precipitation [
44]. This means that continuous and true horizontal wind field data cannot be provided.
WPR-HW [
27] collects turbulence signals for the inversion of a horizontal wind field based on the idea of wind-profile radar detection technology and the power spectrum characteristics of different kinds of weather. WPR-HW’s processing object is power spectrum data. First, the number and position of peak signals in each beam’s power spectrum are automatically recognized. The turbulence spectrum is then automatically recognized and retrieved from the signal spectrum of symmetrical beams based on the criteria that the turbulence spectrum is symmetrical around the east–west (north–south) beams. Finally, using the recovered turbulence spectrum and the wind synthesis method, the horizontal wind field is generated. When compared to the European Centre for Medium-Range Weather Forecasts’ (ECMWF’s) reanalysis data, the trustworthiness of the horizontal wind field after WPR-HW quality control is confirmed, and its timeliness and efficacy fulfill the requirements of FAS construction.
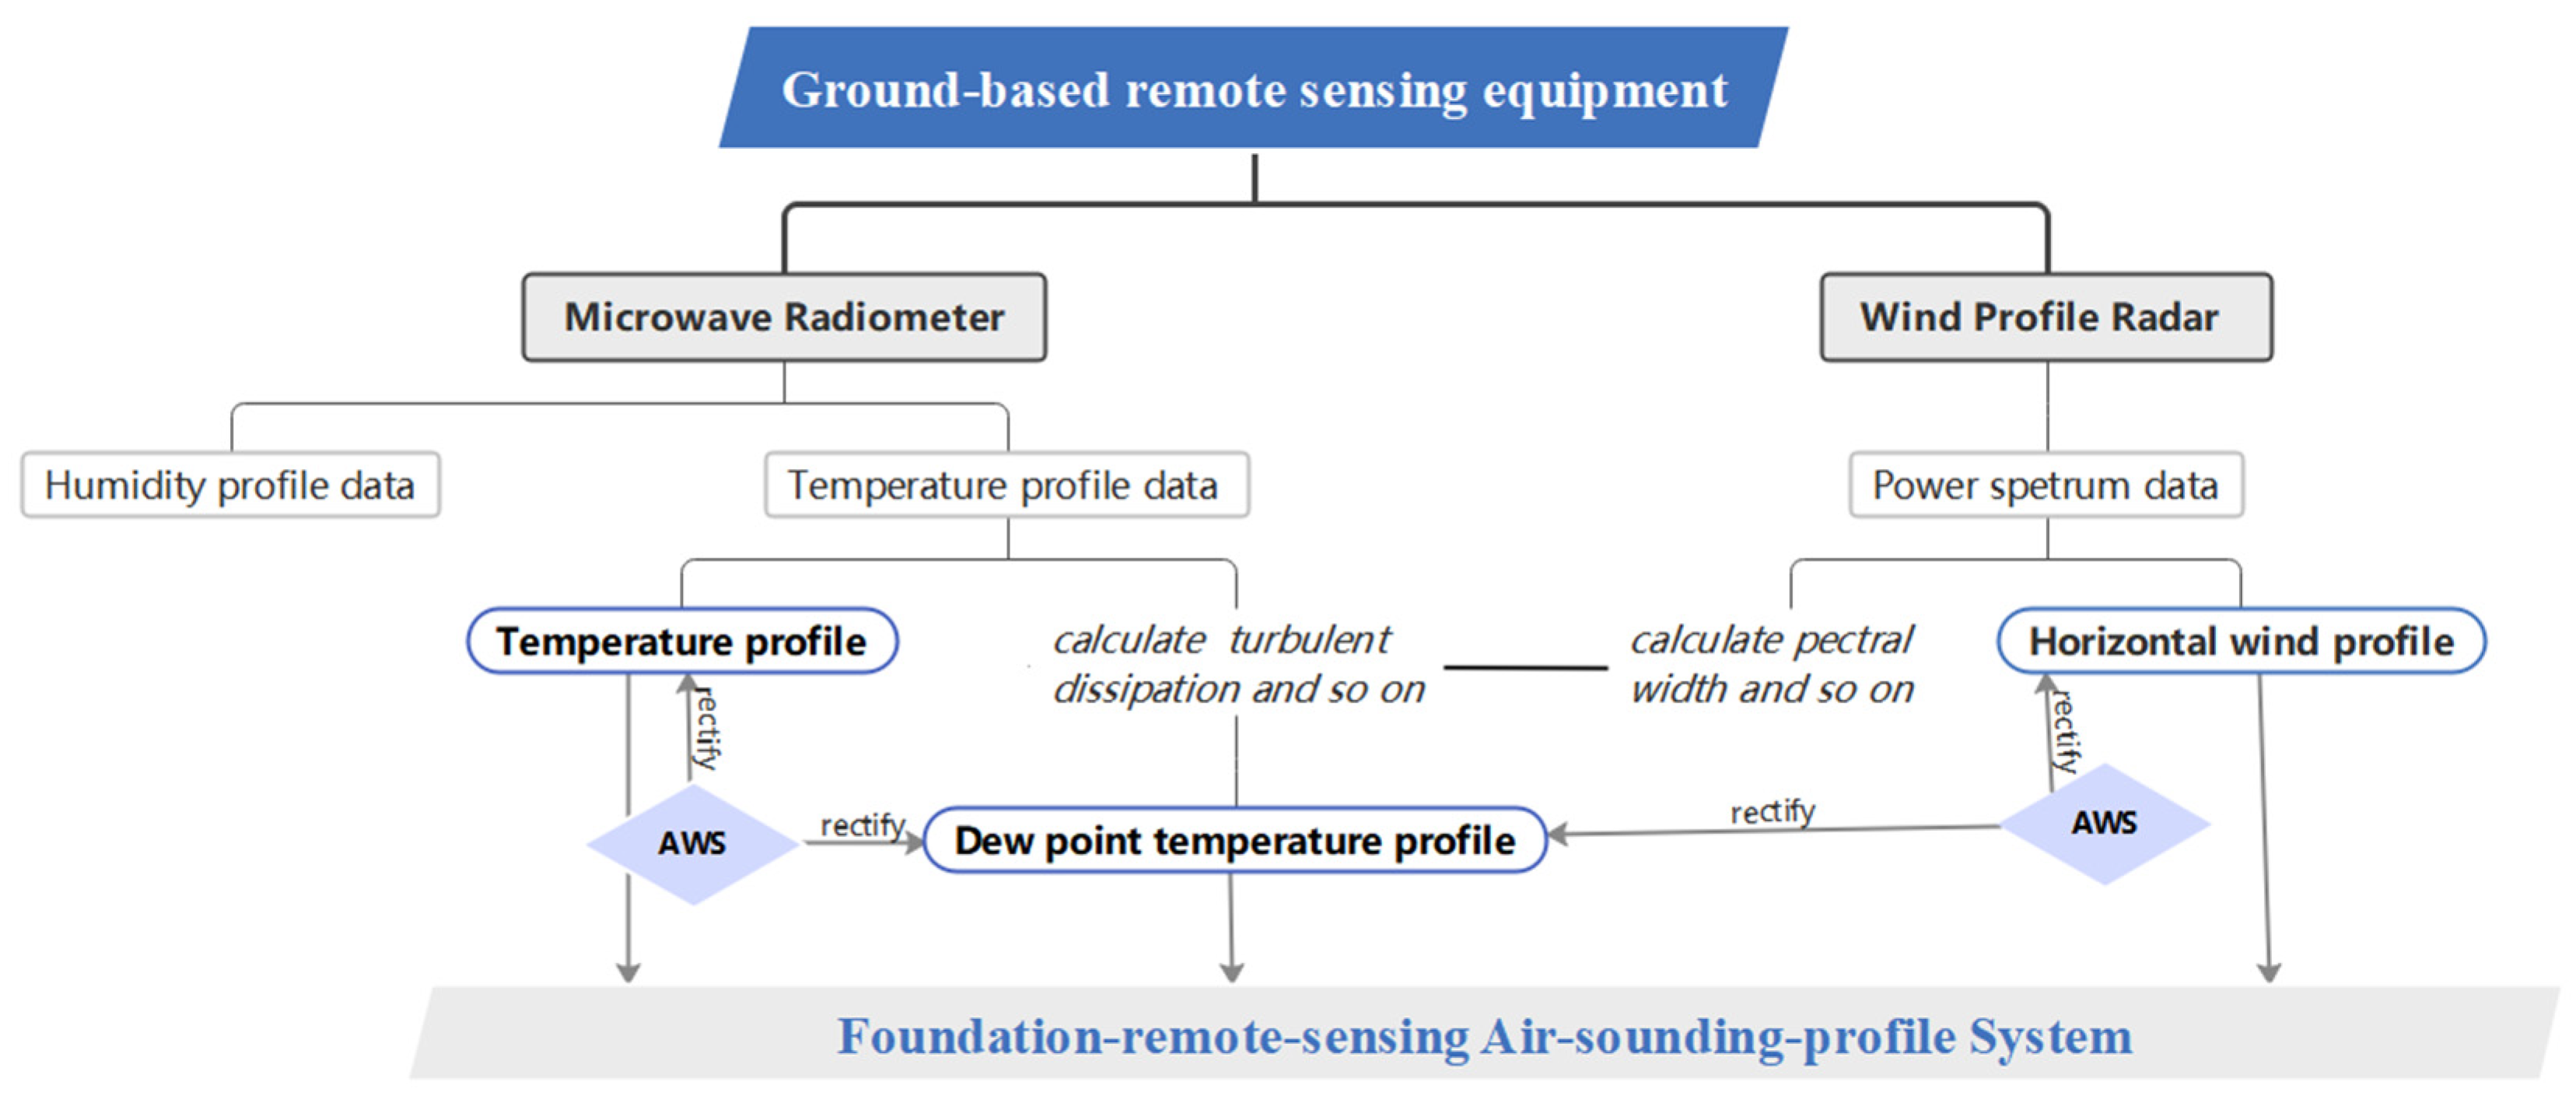
2.4. Construction Method of Foundation-Remote-Sensing Air-Sounding-Profile System
Three vertical profiles of temperature, humidity, and wind can be obtained using the multi-source observation data provided by ground-based remote sensing equipment and ground automatic stations. During the production process, the specific humidity profile inversion method and the WPR-HW method were used. The height range of the three three vertical profiles was 0–10 km. The temperature profile was obtained by microwave radiometer inversion, and the temperature value at 0 m height was corrected by the observation value of the ground automatic station. The specific humidity profile was calculated by the specific humidity profile inversion method, the specific humidity value was converted into dew point temperature value, and the dew point temperature value at 0 m height was corrected by the observation value of the ground automatic station. The horizontal wind profile was derived using wind-profile radar inversion with the WPR-HW method, and the wind direction and speed at 0 m was adjusted using the ground automatic station observation value.
The height resolution of each element was unified by the interpolation method after acquiring the vertical profiles of temperature, humidity, and wind, and the height field and pressure field were converted [
45] to create FAS.
Figure 1 depicts the construction method’s flow chart. The detection time disparity of observation data from multiple sources used for the same time FAS should be less than 1 min during the building process. The stratification parameters were converted into diamond 5 data format, which the Meteorological Information Comprehensive Analysis and Process System (MICAPS) recognizes. Finally, FAS visuals and data are shown using MICAPS’s T log-P diagram (T-lnP).
4. Application Effect Evaluation
Using Beijing’s Plain area as the research scope (the center is station 54511 and the radius is less than 40 km), 40 intense convective phenomena in 2020–2021 were chosen considering the availability of historical data, including 25 short-term heavy-precipitation processes and 15 thunderstorm processes. The FAS in the previous 8 h and the conventional sounding at the same site near the time of the powerful convective occurrences was compared and examined, as well as the application discrepancies between them. The short-term heavy rainfall on 9 June 2021 was chosen for detailed analysis, demonstrating the indicative importance of high-resolution FAS to classify and determine the potential for strong weather, as well as its ability to describe the fine thermodynamic structure of small and medium-scale systems.
4.1. Statistics and Analysis
The detection time of conventional sounding was 08:00 and 20:00. Strong convection processes in Beijing frequently occur in the afternoon or evening. During the 40 occurencess, the average time difference between the occurrence of conventional sounding and the occurrence of strong convection was 6.8 h, making it difficult to capture the most unstable phase before convection. The CAPE value of conventional sounding was less than 1000 J/kg in 17 of 40 processes, with 10 processes having a CAPE value of less than 500 J/kg and two processes having a CAPE value of zero. Conventional sounding in Beijing frequently fails to represent the local convection potential in a timely manner. The FAS, on the other hand, offers the advantage of a great time resolution. The profile data with minute-level time resolution can not only reflect the local atmospheric thermal humidity state and dynamic process in real time, but also continuously observe the process of energy growth, maintenance, and release, the formation process of thermodynamic instability, and the change process of water vapor, all of which are of direct importance to the potential for and types of severe weather.
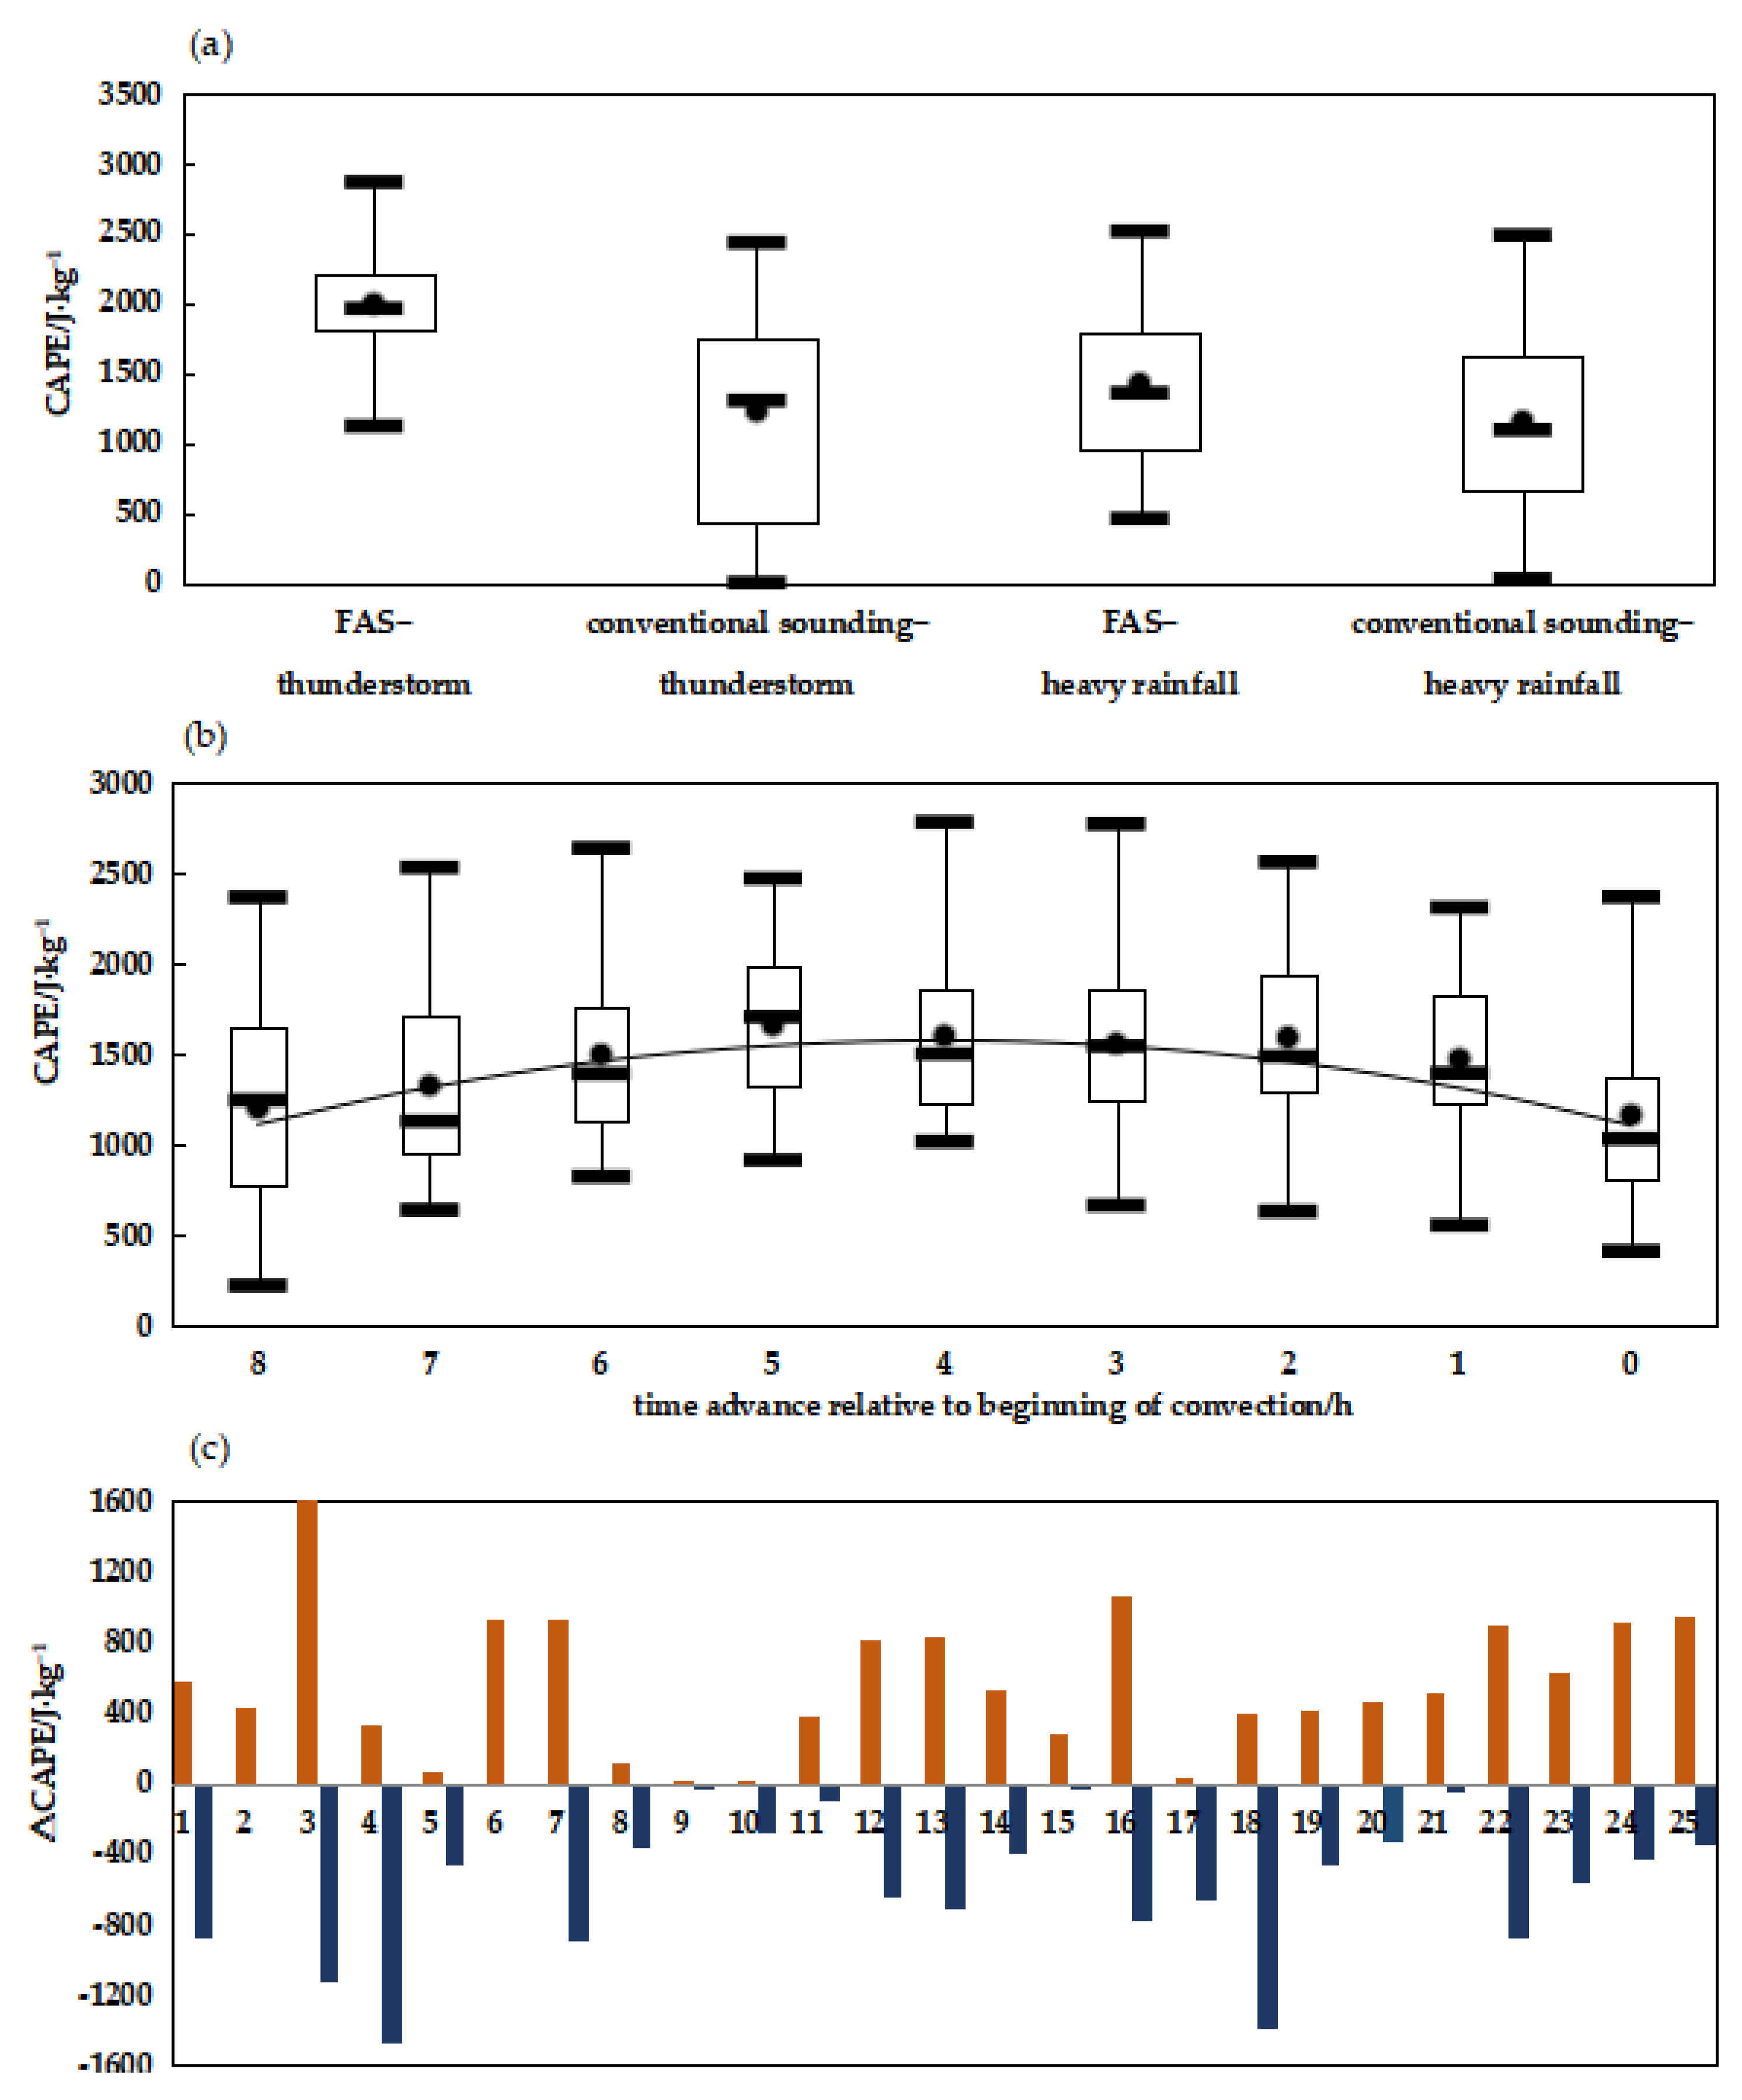
The statistics of the convective parameters CAPE, lifting index (LI), vertical wind shear, and precipitable water (PW) are presented in the form of box charts, column charts, and pie charts in this paper, the coincidence degree between the convective parameters of FAS and conventional sounding was compared with the strong convection, and the evolution law of the minute convective parameters of FAS inversion with time before the strong convection occurs was analyzed. The two ends of the box chart’s line segment reflect the maximum and minimum values, the horizontal lines of the upper, middle, and lower parts of the box represent the first quartile, the second quartile, and the third quartile respectively, and the dots represent the average value.
4.1.1. The Most Important Index of Convection Potential—CAPE
Figure 5a is a box diagram depicting the maximal CAPE value of FAS every 10 min within 8 h prior to the occurrence of thunderstorm gales and short-term heavy precipitation, as well as the distribution range of the CAPE value of conventional sounding at the approaching time. In general, because of the difference in observation time, the CAPE value of FAS is greater than that of conventional sounding, and the value distribution is more concentrated, allowing for it to capture the most opportune moment for convection potential. The minimal CAPE value in conventional sounding is zero, which diminishes the effect of predicting the occurrence of severe weather based on the convective potential reflected by sounding. The minimum value of CAPE in FAS is greater than 500 J/kg prior to short-term heavy precipitation and greater than 1000 J/kg prior to thunderstorms, which satisfies the business requirements for monitoring the trends in convective potential. The empirical threshold verifies that the CAPE of FAS more clearly indicates that the energy accumulation prior to thunderstorms is greater than that of short-term heavy precipitation.
Figure 5b is a box plot depicting the hourly distribution of the CAPE value range of FAS in the eight hours preceding the thunderstorm. On average, unstable energy tends to accumulate and then release: the average period of CAPE growth is 5–8 h prior to convection, with an average increase of 458.2 J/kg. The average maximal value of CAPE is 1658.17 J/kg and occurs from 2 to 5 h before convection; this describes the brewing process of severe weather. The average duration of rapid release of CAPE is 1–2 h prior to convection, and the combination of the favorable convective potential and rapid release of CAPE has a significant impact on the occurrence of severe weather. In contrast to thunderstorms, short-term heavy precipitation is frequently accompanied by the addition of low-level water vapor, and the average downward trend of CAPE value prior to convection is obscured by the humidification of low levels in different processes and at different periods.
Figure 5c presents a histogram of the variation in CAPE value before short-term intense rainfall for various processes. Although the overall fluctuation trend of CAPE value over time cannot be presented, the energy accumulation (red column) and release (blue column) in successive processes prior to convection can be presented to varying degrees.
4.1.2. Thermal Instability Index-LI
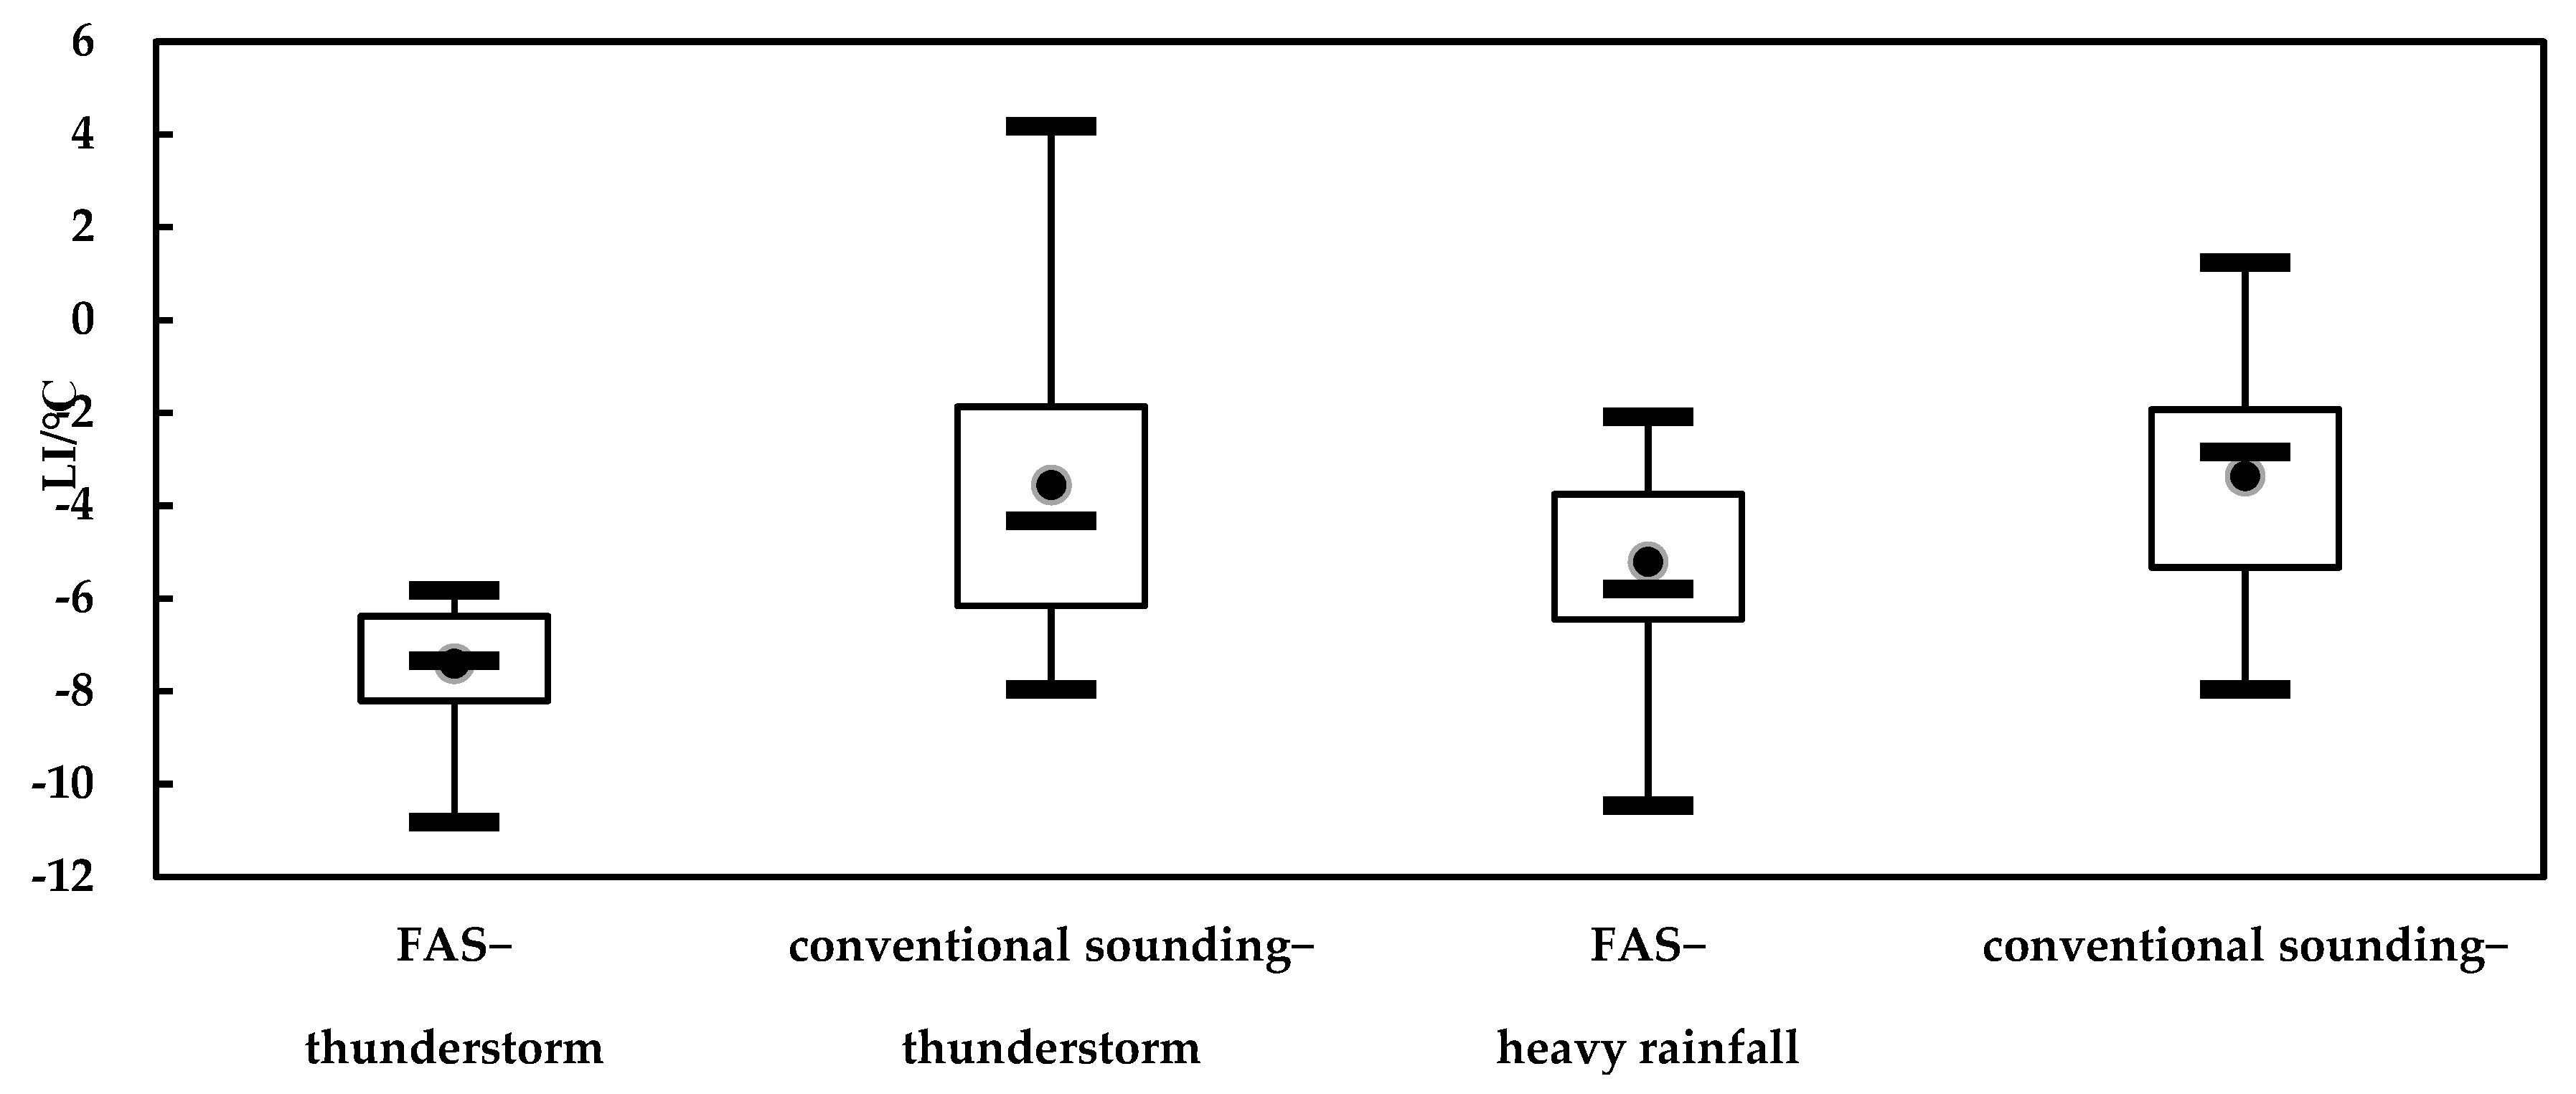
The uplift index LI measures the thermal stability of atmospheric stratification; the larger the negative value, the more unstable it is.
Figure 6 is a box diagram displaying the minimum LI value of FAS every 10 min within 8 h of the occurrence of thunderstorm and short-term heavy precipitation, as well as the range distribution of LI value of conventional sounding at the approaching time. Consistent with the statistical results of CAPE value, the LI value of FAS is lower than that of conventional sounding, and the distribution of the value range is more condensed. This can correctly capture the most unstable moment of thermal power. The greatest LI values in conventional radiosondes are all positive, which influences the convection potential judged according to the thermal stability reflected by radiosondes. The greatest LI values of FAS are all smaller than −2 °C, indicating thermal instability before convection. The LI value of FAS more clearly indicates that thermal instability prior to thunderstorm is greater than that of short-term heavy precipitation, which is mutually verified by the empirical threshold.
4.1.3. Dynamic Instability Index Vertical Wind Shear
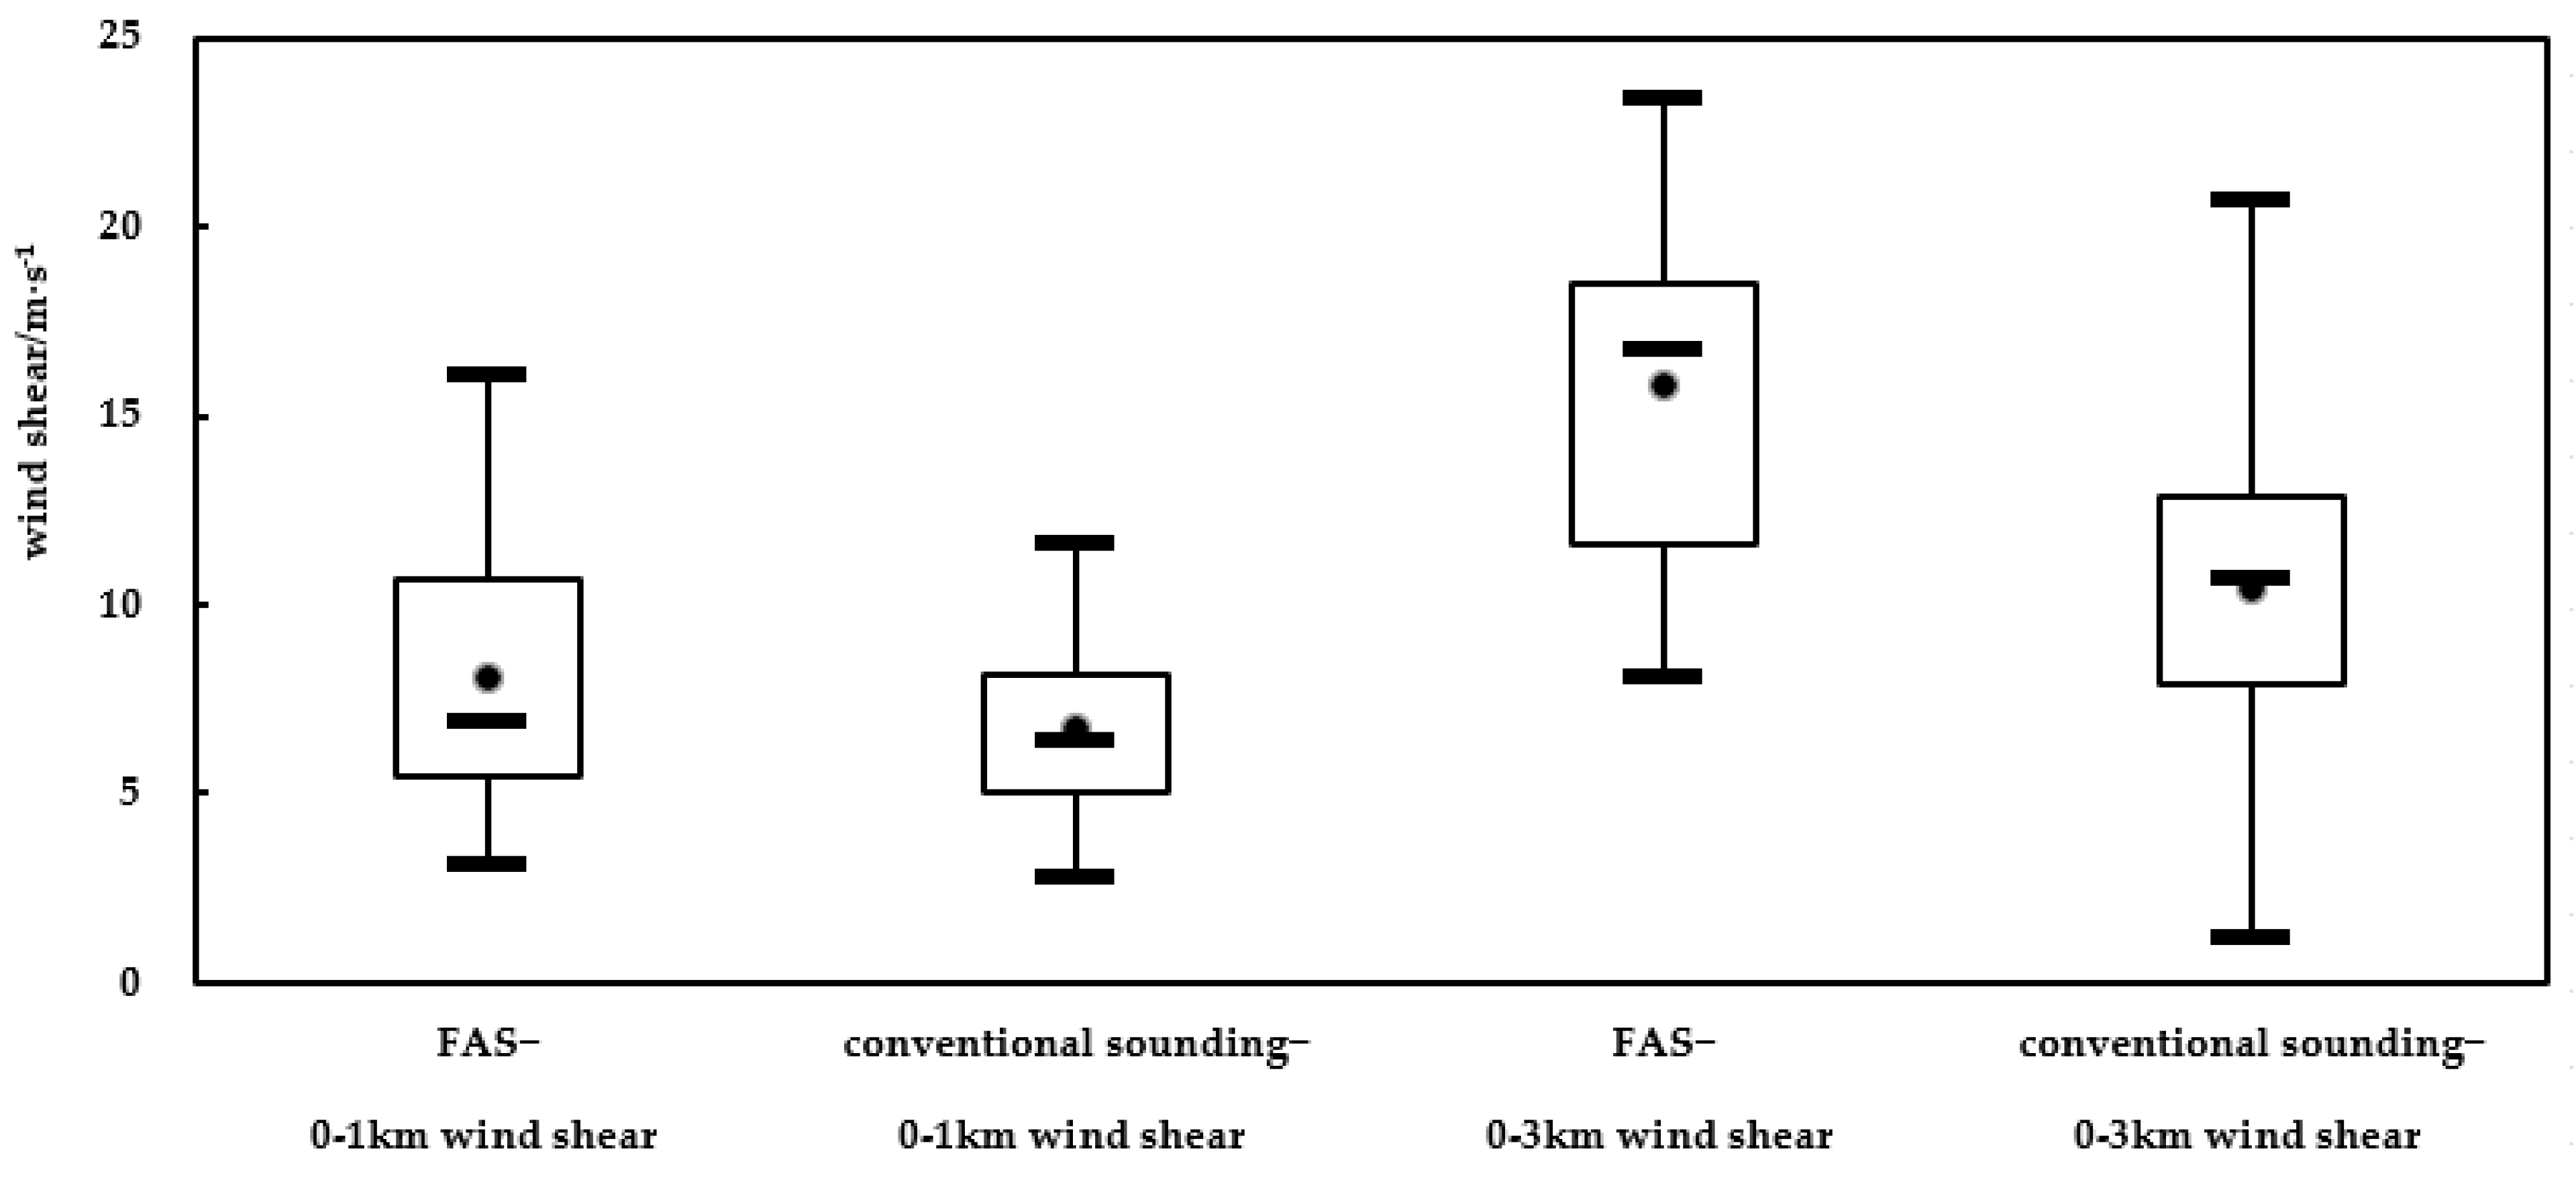
The key to the development and maintenance of convection is dynamic stability. Dynamic instability is especially crucial in the process of severe convection nearing prediction. The amplification of vertical wind shear under particular forms of thermal instability will lead to the subsequent enhancement and development of storms.
Figure 7 is a box diagram displaying the highest vertical wind shear value of FAS at 0–1 km and 0–3 km every 10 min for the 8 h preceding the thunderstorm gale, as well as the range distribution of vertical wind shear value of conventional sounding at the approaching time. Similarly, regardless of the vertical wind shear of 0–1 km or 0–3 km, the FAS inversion value is higher than that of conventional sounding, which objectively indicates the greatest dynamic instability in the convection process. The statistical value is more theoretical than conventional sounding because the value range of FAS in 0–1 km vertical wind shear is 5.44–10.65 m/s while the value range of Fas in 0–3 km vertical wind shear is 11.58–18.51 m/s.
4.1.4. Water-Vapor Generation and Dissipation Index–Atmospheric Precipitable Water
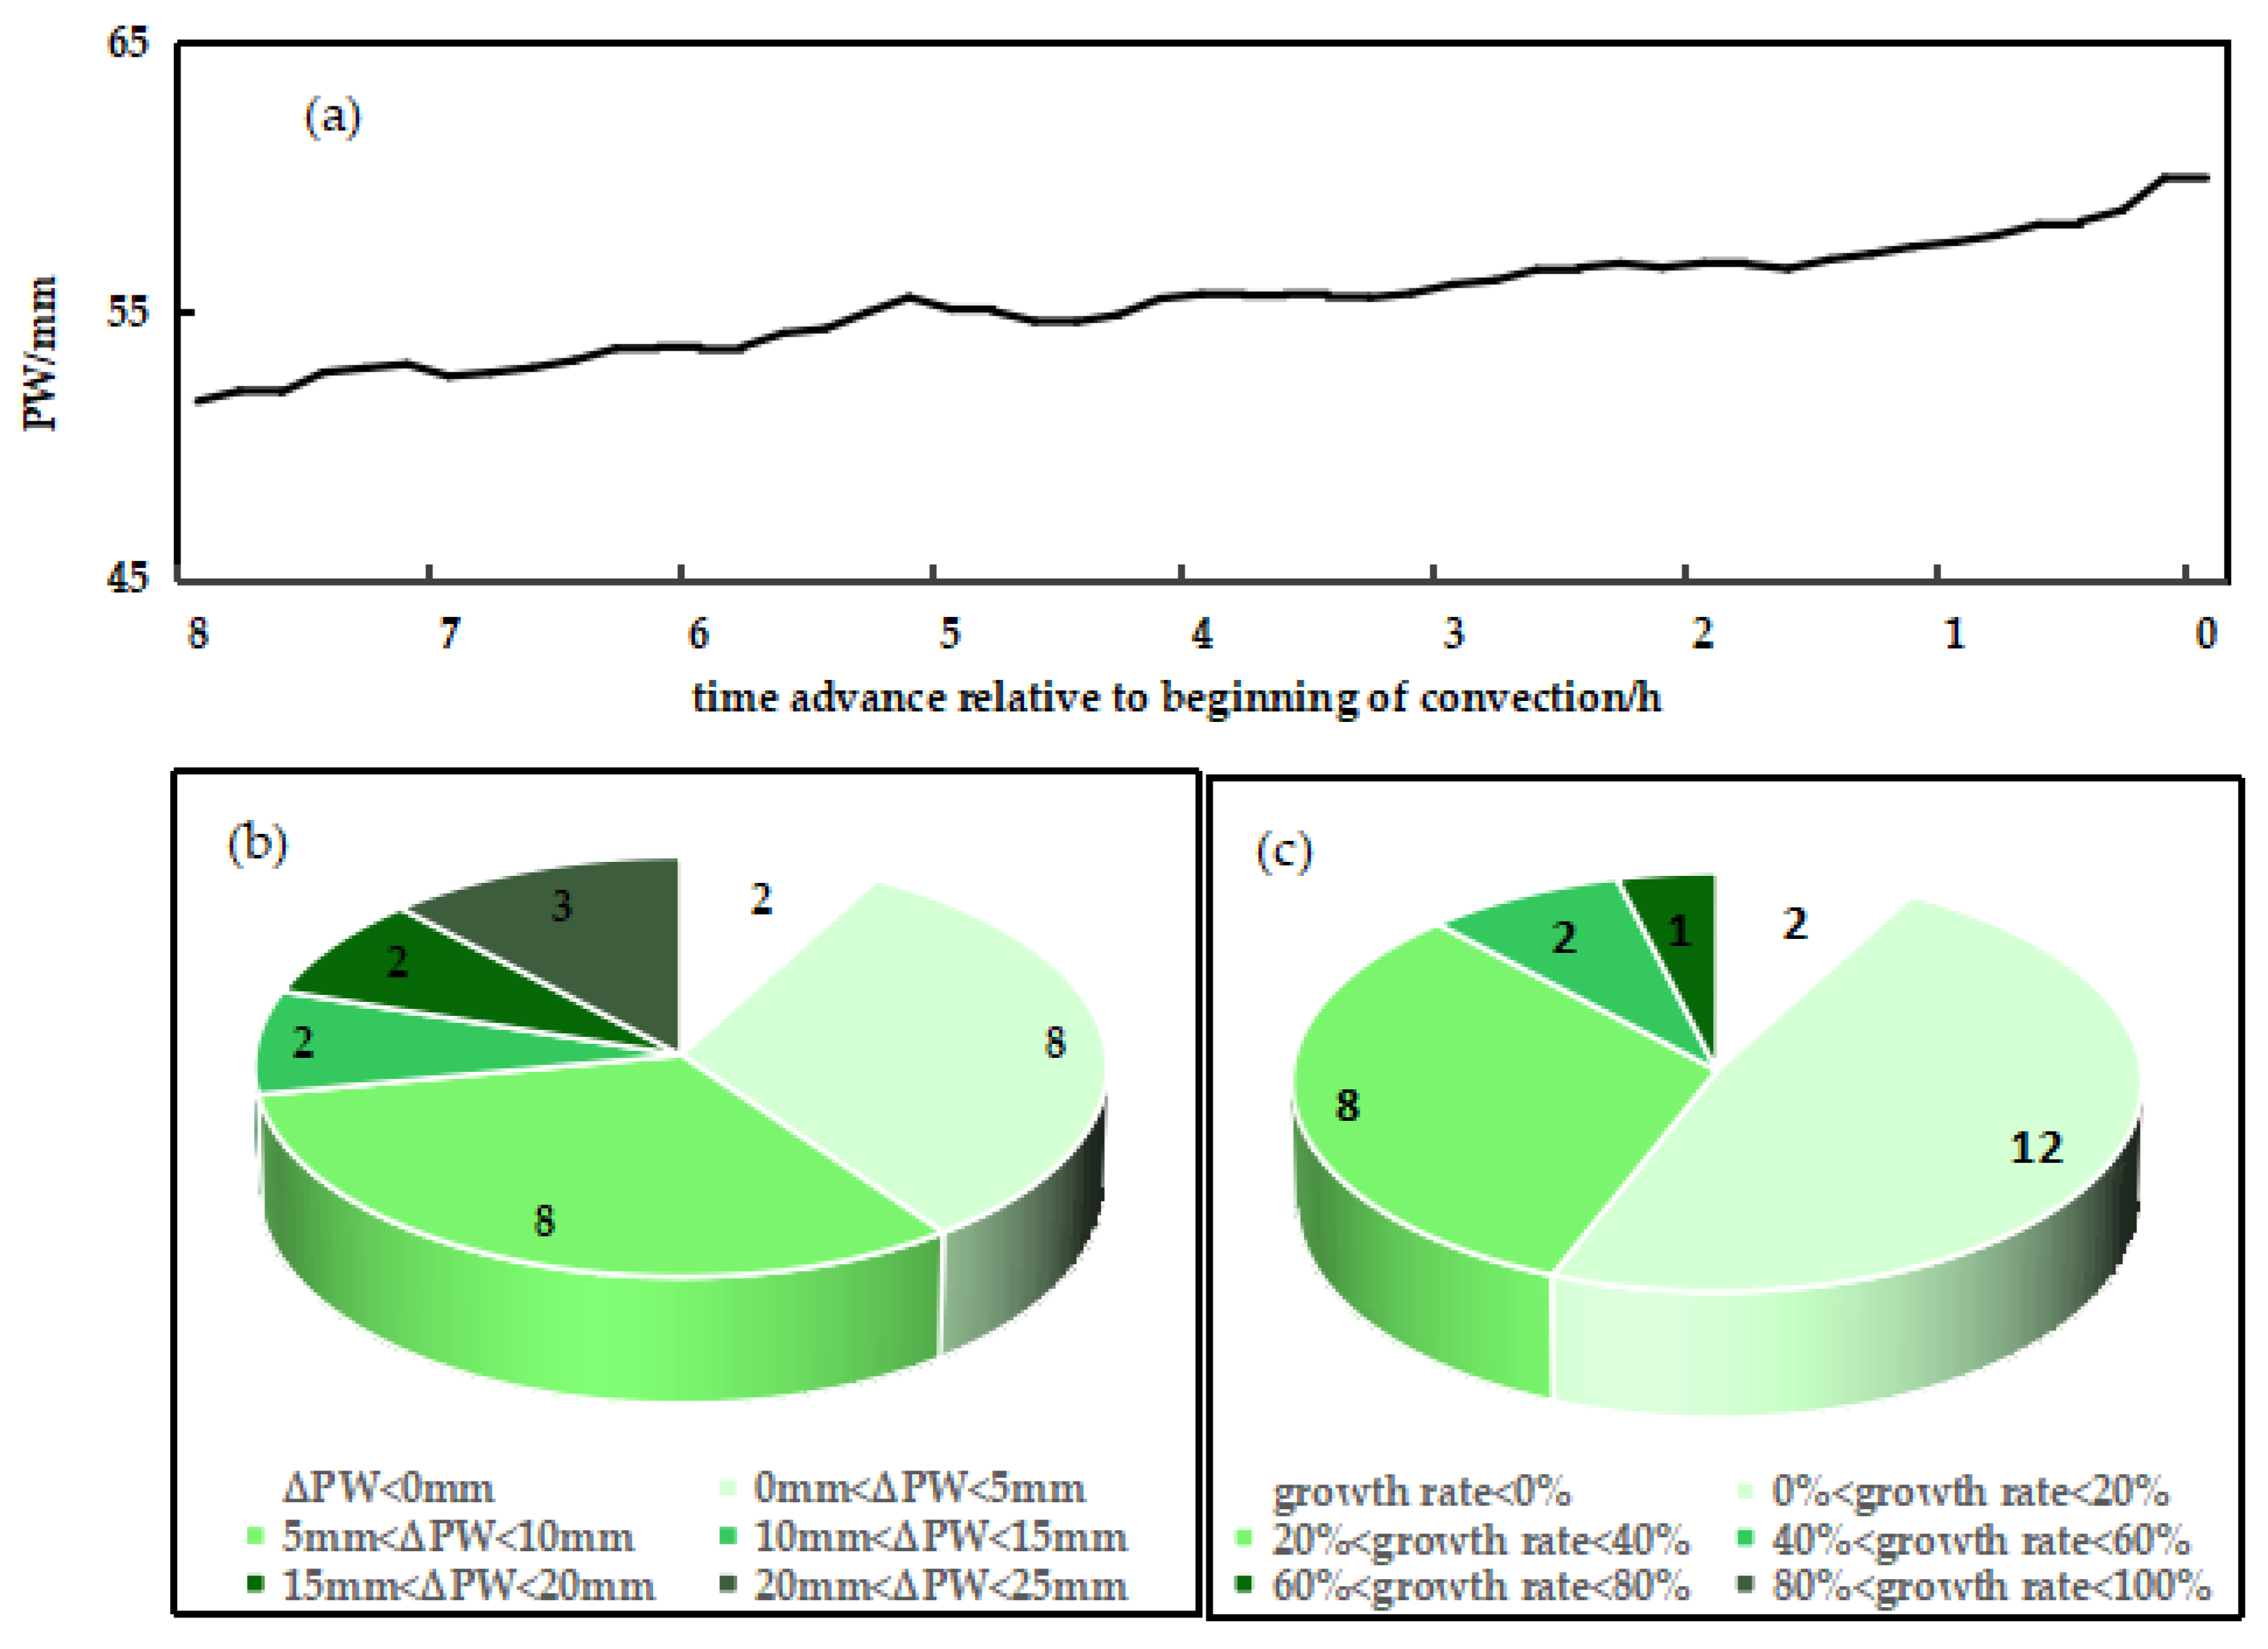
The FAS specific humidity profile can be used to calculate the minute-level atmospheric precipitable water, and the water-vapor growth process reflected by the atmospheric precipitable water can, to some extent, reflect the local water vapor convergence and the establishment process of low-altitude water-vapor channels. The evolution curve of the average atmospheric precipitable water recovered by FAS every 10 min within 8 h before short-term heavy precipitation is shown in
Figure 8a, and displays a variable growth trend with an average rise of 8.34 mm.
Figure 8b,c show pie charts showing the total increase and growth rate of atmospheric precipitable water recovered by FAS prior to the occurrence of short-term heavy rainfall. The numbers on the pie chart in
Figure 8b,c represent the number of samples corresponding to the range. The fraction of total increments is 0–5 mm, 5–10 mm, 48%, 20–40%, and 32%, respectively. According to relevant research, there is a positive correlation between the incremental peak value of the entire layer of precipitable water and the peak value of rainfall intensity, and the minute-level atmospheric precipitable water product retrieved by FAS has some forecasting significance for the occurrence time and precipitation level of short-term heavy precipitation.
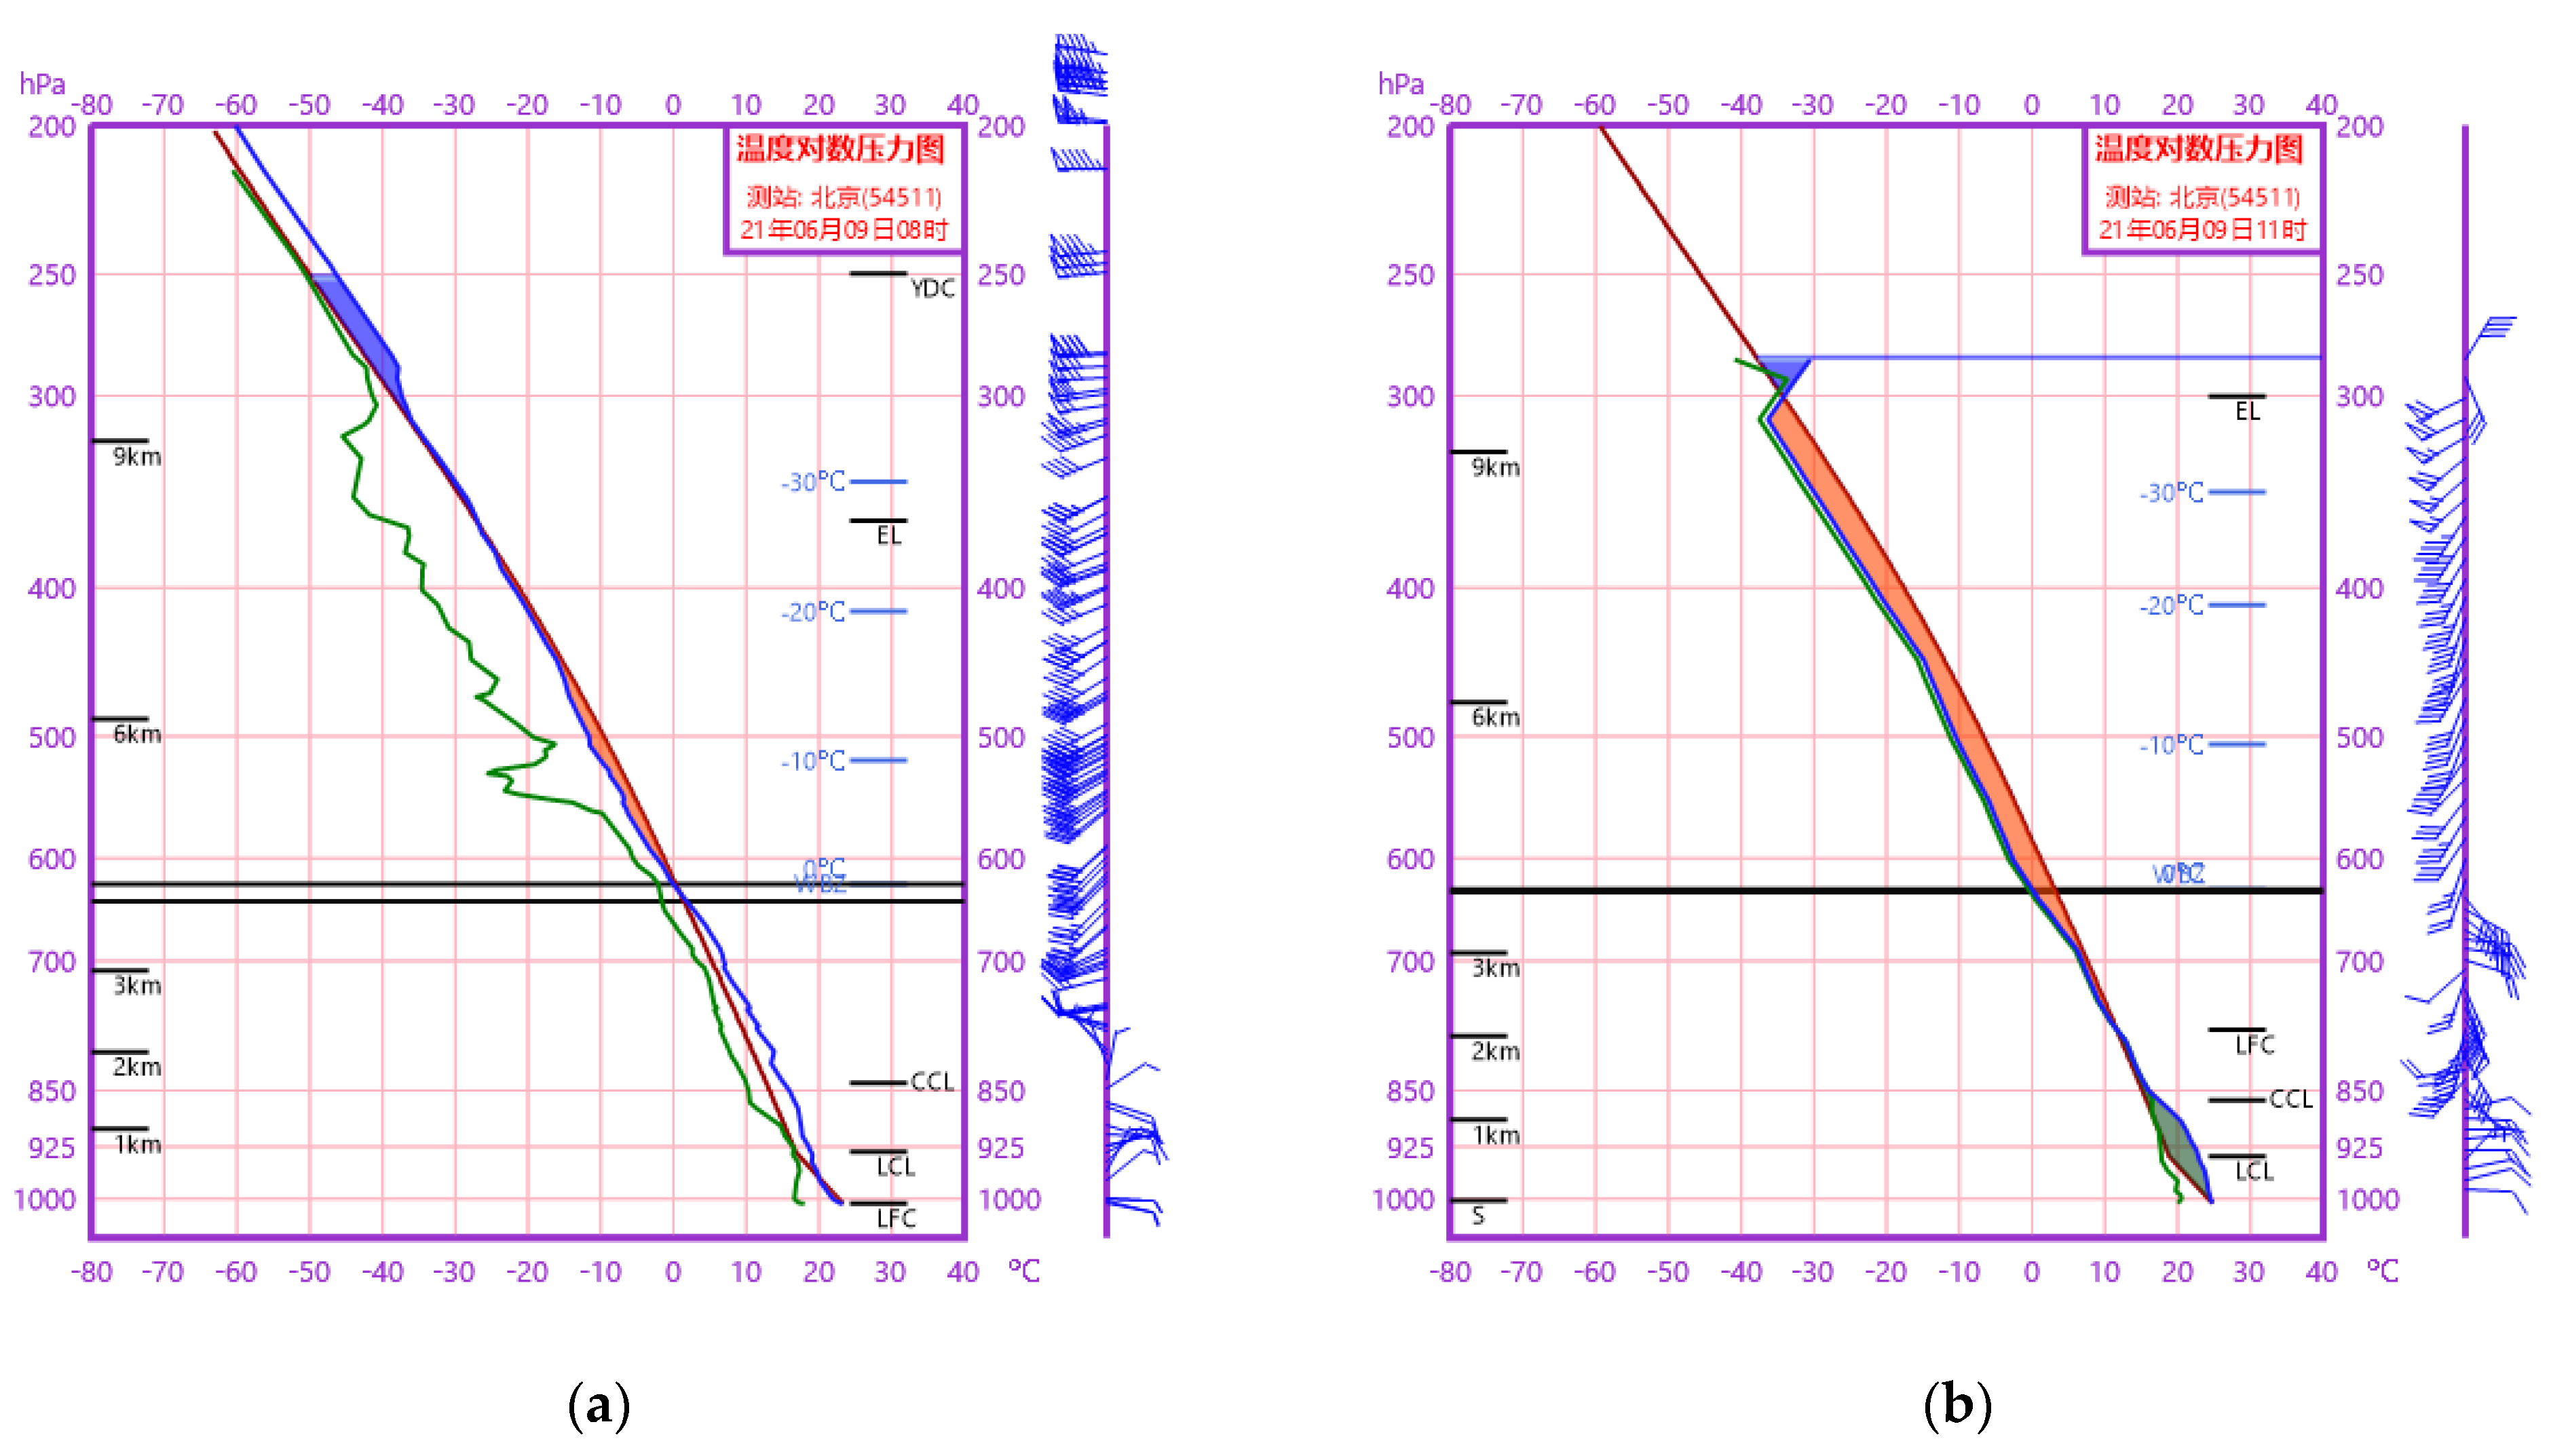
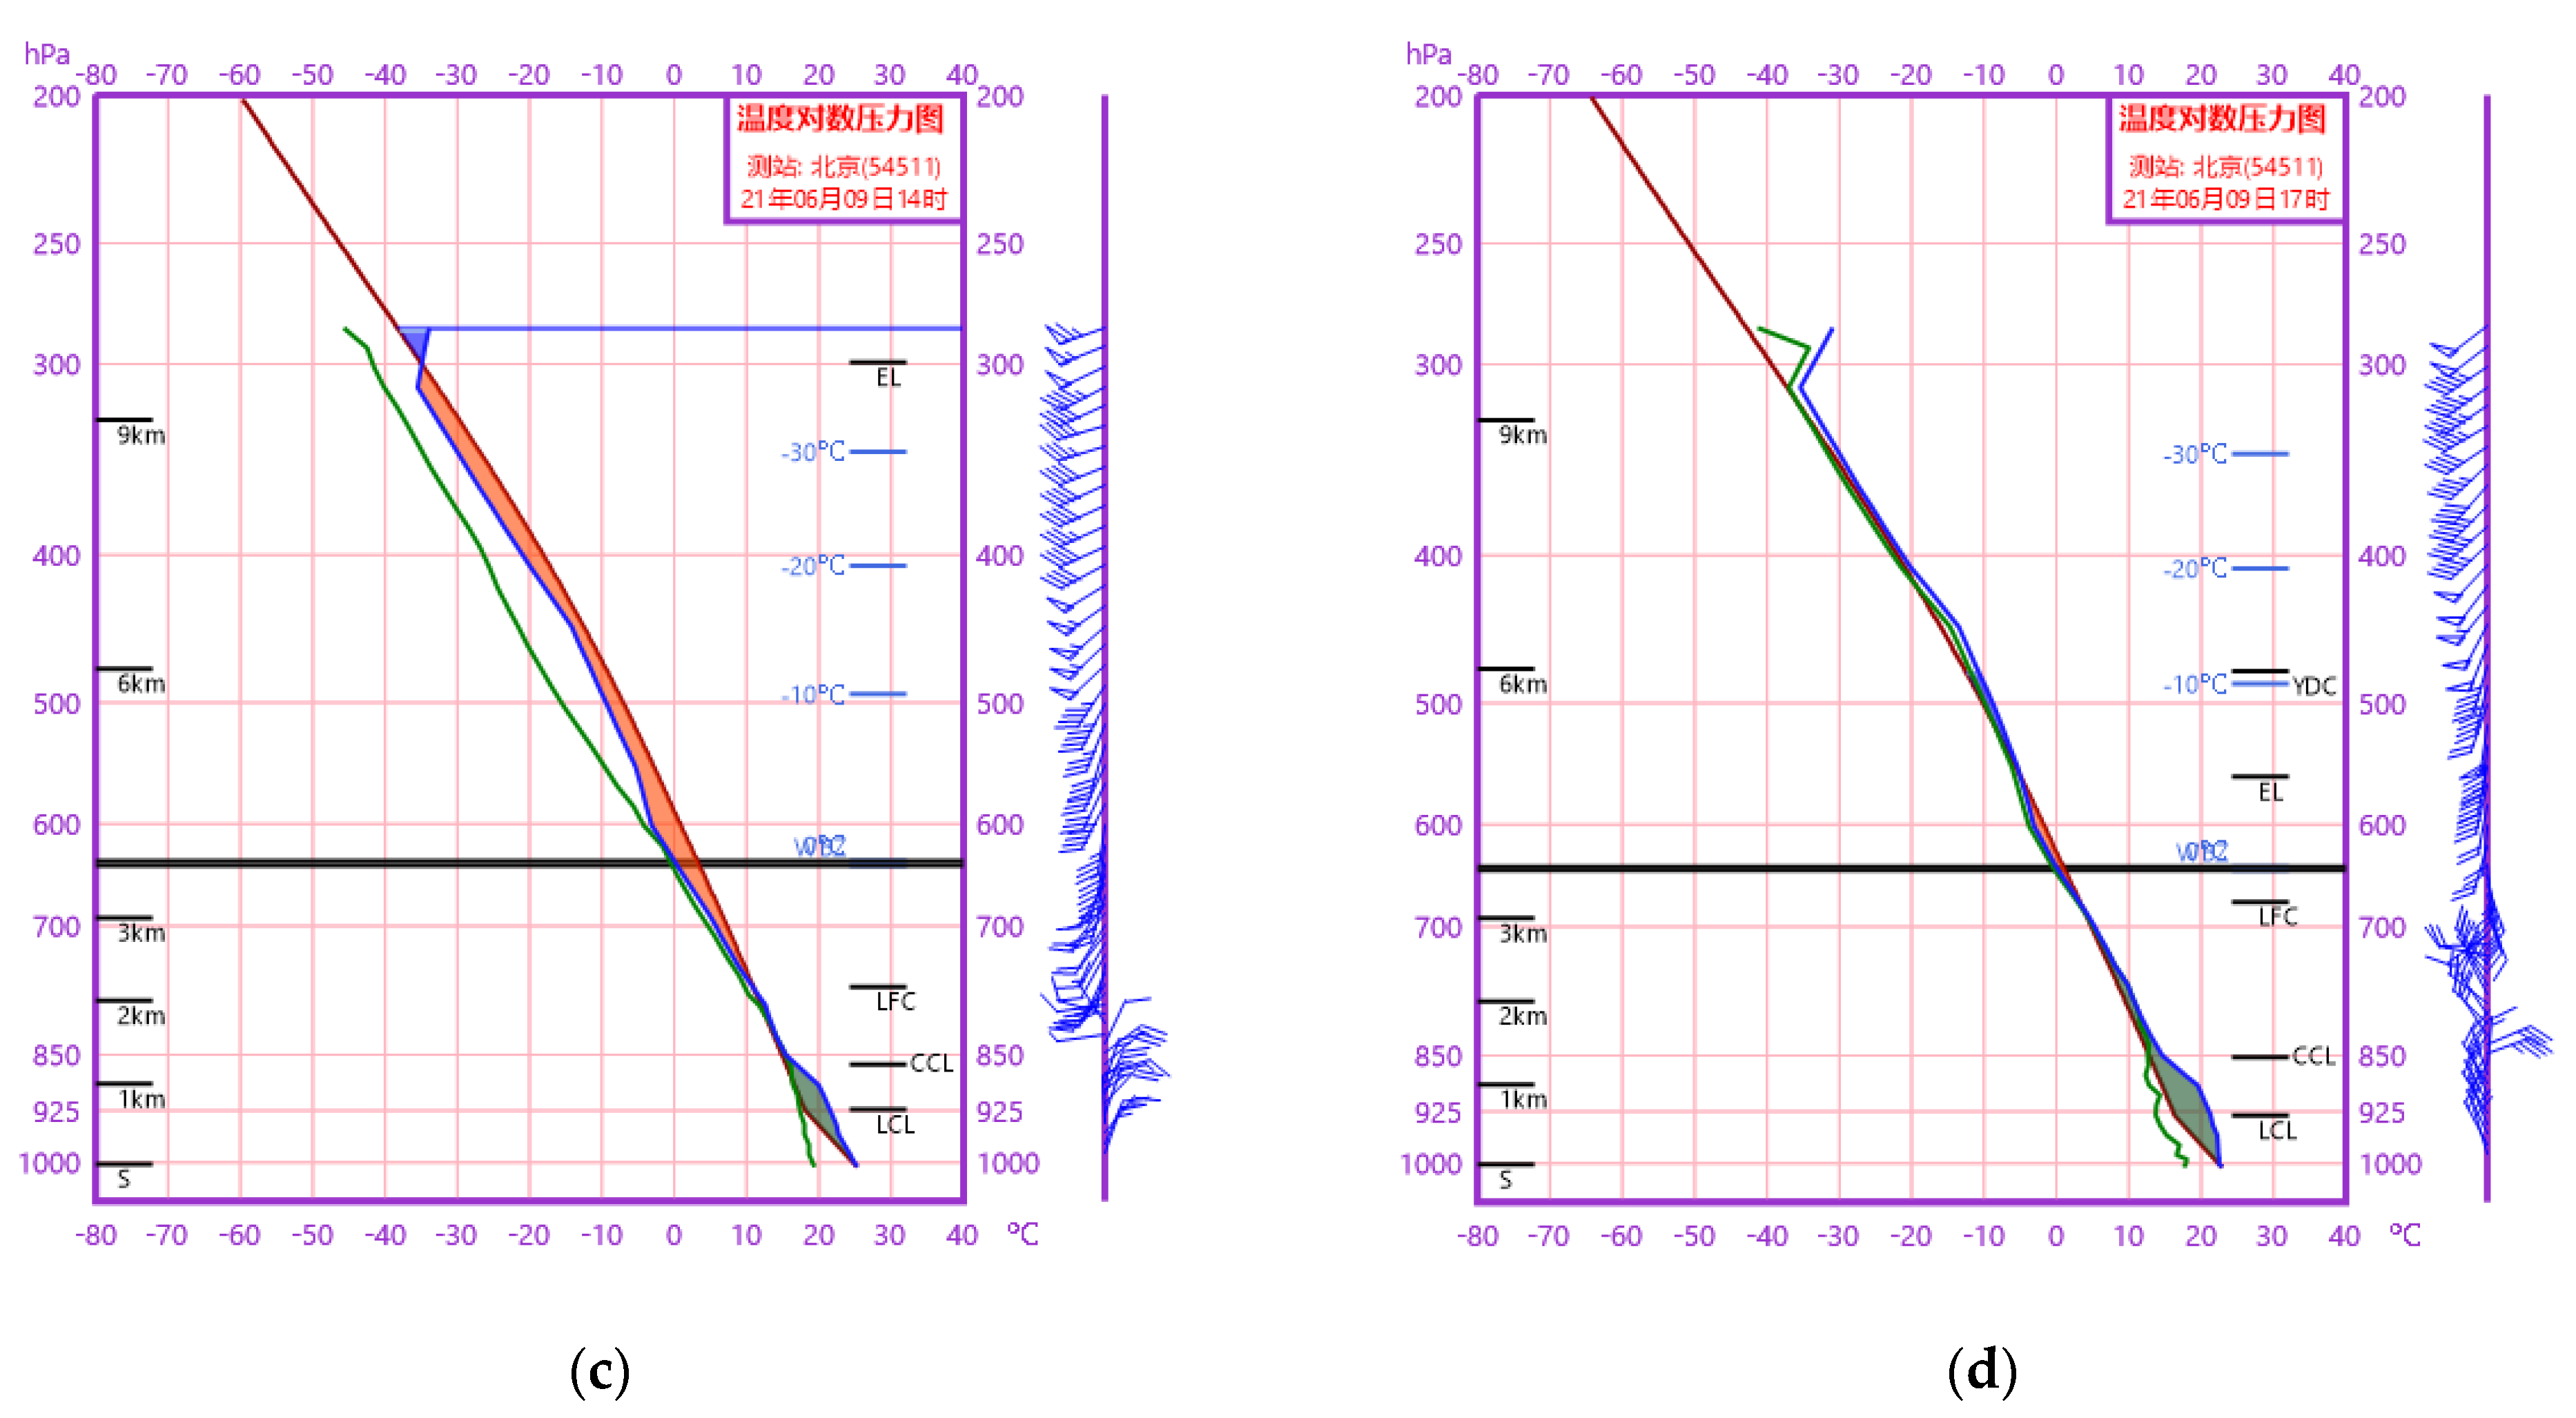
4.2. Short-Term Heavy Precipitation Process on 9 June 2021
On 9 June 2021, the vortex caused a continuous precipitation process in Beijing Plain Area from day to night, and a short-term heavy precipitation process occurred at numerous stations in Beijing’s Tongzhou District from 17:00 to 18:00. The maximum rainfall intensity was 68.3 mm, 34 km away from station 54511.
Figure 9a is a radiosonde map of Beijing at 8:00 a.m. The precipitation-affected CAPE value is 194 J/kg, indicating that there is no clear convection potential and that the rise in weather scale is difficult to use as the trigger mechanism of intense convection. The southwest airflow in front of the middle–lower trough and the easterly airflow in the boundary layer constantly supplement water vapor and energy to the plain area, whereas the unfavorable condition is that the continuous ground-temperature increase is low due to precipitation. Convective characteristics with a high time resolution are a crucial basis for estimating convection potential in short-term and immediate forecasting; however, conventional radiosondes’ limited observation frequency cannot match the observation needs of constantly changing convective parameters.
With a high time resolution, FAS can indicate the alterations in environmental parameters.
Figure 9b–d presents FAS diagrams at 11:00, 14:00, and 17:00, respectively, with corresponding CAPE values of 920.4 J/kg, 703.4 J/kg, and 48.8 J/kg. The inversion data can quantify the process of CAPE’s rapid accumulation, maintenance, and release. The comparison between the Beijing radiosonde at 08:00 and the FAS at 11:00 is presented in
Table 1. The highly effective convective parameters not only describe the increase in CAPE value, but also indicate that convective parameters such as k-index (K), Showalter index (SI), and integral of specific humidity for the whole layer (IQ) develop in varying degrees toward a trend of greater convection potential. The rapid growth in IQ is a result of the transport of local water vapor, which supplies sufficient water vapor sources for the occurrence of short-term heavy precipitation. At 11:00 and 14:00 UTC, the FAS has the characteristics of a high dew point in the lower layer, a high relative humidity throughout the entire layer, a close but slightly higher than the wet adiabatic direct reduction rate, and a long and narrow CAPE, and the sounding environment it depicts is typical of short-term heavy rainfall.
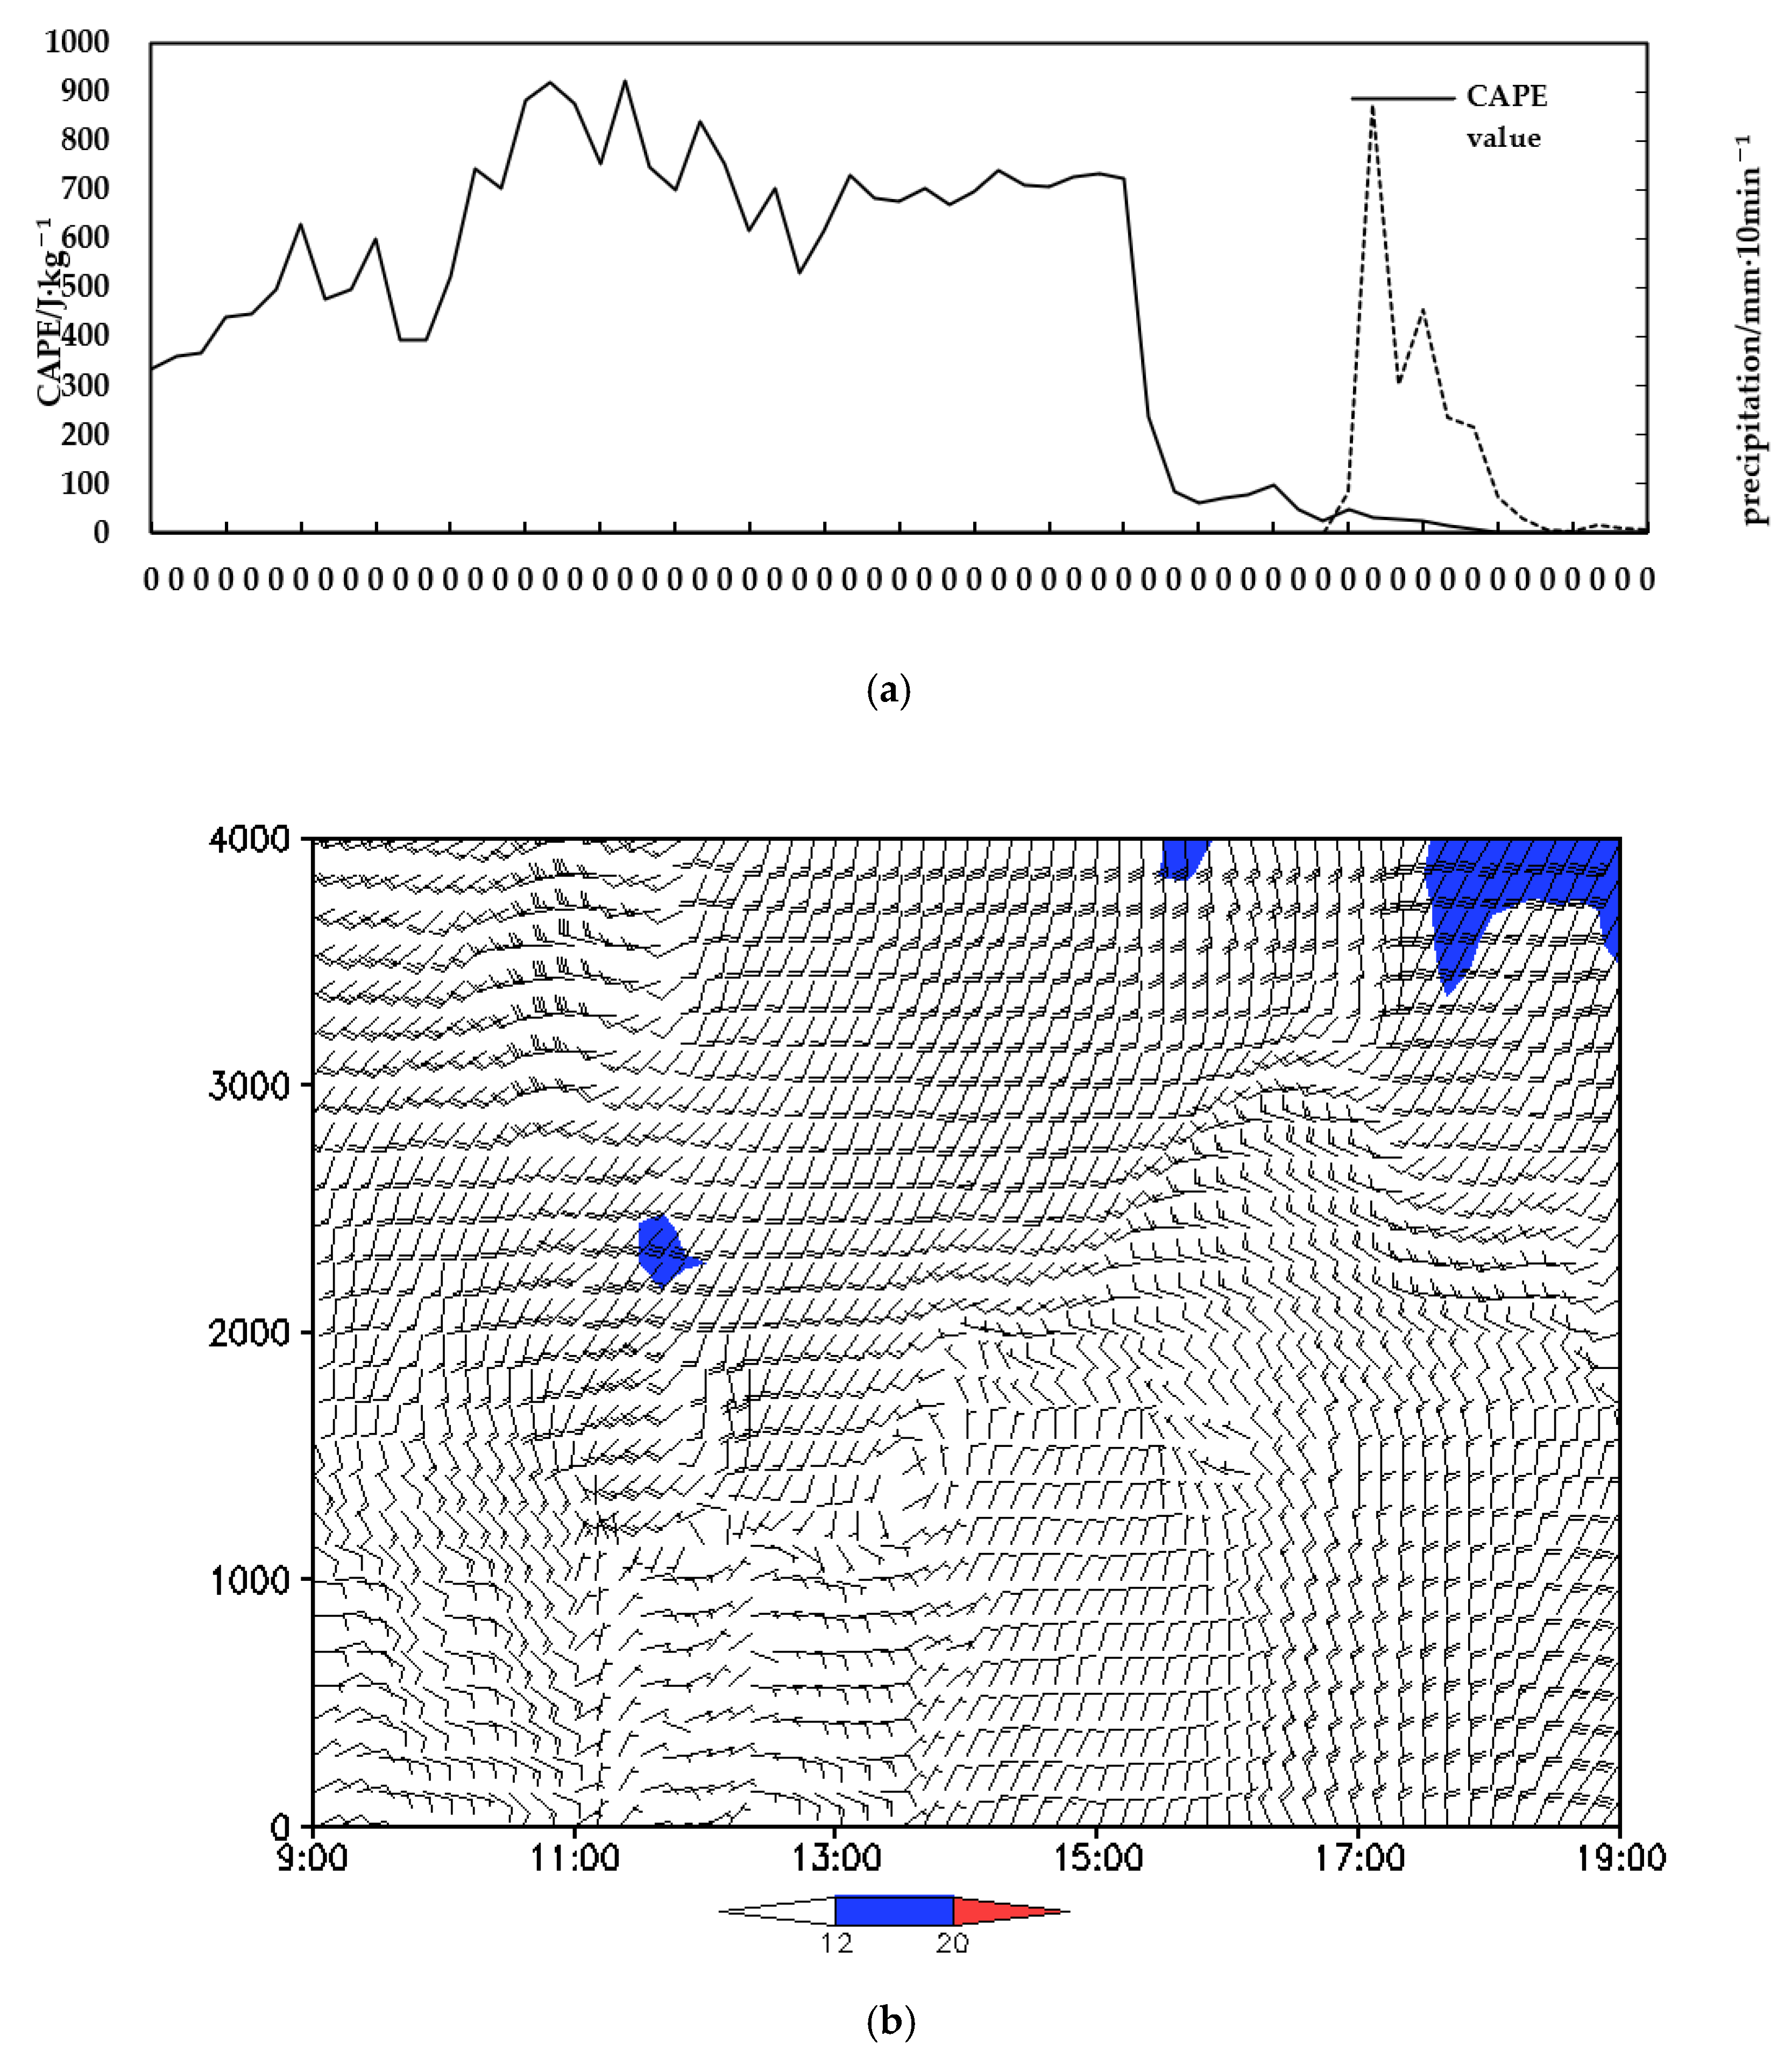
Before strong convection, FAS is used to evaluate the relationship between the dynamic field and the ambient field.
Figure 10a depicts the CAPE value calculated using FAS at station 54511 from 9:00 to 19:00, as well as the time–height profile of the horizontal wind field (WPR-HW technique) obtained from the station 54511 from 9:00 to 19:00. The energy rose and the CAPE value increased by more than 600 J/kg between 9:00 and 11:30. The addition of humidity in the lower layer is more favourable to the CAPE value than temperature growth under the action of the southwest wind in the middle and lower layers and the southeast wind from the east to the southeast of the boundary layer. The energy maintenance stage lasts from 11:30 to 15:30, with the CAPE value ranging between 600 and 900 J/kg. Although there is little cold air disturbance during this period, the rising motion generated by the convergence of a weak wind field creates an energy value fluctuation. Because the easterly boundary layer wind overlaps the southwest wind in the intermediate and lower layers, the high-humidity and high-energy conditions are maintained by a constant supplement of warm and humid airflow. The energy-release stage lasts from 15:30 to 17:00, and a meso-scale cold air mass is jammed around 15:30. Under the action of power transmission, the invading northwest wind constantly penetrates lower and produces convergence with the southwest and easterly winds, respectively, becoming the trigger mechanism for unstable energy. The quick release of energy causes a rapid fall in CAPE value, which changes from 722.3 J/kg to 61.9 J/kg in the period from 15:30 to 16:00. The discharge of unstable energy signals a strong upward trend at the small and medium scales. A short-term heavy-precipitation process occurred at numerous stations around station 54511 at 17:00 due to environmental factors such as good humidity conditions in the middle and lower layers of the whole layer and deep warm clouds.
Figure 10a shows that when the CAPE value rapidly decreased, the intensity of the downpour rapidly increased, and the time interval between energy release and heavy weather based on FAS was 1 h 30 min, which was a forecast and early warning advance.
The case of severe weather demonstrates that FAS can accurately reflect the changing trend of thermodynamically related physical quantities in real-time, and has a favorable convective potential paired with the quick release of CAPE, which can predict the occurrence of severe weather. Subjective severe weather classification results have been shown to be in good accordance with weather occurrences. At the same time, FAS can represent the interaction between environmental temperature and humidity conditions and the dynamic field, which is not only the process of energy generation and maintenance, but also the trigger mechanism of instability, and the release of energy further influences the dynamic field.


 ,
, 


