Article

Dry Deposition of Hydrophilic Black Carbon Aerosols in China

1
China Meteorological Administration Aerosol-Cloud and Precipitation Key Laboratory, School of Atmospheric Physics, Nanjing University of Information Science and Technology, Nanjing 210044, China
2
Key Laboratory of Meteorological Disaster, Ministry of Education (KLME), Nanjing University of Information Science and Technology, Nanjing 210044, China
3
State Key Laboratory of Atmospheric Boundary Layer Physics and Atmospheric Chemistry, Institute of Atmospheric Physics, Chinese Academy of Sciences, Beijing 100029, China
4
Department of Earth and Environmental Sciences, The University of Manchester, Manchester M13 9PL, UK
*
Author to whom correspondence should be addressed.
Atmosphere 2023, 14(7), 1114; https://doi.org/10.3390/atmos14071114
Submission received: 4 June 2023 / Revised: 1 July 2023 / Accepted: 3 July 2023 / Published: 5 July 2023

Abstract

:
Atmospheric dry deposition of black carbon (BC) is a significant but poorly understood and inadequately described process in aerosol-climate models. The 40-year detailed dry deposition velocities of hydrophilic BC over China from 1981 to 2020 were systematically studied based on the MERRA-2 reanalysis data, which hopefully will be beneficial for its applications in atmospheric systems for climate and air quality. The average dry deposition flux of hydrophilic BC over China was 0.00059 ± 0.00014 μg m−2 s−1, while its dry deposition velocity was estimated to be 0.00051 ± 0.00004 m s−1. The monthly mean dry deposition fluxes of hydrophilic BC varied nearly 1.5 fold, ranging from the lowest 0.00046 ± 0.00011 μg m−2 s−1 in August to the highest 0.00068 ± 0.00019 μg m−2 s−1 in January. The spring season had the highest mean dry deposition flux of hydrophilic BC, followed by summer and winter, whereas autumn showed relatively weaker dry deposition flux. The mean dry deposition velocities of hydrophilic BC over the Beijing-Tianjin-Hebei region, Yangtze River Delta, Pearl River Delta and Tibet Plateau were estimated to be 0.00042 ± 0.00004, 0.00042 ± 0.00004, 0.00051 ± 0.00006 and 0.00078 ± 0.00005 m s−1, respectively. The monthly and seasonal patterns of dry deposition velocities of hydrophilic BC differed from each other in different regions, and high air temperature or surface wind speed seemed to fortify dry deposition velocities of hydrophilic BC. Our study pointed to high dry deposition flux of hydrophilic BC in the northern China Plain and Sichuan Basin but large dry deposition velocities in the Tibet Plateau region.

1. Introduction

Aerosol dry deposition is a significant sink for atmospheric particles that are a health hazard and a significant climate forcer [1]. Aerosols can affect global and regional climate changes through directly scattering and absorption of radiation, e.g., [2,3]. Meanwhile, aerosols can modify cloud properties by acting as cloud condensation nuclei, and thus the precipitation may be altered, e.g., [4]. Black carbon (BC) aerosols with the major sources of combustion of biofuel and fossil fuels, wildfires and biomass burning, e.g., [5], strongly absorbs solar radiation, perturbing atmospheric temperature gradients, e.g., [6]. Freshly emitted BC particles are mostly bare BC monomers with chain-like structures and hydrophobic, whereas they are quickly coated by secondary aerosol species in the aging process and then become hydrophilic [7].
The source and sink of BC aerosols balance their loading in the atmosphere, and BC lifetimes in the air are determined by dry and wet depositions [8,9]. Wet deposition scavenges particles by precipitation in below-cloud processes or removes aerosols by cloud droplets and ice crystals during in-cloud processes [10]. Nevertheless, dry deposition is a direct removal of ambient aerosol particles to surfaces through gravitational settling, diffusion, impaction and interception [11]. Particle losses due to wet deposition are estimated to account for a majority of submicron aerosol removal from ambient air, and more than 80% BC mass loss from ambient air is associated with wet deposition based on measurement and model studies, e.g., [12]. Nonetheless, dry deposition is still a globally significant first-order particle loss process that is critical to estimate exact spatial–temporal distributions of aerosols in models [13,14], and the removal rate of BC by wet deposition is one of the most uncertain research aspects in modeling cloud condensation nuclei, e.g., [15,16].
The dry and wet depositions of BC are not only BC removal pathways, but also are among the key processes linking the atmosphere and underlying surface [17]. It is estimated that the dry and wet depositions of BC into global oceans account for 2 Tg yr−1 and 10 Tg yr−1, respectively [18]. Wang et al. [19] estimate that annual average dry deposition flux of atmospheric BC into the East China Sea is 107 μg m−2 d−1. Precipitation shows effects on BC deposition, and wet deposition of BC is efficient if precipitation lasts for more than one day [20]. However, BC deposition is mainly contributed by dry deposition rather than wet deposition in areas with less precipitation, and the reverse is true in regions with more rain [21]. The low BC dry deposition flux is seen in southern areas of China with high precipitation, whereas BC dry deposition is relatively high in northern China with small amounts of rainfall [22]. Direct measurements of black carbon with a single-particle soot photometer (SP2) and eddy covariance over grasslands in the USA suggest a BC dry deposition velocity of 0.3 mm/s on average [8].
The BC dry deposition is a function of turbulence, and more turbulent atmospheric conditions can induce stronger dry deposition flux [23,24,25]. Meanwhile, land use type can also influence BC dry deposition, while more complicated ecosystems with greater surface area can hold more collectors and enable more deposition through interception [26]. For example, deposition velocities of atmospheric compositions over forests may be typically higher than those over grasslands, which are in turn higher than those over lakes or smooth aquatic surfaces [26]. While maintaining the ability of the model to be assimilated easily into regional and global transport and climate models, the main challenge in modeling aerosol concentrations is to predict deposition trends over a wide range of land use types [26]. The models typically employ an aerosol deposition module with a particle size-dependent resistance approach tailored for terrestrial surfaces [27]. For instance, Zhang et al. [28] incorporated simple empirical parameterizations for dry deposition processes and expanded the application of the resistance approach to 14 different land use types; their approach is currently employed in multiple chemical transport and climate models (such as GEOS-Chem). However, robust parameterizations that agree well with available direct measurements of depositions are obviously needed in regional and global models, and the framework should be constrained enough to be easily incorporated into a broad array of chemical models and deposition modules. Although some studies have investigated BC dry deposition, detailed and long-term variation characteristics of BC dry deposition over China, especially in typical regions, are still missing, limiting their application in aerosol-climate models.
Here, spatial and temporal characteristics of dry deposition fluxes of hydrophilic BC over China during the period of 1981–2020 based on the MERRA-2 reanalysis data were systematically studied. The dry deposition velocity of hydrophilic BC was also estimated, and the impacts of meteorological factors on BC dry deposition were also explored. The paper is organized as follows. In Section 2, the MERRA-2 data for dry deposition fluxes are introduced. In Section 3, the 40-year detailed characteristics of dry deposition fluxes of hydrophilic BC and its estimated dry deposition velocities over China and influence factors are discussed. The main conclusions are summarized in Section 4.

2. Methodology

The dry deposition flux of hydrophilic BC aerosols in our study is based on the version 2 of the Modern-Era Retrospective Analysis for Research and Applications (MERRA-2) reanalysis dataset. The MERRA-2 reanalysis dataset is produced by the Goddard Earth Observing System Model, Version 5 (GEOS-5) [29] and data assimilation system [30], and the three-dimension variational data analysis (3DVAR) Gridpoint Statistical Interpolation (GSI) meteorological analysis scheme [31]. The GSI uses an incremental analysis update procedure every 6 h, and the discretization of the dynamical core is calculated based on a cubed sphere grid that mitigates grid-spacing singularities [32]. The MERRA-2 meteorological, radiation, ozone and cryospheric fields have been validated [29]. The MEERA-2 jointly assimilates meteorology and aerosol observations for aiming at integrated Earth system analyses, and it is the first dataset to include the aerosol fields coupled to the atmosphere radiatively [33].
Aerosols in the MERRA-2 are simulated using a radiatively coupled version of the Goddard chemistry, aerosol, radiation, and transport (GOCART) model [34]. The MERRA-2 considers the GOCART model to simulate the sources, sinks, and chemistry of mixed aerosol tracers, such as hydrophobic and hydrophilic BC [35]. Differing from hydrophobic BC, hydrophilic BC particles can act as cloud condensation nuclei and undergo nucleation scavenging, leading to more effective wet removal, e.g., [36]. Freshly emitted BC aerosols are generally hydrophobic, and they can then be converted to hydrophilic BC soon during the aging process in the atmosphere [37]. Particularly in remote regions or at high altitudes (like Tibet), most BC particles are aged, coated and potentially hydrophilic [35]. At present, the MERRA-2 is the most significant long-term global reanalysis, representing the interactions of aerosols with other physical processes in the climate system [38]. A spatial resolution of 0.5° × 0.625° and 72 vertical model levels from 1000 hPa to 0.1 hPa are provided in the MERRA-2 dataset, and it supplies 1-hourly, 3-hourly, and monthly products [39]. The results of dry deposition in this study are statistically expressed with mean values, and their uncertainties are described by the statistical standard deviations.

3. Results and Discussion

3.1. Dry Deposition Fluxes of Hydrophilic Black Carbon over China

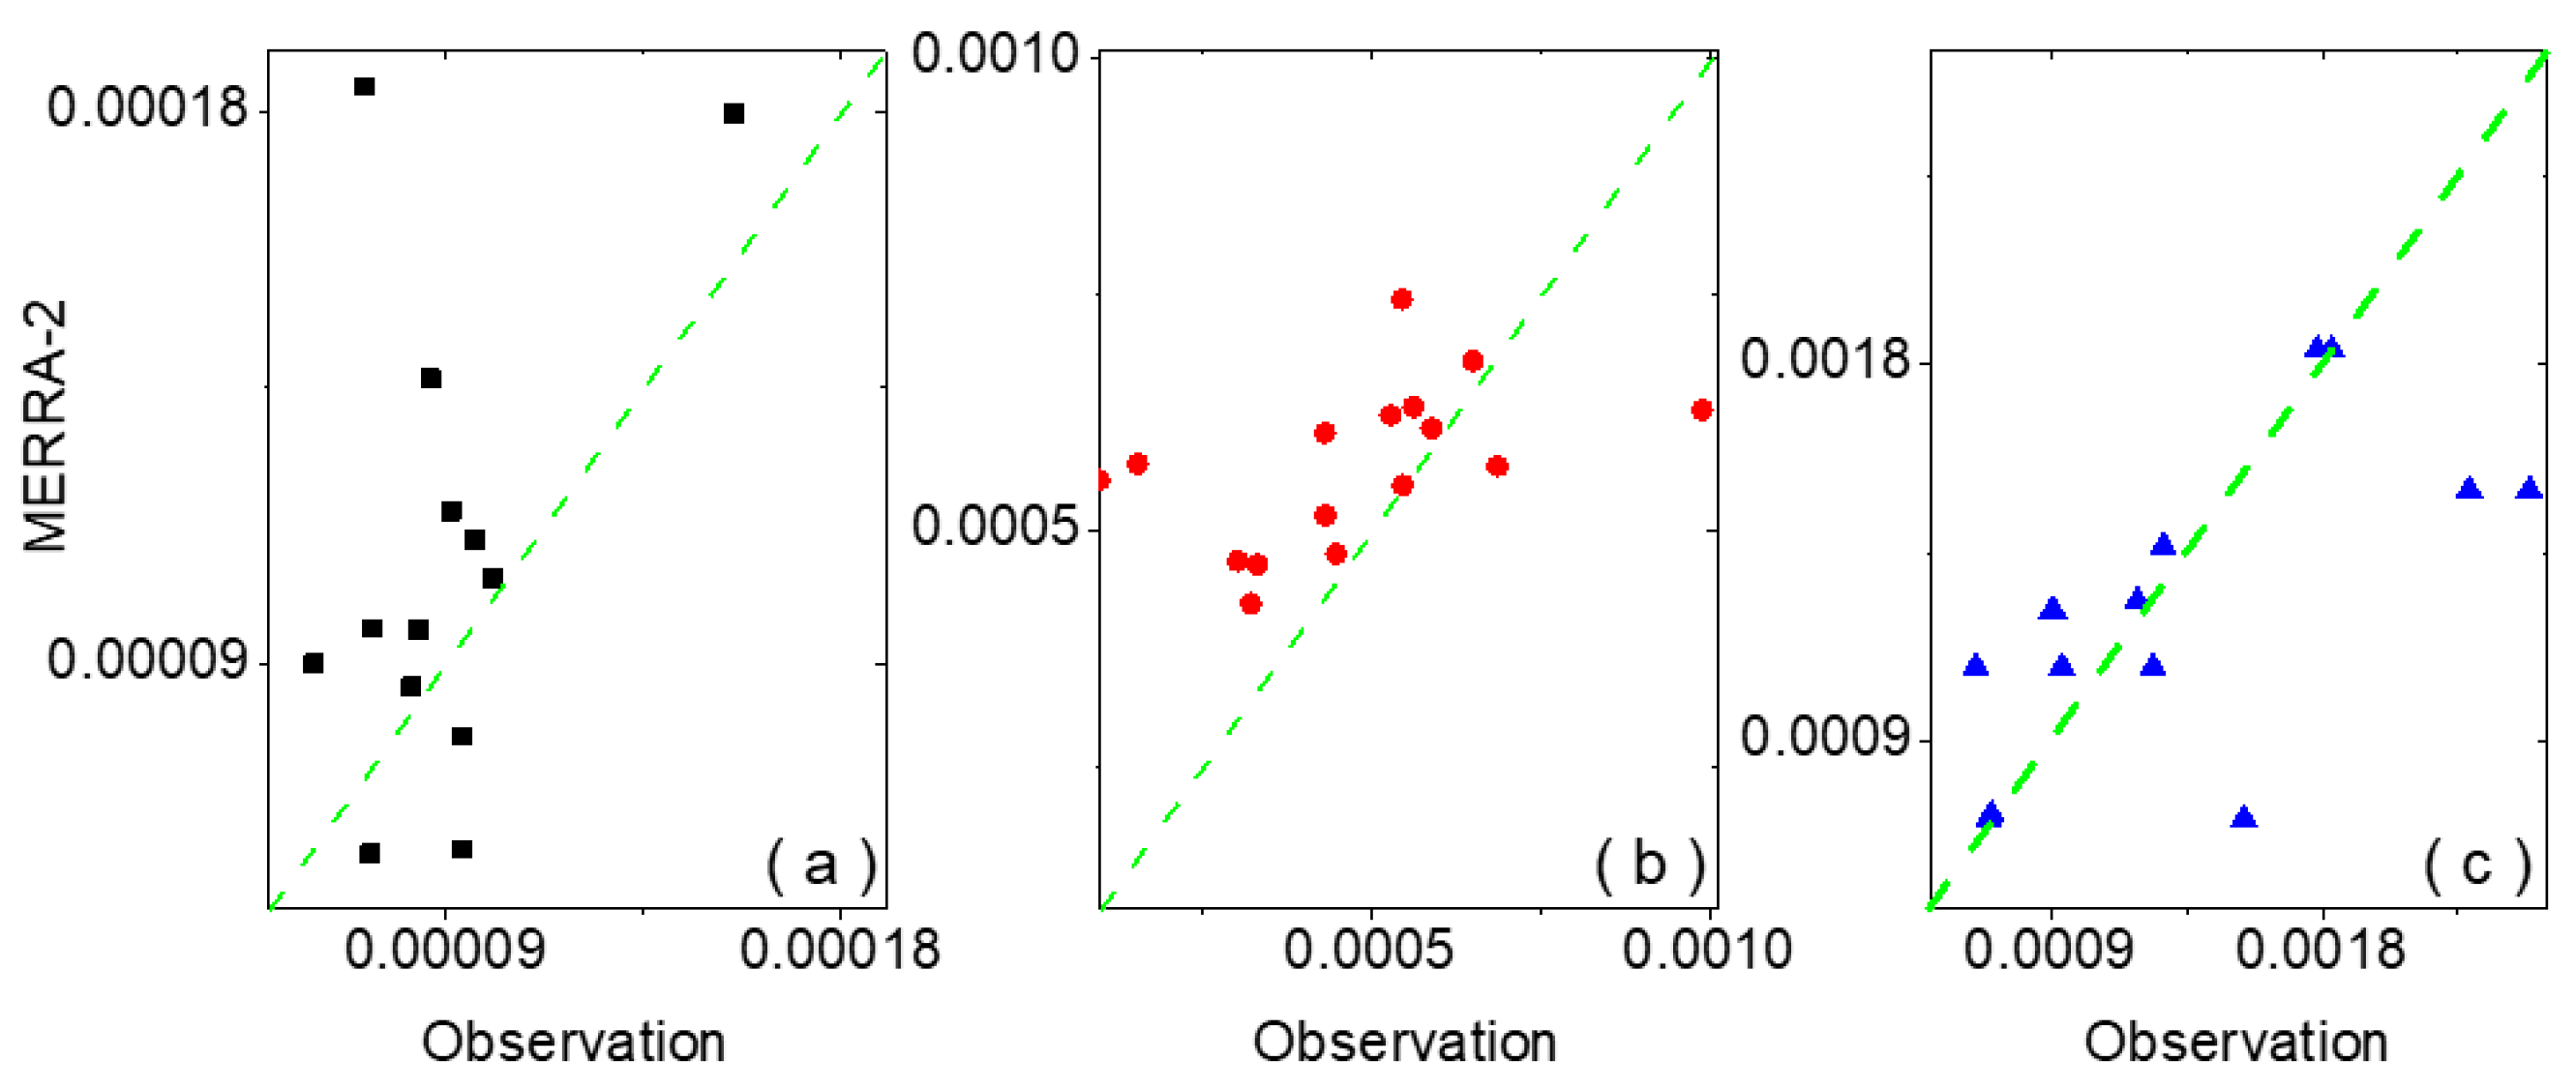
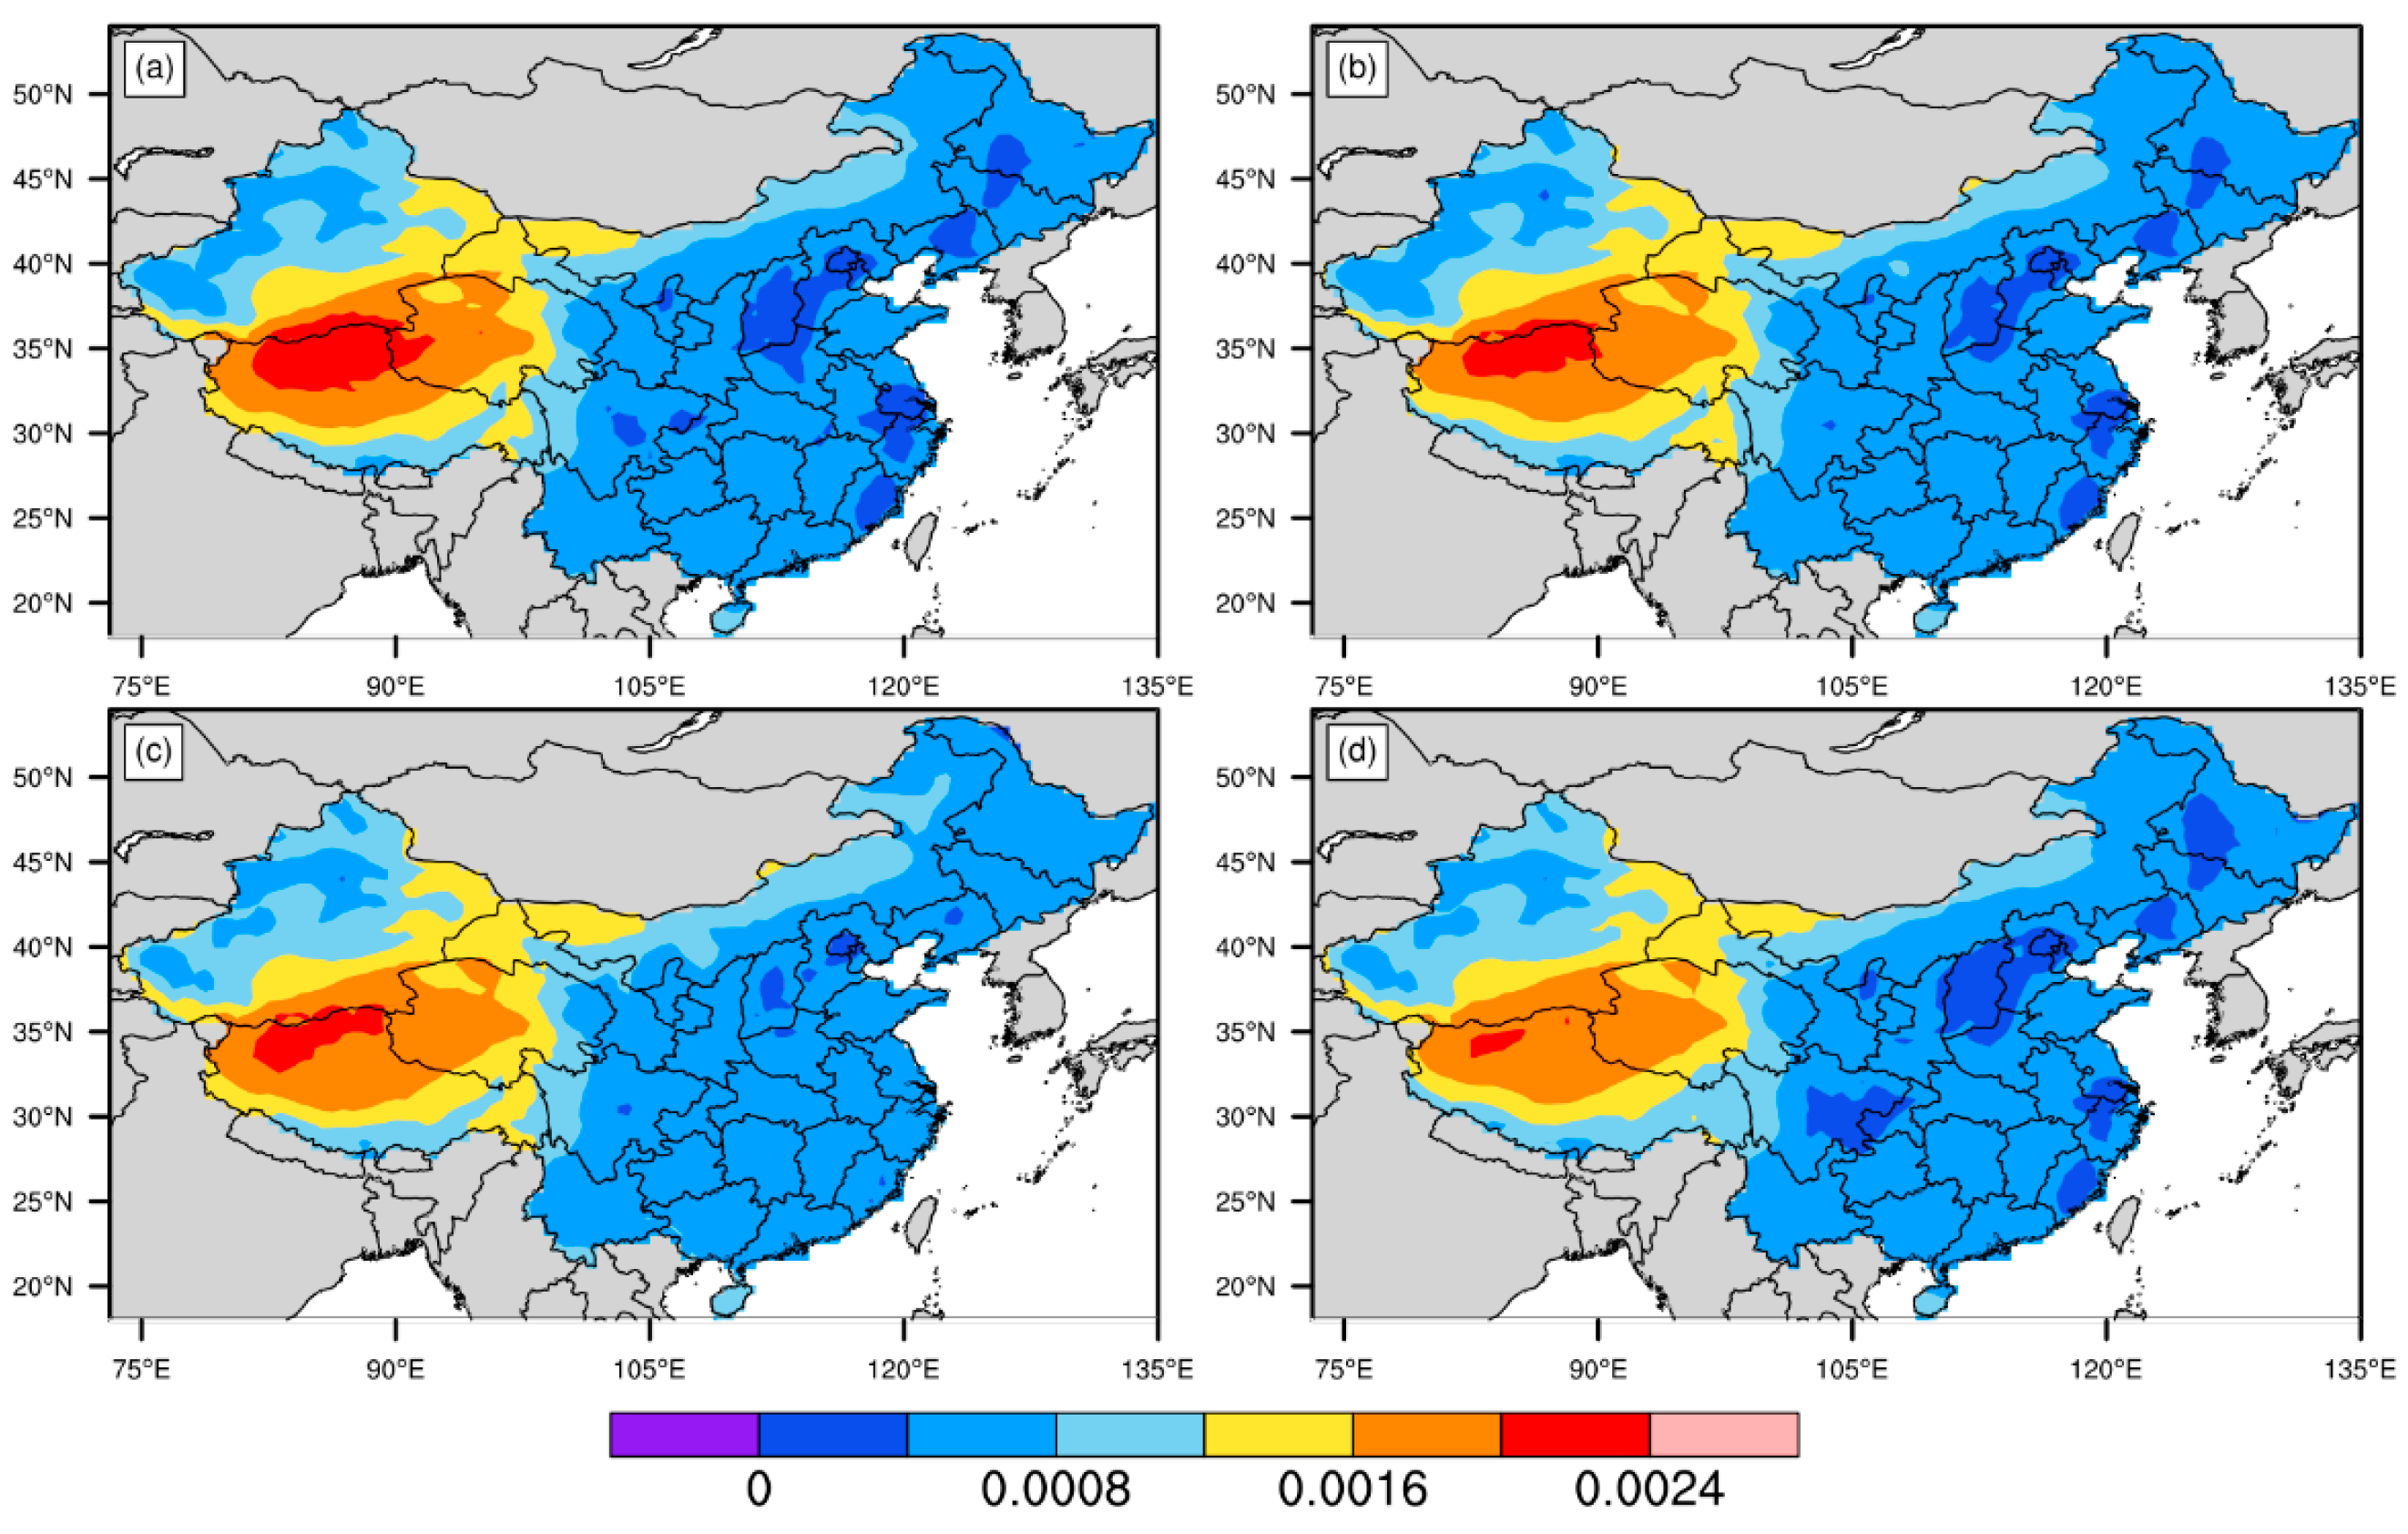
The spatial distributions and inter-decade variations in dry deposition fluxes of hydrophilic BC over mainland China from 1981 to 2020 are portrayed in Figure 1. Four decades during the periods of 1981–1990, 1991–2000, 2001–2010, and 2011–2020 are considered. As illustrated in Figure 1, high dry deposition fluxes of hydrophilic BC are seen in eastern China and southern China, particularly over the northern China Plain and Sichuan Basin, and this is probably associated with fast economic developments producing a large amount of BC particles in these areas during the past four decades. Nonetheless, low dry deposition fluxes of hydrophilic BC are observed in northwestern China, with values smaller than 0.0003 μg m−2 s−1, and low BC concentrations due to low BC emissions therein may be responsible for it. The spatial distributions of dry deposition fluxes generally show patterns similar to the spatial distribution of aerosol optical thickness [40]. Dry deposition fluxes of hydrophilic BC exhibit significant decadal variations, and increased dry deposition flux is distinctly observed from 1981 to 2010. Li et al. [41] reported a continuously increasing trend of aerosol loading and radiative forcing over the Sichuan basin, and it is generally consistent with increased dry deposition flux over the Sichuan basin during this period in our study. The dry deposition flux of hydrophilic BC during the recent decade (i.e., 2011–2020) showed a slight decreasing trend compared to the period of 2001–2010, whereas its dry deposition flux could still be more than 0.0024 μg m−2 s−1 in the northern China Plain and Sichuan Basin. The dry deposition fluxes of hydrophilic BC based on the MERRA-2 data are generally in accordance with those on the basis of in situ or surface measurements, such as over the Tibet Plateau [21], Changbai Mountains [42] and Shanghai [43], which are shown in Figure 2.
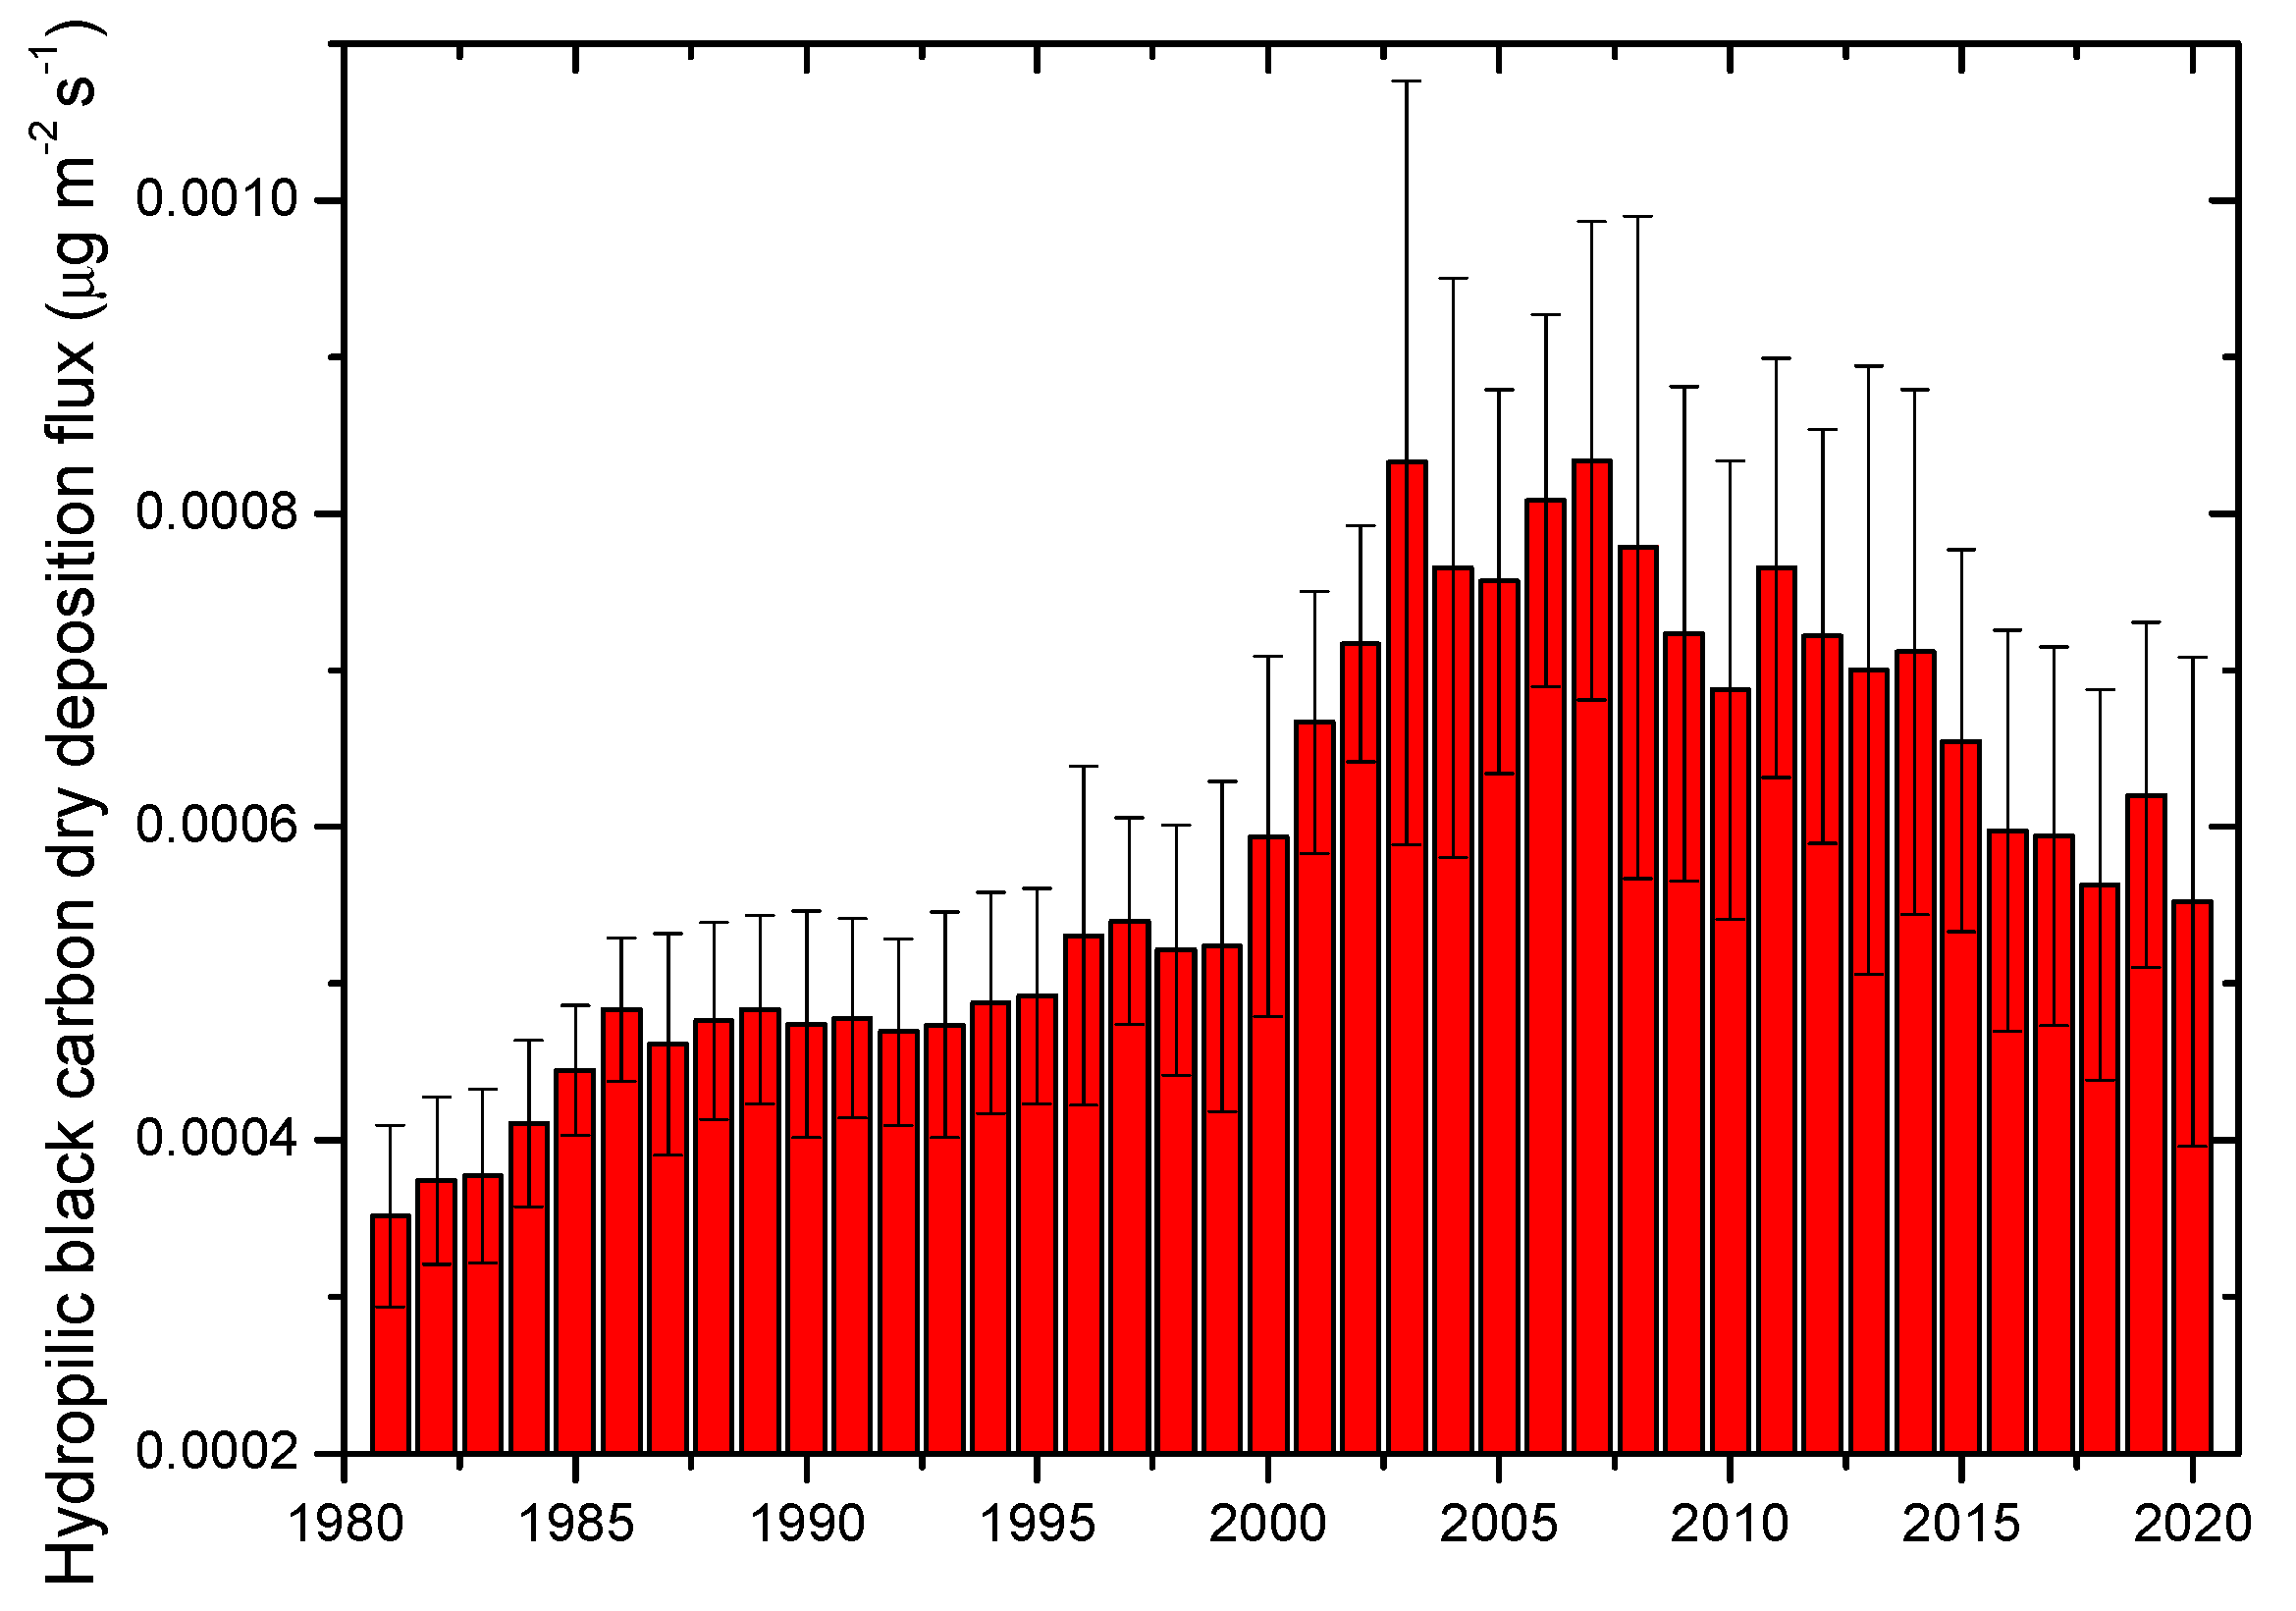
The yearly average variations in dry deposition fluxes of hydrophilic BC over China from 1981 to 2020 are depicted in Figure 3. It should be noted that the results of dry deposition followed in this study are expressed with mean values, while their uncertainties are described by statistical standard deviations. Hydrophilic BC dry deposition fluxes generally exhibited well-defined decadal and annual variations. The yearly mean hydrophilic BC dry deposition fluxes varied from the lowest 0.00035 ± 0.00006 μg m−2 s−1 in 1981 to the highest 0.00083 ± 0.00015 μg m−2 s−1 in 2007, with an average value of 0.00059 ± 0.00014 μg m−2 s−1 from 1981 to 2020. High hydrophilic BC dry deposition fluxes were seen during 2001–2020 compared with the period before 2000, possibly in association with high ambient BC concentrations related to BC emissions due to fast economic developments. Meanwhile, a general decline in hydrophilic BC dry deposition flux during the past decade (i.e., 2011–2020) was statistically significant, and this may suggest the effects of atmospheric pollution control policies by the government.
Figure 4 shows the monthly and seasonal variations in dry deposition fluxes of hydrophilic BC over China from 1981 to 2020. As shown in Figure 4a, monthly mean dry deposition fluxes of hydrophilic BC from 1981 to 2020 varied 1.5 fold, ranging from the lowest 0.00046 ± 0.00011 μg m−2 s−1 in August to the highest 0.00068 ± 0.00019 μg m−2 s−1 in January. The spring (March–May) season had the highest mean dry deposition flux of hydrophilic BC, followed by summer (June–August) and winter (December–February), whereas autumn (September–November) showed relatively weaker hydrophilic BC dry deposition flux. The highest dry deposition flux of hydrophilic BC seen in spring may be attributed to the largest BC aerosol loadings in spring [44]. The seasonally averaged hydrophilic BC dry deposition fluxes from 1981 to 2020 were 0.00064 ± 0.00016, 0.00049 ± 0.00011, 0.00055 ± 0.00015 and 0.00067 ± 0.00017 μg m−2 s−1 for spring, summer, autumn and winter, respectively. For decadal variation, the monthly averaged hydrophilic BC dry deposition fluxes during four different decades were similar, with slight differences in the spring and autumn months, although high dry deposition fluxes were seen during the decade of 2001–2010. The seasonally averaged hydrophilic BC dry deposition fluxes during four decades were consistent with the monthly patterns. The seasonality of hydrophilic BC dry deposition fluxes is probably affected by seasonal variations in BC emissions and formations, in addition to meteorological factors.
Figure 5 depicts the influences of air temperature and surface wind speed on dry deposition fluxes of hydrophilic BC, as well as their correlations with surface BC concentration and BC column mass density over China from 1981 to 2020. The air temperature was that at 2 m height above ground, while surface wind speed was at 10 m height above ground. As illustrated in Figure 5a, a poor correlation between dry deposition fluxes of hydrophilic BC and air temperature was found. The dry deposition fluxes of hydrophilic BC are plotted against surface wind speed in Figure 5b, and a positive correlation was seen. The monthly mean surface wind speed was relatively small, with values of less than 7 m/s, and a comparatively large amount of variability was observed in dry deposition flux of hydrophilic BC compared to that of surface wind speed. The dry deposition flux of hydrophilic BC decreased on average with increased wind speed, and this was probably due to increased turbulence and friction velocity that increased dry turbulent fluxes [45], indicating that the dilution of BC by wind is favorable for its dry deposition. As shown in Figure 5c,d, the monthly mean surface BC mass concentration and BC column mass density over China were in ranges of 0.6–2.2 μg m−3 and 0.8–2.9 μg m−2, respectively. The dry deposition flux of hydrophilic BC generally became higher with higher surface BC mass concentration or BC column mass density. Strong correlations between dry deposition flux of hydrophilic BC and surface BC mass concentration or BC column mass density were found, indicating positive effects of BC concentration on BC dry deposition flux.

3.2. Dry Deposition Velocity of Hydrophilic Black Carbon over China

The concept of dry deposition velocity (Vd) is that the surface dry deposition flux (F) of an atmospheric constituent is directly proportional to its concentration (C) just above the surface, as
F = V d × C
The dynamical and physical processes may be isolated from chemical processes in this way, and the principal processes involved in dry deposition include surface impaction, Brownian diffusion, gravitational settling, surface interception and rebound [1]. The dry deposition velocity provides a particularly useful metric for comparisons of results across diverse sites and modeling particle dry removal, since it is independent of ambient particle concentration. As BC ages quickly after being emitted, most BC particles in the atmosphere are aged BC with coatings and become hydrophilic, e.g., [2]. We use surface BC mass concentration to estimate BC dry deposition velocity, and BC dry deposition velocity is described by BC dry deposition flux divided by surface BC mass concentration.
The spatial distributions of estimated dry deposition velocity of hydrophilic BC over mainland China during the four decades of 1981–1990, 1991–2000, 2001–2010, and 2011–2020 are depicted in Figure 6. In general, the spatial distribution pattern of estimated dry deposition velocity of hydrophilic BC is opposite to the distribution pattern of its dry deposition flux over China. The highest dry deposition velocity of hydrophilic BC was observed over the Tibet Plateau, whereas the lowest dry deposition velocity was seen in eastern China and southern China. The dry deposition velocity of hydrophilic BC over the Tibet Plateau can reach a value larger than 0.002 m s−1, while its value in eastern China can be as low as 0.0004 m s−1. For decadal variation, the dry deposition velocity of hydrophilic BC over eastern China showed almost no change before 2000, whereas its dry deposition velocity increased after 2000. It is interesting to note that increased dry deposition velocity of hydrophilic BC in the Tibet Plateau was seen during the past four decades from 1981 to 2020. Overall, estimated dry deposition velocity of hydrophilic BC showed a spatial distribution pattern opposite to its dry deposition flux pattern over China, and a decadal trend of increased dry deposition velocity of hydrophilic BC was observed over the Tibet Plateau.
The annual, monthly and seasonal variations in dry deposition velocities of hydrophilic BC over China from 1981 to 2020 are shown in Figure 7. As illustrated in Figure 7a, dry deposition velocities of hydrophilic BC showed important annual variations, with a mean value of 0.00051 ± 0.00004 m s−1 during 1981–2020. The yearly average dry deposition velocities of hydrophilic BC varied from the smallest mean value of 0.00044 ± 0.00008 m s−1 in 2020 to the largest value of 0.00059 ± 0.00008 m s−1 in 2002. High dry deposition velocities of hydrophilic BC were seen during 2001–2011, and there was a general decline in dry deposition velocity during the past two decades. Monthly mean dry deposition velocities of hydrophilic BC from 1981 to 2020 showed large variations, ranging from the minimum of 0.00042 ± 0.00004 m s−1 in November to the maximum of 0.00062 ± 0.00006 m s−1 in May (see Figure 7b). The spring season showed highest mean dry deposition velocity of hydrophilic BC, followed by summer and winter, and autumn had the weakest dry deposition velocity. The seasonally averaged hydrophilic BC dry deposition velocities from 1981 to 2020 were 0.00061 ± 0.00005, 0.00054 ± 0.00006, 0.00045 ± 0.00004 and 0.00046 ± 0.00003 m s−1 for spring, summer, autumn and winter, respectively (see Figure 7c). The low deposition velocities observed in autumn and winter may be associated with land use type, as less complicated ecosystems in autumn and winter with smaller surface area can hold less collectors and enable less deposition through interception [26]. The monthly and seasonal patterns of hydrophilic BC dry deposition velocities differ from the patterns of their dry deposition fluxes, although both parameters indicate hydrophilic BC dry deposition. Emerson et al. [8] presented an average BC dry deposition velocity of 0.3 mm/s on the basis of direct measurements of BC dry deposition over a grassland in the USA, which is similar to our results.

3.3. Dry Deposition Velocity of Hydrophilic Black Carbon over Typical Regions of China

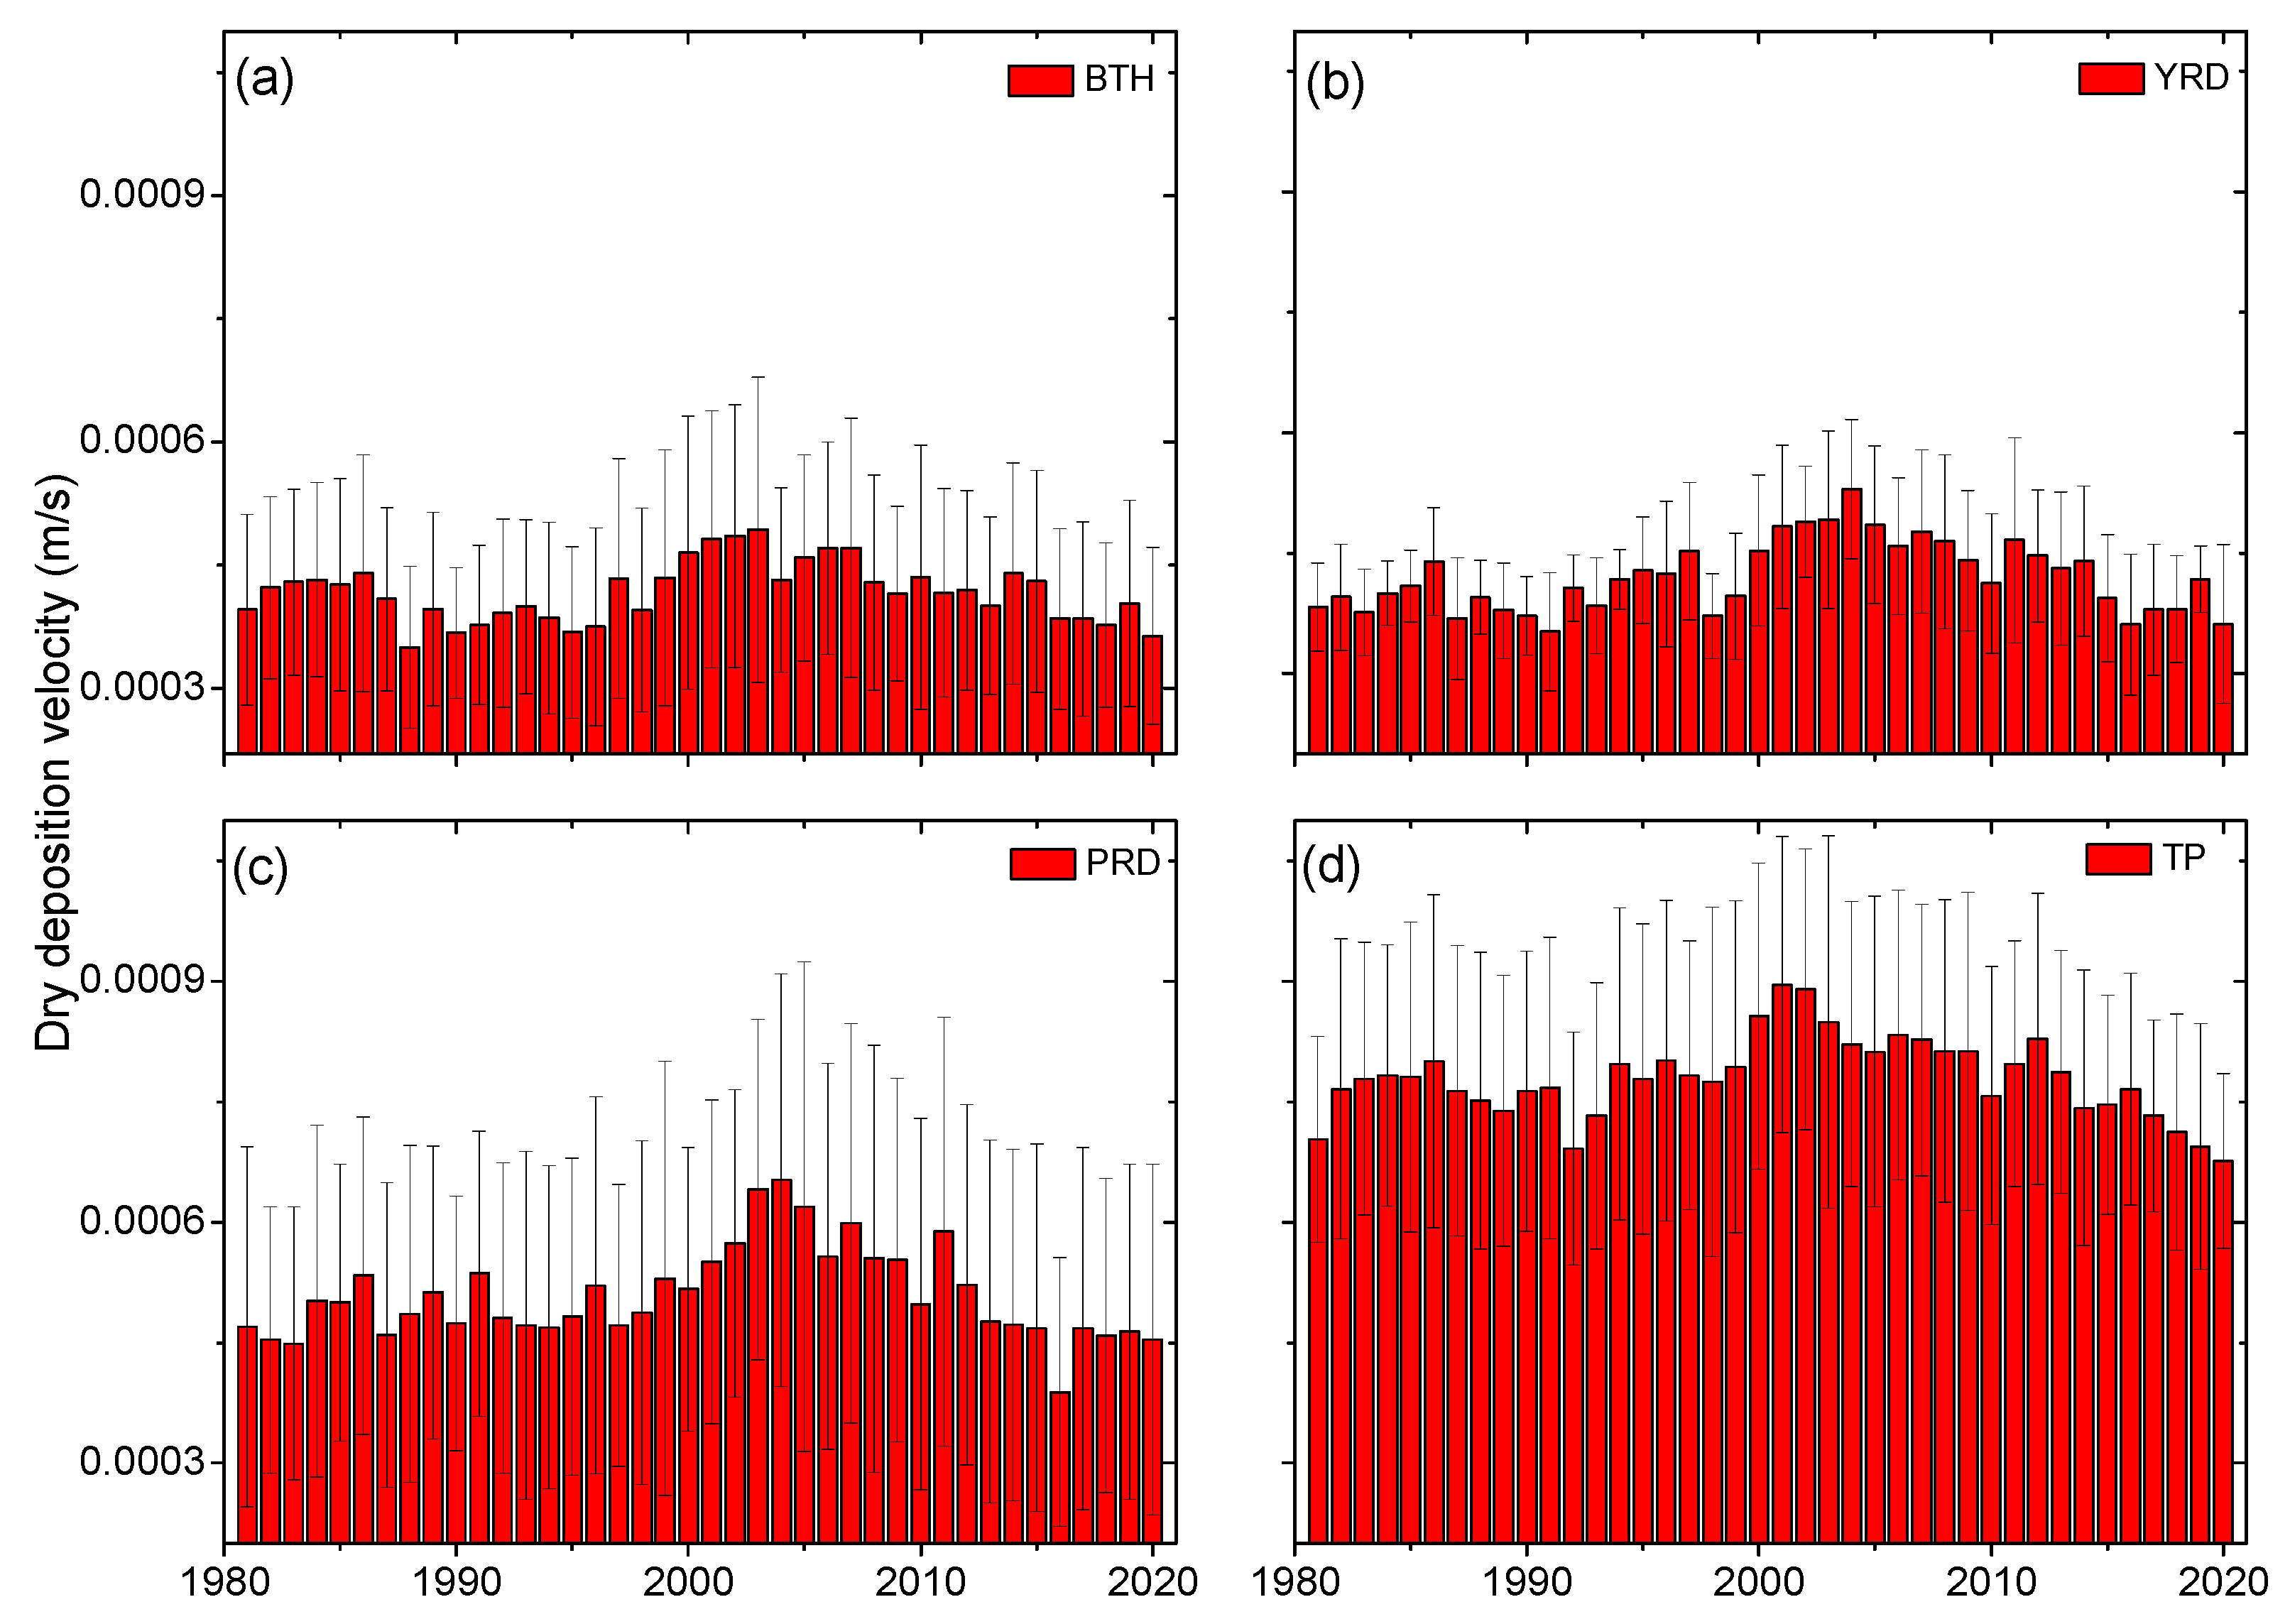
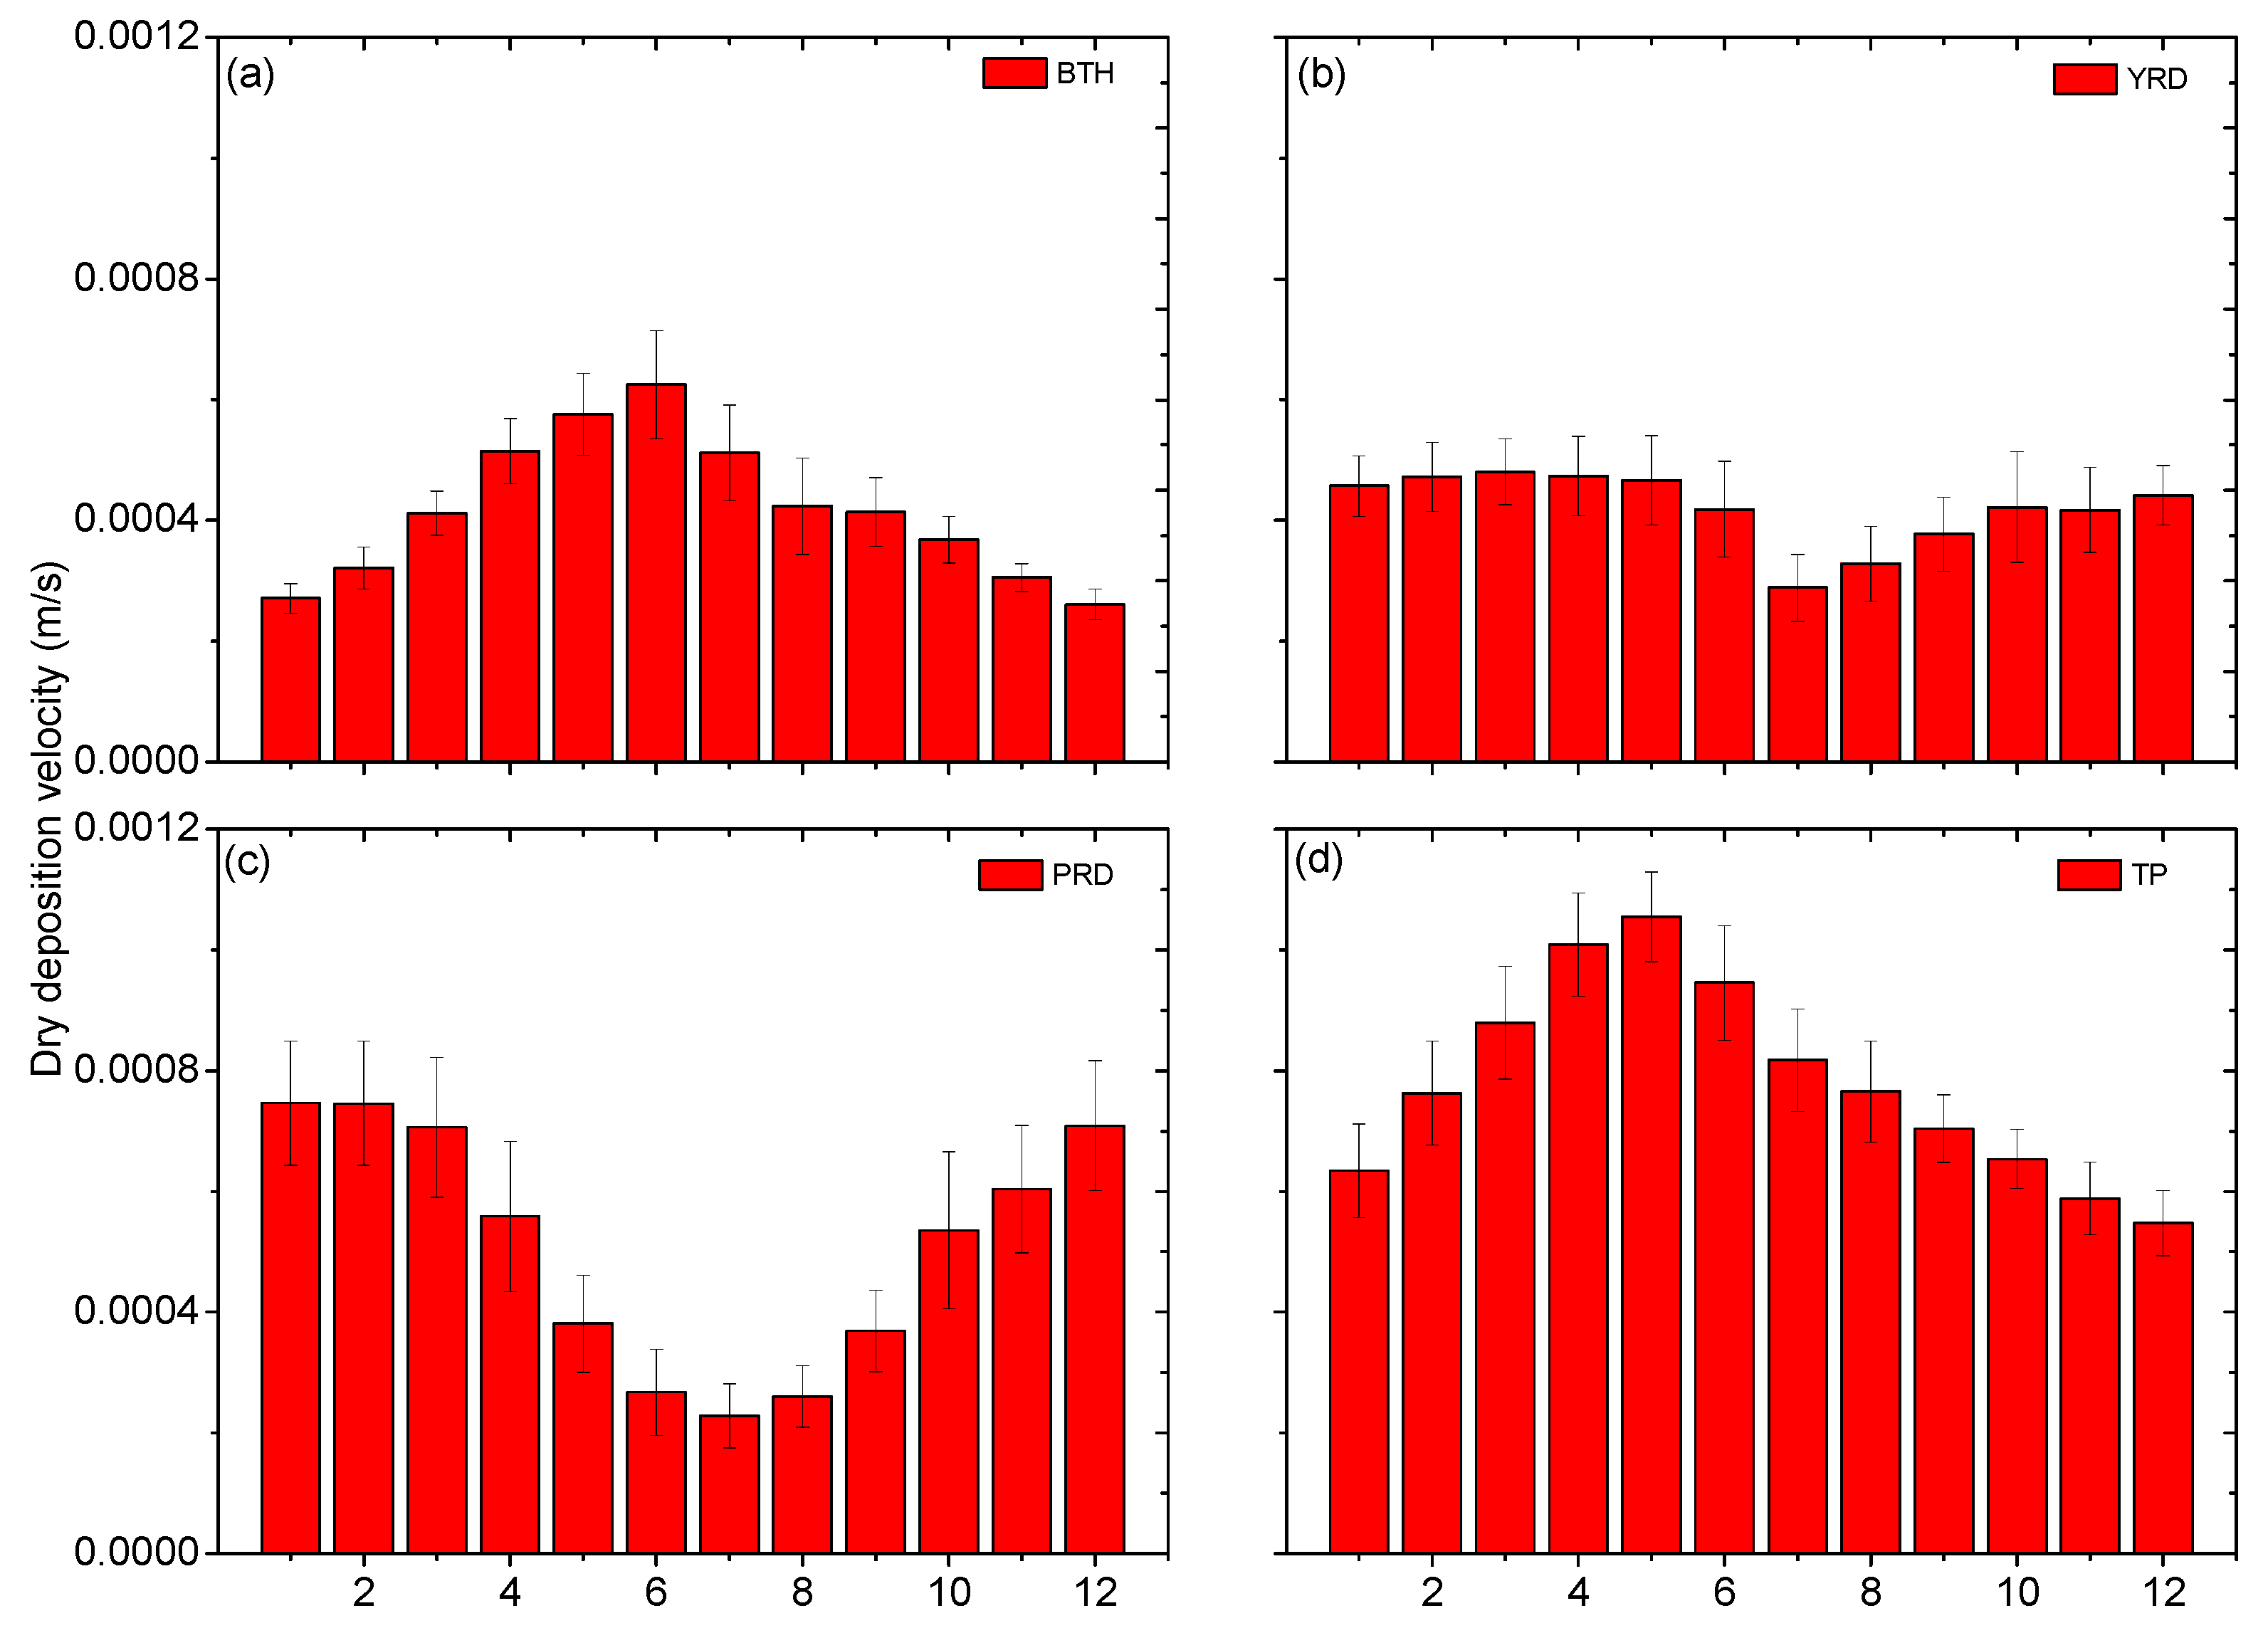
To better understand the characteristics of dry deposition velocity of hydrophilic black carbon in China, four typical areas, including the Tibet Plateau (TP region: 30–36° N, 80–104° E), Beijing-Tianjin-Hebei region (BTH region: 38–41° N, 114–119° E), Yangtze River Delta (YRD region: 29–33° N, 117–122° E), and Pearl River Delta (PRD region: 22–24° N, 112–115° E). The TP region had low BC emissions, while the BTH, YRD and PRD regions were dominated by anthropogenic BC aerosols, and their annual variations of dry deposition velocity of hydrophilic BC are shown in Figure 8. It is shown that yearly mean dry deposition velocity of hydrophilic BC in the BTH, YRD and PRD regions had similar variation patterns, while their values were lower than that in the TP region. The yearly mean dry deposition velocities of hydrophilic BC during the decade of 2001–2010 were generally higher than those during the other three decades in all four regions. The mean dry deposition velocities of hydrophilic BC over the BTH, YRD, PRD and TP regions during 1981–2020 were observed to be 0.00042 ± 0.00004, 0.00042 ± 0.00004, 0.00051 ± 0.00006 and 0.00078 ± 0.00005 m s−1, respectively. In the BTH, YRD and PRD regions, the yearly average dry deposition velocities of hydrophilic BC showed the smallest values of 0.00035 ± 0.00010 m s−1 in 1988, 0.00035 ± 0.00007 m s−1 in 1991 and 0.00039 ± 0.00017 m s−1 in 2016, respectively, while they had the largest values of 0.00049 ± 0.00019 m s−1 in 2003, 0.00053 ± 0.00009 m s−1 in 2004, and 0.00065 ± 0.00026 m s−1 in 2004, respectively. Nevertheless, the yearly average dry deposition velocities of hydrophilic BC in the TP region varied from the smallest 0.00068 ± 0.00011 m s−1 in 2020 to the largest value of 0.00090 ± 0.00018 m s−1 in 2001. Yan et al. [21] also reported a high dry deposition of BC in the TP region and its dominant role in the total deposition based on direct measurements at three remote stations in the Himalayas and Tibetan Plateau, and suggested an urgent need to improve the aerosol deposition in models of the TP regions. Yasunari et al. [46] also estimated a high BC dry deposition in the TP area, and observed a related snow albedo reduction over Himalayan glaciers during dry pre-monsoon periods.
Figure 9 shows monthly variations in dry deposition velocities of hydrophilic BC over the four typical regions of China during 1981–2020. The monthly patterns of dry deposition velocities of hydrophilic BC differed from each other in different regions, and diverse monthly patterns of BC characteristics may have been largely responsible for it. The dry deposition velocities of hydrophilic BC in the TP region showed large values, particularly in spring months, whereas they were relatively low in the other three regions. The monthly average dry deposition velocities of hydrophilic BC in the BTH region exhibited the largest value of 0.00062 ± 0.00009 m s−1 in June and smallest value of 0.00026 ± 0.00003 m s−1 in December, while the YRD region showed the highest value of 0.00048 ± 0.00005 m s−1 in March and smallest of 0.00029 ± 0.00006 m s−1 in July. Meanwhile, monthly dry deposition velocities of hydrophilic BC in the PRD and TP regions ranged from the lowest mean values of 0.00023 ± 0.00005 m s−1 in July and 0.00055 ± 0.00005 m s−1 in December, to the highest values of 0.00075 ± 0.00010 m s−1 in January and 0.0011 ± 0.00005 m s−1 in May, respectively.
The seasonally averaged dry deposition velocities of hydrophilic BC over the four typical regions of China during 1981–2020 are portrayed in Figure 10. The seasonal patterns of dry deposition velocities of hydrophilic BC over the four regions were different from each other, consistent with their monthly patterns. In spring, summer, autumn and winter, seasonal mean hydrophilic BC dry deposition velocities of 0.00050 ± 0.00004, 0.00052 ± 0.00007, 0.00036 ± 0.00003 and 0.00028 ± 0.00002 m s−1 were seen in the BTH region while their values in the YRD region were 0.00047 ± 0.00006, 0.00035 ± 0.00005, 0.00041 ± 0.00007 and 0.00046 ± 0.00005 m s−1, respectively. Nonetheless, seasonal average dry deposition velocities of hydrophilic BC of 0.00057 ± 0.00009, 0.00025 ± 0.00005, 0.00052 ± 0.00009 and 0.00074 ± 0.00009 m s−1 in the PRD region, as well as 0.00098 ± 0.00008, 0.00084 ± 0.00007, 0.00065 ± 0.00005 and 0.00065 ± 0.00006 m s−1 in the TP region, were observed in spring, summer, autumn and winter, respectively. The highest seasonal mean hydrophilic BC dry deposition velocities were seen in summer for the BTH region and in winter for the PRD region, whereas they were highest in spring for both the YRD and TP regions. In addition to the YRD and PRD regions in summer, the lowest seasonal mean dry deposition velocities of hydrophilic BC were seen in winter and autumn for the BTH and TP regions, respectively.
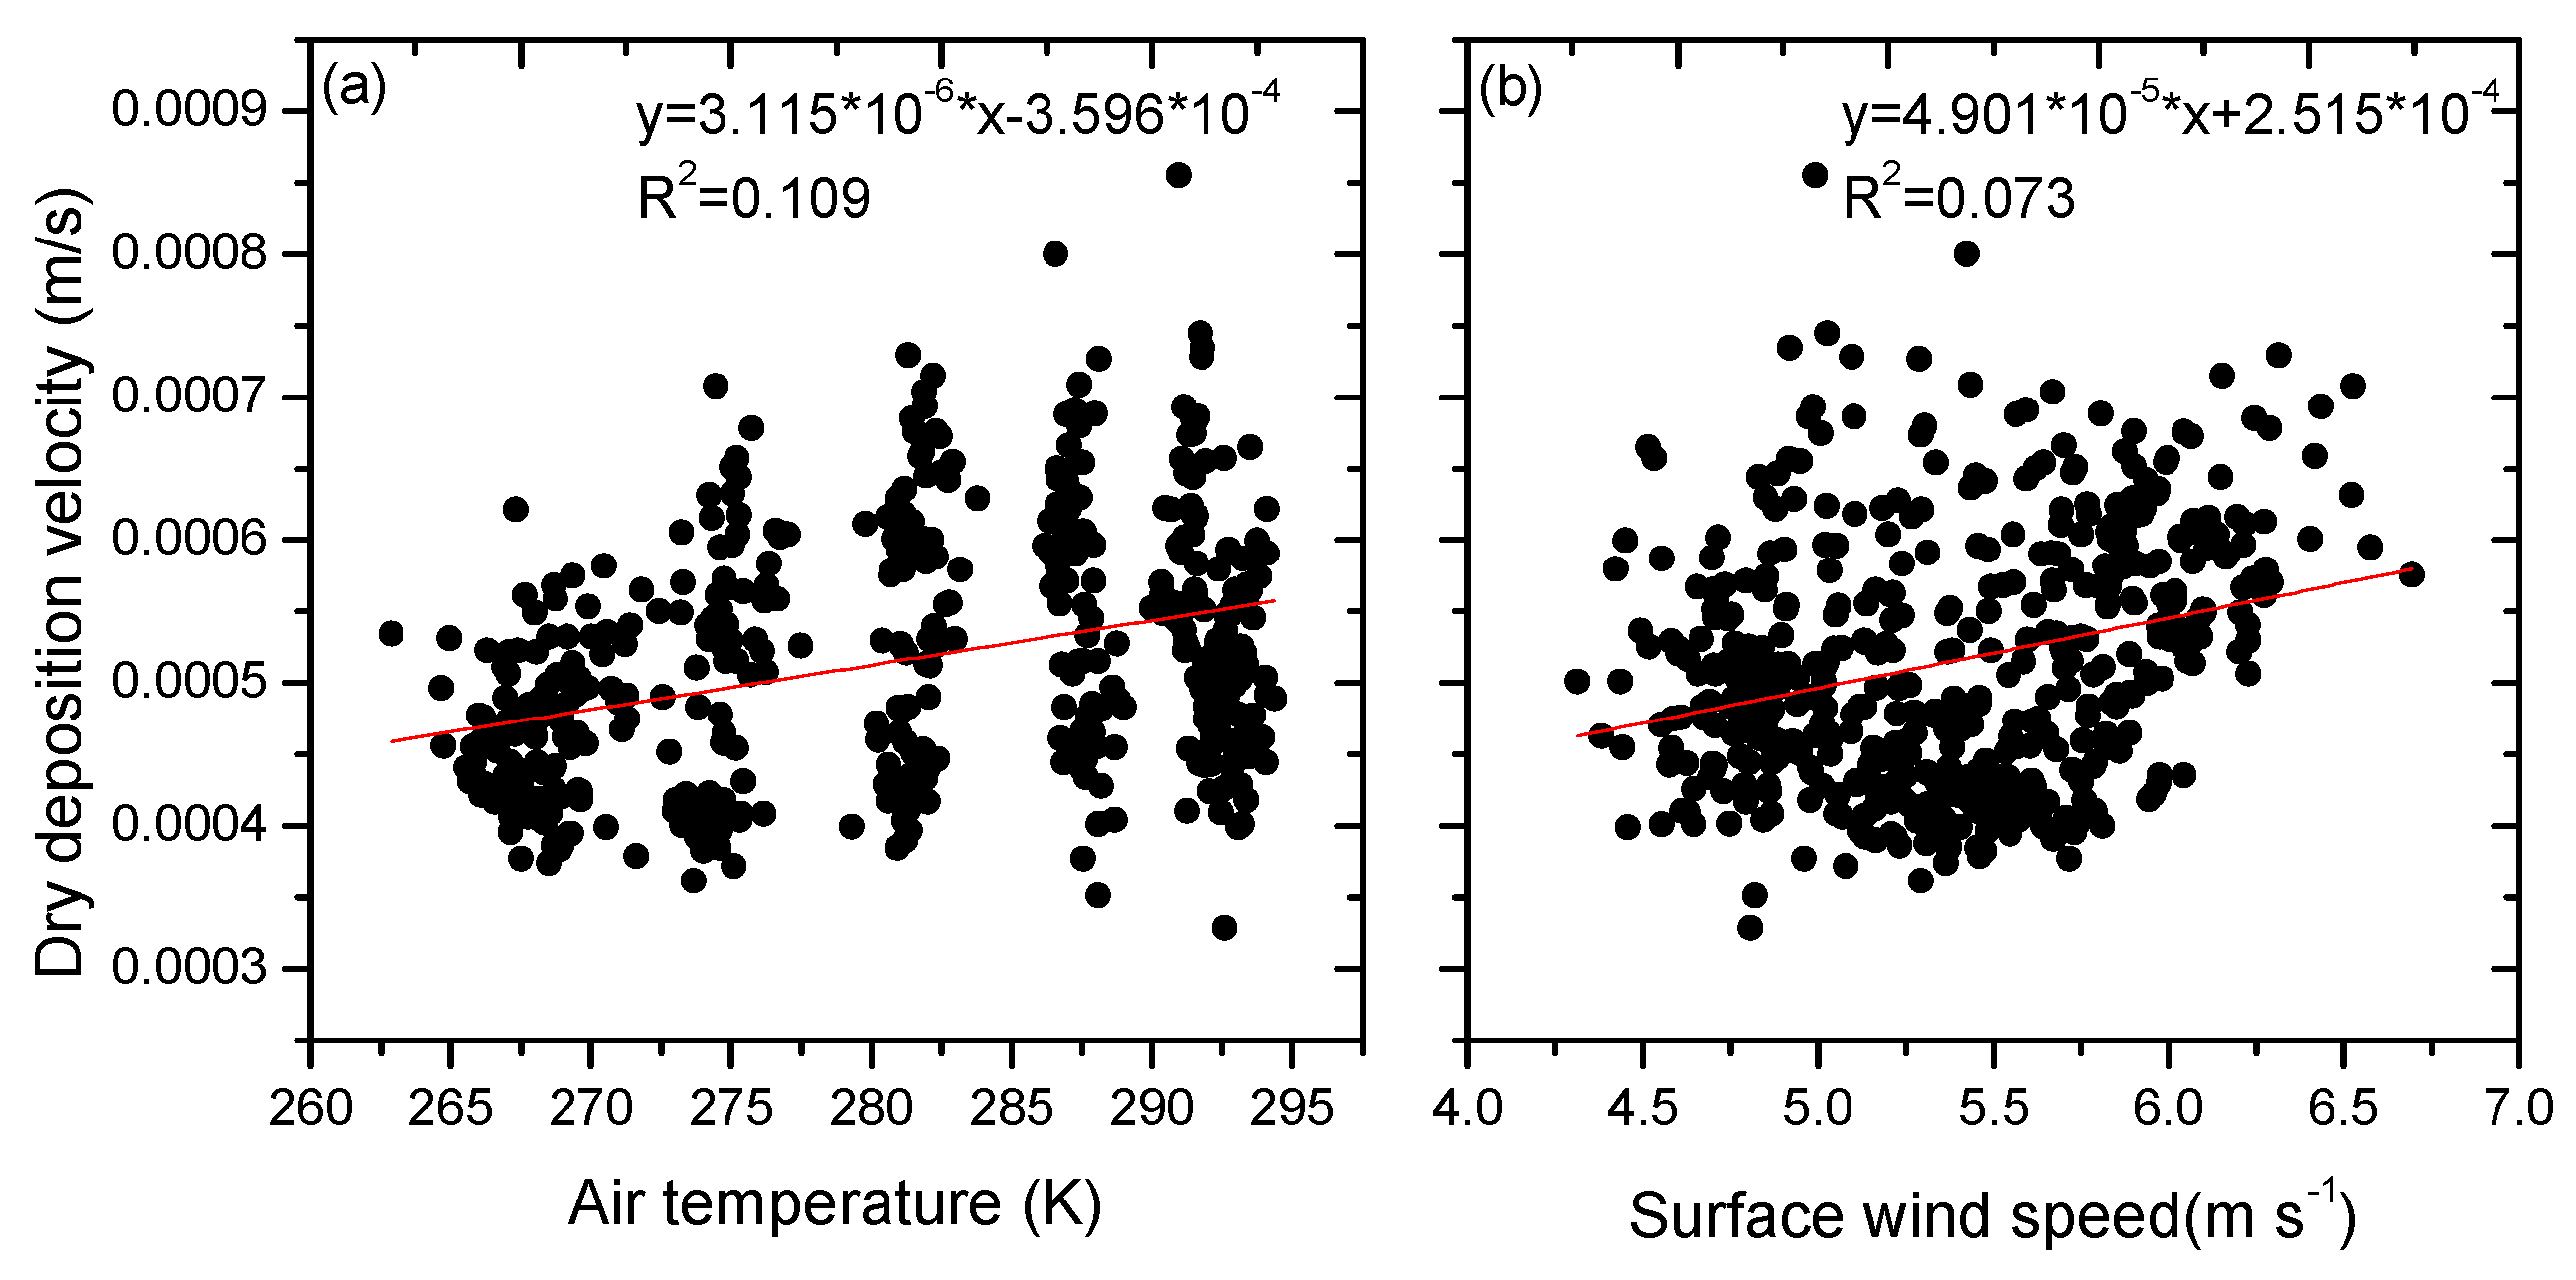
To show the influences of meteorological conditions on dry deposition velocity, Figure 11 illustrates the correlations of dry deposition velocities of hydrophilic BC with air temperature and surface wind speed over China. As noted previously, the air temperature and surface wind speed were measured at 2 m and 10 m height above ground, respectively. It is evident that the correlations between dry deposition velocities of hydrophilic BC and air temperature or surface wind speed were linearly poor, although positive correlation coefficients were obtained. The dry deposition velocities of hydrophilic BC generally increase with increased air temperature or surface wind speed, indicating that high air temperature or surface wind speed can fortify dry deposition velocities of hydrophilic BC.

4. Conclusions

The detailed characteristics of dry deposition velocities of hydrophilic BC over China from 1981 to 2020 were studied based on the MERRA-2 reanalysis data. The spatial, annual, seasonal and monthly variations in dry deposition fluxes of hydrophilic BC and its estimated dry deposition velocities over China, including representative regions, were systematically investigated. The dry deposition fluxes of hydrophilic BC showed diverse spatial distributions over China, with an average value of 0.00059 ± 0.00014 μg m−2 s−1. The monthly mean dry deposition fluxes of hydrophilic BC from 1981 to 2020 varied 1.5 fold, ranging from the lowest 0.00046 ± 0.00011 μg m−2 s−1 in August to the highest 0.00068 ± 0.00019 μg m−2 s−1 in January. The spring season had the highest mean dry deposition flux of hydrophilic BC, followed by summer and winter, whereas autumn showed relatively weaker hydrophilic BC dry deposition flux.
Dry deposition flux of hydrophilic BC could be higher than 0.0024 μg m−2 s−1 in the northern China Plain and Sichuan Basin, whereas large dry deposition velocities of hydrophilic BC were seen in the TP regions. The mean dry deposition velocity of hydrophilic BC over China was estimated to be 0.00051 ± 0.00004 m s−1 during 1981–2020, while its values over the BTH, YRD, PRD and TP regions were observed to be 0.00042 ± 0.00004, 0.00042 ± 0.00004, 0.00051 ± 0.00006 and 0.00078 ± 0.00005 m s−1, respectively. The monthly and seasonal patterns of dry deposition velocities of hydrophilic BC differed from each other in different regions. The dry deposition velocities of hydrophilic BC generally increased with increased air temperature or surface wind speed, although these were quite limited in strength, indicating that high air temperature or surface wind speed may fortify dry deposition velocities of hydrophilic BC.

Author Contributions

Conceptualization, X.Z.; methodology, X.Z.; software, X.Z.; validation, X.Z. and M.M.; formal analysis, X.Z.; investigation, A.H.A.M. and Y.Z.; resources, X.Z.; data curation, X.Z.; writing—original draft preparation, X.Z.; writing—review and editing, X.Z.; visualization, X.Z.; supervision, X.Z.; project administration, X.Z.; funding acquisition, X.Z. All authors have read and agreed to the published version of the manuscript.

Funding

This research was funded by the State Key Laboratory of Atmospheric Boundary Layer Physics and Atmospheric Chemistry (LAPC-KF-2023-09).

Institutional Review Board Statement

Not applicable.

Informed Consent Statement

Not applicable.

Data Availability Statement

The data is available upon request.

Acknowledgments

This work is supported by the Qinglan Project. Analyses and visualizations used in this paper were produced with the Giovanni online data system, developed, and maintained by the NASA GES DISC. We also acknowledge the mission scientists and Principal Investigators who provided the data used in this research effort.

Conflicts of Interest

The authors declare no conflict of interest.

References

  1. Pleim, J.E.; Ran, L.; Saylor, R.D.; Willison, J.; Binkowski, F.S. A new aerosol dry deposition model for air quality and climate modeling. J. Adv. Model. Earth Syst. 2022, 14, e2022MS003050. [Google Scholar] [CrossRef]
  2. Zhang, X.; Mao, M.; Chen, H.; Tang, S. The Angstrom exponents of black carbon aerosols with non-absorptive coating: A numerical investigation. J. Quant. Spectrosc. Radiat. Transf. 2020, 257, 107362. [Google Scholar] [CrossRef]
  3. Zhang, X.; Zhou, Y. Aerosol direct radiative forcing over China: A 40-year MERRA-2-based evaluation. Atmos. Environ. 2023, 299, 119659. [Google Scholar] [CrossRef]
  4. Liu, J.; Li, Z. Significant underestimation in the optically based estimation of the aerosol first indirect effect induced by the aerosol swelling effect. Geophys. Res. Lett. 2018, 45, 5690–5699. [Google Scholar] [CrossRef]
  5. Bond, T.C.; Streets, D.G.; Yarber, K.F.; Nelson, S.M.; Woo, J.H.; Klimont, Z. A technology-based global inventory of black and organic carbon emissions from combustion. J. Geophys. Res. 2004, 109, D14203. [Google Scholar] [CrossRef] [Green Version]
  6. Koch, D.; Del Genio, A.D. Black carbon semi-direct effects on cloud cover: Review and synthesis. Atmos. Chem. Phys. 2010, 10, 7685–7696. [Google Scholar] [CrossRef] [Green Version]
  7. Bond, T.C.; Doherty, S.J.; Fahey, D.W.; Forster, P.M.; Berntsen, T.; DeAngelo, B.J.; Flanner, M.G.; Ghan, S.; Kaercher, B.; Koch, D.; et al. Bounding the role of black carbon in the climate system: A scientific assessment. J. Geophys. Res. 2013, 118, 5380–5552. [Google Scholar] [CrossRef]
  8. Emerson, E.W.; Katich, J.M.; Schwarz, J.P.; McMeeking, G.R.; Farmer, D.K. Direct measurements of dry and wet deposition of black carbon over a grassland. J. Geophys. Res. Atmos. 2018, 123, 12277–12290. [Google Scholar] [CrossRef] [Green Version]
  9. Zhang, X.; Zhou, Y.; Wang, Y.; Huang, A.; Gao, C.; He, S.; Mao, M. Scavenging of Black Carbon Aerosols by Radiation Fog in Urban Central China. Atmosphere 2022, 13, 205. [Google Scholar] [CrossRef]
  10. Emerson, E.W.; Hodshire, A.L.; DeBolt, H.M.; Bilsback, K.R.; Pierce, J.R.; McMeeking, G.R.; Farmer, D.K. Revisiting particle dry deposition and its role in radiative effect estimates. Proc. Natl. Acad. Sci. USA 2020, 117, 26076–26082. [Google Scholar] [CrossRef] [PubMed]
  11. Schwede, D.B.; Lear, G.G. A novel hybrid approach for estimating total deposition in the United States. Atmos. Environ. 2014, 92, 207–220. [Google Scholar] [CrossRef] [Green Version]
  12. Koch, D.; Schulz, M.; Kinne, S.; McNaughton, C.; Spackman, J.R.; Balkanski, Y.; Bauer, S.; Berntsen, T.; Bond, T.C.; Boucher, O.; et al. Evaluation of black carbon estimations in global aerosol models. Atmos. Chem. Phys. 2009, 9, 9001–9026. [Google Scholar] [CrossRef] [Green Version]
  13. Gong, W.; Makar, P.A.; Zhang, J.; Milbrandt, J.; Gravel, S.; Hayden, K.L.; Macdonald, A.M.; Leaitch, W.R. Modelling aerosol-cloud-meteorology interaction: A case study with a fully coupled air quality model (GEM-MACH). Atmos. Environ. 2015, 115, 695–715. [Google Scholar] [CrossRef]
  14. Lee, P.; McQueen, J.; Stajner, I.; Huang, J.P.; Pan, L.; Tong, D.; Kim, H.; Tang, Y.H.; Kondragunta, S.; Ruminski, M.; et al. NAQFC developmental forecast guidance for fine particulate matter (PM2.5). Weather Forecast. 2017, 32, 343–360. [Google Scholar] [CrossRef]
  15. Lee, L.A.; Pringle, K.J.; Reddington, C.L.; Mann, G.W.; Stier, P.; Spracklen, D.V.; Pierce, J.R.; Carslaw, K.S. The magnitude and causes of uncertainty in global model simulations of cloud condensation nuclei. Atmos. Chem. Phys. 2013, 13, 8879–8914. [Google Scholar] [CrossRef] [Green Version]
  16. Contini, D.; Vecchi, R.; Viana, M. Carbonaceous Aerosols in the Atmosphere. Atmosphere 2018, 9, 181. [Google Scholar] [CrossRef] [Green Version]
  17. Liu, M.; Wang, L. Research progress in multimedia cycle processes and simulation of POPs in urban surface system. China Environ. Sci. 2013, 33, 2018–2026. [Google Scholar]
  18. Jurado, E.; Dachs, J.; Duarte, C.M.; Simo, R. Atmospheric deposition of organic and black carbon to the global oceans. Atmos. Environ. 2008, 42, 7931–7939. [Google Scholar] [CrossRef]
  19. Wang, F.; Feng, T.; Guo, Z.; Li, Y.; Lin, T.; Rose, N.L. Sources and dry deposition of carbonaceous aerosols over the coastal East China Sea: Implications for anthropogenic pollutant pathways and deposition. Environ. Pollut. 2019, 245, 771–779. [Google Scholar] [CrossRef]
  20. Witkowska, A.; Lewandowska, A.; Falkowska, L.M. Parallel measurements of organic and elemental carbon dry (PM1, PM2.5) and wet (rain, snow, mixed) deposition into the Baltic Sea. Mar. Pollut. Bull. 2016, 104, 303–312. [Google Scholar] [CrossRef]
  21. Yan, F.; He, C.; Kang, S.; Chen, P.; Hu, Z.; Han, X.; Gautam, S.; Yan, C.; Zheng, M.; Sillanpaa, M.; et al. Deposition of organic and black carbon: Direct measurements at three remote stations in the Himalayas and Tibetan Plateau. J. Geophys. Res. Atmos. 2019, 16, 9702–9715. [Google Scholar] [CrossRef]
  22. Tang, Y.; Han, G.L.; Xu, Z.F. Black carbon in the atmospheric dust of Beijing City and its north area. Acta Sci. Circumstantiae 2013, 33, 332–338. [Google Scholar]
  23. Vong, R.J.; Vong, I.J.; Vickers, D.; Covert, D.S. Size-dependent aerosol deposition velocities during BEARPEX’07. Atmos. Chem. Phys. 2010, 10, 5749–5758. [Google Scholar] [CrossRef] [Green Version]
  24. Ahlm, L.; Krejci, R.; Nilsson, E.D.; Martensson, E.M.; Vogt, M.; Artaxo, P. Emission and dry deposition of accumulation mode particles in the Amazon Basin. Atmos. Chem. Phys. 2010, 10, 10237–10253. [Google Scholar] [CrossRef] [Green Version]
  25. Grönholm, T.; Aalto, P.P.; Hiltunen, V.J.; Rannik, U.; Rinne, J.; Laakso, L.; HyvoNen, S.; Vesala, T.; Kulmala, M. Measurements of aerosol particle dry deposition velocity using the relaxed eddy accumulation technique. Tellus B Chem. Phys. Meteorol. 2007, 59, 381–386. [Google Scholar] [CrossRef]
  26. Farmer, D.K.; Boedicker, E.K.; DeBolt, H.M. Dry Deposition of Atmospheric Aerosols: Approaches, Observations, and Mechanisms. Annu. Rev. Phys. Chem. 2021, 72, 375–397. [Google Scholar] [CrossRef] [PubMed]
  27. Wesely, M.L.; Hicks, B.B. A review of the current status of knowledge on dry deposition. Atmos. Environ. 2000, 34, 2261–2282. [Google Scholar] [CrossRef]
  28. Zhang, L.M.; Gong, S.L.; Padro, J.; Barrie, L. A size-segregated particle dry deposition scheme for an atmospheric aerosol module. Atmos. Environ. 2001, 35, 549–560. [Google Scholar] [CrossRef]
  29. Randles, C.A.; da Silva, A.M.; Buchard, V.; Colarco, P.R.; Darmenov, A.; Govindaraju, R.; Smirnov, A.; Holben, B.; Ferrare, R.; Hair, J.; et al. The MERRA-2 aerosol reanalysis, 1980 onward. Part I: System description and data assimilation evaluation. J. Clim. 2017, 30, 6823–6850. [Google Scholar] [CrossRef]
  30. Molod, A.; Takacs, L.; Suarez, M.; Bacmeister, J. Development of the GEOS-5 atmospheric general circulation model: Evolution from MERRA to MERRA2. Geosci. Model Dev. 2015, 8, 1339–1356. [Google Scholar] [CrossRef] [Green Version]
  31. Kleist, D.T.; Parrish, D.F.; Derber, J.C.; Treadon, R.; Wu, W.-S.; Lord, S. Introduction of the GSI into the NCEP Global Data Assimilation System. Weather Forecast. 2009, 24, 1691–1705. [Google Scholar] [CrossRef] [Green Version]
  32. Putman, W.; Lin, S.-J. Finite-volume transport on various cubed sphere grids. J. Comput. Phys. 2007, 227, 55–78. [Google Scholar] [CrossRef]
  33. Buchard, V.; Randles, C.A.; da Silva, A.M.; Darmenov, A.; Colarco, P.R.; Govindaraju, R.; Ferrare, R.; Hair, J.; Beyersdorf, A.J.; Ziemba, L.D.; et al. The MERRA-2 aerosol reanalysis, 1980 onward. Part II: Evaluation and case studies. J. Clim. 2017, 30, 6851–6872. [Google Scholar] [CrossRef] [PubMed]
  34. Colarco, P.; da Silva, A.; Chin, M.; Diehl, T. Online simulations of global aerosol distributions in the NASA GEOS-4 model and comparisons to satellite and ground-based aerosol optical depth. J. Geophys. Res. 2010, 115, D14207. [Google Scholar] [CrossRef] [Green Version]
  35. Chin, M.; Ginoux, P.; Kinne, S.; Torres, O.; Holben, B.N.; Duncan, B.N.; Martin, R.V.; Logan, J.A.; Higurashi, A.; Nakajima, T. Tropospheric aerosol optical thickness from the GOCART model and comparisons with satellite and Sun photometer measurements. J. Atmos. Sci. 2002, 59, 461–483. [Google Scholar] [CrossRef]
  36. McMeeking, G.R.; Morgan, W.T.; Flynn, M.; Highwood, E.J.; Turnbull, K.; Haywood, J.; Coe, H. Black carbon aerosol mixing state, organic aerosols and aerosol optical properties over the United Kingdom. Atmos. Chem. Phys. 2011, 11, 9037–9052. [Google Scholar] [CrossRef] [Green Version]
  37. Park, R.J.; Jacob, D.J.; Chin, M.; Martin, R.V. Sources of carbonaceous aerosols over the United States and implications for natural visibility. J. Geophys. Res. Atmos. 2003, 108, 4355. [Google Scholar] [CrossRef]
  38. Gelaro, R.; McCarty, W.; Suárez, M.J.; Todling, R.; Molod, A.; Takacs, L.; Randles, C.A.; Darmenov, A.; Bosilovich, M.G.; Reichle, R.; et al. The Modern-Era retrospective analysis for research and applications, version 2 (MERRA-2). J. Clim. 2017, 30, 5419–5454. [Google Scholar] [CrossRef]
  39. Hung, W.T.; Lu, C.; Wang, S.H.; Chen, S.P.; Tsai, F.; Chou, C.K. Investigation of long-range transported PM2.5 events over Northern Taiwan during 2005–2015 winter seasons. Atmos. Environ. 2019, 217, 116920. [Google Scholar] [CrossRef]
  40. Dang, R.; Liao, H. Radiative forcing and health impact of aerosols and ozone in China as the consequence of clean air actions over 2012–2017. Geophys. Res. Lett. 2019, 46, 12511–12519. [Google Scholar] [CrossRef]
  41. Li, J.; Han, Z.; Xie, Z. Model analysis of long-term trends of aerosol concentrations and direct radiative forcings over East Asia. Tellus B Chem. Phys. Meteorol. 2013, 65, 20410. [Google Scholar] [CrossRef] [Green Version]
  42. Wang, Z.W.; Gallet, J.C.; Pedersen, C.A.; Zhang, X.S.; Strom, J.; Ci, Z.J. Elemental carbon in snow at Changbai Mountain, northeastern China: Concentrations, scavenging ratios, and dry deposition velocities. Atmos. Chem. Phys. 2014, 14, 14221–14248. [Google Scholar] [CrossRef] [Green Version]
  43. Wang, Q.; Feng, W.; Liu, M.; Xu, H. Atmospheric elemental carbon deposition from urban and suburban sites of Shanghai: Characteristics, sources and comparison with aerosols and soils. Atmos. Pollut. Res. 2021, 12, 193–199. [Google Scholar] [CrossRef]
  44. Liu, M.; Matsui, H. Aerosol radiative forcings induced by substantial changes in anthropogenic emissions in China from 2008 to 2016. Atmos. Chem. Phys. 2021, 21, 5965–5982. [Google Scholar] [CrossRef]
  45. Contini, D.; Donateo, A.; Belosi, F.; Grasso, F.M.; Santachiara, G.; Prodi, F. Deposition velocity of ultrafine particles measured with the Eddy-Correlation Method over the Nansen Ice Sheet (Antarctica). J. Geophys. Res. 2010, 115, D16202. [Google Scholar] [CrossRef] [Green Version]
  46. Yasunari, T.J.; Tan, Q.; Lau, K.M.; Bonasoni, P.; Marinoni, A.; Laj, P.; Menegoz, M.; Takemura, T.; Chin, M. Estimated range of black carbon dry deposition and the related snow albedo reduction over Himalayan glaciers during dry pre-monsoon periods. Atmos. Environ. 2013, 78, 259–267. [Google Scholar] [CrossRef]
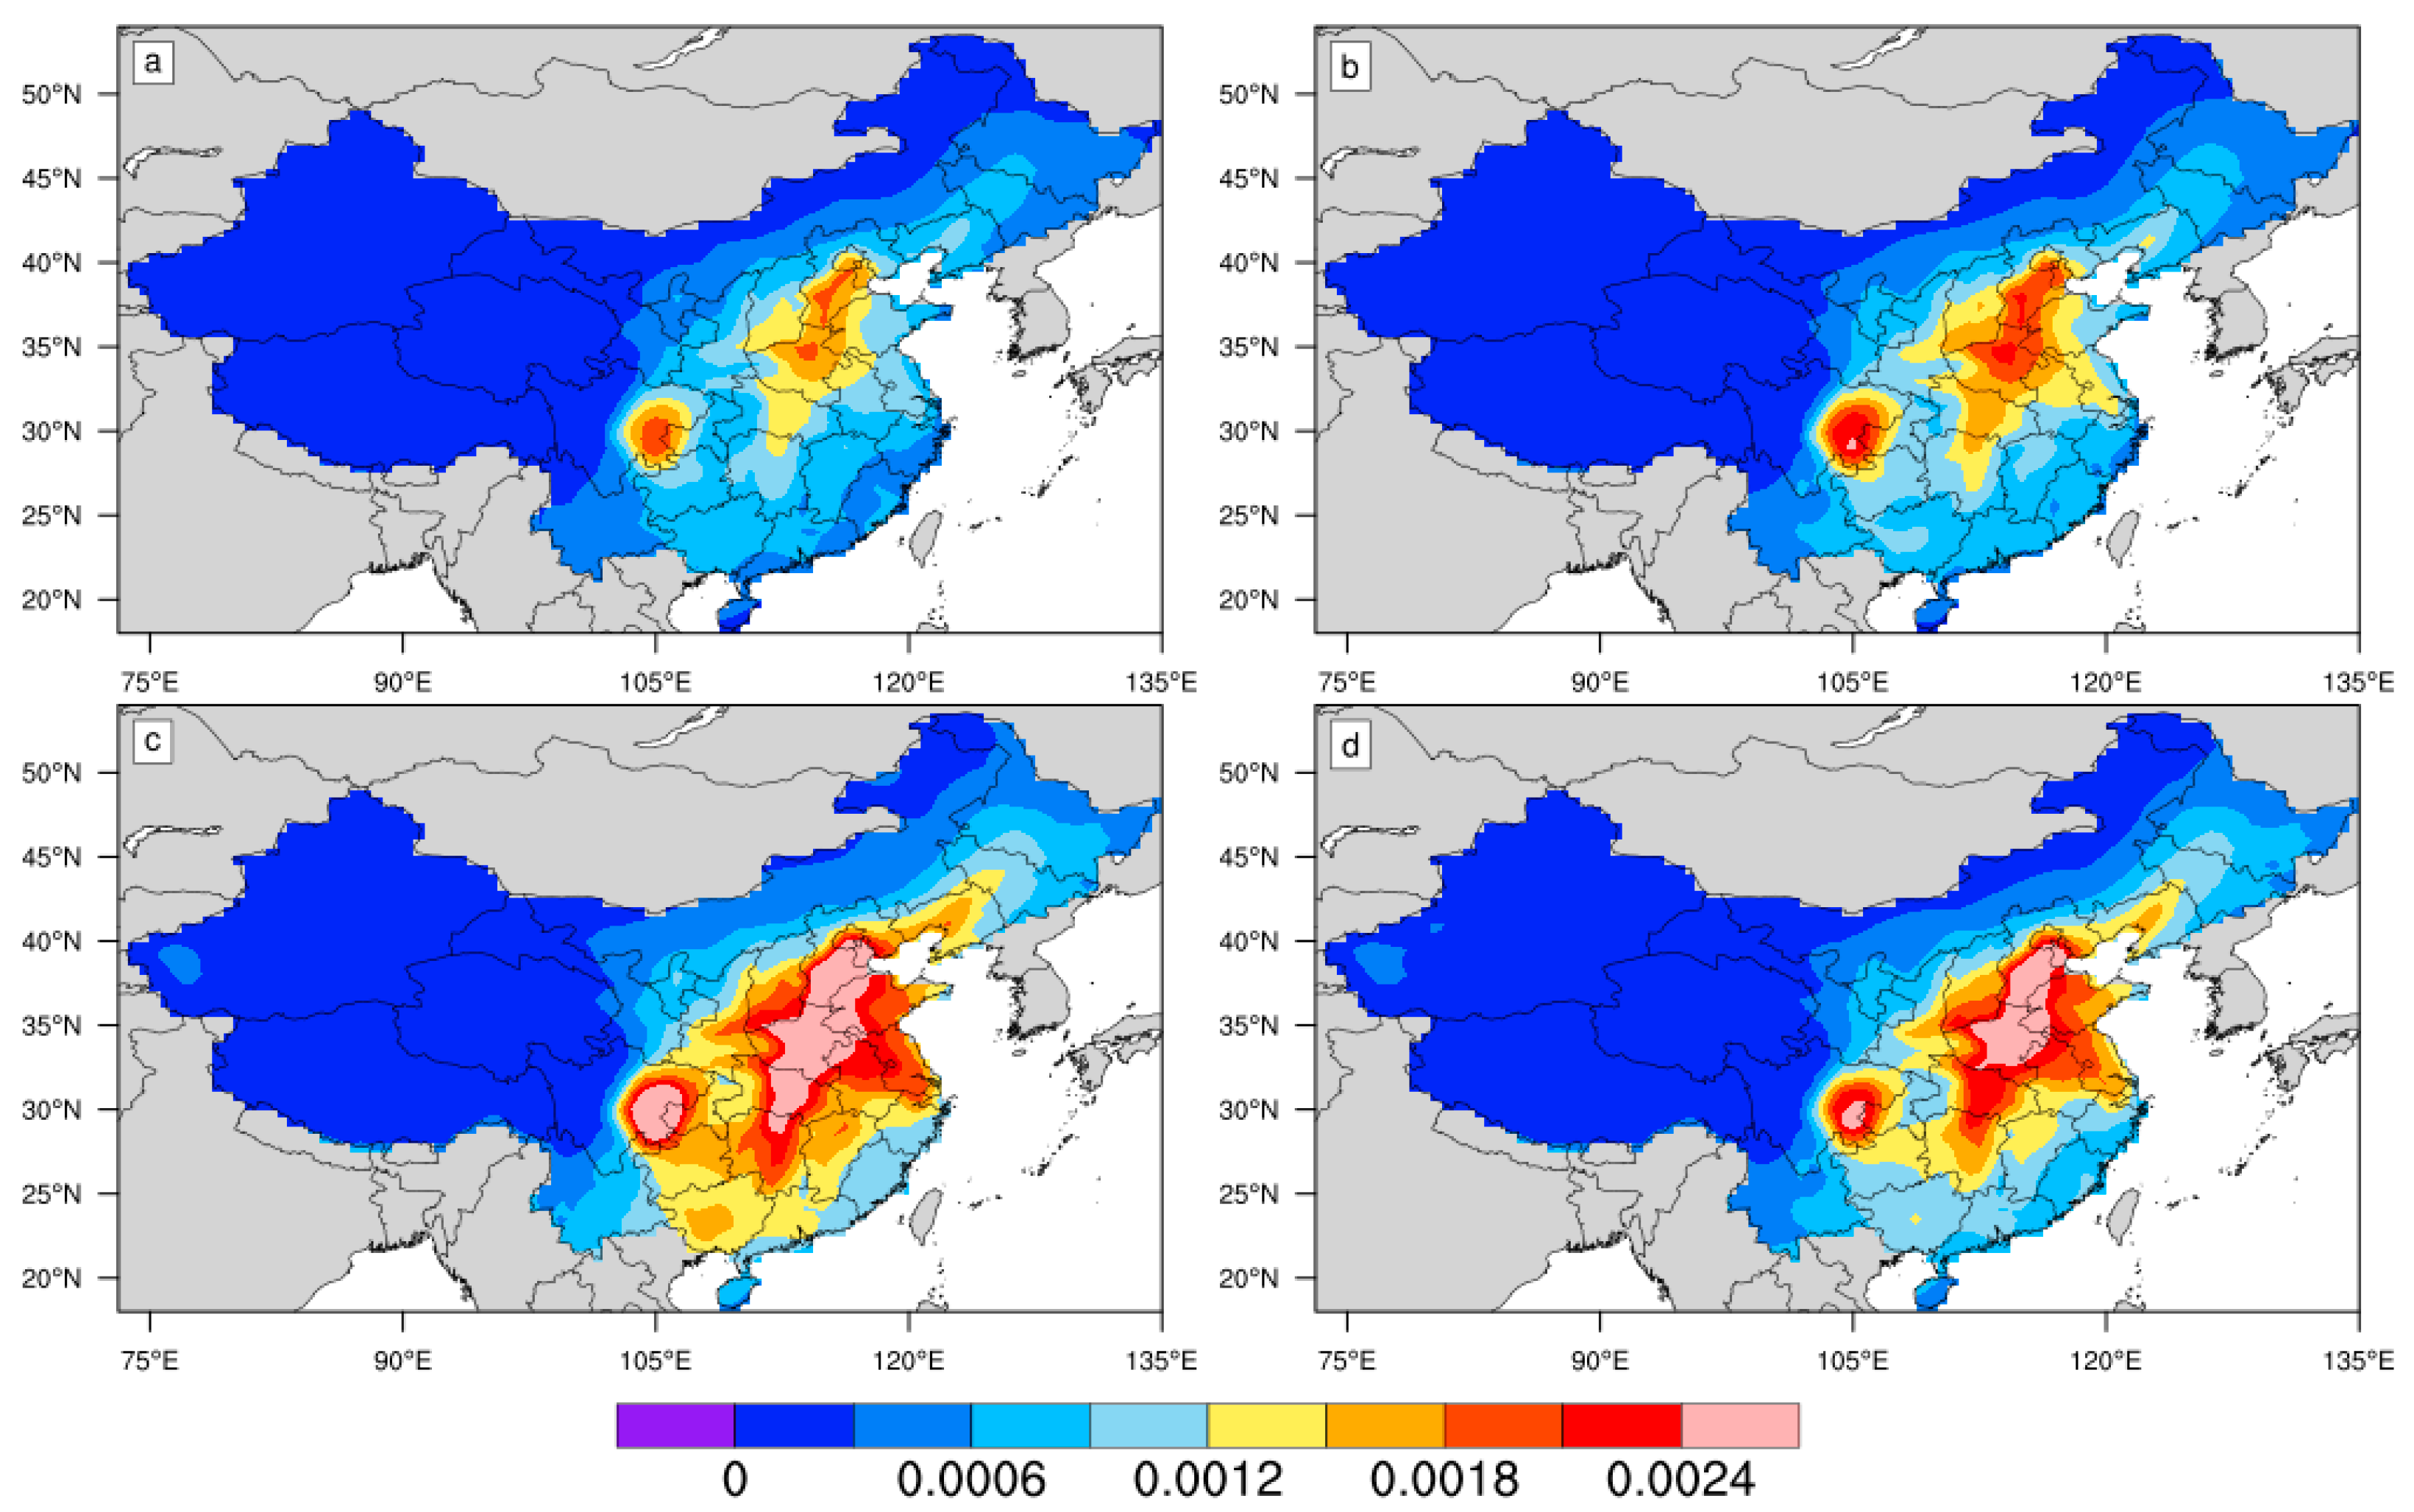
Figure 1. Spatial distributions of dry deposition fluxes of hydrophilic black carbon over mainland China during the periods of 1981–1990 (a), 1991–2000 (b), 2001–2010 (c) and 2011–2020 (d). Unit: μg m−2 s−1.
Atmosphere 14 01114 g001
Figure 2. Comparisons of dry deposition fluxes of hydrophilic black carbon based on the MERRA-2 data with observations over the Tibet Plateau (a), Changbai Mountains (b) and Shanghai (c). Unit: μg m−2 s−1.
Atmosphere 14 01114 g002
Figure 3. Annual variation in dry deposition fluxes of hydrophilic black carbon over China during 1981–2020.
Atmosphere 14 01114 g003
Figure 4. Monthly (a) and seasonal (b) variations in hydrophilic black carbon dry deposition flux over China for different decades from 1981 to 2020.
Atmosphere 14 01114 g004
Figure 5. Correlations of monthly average hydrophilic black carbon dry deposition flux with air temperature (a), surface wind speed (b), surface black carbon concentration (c), and black carbon column mass density (d) over China from 1981 to 2020.
Atmosphere 14 01114 g005
Figure 6. Spatial distributions of dry deposition velocities of hydrophilic black carbon over mainland China during the periods of 1981–1990 (a), 1991–2000 (b), 2001–2010 (c) and 2011–2020 (d). Unit: m s−1.
Atmosphere 14 01114 g006
Figure 7. Annual (a), monthly (b) and seasonal (c) variations in hydrophilic black carbon dry deposition velocity over China from 1981 to 2020.
Atmosphere 14 01114 g007
Figure 8. Annual variations in dry deposition velocity of hydrophilic black carbon over the Beijing-Tianjin-Hebei region (a), Yangtze River Delta (b), Pearl River Delta (c) and Tibet Plateau (d) of China from 1981 to 2020.
Atmosphere 14 01114 g008
Figure 9. Monthly variations in dry deposition velocity of hydrophilic black carbon over the Beijing-Tianjin-Hebei region (a), Yangtze River Delta (b), Pearl River Delta (c) and Tibet Plateau (d) of China from 1981 to 2020.
Atmosphere 14 01114 g009
Figure 10. Seasonal variations in dry deposition velocity of hydrophilic black carbon over the Beijing-Tianjin-Hebei region (a), Yangtze River Delta (b), Pearl River Delta (c) and Tibet Plateau (d) of China from 1981 to 2020.
Atmosphere 14 01114 g010
Figure 11. Correlations of dry deposition velocity of hydrophilic black carbon with air temperature (a) and surface wind speed (b).
Atmosphere 14 01114 g011
Disclaimer/Publisher’s Note: The statements, opinions and data contained in all publications are solely those of the individual author(s) and contributor(s) and not of MDPI and/or the editor(s). MDPI and/or the editor(s) disclaim responsibility for any injury to people or property resulting from any ideas, methods, instructions or products referred to in the content.