Article

Is There a Relationship between Increased Land-Use Intensity and the Rise in PM2.5 Pollution Levels in the Yangtze River Economic Belt, China (2000–2021)?

1
School of Public Administration and Policy, Renmin University of China, Beijing 100872, China
2
School of Marxism Studies, Chongqing University, Chongqing 400044, China
*
Author to whom correspondence should be addressed.
Atmosphere 2023, 14(7), 1097; https://doi.org/10.3390/atmos14071097
Submission received: 18 June 2023 / Revised: 27 June 2023 / Accepted: 28 June 2023 / Published: 30 June 2023
(This article belongs to the Section Biosphere/Hydrosphere/Land–Atmosphere Interactions)

Abstract

:
With the rapid urbanization and industrialization of the past few decades, environmental issues have become increasingly prominent, and air pollution in the form of PM2.5 has become a major concern in China. The Chinese government has recognized the severity of these environmental challenges and has placed great emphasis on protecting the environment while promoting economic growth. This study utilizes remote sensing technology to analyze the spatio-temporal evolution characteristics of the decoupling between land-use intensity and PM2.5 in the Yangtze River Economic Belt (YREB) using 2000–2021 series of PM2.5 and land-use-change data, with the Mean Center Change analysis and the Tapio Decoupling Model. This study attempts to analyze the causes of change from the perspectives of economic development stage and policy execution. The study found that the average PM2.5 level decreased by 11.77 μg/m3 during this period, with high levels concentrated in urban areas and low levels found in less developed regions. The central trajectory of the land-use intensity shifted southeast, indicating a consistent trend in urbanization and industrialization in that direction. Meanwhile, the average land-use intensity value increased by 0.19, with the highest values concentrated in urban areas. A total of 71.12% of the regions in the YREB exhibited strong negative decoupling or negative decoupling between land-use intensity and PM2.5 levels, suggesting rapid urbanization and industrialization with a decrease in PM2.5 levels. These findings provide insight into the dynamic relationship between economic development, urbanization, and PM2.5 in China’s Yangtze River Economic Belt.

1. Introduction

From the beginning of China’s reform and opening-up policy in 1978, China has undergone rapid urbanization and industrialization, which has led to significant economic growth and development. However, it has also resulted in severe environmental problems, such as air, soil and water pollution [1,2,3], land degradation [4], biodiversity loss [5], heavy metal contamination [6], and climate change [7], particularly in the form of air pollution. One of the key pollutants is PM2.5, which consists of fine particulate matter with diameters of 2.5 μm or less [8,9]. PM2.5 refers to fine particulate matter that is less than or equal to 2.5 μm in diameter. Its components include sulfates, nitrates, carbon, organic compounds, and metals, all of which can have negative effects on human health, particularly on the respiratory and cardiovascular systems [10]. In summary, studying trends in PM2.5 levels is important for protecting public health, evaluating environmental policies, and sustainable development.
China is currently considered to be one of the most heavily polluted areas in the world in terms of PM2.5 pollution. Approximately 40% of the global total of premature deaths caused by prolonged exposure to polluted air occur in China, where over 1.3 million people die prematurely each year [11]. The regions in China with the higher concentrations of PM2.5 were primarily located in the central, eastern, and other areas, such as Beijing–Tianjin–Hebei Region, the Huang-Huai-Hai Plain, Lower Yangtze River Delta Plain, Sichuan Basin, and Taklimakan Desert, and there was a noticeable trend in the concentrations shifting towards the east [12,13,14,15]. Previous studies on the sources of PM2.5 have found that vehicle exhausts [16,17], industrial processes [18,19], and coal/biomass combustions [20,21] are the main sources. Additionally, previous studies have found that meteorological factors [22] influenced the regional PM2.5 pollution levels, such as humidity [23], temperature [24], wind speed [25], surface pressure [26], atmospheric circulation [27], wind direction [28], and air movement patterns [29,30].
Land-use change has significant impacts on various inter-regional aspects such as material cycles, energy flows, climates, and biodiversities. This is primarily because it alters the quantity, structure, and type of land use, resulting in changes to vegetation, soil properties, nutrient cycling, and water availability [31,32,33,34]. Quick urbanization and industrialization have resulted in changes in land-use structures and functions, where a significant amount of farmland and forest land have been developed into artificial surfaces, with an increase in residential and industrial land-use types [35,36]. This is especially true in the core economic regions such as the Beijing–Tianjin–Hebei region, Yangtze River Delta, Pearl River Delta, and Chengdu–Chongqing areas [37,38]. The pattern of regional land use is directly affected by urbanization and industrialization, which, in turn, has an indirect impact on the level of PM2.5 pollution [39,40]. Different land-use types will directly affect the distribution of PM2.5 in different degrees [41,42]. For example, the construction of factories, houses, roads, and stores has been shown to increase air pollution levels, whereas the presence of lakes, wetlands, and green spaces can reduce such levels, according to studies [43,44,45]. Changes in the landscape can affect climate change and thus regional PM2.5 levels [46]. The common research methods for studying land use include land-use quantity change, land-use pattern change, land-use dynamic degree, transfer matrix, and land-use intensity [47,48,49,50].
Most of the existing studies on the influence of land-use change on PM2.5 focus on the influence of land-use type, land-use quantity, and land-use pattern on PM2.5. However, these studies lack the decoupling analysis of more sensitive land-use intensity [51] on PM2.5, especially the panel analysis of high-precision data over a long period of time. The decoupling analysis method can be used to analyze the response relationship between two or more elements and can effectively reveal the extent of the impact of land-use change on PM2.5. In this study, based on PM2.5 and land-use-change data, we investigate the level of decoupling between more sensitive land-use intensity and PM2.5 in the YREB during 2000–2021. Hoping to inform the sustainable development of the YREB, hoping to inform the sustainable development of the YREB.

2. Materials and Methods

2.1. Study Area

The YREB spans three regions in eastern, Central and Western China, which is one of the “three strategies” implemented by the central government. The YREB (97°21′–123°10′ E, 21°08′–35°20′ N) includes 11 provinces and cities, including Shanghai, Jiangsu, Zhejiang, Anhui, Jiangxi, Hubei, Hunan, Chongqing, Sichuan, Yunnan, and Guizhou, with a total area of about 2,052,300 km2 (Figure 1). The three core urban agglomerations, namely, the Chengdu–Chongqing Urban Agglomerations (CCUA), the Mid-Yangtze River Urban Agglomerations (MYRUA), and the Yangtze River Delta Urban Agglomerations (YRDUA) are linked by Yangtze River waterway (Figure 1). The gross domestic product (GDP) of YREB increased notably over the same period (2000–2021), from 4.05 trillion to 53.20 trillion CNY, and the resident population (year-end) increased from 5.52 billion to 6.06 billion people. The Development Plan Outline of the YREB aims to utilize the golden waterway of the Yangtze River and the core roles of Shanghai, Wuhan, and Chongqing, along with other major cities along the river, to construct a green development axis along the Yangtze River. The CCUA, the MYRUA, and the YRDUA will leverage the radiating effects of their central cities to drive economic development and innovation in the surrounding regions. The YREB is one of the regions with the most rapid economic growth and is very crucial to China’s modernization process from a strategic standpoint. The rapid economic growth of the region is accompanied by increases in environmental pollution, land-use imbalances, and other problems, especially in urban agglomerations [12,13,14,15]. Therefore, the YREB, a major national strategic development area, is used as the study area, and the study of the response of PM2.5 pollution to land-use change is beneficial to promoting regional sustainable development.

2.2. Data Sources

PM2.5 data were downloaded from https://weijing-rs.github.io/product.html (accessed 6 January 2023), with a cell size of 1000 m × 1000 m, and the time span was from 2000 to 2021 [52,53]. Land-use/cover maps data included nine land-use/cover types as follows, cropland, forest, shrub, grassland, water, snow/ice, barren, impervious, and wetland, with a cell size of 30 m × 30 m, downloaded from https://zenodo.org/record/5816591#.Y-si3HZBxPZ (accessed on 6 January 2023), and the time span was from 2000 to 2021 [54]. The scope of this paper’s research was centered on the county level, specifically in measuring PM2.5 as an average value and calculating land-use data at the same level.

2.3. Methods

2.3.1. Land-Use Intensity (LUI)

Land-use intensity (LUI) encompassed the extent of human activity and development taking place in a specific land area [51]. It gauged the level of utilization and intensity with which the land was used for different endeavors, including agriculture, urbanization, industry, and conservation [55,56]. The concept of land-use intensity takes into account factors such as population density, infrastructure development, resource extraction, and ecological impact [57,58]. Li, Wu, Gong, and Li [51] assigned the score as more sensitive based on the assignment of Zhuang and Liu [55], who assigned a score of 10 to built-up land and a score of 7 to cropland. Due to the difference in the classification of land-use types, we assigned a score of 10 to impervious, a score of 7 to cropland, and a score of 0 to other land-use types based on the study of Li, Wu, Gong, and Li [51]. The equation is as follows:
L U I = i = 1 n S i i = 1 n S i × D i
where LUI is the LUI of a region; Si is the area of land-use type i; Di is the score of land-use type i.

2.3.2. Mean Center Change

The mean center change is a spatial analysis technique used to investigate changes in the central location of a set of geographic features over time [59]. The method involves calculating the mean center of a set of features at two or more points in time and then comparing the resulting mean centers to determine how they have shifted. It is commonly used in fields such as urban planning, environmental science, and sociology to study changes in the spatial distribution of various phenomena [60,61]. It can assist us in this study in gaining understanding of the changing patterns of PM2.5 and LUI. Please refer to Arc Gis 10.8 software for the details of the mean center change tool.

2.3.3. The Tapio Decoupling Model

The Tapio method, also known as the Tapio Decoupling Model, is a statistical technique widely utilized across multiple domains such as agriculture, transportation, energy, construction, and carbon emissions [62,63]. This model was created by Tapio in 2005, and it classifies decoupling into three different states and eight levels of decoupling (Table 1) [64]. This study utilized the Tapio Decoupling Model to explore the correlation between LUI and PM2.5 through a decoupling analysis. The equation is as follows:
D I t 1 t 2 = % L U I % M P M 2.5 = ( L U I t 2 L U I t 1 ) / L U I t 1 ( M P M 2.5 t 2 M P M 2.5 t 1 ) / M P M 2.5 t 1
where DIt1−t2 is the decoupling index; LUIt1 and LUIt2 are the LUI in years t1 and t2; MPM2.5t1 and MPM2.5t2 are the mean PM2.5 at county level in years t1 and t2.

3. Results

3.1. Spatial and Temporal Change Characteristics of PM2.5

3.1.1. PM2.5 Time Change Trend

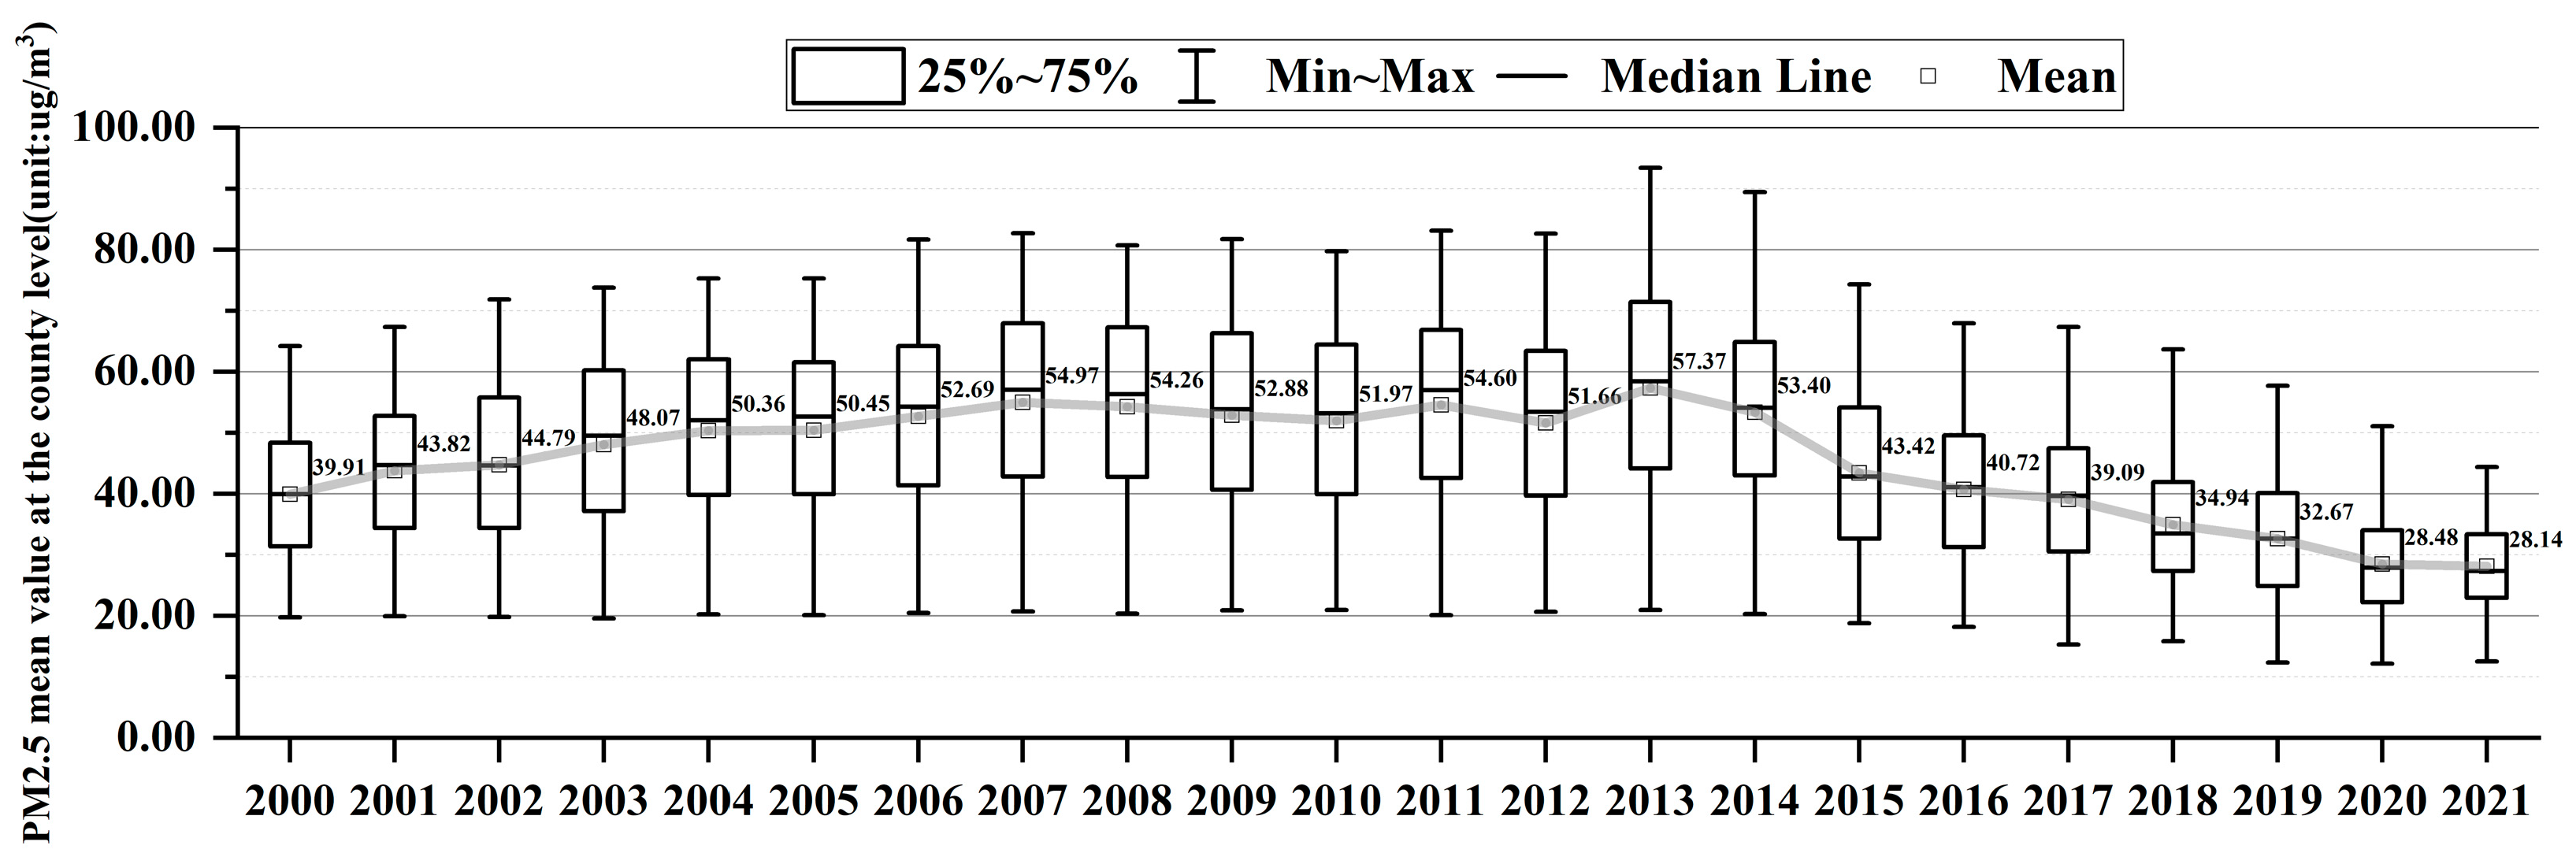
Figure 2 shows the trend in PM2.5 values at the county level in the YREB, including the maximum, minimum, median, mean, and range of 25–75% during 2000–2021. The trends in PM2.5 maximum, minimum, median, mean, and range of 25–75% exhibited fluctuations over the period of 2000–2021. Specifically, there was a gradual increase from 2000 to 2007, followed by an insignificant change during 2007–2012. However, from 2013 to 2021, there was a significant reduction in the aforementioned parameters. During the entire period of 2000–2021, the trends in PM2.5 maximum, minimum, median, mean, and range of 25–75% displayed a downward trajectory. As can be seen from Figure 2, the mean value of PM2.5 decreased by 11.77 μg/m3 from 39.91 μg/m3 to 28.14 μg/m3 during the entire period of 2000–2021. This suggested an overall improvement in air quality in the given location during this period. However, the changes in PM2.5 levels were not consistent throughout the entire period. In the initial period of 2000–2007, the mean value of PM2.5 increased from 39.91 μg/m3 to 54.97 μg/m3 by 14.79 μg/m3. This was followed by a decrease from 54.97 μg/m3 to 51.97 μg/m3 by 3 μg/m3 during 2007–2010. Subsequently, there was a further decrease in the mean value of PM2.5 from 54.60 to 51.66 by 2.94 μg/m3 during 2011–2012. The most significant decrease in PM2.5 was observed during 2013–2021, when the mean value decreased from 57.37 μg/m3 to 28.14 μg/m3 by 29.23 μg/m3. The trend in decreasing range in the minimum to maximum values of PM2.5 after 2013. The trends in PM2.5 maximum, minimum, and range of 25–75% exhibited significant reductions after 2013. This suggested that efforts to reduce particulate matter emissions had been successful in mitigating air pollution levels, especially after the Eighteenth National Congress of the CPC. The most significant decrease in PM2.5 levels during 2013–2021 could have been attributed to a combination of factors, including emphasis on green economy development, stricter ecological protection quality regulations, increased use of clean energy sources, and technological advancements in emission reduction measures.
Figure 3 displays the maximum, minimum, median, mean, and range of 25–75% of PM2.5 values at the county level in CCUA, MYRUA, and YRDUA from 2000–2021, providing a simple visual comparison of these trends between the three core urban agglomerations.
From 2000–2013, through a comprehensive examination of the mean, maximum, and 25–75% range of PM2.5 values (Figure 3), it was observed that the CCUA had higher PM2.5 levels compared to the other two urban agglomerations, except for the years 2004 and 2012. Specifically, in the majority of districts and counties within the CCUA, PM2.5 levels were higher than those in the majority of districts and counties within the MYRUA and YRDUA. With the exception of 2002, the PM2.5 levels in three-quarters of the urban agglomerations in the MYRUA area were higher than those in three-quarters of the YRDUA region. In other words, the higher levels of PM2.5 pollution in most of the MYRUA region compared to most of the YRDUA region, except for 2002, suggested that air quality was generally worse in the former region during this time period. By comparing the range of minimum–maximum of PM2.5 values among the three urban agglomerations, it could be observed that the PM2.5 levels were more concentrated in the YRDUA when compared to the CCUA and the MYRUA; the MYRUA ranked second in the range of minimum–maximum of PM2.5 values, followed by the CCUA, which showed a more dispersed pattern. By comparing the minimum and maximum of PM2.5 value variations among the three urban agglomerations, it could be observed that the CCUA experienced higher levels of PM2.5 pollution than the MYRUA and YRDUA, but the minimum PM2.5 levels in the CCUA were consistently lower than those in the other two city groups, with the exception of 2009, 2011, 2012, and 2013. The maximum PM2.5 levels in the MYRUA were generally higher than those in the YRDUA; however, the lowest PM2.5 levels in the MYRUA and YRDUA alternated with each other.
From 2014–2021, there were notable reductions in the mean, maximum, and minimum levels of PM2.5, as well as the 25–75% range, across the three core urban agglomerations within the YREB, indicating a marked improvement in air quality (Figure 3). The analysis of PM2.5 mean change levels among the three urban agglomerations indicated that the CCUA had generally lower PM2.5 levels than the MYRUA in most years between 2014 and 2021, except for the years 2016, 2018, and 2021. In contrast, the CCUA had higher PM2.5 levels than the YRDUA in most years between 2014 and 2021, except for the years 2015 and 2019. Moreover, the MYRUA generally had higher PM2.5 levels than the YRDUA in most years between 2014 and 2021, except for the years 2015 and 2018. This suggested that the PM2.5 levels varied significantly between the different urban agglomerations, which could have been due to differences in geographic location, climate, and human activities, among other factors. By analyzing the maximum and minimum values of PM2.5 pollution in three urban agglomerations, it was found that the MYRUA had significantly higher maximum levels of PM2.5 pollution compared to the CCUA and the YRDUA, but the minimum pollution level of PM2.5 in the CCUA was significantly lower than that in the MYRUA and the YRDUA, with an exception in 2016. By comparing the range of 25–75% of PM2.5 values among the three urban agglomerations, it could be observed that the PM2.5 levels were more concentrated in the CCUA when compared to the YRDUA and the MYRUA; the YRDUA ranked second in the range of 25–75% of the PM2.5 values, followed by the MYRUA, which showed a more dispersed pattern.

3.1.2. Spatial Distribution Characteristics of PM2.5

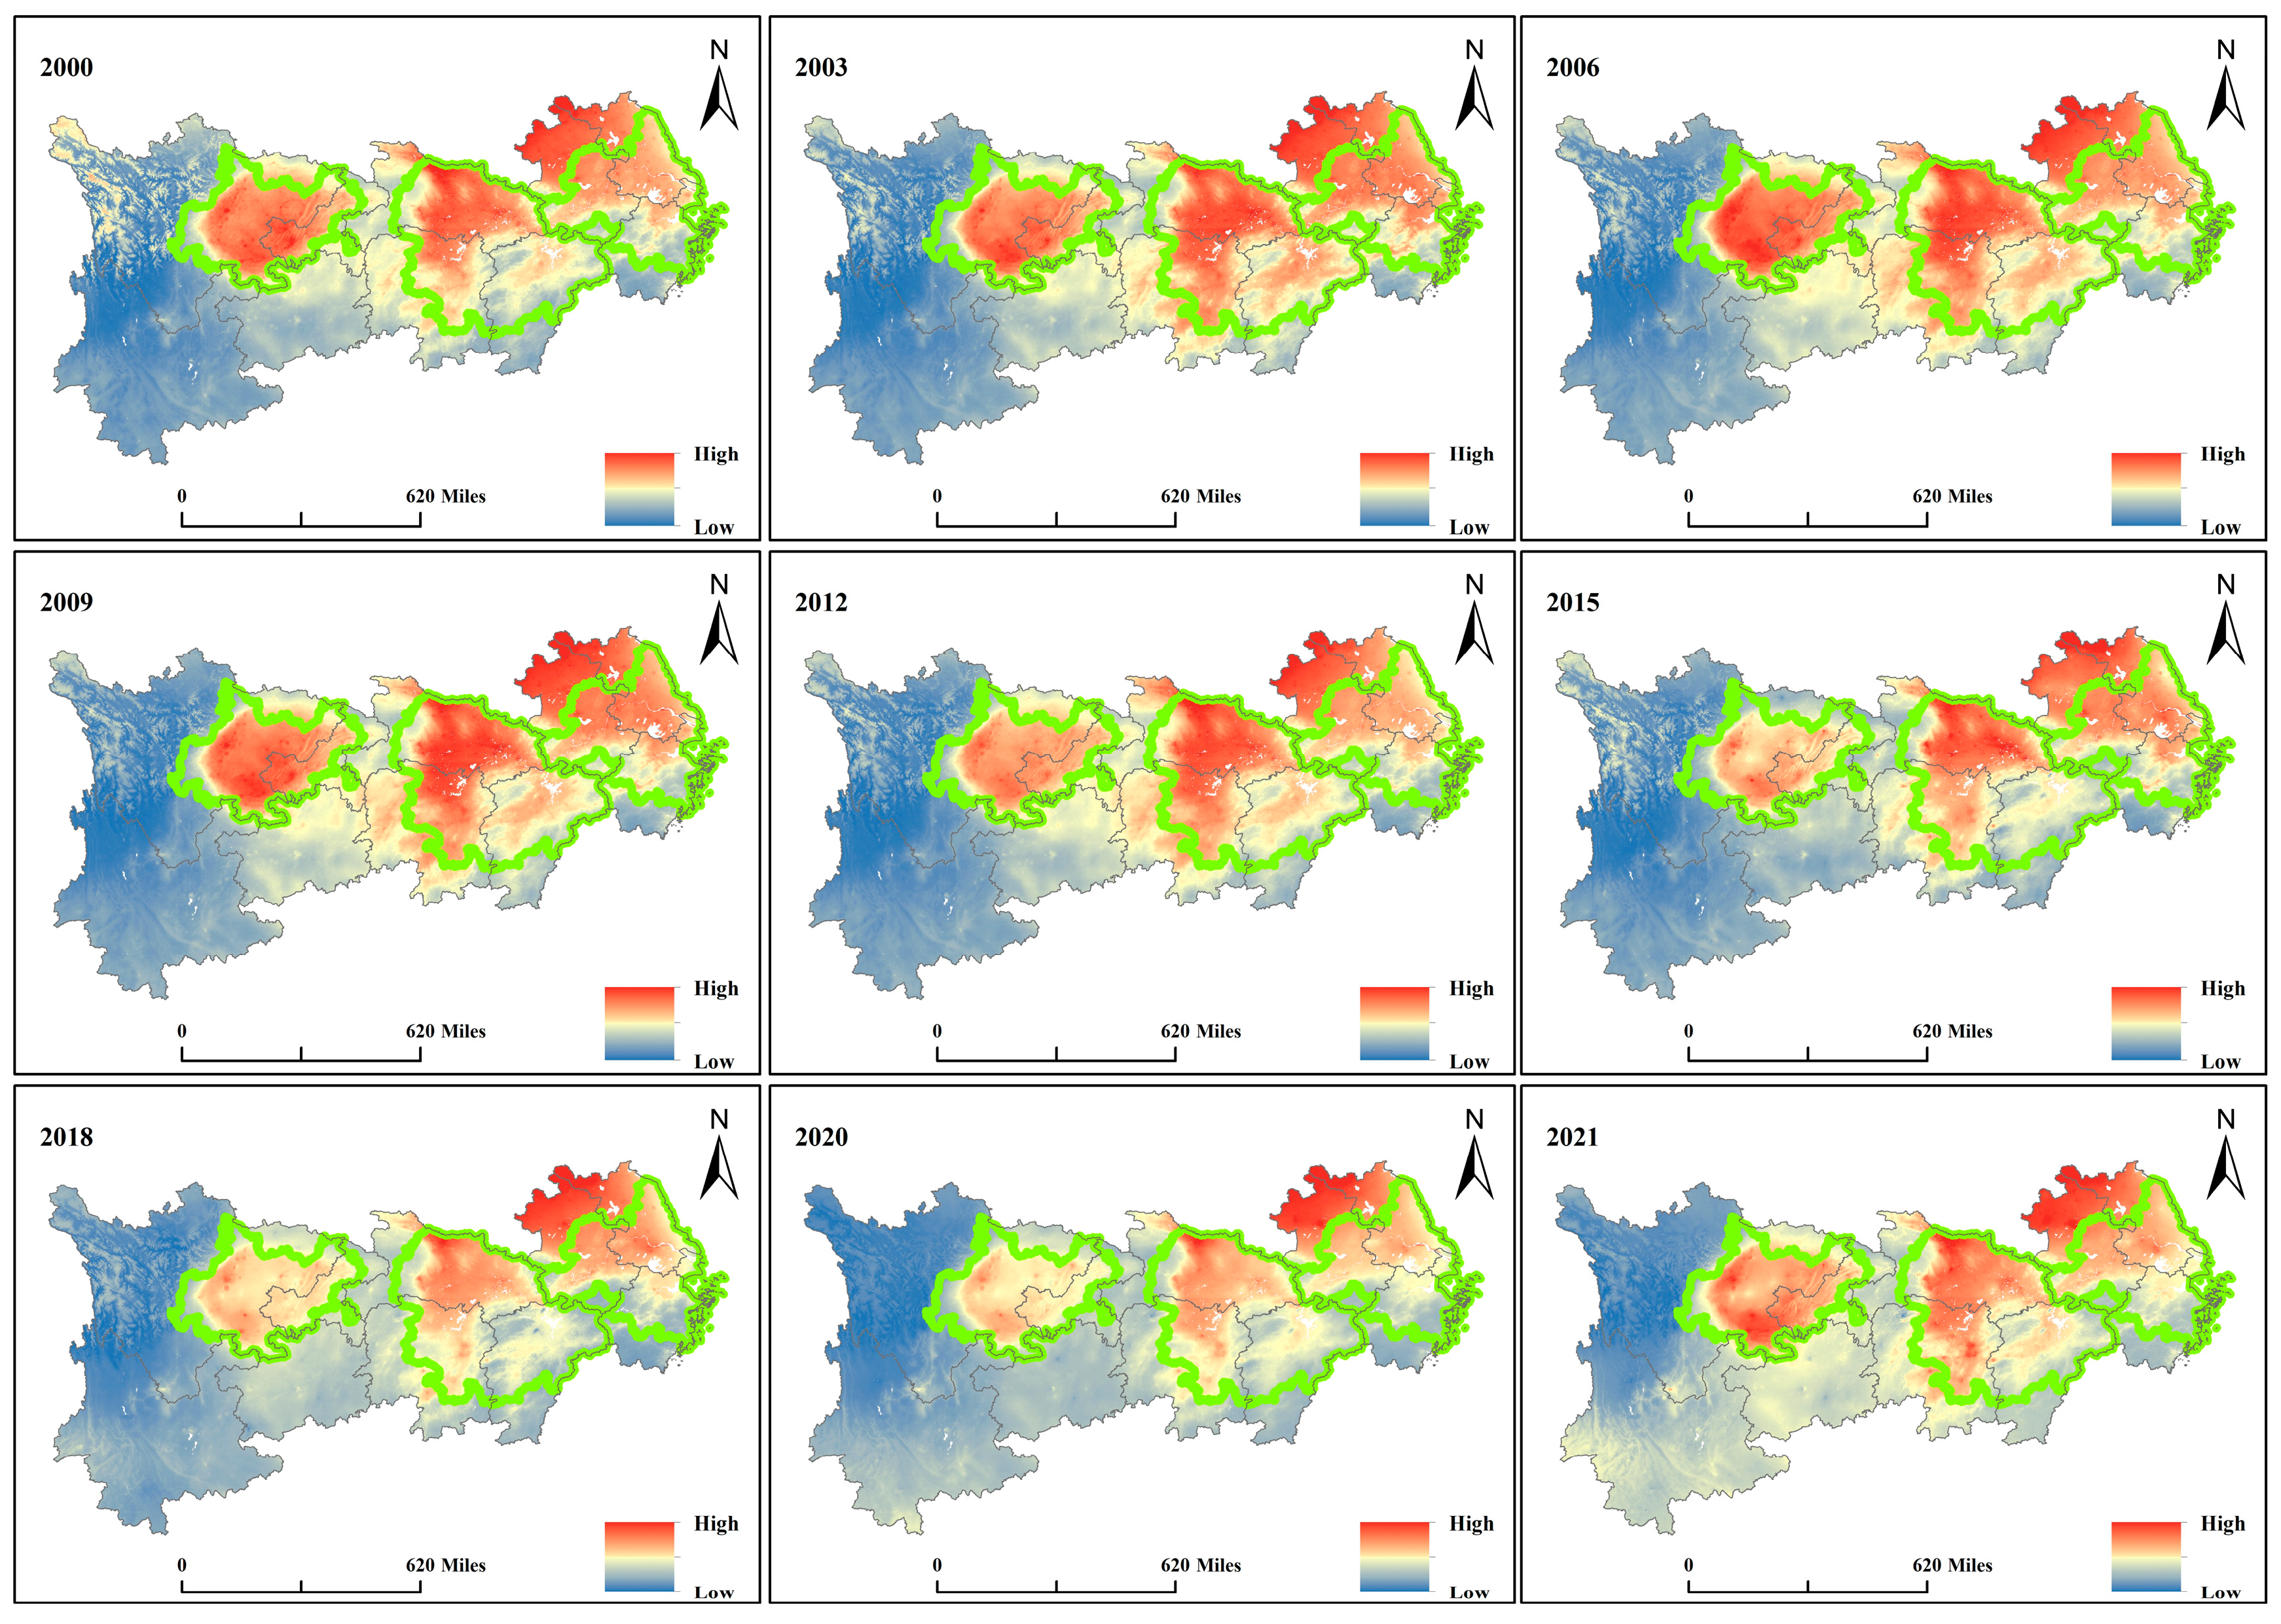
The spatial distribution of average PM2.5 during the research period of 2000–2021 is shown in Figure 4 (due to the page limitation, only pictures from the past 9 years are displayed). The high value of PM2.5 is mainly distributed in the three major urban agglomerations, which also include the whole area of Jiangsu and Anhui. These areas are economically developed areas of the YREB. In contrast, low PM2.5 values are mainly distributed the Yunnan, Guizhou, and western Sichuan plateau areas with low population densities and relatively unconventional economic developments.
The CCUA is characterized by a dense concentration of industrial activities, encompassing various heavy industries such as steel, cement, chemical manufacturing, and coal-fired power plants. These industries emit large amounts of pollutants, including PM2.5, into the air, contributing to the high levels of pollution in the regions. Furthermore, the topography of the CCUA, enclosed by mountains, can impede the dispersion of pollution, resulting in its accumulation within the region. Similarly, the MYRUA, including Wuhan, Changsha, and Nanchang, among others, is also home to numerous industries, transportation hubs, and a large population. The region is one of the most densely populated areas in China and is home to many large industrial centers, which are major sources of PM2.5 emissions. The MYRUA has a high density of vehicles on the road, and these vehicles emit pollutants such as nitrogen oxides, sulfur oxides, and particulate matter. In addition, the MYRUA’s geography, with mountains to the south and west, can trap pollutants and prevent them from dispersing, leading to high levels of pollution. The YRDUA is highly industrialized and densely populated, which has contributed to the high levels of PM2.5 pollution in the area. One major factor is the large number of factories and power plants in the area. These facilities emit pollutants such as sulfur dioxide, nitrogen oxides, and particulate matter, which contribute to the formation of PM2.5. The above indicates that the PM2.5 distribution pattern roughly aligns with the population and economic distribution pattern, except for natural conditions, suggesting a strong influence of human socio-economic activities on the concentration of PM2.5.
To address the problem of PM2.5 pollution in the YREB, the Chinese government has implemented a range of measures, including emphasis on green economy development, stricter ecological protection quality regulations, stricter emissions standards for vehicles and factories, promoting the use of clean energy sources, and investing in public transportation infrastructure. The government has also imposed temporary measures such as factory closures and traffic restrictions during times of high pollution. Despite the most significant decrease in PM2.5 levels after 2013, there are still challenges to reducing PM2.5 pollution in the region. For example, the implementation and enforcement of emissions standards can be challenging, and there is also a need to address the issue of pollution from small and medium-sized enterprises, which may not have the resources to comply with regulations. Overall, addressing the problem of PM2.5 pollution in the YREB will necessitate persistent commitment and long-term investment.

3.1.3. Mean Center Change in PM2.5 and LUI

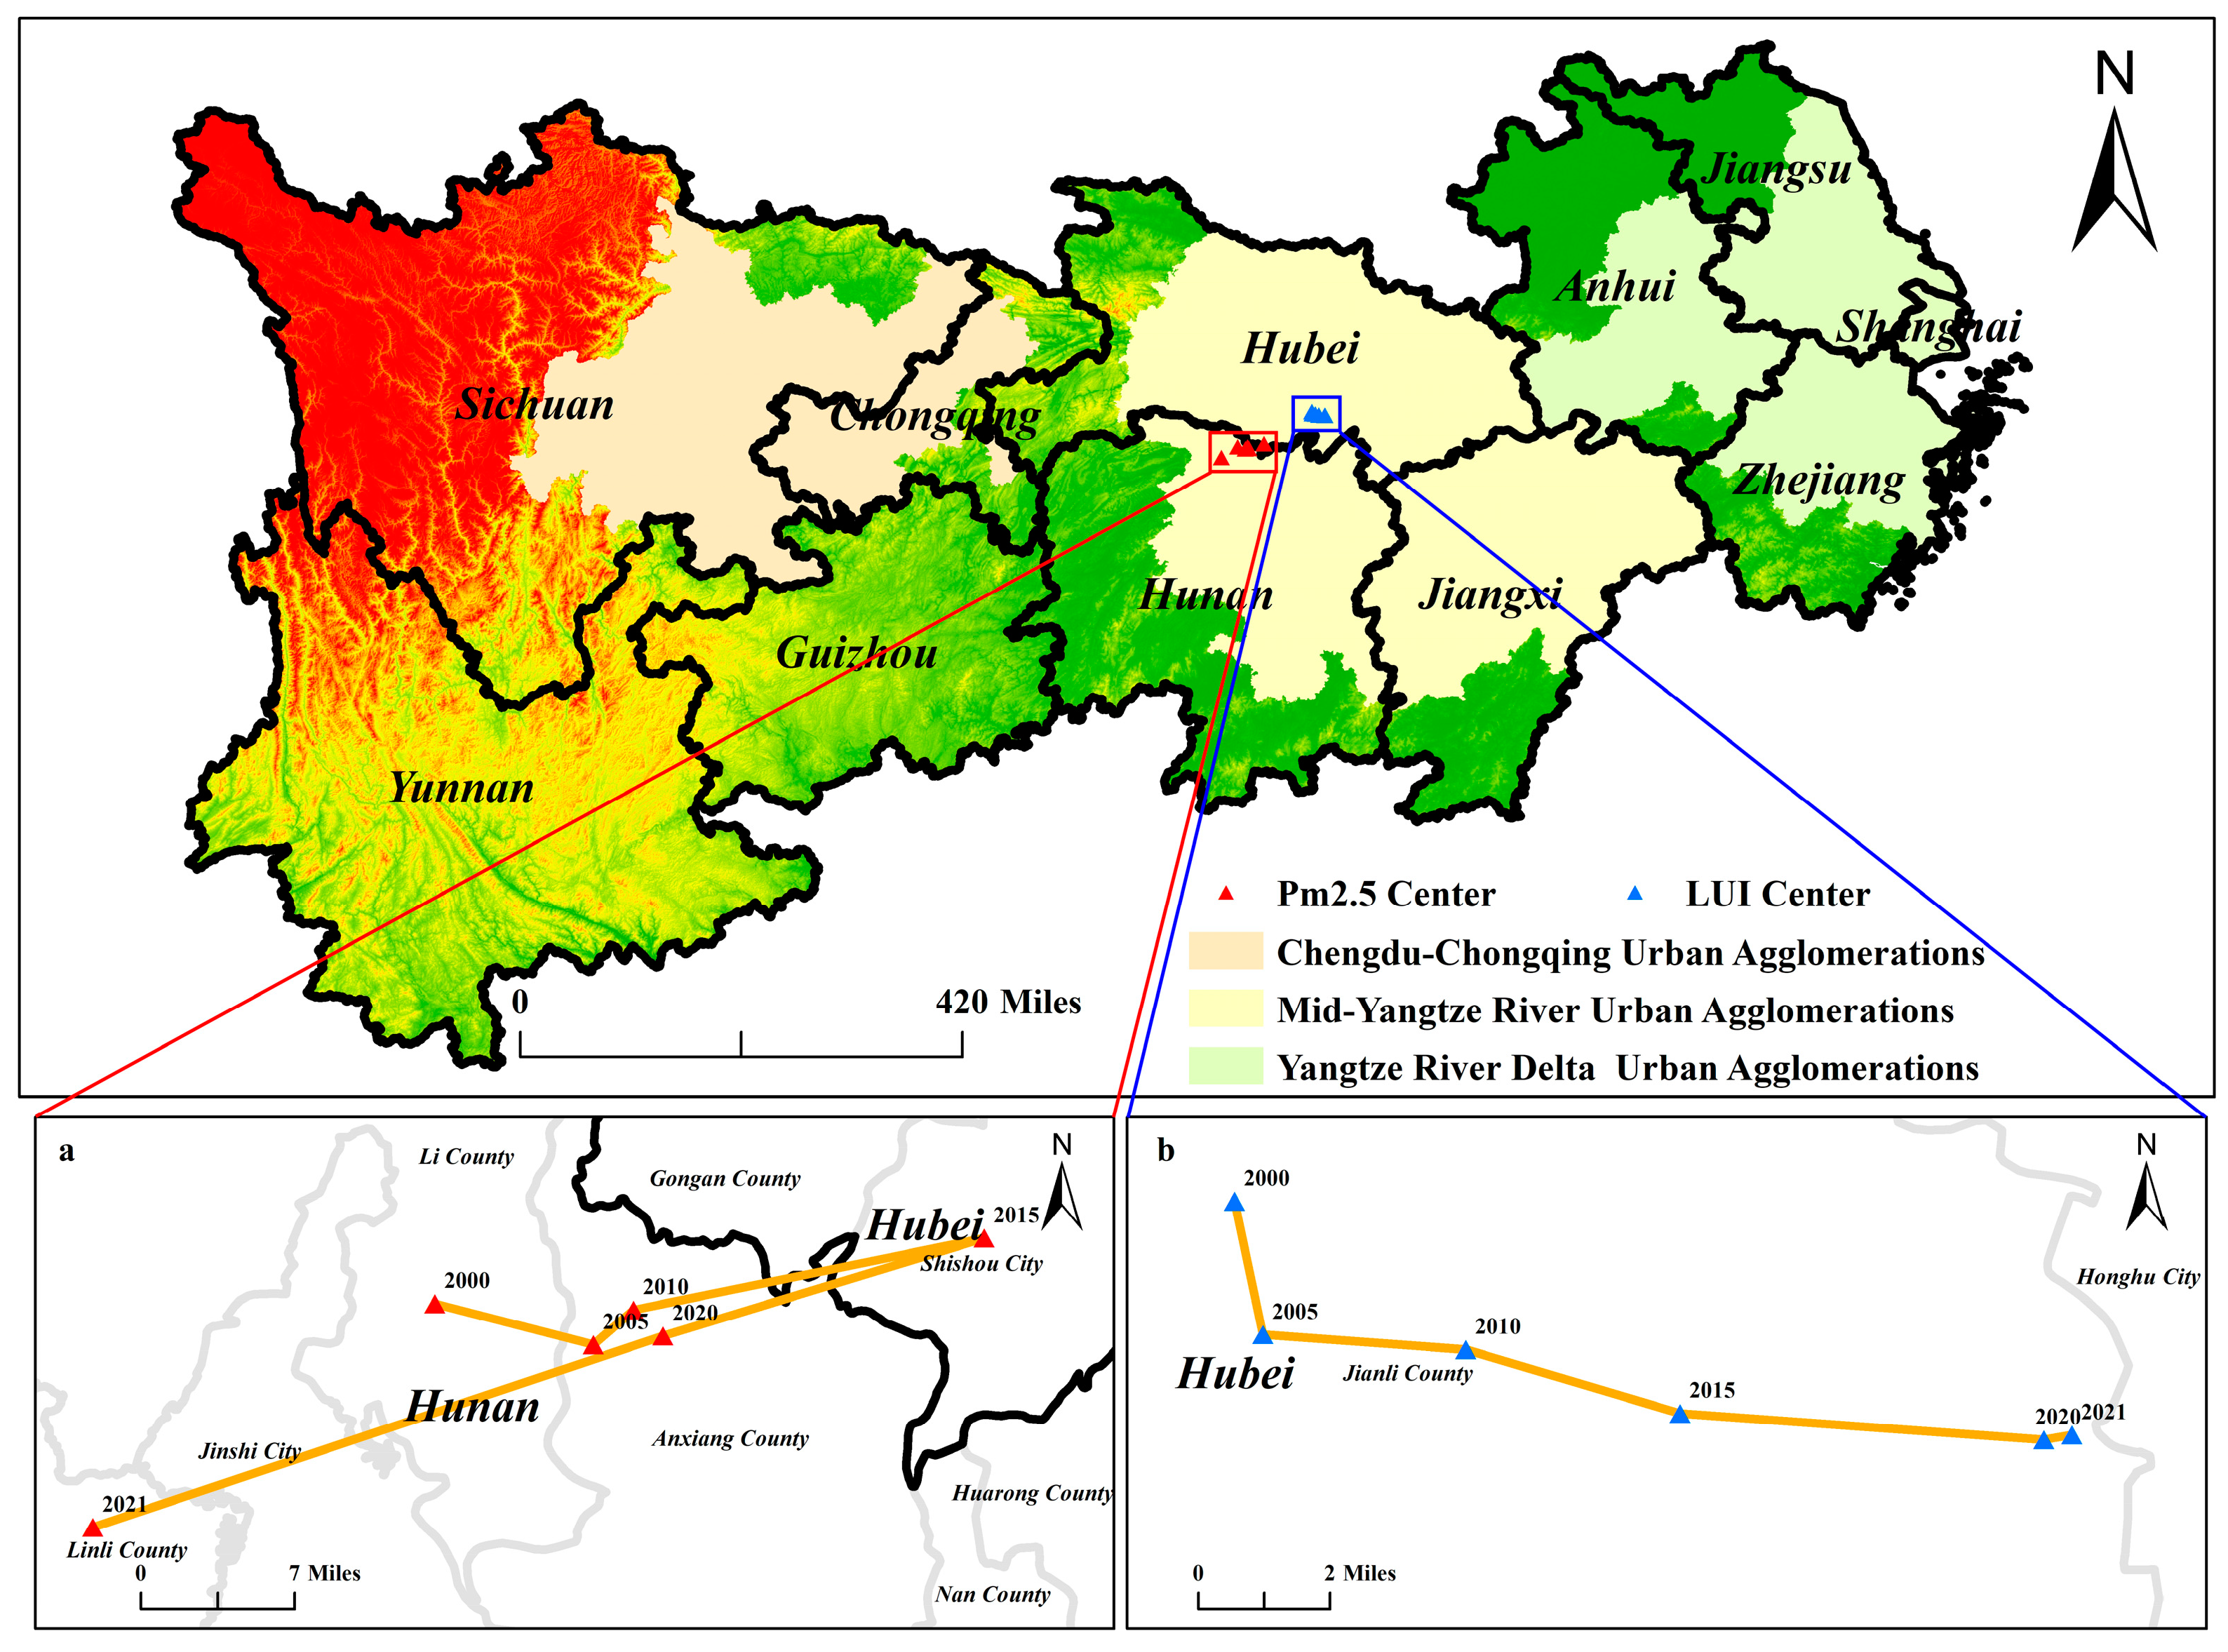
The technique of mean center change was utilized to detect the trend in spatial variation in PM2.5 (Figure 5a) and LUI (Figure 5b). The change in the central track denoted a shift in the direction of PM2.5 and LUI, indicating an increase in air pollution levels and varying degrees of modification in land-use patterns, ranging from severe to moderate.
The PM2.5 centers and central change track (Figure 5a) were located in Hunan and Hubei provinces, with specific locations including Li county in 2000, Anxiang county in 2005, 2010, and 2020, Linli county in 2021, and Shishou City in 2015. The movement of PM2.5 centers were reliable indicators of air quality changes, with reversals in direction suggesting improvements. In the region under study, the levels of air pollution have been subject to fluctuation over the years, and these changes have been reflected in the trajectory of the PM2.5 centers. Specifically, from 2000 to 2005, the PM2.5 centers moved in a southeastward direction, indicating a shift in pollution levels in that direction. From 2005 to 2015, the centers reversed their direction and moved northeastward, suggesting a corresponding change in the levels of air pollution in that region. Between 2015 and 2021, the PM2.5 centers shifted direction again, this time moving northwestward. The PM2.5 centers moved in a northwestward direction for the entire period, indicating that areas in this direction had high levels of air pollution. To better understand the magnitude of these changes, we could examine the size of the distance traveled by the PM2.5 centers. The largest distance traveled was during the period of 2020–2021, indicating a significant increase in pollution levels during that time in northwestern direction. The next largest distance traveled was from 2000 to 2021 in northwestern direction, followed by the period of 2010–2015 in northeast direction, and then 2015–2020 in northwestern direction. The smallest distances traveled were during the periods of 2000–2005 in southeast direction and 2005–2010 in northeast direction, suggesting that pollution levels were relatively stable during those times.
The LUI is a measure of how much land is used for human activities such as agriculture, urbanization, and industrialization. The displacement of LUI centers, which refers to the shift in the location of areas with high LUI, can serve as an effective gauge of the extent to which human activities have impacted an area. The LUI centers and central change tracks (Figure 5b) were located in Jianli County, Hubei Province in 2000, 2005, 2010, 2015, 2020, and 2021. The central spatial trajectory of the LUI shifted southeast in the time periods of 2000–2005, 2005–2010, 2010–2015, 2015–2020, 2020–2021, and 2000–2021. This indicated a consistent trend in human activities such as urbanization and industrialization spreading towards the southeast over time. Furthermore, the magnitudes of the distances of the central LUI trajectories in different time periods were ranked as follows: 2000–2021, 2015–2020, 2010–2015, 2005–2010, 2000–2005, and 2020–2021. This ranking implies that the highest level of change in LUI occurred between 2000 and 2021, which could have been attributed to rapid economic development and urbanization in the region during this time period.

3.2. Spatial and Temporal Change Characteristics of LUI

3.2.1. LUI Time Change Trend

LUI refers to the degree to which land is developed or utilized for different purposes and is an important metric for assessing the impact of human activities on land-use patterns within a given region. This metric can be measured by the amount of land that is developed or used for a specific purpose, as well as the intensity of use per unit of land. The way in which land is utilized and allocated can have significant effects on the sustainability of an area, both environmentally and economically. Inefficient land-use structures, such as urban sprawl and the depletion of natural habitats and open spaces, can result in increased traffic congestion, air pollution, and a decreased quality of life for residents. On the other hand, an efficient land-use structure can promote sustainable development by encouraging mixed-use development, minimizing transportation emissions, and conserving natural resources. Assessing LUI is an important step in developing effective land-use policies that support sustainable development. We can calculate the LUI by using Equation (1).
Figure 6 shows the trend in LUI values at the county level in the YREB, including the maximum, minimum, median, mean, and range of 25–75% during 2000–2021. The mean value of the LUI increased from 3.73 to 3.92 by 0.19, suggesting that there was more construction and development of buildings and infrastructure, leading to a higher intensity of land use. This could have been attributed to various factors such as population growth, urbanization, and increased economic activity in the YREB. The minimum and maximum LUI values were observed within the range of 0 to 10, no significant changes were found in the entire range of values, but the range of 25–75% of the values increased significantly, and the mean value of the LUI was consistently above the median, indicating that there were some areas with very intense land use, such as cities or heavily industrialized regions, whereas most of the other areas had lower levels of LUI. This suggested that some areas within the zone had low levels of development and human activity, whereas others had much higher levels of development and activity. However, the fact that there were no significant changes in the range of values indicated that the level of economic development across the region was uneven, with some areas more developed than others. Areas with lower levels of development may have less access to resources and opportunities, whereas more developed areas may face challenges such as environmental degradation and resource depletion.
Figure 7 provides a clear and simple graphical comparison of the maximum, minimum, median, mean, and range of 25–75% of the LUI values at the county level for CCUA, MYRUA, and YRDUA from 2000 to 2021, facilitating a straightforward comparison of the trends in these three main urban agglomerations.
From 2000 to 2021, the mean value of the LUI in the YRDUA was greater than those in the urban agglomerations, and the CCUA was greater than that in the MYRUA. This meant that the LUI in the YRDUA was consistently high, indicating significant development of land for urban purposes such as residential and commercial areas, industrial parks, and infrastructure. The LUI in the CCUA was higher than that in the MYRUA, suggesting that the former underwent more rapid urbanization and development. However, both of these urban agglomerations had lower LUI values compared to the YRDUA. Within the three main urban agglomerations, the maximum LUI increased across the entire range. However, there were significant increases in the range of 25–75% in the MYRUA and YRDUA, particularly in the YRDUA. There was a significant increase in the LUI values in most regions of the MYRUA and YRDUA. This meant that certain areas of these urban agglomerations experienced marked increases in LUI values over time. The extent of this increase was most pronounced in YRDUA, indicating that this region may have been undergoing more rapid urbanization or development compared to the other regions studied. The median values of the LUI for both MYRUA and YRDUA were consistently higher than their respective mean values. In the MYRUA, the median LUI increased from 4.00 to 4.54, a difference of 0.54, the mean value of the LUI increased from 3.97 to 4.30 by 0.33, and the difference between the median and the mean of the LUI increased from 0.04 to 0.24 by 0.20. Similarly, the median LUI in the YRDUA increased from 5.89 to 6.39, a difference of 0.50, the mean value of the LUI increased from 5.30 to 5.73 by 0.43, and the difference between the median and the mean of the LUI increased from 0.59 to 0.61 by 0.66. The increase in median LUI values in both the MYRUA and YRDUA indicated a trend towards more intensive land-use practices in these regions. This trend may reflect an increasing demand for land resources, growing urbanization, and economic development in the area, and there was a growing disparity or unequal distribution in the level of economic development across the regions. The rise in LUI is a potential cause for concern as it can lead to environmental degradation, loss of natural habitats, and increased pressure on natural resources. The median value of the LUI in the CCUA decreased from 5.93 to 5.72, a decrease of 0.21, and the mean value of the LUI decreased from 5.17 to 5.11 by 0.16, and the difference between the median and the mean of the LUI decreased from 0.75 to 0.61 by 0.14. However, the maximum LUI increased across the entire range, indicating a more uneven regional economic development in this area compared to the other two urban agglomerations. This was related, as Sichuan Province has been focusing on the development of its capital city, Chengdu. To support the urbanization and industrialization of Chengdu, the government of Sichuan Province has invested in infrastructure development including building new highways, expanding public transportation, constructing new housing and commercial complexes, and promoting the development of high-tech industries such as electronics, information technology, and biotechnology. As a result, many people from nearby regions are drawn to Chengdu in search of a better quality of life. This siphoning effect has contributed to the city’s population growth and economic development.

3.2.2. Spatial Distribution Characteristics of LUI

The spatial distribution of the LUI during the research period of 2000–2021 is shown in Figure 8 (due to the page limitation, only pictures from the past 9 years are displayed). Topographic differences play a crucial role in shaping land use and spatial distribution patterns. Significant spatial variations can be observed in the distribution of the LUI, where the eastern region displays high value of LUI, the central region exhibits moderate value of LUI, and the western region shows low value of LUI. The high value of LUI is primarily concentrated in three major urban agglomerations, as well as the entire regions of Jiangsu and Anhui. These areas are specifically located in the Chengdu Plain, Hanzhong Plain, Dongting Lake Plain, Poyang Lake Plain, and Yangtze River Delta Plain. These flat and fertile plains are abundant in water resources, making them some of the most important agricultural areas in China. In addition, these regions also house several of the country’s major economic centers and cities. In contrast, low LUI values are mainly located in western Sichuan, Yunnan, Guizhou, western Hubei, and other areas with many mountain ranges, uneven terrains, and inconvenient transportation systems, such as the eight concentrated contiguous poverty areas in the Qinba Mountains, the Wumeng Mountains, the Wuling Mountains, the border areas in western Yunnan, the Yunnan–Guizhou–Qiangyan Stone Desertification Area, the Dabie Mountains, the Luoxiao Mountains, and the Tibetan areas in four provinces.
The spatial characteristics of LUI and economic development are closely related. In general, more developed regions tend to have higher levels of economic activity and a greater LUI. An imbalanced economic development within the YREB was recognized in Section 3.2.1. Figure 8 displays the areas where economic development is unbalanced.
Due to its strategic location at the mouth of the Yangtze River, the Yangtze River Delta boasts a complex network of waterways that includes smaller rivers, lakes, and canals, in addition to the Yangtze River itself. This expansive water system has played a vital role in driving the region’s economic development by facilitating the seamless movement of goods and people and providing easy access to the sea. Furthermore, the region serves as a critical transport hub, with numerous major ports, airports, and highways linking it to other parts of China and the world. As a result, the Yangtze River Delta has consistently been at the forefront of China’s economic progress and development, particularly since the era of global trade, which primarily relies on maritime transportation. This region, which has a high level of land-use intensity, is one of the most economically dynamic regions in China.
The MYRUA comprises several major urban areas, including the Wuhan City Circle, Changzhutan Urban Agglomerations, and Poyang Lake Urban Agglomerations, which are the three main sub-regions. Wuhan, Changsha, and Nanchang are the central cities of this region and are important economic and cultural centers in their own right. The distribution of LUI indicates differences in the urban areas’ developments, with Wuhan exhibiting higher levels of LUI compared to the other two sub-regions. While the Wuhan City Circle is the most dominant force in the region and is experiencing significant growth, the other two urban agglomerations also play an essential role in the overall development of the area. The Wuhan city circle is located at the intersection of several major transportation routes, including the Yangtze River, several major highways, and high-speed rail lines. This makes it a natural transportation hub for the region and has helped to drive its economic growth. In recent years, the Chinese government has implemented a number of policies and initiatives aimed at boosting economic growth in central China. As a result of these factors, the Wuhan city circle has seen rapid urbanization and industrialization in recent years.
The CCUA is situated in the upper reaches of the Yangtze River. The CCUA has been recognized by the Chinese government as a pivotal development zone, and, to reduce the economic disparities between the East, Central and West regions, significant investments have been made to promote its growth. The CCUA is a key economic hub in western China, and it plays an important role in the region’s development. The relocation of numerous manufacturing industries from the lower areas of the YREB to the middle and upper regions has elevated the standard of industries in those areas while also reducing the regional disparity. Industrial restructuring and economic transformation and upgrading are occurring in the downstream region of the Yangtze River. The increased values of the LUI observed in CCUA suggest a hastened pace of urbanization and industrialization in these areas.

3.2.3. Decoupling Analysis of LUI and PM2.5

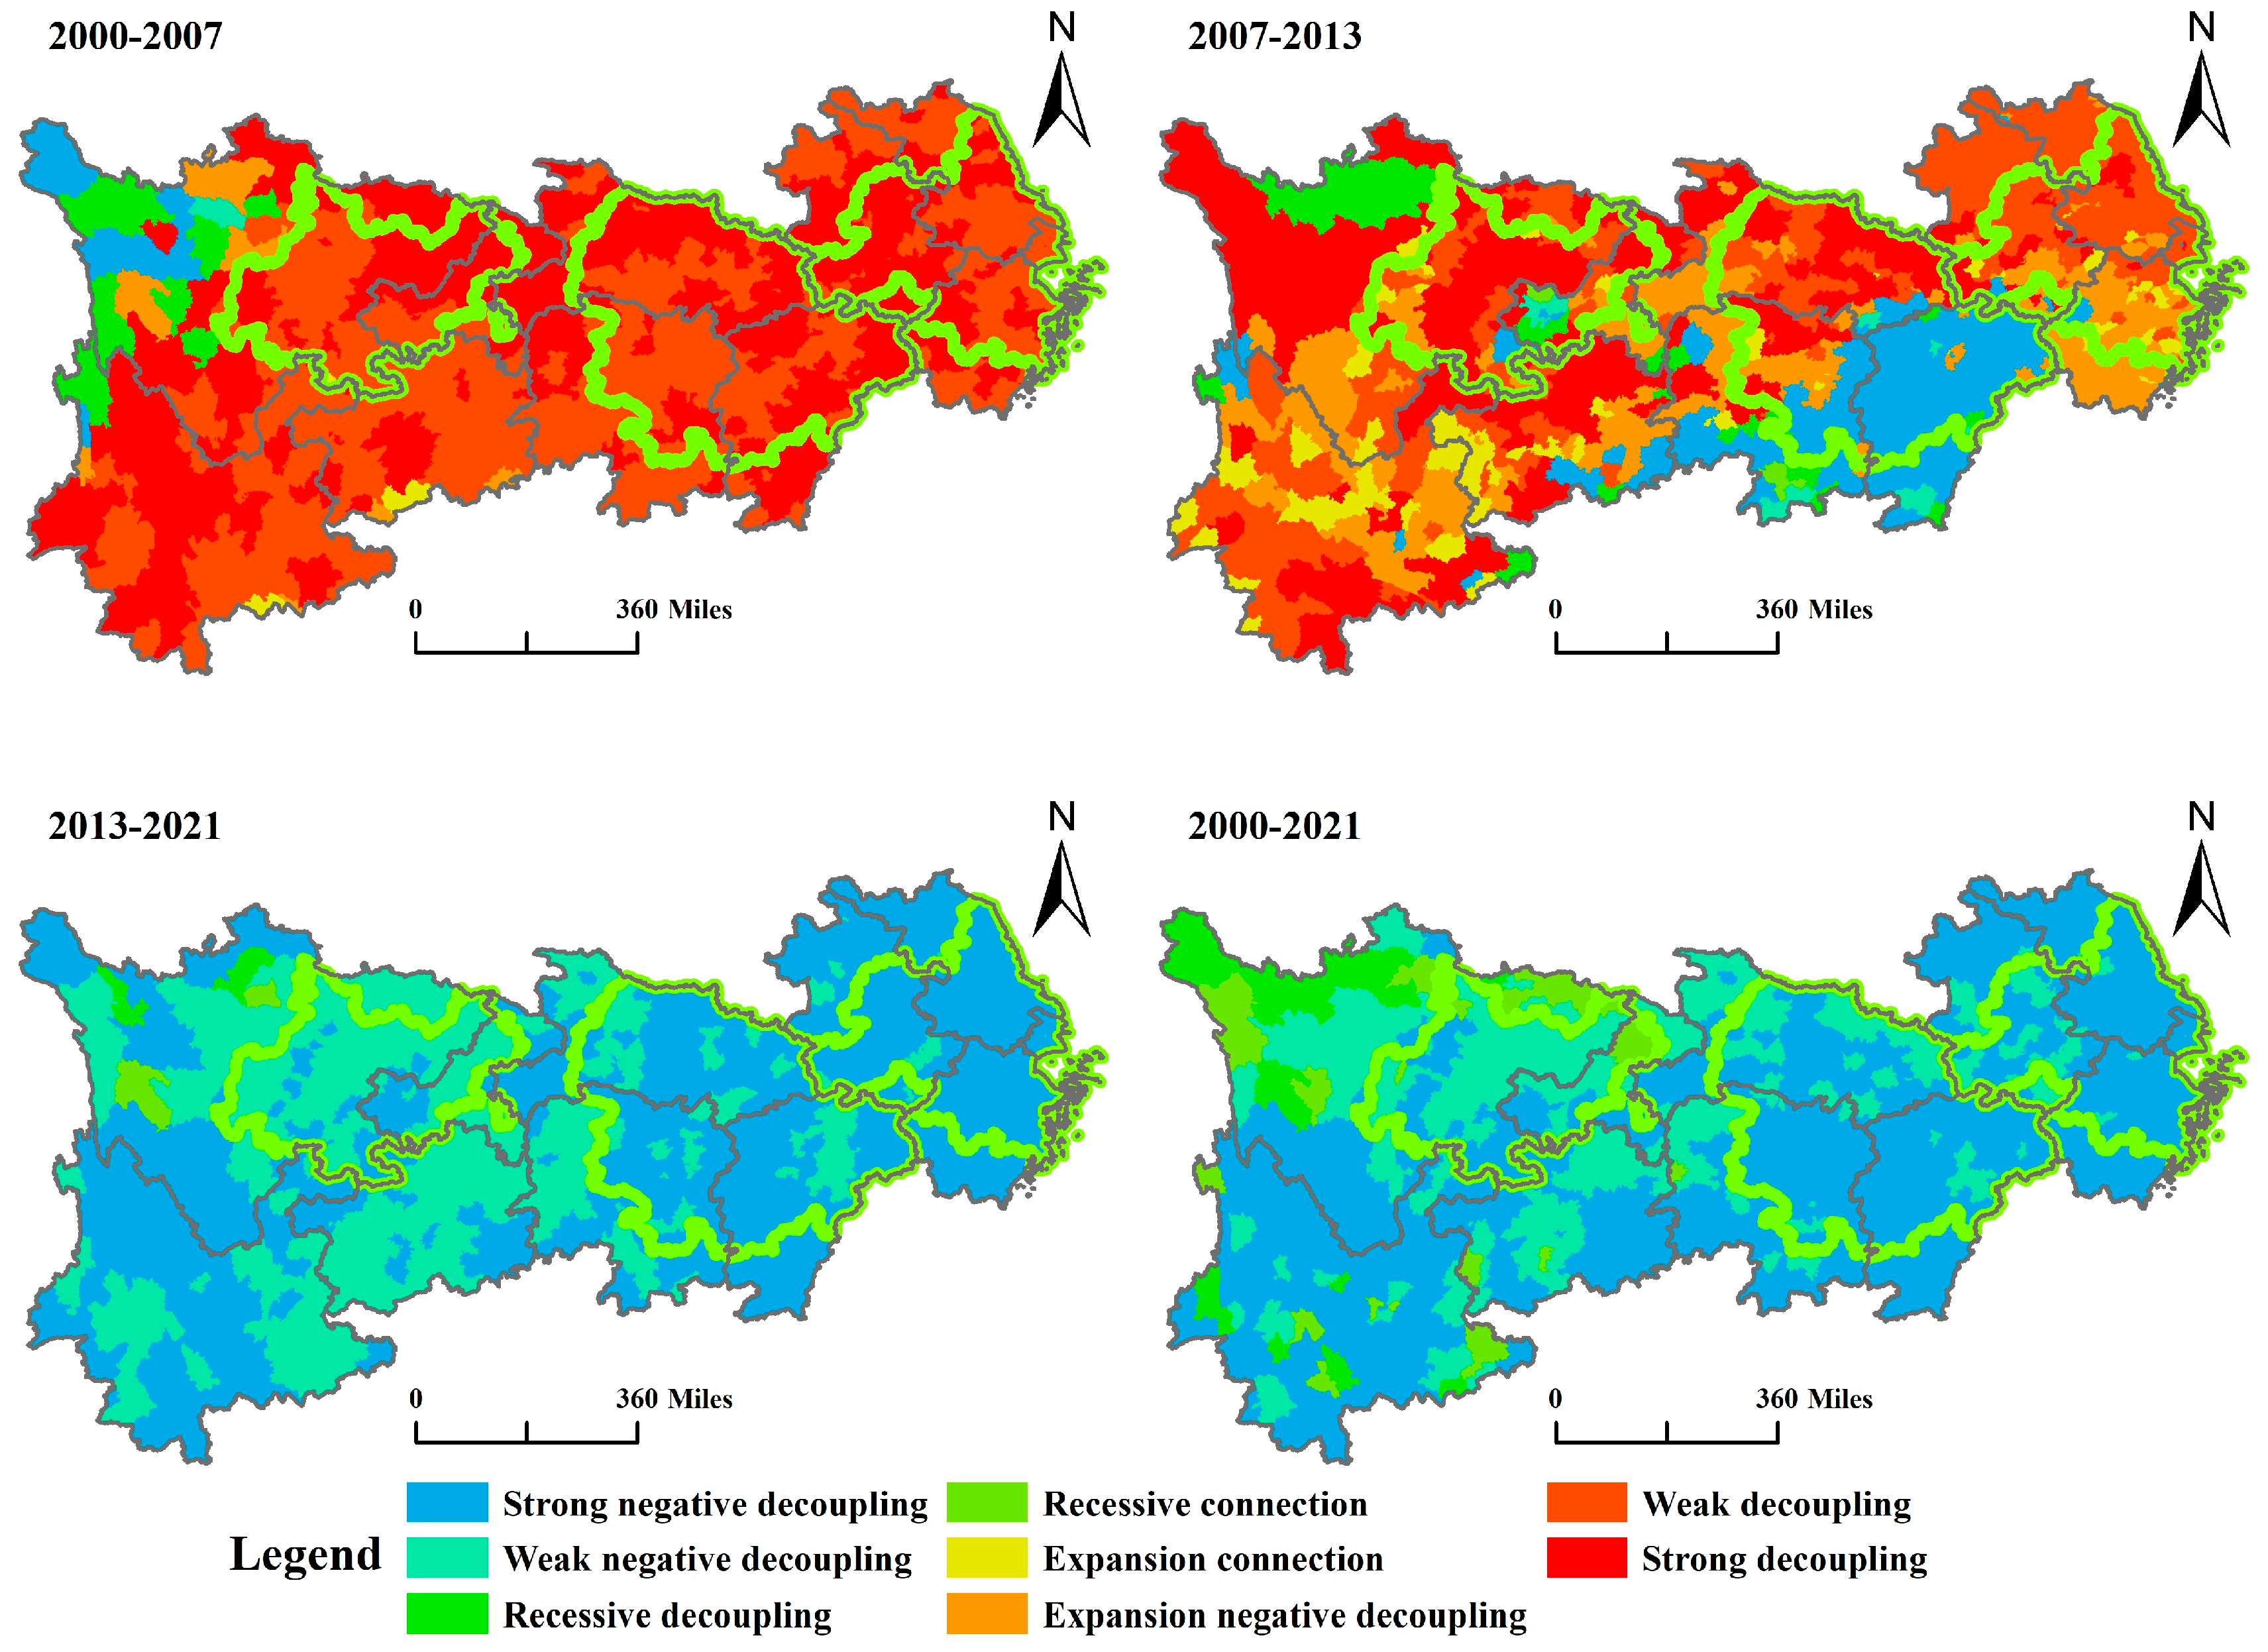
Table 2 displays the decoupling analysis results of the LUI and PM2.5 for the period between 2000 and 2021. Figure 9 shows the spatial distribution map of the level of decoupling between LUI and PM2.5 during 2000–2021. The ranking of desired levels of decoupling between LUI and PM2.5 is as follows, starting from the highest to lowest: strong negative decoupling, weak negative decoupling, recessive decoupling, and recessive connection. On the other hand, the ranking of undesired levels of decoupling is as follows, starting from the highest to lowest: strong decoupling, weak decoupling, expansion negative decoupling, and expansion connection. These rankings are based on the rate of change in LUI and PM2.5, taking into consideration their positive or negative natures, as well as their numerical magnitudes. This section divides the entire study period into three parts based on the trend in PM2.5 levels from 2000 to 2021: 2000–2007, 2007–2013, and 2013–2021.
From 2000 to 2021, the desired levels of decoupling between LUI and PM2.5 were classified into two types in most regions of YREB: strong negative decoupling and negative decoupling. These accounted for 71.12% and 24.86%, respectively, indicating rapid urbanization and industrialization in most regions, along with a significant decrease in PM2.5. Over time, there were varying trends across different periods. Strong negative decoupling was primarily observed in the MYRUA, YRDUA, Chongqing’s main city areas, and the majority of Yunnan Province. Conversely, weak negative decoupling was primarily observed in most parts of Chongqing and Sichuan, as well as a few areas in the western region of Guizhou.
During 2000–2007, most regions in YREB mainly exhibited two types of undesired decoupling between LUI and PM2.5 levels: strong decoupling and weak decoupling. Strong decoupling was observed in 40.47% of the regions, where PM2.5 levels increased as land-use intensity decreased. In contrast, weak decoupling was observed in 56.36% of the regions, where PM2.5 levels increased as LUI increased. During this study period, there was a noticeable upward trend in PM2.5 levels within the YREB. The regions of strong decoupling and weak decoupling were mainly distributed in most provinces of the YREB, except for a very small part of Sichuan Province and Yunnan Province. Throughout this study period, China underwent swift economic growth and urbanization, yet at a substantial expense to the environment. The manufacturing industry played a major role in driving China’s rapid economic growth during this period; however, this resulted in elevated levels of air and water pollution. As factories ramped up production to meet the demands of global markets, they released pollutants such as sulfur dioxide, nitrogen oxide, and particulate matter into the air and water. Additionally, China’s energy consumption soared, largely dependent on coal, which is a major contributor to air pollution and greenhouse gas emissions.
During 2007–2013, the levels of decoupling between LUI and PM2.5 were mainly classified into four types in most regions of YREB: weak decoupling, strong decoupling, expansion negative decoupling, and strong negative decoupling, indicating that PM2.5 levels in the YREB increased with decreasing LUI in 23.18% of the regions, increasing with increasing LUI in 51.79%, and decreasing with increasing LUI in 15.33% of the regions. The areas with strong decoupling were primarily located in Hubei, Sichuan, Yunnan, and certain parts of Guizhou. On the other hand, regions with weak decoupling were mainly found in Jiangsu, Anhui, Hubei, and some parts of Yunnan. Expansion negative decoupling was observed primarily in Zhejiang, western Hubei, northern Hunan, parts of Yunnan, Guizhou, and Sichuan. Meanwhile, areas with strong negative decoupling were mainly concentrated in the southern parts of Hunan and Jiangxi provinces. During this study period, a significant downward trend was observed in the proportion of areas showing strong and weak decoupling in the YREB. Specifically, only 17.29% of areas exhibited strong decoupling, and 25.05% showed weak decoupling, indicating a reduction in the number of areas where PM2.5 levels increased with changes in LUI, and it was observed that extended weak decoupling occurred in 15.33% of the areas, indicating that the rate of increase in land use surpassed those of PM2.5 in those areas. While there is still a long way to go in reducing air pollution to safe levels, the decreasing trend in PM2.5 levels with urbanization and industrialization is a positive sign that effective measures are being taken to address the issue. It is crucial to continue implementing and enforcing environmental policies and promoting sustainable practices to improve air quality and protect public health.
During 2013–2021, the desired levels of decoupling between LUI and PM2.5 were mainly classified into two types in most regions of YREB: strong negative decoupling and weak negative decoupling. This indicated that PM2.5 levels in the YREB decreased with increasing LUI in 67.01% of the regions, meaning that PM2.5 levels decreased as human activities and developments increased in these areas. In contrast, in 32.62% of the regions, PM2.5 levels decreased with decreasing LUI, indicating that PM2.5 levels also decreased in these areas as human activities and developments decreased. During this study period, there was a noticeable downward trend in PM2.5 levels within the YREB. The areas exhibiting strong negative decoupling were predominantly situated in MYRUA, YRDUA, Chongqing’s main city areas, and parts of Yunnan Province. On the other hand, the areas with weak negative decoupling were mainly dispersed across most of the western regions, including Chongqing, Sichuan, and Guizhou. Overall, during this study period, the decrease in PM2.5 levels with urbanization and industrialization in the YREB could be attributed to China’s economic transformation and upgrading, where green development became the predominant theme, and environmental protection measures were intensified.
The decoupling relationship between LUI and PM2.5 in the YREB over the years can provide insights into the air quality trends in the region. From 2000 to 2021, the PM2.5 level in the YREB showed a fluctuating trend, with periods of increase, stabilization, and decrease. During the initial phase of urbanization and industrialization in the early 2000s, the PM2.5 level in the region increased significantly due to the rapid expansion of urban areas and industrial activities. The increase in emissions from factories, power plants, transportation, and other sources contributed to the deterioration of air quality. However, in the mid-2000s, the PM2.5 level in the YREB began to stabilize, despite continued urbanization and industrialization. This could have been attributed to the implementation of various measures to control air pollution, such as the promotion of clean energy, the closure of outdated factories, and the improvement of emission standards for vehicles and industries. In the last decade, the PM2.5 level in the YREB showed a clear downward trend, indicating an overall improvement in air quality. This could have been attributed to the continued implementation of air pollution control measures, as well as the shift towards a more service-oriented economy and the adoption of cleaner technologies in industries. The decoupling relationship between LUI and PM2.5 in the YREB also indicated that the region had achieved a certain degree of environmental sustainability.

4. Discussion

4.1. From the Perspective of Economic Development Stages

China has transitioned from rapid development to high-quality development. This shift aims to tackle issues such as regional imbalances, urban–rural disparities, environmental pollution, and urban sprawl. The government is implementing strategies to promote balanced regional development, reduce disparities, protect the environment, create more sustainable and livable cities, and achieve sustainable development. The goal is to achieve inclusive and equitable growth while improving the overall well-being of the population.
Since the beginning of China’s reform and opening-up policy in 1978, China has become one of the world’s fastest-growing economies and has attracted significant foreign investment. China has been able to leverage its market size, low labor costs, and growing infrastructure to become a key player in the global economy dominated by shipping and to undertake the transfer of Western industrial chains. As Western companies look for methods to reduce their production costs and expand their markets, many have turned to China as a manufacturing hub. China’s labor costs are typically lower than those in the West, making it an attractive location for companies seeking to reduce their production costs. China has seized this opportunity to initiate urbanization and industrialization in a gradual manner. China’s approach to urbanization and industrialization has led to impressive economic growth, but it has also resulted in significant environmental challenges such as air and water pollution, land degradation, biodiversity loss, and climate change. Certainly, there are discrepancies in income among different regions, between urban and rural areas, and among the rich and poor. The coastal provinces have experienced significant growth, whereas the western and central regions have lagged behind. In addition, urban areas have also seen greater economic growth than rural areas, resulting in a widening income gap. Undoubtedly, the YREB also faces these issues, and the findings presented in this paper indicate an increase in PM2.5 levels with urbanization and industrialization within China’s YREB from 2000 to 2007. The Yangtze River is the world’s busiest inland waterway and the golden waterway with the highest freight volume.
The Chinese government aims to foster the integrated development of the upper, middle, and lower reaches of the Yangtze River, as well as the high-quality development of the surrounding regions, by leveraging the Yangtze River Golden Waterway, which spans across the eastern, Western, and Central regions of China. The policy of transferring labor-intensive industries to the Central and Western regions of China involves relocating manufacturing activities from the more developed eastern coastal regions to the less developed regions in Central and Western China. This policy aims to promote balanced regional development and alleviate the pressure on resources and the environment in the eastern coastal regions. The Central and Western regions of China have abundant resources and lower labor costs, which can attract more investment and promote economic growth in these regions. At the same time, the development of the Yangtze River Delta urban cluster is a strategic plan to create a world-class modern urban agglomeration in the eastern coastal region of China. This urban cluster includes Shanghai and the surrounding provinces of Jiangsu, Zhejiang, and Anhui. The plan aims to integrate the resources of these regions to enhance their overall competitiveness and promote sustainable development. In the process of industrial chain transfer, ecological priority and green development are taken as the guiding principles. This means that environmental protection is given top priority, and the development of industries is guided by sustainable and green principles. The policy aims to prevent environmental pollution and degradation and promote the efficient use of resources. The government has put various measures in place to encourage and support the development of green industries and the adoption of environmentally friendly technologies. The paper’s findings suggest that the Chinese government’s efforts towards green development have been effective in controlling and reducing PM2.5 levels in the YREB. This study shows that as urbanization and industrialization continue, PM2.5 levels first rise, then stabilize, and, finally, decline. This trend indicates that the government’s policies and regulations have been successful in reducing pollution levels. Overall, the study’s findings provide encouraging evidence that the Chinese government’s green development strategies are having a positive impact on the environment. By continuing to prioritize sustainability and pollution reduction, China can work towards a cleaner, healthier future for its citizens.

4.2. From the Perspective of Policy Execution

The environmental protection laws in China include the Environmental Protection Law (Enacted in 1989), Air Pollution Prevention and Control Law (Enacted in 1987), Water Pollution Prevention and Control Law (Enacted in 1984), Environmental Impact Assessment Law (Enacted in 2002), Solid Waste Pollution Prevention and Control Law (Enacted in 1995), Wildlife Protection Law (Enacted in 1988), etc. In terms of their enactment dates, all of China’s environmental protection laws were established earlier. However, the results of this study indicated that significant declines in PM2.5 levels were observed only after 2013. This paper analyzed the policy factors influencing the level of PM2.5 change in China with the help of the flexible execution perspective in policy execution theory in the context of China. Flexible execution included actual execution, selective execution, supplementary execution, and alternative execution [65,66]. In this paper, the main focus was on actual execution and selective execution.
The results of this paper provide evidence of a substantial shift in PM2.5 pollution levels within the YREB after 2013. Specifically, there was a gradual rise in PM2.5 pollution levels from 2000 to 2007, followed by a period of insignificant change from 2007 to 2012, as shown in Figure 2. Consequently, it was observed that local governments frequently prioritized their own self-interests and prioritized extensive developments at the expense of environmental protection from 2000 to 2007. This preference for extensive development over environmental protection could manifest in several ways. Local governments might prioritize industrial growth, urbanization, or infrastructure projects that contribute to economic expansion but disregard their environmental impact. This approach often involved relaxed regulations, insufficient enforcements of environmental standards, and a lack of emphasis on sustainable practices.
From 2007 to 2012, PM2.5 levels changed smoothly and exhibited a decreasing trend after 2013, indicating that local governments in the region were seriously executing policies to protect the environment and achieve sustainable economic development, such as implementing stringent emission standards, upgrading coal-fired power plants, promoting clean energy, enforcing vehicle emission controls, improving industrial pollution control, engaging in regional air quality cooperation, and raising public awareness and participation. The spatial distribution map of PM2.5 also reflects, to some extent, the selective execution strategies of local governments in the region when it came to selecting industries with high PM2.5 pollution levels (Figure 4).
Undoubtedly, the findings of this paper demonstrated the simultaneous presence of actual execution and selective execution. Additionally, it was observed that the PM2.5 centers shifted in a northwestern direction between 2000 and 2020, suggesting that regions in this particular direction experienced elevated levels of air pollution (Figure 5a). The results of this study revealed that certain local governments in the YREB opted for active execution in terms of PM2.5 pollution prevention and control. Conversely, other governments in the YREB prioritized the development of industries associated with high PM2.5 pollution, disregarding the environmental consequences.

5. Conclusions

This study employed remote-sensing inversion of PM2.5 data and land-use-change data in a long time series to analyze the spatio-temporal evolution characteristics of the decoupling between land-use intensity and PM2.5 in the YREB using Mean Center Change analysis and the Tapio Decoupling Model. The main conclusions were as follows:
(1)
During 2000–2021, the mean value of PM2.5 decreased by 11.77 μg/m3 from 39.91 μg/m3 to 28.14 μg/m3. The high values of PM2.5 were mainly distributed in the three major urban agglomerations, also including the whole areas of Jiangsu and Anhui. In contrast, low PM2.5 values were mainly distributed the Yunnan, Guizhou, and western Sichuan plateau areas with low population densities and relatively unconventional economic developments.
(2)
During 2000–2021, the PM2.5 centers moved in a northwestward direction, indicating that areas in this direction had high levels of air pollution. The central spatial trajectory of the LUI shifted southeast, indicating that a consistent trend in human activities such as urbanization and industrialization spread towards the southeast over time.
(3)
During 2000–2021, the mean value of the LUI increased from 3.73 to 3.92 by 0.19. The high values of the LUI were primarily concentrated in three major urban agglomerations, as well as the entire regions of Jiangsu and Anhui. In contrast, low LUI values were mainly located in western Sichuan, Yunnan, Guizhou, western Hubei, and other areas with many mountain ranges, uneven terrains, and inconvenient transportation systems.
(4)
During 2000–2021, the desired levels of decoupling between LUI and PM2.5 were classified into two types in most regions of YREB: strong negative decoupling and negative decoupling. These accounted for 71.12% and 24.86%, respectively, indicating rapid urbanization and industrialization in most regions, along with a significant decrease in PM2.5.

Author Contributions

Conceptualization, J.H. and D.R.; methodology, Y.J. and D.R.; software, Y.J. and D.R.; validation, D.R.; formal analysis, J.H., Y.J. and D.R.; data curation, Y.J.; writing—original draft preparation, D.R.; writing—review and editing, D.R.; visualization, D.R.; supervision, J.H.; project administration, J.H.; funding acquisition, J.H. All authors have read and agreed to the published version of the manuscript.

Funding

This paper is supported by the Research Fund of Renmin University of China (Fundamental Research Funds of Central Universities) under the project “Research on the Construction of Urban-Rural Unified Construction Land Market and Benefit Distribution Relationship Based on Land Development Right” (Grant No. 20XNL005).

Institutional Review Board Statement

Not applicable.

Informed Consent Statement

Not applicable for studies not involving humans.

Data Availability Statement

PM2.5 data were downloaded from https://weijing-rs.github.io/product.html (accessed 6 January 2023), with a cell size of 1000 m × 1000 m, and the time span was from 2000 to 2021. Land-use/cover maps data included nine land-use/cover types as follows, cropland, forest, shrub, grassland, water, snow/ice, barren, impervious, and wetland, with a cell size of 30 m × 30 m, downloaded from https://zenodo.org/record/5816591#.Y-si3HZBxPZ (accessed on 6 January 2023), and the time span was from 2000 to 2021.

Conflicts of Interest

The authors declare no conflict of interest.

References

  1. Huang, R.-J.; Zhang, Y.; Bozzetti, C.; Ho, K.-F.; Cao, J.-J.; Han, Y.; Daellenbach, K.R.; Slowik, J.G.; Platt, S.M.; Canonaco, F.; et al. High secondary aerosol contribution to particulate pollution during haze events in China. Nature 2014, 514, 218–222. [Google Scholar] [CrossRef] [Green Version]
  2. Chan, C.K.; Yao, X. Air pollution in mega cities in China. Atmos. Environ. 2008, 42, 1–42. [Google Scholar] [CrossRef]
  3. Zhao, F.J.; Ma, Y.; Zhu, Y.G.; Tang, Z.; McGrath, S.P. Soil contamination in China: Current status and mitigation strategies. Environ. Sci. Technol. 2015, 49, 750–759. [Google Scholar] [CrossRef] [PubMed]
  4. Mahala, A. Processes and Status of Land Degradation in a Plateau Fringe Region of Tropical Environment. Environ. Process. 2017, 4, 663–682. [Google Scholar] [CrossRef]
  5. Baptista, S.R.; Rudel, T.K. A re-emerging Atlantic forest? Urbanization, industrialization and the forest transition in Santa Catarina, southern Brazil. Environ. Conserv. 2006, 33, 195–202. [Google Scholar] [CrossRef]
  6. Wang, S.-L.; Xu, X.-R.; Sun, Y.-X.; Liu, J.-L.; Li, H.-B. Heavy metal pollution in coastal areas of South China: A review. Mar. Pollut. Bull. 2013, 76, 7–15. [Google Scholar] [CrossRef]
  7. York, R.; Rosa, E.A.; Dietz, T. STIRPAT, IPAT and ImPACT: Analytic tools for unpacking the driving forces of environmental impacts. Ecol. Econ. 2003, 46, 351–365. [Google Scholar] [CrossRef]
  8. Han, L.; Zhou, W.; Li, W. City as a major source area of fine particulate (PM2.5) in China. Environ. Pollut. 2015, 206, 183–187. [Google Scholar] [CrossRef]
  9. Wang, Y.; Ying, Q.; Hu, J.; Zhang, H. Spatial and temporal variations of six criteria air pollutants in 31 provincial capital cities in China during 2013–2014. Environ. Int. 2014, 73, 413–422. [Google Scholar] [CrossRef]
  10. Bodor, K.; Szép, R.; Bodor, Z. The human health risk assessment of particulate air pollution (PM2.5 and PM10) in Romania. Toxicol. Rep. 2022, 9, 556–562. [Google Scholar] [CrossRef]
  11. Yin, P.; Brauer, M.; Cohen, A.J.; Wang, H.; Li, J.; Burnett, R.T.; Stanaway, J.D.; Causey, K.; Larson, S.; Godwin, W.; et al. The effect of air pollution on deaths, disease burden, and life expectancy across China and its provinces, 1990–2017: An analysis for the Global Burden of Disease Study 2017. Lancet Planet. Health 2020, 4, e386–e398. [Google Scholar] [CrossRef] [PubMed]
  12. Cui, X.; Huang, W.; Deng, W.; Jia, C. Spatial Patterns, Drivers and Heterogeneous Effects of PM2.5: Experience from China. Pol. J. Environ. Stud. 2022, 31, 5633–5647. [Google Scholar] [CrossRef]
  13. Wang, Z.; Liang, L.; Wang, X. Spatiotemporal evolution of PM2.5 concentrations in urban agglomerations of China. J. Geogr. Sci. 2021, 31, 878–898. [Google Scholar] [CrossRef]
  14. Zhou, L.; Zhou, C.; Yang, F.; Che, L.; Wang, B.; Sun, D. Spatio-temporal evolution and the influencing factors of PM2.5 in China between 2000 and 2015. J. Geogr. Sci. 2019, 29, 253–270. [Google Scholar] [CrossRef] [Green Version]
  15. Yan, D.; Lei, Y.; Shi, Y.; Zhu, Q.; Li, L.; Zhang, Z. Evolution of the spatiotemporal pattern of PM2.5 concentrations in China—A case study from the Beijing-Tianjin-Hebei region. Atmos. Environ. 2018, 183, 225–233. [Google Scholar] [CrossRef] [Green Version]
  16. Lelieveld, J.; Evans, J.S.; Fnais, M.; Giannadaki, D.; Pozzer, A. The contribution of outdoor air pollution sources to premature mortality on a global scale. Nature 2015, 525, 367–371. [Google Scholar] [CrossRef]
  17. Garbarienė, I.; Garbaras, A.; Masalaite, A.; Ceburnis, D.; Krugly, E.; Kauneliene, V.; Remeikis, V.; Martuzevicius, D. Identification of wintertime carbonaceous fine particulate matter (PM2.5) sources in Kaunas, Lithuania using polycyclic aromatic hydrocarbons and stable carbon isotope analysis. Atmos. Environ. 2020, 237, 117673. [Google Scholar] [CrossRef]
  18. Zhang, J.; Wang, H.; Yan, L.; Ding, W.; Liu, R.; Wang, H.; Wang, S. Analysis of Chemical Composition Characteristics and Source of PM2.5 under Different Pollution Degrees in Autumn and Winter of Liaocheng, China. Atmosphere 2021, 12, 1180. [Google Scholar] [CrossRef]
  19. Wang, Y.; Wang, M.; Li, S.; Sun, H.; Mu, Z.; Zhang, L.; Li, Y.; Chen, Q. Study on the oxidation potential of the water-soluble components of ambient PM2.5 over Xi’an, China: Pollution levels, source apportionment and transport pathways. Environ. Int. 2020, 136, 105515. [Google Scholar] [CrossRef]
  20. Wang, Y.; Zhuang, G.; Tang, A.; Yuan, H.; Sun, Y.; Chen, S.; Zheng, A. The ion chemistry and the source of PM2.5 aerosol in Beijing. Atmos. Environ. 2005, 39, 3771–3784. [Google Scholar] [CrossRef]
  21. Fu, X.; Wang, S.; Zhao, B.; Xing, J.; Cheng, Z.; Liu, H.; Hao, J. Emission inventory of primary pollutants and chemical speciation in 2010 for the Yangtze River Delta region, China. Atmos. Environ. 2013, 70, 39–50. [Google Scholar] [CrossRef]
  22. Luo, Y.; Liu, S.; Che, L.; Yu, Y. Analysis of temporal spatial distribution characteristics of PM2.5 pollution and the influential meteorological factors using Big Data in Harbin, China. J. Air Waste Manag. Assoc. 2021, 71, 964–973. [Google Scholar] [CrossRef]
  23. Zhang, J.; Zhou, Z.; Wang, C.; Xue, K.; Liu, Y.; Fang, M.; Zuo, J.; Sheng, Y. Research on the Influence of Indoor Relative Humidity on PM2.5 Concentration in Residential Buildings. IOP Conf. Ser. Mater. Sci. Eng. 2019, 585, 012086. [Google Scholar] [CrossRef] [Green Version]
  24. Zhang, C.; Ni, Z.; Ni, L. Multifractal detrended cross-correlation analysis between PM2.5 and meteorological factors. Phys. A Stat. Mech. Appl. 2015, 438, 114–123. [Google Scholar] [CrossRef]
  25. Kanabkaew, T.; Mekbungwan, P.; Raksakietisak, S.; Kanchanasut, K. Detection of PM2.5 plume movement from IoT ground level monitoring data. Environ. Pollut. 2019, 252, 543–552. [Google Scholar] [CrossRef]
  26. Yang, Q.; Yuan, Q.; Li, T.; Shen, H.; Zhang, L. The Relationships between PM2.5 and Meteorological Factors in China: Seasonal and Regional Variations. Int. J. Environ. Res. Public Health 2017, 14, 1510. [Google Scholar] [CrossRef] [PubMed] [Green Version]
  27. Yin, Z.; Zhang, Y. Climate anomalies contributed to the rebound of PM2.5 in winter 2018 under intensified regional air pollution preventions. Sci. Total Environ. 2020, 726, 138514. [Google Scholar] [CrossRef]
  28. Hu, W.; Zhao, T.; Bai, Y.; Kong, S.; Xiong, J.; Sun, X.; Yang, Q.; Gu, Y.; Lu, H. Importance of regional PM2.5 transport and precipitation washout in heavy air pollution in the Twain-Hu Basin over Central China: Observational analysis and WRF-Chem simulation. Sci. Total Environ. 2021, 758, 143710. [Google Scholar] [CrossRef]
  29. Lv, B.; Liu, Y.; Yu, P.; Zhang, B.; Bai, Y. Characterizations of PM2.5 Pollution Pathways and Sources Analysis in Four Large Cities in China. Aerosol Air Qual. Res. 2015, 15, 1836–1843. [Google Scholar] [CrossRef]
  30. Ding, H.; Liu, Y.; Yu, Z.; Cheung, C.; Zhan, J. Spatial and Temporal Characteristics and Main Contributing Regions of High PM2.5 Pollution in Hong Kong. Aerosol Air Qual. Res. 2017, 17, 2955–2965. [Google Scholar] [CrossRef] [Green Version]
  31. Chen, W.; Zeng, J.; Li, N. Change in land-use structure due to urbanisation in China. J. Clean. Prod. 2021, 321, 128986. [Google Scholar] [CrossRef]
  32. Lambin, E.F.; Geist, H.J.; Lepers, E. Dynamics of Land-Use and Land-Cover Change in Tropical Regions. Annu. Rev. Environ. Resour. 2003, 28, 205–241. [Google Scholar] [CrossRef] [Green Version]
  33. Dale, V.H. The relationship between land-use change and climate change. Ecol. Appl. 1997, 7, 753–769. [Google Scholar] [CrossRef]
  34. Pompe, S.; Hanspach, J.; Badeck, F.; Klotz, S.; Thuiller, W.; Kühn, I. Climate and land use change impacts on plant distributions in Germany. Biol. Lett. 2008, 4, 564–567. [Google Scholar] [CrossRef] [PubMed] [Green Version]
  35. Liu, J.; Liu, M.; Tian, H.; Zhuang, D.; Zhang, Z.; Zhang, W.; Tang, X.; Deng, X. Spatial and temporal patterns of China’s cropland during 1990–2000: An analysis based on Landsat TM data. Remote Sens. Environ. 2005, 98, 442–456. [Google Scholar] [CrossRef]
  36. Liu, J.; Zhang, Z.; Xu, X.; Kuang, W.; Zhou, W.; Zhang, S.; Li, R.; Yan, C.; Yu, D.; Wu, S.; et al. Spatial patterns and driving forces of land use change in China during the early 21st century. J. Geogr. Sci. 2010, 20, 483–494. [Google Scholar] [CrossRef]
  37. Lu, D.; Mao, W.; Xiao, W.; Zhang, L. Non-Linear Response of PM2.5 Pollution to Land Use Change in China. Remote Sens. 2021, 13, 1612. [Google Scholar] [CrossRef]
  38. Zhang, H.; Deng, W.; Zhang, S.; Peng, L.; Liu, Y. Impacts of urbanization on ecosystem services in the Chengdu-Chongqing Urban Agglomeration: Changes and trade-offs. Ecol. Indic. 2022, 139, 108920. [Google Scholar] [CrossRef]
  39. Yang, H.; Chen, W.; Liang, Z. Impact of Land Use on PM2.5 Pollution in a Representative City of Middle China. Int. J. Environ. Res. Public Health 2017, 14, 462. [Google Scholar] [CrossRef]
  40. Lu, D.; Xu, J.; Yue, W.; Mao, W.; Yang, D.; Wang, J. Response of PM2.5 pollution to land use in China. J. Clean. Prod. 2020, 244, 118741. [Google Scholar] [CrossRef]
  41. Zhang, D.; Zhou, C.; He, B.-J. Spatial and temporal heterogeneity of urban land area and PM2.5 concentration in China. Urban Clim. 2022, 45, 101268. [Google Scholar] [CrossRef]
  42. Lin, Y.; Yuan, X.; Zhai, T.; Wang, J. Effects of land-use patterns on PM2.5 in China’s developed coastal region: Exploration and solutions. Sci. Total Environ. 2020, 703, 135602. [Google Scholar] [CrossRef] [PubMed]
  43. Zhu, C.; Zeng, Y. Effects of urban lake wetlands on the spatial and temporal distribution of air PM10 and PM2.5 in the spring in Wuhan. Urban For. Urban Green. 2018, 31, 142–156. [Google Scholar] [CrossRef]
  44. Xu, Z.; Niu, L.; Zhang, Z.; Hu, Q.; Zhang, D.; Huang, J.; Li, C. The impacts of land supply on PM2.5 concentration: Evidence from 292 cities in China from 2009 to 2017. J. Clean. Prod. 2022, 347, 131251. [Google Scholar] [CrossRef]
  45. Yuan, M.; Song, Y.; Huang, Y.; Shen, H.; Li, T. Exploring the association between the built environment and remotely sensed PM2.5 concentrations in urban areas. J. Clean. Prod. 2019, 220, 1014–1023. [Google Scholar] [CrossRef]
  46. Lu, D.; Mao, W.; Yang, D.; Zhao, J.; Xu, J. Effects of land use and landscape pattern on PM2.5 in Yangtze River Delta, China. Atmos. Pollut. Res. 2018, 9, 705–713. [Google Scholar] [CrossRef]
  47. Jiang, G.; Tian, Y.; Zhang, R.; Wu, S.; Chen, T. Assessing the effects of land use pattern change applying a spatially oriented indicator system framework. Habitat Int. 2022, 129, 102619. [Google Scholar] [CrossRef]
  48. Pontius, R.G.; Huang, J.; Jiang, W.; Khallaghi, S.; Lin, Y.; Liu, J.; Quan, B.; Ye, S. Rules to write mathematics to clarify metrics such as the land use dynamic degrees. Landsc. Ecol. 2017, 32, 2249–2260. [Google Scholar] [CrossRef]
  49. Liu, F.; Qin, T.; Girma, A.; Wang, H.; Weng, B.; Yu, Z.; Wang, Z. Dynamics of Land-Use and Vegetation Change Using NDVI and Transfer Matrix: A Case Study of the Huaihe River Basin. Pol. J. Environ. Stud. 2019, 28, 213–223. [Google Scholar] [CrossRef]
  50. Di, X.; Hou, X.; Wang, Y.; Wu, L. Spatial-temporal characteristics of land use intensity of coastal zone in China during 2000–2010. Chin. Geogr. Sci. 2015, 25, 51–61. [Google Scholar] [CrossRef]
  51. Li, S.; Wu, J.; Gong, J.; Li, S. Human footprint in Tibet: Assessing the spatial layout and effectiveness of nature reserves. Sci. Total Environ. 2018, 621, 18–29. [Google Scholar] [CrossRef]
  52. Wei, J.; Li, Z.; Cribb, M.; Huang, W.; Xue, W.; Sun, L.; Guo, J.; Peng, Y.; Li, J.; Lyapustin, A. Improved 1 km resolution PM 2.5 estimates across China using enhanced space–time extremely randomized trees. Atmos. Chem. Phys. 2020, 20, 3273–3289. [Google Scholar] [CrossRef] [Green Version]
  53. Wei, J.; Li, Z.; Lyapustin, A.; Sun, L.; Peng, Y.; Xue, W.; Su, T.; Cribb, M. Reconstructing 1-km-resolution high-quality PM2.5 data records from 2000 to 2018 in China: Spatiotemporal variations and policy implications. Remote Sens. Environ. 2021, 252, 112136. [Google Scholar] [CrossRef]
  54. Yang, J.; Huang, X. The 30 m annual land cover dataset and its dynamics in China from 1990 to 2021. Earth Syst. Sci. Data 2022, 13, 3907–3925. [Google Scholar] [CrossRef]
  55. Zhuang, D.; Liu, J. Study on the model of regional differentiation of land use degree in China. J. Nat. Resour 1997, 12, 105–111. [Google Scholar]
  56. Shen, F.; Yang, L.; Zhang, L.; Guo, M.; Huang, H.; Zhou, C. Quantifying the direct effects of long-term dynamic land use intensity on vegetation change and its interacted effects with economic development and climate change in jiangsu, China. J. Environ. Manag. 2023, 325, 116562. [Google Scholar] [CrossRef]
  57. Xia, C.; Dong, Z.; Wu, P.; Dong, F.; Fang, K.; Li, Q.; Li, X.; Shao, Z.; Yu, Z. How urban land-use intensity affected CO2 emissions at the county level: Influence and prediction. Ecol. Indic. 2022, 145, 109601. [Google Scholar] [CrossRef]
  58. Li, X.; Wu, K.; Yang, Q.; Hao, S.; Feng, Z.; Ma, J. Quantitative assessment of cultivated land use intensity in Heilongjiang Province, China, 2001–2015. Land Use Policy 2023, 125, 106505. [Google Scholar] [CrossRef]
  59. Chen, W.; Gu, T.; Fang, C.; Zeng, J. Global urban low-carbon transitions: Multiscale relationship between urban land and carbon emissions. Environ. Impact Assess. Rev. 2023, 100, 107076. [Google Scholar] [CrossRef]
  60. Hu, Q.; Zhang, Z.; Niu, L. Identification and evolution of territorial space from the perspective of composite functions. Habitat Int. 2022, 128, 102662. [Google Scholar] [CrossRef]
  61. Billman, P.D.; Beever, E.A.; McWethy, D.B.; Thurman, L.L.; Wilson, K.C. Factors influencing distributional shifts and abundance at the range core of a climate-sensitive mammal. Glob. Chang. Biol. 2021, 27, 4498–4515. [Google Scholar] [CrossRef]
  62. Tapio, P. Towards a theory of decoupling: Degrees of decoupling in the EU and the case of road traffic in Finland between 1970 and 2001. Transp. Policy 2005, 12, 137–151. [Google Scholar] [CrossRef] [Green Version]
  63. Song, Y.; Sun, J.; Zhang, M.; Su, B. Using the Tapio-Z decoupling model to evaluate the decoupling status of China’s CO2 emissions at provincial level and its dynamic trend. Struct. Chang. Econ. Dyn. 2020, 52, 120–129. [Google Scholar] [CrossRef]
  64. Wang, X.; Zhang, S.; Zhao, X.; Shi, S.; Xu, L. Exploring the Relationship between the Eco-Environmental Quality and Urbanization by Utilizing Sentinel and Landsat Data: A Case Study of the Yellow River Basin. Remote Sens. 2023, 15, 743. [Google Scholar] [CrossRef]
  65. Shen, L. On the Execution of Public Policy: Problems and Solutions. Chin. Public Adm. 2009, 293, 41–44. Available online: http://gfgga60aabc7d15084b00spno06upp5nfo6oc9.fhaz.libproxy.ruc.edu.cn/kcms2/article/abstract?v=3uoqIhG8C44YLTlOAiTRKgchrJ08w1e75TZJapvoLK3CjGAgDfN5eNtmS6KV3p_WNQwpoSqt76k0HuPEO0x5y3_hxpp_WmcQ&uniplatform=NZKPT (accessed on 26 June 2023).
  66. Yang, H. Public Policy Studies; Renmin University of China Press: Beijing, China, 2020. [Google Scholar]
Figure 1. Location of the study area.
Atmosphere 14 01097 g001
Figure 2. The Box-plot of PM2.5 time change trend in YREB.
Atmosphere 14 01097 g002
Figure 3. The Box-plot of PM2.5 time change trend in CCUA, MYRUA, and YRDUA.
Atmosphere 14 01097 g003
Figure 4. Spatial distribution map of PM2.5 mean value at the county level during 2000–2021. Note: the green boundary line indicates the boundary of the urban agglomerations.
Atmosphere 14 01097 g004
Figure 5. Center and spatial change central tracks of PM2.5 and LUI. Note: (a) represents the trend in spatial trajectories of PM2.5, while (b) illustrates the trend in spatial trajectories of LUI.
Atmosphere 14 01097 g005
Figure 6. The Box-plot of LUI time change trend in YREB.
Atmosphere 14 01097 g006
Figure 7. The Box-plot of LUI time change trend in CCUA, MYRUA, and YRDUA.
Atmosphere 14 01097 g007
Figure 8. Spatial distribution map of LUI value at the county level during 2000–2021. Note: the green boundary line indicates the boundary of the urban agglomerations.
Atmosphere 14 01097 g008
Figure 9. Spatial distribution map of the level of decoupling between LUI and PM2.5 during 2000–2021. Note: the green boundary line indicates the boundary of the urban agglomerations.
Atmosphere 14 01097 g009
Table 1. Evaluation of decoupling level between LUI and PM2.5.
Decoupling Status %∆LUI %∆MPM2.5 DIt1−t2
DecouplingStrong decoupling+DI < 0
Weak decoupling++0 ≤ DI < 0.8
Negative DecouplingExpansion negative decoupling++DI ≥ 1.2
Strong negative decoupling + DI < 0
Weak negative decoupling 0 ≤ DI < 0.8
Recessive decoupling DI ≥ 1.2
Connection Expansion connection + + 0.8 ≤ DI ≤ 1.2
Recessive connection 0.8 ≤ DI ≤ 1.2
Note: “−” means reduced LUI or PM2.5, and “+” means increased.
Table 2. Results from Tapio Decoupling Model during 2000–2021.
Decoupling Status2000–20072007–20132013–20212000–2021
Strong decoupling 40.47%23.18%0.00%0.00%
Weak decoupling 56.36%31.31%0.00%0.00%
Expansion negative decoupling 0.84%20.47%0.00%0.00%
Strong negative decoupling 0.56%15.33%67.01%71.12%
Weak negative decoupling 0.09%1.21%32.62%24.86%
Recessive decoupling 1.31%2.52%0.19%1.50%
Expansion connection 0.37%5.61%0.00%0.00%
Recessive connection 0.00%0.37%0.19%2.52%
Disclaimer/Publisher’s Note: The statements, opinions and data contained in all publications are solely those of the individual author(s) and contributor(s) and not of MDPI and/or the editor(s). MDPI and/or the editor(s) disclaim responsibility for any injury to people or property resulting from any ideas, methods, instructions or products referred to in the content.