Abstract
This work addresses the chemical characterization of atmospheric aerosols and precipitation in the period from May to November 2019 at Monte Fenton (53.16° S, 71.05° W, 612 m.a.s.l.), 9 km west of Punta Arenas, to study the contribution and distribution of emission sources and chemical enrichment. The main ions (Ca2+, Cl−, K+, Mg2+, Na+, NH4+, NO3− and SO42−) were studied using ion chromatography, and trace elements (Al, Br, Ca, Cl, Cr, Fe, K, Mg, Mn, Na, Ni, P, Pb, S, Se, Si, Ti, V and Zn) using energy dispersive X-ray fluorescence. Ions concentration ranged from 5.0 × 10⁻¹ to 2.9 × 10⁴ mg/m3 for Ca2+ and Cl−, respectively; whilst the concentration of elements varied between 8.8 × 10⁻¹¹ and 2.1 × 10⁻² mg/m3, for crZn (crustal Zn) and Fe, respectively. The electrical conductivity (EC, mean = 32.5 µS/cm) and the pH (mean = 6.8), showed the atmosphere of the study site was relatively neutral compared to the standard pH for rain (or snow) without contamination (pH = 5.6), and presented relatively low levels of conductivity compared to the EC standards for distilled water (0.5 to 3 µS/cm) and seawater (30,000 to 60,000 µS/cm). The main contribution to aerosols in the atmosphere of Monte Fenton came from marine and lithospheric sources, followed by local anthropogenic sources such as burning firewood and/or urban waste for heating production, etc., that led to the enrichment of aerosols with high Fe, K, Mn and V content. The results of this study contribute to filling a gap in knowledge of the chemistry of atmospheric aerosols in Southern Patagonia.
1. Introduction
Aerosols, or suspended particulate matter (PM), are particles with a diameter <10 µm, suspended in the Earth’s atmosphere in a solid or liquid state. They are formed by natural and/or anthropogenic processes and remain suspended for a few hours, days, or even months, depending on their size and the atmospheric conditions that regulate their transport and distribution [1].
Atmospheric aerosols are originated either from natural sources (biological, lithospheric, marine, among others) or as a result of human activities (combustion processes, biomass burning, secondary organic aerosols, nitrates, sulfates, etc.) [2,3]. Atmospheric circulation systems transport aerosols around the planet, which act as cloud condensation nuclei (CCN) at a temperature above 273 K, or as ice nuclei (IN) at temperatures between 235 (−38 °C) and 273 K (0 °C), to form liquid or solid precipitation respectively [4,5].
Aerosols eventually reach the Earth’s surface (land and sea) through wet or dry deposition (WD/DD) phenomena [6]. In WD, aerosols have captured enough water vapor from the surrounding atmosphere to form wet precipitation, a phenomenon influenced by gravity and wind speed and direction [7,8,9]. In the case of DD (without precipitation), the main factors involved are gravity and air density [8]. For atmospheric sampling purposes, the transfer of chemical species from the atmosphere to the Earth’s surface by both wet and dry deposition is known as total deposition (TD); (TD = WD + DD) [10,11].
Aerosols play an important role in the formation of precipitation and its accumulation on the Earth’s surface. Those found in accumulated snow are fundamental in the formation and maintenance of the cryosphere since darker particles increase the absorption of solar radiation, causing more melting [12,13,14]. Thus, aerosols might have enhanced the reduction of ice masses observed in recent years for glaciers at a global and regional level, a phenomenon mainly attributed to global warming [15]. However, despite the significance of aerosols in these and other atmospheric processes, only a few studies have been reported in Southern Patagonia [16,17,18,19,20,21], being the most recent research focused preferentially on the Antarctic continent [22] and other northern regions [23,24,25,26,27,28,29,30,31].
This work presents the results of the collection and chemical characterization of precipitation (liquid and solid) and suspended particulate material (SPM) [32], carried out between May and November 2019 at Monte Fenton (MF), in the Magellan Province, Chilean Southern Patagonia, with the aim of contributing to the study of atmospheric chemistry in the region.
2. Materials and Methods
2.1. Description of the Study Area
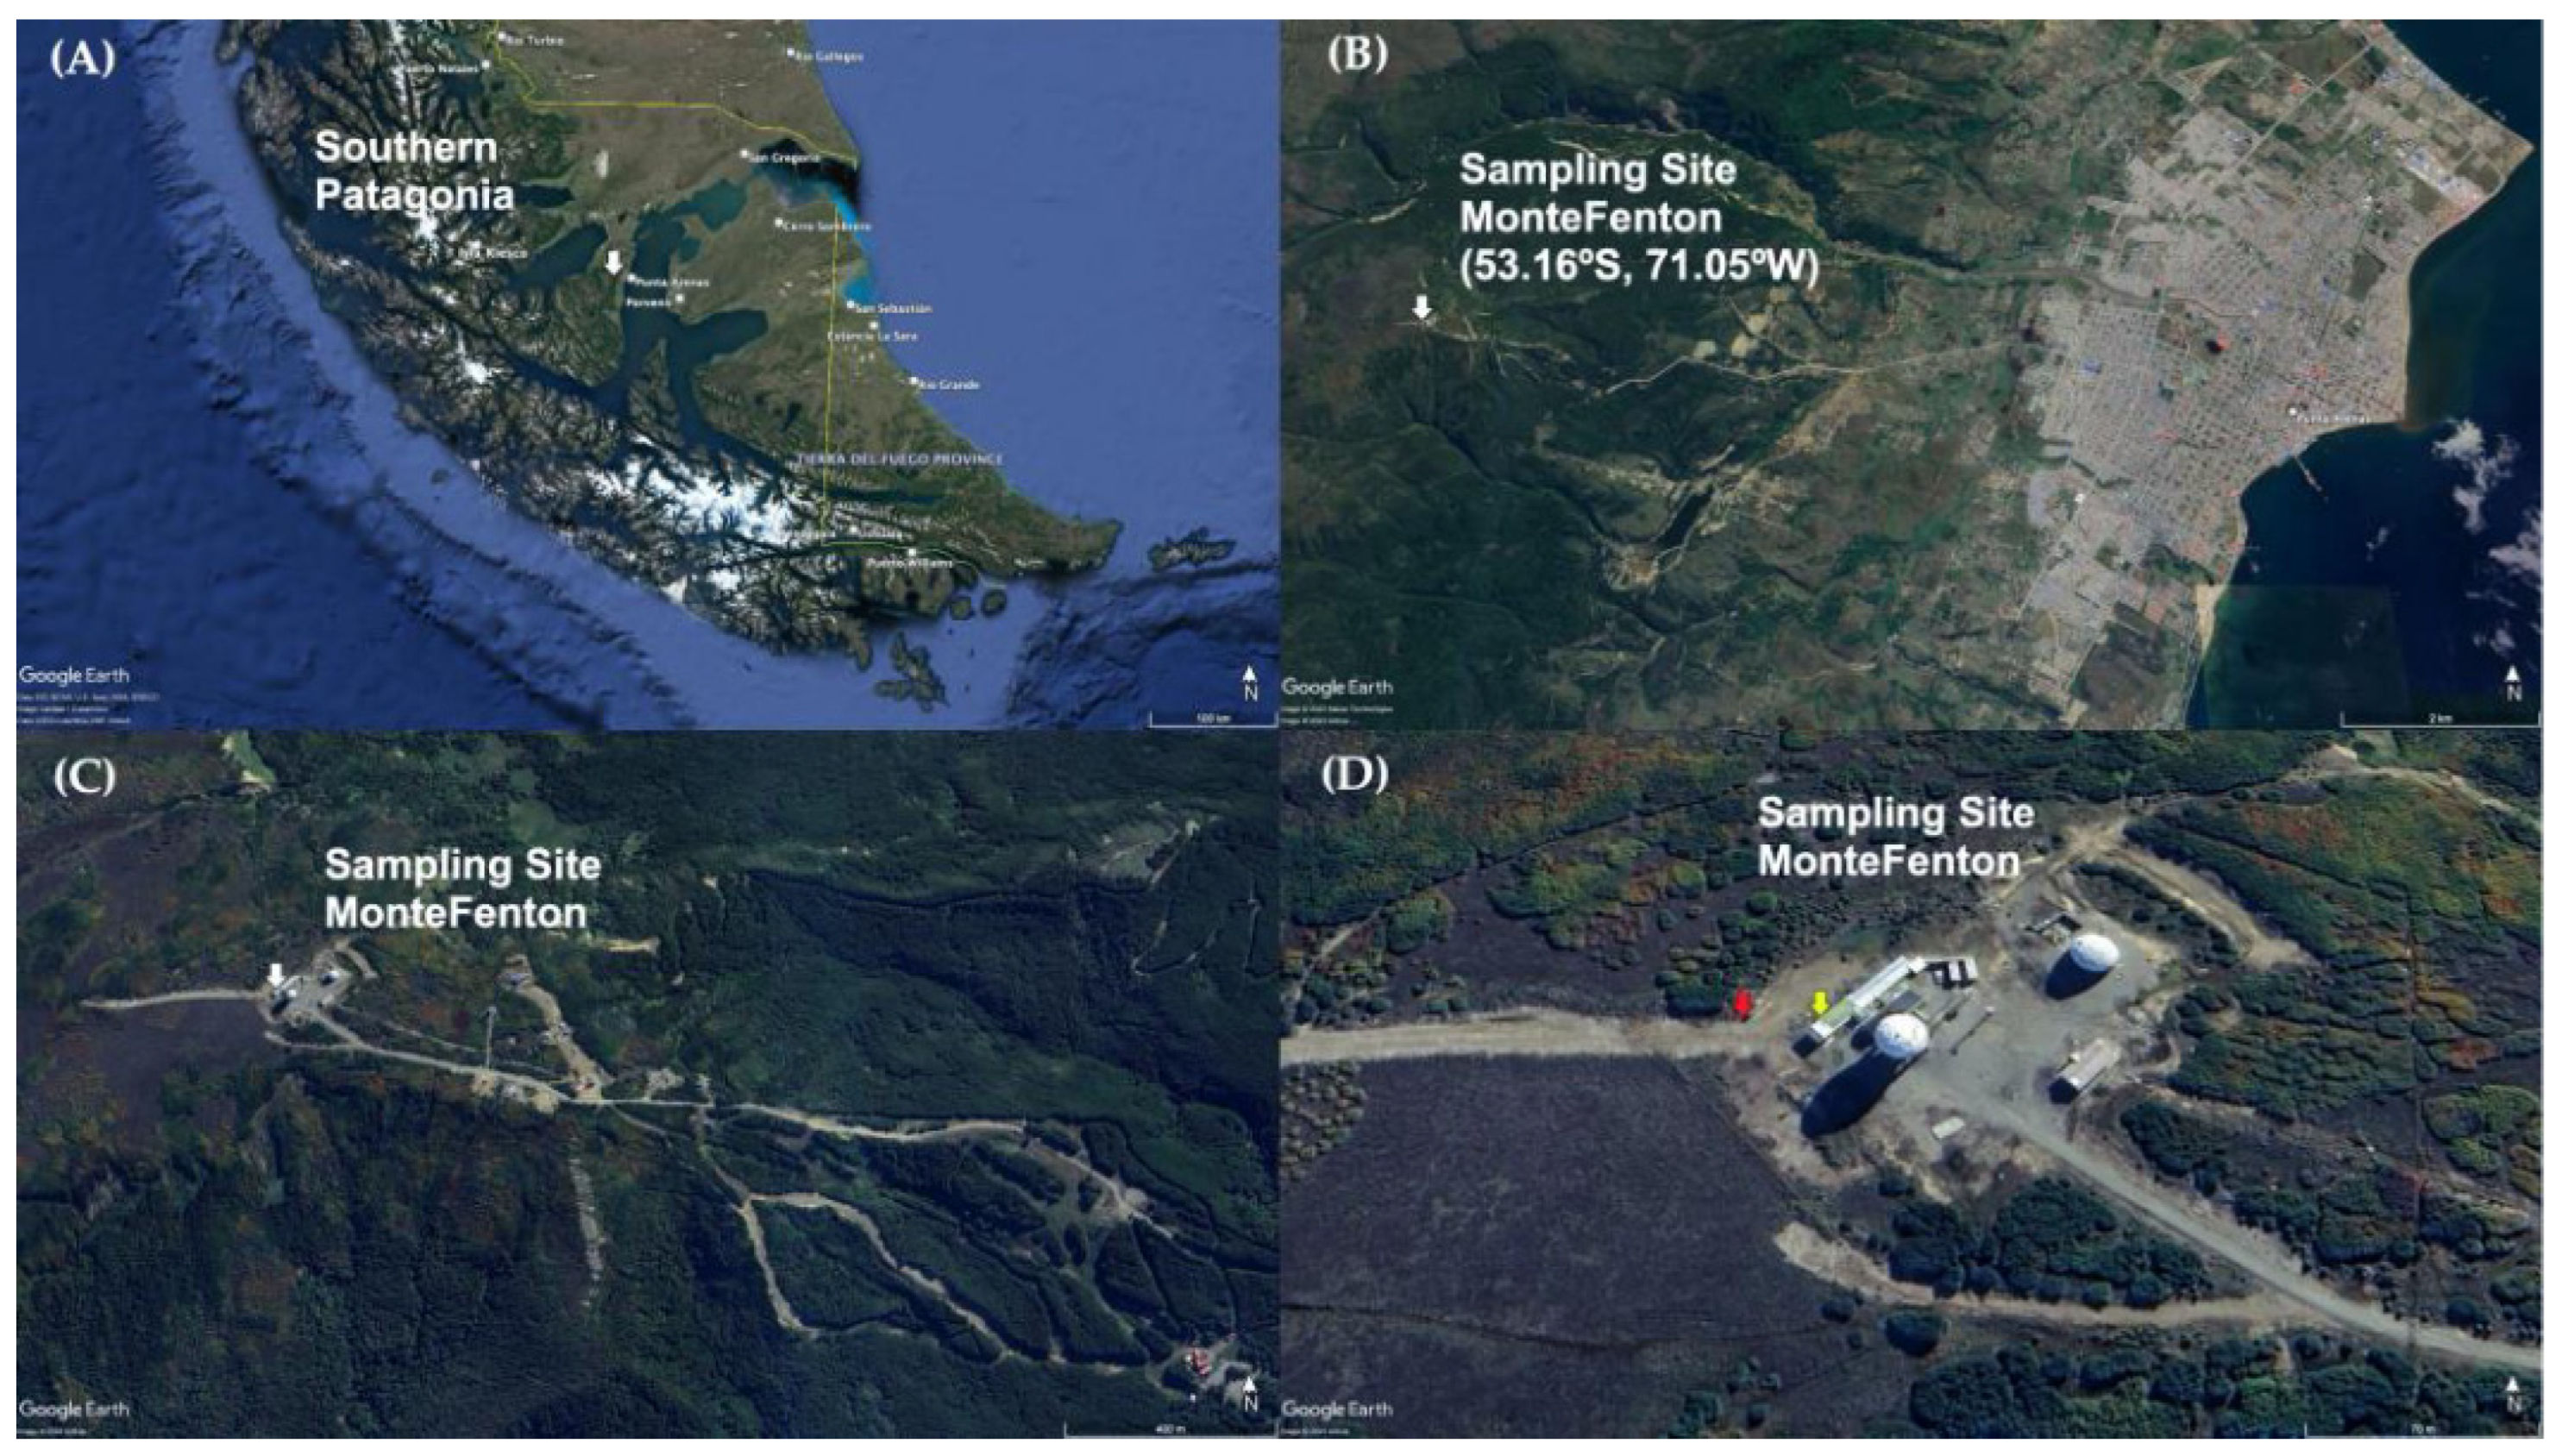
Figure 1 shows the study site, located at MF (53.16° S, 71.05° W, 612 m.a.s.l.), a mountainous area 9 km west of the city of Punta Arenas (PA) (Figure 1B), locally known as the Cerro Mirador. This hill has an approximate area of 312 km2, it is surrounded by a forest rich in Nothofagus pumilio (lenga trees), and its eastern slopes are used by a ski center (Club Andino de Punta Arenas) (Figure 1C). The sampling collector was located at the western end of the hill summit, on the premises of “Base Gavilán” of the Chilean Air Force (Fuerza Aérea de Chile or FACh, its acronym in Spanish) (Figure 1D). This place was chosen as the highest point easily accessible in the vicinity of the city and because it has a low human impact, making it appropriate for studying the natural atmospheric chemistry in the study area.
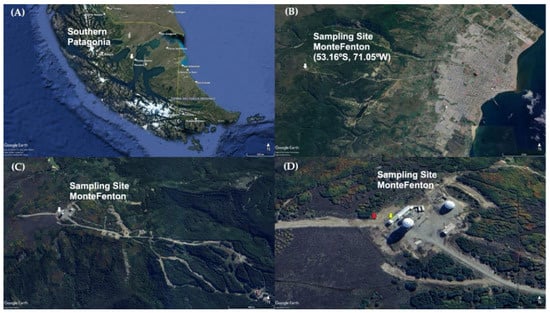
Figure 1.
Location of the sampling site Monte Fenton (white arrow) in (A) the Chilean Magellan Province, Southern Patagonia; (B) a view including the city of Punta Arenas; (C) aerial view of the Club Andino area, and (D) a close up of the Base Gavilán, with location of total deposition passive collector (TDPC) (red arrow) and Automatic Meterorological Station (yellow arrow). Adapted from Google Earth, https://tinyurl.com/2a9z6ah4, (accessed on 24 April 2023). All rights reserved 2023 by Google. Adapted with permission of the author.
2.2. Data Available and Obtained for This Study
At the Base Gavilán, meteorological data of temperature and relative humidity (RH) are regularly recorded using an HMP155A 22280-10 sensor (Manufactured by Vaisala, Vantaa, Finland) and wind direction using a Young 81000 anemometer (Manufactured by R. M. Young Company, Traverse City, MI, USA).
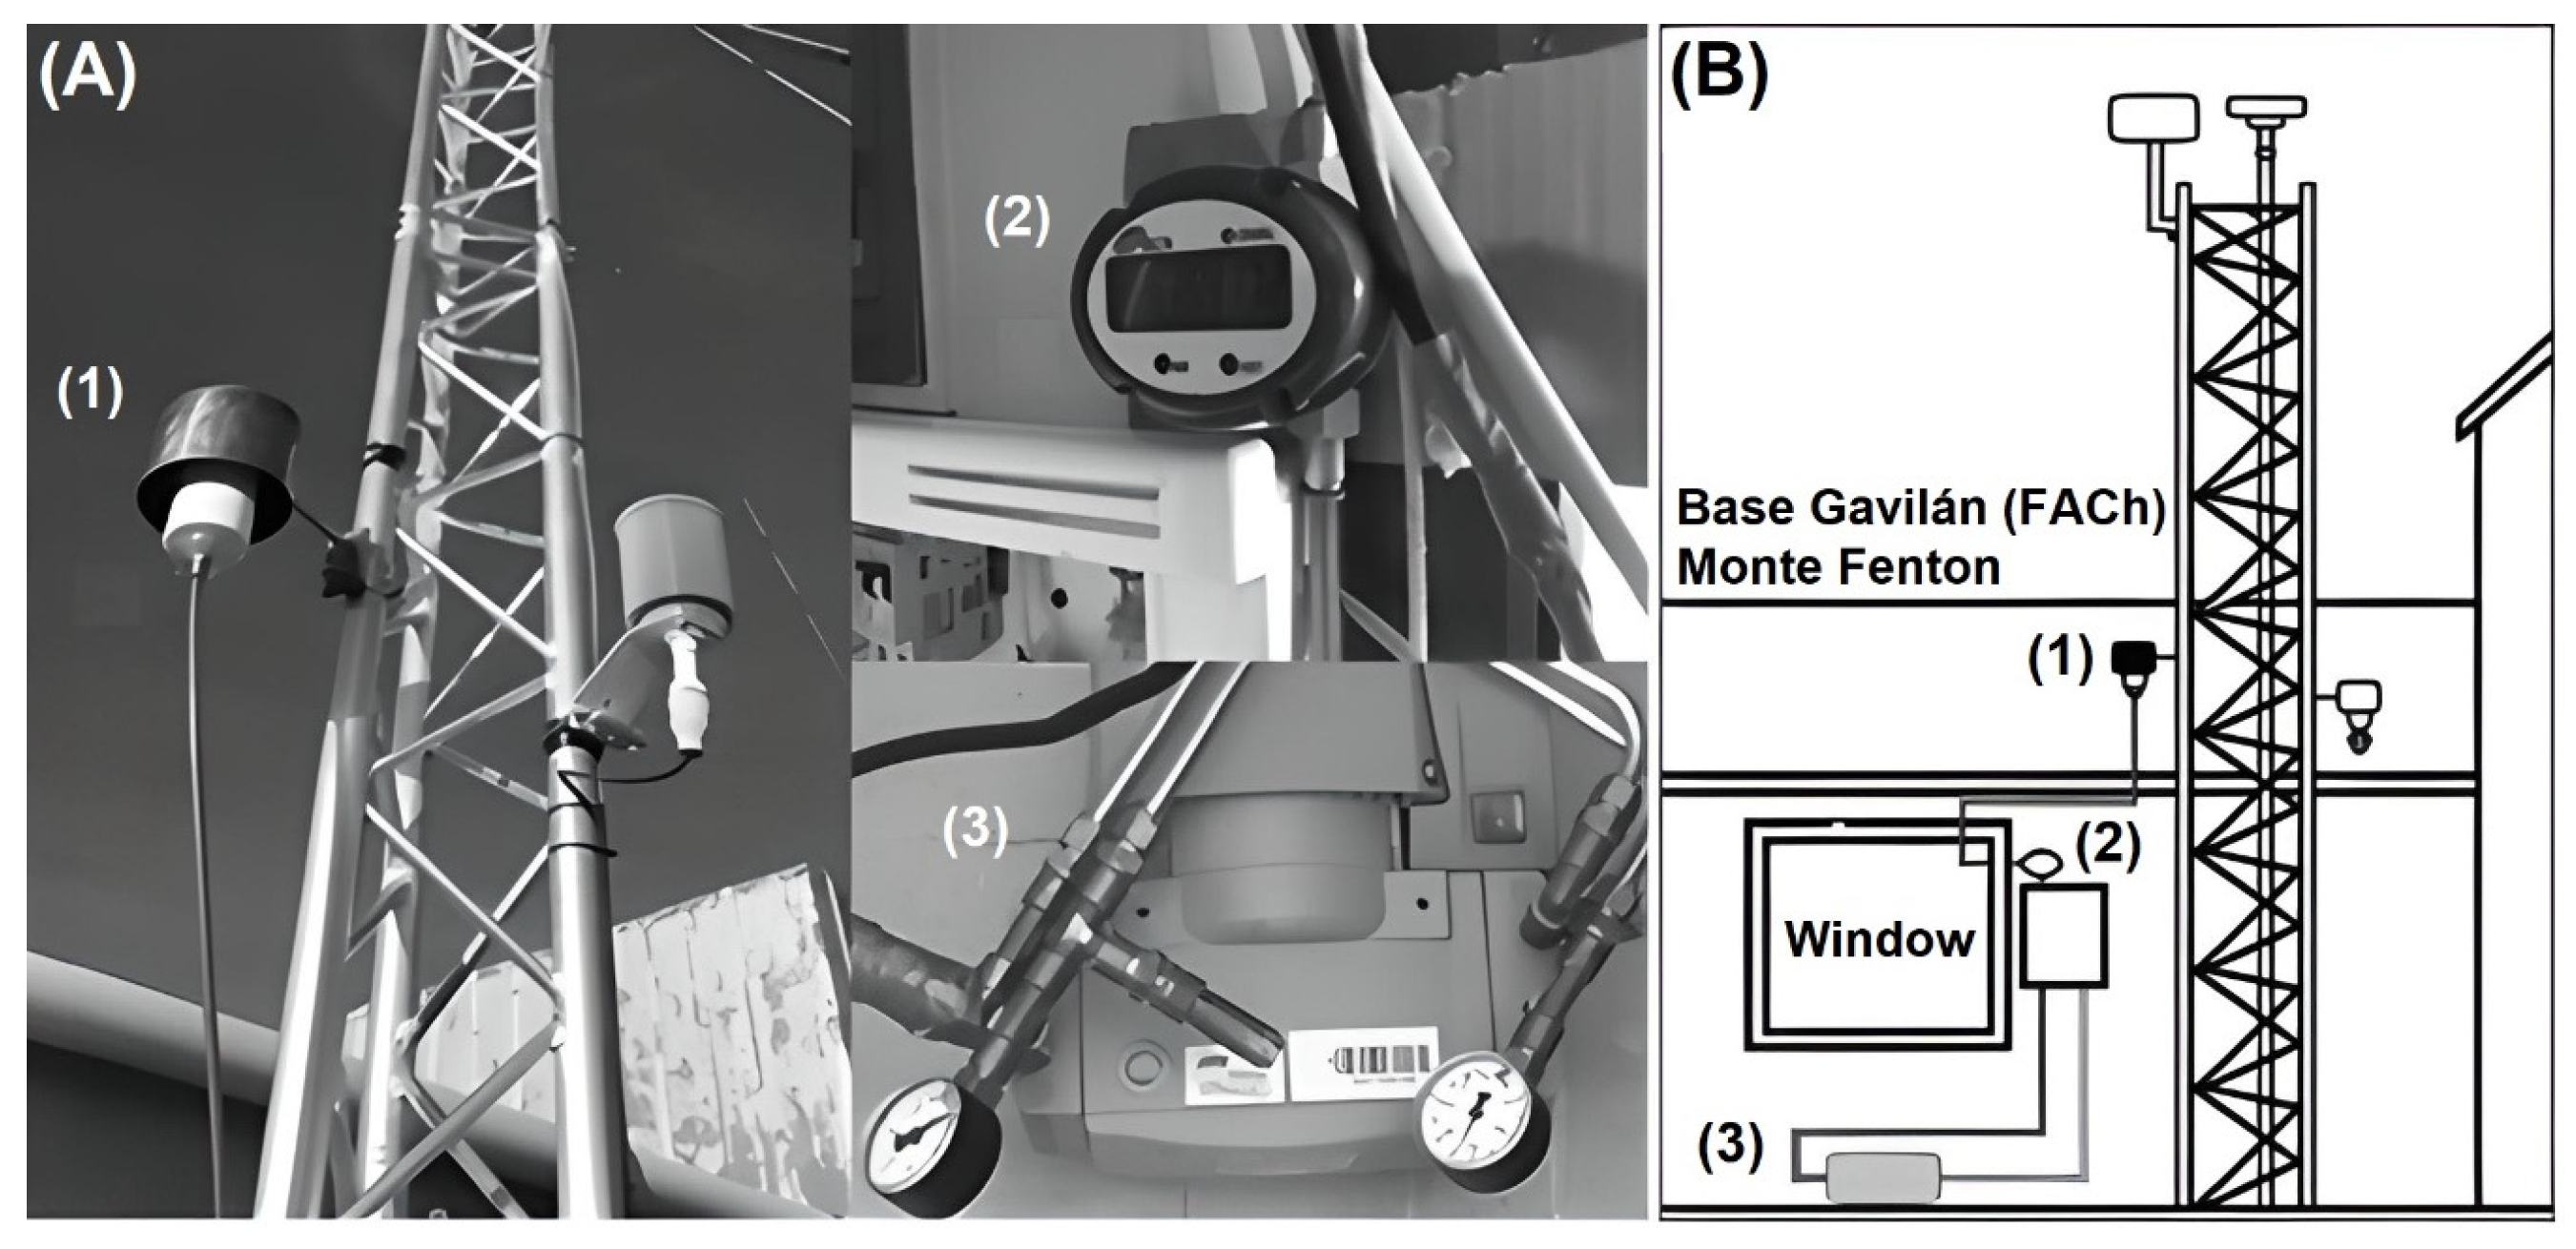
Atmospheric aerosols were captured by direct filtration using a low-volume air monitoring system implemented by the Laboratorio de Investigaciones Atmosféricas (LIA) from the Universidad de Magallanes (UMAG) (Figure 2A). The low-volume system consists of an air inlet (1) with an aerodynamic diameter cut for 2.5 µm particles (PM2.5), where there is a filter holder and a 47 mm diameter, 0.2 µm porosity, polycarbonate membrane filter set at 2.5 m above the ground. An OVAL Eggs DELTA vortex flowmeter (2), within an air suction system, generated by a ME 4R NT VACUUBRAND vacuum pump with a timer (3) for a continuous and constant volumetric airflow of 16 L/min (Figure 2B). Employing this low-volume system, 22 samples of atmospheric aerosols were obtained in weekly exposure periods.
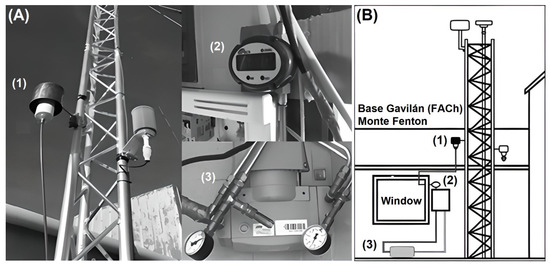
Figure 2.
Low-volume sampling system at Monte Fenton (A) Images of parts ((1) air inlet, (2) flowmeter and (3) vacuum pump); (B) Assembly diagram of the system.
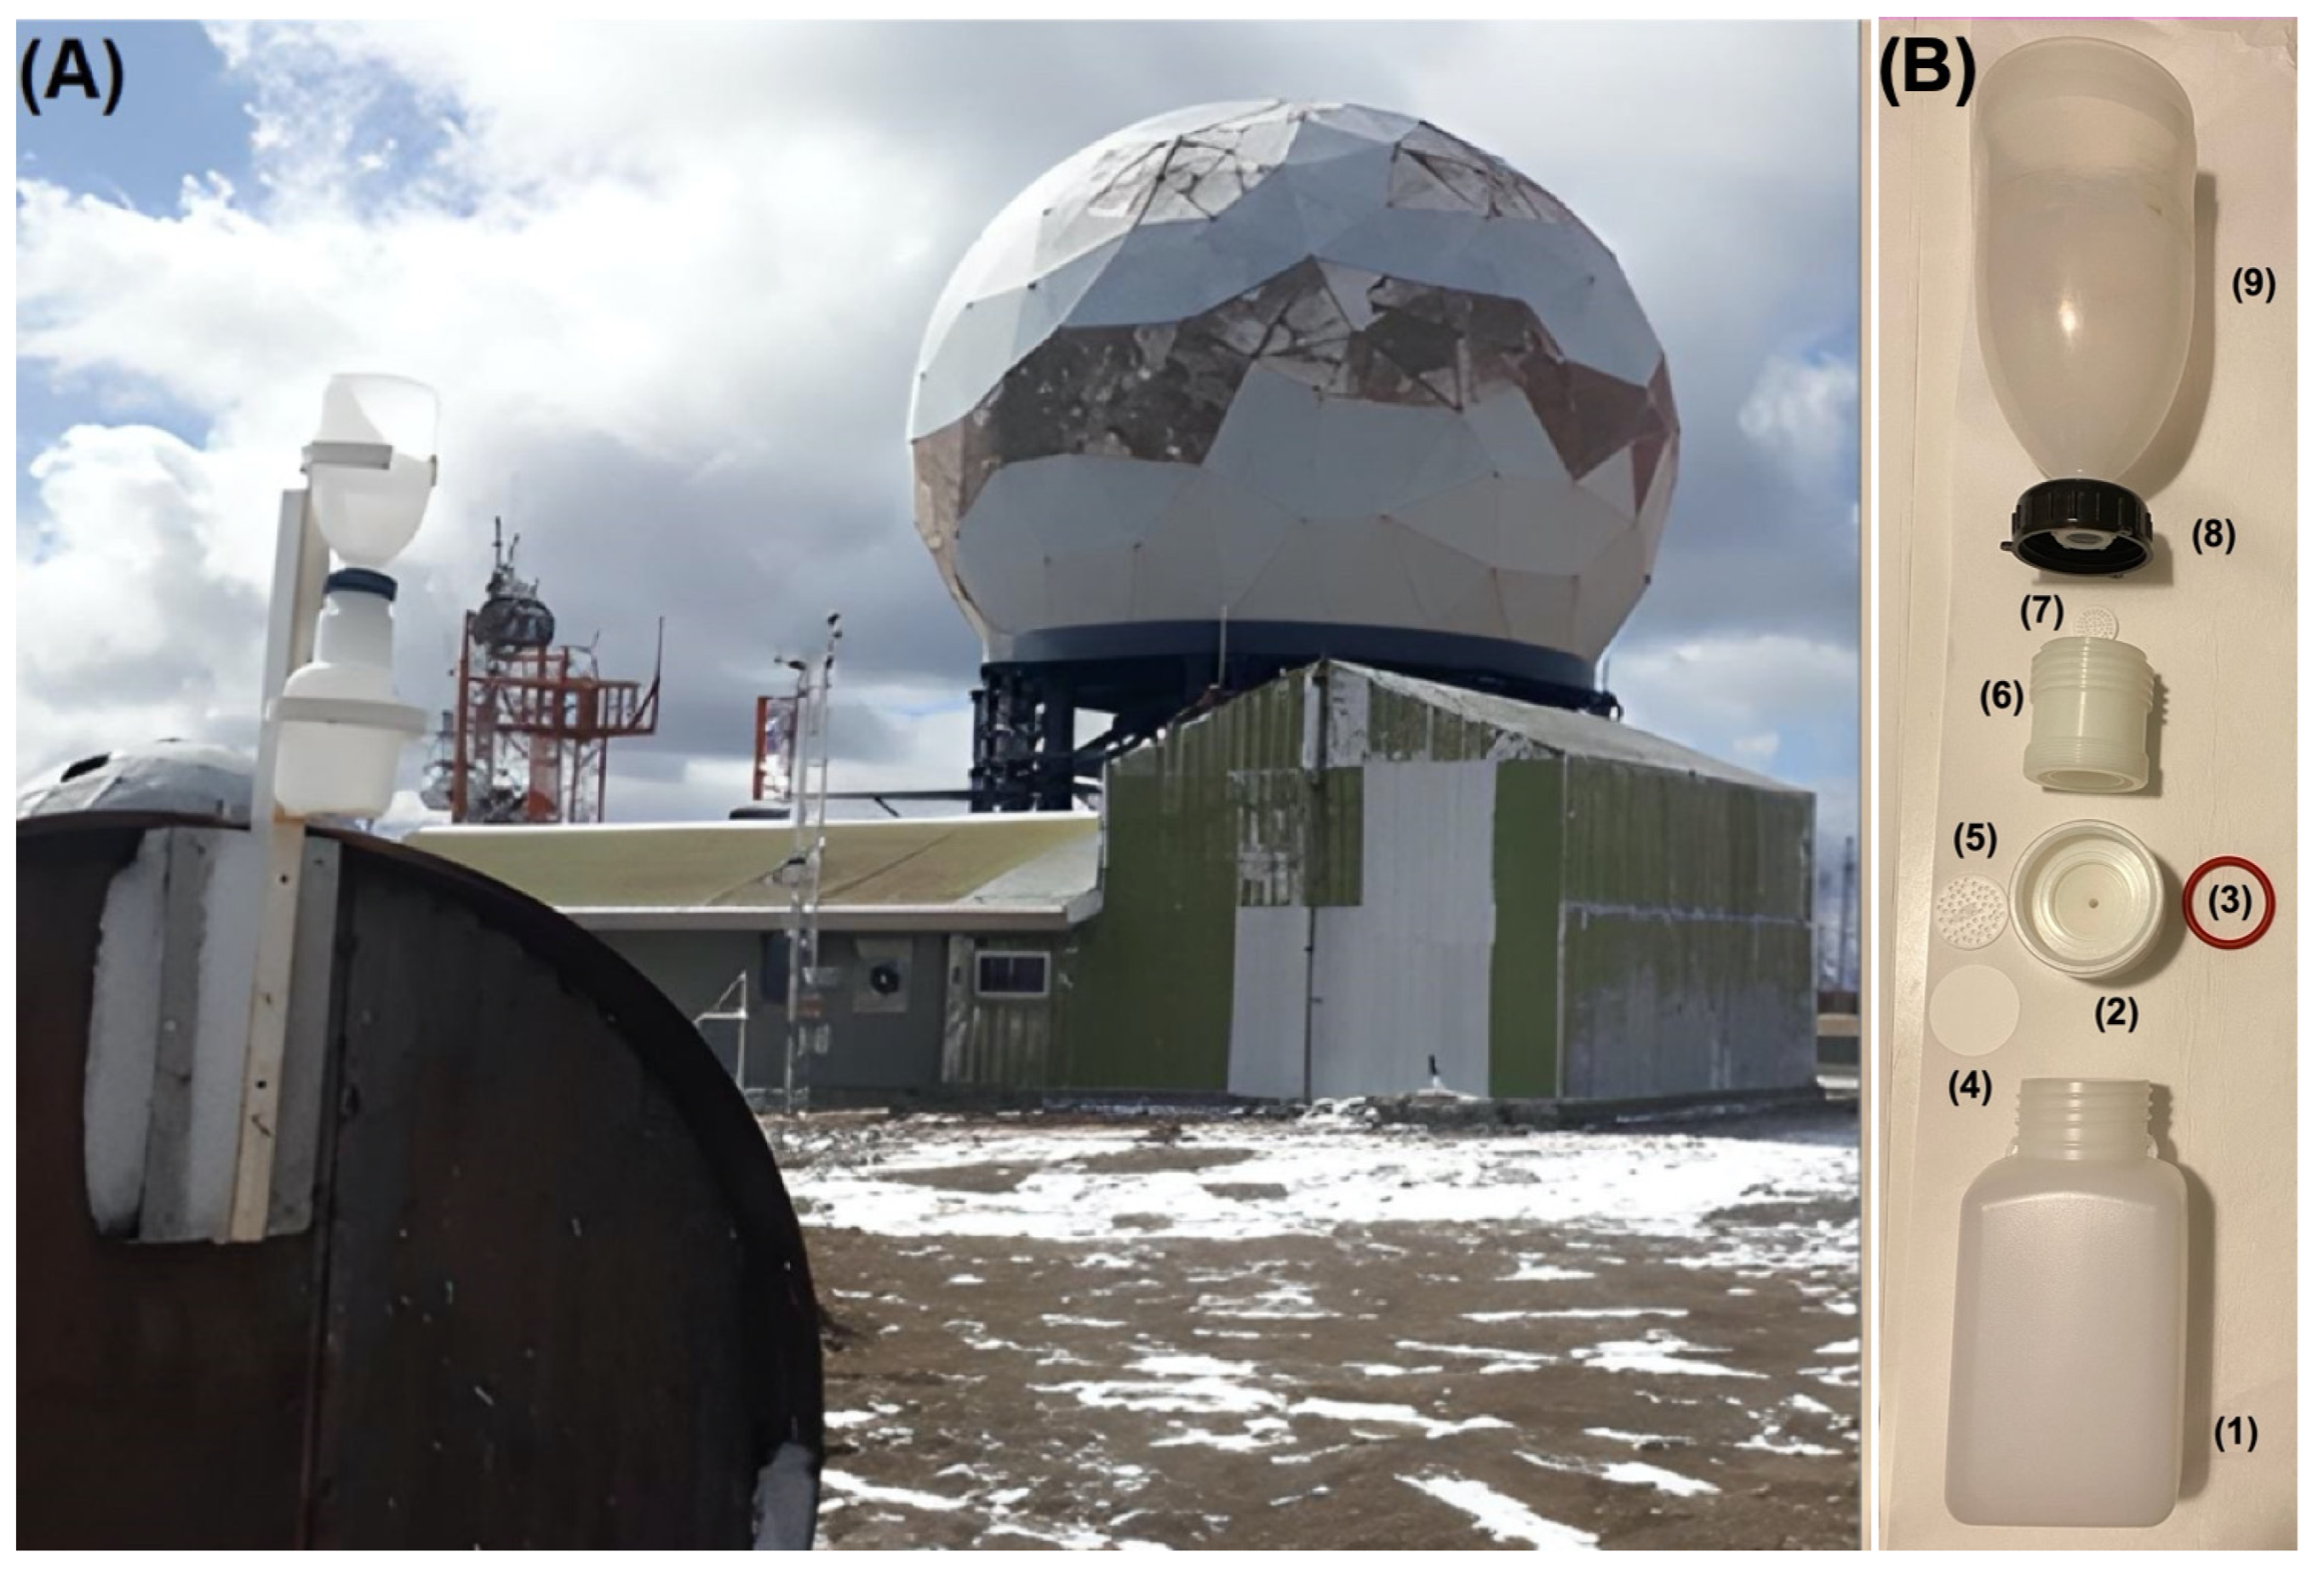
TD was collected, between 5 June and 20 November 2019, using total deposition passive collectors (TDPC), adapting the method in [3]. These collectors were installed 20 m from Base Gavilán and 2 m above the ground (Figure 3A). Each TDPC is composed of a polyethylene receiving bottle (1) for WD, a polypropylene container (2), a silicone O-ring (3), a 47 mm quartz filter and 0.45 µm pore diameter (4), a 40 mm diameter Teflon filter holder (5) in which a quartz filter (47 mm diameter) is deposited, a polypropylene adapter (6), a 25 mm diameter perforated Teflon disc (7) with 0.5 mm pore diameter, a polypropylene ring (8) and a polyethylene collecting funnel (9) of 115 cm in diameter and 30 cm in height (Figure 3B). Using this TDPC, 10 TD samples were obtained in weekly exposure periods.
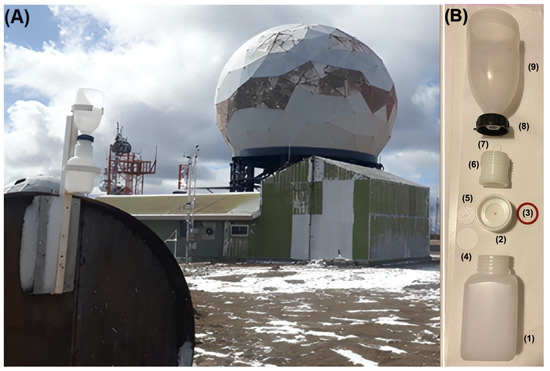
Figure 3.
(A) Location of the TDPC at Base Gavilán on Monte Fenton; (B) Diagram of the TDPC (Each TDPC is composed of a polyethylene receiving bottle (1) for WD, a polypropylene container (2), a silicone O-ring (3), a 47 mm quartz filter and 0.45 µm pore diameter (4), a 40 mm diameter Teflon filter holder in which a quartz filter (5) (47 mm diameter) is deposited, a polypropylene adapter (6), a 25 mm diameter perforated Teflon disc with 0.5 mm pore diameter (7), a polypropylene ring (8) and a polyethylene collecting funnel (9) of 115 cm in diameter and 30 cm in height).
The total concentration of atmospheric aerosols deposited was determined by the Department of Monitoring Networks: Air Quality Division of the Ministry of the Environment in Santiago, Chile, by applying the gravimetric method to the polycarbonate filters used in the low-volume system. For this, every filter was weighed before and after exposure to obtain the total concentration of aerosols, dividing the sample mass in the filter by the volume of air sampled. The weighing was carried out under stable environmental conditions, with RH between 30 and 40%, and temperature between 21 and 25 °C. The filters were previously acclimated in desiccators for 48 h, and a filter without a sample (“blank”) was used as a reference, subject to the same conditions as the sampled filters.
The chemical concentration of the elements (mg/m3): Al, Br, Ca, Cl, Cr, Fe, K, Mg, Mn, Na, Ni, P, Pb, S, Se, Si, Ti, V and Zn in the polycarbonate filters, was determined by the Laboratory for the Analysis of Atmospheric Processes of the Institute of Astronomy, Geophysics and Atmospheric Sciences of the University of São Paulo, Brazil (Laboratório de Análise dos Processos Atmosféricos or LAPAT-IAG-USP for its acronym in Portuguese). The method applied was XRF (X-ray fluorescence) spectrometry, using a Shimadzu EDX-700 spectrometer, which uses Energy Dispersive X rays (EDX) and a Silicon (Lithium) or Si (Li) semiconductor detector to scan and measure elements in the range from sodium to uranium (11 (Na) to 92 (U)). Previous to the analysis, the sampled polycarbonate filters were placed in a room at constant conditions of 20 °C and between 30 and 40 ± 5% of relative humidity for 24 h. A blank filter was used as a reference in the analysis.
The EDX analysis takes approximately 16 min per filter. EDX generates a spectrum that for the analysis was split into two, one with high energy elements (Z from 21 to 82) and one with low energy elements (Z from 11 to 20). The spectrum was then fitted using WinQxas (Quantitative X-Ray Analysis System for Windows [33].
TD in the TDPCs was obtained from the WD + DD collected in the polyethylene bottles (Figure 3B) during the sampling period. Once the TDPC was removed from the study site, the collecting funnel was washed with Milli-Q water (200 mL) to obtain the remaining DD. This washing water containing the DD was added to the WD in the polyethylene bottle, thus obtaining the TD. These samples were stored at −20 °C. Subsequently, the quartz filters are weighed before the analysis of these samples and acclimated for at least 24 h, at controlled ambient conditions with RH of 50%, 25 °C, and 1 atm, in a room conditioned for this purpose [3].
The pH and electrical conductivity (EC, µS/cm) were measured for the TD samples using a digital benchtop pH-meter for water quality, Super Scientific 860033 Benchtop, and an RCT magnetic stirrer basic IKA LABORTECHNIK, respectively. The pH meter was calibrated using two buffer standards, for pH 4.0 (HI-7004) and 7.0 (HI-7007), while the EC meter was calibrated using a HI-7031L solution, 1413 µS/cm. The concentration of major ions (mg/m3) NH4+, Ca2+, Cl−, Mg2+, NO3−, K+, Na+ and SO42− in the TD samples were obtained by using an 850 Professional ion chromatograph from Metrohm, Switzerland [34], and quantified through an external calibration curve for each ion. All standards were obtained from Sigma-Aldrich (Germany).
The contribution (%Xi) of different ions or elements to the total concentration during the 2019 campaign was calculated using Equation (1), where [Xi] is the total concentration of the ion or element under consideration, and ∑[Xi] is the sum of the concentrations of all ions or elements. Then, the ion concentration series were correlated (R2) with pH and EC data to determine the type of ions that could have conditioned the MF atmosphere during the 2019 campaign.
To differentiate between aerosol sources, non-sea salt fractions (nss) of ions were determined using Equation (2), where [X1] is the concentration of the K+ or SO42− ion, [Y1] is the concentration of the Na+ ion used as a reference, given its abundance (in ppm) in the ocean, and ([X1]/[Y1])ocean is the ratio of the concentration of K+ or SO42− ions concerning the Na+ ion in the ocean, obtained from the literature: [K+]/[Na+] = 0.037; [SO42−]/[Na+]) = 0.252 [35,36].
The non-crustal fraction (ncr) of elements was determined using Equation (3), where [X2] is the concentration of the Ca, K, Mg, Na or Zn element, [Y2] is the concentration of the Al element used as a reference, given its abundance (in ppm) in the Earth’s crust, and ([X2]/[Y2])crust is the ratio between the concentration of the Ca, K, Mg, Na or Zn element and the Al element, in the Earth’s crust, obtained from literature: [Ca]/[Al] = 0.592; [K]/[Al] = 0.160; [Mg]/[Al] = 0.384; [Na]/[Al] = 0.258; [Zn]/[Al] = 0.001 [37,38].
The crustal fraction (cr) of element X2 was obtained by subtracting non-crustal concentration (ncr) from the total concentration of the element (X2). The sea-salt fraction (ss) of ions X1 was obtained by subtracting non-sea salt concentration (nss) from the total concentration of the ion (X1).
Principal Component Analysis (PCA) with Varimax rotation was applied to the concentration series of ions and elements in the atmospheric aerosols and TD samples separately to maximize the number of loading patterns without changing the total variance or the variance of the ion and element data used. For the analysis and interpretation of results, only factors with eigenvalues greater than 1 were considered [39].
PCA analysis is a technique used to convert a data set (or observations) of correlated variables, based on the arithmetic mean of the data, into a set of linearly uncorrelated orthogonal variables called principal components. These components are ordered according to the variance (or degree of variability or dispersion) that the data describes [40]. From the Varimax rotation of chemical concentrations, the ions or elements originating from the same source correspond to a single component of high weight or loading. By applying PCA using a chemical concentration of ions or elements, loadings with values of |0.7| or higher can be obtained and associated with different aerosol emission sources [39].
To establish the contribution of ions and elements in the TD and atmospheric aerosols, respectively, Enrichment Factors (EF) were determined using the adapted Equation (4) [41]. The enrichment of the Ca2+, Cl−, Mg2+, K+ or SO42− ion (X) (EF(X))was calculated with respect to the Na+ ion from the ocean, while the enrichment of the Ca, Fe, K, Mg, Mn, Na, P, Si, Ti or V element (X), with respect to the Al element from the Earth’s crust.
(X/Y)aerosol is the concentration ratio between an ion or element (X) and the reference Na+ ion or Al element (Y) in the aerosol sample. (X/Y)source is the concentration ratio between the ion or element (X) and the reference Na+ ion or Al element (Y), in a known source of aerosol emission (such as the ocean or the soil), with Na+ and Al used as reference (Y) values, given their abundance (in ppm) in the ocean and the Earth’s crust, respectively [34,35,36,37]. The values of (X/Y)source ((X/Na+)ocean) used for the ion enrichment regarding the ocean were obtained from the literature: [Ca2+]/[Na+] = 0.038; [Cl−]/[Na+] = 1.802; [Mg2+]/[Na+] = 0.118; [K+]/[Na+] = 0.037; [SO42−]/[Na+] = 0.252 [28,29]. The values of (X/Al)source ((X/Al)crust) used for the element enrichment concerning the Earth’s crust, were obtained from the literature: [Ca]/[Al] = 0.592; [Fe]/[Al] = 0.695; [K]/[Al] = 0.160; [Mg]/[Al] = 0.384; [Mn]/[Al] = 0.011; [Na]/[Al] = 0.258; [P]/[Al] = 0.011; [Si]/[Al] = 3.304; [Ti]/[Al] = 0.061; [V]/[Al] = 0.002 [37,38].
To interpret the EF(X) of ions and elements, a numerical scale was considered: minimal enrichment (below 2), moderate enrichment (between 2 and 5), significant enrichment (between 5 and 20), high enrichment (between 20 and 40), extreme enrichment (above 40) [42].
3. Results
3.1. Meteorological Data
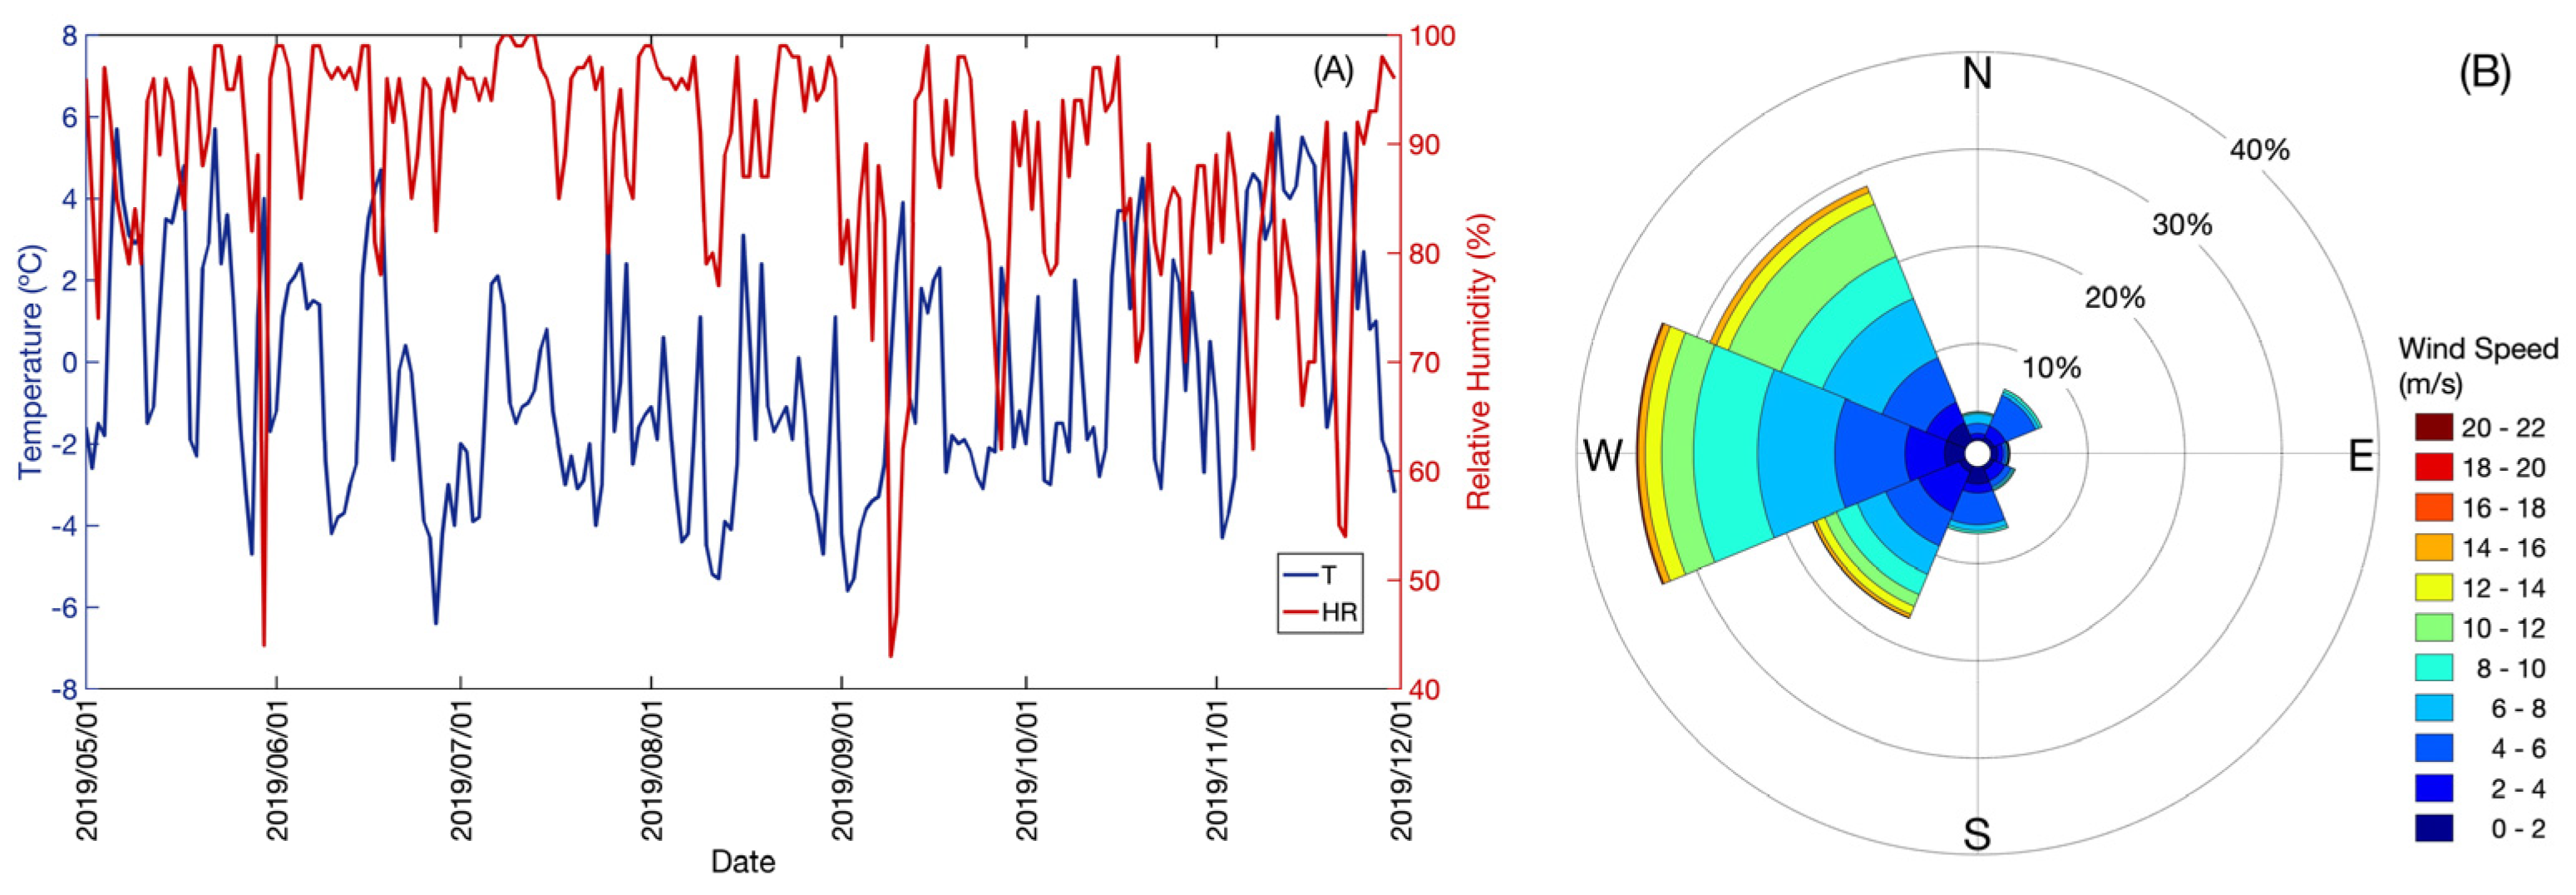
At the Base Gavilán, between 1 May and 30 November 2019, average daily temperature values were recorded between a minimum of −6.4 °C and a maximum of 6.0 °C, average daily RH values between a minimum of 42.8% and a maximum of 99.8% (Figure 4A), and distribution of the wind direction: west (W) (33%), northwest (NW) (28%), southwest (SW) (18%), south (S) (7%), northeast (NE) (6%), north (N) (4%), southeast (SE) (2%), east (E) (1%) and calm (1%) (Figure 4B).
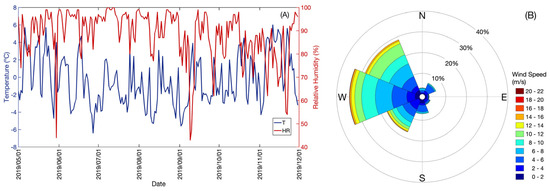
Figure 4.
(A) Record of mean daily temperature (T (°C), blue color line), mean daily relative humidity (RH (%), red color line); (B) Monte Fenton wind rose between 1 May and 30 November 2019.
The 10 TD samples in the TDPCs and the 22 atmospheric aerosol samples in the polycarbonate filters totalized 25 sampling periods between 8 May and 20 November 2019. For each sampling period, mean temperature (°C), mean RH (%), and mode of wind direction values were recorded (Table 1).

Table 1.
Sample collection periods in total deposition passive collectors (TDPC) and polycarbonate filters, and records of mean temperature (T (°C)), mean relative humidity (RH (%)), and mode of wind direction for sampling at Monte Fenton, May–November 2019.
3.2. Chemical Concentrations Results
Table 2 shows the concentration records (mean, minimum, and maximum in mg/m3) of elements in the atmospheric aerosols of the polycarbonate filters during the collection period from May–November 2019. These values varied between a minimum of 8.8 × 10⁻¹¹ and a maximum of 2.1 × 10⁻² mg/m3, for the crZn and Fe elements, respectively. During the 2019 campaign, a total sample (∑[Xi], as atmospheric aerosols) of 4.3 × 10⁻² mg/m3 was collected. From this, the percentages of the total concentration of elements during the 2019 campaign were obtained, which varied between a minimum of 0.0% and a maximum of 48.3% for the crZn and Fe elements, respectively.

Table 2.
Statistical description and percent distribution (%) of the element concentration series (mg/m3) for aerosol samples from polycarbonate filters during the study period May–November 2019.
Table 3 shows the concentration records (mean, minimum, and maximum in mg/m3) of ions in the TD of the TDPCs, during the May–November 2019 collection period. These values varied between a minimum of 5.0 × 10⁻¹ and a maximum of 2.9 × 10⁴ mg/m3 for Ca2+ and Cl− ions, respectively. During the 2019 campaign, a total (∑[Xi], as TD) of 2.1 × 10⁵ mg/m3 was collected. From this, the percentages of total ions concentration during the 2019 campaign were obtained, which varied between a minimum of 0.8% and a maximum of 55.0% for ssK+ and Cl− ions, respectively. The pH values in the TD varied between a minimum of 6.4 and a maximum of 7.4, with a mean of 6.8. The EC values in the TD varied between a minimum of 15.0 and a maximum of 49.6 µS/cm, with a mean of 32.5 µS/cm.

Table 3.
Statistical description and percent distribution (%) of ion concentration (mg/m3) series and measurements of pH and EC (µS/cm), for samples from TDPCs, in the study period (May–November 2019).
Table 4 shows the correlation coefficients (R2) between the series of ion concentrations and pH values in the TD, which varied between a minimum of 0.0 (between Mg2+ and pH) and a maximum of 0.43 (between NH4+ and pH). The correlation coefficients R2, between the series of ion concentrations and the EC values (µS/cm) in the TD, varied between a minimum of 0.0 (between nssSO42− and EC) and a maximum of 0.52 (between Na+ and EC).

Table 4.
Correlation coefficients (R2) between ion concentrations and pH and ion concentrations and EC (µS/cm) for samples from TDPCs, in the period May–November 2019.
Table 5 shows the PCA analysis with Varimax rotation of elements in atmospheric aerosols. PCA analysis shows two factors or components that contribute 85.9% of the accumulated variance. Factor 1 (F1), with a variance percentage of 71.3%, is formed by the elements V, Mn, Fe, Ni, Cr, Pb, Al, crNa, crZn, crCa, Br, crK, ncrNa, Ti, crMg, Se, P and Si. Factor 2 (F2), with a percentage of variance of 14.6%, is formed by the elements Cl, ncrK, and S. In this PCA analysis, the ncrCa, ncrMg, and ncrZn elements do not belong to the main factors.

Table 5.
Factor matrix from Principal Component Analysis (PCA) for elements in atmospheric aerosol samples, May–November 2019. Significant values (values >|0.7|) are indicated in bold.
Table 6 shows the PCA with Varimax rotation for ions in the TD. PCA shows three factors or components contributing 94.6% of the total accumulated variance. Factor 1 (F1), 44.7% variance, is formed by ssSO42−, ssK+, Na+, Mg2+ and Cl− ions. Factor 2 (F2), 33.1% variance, is formed by nssK+, nssSO42− and Ca2+ ions. Factor 3 (F3), 16.8% variance, is formed by NH4+ and NO3− ions.

Table 6.
Factor matrix by Principal Component Analysis (PCA) for ions in the TD, May–November 2019. Significant values (values >|0.7|) are indicated in bold.
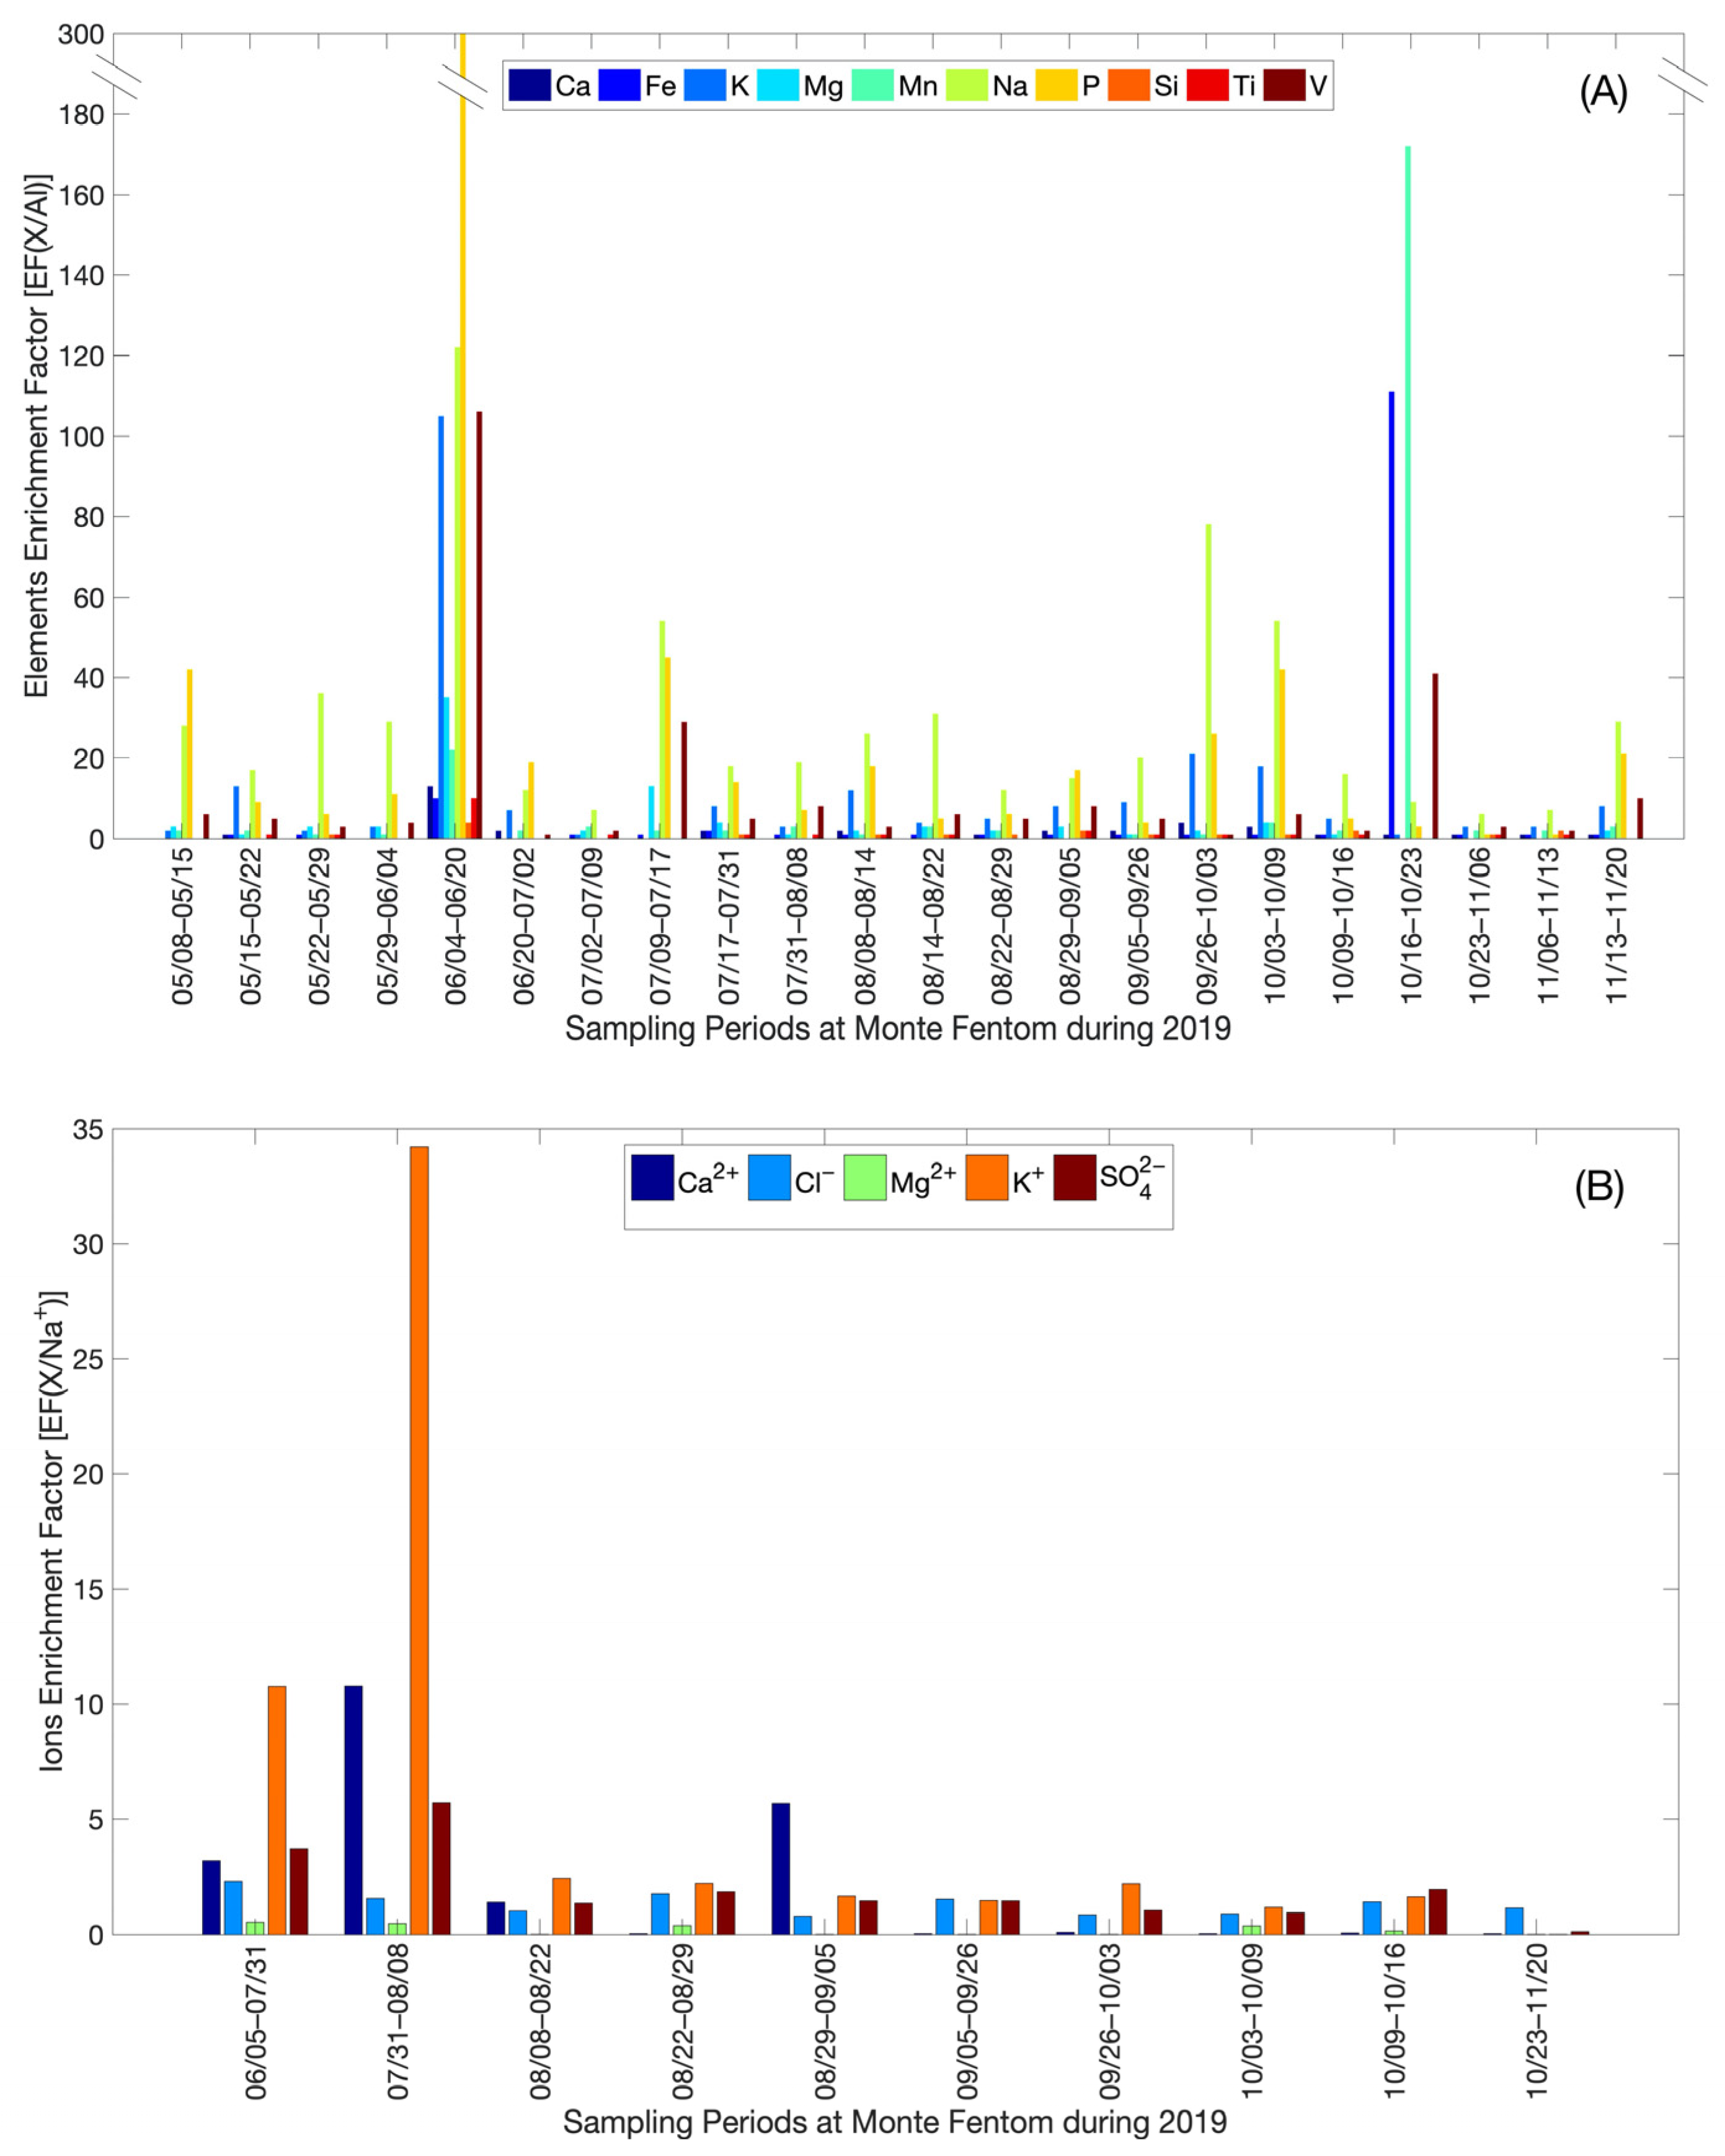
Following the numerical scale of enrichment, the element enrichment factors related to the Al element (EF(X/Al)) (Figure 5A) for atmospheric aerosols varied between a minimum of 9.0 × 10⁻¹¹ (minimum enrichment) and a maximum of 307 (extreme enrichment), for the Si and P elements, respectively. The ion enrichment factors with respect to the Na+ ion (EF(X/Na+)) (Figure 5B) in the TD varied between a minimum of 6.8 × 10⁻³ (minimum enrichment) and a maximum of 34 (high enrichment) for Mg2+ and K+ ions, respectively. The variability of the EF(X) indicates that MF ions and elements comprise both natural (ocean and Earth’s crust) and anthropogenic sources.
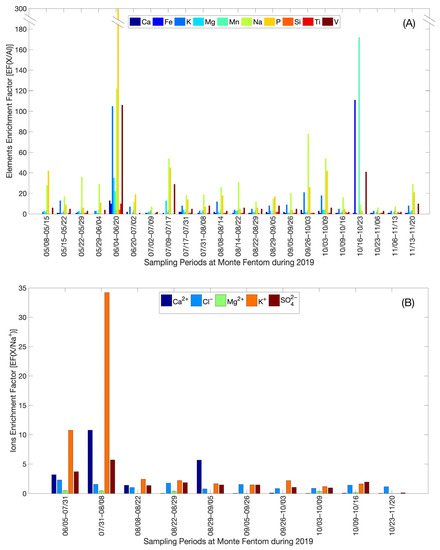
Figure 5.
Enrichment factors (EF) calculated for (A) Ions (EF(X/Na+)); and (B) Elements (EF(X/Al)) for the sampling at Monte Fenton between May–November 2019.
4. Discussion
In the study period, May–November 2019, the pH results in the total deposition of the TDPC collectors of Monte Fenton indicated that the atmosphere of the study site at Base Gavilán was relatively neutral due to a minimum formation of acidic compounds such as hydrogen chloride (HCl), nitric acid (HNO3) or sulfuric acid (H2SO4) [43,44]. This was considered after comparing the obtained average pH of 6.8 (Table 3) with the standard pH value of 5.6 for normal precipitation [45], which can vary between 5.62 and 5.68, and which accounts for the acid (pH < 5.6) or alkaline (pH > 5.6) character of the atmosphere of a site after the generation of neutralization processes of the acidity of rain (or snow). The standard pH value of 5.6 relates to the balance between pure water and the standard pre-industrial atmospheric carbon dioxide (CO2) content dissolved in water (0.033%). This dissolution forms carbonic acid (H2CO3) and produces the acidic pH in the rain (or snow) under unpolluted conditions at 25 °C and 1 atm [46].
The results of electrical conductivity in the total deposition of the TDPC from Monte Fenton indicate that the atmosphere of the study site in Base Gavilán presented relatively low conductivity levels. This was considered after comparing the average value for Electrical Conductivity of 32.5 µS/cm with the standard Electrical Conductivity of distilled water, which varies between 0.5 to 3 µS/cm [47], well below the range for seawater, ranging from 30,000 to 60,000 µS/cm, at 25 °C and 1 atm [48,49,50,51,52]. It is considered that the Electrical Conductivity of the atmosphere of a site decreases, due to the relatively low formation of conductive ions [53], their concentration depending on factors such as altitude, temperature, the concentration of aerosols, etc. [54,55]. For example, the total sum of ions (as a total deposition) obtained in the 2019 campaign was 2.1 × 10⁵ mg/m3. Seawater exceeds this figure, given a standard distribution (in ppm, approximated to 10−3 times the concentration in mg/m3) of Ca (412), Cl (19383), K (397.8), Na (10759) and S (2708.9) [35,36]. This comparison could infer that the low concentration of ions (compared to seawater) produced low conductivity levels in the atmosphere of Monte Fenton.
The correlation results (R2) between pH and ion concentration present values below 0.5. This would indicate that only the NH4+ ion (R2 = 0.43) may be partially associated with the neutralization of the Monte Fenton precipitation, this R2 being a significant value (p > 0.05) with a calculated p of 0.21. The production of NH4+ would be related to the natural emission of ammonia (NH3), which derives from biological sources, such as the processes of nitrification, denitrification, and the natural washing of soils by rains [56].
The correlation results (R2) between electrical conductivity and ion concentration present values below 0.5, except for the Na+ ion. This would indicate that the Na+ ion (R2 = 0.52) may be directly related to the low levels of conductivity at Monte Fenton, this R2 being a significant value (p > 0.05) with a calculated p of 0.13. The production of Na+ would be related to the emission of marine aerosols from marine sources that contribute moisture to Monte Fenton. On a straight line from the sampling site, to the west (most frequent wind direction) is the Otway Sound located 20 km away, and farther westward at 200 km is the South Pacific Ocean. In the opposite direction (less frequent wind direction) is found the Strait of Magellan at 10 km leeward. Thus, the study site receive the contribution of marine aerosols from both west and east wind directions.
The principal component analysis for elements in the atmospheric aerosols from Monte Fenton presents two factors. Factor 1 (cumulative variance 71.3%) brings together the V, Mn, Fe, Ni, Cr, Pb, Al, crNa, crZn, crCa, Br, crK, ncrNa, Ti, crMg, Se, P and Si. It can be attributed to natural sources due to resuspension phenomena since most of the elements in this cluster have significant abundance (in ppm) in the Earth’s crust [37,38]. Factor 2 (85.9% cumulative variance), which brings together the Cl, ncrK and S elements, can also be attributed to natural sources due to the emission of marine aerosols since the elements in this cluster have a significant abundance (in ppm) in the ocean [35,36]. It should be noted that in Factor 1, crNa and ncrNa are grouped and show loading > 0.9. This situation could have arisen during wind events in which Na of marine origin has been transported and deposited in the surroundings of Base Gavilán on Monte Fenton. In addition, soil resuspension phenomena would have allowed marine Na to add to local lithospheric aerosols [50]. On the other hand, at Monte Fenton ncrNa constitutes the dominant contribution (>82%) to the total Na quantified, which could imply an oceanic origin [24]. It is worth noting that separation between the crNa and ncrNa fractions was obtained using a bibliographic value and not from local concentration data for the study area [57].
The principal component analysis for ions in the total deposition from Monte Fenton presents three factors. Factor 1 (cumulative variance 44.7%), which brings together the ssSO42−, ssK+, Na+, Mg2+ and Cl− ions, can be attributed to the emission of marine aerosols, given the abundance of these ions in the ocean. [35,36]. Factor 2 (cumulative variance 77.8%), which brings together the nssK+, nssSO42− and Ca2+ ions, can be attributed to the emission of anthropogenic aerosols (given the presence of the nssK+ and nssSO42− ions).
The presence of the nssSO42− ion may have occurred due to the production of heating and electricity at Base Gavilán, as well as the emission of sulfur oxides (SOx) contained in fuels consumed by construction works (where Ca2+ emission is also generated), burning coal and firewood (simultaneous emission of Ca2+ and nssK+) [58,59].
During the sampling period, all these activities were developed in the surrounding of MF, as the city of Punta Arenas has been rapidly expanding [60], reaching up to 3 km from the site. Even though the most frequent wind direction, from the west, can be associated with maritime aerosols, a contribution of anthropogenic aerosols is also observed, linked to nssSO42− ion, which might be related to the anthropogenic activity around MF or on Riesco Island (Isla Riesco in Spanish) located across the Otway Sound.
Factor 3 (cumulative variance 94.6%), which brings together the NH4+ and NO3− ions, can be attributed to the emission of biological aerosols. In the case of the Magallanes Region, there are contributing agricultural activities, including land use, breeding and feeding of animals (production of feces and urine from which emission of NH4+ and NO3− ions can be produced in parallel), management and storage of fertilizer, fertilizers applied to cultivated fields, grazing, residue management, and burning of crops, firewood, and residues [59].
The enrichment factors for elements (EF(X/Al)) and ions (EF(X/Na+)) in atmospheric aerosols and the total deposition at Monte Fenton, respectively, show specific and sporadic aerosol contribution events during 2019. For example, the extreme enrichment in the aerosols of the polycarbonate filter 5 would be related to the fact that the filter would not have been adequately attached to the filter holder of the low-volume system, which produced low Al uptake (reference element Y), increasing the values (EF(X/Al)). The extreme enrichment in the aerosols of the polycarbonate filter 19 would be related to the activities of the so-called “Chilean social outbreak” in Punta Arenas between 19 and 23 October 2019, where there was burning of tires, vehicles, and urban solid waste, which would have contributed to an increase in the concentration of the elements Fe, Mn, and V [61,62].
The enrichment factors for ions (EF(X/Na+)) in the TDPC 1 and TDPC 2 samples would be related to the urban growth of the city of Punta Arenas in recent years [60], which has led to an increase in the burning of firewood and urban waste, as an alternative for heating generation during wintertime [63]. A consequence is ash formation, which comprises Ca2+, K+, Mg2+ and SO42− minerals, the latter as calcium sulfate (CaSO4) [64,65,66,67,68]. Thus, ash transport to Base Gavilán on Monte Fenton might have caused an increase in the concentration of Ca2+, nssK+ and nssSO42− ions.
The Chilean National Air Quality Information System (Sistema de Información Nacional de Calidad del Aire or SINCA for its acronym in Spanish) indicated that the city of Punta Arenas between 1 May and 30 November 2019 did not exceed 13.5 μg/m3 of PM2.5 concentration, with an atmospheric emission limit of 50 μg/m3 daily and 20 μg/m3 annually, according to the Chilean Supreme Decree No. 12 (D.S.N°12/2012) [69]. This record, together with the evidence previously presented, demonstrates this austral region undergoes the occurrence of specific and sporadic contamination events of anthropic origin that are represented in the atmosphere of Monte Fenton, thus validating the study site for monitoring contamination around the rapidly growing city of Punta Arenas.
5. Conclusions
The present study provides the first report on the chemical characterization of atmospheric aerosols on a 612 m altitude site of the Magellan Province in the Chilean Southern Patagonia. The results offer a first assessment of the contribution of atmospheric aerosol sources in a scarcely studied region of the Southern Hemisphere.
During the study period, the atmosphere was relatively neutral compared to the standard pH for rain or snow (without contamination, pH = 5.6) with a mean value of 6.8 and relatively low levels of conductivity with values below 50 µS/cm. Thus indicating low ion formation in the atmosphere of the sampling site, derived from low pollution levels.
The results also showed that the main contribution to aerosols in the atmosphere of Monte Fenton came from marine and lithospheric sources, followed by local anthropogenic sources such as burning firewood and/or urban waste for heating production.
These first reported results contribute to filling an existing gap in the knowledge of atmospheric aerosols in Southern Patagonia. For future work, it is suggested to extend the sample collection period on an interannual basis.
Author Contributions
Conceptualization, G.M., F.C.-B. and B.B.; methodology, T.G., F.C.-B. and B.B.; software, G.M.; validation, T.G. and F.C.-B.; investigation, G.M. and B.B.; resources, B.B., F.C.-B., M.A.G. and P.C.-A.; data curation, G.M.; writing—original draft preparation, G.M. and B.B.; writing—review and editing, B.B., P.C.-A., M.A.G. and F.C.-B.; supervision, B.B., F.C.-B. and M.A.G.; project administration, B.B.; funding acquisition, B.B. and F.C.-B. All authors have read and agreed to the published version of the manuscript.
Funding
This research was funded by the internal research project PY-03-INV-18 from the University of Magallanes (UMAG), ANID-FONDECYT 11181335, INACH 2021 N° RT 34-21, ANID-ANILLO ACT210021, ANID-FONDECYT Regular 1221526, ANID-FOVI210064, and CETAM-UTFSM.
Institutional Review Board Statement
The study did not require ethical approval.
Informed Consent Statement
Not applicable.
Data Availability Statement
Not applicable.
Acknowledgments
The authors thank the Centre for Environmental Technologies (CETAM), (CETAM), Universidad Técnica Federico Santa Maria (UTFSM), Valparaíso, Chile; and the Laboratory for the Analysis of Atmospheric Processes, Institute of Astronomy, Geophysics and Atmospheric Sciences, University of São Paulo, Brazil (LAPAt-IAG-USP), for the chemical analyzes of ions and trace elements. A particular thanks to Nicolás Butorovic, from the Instituto de la Patagonia, Universidad de Magallanes, in Punta Arenas, Chile, for managing the statistical data of the Mount Fenton meteorological monitoring station.
Conflicts of Interest
The authors declare no conflict of interest.
References
- Lagzi, I.; Mészáros, R.; Gelybó, G.; Leelössy, A. Atmospheric Chemistry; Eötvös Loránd University: Budapest, Hungary, 2013; p. 208. [Google Scholar]
- Seguel, R.; Morales, R.G.E.; Leiva, M.A. Estimations of primary and secondary organic carbon formation in PM2.5 aerosols of Santiago City, Chile. Atmos. Environ. 2009, 30, 7. [Google Scholar] [CrossRef]
- Rueda-Holgado, F.; Palomo-Marín, M.R.; Calvo-Blázquez, L.; Cereceda-Balic, F.; Pinilla-Gil, E. Fractionation of trace elements in total Atmospheric deposition by filtrating bulk passive sampling. Talanta 2014, 125, 125–130. [Google Scholar] [CrossRef] [PubMed]
- Murray, B.J.; O’Sullivan, D.; Atkinson, J.D.; Webb, M.E. Ice nucleation by particles immersed in supercooled cloud droplets. Chem. Soc. Rev. 2012, 41, 6519–6554. [Google Scholar] [CrossRef] [PubMed]
- Burkert-Kohn, M.; Wex, H.; Welti, A.; Hartmann, S.; Grawe, S.; Hellner, L.; Herenz, P.; Atkinson, J.D.; Stratmann, F.; Kanji, Z.A. Leipzig Ice Nucleation chamber Comparison (LINC): Intercomparison of four online ice nucleation counters. Atmos. Chem. Phys. 2017, 17, 11683–11705. [Google Scholar] [CrossRef]
- Donateo, A.; Contini, D. Correlation of Dry Deposition Velocity and Friction Velocity over Different Surfaces for PM2.5 and Particle Number Concentrations. Adv. Meteorol. 2014, 14, 760393. [Google Scholar] [CrossRef]
- Johnson, J.S.; Regayre, L.A.; Yoshioka, M.; Pringle, K.J.; Lee, L.A.; Sexton, D.M.H.; Rostron, J.W.; Booth, B.B.B.; Carslaw, K.S. The importance of comprehensive parameter sampling and multiple observations for robust constraint of aerosol radiative forcing. Atmos. Chem. Phys. 2018, 18, 13031–13053. [Google Scholar] [CrossRef]
- Mariraj, S. An overview of particulate dry deposition: Measuring methods, deposition velocity and controlling factors. Int. J. Environ. Sci. Technol. 2016, 13, 387–402. [Google Scholar] [CrossRef]
- Wu, Y.; Liu, J.; Zhai, J.; Cong, L.; Wang, Y.; Ma, W.; Zhang, Z.; Li, C. Comparison of dry and wet deposition of particulate matter in near-surface waters during summer. PLoS ONE 2018, 13, e0199241. [Google Scholar] [CrossRef]
- Araujo, T.G.; Souza, M.F.L.Z.; de Mello, W.L.; da Silva, D.M. Bulk Atmospheric Deposition of Major Ions and Dissolved Organic Nitrogen in the Lower Course of a Tropical River Basin, Southern Bahia, Brazil. J. Braz. Chem. Soc. 2015, 26, 1692–1701. [Google Scholar] [CrossRef]
- Rueda-Holgado, F.; Calvo-Blázquez, L.; Cereceda-Balic, F.; Pinilla-Gil, E. Temporal and spatial variation of trace elements in Atmospheric deposition around the industrial area of Puchuncaví-Ventanas (Chile) and its influence on exceedances of lead and cadmium critical loads in soils. Chemosphere 2016, 144, 1788–1796. [Google Scholar] [CrossRef]
- Abbatt, J.P.D.; Leaitch, W.R.; Aliabadi, A.A.; Bertram, A.K.; Blanchet, J.-P.; Boivin-Rioux, A.; Bozem, H.; Burkart, J.; Chang, R.Y.W.; Charette, J.; et al. Overview paper: New insights into aerosol and climate in the Arctic. Atmos. Chem. Phys. 2019, 19, 2527–2560. [Google Scholar] [CrossRef]
- Di Mauro, B. A darker cryosphere in a warming world. Nat. Clim. Chang. 2020, 10, 978–982. [Google Scholar] [CrossRef]
- Skiles, S.M.; Flanner, M.; Cook, J.M.; Dumont, M.; Painter, T.H. Radiative forcing by light-absorbing particles in snow. Nat. Clim. Chang. 2018, 8, 964–971. [Google Scholar] [CrossRef]
- Stocker, T.F.D.; Qin, G.-K.; Plattner, M.; Tignor, S.K.; Allen, J.; Boschung, A.; Nauels, Y.; Xia, V.; Bex, P.M. (Eds.) IPCC, 2013: Climate Change 2013: The Physical Science Basis. Contribution of Working Group I to the Fifth Assessment Report of the Intergovernmental Panel on Climate Change; Cambridge University Press: Cambridge, UK, 2013; p. 1585. [Google Scholar]
- Satow, K. Chemical features of the precipitation in summer at Tyndall Glacier, Patagonia. Bull. Glaciol. Res. 1995, 13, 57–61. [Google Scholar]
- Dalia, K.C.; Evangelista, H.; Pereira, E.B.; Simões, J.C.; Johnson, E.; Melo, L.R. Transport of crustal microparticles from Chilean Patagonia to the Antarctic Peninsula by SEM-EDS analysis. Tellus B Chem. Phys. Meteorol. 2004, 56, 262–275. [Google Scholar] [CrossRef][Green Version]
- Schwikowski, M.; Brütsch, S.; Casassa, G.; Rivera, A. A potential high-elevation ice-core site at Hielo Patagónico Sur. Ann. Glaciol. 2006, 43, 8–13. [Google Scholar] [CrossRef]
- Silva, N.; Haro, J.; Prego, R. Metals background and enrichment in the Chiloé Interior Sea sediments (Chile). Is there any segregation between fjords, channels and sounds? Estuar. Coast. Shelf Sci. 2009, 82, 469–476. [Google Scholar] [CrossRef]
- Grigholm, B.; Mayewski, P.A.; Kurbatov, A.V.; Casassa, G.; Contreras, A.; Handley, M.; Sneed, S.B.; Introne, D.S. Chemical composition of fresh snow from Glaciar Marinelli, Tierra del Fuego, Chile. J. Glaciol. 2009, 55, 769–776. [Google Scholar] [CrossRef]
- Zihan, Q. Chemical Properties of Continental Aerosol Transported over the Southern Ocean: Patagonian and Namibian Sources. Ph.D. Thesis, Pierre and Marie Curie University, Paris, France, July 2016. [Google Scholar]
- Contini, D.; Donateo, A.; Belosi, F.; Grasso, F.M.; Santachiara, G.; Prodi, F. Deposition velocity of ultrafine particles measured with the Eddy-Correlation Method over the Nansen Ice Sheet (Antarctica). J. Geophys. Res. 2010, 115, D16202. [Google Scholar] [CrossRef]
- Wolff, E.W.; Hall, J.S.; Mulvaney, R.; Pasteur, E.C.; Wagenbach, D.; Legrand, M. Relationship between chemistry of air, fresh snow and firn cores for aerosol species in coastal Antarctica. J. Geophys. Res. 1998, 103, 11057–11070. [Google Scholar] [CrossRef]
- Udisti, R.; Becagli, S.; Benassai, S.; Castellano, E.; Fattori, L.; Innocenti, M.; Migliori, A.; Traverse, R. Atmosphere–snow interaction by a comparison between aerosol and uppermost snow-layers composition at Dome C, East Antarctica. Ann. Glaciol. 2004, 39, 53–61. [Google Scholar] [CrossRef][Green Version]
- Valdés, J.; Vargas, G.; Sifeddine, A.; Ortlieb, L.; Guiñez, M. Distribution and enrichment evaluation of heavy metals in Mejillones Bay (23 °S), Northern Chile: Geochemical and statistical approach. Mar. Pollut. Bull. 2005, 50, 1558–1568. [Google Scholar] [CrossRef] [PubMed]
- Ahumada, R.B.; Rudolph, A.J.; Mudge, S.M. Trace metals in sediments of Southeast Pacific Fjords, north region (42.5° to 46.5 °S). J. Environ. Monit. 2007, 10, 231–238. [Google Scholar] [CrossRef] [PubMed]
- Dixon, D.A.; Mayewski, P.A.; Korotkikh, E.; Sneed, S.B.; Handley, M.J.; Introne, D.S.; Scambos, T.A. Variations in snow and firn chemistry along US ITASE traverses and the effect of surface glazing. Cryosphere 2013, 7, 515–535. [Google Scholar] [CrossRef]
- Budhavant, K.B.; Rao, P.S.P.; Safai, P.D. Chemical Composition of Snow-Water and Scavenging Ratios over Costal Antarctica. Aerosol Air Qual. Res. 2014, 14, 666–676. [Google Scholar] [CrossRef]
- Ahumada, R.; González, E.; Diaz, C.; Silva, N. Characterization of Baker Fjord region through its heavy metal content on sediments (Central Chilean Patagonia). Lat. Am. J. Aquat. Res. 2015, 43, 581–587. [Google Scholar] [CrossRef]
- Cid-Agüero, P.; Toro, C.; Khondoker, R.; Salamanca, M.; Jara, B.; Cárdenas, C. Effect of the 2008 chaitén volcano eruption over the antartic snowfall. An. Inst. Patagon (Chile) 2008, 45, 5–15. [Google Scholar] [CrossRef]
- Cereceda-Balic, F.; Vidal, V.; Ruggeri, M.F.; González, H. Black carbon pollution in snow and its impact on albedo near the Chilean stations on the Antartic peninsula: First Results. Sci. Total Environ. 2020, 743, 18. [Google Scholar] [CrossRef]
- Wang, H.; Cong, H.; Feng, X.; Ji, C.; Jia, Y. In-situ long-period monitoring of suspended particulate matter dynamics in deep sea with digital video images. Front. Mar. Sci. 2022, 9, 1011029. [Google Scholar] [CrossRef]
- Mendes, A.P. Caracterização do Aerossol Biogênico Primário na Atmosfera da Região Metropolitana de São Paulo. Ph.D. Thesis, University of São Paulo, São Paulo, Brazil, 2021. [Google Scholar]
- Cereceda-Balic, F.; de la Gala-Morales, M.; Palomo-Marín, R.; Fadic, X.; Vidal, V.; Funes, M.; Rueda-Holgado, F.; Pinilla-Gil, E. Spatial distribution, sources and risk assessment of major ions ad trace elements in rainwater at Puchuncaví Valley, Chile: The impact of industrial activities. Atmos. Pollut. Res. 2020, 11, 99–109. [Google Scholar] [CrossRef]
- Goldberg, E.D.; Koide, M.; Schmitt, R.A.; Smith, R.H. Rare Earth Distributions in the Marine Environment. J. Geophys. Res. 1963, 68, 4209–4217. [Google Scholar] [CrossRef]
- Holland, H.D. The Chemistry of the Atmosphere and Oceans; John Wiley & Sons Inc: New York, NY, USA, 1979; p. 369. [Google Scholar]
- Horn, M.K.; Adams, J.A.S. Computer-derived geochemical balances and element abundances. Geochim. Cosmochim. Acta. 1966, 40, 279–297. [Google Scholar] [CrossRef]
- Wedepohl, K.H. The composition of the continental crust. Geochim. Cosmochim. Acta. 1995, 59, 1217–1232. [Google Scholar] [CrossRef]
- Gorena, T.; Fadic, X.; Cereceda-Balic, F. Cupressus marocarpa leaves for biomonitoring the environmental impact of an industrial complex: The case of Puchuncaví Ventanas in Chile. Chemosphere 2020, 260, 9. [Google Scholar] [CrossRef]
- Jolliffe, I.T. Principal Component Analysis Second Edition; Springer: New York, NY, USA, 1986; p. 518. [Google Scholar]
- Lawson, D.R.; Winchester, J.W. A Standard crustal aerosol as reference for elemental enrichment factors. Atmos. Environ. 1979, 13, 925–930. [Google Scholar] [CrossRef]
- Sutherland, R. Bed sediment-associated trace metals in an urban stream, Oahu, Hawaii. Environ. Geol. 2000, 39, 611–627. [Google Scholar] [CrossRef]
- Wagenbach, D.; Legrand, M.; Fischer, H.; Pichlmayer, F.; Wolff, E.W. Atmospheric near surface nitrate at coastal Antartic sites. J. Geophys. Res. 1998, 103, 11007–11020. [Google Scholar] [CrossRef]
- Wagnon, P.; Delmas, R.J.; Legrand, M. Loss of volatile acid species from upper firn layers at Vostok, Antarctica. J. Geophys. Res. Atmos. 1999, 104, 3423–3431. [Google Scholar] [CrossRef]
- EPA. United States Environmental Protection Agency. 2019. Available online: https://www.epa.gov/acidrain (accessed on 22 January 2022).
- Liljestrand, H.M. Average rainwater pH, concepts of atmospheric acidity, and buffering in open systems. Atmos. Environ. 1985, 19, 487–499. [Google Scholar] [CrossRef]
- EPA. United States Environmental Protection Agency. 2019. Available online: https://archive.epa.gov/water/archive/web/html/vms59.html (accessed on 22 January 2022).
- Chalmers, J. Atmospheric Electricity. Q. J. R. Meteorol. Soc. 1967, 95, 515–570. [Google Scholar] [CrossRef]
- Light, T.S.; Kingman, E.A.; Bevilaqua, A.C. The Conductivity of Low Concentrations of CO2 Dissolved in Ultrapore Water from 0–100 °C, Thornton Associates, Inc. 1432 Main Street Waltham, MA 02154, Paper Presented at the 209th American Chemical Society National Meeting, Anaheim, CA, USA, 2–6 April 1995. [Google Scholar]
- Zdeb, M.; Papciak, D.; Zamorska, J. An assessment of the quality and use of rainwater as the basis for sustainable water management in suburban areas. E3S Web Conf. 2018, 45, 8. [Google Scholar] [CrossRef]
- Han, Y.; Xu, H.; Bi, X.; Lin, F.; Jiao, L.; Zhang, Y.; Feng, Y. The effect of atmospheric particulates in the rainwater chemistry in the Yangtze River Delta, China. J. Air Waste Manag. Assoc. 2019, 69, 1462–1466. [Google Scholar] [CrossRef] [PubMed]
- Pye, H.O.T.; Nenes, A.; Alexander, B.; Ault, A.P.; Barth, M.C.; Clegg, S.L.; Collet, J.L., Jr.; Fahey, K.M.; Hennigen, C.J.; Herrmann, H.; et al. The acidity of Atmospheric Particles and Clouds. Atmos. Chem. Phys. 2019, 20, 4809–4888. [Google Scholar] [CrossRef] [PubMed]
- Hirsikko, A. On Formation, Growth and Concentrations of Air Ions. Ph.D. Thesis, University of Helsinki, Helsinki, Finland, June 2011. [Google Scholar]
- Kamsali, N.; Prasad, B.S.N.; Datta, J. The Electrical Conductivity as an Index of Air Pollution in the Atmosphere. In Advanced Air Pollution; Nejadkoorki, F., Ed.; IntechOpen: London, UK, 2011; pp. 365–390. [Google Scholar]
- Kumar-Mishra, A.; Kumar, A.; Mishra, V. The Variation of Atmospheric Electrical Conductivity as the Function of Altitude. IJITEE 2020, 10, 2278–3075. [Google Scholar]
- De Miguel-Fernández, C.; Vásquez-Taset, Y.M. Origen de los nitratos (NO3) y nitritos (NO2) y su influencia en la potabilidad de las aguas subterráneas. Min. Geol. 2006, 22, 9. [Google Scholar]
- Duvall, R.M.; Majestic, B.J.; Shafer, M.M.; Chuang, P.Y.; Simoneit, B.R.T.; Schauer, J.J. The water-soluble fraction of carbon, sulfur, and crustal elements in Asian aerosols and Asian soils. Atmos. Environ. 2008, 42, 5872–5884. [Google Scholar] [CrossRef]
- Seinfeld, J.H.; Pandis, S.N. Atmospheric Chemistry and Physics: From Air Pollution to Climate Change, 3rd ed.; Wiley: New Jersey, NJ, USA, 2016; p. 1152. [Google Scholar]
- Wu, P.; Aijin, Y.; Fan, M.; Wu, J.; Yang, X.; Zhang, H.; Chao, G. Phosphorus dynamics influenced by anthropogenic calcium in an urban stream flowing along an increasing urbanization gradient. Landsc. Urban Plan. 2018, 177, 9. [Google Scholar] [CrossRef]
- INE. Instituto Nacional de Estadísticas. 2017. Available online: http://resultados.censo2017.cl/Region?R=R12 (accessed on 15 July 2020).
- Fong-Silva, W.; Quiñonez-Bolaños, E.; Tejada-Tovar, C. Caracterización físico-química de aceites usados de motores para su reciclaje. Prospect 2017, 15, 135–144. [Google Scholar]
- Rodríguez-Heredia, D. Occupational poisoning due to heavy metals. Medisan 2017, 21, 3372–3384. [Google Scholar]
- BNd. Biblioteca Nacional Digital de Chile. 2015. Available online: https://biblioteca.digital.gob.cl/handle/123456789/586 (accessed on 7 September 2021).
- Perry, E. Wood Ashes as a Garden Fertilizer; Vegetable Research and Information Center, University of California: Berkeley, CA, USA, 1982; p. 2. [Google Scholar]
- Hobbs, P.V.; Reid, J.S.; Kotchenruther, R.A.; Ferek, R.J.; Weiss, R. Direct Radiative Forcing by Smoke from Biomass Burning. Science 1997, 275, 1776–1778. [Google Scholar] [CrossRef]
- Andreae, M.O.; Rosenfeld, D.; Artaxo, P.; Costa, A.A.; Frank, G.P.; Longo, K.M.; Silva-Dias, M.A.F. Smoking Rain Clouds over the Amazon. Science 2004, 303, 1337–1342. [Google Scholar] [CrossRef]
- Pachon, J.E.; Weber, R.J.; Zhang, X.; Mulholland, J.A.; Russell, A.G. Revising the use of potassium (K) in the source apportionment of PM2.5. Atmos. Pollut. Res. 2013, 4, 14–21. [Google Scholar] [CrossRef]
- Yankovsky, S.; Tolokol’nikovm, A.; Misyukova, A.; Kuznetsov, G. On the Effect of the Distances between Coal and Wood Particles during Their Joint Pyrolysis on Sulfur Oxides Formation. Energies 2021, 14, 8321. [Google Scholar] [CrossRef]
- SINCA. Sistema de Información Nacional de Calidad del Aire. 2019. Available online: https://sinca.mma.gob.cl/index.php/estacion/index/id/191 (accessed on 17 October 2022).
Disclaimer/Publisher’s Note: The statements, opinions and data contained in all publications are solely those of the individual author(s) and contributor(s) and not of MDPI and/or the editor(s). MDPI and/or the editor(s) disclaim responsibility for any injury to people or property resulting from any ideas, methods, instructions or products referred to in the content. |
© 2023 by the authors. Licensee MDPI, Basel, Switzerland. This article is an open access article distributed under the terms and conditions of the Creative Commons Attribution (CC BY) license (https://creativecommons.org/licenses/by/4.0/).

