Article

Climate Potential for Apple Growing in Norway—Part 1: Zoning of Areas with Heat Conditions Favorable for Apple Growing under Observed Climate Change

by
Ana Vuković Vimić
1,
Mirjam Vujadinović Mandić
1,
Milica Fotirić Akšić
1,
Ksenija Vukićević
1 and
Mekjell Meland
2,*
1
Faculty of Agriculture, University of Belgrade, Nemanjina 6, 11080 Belgrade, Serbia
2
NIBIO Ullensvang, Norwegian Institute of Bioeconomy Research, Ullensvangvegen 1005, N-5781 Lofthus, Norway
*
Author to whom correspondence should be addressed.
Atmosphere 2023, 14(6), 993; https://doi.org/10.3390/atmos14060993
Submission received: 24 April 2023 / Revised: 4 June 2023 / Accepted: 5 June 2023 / Published: 7 June 2023
(This article belongs to the Section Climatology)

Abstract

:
Agricultural production is already, and obviously, affected by climate change. Adapting to climate change includes reducing future risks to ensure yield quality and quantity and considers seizing any potential opportunities induced by climate change. In higher latitude areas, such as Norway, cold climate limits the cultivation of fruits. An increase in temperature offers more favorable conditions for fruit production. In this study, using available phenological observations (full blooming) and harvest dates, and meteorological data from the experimental orchard of NIBIO Ullensvang, the minimum heat requirements for growing different apple varieties are determined. Those criteria are used for zoning of the areas with heat favorable conditions for apple growing. Data on six varieties were used, with lower and higher requirements for heat for fruit development (Discovery, Gravenstein, Summerred, Aroma, Rubinstep, and Elstar). High resolution daily temperature data were generated and used for zoning of the areas with heat favorable conditions for apple growing within the selected domain, which includes Western Norway, Southern Norway, Eastern Norway, and the western part of Trøndelag, Mid-Norway. Dynamics of the change in such surfaces was assessed for the period of 1961–2020. The total surface with favorable heat conditions for growing the varieties with lesser requirement for heat increased three times during this period. The growing of more heat-demanding varieties increased from near zero to about 2.5% of the studied land surface. In the period of 2011–2020, surface area with favorable heat conditions for apple growing was almost 27,000 km2, and a surface area of about 4600 km2 can sustain growing of more heat-demanding varieties. The presented results show the increasing potential of the climate of Norway for apple cultivation and highlight the importance of implementation of fruit production planned according to climate change trends, including the assessment of potential risks from climate hazards. However, the methodology for determining heat requirements can be improved by using phenological ripening dates if available, rather than harvest dates which are impacted by human decision. Zoning of areas with the potential of sustainable apple growing requires the use of future climate change assessments and information on land-related features.

1. Introduction

Global apple production, which is ~93 million tons annually [1], represents a significant component of the global food system. Large gene pools, successful production in both northern and southern hemispheres, different appearance, pleasant aroma and taste, low prices, good transportability, less fruit deteriorating, and year-round storage are making the apple one of the most popular snack fruits [2]. Therefore, the apple’s vulnerability to climate change and potential opportunities for apple growing under changing climate conditions should be assessed. Due to the large number of bred cultivars, the apple is considered to be a very adaptable species. In the northern atmosphere the largest areas where apples are grown are limited to the latitude range of 25° N to 52° N. Of course, apples are grown beyond this range if the regions have favorable climate and/or are heated with warm water masses, such as in Norway [3].
According to [4] and [5] two main thermal factors, chilling and forcing, are influencing fruit development in temperate climatic regions. Heat accumulation is needed for adequate blooming and fruit ripening [6,7]. Late frosts in the spring and low temperatures in late autumn and winter are drawing the line where apple production can be managed [8]. The consequences of winter freezing, such as the darkening of the xylem, stem dieback, frost splitting of tree-trunks (winter sunscald or south-west injury), and crown and root injury, accompanied with coming pathogens, can completely kill the tree [3]. Additionally, many other physiological processes of the apple tree development depend on the temperature [9]. Flowering seems to be limited by low temperature depression of growth and leaf production at 12 °C, while at 27 °C flowering is blocked by inhibition of the floral initiation itself. Intermediate temperatures of 18–21 °C, on the other hand, seem to satisfy the requirements for both processes [10]. The apple net photosynthesis is optimal in temperatures between 15 °C and 30 °C, while a maximum is at 20 °C [11]. Changing heat conditions, including changes in climate heat characteristics and changes in heat-related weather extremes, impact apple tree development. Increasing changes impact the increase in vulnerability of apple production to climate change and alter the global distribution of optimal zones for apple cultivation.
Average global surface air temperature for the period 2011–2020 was 1.1 °C higher compared to preindustrial times, and the trend of increase has accelerated since the 1980s [12]. The increase in the temperature is more pronounced over the northern hemisphere, and especially at the higher latitudes. Under global warming impact, heat conditions in Norway are becoming more favorable for the development of diverse agricultural production, due to the expansion of the growing season and the increasing growing season temperature [13].
Adaptation to climate change considers the implementation of many different actions specific to every region and sector because of the different changes in frequency and intensity of climatic impact-drivers and other climate hazards, and their impacts [14]. Most of the impact assessments are focused on risk assessments and used for planning of adaptation which mitigates negative climate change impacts. In a few cases climate change can be considered an opportunity. For example, cold climates limit the development of agricultural production. This changes with increasing temperatures and can be addressed as an opportunity for countries in such areas, if well studied and planned.
This case study focuses on the assessment of the observed climate change impact on the change in the heat conditions for apple growing in Norway. The chosen indicator to assess this impact is the change in surface areas with favorable heat conditions for apple growing in the period of 1961–2020. This period is chosen for the analysis to be able to show the climate heat conditions during the period when temperature variations were within the limits of natural variability and the acceleration of heat condition changes toward recent periods. Outcomes of the presented analysis, given through the assessments on the decadal level, are meant to provide a strong argument and basis for continuing the work in planning of the current and future apple production in Norway while adapting to climate change.
To be able to approximately determine the areas where the heat conditions are sufficient for growing of different cultivars, it is necessary to develop a relation between phenological development and heat conditions, usually expressed through developed bioclimatic indices which are generated using surface air temperature data (for example for Norway, ref. [15]). There are different approaches to determine the heat conditions required for achieving different phenological stages, which depend on the availability of data and required simplicity of methodology (easy to calculate). For example, some used calculations of chilling and heating units to include the importance of the rest period for the growing season on-set but also discussed the large spans of the determined thresholds [16,17,18,19]. In the case where a full set of observed data for some phenological stage is available for the long-term period, sums of temperatures can be used to define the average date of the on-set of each phenological stage [20,21,22]. Others, who are targeting the assessment of ripening and harvest dates, simply accumulate daily temperatures that are higher than some assumed fixed values of the base temperature [23,24].
In Norway, apple production is organized mostly around fjords (Western Norway), which are the most northerly fruit-tree-producing area in the world. Furthermore, apples can be grown in the southern and eastern parts of the country, where the climate and growing conditions are the most suitable. The production covers more than 1500 ha with a yield of more than 12,000 tons [25,26].
In this study, the data were collected from the experimental orchard of NIBIO, Ullensvang, Western Norway (Hardenger), where apple production is well studied [26,27,28]. Considering the availability of phenological data and the final goal (determining lower thresholds for the favorable heat conditions for apple growing), the chosen methodology for determining minimum heat requirements for apple growing is based on (a) determining the base temperature for full blooming date, which is calculated as the growing season start date according to the World Meteorological Organization list of climate indices [29], and (b) determining the threshold for the sum of active temperatures (growing degree days) required from full blooming to harvest. In this case, no data on fruit ripening were available according to the extended BBCH-scale [30,31] as they were for earlier stages, and the harvest date was the next best choice for the stage of maturing of the fruit, while keeping in mind that the harvest may be greatly impacted by the decision of the producer. Harvesting may be implemented before or well after the ripening [32].
After determining the required heat conditions for apple growing, the methodology was transferred to the whole south part of Norway, which includes the domain 4.4° E–12.9° E and 58° N–65.2° N (regions: Western Norway, Southern Norway, Eastern Norway, and west part of Trøndelag, Mid-Norway). This domain was chosen to include most of the relevant areas and to limit the calculation as much as possible. The calculation was applied to the set of interpolated daily data with a resolution of 0.01° × 0.01°. Input data for interpolation are from the EOBS database with a resolution of 0.1° × 0.1° [33]. Applying the derived criteria for apple growing over the period of 1961–2020 produced the assessment on the rate of expansion of the areas where heat conditions are favorable for apple growing.
In short, the workflow in this manuscript, which led to the results, conclusions, and recommendations, included (1) determining the criteria for the calculation of the optimal heat conditions required for growing, based on the full blooming and harvest dates of six apple varieties (Discovery, Gravenstein, Summerred, Aroma, Rubinstep, and Elstar); (2) the interpolation of gridded daily temperature data in high resolution for the selected domain; (3) the application of the derived criteria for six varieties over the domain to map areas with heat favorable conditions for their growing; (4) the assessment of surface areas with such conditions for each decade in the period of 1961–2020 and the analysis of their change; and (5) summarizing the results derived for each variety in two groups—surface area change with heat conditions favorable for growing at least one variety (with minimum heat requirements) and with heat conditions favorable for growing any variety (including ones with higher heat demands). The main results of the research are given in the following chapters, while other results, which are not crucial for the understanding of the main findings, are given as a supplement material in the Appendix sections. Presented analyses include the assessments for apple varieties for which necessary data were available, but the assessment can be replicated for other varieties.

2. Materials and Methods

This study includes the following steps: (a) determining criteria for the minimum heat requirements for the growing of different apple varieties using phenological and meteorological data from Ullensvang, (b) interpolation of gridded daily temperature data, (c) application of the criteria for heat requirements for apple growing over the domain of the southern part of Norway—zoning of heat favorable conditions for apple growing, and (d) analysis of the impact of observed climate change on the change in areas with favorable conditions for apple growing.
The phenological data for six varieties of apple (Discovery, Gravenstein, Summerred, Aroma, Rubinstep, and Elstar) were collected and used for determining the heat conditions required for fruit development, until harvest, in the Ullensvang orchards (location shown in Figure 1). Full blooming (FB) is chosen for the initial phenological stage, which, for the purpose of this study, marks the definite start of the plant’s vegetative development. Observed dates for this phenological stage were the most abundant, considering all varieties. Since the data on fruit development were scarce, and there were no dates on fruit ripening stages, the harvest (HAR) date is used as a mark for the end of the fruit development.
In this study, the meteorological data used for determining the criteria for heat conditions for apple growing are from the local meteorological station in NIBIO Ullensvang (daily data for the period of 2001–2020). The latter decade, 2011–2020, is somewhat warmer than the climate period of 2001–2020 (Appendix A, Figure A1). However, due to the vicinity of the sea (fjord), the increase is not as pronounced as in other parts of the northern hemisphere in in-land areas. The average annual temperature is 8.9 °C, and the average growing season (May–September) temperature is 14.3 °C. Accumulated precipitation also increased, and for the period of 2011–2020, the average annual accumulated precipitation is 1870 mm and average for the growing season is 541 mm. The annual distribution of precipitation shows high maritime characteristics, with higher accumulated values in the colder part of the year (maximum in December, about 320 mm), and minimum values in the warmer part of the year (minimum in June, about 80 mm).
Phenological and meteorological observations were used to determine the heat conditions required for apple growing. Risks related to precipitation will not be considered because of the lack of quantifiable information on the limitations they can cause in apple production.
To be able to map the favorable heat conditions for apple growing, using the determined criteria, EOBS [33] gridded daily temperature data were downscaled for the chosen domain in Norway. Note that the quality of interpolated data depends on the availability of observations. These limitations are not within the scope of this work. The domain in which the study was conducted (4.4° E–12.9° E and 58° N–65.2° N) is referred to as the “south part of Norway” (Figure 1) in the following text and includes the following regions: Western Norway, Southern Norway, Eastern Norway, and the western part of Trøndelag, Mid-Norway. The temperature data from the EOBS database were downscaled from 0.1° × 0.1° resolution to 0.01° × 0.01°, which was necessary because of the high spatial variations in the topography of Norway. The data were interpolated for each day for the period of 1961–2020. The methodology applied is the method of successive corrections [34]. This method was endorsed initially for numerical weather forecast purposes, in producing gridded meteorological data, and represents an optimal combination of simplicity, computational efficiency, and quality of the obtained interpolated data. It is used for the climate analysis in the project for national viticulture zoning in the Republic of Serbia [35], the zoning of fruit production, and identifying risks for growing [36,37]. This methodology also can be used for obtaining interpolated observations for the purpose of climate model bias correction [38]. Other high resolution gridded daily datasets, if available, also can be used for this purpose.
To find the “biological minimum” or, frequently called, the “base temperature” for full blooming for each variety, the following methodology was implemented: the assumption was made that it is between 9 °C and 15 °C; for each temperature value within this interval and step of 0.1 °C, the full blooming (FB) date was calculated using each temperature value (total 41 temperature values) as the base temperature for each year; average calculated and observed dates were compared; the temperature which was used to predict the average FB date closest to the observed one, was adopted as the base temperature.
According to the WMO indices [29], the growing season start is defined as the end date of the first appearance in the year of the six consecutive days above the base temperature. Here, for the stage of the growing season start is considered the full blooming. FB date was calculated according to this approach: when a period of six consecutive days with an average daily temperature above the base temperature appears for the first time in the year, the sixth day of this period is the date of the FB. For the years with an available observed FB the difference between the average observed and the predicted FB was calculated for each base temperature. The base temperature for which the difference between average predicted and observed FB date was smallest, was chosen as the base temperature for FB. Base temperatures for FB were determined for each variety.
In the period of the year when blooming occurs, the temperature increases quickly in conjunction with the date (Appendix A, Figure A2a). During the period when FB usually occurs for the selected varieties (approximately between 130 and 160 day of year), the average daily temperature changes by approximately 4 °C. Heat conditions are such, that the base temperature of 10 °C is achieved around the 135th day of the year on average, and the base temperature of 12 °C occurs on about the 145th day of the year (Appendix A, Figure A2b). This means that the thresholds for the base temperature are changing rapidly with the date, which is the consequence of rapid temperature increase during that time of the year. For this reason, the base temperature was determined for each variety separately, because they differ in the observed FB dates.
The sum of the active temperatures (sum of temperatures above the base temperature) is frequently used for quantifying heat requirements for the development of fruit, and crops in general, as discussed above. Here, the sum of the active temperatures (SUMT) is used to determine the minimum heat requirements for the development of different apple varieties from FB until harvest.
As a result of the combined analysis of phenological and meteorological data, obtained from Ullensvang orchards, the most suitable base temperature (Tb) and the sum of the active temperatures (SUMT), required to be collected between FB and HAR, were obtained for each variety. Those two conditions were applied over the whole domain, in each grid point. The following steps were applied for each grid point:
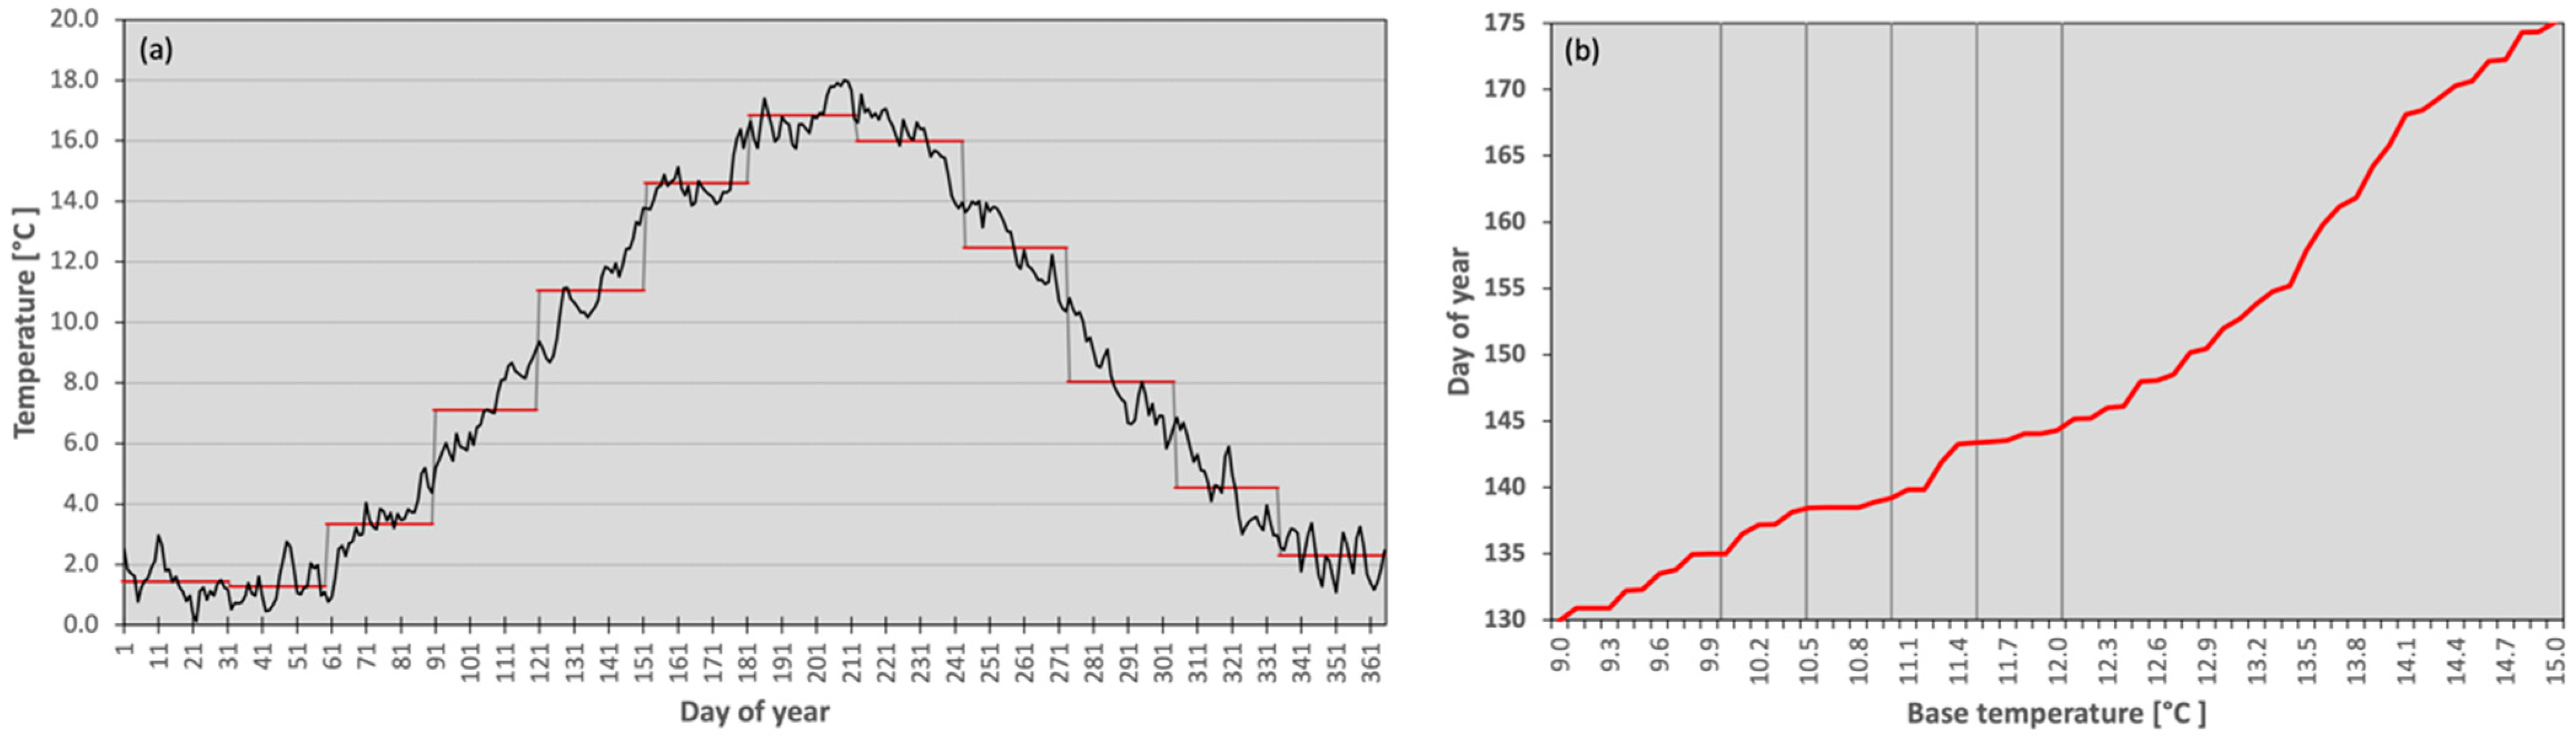
  • The FB date was calculated: starting from the beginning of the year, the first appearance of the six consecutive days above the determined threshold value (base temperature—Tb) was calculated, the sixth day was chosen as the FB date;
  • The accumulation of temperatures above the threshold value starts from the calculated FB date, and the date when the accumulated value reaches the determined threshold (predefined by the sum of active temperatures) was chosen as the harvest date (assuming it is close to biological ripening);
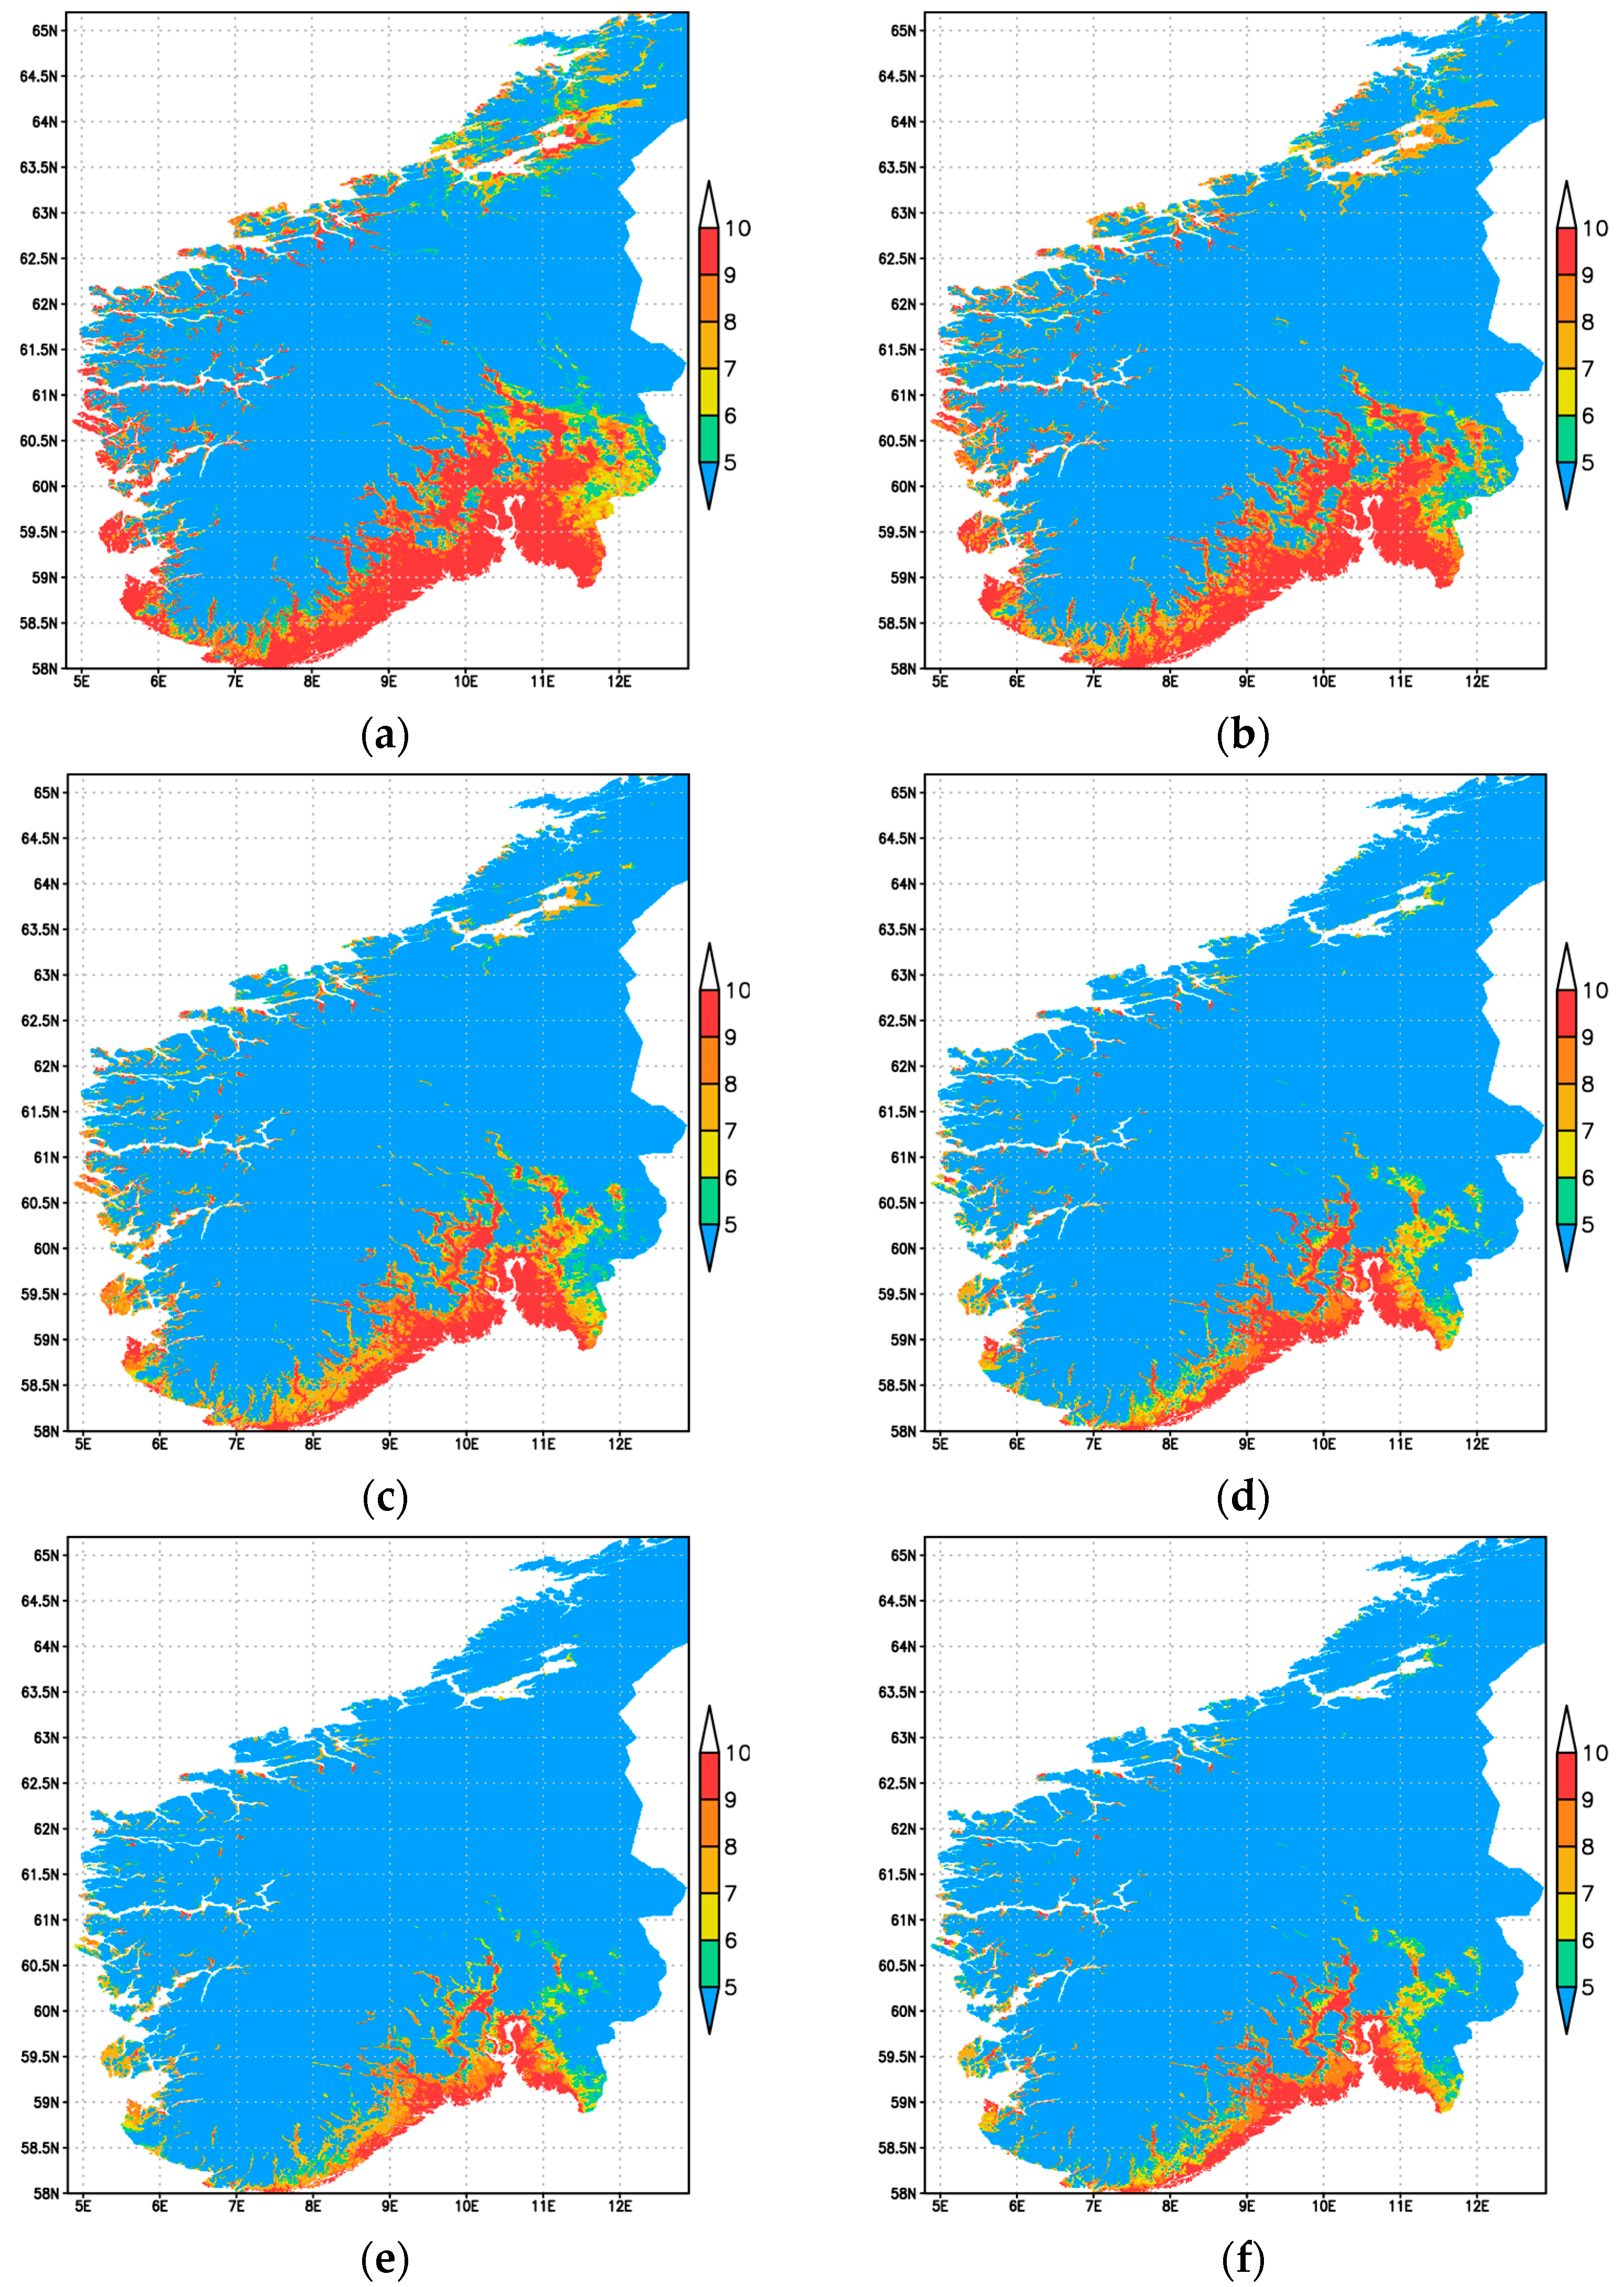
  • If these heat criteria were possible to reach in each year of the chosen period, the areas that belong to that grid point are considered to be the areas with favorable heat conditions for apple growing.
This is repeated for each grid point, to derive a map of areas with favorable heat conditions for the growing of each variety.
Since all verities have their own heat requirements, to be able to provide a rather general and representative map of favorable heat conditions for apple growing, the following conditions were applied:
  • Minimum heat requirements for apple growing: if there are favorable heat conditions in the grid point for at least for one variety, the area which belongs to that grid point is designated as having favorable heat conditions for apple growing;
  • Heat requirements for the growing of any apple variety (including more heat-demanding varieties): if there are favorable heat conditions for all varieties in the grid point the area which belongs to that grid point is designated as having favorable heat conditions for growing of any apple variety.

3. Results

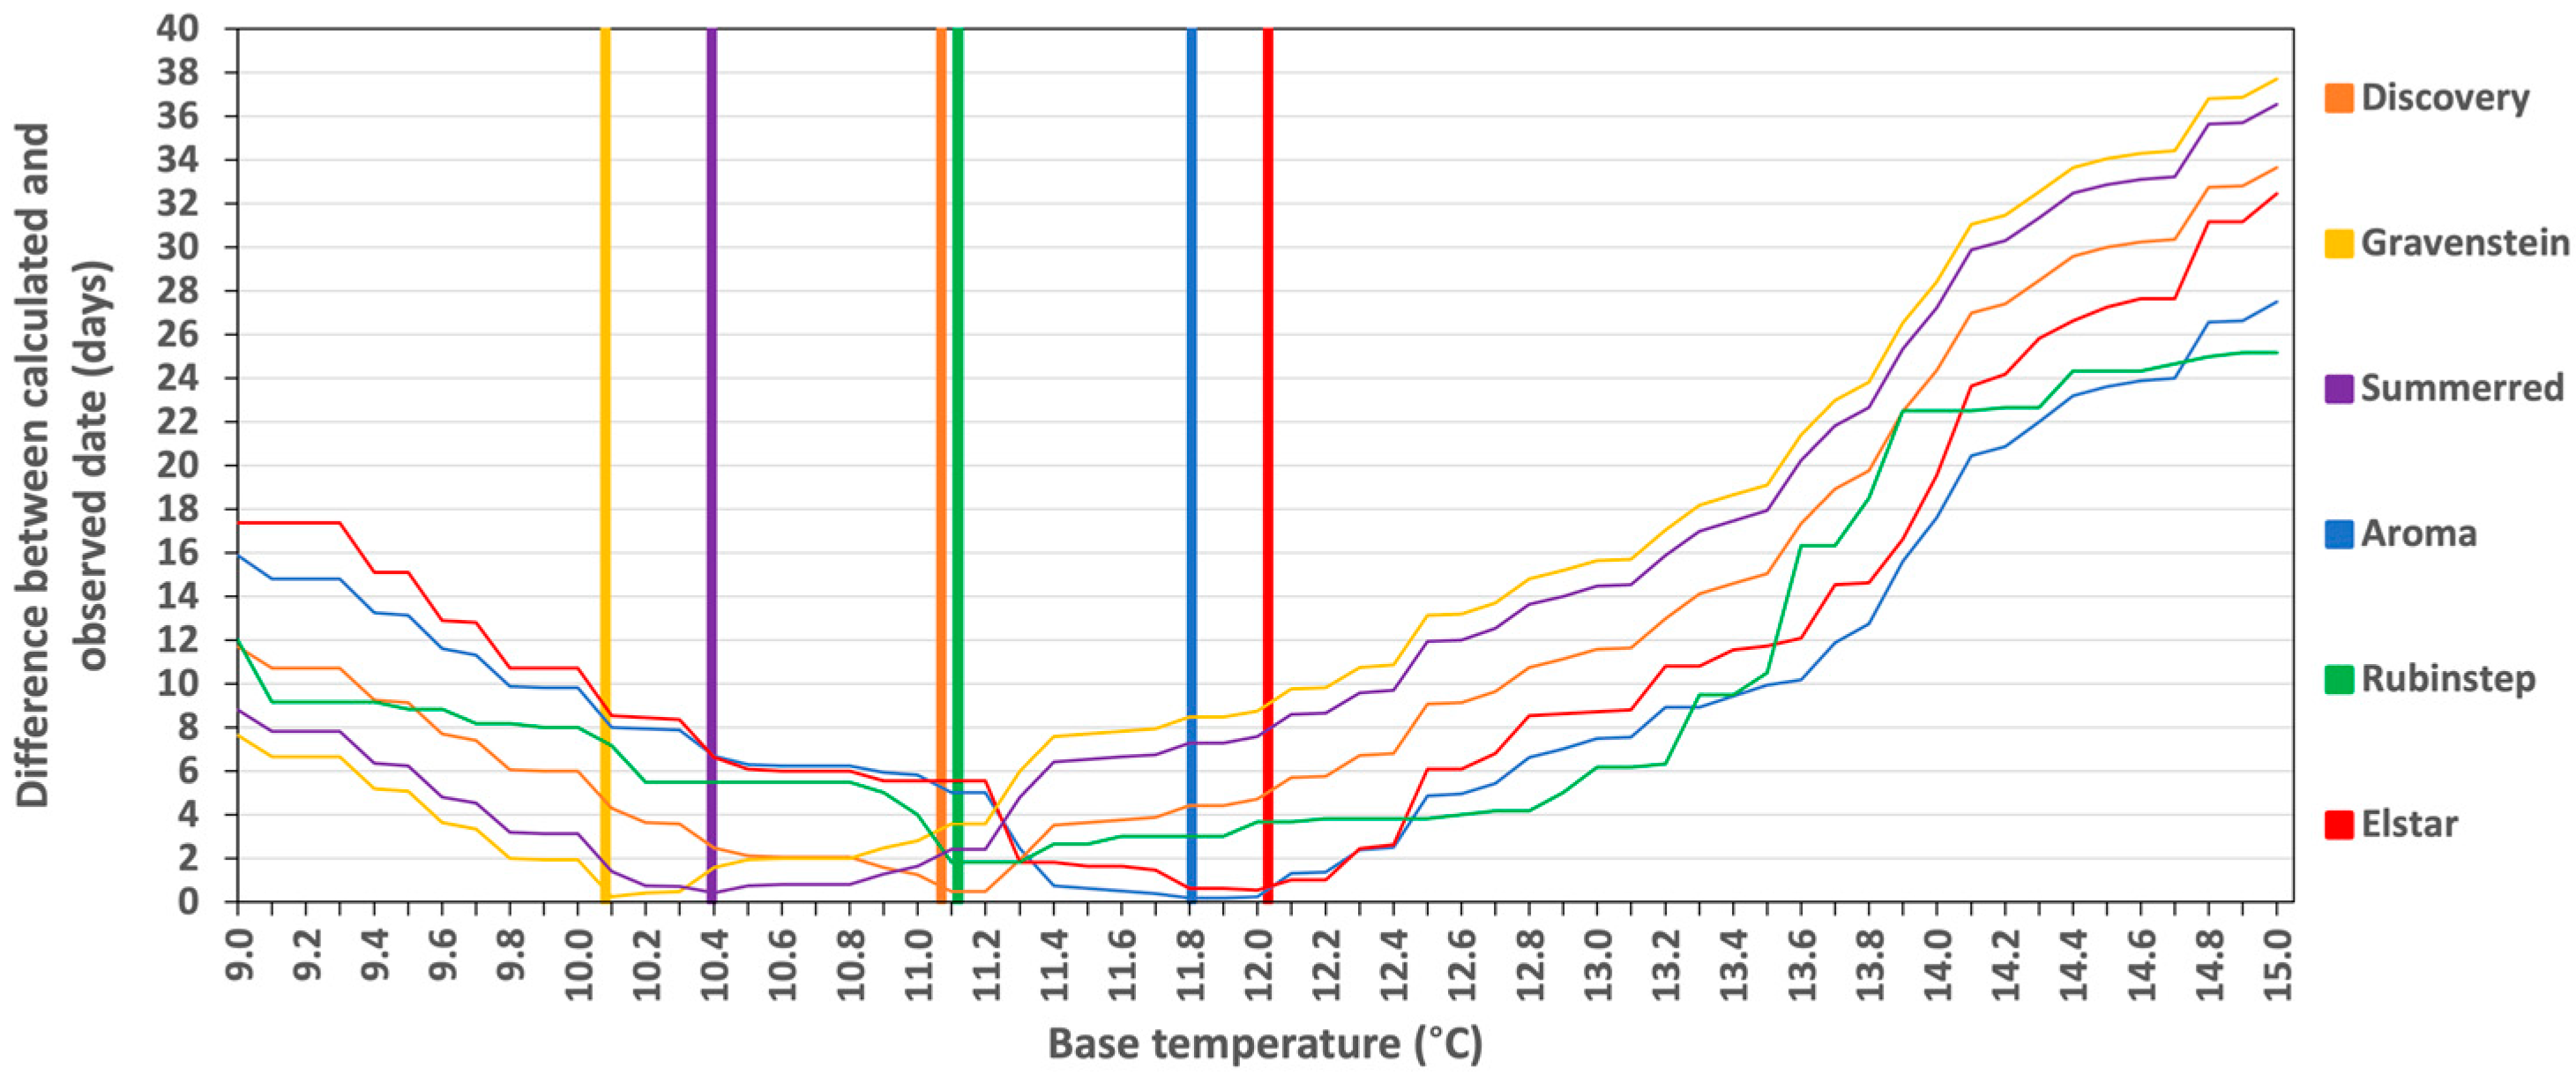
3.1. Base Temperature for Apple Varieties

The differences between the average predicted (calculated) and observed full blooming (FB) date, for the base temperatures from 9 °C to 15 °C with an interval of 0.1 °C, for each variety in Ullensvang, are given in Figure 2. The temperature for which the difference between the average predicted and the observed dates is smallest, is selected for the base temperature (Tb). In Table 1 the values of the selected Tb for each variety are given. The difference between the average predicted dates and the average observed dates for all varieties have a difference of less than or equal to 2, when the chosen Tb is used for the calculation of predicted dates. This confirms that derived Tb values and the methodology for calculation of full blooming date represent the average observed dates well.

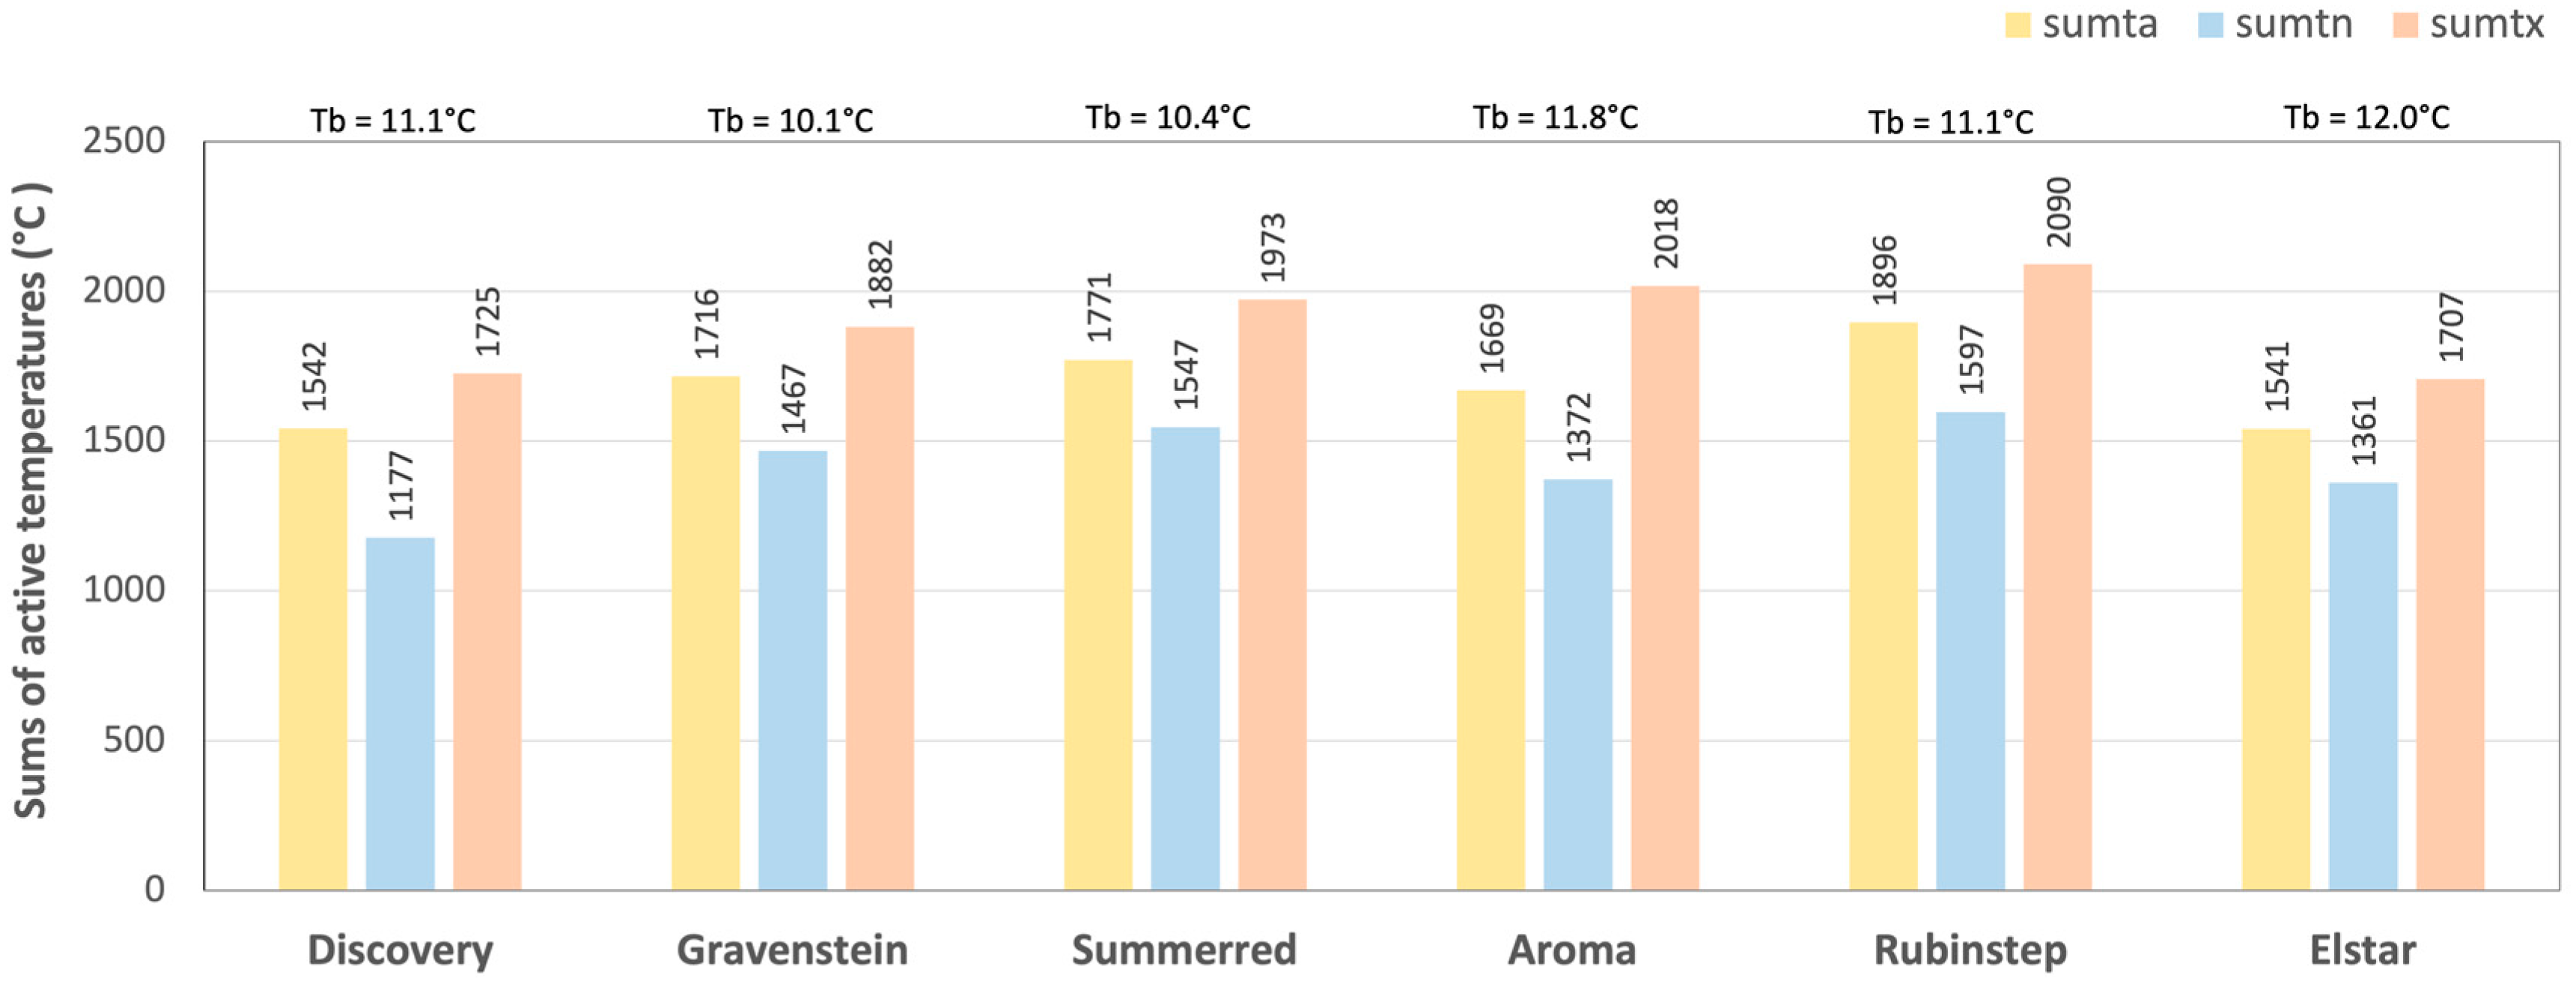
3.2. Heat Required for Fruit Development

For each variety and for each available year, the sums of the active temperatures (SUMT) are calculated from the observed full blooming (FB) date to the observed harvest date (HAR). They are calculated for each variety and for each year, for which observed dates of FB and HAR exist (Table 2). The results are given in Figure 3. Unfortunately, in one year both the FB and HAR dates are available for lesser number of years, which means that a larger uncertainties are expected for the derived criteria for determining the harvest date.
There is a large difference in sums of active temperatures for different years (Appendix A, Figure A3), which can be the consequence of using the harvest date instead of the date of physiological ripening. Meaning that the harvest date is impacted by the human decision of when to harvest and could have happened before or well after full ripening. To this, there was no available information. For all varieties, the years with higher values of sums of active temperatures coincided with warmer growing seasons (Appendix A, Figure A4). Variations of SUMT from year to year are mostly larger than variations in sums between different varieties. For example, the average May–September temperature (the approximate growing season period for fruits in Norway) was higher than the average in years for which higher sums of active temperatures are derived (most pronounced was in 2006, 2014, 2016, and 2018), and for years with an average temperature lower than the average, lower sums of active temperatures are derived (2003, 2005, 2007, 2012, and 2015).
For the purpose of zoning of areas with favorable heat conditions for apple growing, the calculated minimum sum of active temperatures is chosen, derived from the observed FB to HAR date. More comments on this subject are provided in Appendix B.

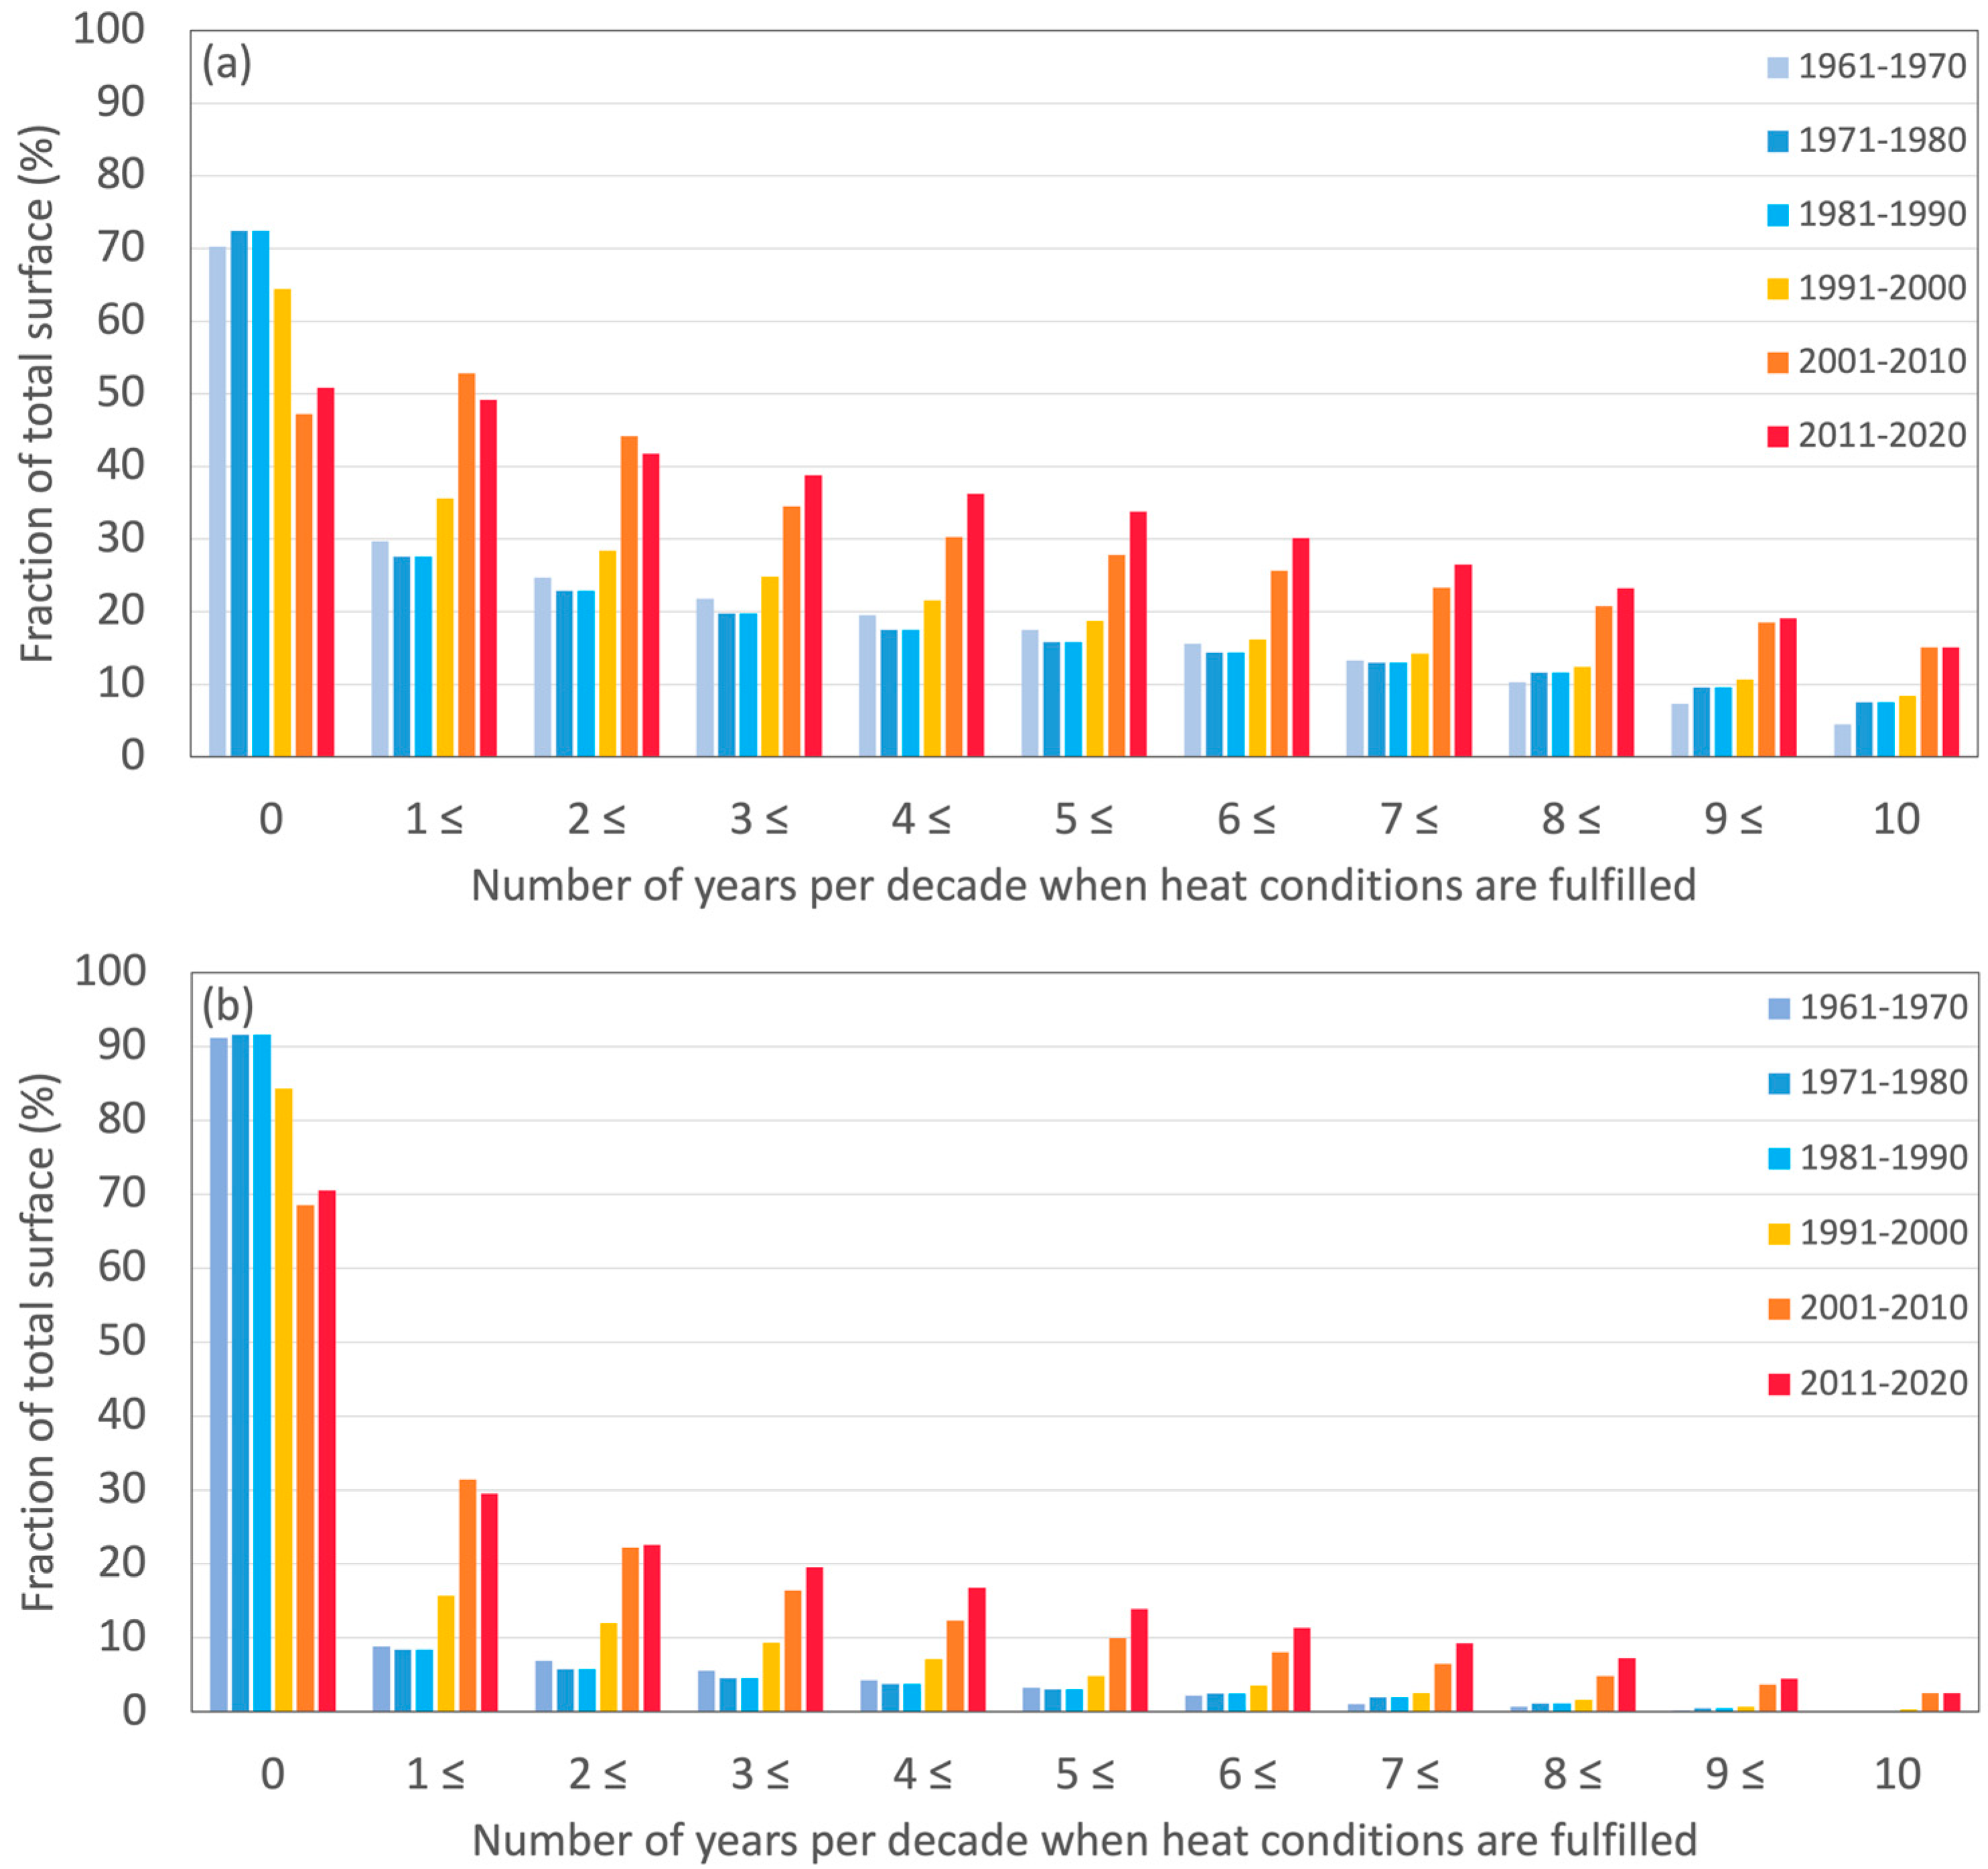
3.3. Zoning of Areas with Heat Favorable Conditions for Apple Growing and Their Change

Using the daily data interpolated on high resolution (comparison of the original and interpolated data is presented in Appendix C, Figure A6), the calculation of heat requirements was done for each grid point for each variety. As an example, maps of areas with heat favorable conditions for each variety for the period of 2011–2020 are shown in Appendix D, Figure A7. Such datasets were made for every decade, and using them, the following maps are developed.
Two maps for each decade were derived, one showing the areas where heat conditions are fulfilled at least for one variety (at least one variety can gain enough heat for its development) and one showing the areas where heat conditions are fulfilled for all varieties (all of the studied varieties can retrieve enough heat for their development).
Figure 4 presents the results for two decades of the studied period, 1961–1970 and 2011–2020. Percentages of land surface in the “south part of Norway” (selected domain) with heat favorable conditions for at least one and for all varieties, by decade in the period of 1961–2020, are given in Figure 5. Areas for which heat conditions are fulfilled in all years, are in red color. Because of the increasing temperatures, other areas in which heat conditions are not fulfilled every year are also presented, because they reach sufficient heat conditions in later decades.
Areas with favorable heat conditions for apple growing existed in Norway in the past periods, during the 20th century. In the decades in the period of 1961–2000, areas with heat conditions which can sustain apple growing were between 4.5% to 8.5% (highest in the last decade, 1990–2000) of the land surface in the selected domain, i.e. the south part of Norway. In the period of 2001–2020, the fraction of such areas increased to about 15% of the land surface. The spreading of such areas is shown in Figure 4 (left panels) and in Figure 5a. The largest progression happened in the southern parts of Eastern Norway and Southern Norway, while in Eastern Norway the detected areas advanced furthest from the coastal areas. Heat conditions became favorable in the west parts in Western Norway and in small scale areas in the fjords. In the Trøndelag region in the past, areas which could provide sufficient heat conditions were not detected with these data, but in the recent past favorable conditions are represented in lower altitudes in the land area around Trondheim Fjord, and even more near Beitstadfjorden. Sufficient heat conditions for apple growing are found in small size areas (locally) even near the northern border of the domain.
Areas with favorable heat conditions for growing varieties which have higher demands for heat during their development are presented with the results derived by the criteria that conditions for heat must be fulfilled for all varieties. They are shown in Figure 4 on panels on the right side and in Figure 5b. In the period of 1961–2000, surfaces with favorable conditions for the growing of more heat-demanding varieties occupied from 0.01% to 0.33% of the domain (the highest fraction in the last decade, 1991–2000). In the period of 2001–2020, the fraction of such areas is about 2.6% of the land surface in the domain. This means that heat conditions are becoming even more favorable for the growing of more heat-demanding apple varieties. The largest portion of such areas is in the south part of Eastern Norway. Smaller scale areas are scattered in Western Norway, in coastal areas of fjords, and eastern coastal part of Southern Norway.
Analysis of the areas which have fulfilled heat conditions in certain number of years but not in all years, shows that they are also increasing and most probably will reach the heat conditions that could sustain apple development and maturing in each year. This is expected in the near future under increasing temperatures. For example, there are areas which fulfill conditions for apple growing in 90% of the years (9 out of 10), in about 4% of the total surface, and in 2% for the more heat-demanding varieties. Those additional areas could become suitable for apple growing in the near future (or already are, if the years after 2020 are considered).
Another indicator that evidently shows the significant advancement of temperature conditions in favor of apple growing, is the fraction of total surface where not once (in any of the years) were the heat conditions fulfilled. In the period of 1961–2000, those areas occupied about 65% to 70% of the territory (lesser in the decade of 1991–2000), and in the period of 2001–2020 they occupy only about 50% of the total land surface in the domain.
How much the average temperature is changing in the selected domain is given in Figure 6, where the average temperature anomalies are presented for the domain for each decade compared to the average value for the whole period of 1961–2020. The average temperature anomaly for 1961–1990 is -0.8 °C, and for the decade of 2011–2020 is 0.9 °C. On average, each decade is warmer than the previous one, and in the last four decades the differences in anomalies from previous decades are about 0.4 °C.
In the climate change impact analysis in [13], the period of 1971–2000 is adopted as the reference (base) climate period, compared to which climate change is studied. Compared to this reference period, the average temperature of the land area, in the domain of the south part of Norway, is 1.1 °C higher in the decade of 2011–2020. How much of the surface achieved heat conditions which could sustain apple growing, in the decade of 2011–2020 compared to 1971–2000, is shown in Figure 7. Areas with heat conditions that are sufficient for apple growing (heat condition fulfilled at least for one variety) increased in 2011–2020 compared to 1971–2000 by 248%. During the period of 1971–2000, such surface areas occupied 7750 km2 and in 2011–2020 26,969 km2. Areas with sufficient heat conditions for the growing of more heat-demanding apple varieties were almost nonexistent during 1971–2000 (29 km2), but in 2011–2020 their total surface was 4612 km2.

4. Discussion

The EU Strategy on Adaptation to Climate Change [39] promotes “smarter” and “systematic” adaptation and, with this, promotes pushing the frontiers of scientific knowledge related to changing conditions and options for adaptations and their implementation into national plans and policies. While the strategy for climate change adaptation of Norway [40] has the main objective of reducing vulnerability to climate change and hunger in developing countries, Norway’s first adaptation communication [41] recognizes the national priorities for the adaptation to climate change and recognizes forestry and agriculture as priority sectors for adaptation implementation.
The main goal of the presented work is to show the growing potential of Norway for fruit production. More precisely, to show the expansion of areas with heat favorable conditions for apple growing in the southern part of Norway (the land area of Norway in the domain of 4.4° E–12.9° E and 58° N–65.2° N). Heat requirements are the main indicator for assessing the climate conditions for agricultural production in open spaces. In these areas, other factors, such as high humidity caused by high precipitation, may represent a difficulty for fruit growing because of the possible appearance of diseases [42]. Humidity depends on precipitation, temperature, local terrain characteristics (soil type or slope—impact infiltration rate of precipitation in soil), and the vicinity of the sea. These, and other, limitations are considered as risks, and in some cases could be manageable using agrotechnical measures and selection of more resistant varieties [43,44]. In [13] it is shown that the significant increase in temperature conditions, expansion of growing season, but also the increase in precipitation will happen in the future in Norway. While the change in the heat conditions is favorable for apple growing, future precipitation could impose some risks. Analysis of the risks from climate hazards are beyond this study and require more data on impacts on apple yield and quality, including the monitoring of diseases, information on losses and damages caused by climate hazards, local sensitivities (for example, risk of storm surges, of landslides), etc. Most of the climate hazards could be manageable, while heat conditions are the main factor which determines plant distribution.
Varieties which are included in this analysis have different demands for heat for their development during the growing season. Regarding heat conditions required for full blooming, Gravenstein and Summerred have lower heat demands and for them blooming happens early compared to other varieties. Discovery and Rubinstep have medium requirements, and the latest blooming dates are for Aroma and Elstar, meaning they have the highest heat requirements to reach full blooming. The harvest of these varieties was implemented in a somewhat different order. Discovery matures early, and thereby shows lesser demands for heat for fruit development. Next, Gravenstein and Summerred were harvested, and the latest harvest was usually for Aroma, Rubinstep, and Elstar. Understanding the varieties’ heat requirements is not straight forward, meaning that the ones with later blooming do not necessary ripen later and vice versa. Therefore, the development of methodologies for determining heat conditions, which are sufficient to sustain growing, should include dynamics of phenological development. Here it was done by using two stages which mark the beginning and ending stage of penological development.
A wide range of different requirements for heat for the development of the fruits of the varieties included in this study, enabled zoning of (1) areas with the heat conditions which can sustain apple growing in general, meaning that it is possible to grow some variety, and of (2) areas with heat conditions which can sustain the growing of apples which are more heat-demanding. The main finding is that expansion of areas with favorable heat conditions for apple growing progress fast under changing climate conditions. The surface area with heat conditions which can sustain the growing of apples has already increased by about 2.5 times, compared to such surface areas in the reference period of 1971–2000. In the more recent period (2011–2020) it was 26,969 km2, out of which 17% can sustain the growing of apples with higher demands for heat (during the 20th century such areas were almost non-existent in Norway).
Presented results show the rapidly growing potential of Norway for the development of apple cultivation, and other fruit varieties with similar heat requirements. They provide the strong argument to address the future fruit production development in Norway, i.e., to develop the methodology for the zoning of the potential fruit growing areas under changing climate conditions, including the land surface data (soil characteristics, topography, land cover, etc.) and the climate change risk assessments (impacts of climate hazards). This would require further scientific research on this subject and the inclusion of divers phenological and meteorological data and information on potential negative impacts. A strong scientific background in the decision-making of future fruit growing in Norway would ensure “smart” adaptation, and its addressing through the national plans (including zoning of agricultural production under changing climate conditions) and policies would ensure “systematic” adaptation.

5. Conclusions

The main goal of this study was to assess the potential of climate conditions in Norway for apple growing under changing climate conditions during the period of 1961–2020. The analysis was done for the area of Norway, up to 65.2° N. To summarize and to quantify the results, the surface area in which minimum heat requirements for apple growing were fulfilled was chosen as the main indicator and was expressed in surface area units (km2) or as a fraction of total land area in the domain (%).
Criteria for determining the minimum heat requirements for apple growing were derived from the available observations of full blooming dates and harvest dates (no ripening dates were available) for six apple varieties (Discovery, Gravenstein, Summerred, Aroma, Rubinstep, and Elstar) in NIBIO Ullensvang, Norway. For each variety the base temperatures for full blooming and the minimum sum of active temperatures from full blooming to harvest were determined. The derived criteria for each variety were applied to the gridded daily temperature data and interpolated to high resolution (0.01° × 0.01°).
In the period of 1961–2020, on average, each decade was warmer than the previous by approximately 0.4 °C but with a faster increase in 21st century. The average surface air temperature over the land area in the domain for the period of 2011–2020 was 1.1 °C higher compared to the value in the reference period of 1971–2000. During the reference period, the surface area with heat conditions which can sustain apple growing (with lower demands for heat), according to the determined criteria, was 7750 km2 (4.3% of land area) and in the decade of 2011–2020 it was 26,969 km2 (15.1%). Surface areas which can also sustain the growing of more heat-demanding varieties, increased from 29 km2 (0.016%) to 4612 km2 (2.575%).
Results derived for each decade in the period of 1961–2020 show a rapid decline in surface areas which did not have enough heat in any year and an increase of surface areas which have fulfilled, in some or all years, the minimum heat conditions for apple growing. This shows the rapid growing of the climate heat potential for sustainable apple growing in Norway, and it can be assumed it will continue to increase in the future.
Analysis of the change in the spatial distribution of the areas with favorable heat conditions for apple growing showed that the largest expansion happened in the southern parts of Southern Norway and of Eastern Norway and in the west parts of Western Norway. In Eastern Norway, such areas spread furthest from the coastal areas. The results also show that such areas appeared in the Trøndelag region, in areas with low altitudes. Because of the relatively high spatial variability of the terrain characteristics of Norway, as expected, small-scale areas with favorable heat conditions are scattered over the domain, further in-land, near fjords, and near the northern border of the domain.
Zoning of the areas where the fruit production could be implemented should include the assessment of spatial distribution of present and future optimal heat conditions, which are variety- and species-specific, climate risk assessment (risk of climate hazards), and information on land surface characteristics. In the study by [45], an assessment of the future rate of the expansion of areas with favorable heat conditions for apple growing is conducted, which presents the sequel to the analysis given in this paper.

Author Contributions

Conceptualization, A.V.V. and M.M.; methodology, A.V.V., M.M., M.V.M., and M.F.A.; software, A.V.V. and M.V.M.; validation, A.V.V., M.F.A., and K.V.; formal analysis, M.M.; resources, A.V.V., M.V.M., and M.M.; data curation, M.V.M., M.M., and K.V.; writing—original draft preparation, A.V.V.; writing—review and editing, M.M. and M.F.A.; visualization, A.V.V. and K.V.; supervision, M.M.; project administration, M.M.; funding acquisition, M.M. All authors have read and agreed to the published version of the manuscript.

Funding

This research was funded by the Norwegian Agriculture Agency, grant number 2020/72550, Agros 138323.

Institutional Review Board Statement

Not applicable.

Informed Consent Statement

Not applicable.

Data Availability Statement

Data can be provided on demand.

Acknowledgments

We thank Oddmund Frøynes and other technical staff at NIBIO Ullensvang, Norwegian Institute of Bioeconomy Research, Lofthus, Norway, for phenology registrations spanning many years. This research had technical support realized under the contract on realization and financing of science and research in 2023 between the Ministry of Science, Technological Development and Innovations of the Republic of Serbia and the Faculty of Agriculture, University of Belgrade (contract no. 451-03-47/2023-01/200116).

Conflicts of Interest

The authors declare no conflict of interests.

Appendix A. Supplement to the Analysis Implemented Using Data from Ullensvang

Figure A1. Average monthly temperature (maximum—upper pair of lines; mean—middle pair of lines; minimum—lower pair of lines) for the climate period 2001–2020 (orange) and for the latter decade 2011–2020 (red), and the average monthly accumulated precipitation for the climate period 2001–2020 (light green) and for the decade of 2011–2020 (dark green), for Ullensvang.
Atmosphere 14 00993 g0a1
Figure A2. Average daily temperature and monthly temperature (a) and change of the base temperature with date (b) where vertical lines mark 10 °C, 10.5 °C, 11 °C, 11.5 °C, and 12 °C. Data used are from Ullensvang station, for the period 2001–2020.
Atmosphere 14 00993 g0a2
Figure A3. Sums of active temperatures for each variety and each year with available observations of both FB and HAR dates in Ullensvang, and average sums of active temperatures for all varieties with available data for each year.
Atmosphere 14 00993 g0a3
Figure A4. Anomalies of average temperature for May–September for each year with respect to the average temperature for May–September for the period 2001–2020, for Ullensvang.
Atmosphere 14 00993 g0a4

Appendix B. Supplement to the Assessment of the Heat Requirements for Apple Growing

To determine the minimum heat requirements for fruit development, until the stage of development when they can be harvested, it is required to have observed dates of ripening. In this case, observation on fruit development were scarce, and no data on fruit final stages of development were available. Instead of considering physiological ripening to determine required heat conditions for apple growing, the dates of harvest for each variety are used here, as the next best thing.
The heat conditions required to achieve ripening and harvest, starting from the full blooming (FB), are to be determined by the threshold value for the sum of active temperatures (SUMT) for each variety. The SUMT are available for each variety for the years which have data on FB and HAR (Table 2). For each variety, the average (sumta), minimum (sumtx), and maximum (sumtn) SUMT values are presented in Figure 5. Higher values of SUMT were derived for years with warmer growing season, despite the fact that the harvest happened earlier. Those values could not be reached during the years with colder growing seasons. Large variations in SUMT values also could be the consequence of using the harvest date, and not the ripening date, for creating thresholds for the required heat conditions. As discussed in the main text, the harvest date is impacted by the decision of the producer and can happen before or well after the fruit ripens.
In Figure A5 the observed harvest dates and dates when certain threshold was achieved are given, using sumtn, sumta, and sumtx, for each year for each variety. All data with the observed harvest dates are shown. One should keep in mind that for all years with an available harvest date, not all dates for full blooming were necessarily available (Table 2), which were necessary to derive the criteria for heat requirements. Only the sumtn threshold for SUMT were possible to reach in all years, or at least values close enough to the threshold. For example, in 2005 and 2015 thresholds of sumta and sumtx were not achieved for most of the varieties. Additionally, in other colder growing season periods, similar problems appeared. To ensure not to overestimate the minimum heat requirements, the minimum SUMT (for each variety) was adopted as a threshold for the minimum heat requirements of fruits to reach the development stage when they can be harvested.
Figure A5. Harvest dates calculated using threshold values for SUMT (suma, sumtx, and sumtn; in grey, respectively), average calculated date (black), and the real (observed) harvest date (red) for Ullensvang for the period 2001–2020.
Atmosphere 14 00993 g0a5

Appendix C. Interpolated Temperature Data

Figure A6. Average minimum (a), mean (b), and maximum (c) daily temperature from EOBS and average minimum (d), mean (e), and maximum (f) daily temperature from interpolated (high resolution) daily data, for the period 2011–2020.
Atmosphere 14 00993 g0a6

Appendix D. Supplement to Zoning of Areas with Heat Favorable Conditions for Apple Growing

Figure A7. Number of years in 2011–2020 when heat conditions were achieved for each variety: Discovery (a), Gravenstein (b), Summerred (c), Aroma (d), Rubinstep (e), and Elstar (f), using sumtn for heat threshold; in blue are areas which have fulfilled heat conditions in ≤5 years, in green are areas which have reached required heat conditions in 6 years, in yellow in 7, etc., and in red are given areas which fulfilled required heat conditions in all 10 years.
Atmosphere 14 00993 g0a7

References

  1. FaoStat. 2023. Available online: http://www.fao.org/faostat/en/#data/QC (accessed on 25 March 2023).
  2. Fotirić Akšić, M.; Lazarević, K.; Šegan, S.; Natić, M.; Tosti, T.; Ćirić, I.; Meland, M. Assessing the Fatty Acid, Carotenoid, and Tocopherol Compositions of Seeds from Apple Cultivars (Malus domestica Borkh.) Grown in Norway. Foods 2021, 10, 1956. [Google Scholar] [CrossRef] [PubMed]
  3. Jackson, J.E. Biology of Apples and Pears; Cambridge University Press: Cambridge, UK, 2003; 488p. [Google Scholar]
  4. Benmoussa, H.; Ghrab, M.; Ben Mimoun, M.; Luedeling, E. Chilling and heat requirements for local and foreign almond (Prunus dulcis Mill.) cultivars in a warm mediterranean location based on 30 years of phenology records. Agric. For. Meteorol. 2017, 239, 34–46. [Google Scholar] [CrossRef]
  5. Santos, J.A.; Costa, R.; Fraga, H. New insights into thermal growing conditions of Portuguese grapevine varieties under changing climates. Theor. Appl. Climatol. 2018, 135, 1215–1226. [Google Scholar] [CrossRef]
  6. Rodriguez, A.B.; Munoz, A.R.; Curetti, M.; Raffo, M.D. Impact of seasonal climate variability on the phenology of pear (Pyrus communis L.) cv. Williams from Rio Negro-Argentina. Chil. J. Agric. Anim. Sci. 2020, 36, 129–139. [Google Scholar] [CrossRef]
  7. Cho, J.G.; Kumar, S.; Kim, S.H.; Han, J.H.; Durso, C.S.; Martin, P.H. Apple phenology occurs earlier across South Korea with higher temperatures and increased precipitation. Int. J. Biometeorol. 2021, 65, 265–276. [Google Scholar] [CrossRef]
  8. Ru, X.; Jiang, Y.; Luo, Q.; Wang, R.; Feng, X.; Wang, J.; Wang, Z.; Li, M.; Qu, Z.; Su, B.; et al. Evaluating late spring frost risks of apple in the Loess Plateau of China under future climate change with phenological modeling approach. Sci. Hortic. 2023, 308, 111604. [Google Scholar] [CrossRef]
  9. Hassan, G.I.; Wani, A.W.; Dar, S.Q.; Younus Wani, M.; Sofi, J.A.; Baba, T.R.; Parray, E.; Rasool, A. Physiology of Fruit Set and Development in Apple under Temperate conditions: A Review. Int. J. Curr. Microbiol. App. Sci. 2020, 9, 618–638. [Google Scholar] [CrossRef]
  10. Heide, O.M.; Rivero, R.; Sønsteby, A. Temperature control of shoot growth and floral initiation in apple (Malus × domestica Borkh.). CABI Agric. Biosci. 2020, 1, 8. [Google Scholar] [CrossRef]
  11. Lakso, A.N.; Piccioni, R.M.; Denning, S.S.; Sottile, F.; Costa Tura, J. Validating an apple dry matter production model with whole canopy gas exchange measurements in the field. Acta Hortic. 1999, 499, 115–122. [Google Scholar] [CrossRef]
  12. IPCC. Summary for Policymakers. In Climate Change 2021: The Physical Science Basis. Contribution of Working Group I to the Sixth Assessment Report of the Intergovernmental Panel on Climate Change; Masson-Delmotte, V., Zhai, P., Pirani, A., Connors, S.L., Péan, C., Berger, S., Caud, N., Chen, Y., Goldfarb, L., Gomis, M.I., et al., Eds.; Cambridge University Press: Cambridge, UK; New York, NY, USA, 2021; pp. 3–32. [Google Scholar]
  13. Hanssen-Bauer, I.; Førland, E.J.; Haddeland, I.; Hisdal, H.; Mayer, S.; Nesje, A.; Nilsen, J.E.Ø.; Sandven, S.; Sandø, A.B.; Sorteberg, A.; et al. Klima i Norge 2100; Kunnskapsgrunnlag for klimatilpasning oppdatert i 2015; Bakgrunnsmateriale til NOU Klimatilpassing., Norsk Klimasenter: Oslo, Norway, 2015; ISSN 2387-3027. [Google Scholar]
  14. IPCC. Summary for Policymakers. In Climate Change 2022: Impacts, Adaptation and Vulnerability. Contribution of Working Group II to the Sixth Assessment Report of the Intergovernmental Panel on Climate Change; Pörtner, H.-O., Roberts, D.C., Poloczanska, E.S., Mintenbeck, K., Tignor, M., Alegría, A., Craig, M., Langsdorf, S., Löschke, S., Möller, V., et al., Eds.; Cambridge University Press: Cambridge, UK; New York, NY, USA, 2022; pp. 3–33. [Google Scholar]
  15. Bhandari, N. Apple Tree Phenology in Relation to Temperature in Sauherad (Norway). Int. J. Nat. Resour. Ecol. Manag. 2022, 7, 59–66. [Google Scholar] [CrossRef]
  16. Luedeling, E.; Brown, P.H. A global analysis of the comparability of winter chill models for fruit and nut trees. Int. J. Biometeorol. 2011, 55, 411–421. [Google Scholar] [CrossRef] [PubMed] [Green Version]
  17. Fadon, E.; Herrera, S.; Guerrero, B.I.; Guerra, M.E.; Rodrigo, J. Chilling and Heat Requirements of Temperature Fruit Trees (Prunus sp.). Agronomy 2020, 10, 409. [Google Scholar] [CrossRef] [Green Version]
  18. Ruiz, D.; Campoy, J.A.; Egea, J. Chilling and heat requirements of apricot cultivars for flowering. Environ. Exp. Bot. 2007, 61, 254–263. [Google Scholar] [CrossRef]
  19. Djaman, K.; Koudahe, K.; Darapuneni, M.; Irmak, S. Chilling and Heat Accumulation of Fruit and Nut Trees and Flower Bud Vulnerability to Early Spring Low Temperatures in New Mexico: Meteorological Approach. Sustainability 2021, 13, 2524. [Google Scholar] [CrossRef]
  20. Ruml, M.; Vuković, A.; Milatović, D. Evaluation of different methods for determining growing degree-day thresholds in apricot cultivars. Int. J. Biometeorol. 2010, 54, 411–422. [Google Scholar] [CrossRef]
  21. Ruml, M.; Milatović, D.; Vulić, T.; Vuković, A. Predicting apricot phenology using meteorological data. Int. J. Biometeorol. 2011, 55, 723–732. [Google Scholar] [CrossRef]
  22. Vuković Vimić, A.; Djurdjević, V.; Ranković-Vasić, Z.; Nikolić, D.; Ćosić, M.; Lipovac, A.; Cvetković, B.; Sotonica, D.; Vojvodić, D.; Vujadinović Mandić, M. Enhancing Capacity for Short-Term Climate Change Adaptations in Agriculture in Serbia: Development of Integrated Agrometeorological Prediction System. Atmosphere 2022, 13, 1337. [Google Scholar] [CrossRef]
  23. Łysiak, G. The Sum of Active Temperatures as a Method of Determining the Optimum Harvest Date of ‘Šampion’ and ‘Ligol’ Apple Cultivars. Acta Sci. Pol. Hort. Cultus 2012, 11, 3–13. [Google Scholar]
  24. Łysiak, G.P. Degree Days as a Method to Estimate the Optimal Harvest Date of ‘Conference’ Pears. Agriculture 2022, 12, 1803. [Google Scholar] [CrossRef]
  25. Fotirić Akšić, M.; Nešović, M.; Ćirić, I.; Tešić, Ž.; Pezo, L.; Tosti, T.; Gašić, U.; Dojčinović, B.; Lončar, B.; Meland, M. Polyphenolics and Chemical Profiles of Domestic Norwegian Apple (Malus × domestica Borkh.) Cultivars. Front. Nutr. 2022, 9, 941487. [Google Scholar] [CrossRef]
  26. Fotirić Akšić, M.; Dabić Zagorac, D.; Gašić, U.; Tosti, T.; Natić, M.; Meland, M. Analysis of Apple Fruit (Malus × domestica Borkh.) Quality Attributes Obtained from Organic and Integrated Production Systems. Sustainability 2022, 14, 5300. [Google Scholar] [CrossRef]
  27. Maas, F.M.; Fotirić Akšić, M.; Meland, M. Response of ’Rubinstep’ apple to flower and fruitlet thinning in a northern climate. Acta Hortic. 2020, 1295, 41–48. [Google Scholar] [CrossRef]
  28. Wicklund, T.; Guyot, S.; Le Quere, J.-M. Chemical Composition of Apples Cultivated in Norway. Crops 2021, 1, 8–19. [Google Scholar] [CrossRef]
  29. WMO. Guidlines on Analysis of Extremes in a Chaniging Climate in Support of Informed Decisions for Adaptation; World Meteorological Organization: Geneva, Switzerland, 2009. [Google Scholar]
  30. Hack, H.; Bleiholder, H.; Buhr, L.; Meier, U.; SchnockFricke, U.; Weber, E.; Witzenberger, A. Einheitliche Codierung der phanologischen Entwicklungsstadien mono- und dikotyler Pfl anzen-Erweiterte BBCH-Skala, Allgemein. Nachrichtenbl. Deut. Pflanzenschutzd 1992, 44, 265–270. [Google Scholar]
  31. Meier, U. Growth Stages of Mono-and Dicotyledonous Plants-BBCH Monograph; Federal Biological Research Centre for Agriculture and Forestry: Berlin, Germany, 2001; Available online: https://www.politicheagricole.it/flex/AppData/WebLive/Agrometeo/MIEPFY800/BBCHengl2001.pdf (accessed on 25 March 2023).
  32. Laaksonen, O.; Kuldjärv, R.; Paalme, T.; Virkki, M.; Yang, B. Impact of apple cultivar, ripening stage, fermentation type and yeast strain on phenolic composition of apple ciders. Food Chem. 2017, 233, 29–37. [Google Scholar] [CrossRef]
  33. Cornes, R.C.; van der Schrier, G.; van den Besselaar, E.J.M.; Jones, P.D. An Ensemble Version of the E-OBS Temperature and Precipitation Datasets. J. Geophys. Res. Atmos. 2018, 123, 9391–9409. [Google Scholar] [CrossRef] [Green Version]
  34. Cressman, G.P. An operational objective analysis system. Mon. Weather. Rev. 1959, 87, 367–374. [Google Scholar] [CrossRef]
  35. Ivanisevic, D.; Jaksic, D.; Korac, N. Atlas of Viticulture; In Serbian; Statistical Office of the Republic of Serbia: Belgrade, Serbia, 2015; p. 413. ISBN 978-86-6161-138-4. [Google Scholar]
  36. Djurović, D.; Vulić, T.; Veličković, M.; Oparnica, Č.; Djordjević, A.; Milatović, D.; Nikolić, D.; Zec, G.; Fortirić-Akšić, M.; Djordjević, B.; et al. Zoning of Fruit Production in Belgrade, South and East Serbia; In Serbian; Project Report; University of Belgrade-Faculty of Agriculture: Belgrade, Serbia, 2020; p. 306. [Google Scholar]
  37. Vujadinović Mandić, M.; Vuković Vimić, A.; Ranković-Vasić, Z.; Đurović, D.; Ćosić, M.; Sotonica, D.; Nikolić, D.; Đurđević, V. Observed Changes in Climate Conditions and Weather-Related Risks in Fruit and Grape Production in Serbia. Atmosphere 2022, 13, 948. [Google Scholar] [CrossRef]
  38. Vukovic, A.; Vujadinovic, M.; Djurdjevic, V.; Cvetkovic, B.; Rankovic-Vasic, Z.; Przic, Z.; Ruml, M.; Krzic, A. Fine scale Climate Change Analysis: From Global Models to Local Impact Studies in Serbia. In Proceedings of the 7th International Conference on Information and Communication Technologies in Agriculture, Food and Environment (HAICTA 2015), Kavala, Greece, 17–20 September 2015; Volume 1498, pp. 892–901, ISSN 1613-0073. [Google Scholar]
  39. EC. EU Strategy on Adaptation to Climate Change; EC: Brussels, Belgium, 2021; Available online: https://eur-lex.europa.eu/legal-content/EN/TXT/?uri=COM:2021:82:FIN (accessed on 31 March 2023).
  40. Norwegian Ministry of Foreign Affairs. Strategy for Climate Change Adaptation, Disaster Risk Reduction and the Fight against Hunger; Norwegian Ministry of Foreign Affairs: Oslo, Norway, 2023; Available online: https://www.regjeringen.no/contentassets/1d1d0105047e42f28f33008fcc90eef7/klimatilpasningstrategi_2023_en.pdf (accessed on 31 March 2023).
  41. Ministry of Climate and Environment, 2022 Norway’s First Adaptation Communication. 2021. Available online: https://unfccc.int/sites/default/files/resource/Adaptation%20Communication%20Norway.pdf (accessed on 31 March 2023).
  42. Moinina, A.; Lahlali, R.; Boulif, M. Important pests, diseases and weather conditions affecting apple production: Current state and perspectives. Rev. Mar. Sci. Agron. Vét. 2019, 7, 71–87. [Google Scholar]
  43. Papp, D.; Gao, L.; Thapa, R.; Olmstead, D.; Khan, A. Field apple scab susceptibility of a diverse Malus germplasm collection identifies potential sources of resistance for apple breeding. CABI Agric. Biosci. 2020, 1, 16. [Google Scholar] [CrossRef]
  44. Sestras, R.E.; Sestras, A.F. Quantitative Traits of Interest in Apple Breeding and Their Implications for Selection. Plants 2023, 12, 903. [Google Scholar] [CrossRef] [PubMed]
  45. Vujadinović Mandić, M.; Vuković Vimić, A.; Fotirić Akšić, M.; Meland, M. Climate Potential for Apple Growing in Norway—Part 2: Assessment of Suitability of Heat Conditions under Future Climate Change. Atmosphere 2023, 14, 937. [Google Scholar] [CrossRef]
Figure 1. The domain of the study area with altitudes and the location of the orchards (NIBIO Ullensvang) from where the phenological and meteorological data were collected.
Atmosphere 14 00993 g001
Figure 2. The difference between the average predicted and observed full blooming dates for the whole range of the assumed base temperatures (9 °C to 15 °C with interval 0.1 °C), for each variety (thin lines), and selected base temperatures for each variety (vertical lines), for which the smallest is the difference between the predicted and observed dates.
Atmosphere 14 00993 g002
Figure 3. Values of sums of active temperatures for each variety derived from the available data in Ullensvang in the period of 2003–2020, their average (yellow), minimum (blue), and maximum (orange) values. Also marked are base temperatures (Tb), determined for each variety.
Atmosphere 14 00993 g003
Figure 4. Number of years in the decade of 1961–1970 when heat conditions were achieved at least for one apple variety (a) and for all apple varieties (b), and the same for the decade of 2011–2020 (c,d). In blue are the areas which have fulfilled the heat conditions in ≤5 years, in green are the areas which reached required heat conditions in 6 years, in yellow in 7, etc., and in red are given the areas which fulfilled required heat conditions in all 10 years.
Atmosphere 14 00993 g004
Figure 5. Percentage of total surface area of the domain (south part of Norway) when zero years fulfill the minimum required heat conditions (0), when the condition is fulfilled at least in one year (1 ≤), at least in two years (2 ≤), etc., and when the condition is fulfilled in all years (10), for each decade during the period of 1961–2020. Upper panel (a) gives the results for surface areas where at least one variety fulfills the condition, and lower panel (b) when all varieties fulfill the condition.
Atmosphere 14 00993 g005
Figure 6. The average temperature anomalies for the whole domain for each decade, compared to the average temperature for the period of 1961–2020.
Atmosphere 14 00993 g006
Figure 7. Areas with favorable heat conditions for apple growing in 2011–2020, which did not have sufficient heat conditions during the base period of 1971–2000, for apple growing in general, meaning if the condition is fulfilled for at least one variety (a), and for more heat-demanding apple varieties, meaning if the condition is fulfilled for all studied varieties (b). This anomaly shows the expansion of areas with favorable heat conditions in 2011–2020, compared to 1971–2000.
Atmosphere 14 00993 g007
Table 1. For each variety, the number of available observations of full blooming (FB), average observed date of FB, and selected base temperature (Tb) for FB. Varieties are listed according to the average dates of the observed FB.
VarietyNumber of Years with Observed FBAverage Observed Date
(Day of Year (Date))
Selected Base Temperature (°C)
Gravenstein17139 (18.5.)10.1
Summerred17140 (19.5.)10.4
Discovery17143 (22.5.)11.1
Rubinstep6144 (23.5.)11.1
Aroma16147 (26.5.)11.8
Elstar11148 (27.5.)12.0
Table 2. Number of years with observed dates for both, full blooming and harvest FB&HAR (all observed harvest dates HAR), earliest observed harvest date and average observed harvest date (using all available HAR dates), and difference in days between the latest and earliest harvest date (considering all observed harvest dates), for each variety, in Ullensvang, in the period of 2003–2020. Varieties are listed according to the average HAR date.
VarietyNumber of Years FB&HAR (HAR)Earliest
HAR
Average
HAR
Difference between latest and earliest HAR Date
Discovery15 (16)235 (23.8.)249 (6.9.)25
Gravenstein4 (5)243 (31.8.)257 (14.9.)24
Summerred13 (14)242 (30.8.)259 (16.9.)32
Aroma16 (18)253 (10.10.)273 (30.9.)36
Rubinstep3 (13)259 (16.9.)279 (6.10.)31
Elstar4 (11)258 (15.9.)280 (7.10.)37
Disclaimer/Publisher’s Note: The statements, opinions and data contained in all publications are solely those of the individual author(s) and contributor(s) and not of MDPI and/or the editor(s). MDPI and/or the editor(s) disclaim responsibility for any injury to people or property resulting from any ideas, methods, instructions or products referred to in the content.

