
Investigation of Secondary Organic Aerosol Formation during O3 and PM2.5 Episodes in Bangkok, Thailand

 ,
,
Abstract
1. Introduction
2. Materials and Methods
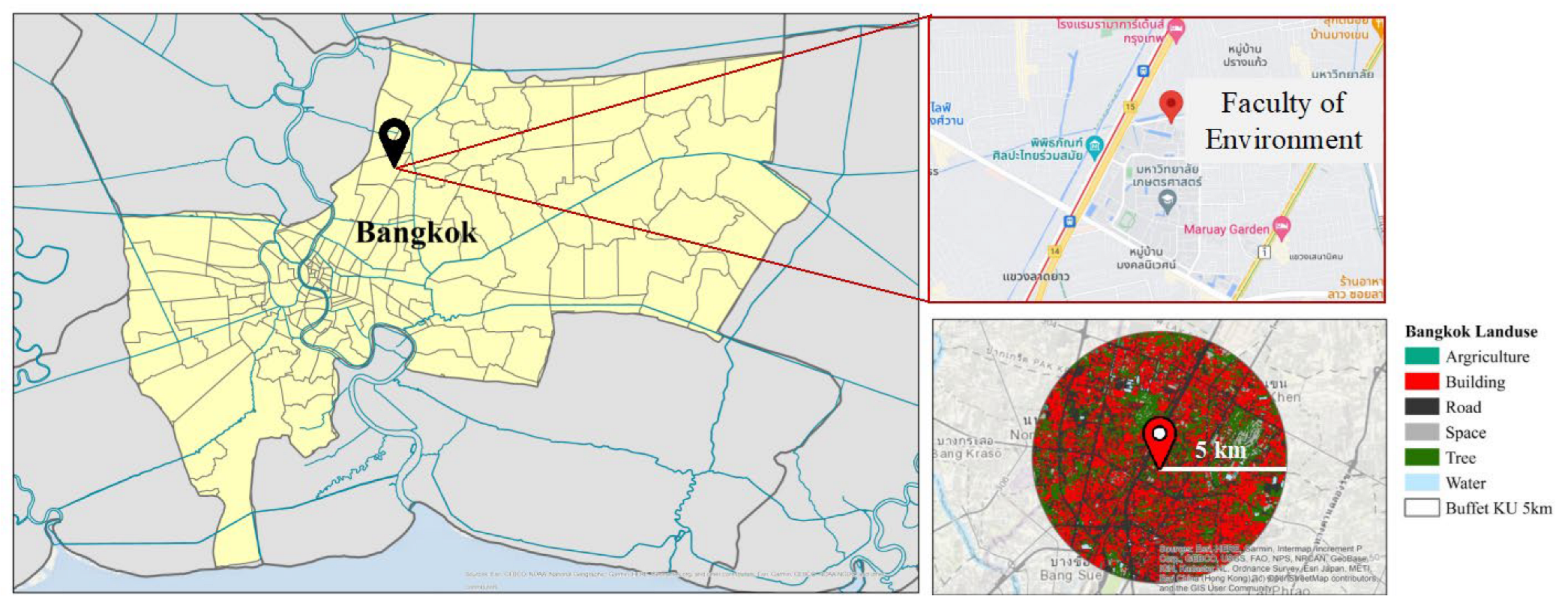
2.1. Sampling Site
2.2. Data Collection
2.3. OC and EC Contaminant Analysis and Estimation of POC and SOC
3. Results and Discussion
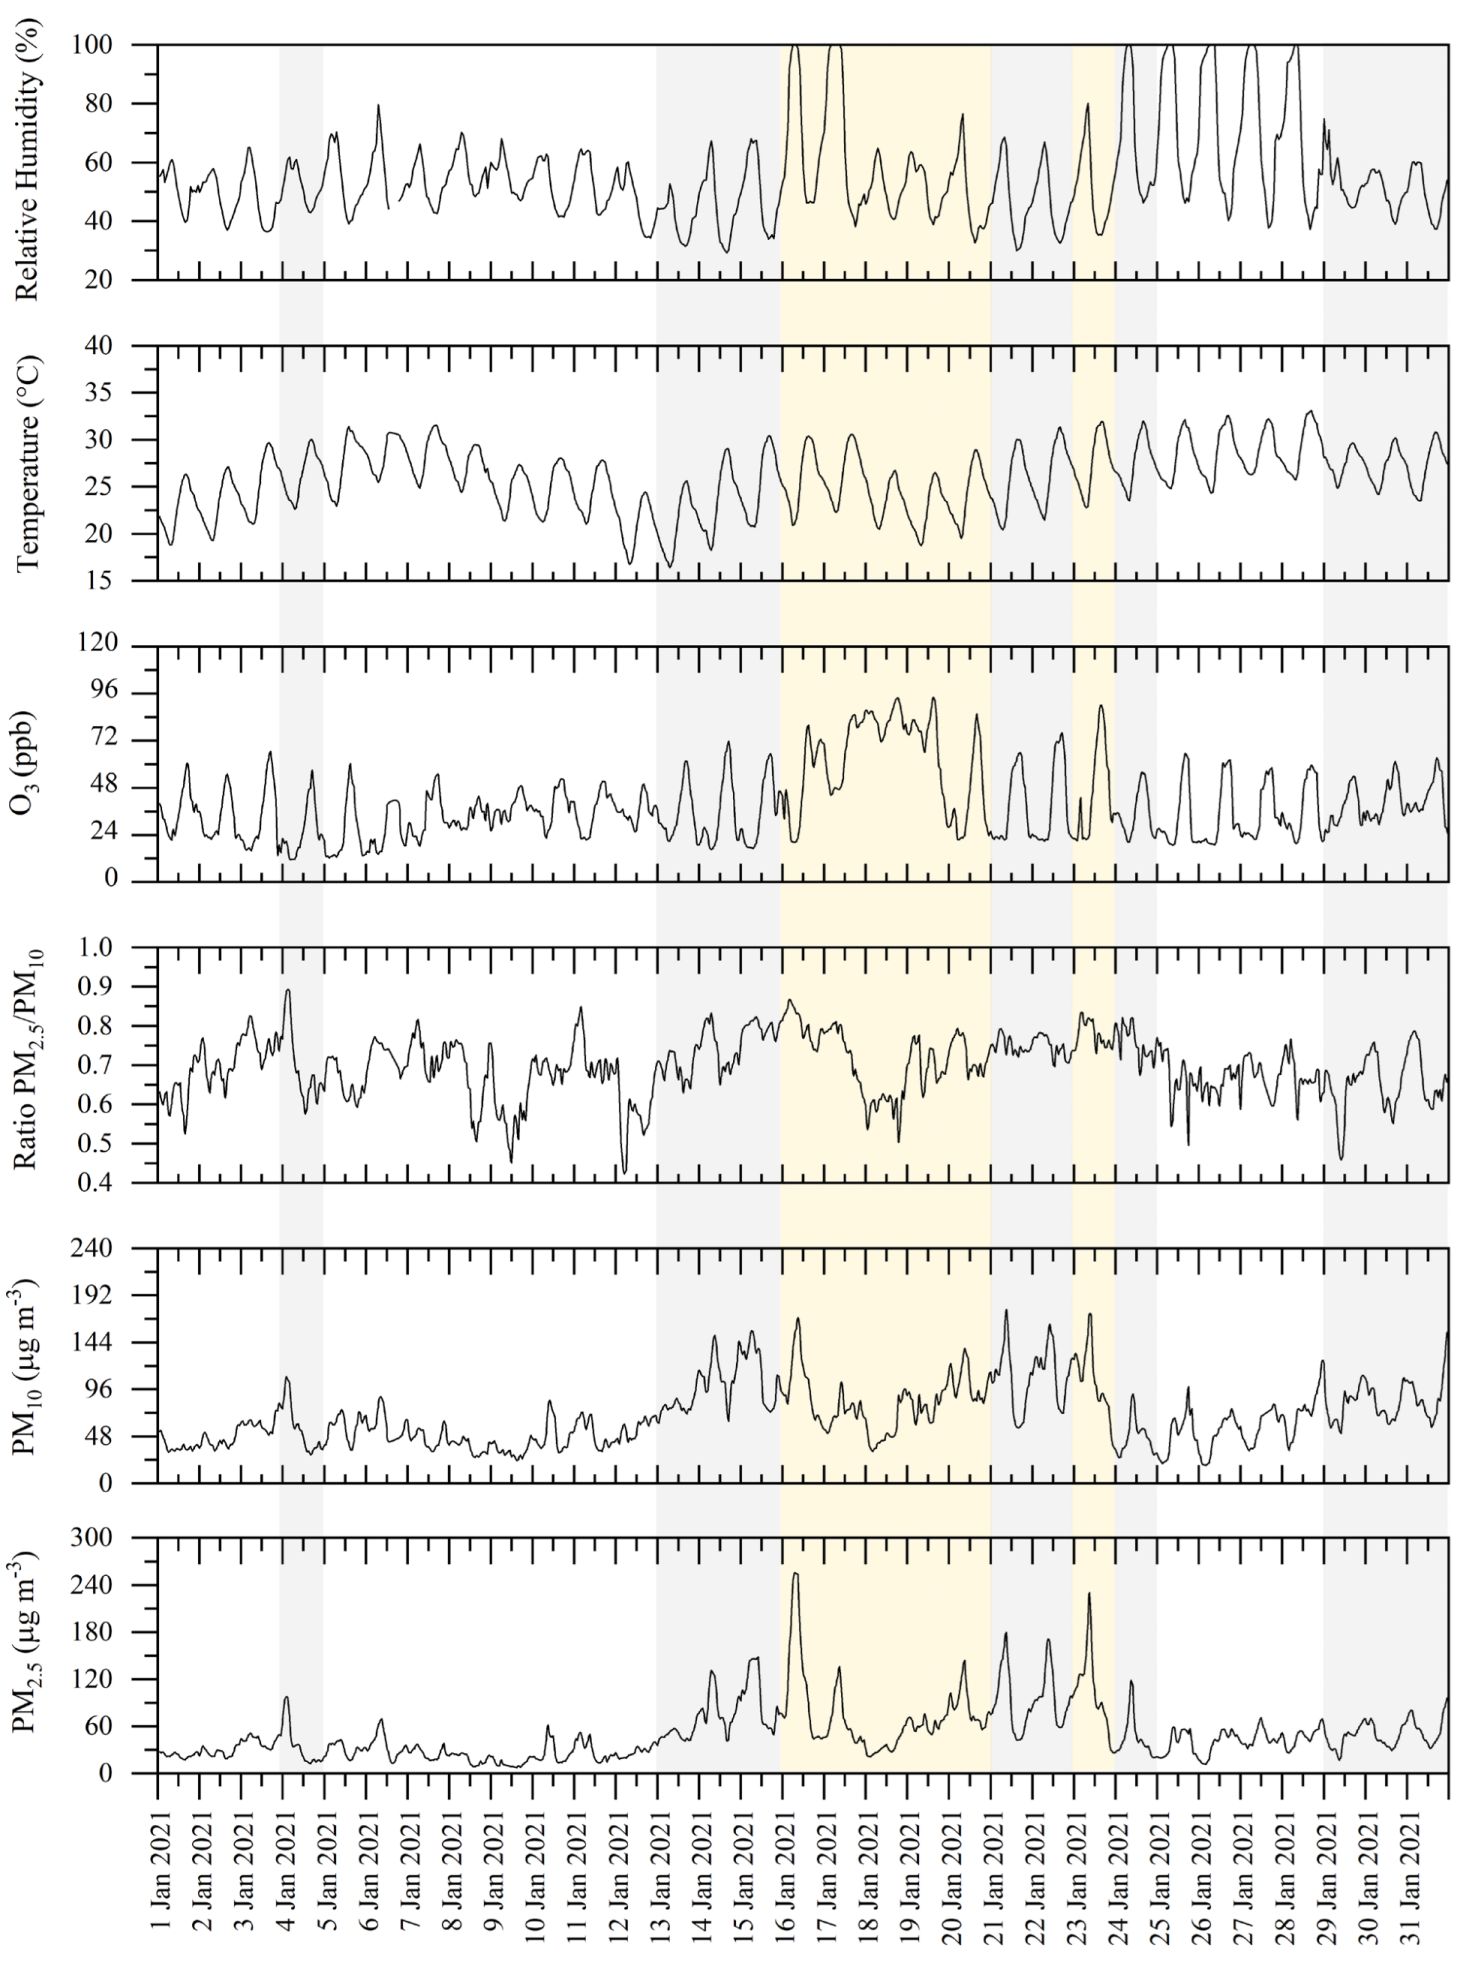
3.1. Classification of Pollution Events
3.2. Correlation between PM2.5 and O3
3.3. Temporal Patterns of OC, EC, POC, and SOC
3.3.1. Identification of Emission Sources
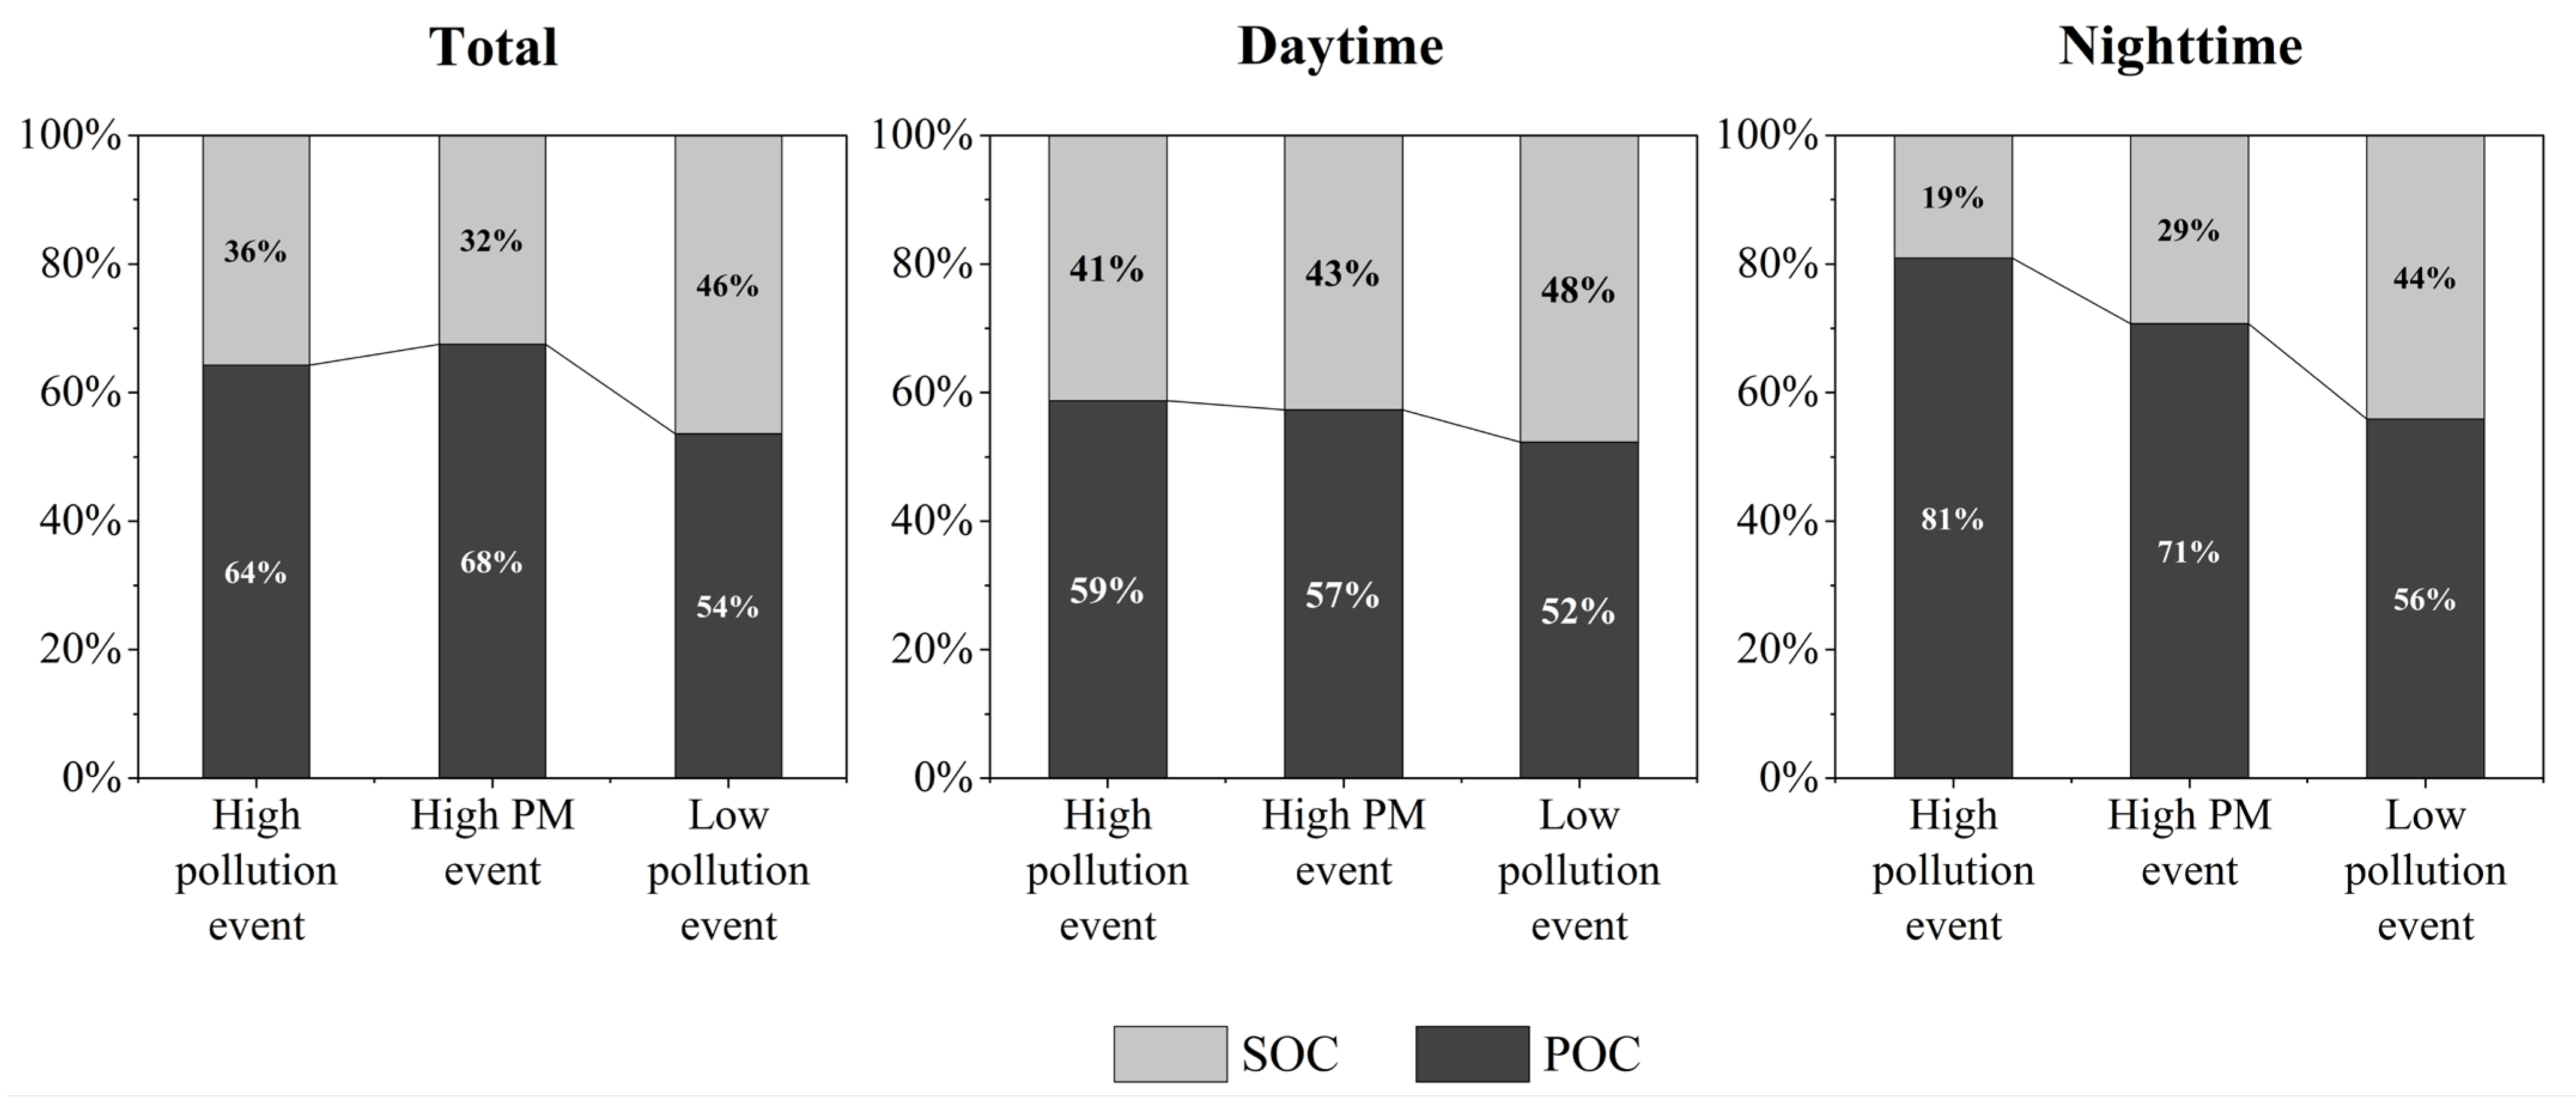
3.3.2. Estimation of Primary and Secondary Organic Carbon Concentrations
4. Conclusions
Author Contributions
Funding
Institutional Review Board Statement
Informed Consent Statement
Data Availability Statement
Acknowledgments
Conflicts of Interest
References
- Ambient Air Quality Standard for PM2.5 Act. 139 § 163. 2022. Available online: https://ratchakitcha2.soc.go.th/pdfdownload/?id=139D163S0000000002100 (accessed on 30 June 2022).
- Thai Meteorological Department. The Climate of Thailand. Available online: https://www.tmd.go.th/en/archive/thailand_climate.pdf (accessed on 30 June 2022).
- Uttamang, P.; Aneja, V.P.; Hanna, A.H. Assessment of gaseous criteria pollutants in the Bangkok Metropolitan Region, Thailand. Atmos. Chem. Phys. 2018, 18, 12581–12593. [Google Scholar] [CrossRef]
- Bangkok Metropolitan Administration. AQI Information. Available online: https://bangkokairquality.com/bma/aqi?lang=en (accessed on 14 March 2023).
- Phairuang, W.; Hongtieab, S.; Suwattiga, P.; Furuuchi, M.; Hata, M. Atmospheric ultrafine particulate matter (PM0.1)-bound carbon composition in Bangkok, Thailand. Atmosphere 2022, 13, 1676. [Google Scholar] [CrossRef]
- Thangavel, P.; Park, D.; Lee, Y.-C. Recent Insights into Particulate Matter (PM2.5)-Mediated Toxicity in Humans: An Overview. Int. J. Environ. Res. Public Health 2022, 19, 7511. [Google Scholar] [CrossRef]
- United State Environmental Protection Agency (US.EPA). Particulate Matter (PM) Pollution Health and Environmental Effects of Particulate Matter (PM). Available online: https://www.epa.gov/pm-pollution/health-and-environmental-effects-particulate-matter-pm (accessed on 14 March 2023).
- Wetchayont, P.; Hayasaka, T.; Khatri, P. Air Quality Improvement during COVID-19 Lockdown in Bangkok Metropolitan, Thailand: Effect of the Long-range Transport of Air Pollutants. Aerosol Air Qual. Res. 2021, 21, 200662. [Google Scholar] [CrossRef]
- Choomanee, P.; Bualert, S.; Thongyen, T.; Salao, S.; Szymanski, W.W.; Rungratanaubon, T. Vertical variation of carbonaceous aerosol with in the PM2.5 fraction in Bangkok, Thailand. Aerosol Air Qual. Res. 2020, 20, 43–52. [Google Scholar] [CrossRef]
- Rattanapotanan, T.; Thongyen, T.; Bualert, S.; Choomanee, P.; Suwattiga, P.; Rungrattanaubon, T.; Utavong, T.; Phupijit, J.; Changplaiy, N. Secondary source of PM2.5 based on the vertical distribution of organic carbon, elemental carbon, and water-soluble ions in Bangkok. Environ. Adv. 2023, 11, 100337. [Google Scholar] [CrossRef]
- Zhang, H.-H.; Li, Z.; Liu, Y.; Xinag, P.; Cui, X.-Y.; Ye, H.; Hu, B.-I.; Lou, L.-P. Physical and chemical characteristics of PM2.5 and its toxicity to human bronchial cells BEAS-2B in the winter and summer. J. Zhejiang Univ. Sci. B 2018, 19, 317–326. [Google Scholar] [CrossRef]
- Pani, S.K.; Lin, N.-H.; Chantra, S.; Wang, S.-H.; Khamlkaew, C.; Prapamontol, T.; Janjai, S. Radiative response of biomass-burning aerosols over an urban atmosphere in northern peninsular Southeast Asia. Sci. Total Environ. 2018, 633, 892–911. [Google Scholar] [CrossRef]
- Yoo, H.Y.; Kim, K.A.; Kim, Y.P.; Jung, C.H.; Shin, H.J.; Moon, K.J.; Park, S.M.; Lee, J.Y. Validation of SOC Estimation using OC and EC Concentration in PM2.5 Measured at Seoul. Aerosol Air Qual. Res. 2022, 22, 210388. [Google Scholar] [CrossRef]
- Turpin, B.J.; Huntzicker, J.J. Secondary formation of organic aerosol in the Los Angeles basin: A descriptive analysis of organic and elemental carbon concentrations. Atmos. Environ. 1991, 24A, 207–215. [Google Scholar] [CrossRef]
- Day, M.C.; Zhang, M.; Pandis, S.N. Evaluation of the ability of the EC tracer method to estimate secondary organic carbon. Atmos. Environ. 2015, 112, 317–325. [Google Scholar] [CrossRef]
- Kaskaoutis, D.G.; Grivas, G.; Theodosi, C.; Tsagkaraki, M.; Paraskevopoulou, D.; Stavroulas, I.; Liakakou, E.; Gkikas, A.; Hatzianastassiou, N.; Wu, C.; et al. Carbonaceous Aerosols in Contrasting Atmospheric Environments in Greek Cities: Evaluation of the EC-tracer Methods for Secondary Organic Carbon Estimation. Atmosphere 2020, 11, 161. [Google Scholar] [CrossRef]
- Lim, H.-J.; Turpin, B.J. Origins of primary and secondary organic aerosol in Atlanta: Results of time-resolved measurements during the Atlanta Supersite Experiment. Environ. Sci. Technol. 2002, 36, 4489–4496. [Google Scholar] [CrossRef]
- Salma, I.; Varga, P.T.; Vasanits, A.; Machon, A. Secondary organic carbon in different atmospheric environments of a continental region and seasons. Atmos. Res. 2022, 278, 106360. [Google Scholar] [CrossRef]
- Han, S.; Jang, M. Modeling daytime and nighttime secondary organic aerosol formation via multiphase reactions of biogenic hydrocarbons. ACP 2023, 23, 1209–1226. [Google Scholar] [CrossRef]
- Jia, M.; Zhao, T.; Cheng, X.; Gong, S.; Zhang, X.; Tang, L.; Liu, D.; Wu, X.; Wang, L.; Chen, Y. Inverse relations of PM2.5 and O3 in air compound pollution between cold and hot seasons over an urban area of east China. Atmosphere 2017, 8, 59. [Google Scholar] [CrossRef]
- Zhu, J.; Chen, L.; Liao, H.; Dang, R. Correlations between PM2.5 and Ozone over China and Associated Underlying Reasons. Atmosphere 2019, 10, 352. [Google Scholar] [CrossRef]
- Feng, T.; Zhao, S.; Bei, N.; Wu, J.; Liu, S.; Li, X.; Liu, L.; Qian, Y.; Yang, Q.; Wang, Y.; et al. Secondary organic aerosol enhanced by increasing atmospheric oxidizing capacity in Beijing–Tianjin–Hebei (BTH), China. Atmos. Chem. Phys. 2019, 19, 7429–7443. [Google Scholar] [CrossRef]
- Liu, Y.; Zhao, Q.; Hao, X.; Zhao, J.; Zhang, Y.; Yang, X.; Fu, Q.; Xu, X.; Wang, X.; Huo, J.; et al. Increasing surface ozone and enhanced secondary organic carbon formation at a city junction site: An epitome of the Yangtze River Delta, China (2014–2017). Environ. Pollut. 2020, 265, 114847. [Google Scholar] [CrossRef]
- Li, K.; Jacob, D.J.; Liao, H.; Shen, L.; Zhang, Q.; Bates, K.H. Anthropogenic drivers of 2013–2017 trends in summer surface ozone in China. Proc. Natl. Acad. Sci. USA 2019, 116, 422–427. [Google Scholar] [CrossRef]
- Fan, H.; Zhao, C.; Yang, Y.; Yang, X. Spatio-Temporal Variations of the PM2.5/PM10 Ratios and Its Application to Air Pollution Type Classification in China. Front. Environ. Sci. 2021, 9, 692440. [Google Scholar] [CrossRef]
- Franzin, B.T.; Guizellini, F.C.; de Babos, D.V.; Hojo, O.; Pastre, I.A.; Marchi, M.R.R. Characterization of Atmospheric Aerosol (PM10 and PM2.5) from a Medium Sized City in São Paulo State, Brazil. J. Environ. Sci. 2020, 89, 238–251. [Google Scholar] [CrossRef]
- Spandana, B.; Rao, S.S.; Upadhya, A.R.; Kulkarni, P.; Sreekanth, V. PM2.5/PM10 ratio characteristics over urban sites of India. Adv. Space Res. 2021, 67, 3134–3146. [Google Scholar] [CrossRef]
- Xu, G.; Jiao, L.; Zhang, B.; Zhao, S.; Yuan, M.; Gu, Y.; Liu, J.; Tang, X. Spatial and Temporal Variability of the PM2.5/PM10 Ratio in Wuhan, Central China. Aerosol Air Qual. Res. 2017, 17, 741–751. [Google Scholar] [CrossRef]
- Zhao, D.; Chen, H.; Yu, E.; Luo, T. PM2.5/PM10 Ratios in Eight Economic Regions and Their Relationship with Meteorology in China. Adv. Meteorol. 2019, 2019, 5295726. [Google Scholar] [CrossRef]
- Chen, Y.J.; Zhi, G.R.; Feng, Y.L.; Fu, J.M.; Feng, J.L.; Sheng, G.Y.; Simoneit, B.R.T. Measurements of emission factors for primary carbonaceous particles from residential raw-coal combustion in China. Geophys. Res. Lett. 2006, 33, 382. [Google Scholar] [CrossRef]
- Chow, J.C.; Watson, J.G.; Chen, L.W.A.; Arnott, W.P.A.; Moosmüller, H.; Fung, K. Equivalence of elemental carbon by thermal/optical reflectance and transmittance with different temperature protocols. Environ. Sci. Technol. 2004, 38, 4414–4422. [Google Scholar] [CrossRef]
- He, L.Y.; Hu, M.; Huang, X.F.; Yu, B.D.; Zhang, Y.H.; Liu, D.Q. Measurement of emissions of fine particulate organic matter from Chinese cooking. Atmos. Environ. 2004, 38, 6557–6564. [Google Scholar] [CrossRef]
- Zhang, Y.X.; Shao, M.; Zhang, Y.H.; Zeng, L.M.; He, L.Y.; Zhu, B.; Wei, Y.J.; Zhu, X.L. Source profiles of particulate organic matters emitted from cereal straw burnings. J. Environ. Sci. 2007, 19, 167–175. [Google Scholar] [CrossRef]
- Qi, M.; Jiang, L.; Liu, Y.; Xiong, Q.; Sun, C.; Li, X.; Zhao, W.; Yang, X. Analysis of the characteristics and sources of carbonaceous aerosols in PM2.5 in the Beijing, Tianjin, and Langfang Region, China. Int. J. Environ. Res. Public Health 2018, 15, 1483. [Google Scholar] [CrossRef]
- Department of Land Transport. Nation Transportation Statistics. Available online: https://web.dlt.go.th/statistics/index.php (accessed on 30 November 2022).
- Phairuang, W.; Inerb, M.; Furuuchi, M.; Hata, M.; Tekasakul, S.; Tekasakul, P. Size-fractionated carbonaceous aerosols down to PM0.1 in southern Thailand: Local and long-range transport effects. Environ. Pollut. 2020, 260, 114031. [Google Scholar] [CrossRef] [PubMed]
- Aman, N.; Manomaiphiboon, K.; Suwattiga, P.; Assareh, N.; Limpaseni, W.; Suwanathada, P.; Soonsin, V.; Wang, Y. Visibility, aerosol optical depth, and low-visibility events in Bangkok during the dry season and associated local weather and synoptic patterns. Environ. Monit. Assess. 2022, 194, 322. [Google Scholar] [CrossRef] [PubMed]
- Chow, J.C.; Watson, J.G.; Chen, W.A.; Chang, M.O.; Robinson, N.F.; Trimble, D.; Kohl, S. The IMPROVE_A temperature protocol for thermal/optical carbon analysis: Maintaining consistency with a long-term database. J. Air Waste Manag. Assoc. 2012, 57, 1014–1023. [Google Scholar] [CrossRef]
- Han, Y.M.; Cao, J.J.; Chow, J.C.; Watson, J.G.; An, Z.; Jin, Z.S.; Fung, K.; Liu, S. Evaluation of the thermal/optical reflectance method for discrimination between char- and soot-EC. Chemosphere 2007, 69, 569–574. [Google Scholar] [CrossRef]
- Karanasiou, A.; Minguilloón, M.C.; Viana, M.; Alastuey, A.; Putaud, J.P.; Maenhaut, W.; Pantelladis, P.; Močnik, G.; Favez, O.; Kuhlbusch, T.A.J. Thermal-optical analysis for the measurement of elemental carbon (EC) and organic carbon (OC) in ambient air a literature review. Atmos. Meas. Technol. 2015, 8, 9649–9712. [Google Scholar]
- Bautista VII, A.T.; Pabroa, P.C.B.; Santos, F.L.; Quirit, L.L.; Asis, J.L.B.; Dy, M.A.K.; Martinez, J.P.G. Intercomparison between NIOSH, IMPROVE_A, and EUSAAR_2 protocols: Finding an optimal thermal– optical protocol for Philippines OC/EC samples. Atmos. Pollut. Res. 2015, 6, 334–342. [Google Scholar] [CrossRef]
- Srivastava, D.; Daellenbach, K.R.; Zhang, Y.; Bonnaire, N.; Chazeau, B.; Perraudin, E.; Gros, V.; Lucarelli, F.; Villenave, E.; Prévôt, A.S.H.; et al. Comparison of five methodologies to apportion organic aerosol sources during a PM pollution event. Sci. Total Environ. 2021, 757, 143168. [Google Scholar] [CrossRef]
- Wu, C.; Wu, D.; Yu, J.Z. Estimation and Uncertainty Analysis of Secondary Organic Carbon Using 1 Year of Hourly Organic and Elemental Carbon Data. Journal of Geophysical Research. Atmospheres 2019, 124, 2774–2795. [Google Scholar]
- Coa, J.J.; Zhu, C.S.; Tie, X.X.; Geng, F.H.; Ho, S.S.H.; Wang, G.H.; Han, Y.M.; Ho, K.F. Characteristics and sources of carbonaceous aerosols from Shanghai, China. Atmos. Chem. Phys. 2013, 13, 803–817. [Google Scholar]
- Tiwari, S.; Dumka, U.C.; Kaskaoutis, D.G.; Ram, K.; Panicker, A.S.; Srivastava, M.K.; Tiwari, S.; Attri, S.D.; Soni, V.K.; Pandey, A.K. Aerosol chemical characterization and role of carbonaceous aerosol on radiative effect over Varanasi in central Indo-Gangetic Plain. Atmos. Environ. 2016, 125, 437–449. [Google Scholar] [CrossRef]
- Wu, C.; Yu, J.Z. Determination of primary combustion source organic carbon-to-elemental carbon (OC /EC) ratio using ambient OC and EC measurements: Secondary OC-EC correlation minimization method. Atmos. Chem. Phys. 2016, 16, 5453–5465. [Google Scholar] [CrossRef]
- Zhang, H.; Wang, Y.; Hu, J.; Ying, Q.; Hu, X.-M. Relationships between meteorological parameters and criteria air pollutants in three megacities in China. Environ. Res. 2015, 140, 242–254. [Google Scholar] [CrossRef]
- Devi, N.L.; Kumar, A.; Yadav, I.C. PM10 and PM2.5 in Indo-Gangetic Plain (IGP) of India: Chemical characterization, source analysis, and transport pathways. Urban Clim. 2020, 33, 100663. [Google Scholar] [CrossRef]
- Dumka, U.C.; Tiwari, S.; Kaskaoutis, D.G.; Hopke, P.K.; Singh, J.; Srivastava, A.K.; Bisht, D.S.; Attri, S.D.; Tyagi, S.; Misra, A.; et al. Assessment of PM2.5 chemical compositions in Delhi: Primary vs. secondary emissions and contribution to light extinction coefficient and visibility degradation. J. Atmos. Chem. 2017, 74, 423–450. [Google Scholar] [CrossRef]
- Han, S.; Bian, H.; Feng, Y.; Liu, A.; Li, X.; Zeng, F.; Zhang, X. Analysis of the Relationship between O3, NO and NO2 in Tianjin, China. Aerosol Air Qual. Res. 2011, 11, 128–139. [Google Scholar] [CrossRef]
- Uttamang, P.; Campbell, P.C.; Aneja, V.P.; Hanna, A.F. A multi-scale model analysis of ozone formation in the Bangkok Metropolitan Region, Thailand. Atmos. Environ. 2020, 229, 117433. [Google Scholar] [CrossRef]
- Gaoa, S.; Lathem, T.; Nyadong, L. Nighttime secondary organic aerosol formation from unburned fuel vapors. Atmos. Environ. 2019, 204, 125–134. [Google Scholar] [CrossRef]
- Palm, B.B.; Campuzano-Jost, P.; Day, D.A.; Ortega, A.M.; Fry, J.L.; Brown, S.S.; Zarzana, K.J.; Dube, W.; Wagner, N.L.; Draper, D.C.; et al. Secondary organic aerosol formation from in situ OH, O3, and NO3 oxidation of ambient forest air in an oxidation flow reactor. Atmos. Chem. Phys. 2017, 17, 5331–5354. [Google Scholar] [CrossRef]
- Zaveri, R.A.; Shilling, J.E.; Fast, J.D.; Springston, S.R. Efficient nighttime biogenic SOA formation in a polluted residual layer. J. Geophys. Res. Atmos. 2020, 125, e2019JD031583. [Google Scholar] [CrossRef]
- Jiang, X.; Tsona, N.T.; Jia, L.; Liu, S.; Zhang, H.; Xu, Y.; Du, L. Secondary organic aerosol formation from photooxidation of furan: Effects of NOx and humidity. Atmos. Chem. Phys. 2019, 19, 13591–13609. [Google Scholar] [CrossRef]


| Species | Maximum | Minimum | Average ± SD |
|---|---|---|---|
| PM2.5 (µg m−3) | 141.88 | 11.97 | 49.69 ± 25.61 |
| PM10 (µg m−3) | 177.46 | 18.53 | 69.80 ± 31.43 |
| O3 (ppb) | 94.22 | 11.6 | 39.45 ± 18.96 |
| PM2.5/PM10 | 0.89 | 0.42 | 0.70 ± 0.08 |
| Episode | PM2.5 (µg m−3) | O3 (ppb) | Day of the Month | Total Day |
|---|---|---|---|---|
| High pollution | >50 | >77.4 | 16 to 20 and 23 | 6 |
| High PM | >50 | ≤77.4 | 4, 13 to 15, 21 to 22, 24, and 29 to 31 | 10 |
| Low pollution | ≤50 | ≤77.4 | 1 to 3, 5 to 12, and 25 to 28 | 15 |
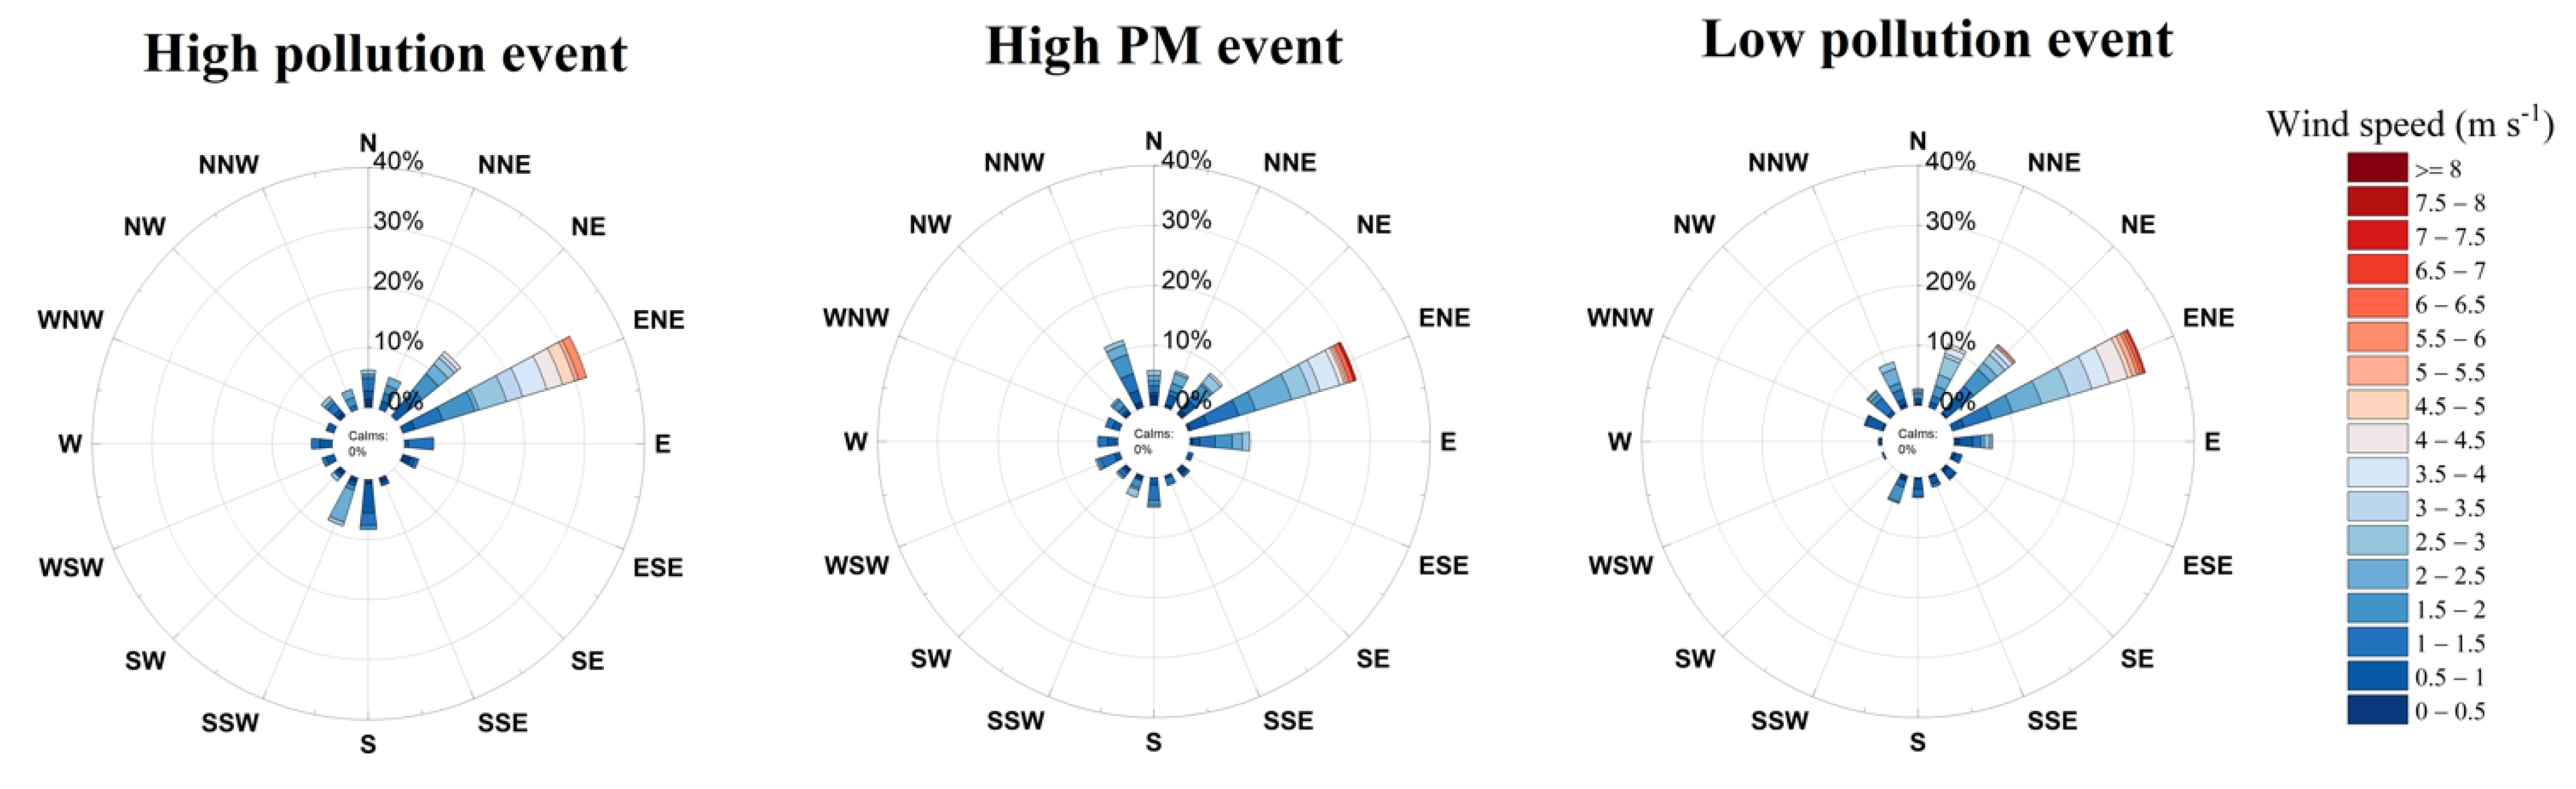
| Parameters | Events | Maximum | Minimum | Mean |
|---|---|---|---|---|
| Wind Speed (m s−1) | High pollution | 5.57 | 0.16 | 1.84 ± 1.21 |
| High PM | 7.10 | 0.10 | 1.72 ± 1.06 | |
| Low pollution | 6.83 | 0.04 | 2.00 ± 1.22 | |
| Temperature (°C) | High pollution | 31.99 | 18.78 | 25.12 ± 3.21 |
| High PM | 32.01 | 16.43 | 25.81 ± 3.43 | |
| Low pollution | 33.09 | 16.74 | 26.13 ± 3.47 | |
| Relative Humidity (%) | High pollution | 100.00 (34) * | 32.67 (11) | 56.83 ± 18.10 (19 ± 6) |
| High PM | 100.00 (34) | 29.32 (10) | 50.27 ± 12.59 (17 ± 4) | |
| Low pollution | 100.00 (36) | 34.42 (12) | 57.35 ± 16.08 (20 ± 6) | |
| Light Intensity ** (wm−2 µm−1) | High pollution | 212.3 | 0.0 | 74.3 ± 61.8 |
| High PM | 234.7 | 0.0 | 76.5 ± 62.4 | |
| Low pollution | 235.7 | 0.0 | 76.5 ± 66.0 |
| Events | PM2.5 (µg m−3) | PM10 (µg m−3) | O3 (ppb) | PM2.5/PM10 | r (PM2.5-O3) | OC (µg m−3) | EC (µg m−3) | OC/EC | POC (µg m−3) | SOC (µg m−3) | SOC/ POC |
|---|---|---|---|---|---|---|---|---|---|---|---|
| Total | |||||||||||
| High pollution | 78.3 ± 48.8 | 85.9 ± 30.1 | 59.8 ± 23.7 | 0.73 | −0.64 | 64.92 ± 20.72 | 14.31 ± 7.67 | 4.54 | 41.72 ± 22.36 | 23.20 ± 9.29 | 0.56 |
| High PM | 65.2 ± 34.5 | 88.1 ± 32.3 | 36.5 ± 15.3 | 0.71 | −0.38 | 75.38 ± 28.38 | 17.47 ± 9.21 | 4.32 | 50.92 ± 26.84 | 24.46 ± 11.68 | 0.48 |
| Low pollution | 31.4 ± 14.0 | 50.8 ± 17.2 | 33.2 ± 12.4 | 0.67 | −0.18 | 50.75 ± 12.98 | 9.34 ± 3.92 | 5.43 | 27.21 ± 11.44 | 23.54 ± 7.46 | 0.86 |
| Daytime | |||||||||||
| High pollution | 72.3 ± 51.2 | 81.8 ± 33.1 | 61.7 ± 23.0 | 0.70 | −0.43 | 61.57 ± 23.68 | 12.42 ± 5.50 | 4.96 | 36.18 ± 16.02 | 25.38 ± 8.18 | 0.70 |
| High PM | 59.9 ± 36.5 | 82.1 ± 31.0 | 44.9 ± 15.4 | 0.69 | −0.40 | 61.73 ± 17.34 | 12.14 ± 4.19 | 5.08 | 35.39 ± 12.20 | 26.34 ± 7.73 | 0.74 |
| Low pollution | 31.8 ± 15.6 | 51.4 ± 17.2 | 39.0 ± 12.9 | 0.65 | −0.17 | 46.42 ± 9.29 | 8.32 ± 3.47 | 5.58 | 24.26 ± 10.10 | 22.16 ± 7.15 | 0.91 |
| Night-time | |||||||||||
| High pollution | 76.2 ± 46.9 | 82.9 ± 29.1 | 52.3 ± 24.8 | 0.74 | −0.64 | 68.27 ± 18.90 | 16.21 ± 9.52 | 4.21 | 47.25 ± 27.74 | 21.03 ± 10.56 | 0.44 |
| High PM | 71.5 ± 31.0 | 95.0 ± 32.5 | 26.8 ± 7.4 | 0.75 | −0.27 | 89.04 ± 31.41 | 22.80 ± 9.92 | 3.91 | 66.45 ± 28.92 | 22.59 ± 14.85 | 0.34 |
| Low pollution | 30.8 ± 11.9 | 50.1 ± 17.3 | 26.7 ± 7.8 | 0.70 | −0.37 | 55.09 ± 15.11 | 10.35 ± 4.24 | 5.32 | 30.17 ± 12.35 | 24.92 ± 7.78 | 0.83 |
Disclaimer/Publisher’s Note: The statements, opinions and data contained in all publications are solely those of the individual author(s) and contributor(s) and not of MDPI and/or the editor(s). MDPI and/or the editor(s) disclaim responsibility for any injury to people or property resulting from any ideas, methods, instructions or products referred to in the content. |
© 2023 by the authors. Licensee MDPI, Basel, Switzerland. This article is an open access article distributed under the terms and conditions of the Creative Commons Attribution (CC BY) license (https://creativecommons.org/licenses/by/4.0/).
Share and Cite
Uttamang, P.; Choomanee, P.; Phupijit, J.; Bualert, S.; Thongyen, T. Investigation of Secondary Organic Aerosol Formation during O3 and PM2.5 Episodes in Bangkok, Thailand. Atmosphere 2023, 14, 994. https://doi.org/10.3390/atmos14060994
Uttamang P, Choomanee P, Phupijit J, Bualert S, Thongyen T. Investigation of Secondary Organic Aerosol Formation during O3 and PM2.5 Episodes in Bangkok, Thailand. Atmosphere. 2023; 14(6):994. https://doi.org/10.3390/atmos14060994
Chicago/Turabian StyleUttamang, Pornpan, Parkpoom Choomanee, Jitlada Phupijit, Surat Bualert, and Thunyapat Thongyen. 2023. "Investigation of Secondary Organic Aerosol Formation during O3 and PM2.5 Episodes in Bangkok, Thailand" Atmosphere 14, no. 6: 994. https://doi.org/10.3390/atmos14060994
APA StyleUttamang, P., Choomanee, P., Phupijit, J., Bualert, S., & Thongyen, T. (2023). Investigation of Secondary Organic Aerosol Formation during O3 and PM2.5 Episodes in Bangkok, Thailand. Atmosphere, 14(6), 994. https://doi.org/10.3390/atmos14060994