3.2. Concentrations of Air Pollutants and Meteorological Parameters before and during MCO
Many processes contribute to causing air pollution in automobiles (aircraft, trucks, automobiles, and other engines), power plants, industries, and household heating systems. The release of chemicals and harmful gases interacts with sunlight to increase the toxicity of the material [
38]. As predicted, the lockdown, better known as MCO in Malaysia, improved the air quality in the country. During MCO, there were restricted social interactions and the closure of non-essential industries; hence, particular air contaminants, primarily those controlled by primary sources, were temporarily reduced. Several studies also reported a significant reduction in air pollution and improved air quality in their regions during lockdown [
16,
39,
40,
41].
Table 1 and
Table 2 depict the descriptive statistics (mean, standard deviation, median, interquartile range, maximum, and minimum) of daily parameters and air pollutants parameters between 18 March and 1 June in 2019 and 2020 in the study locations. This 11-week period represents MCO in Malaysia, with MCO starting on 18 March 2020. A pair-sample
t-test (effect size, d) was employed in comparing the mean concentrations of all parameters that were normally distributed. In contrast, non-normally distributed parameters were appropriately interpreted using a Wilcoxon signed-rank test (effect size, r) during these two years.
In 2020, all studied air pollutants in Kuala Lumpur showed lower concentrations than in 2019, except for PM
2.5, as shown in
Table 2. The average of PM
2.5 in 2020 was higher than in 2019 at 0.22 µg/m
3, and the results were statistically different (t or Z) at
p < 0.05. In other words, the MCO was influential in reducing toxic air levels. The effect size of NO
2 was large (d ≥ 0.80 or r ≥ 0.80), whereas CO and SO
2 recorded a medium effect size (r ≥ 0.50). Nevertheless, all meteorological parameters were statistically significant (t or Z) at
p < 0.05, following the removal of AT. SR had the highest effect size compared to other variables, which was a medium effect size at r = 0.68.
On average, all air quality parameters in 2020 showed lower concentrations than in 2019, as shown in
Table 3. These results were statistically significant at
p < 0.05, reflecting the impact of the MCO on enhancing air quality. Whereas PM
2.5 and PM
10 recorded a medium effect size (r ≥ 0.50), a large effect size was observed for NO
2, O
3, and CO (d ≥ 0.80 or r ≥ 0.80). The exclusion of SR resulted in all meteorological parameters exhibiting non-statistically significant differences (t or Z) at
p < 0.05. SR had the highest effect size compared to other variables, which had a medium effect size at r = 0.70.
The new Malaysia Ambient Air Quality Standard for 2020 from the DOE (2020) was compared with all six air pollutant parameters. None of these air pollution parameters exceeded the standards (PM10 = 100 μg m−3 for 24 h, PM2.5 = 35 μg m−3 for 24 h, SO2 = 95 ppb for 1 h, NO2 = 149 ppb for 1 h, O3 = 92 ppb for 1 h, and CO = 26.19 ppm for 1 h) except for PM2.5 for both states.
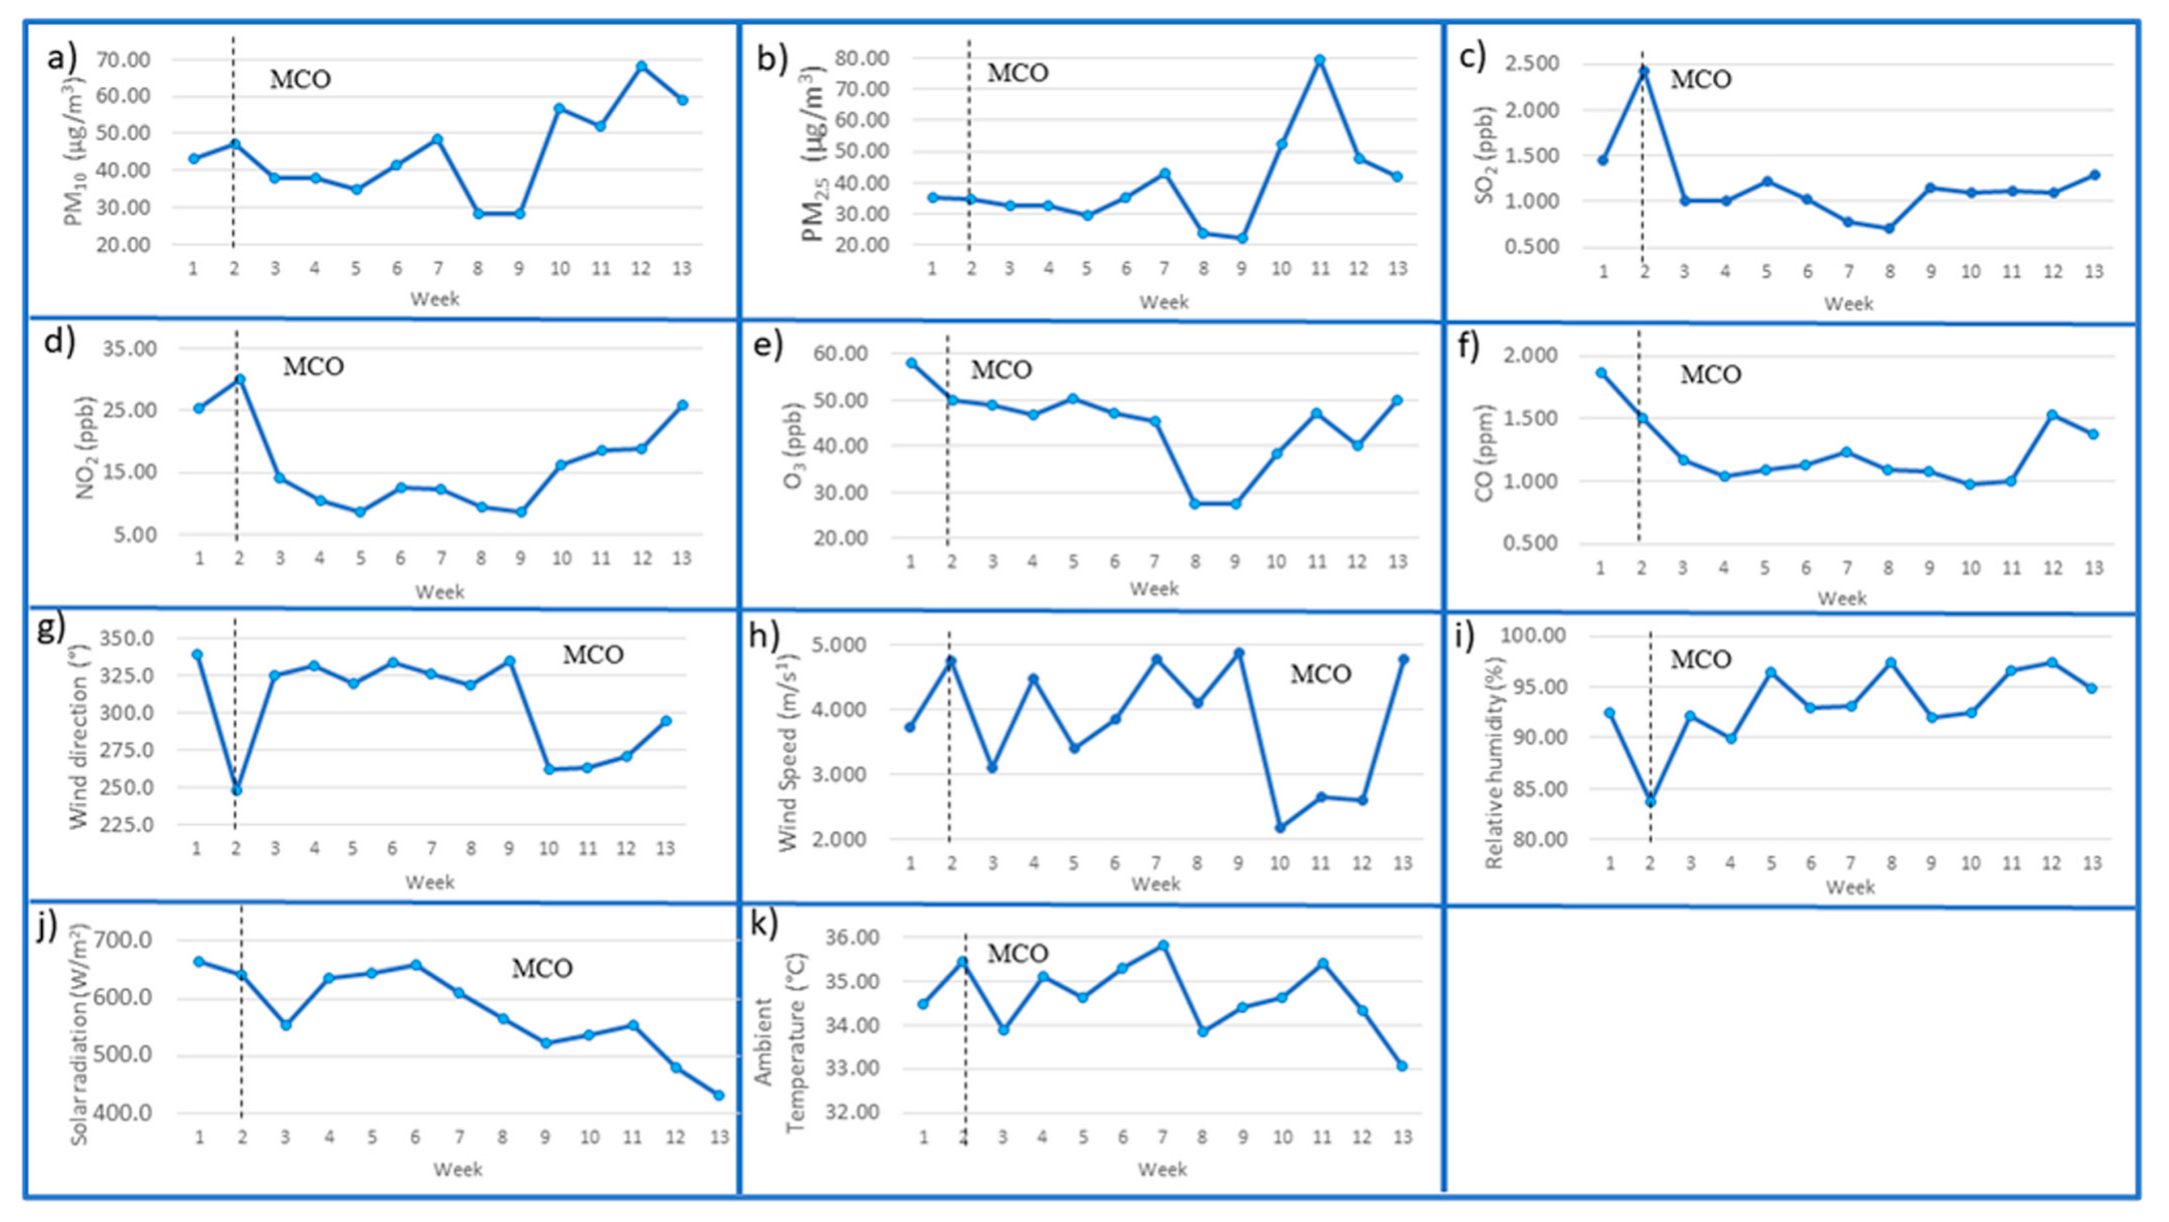
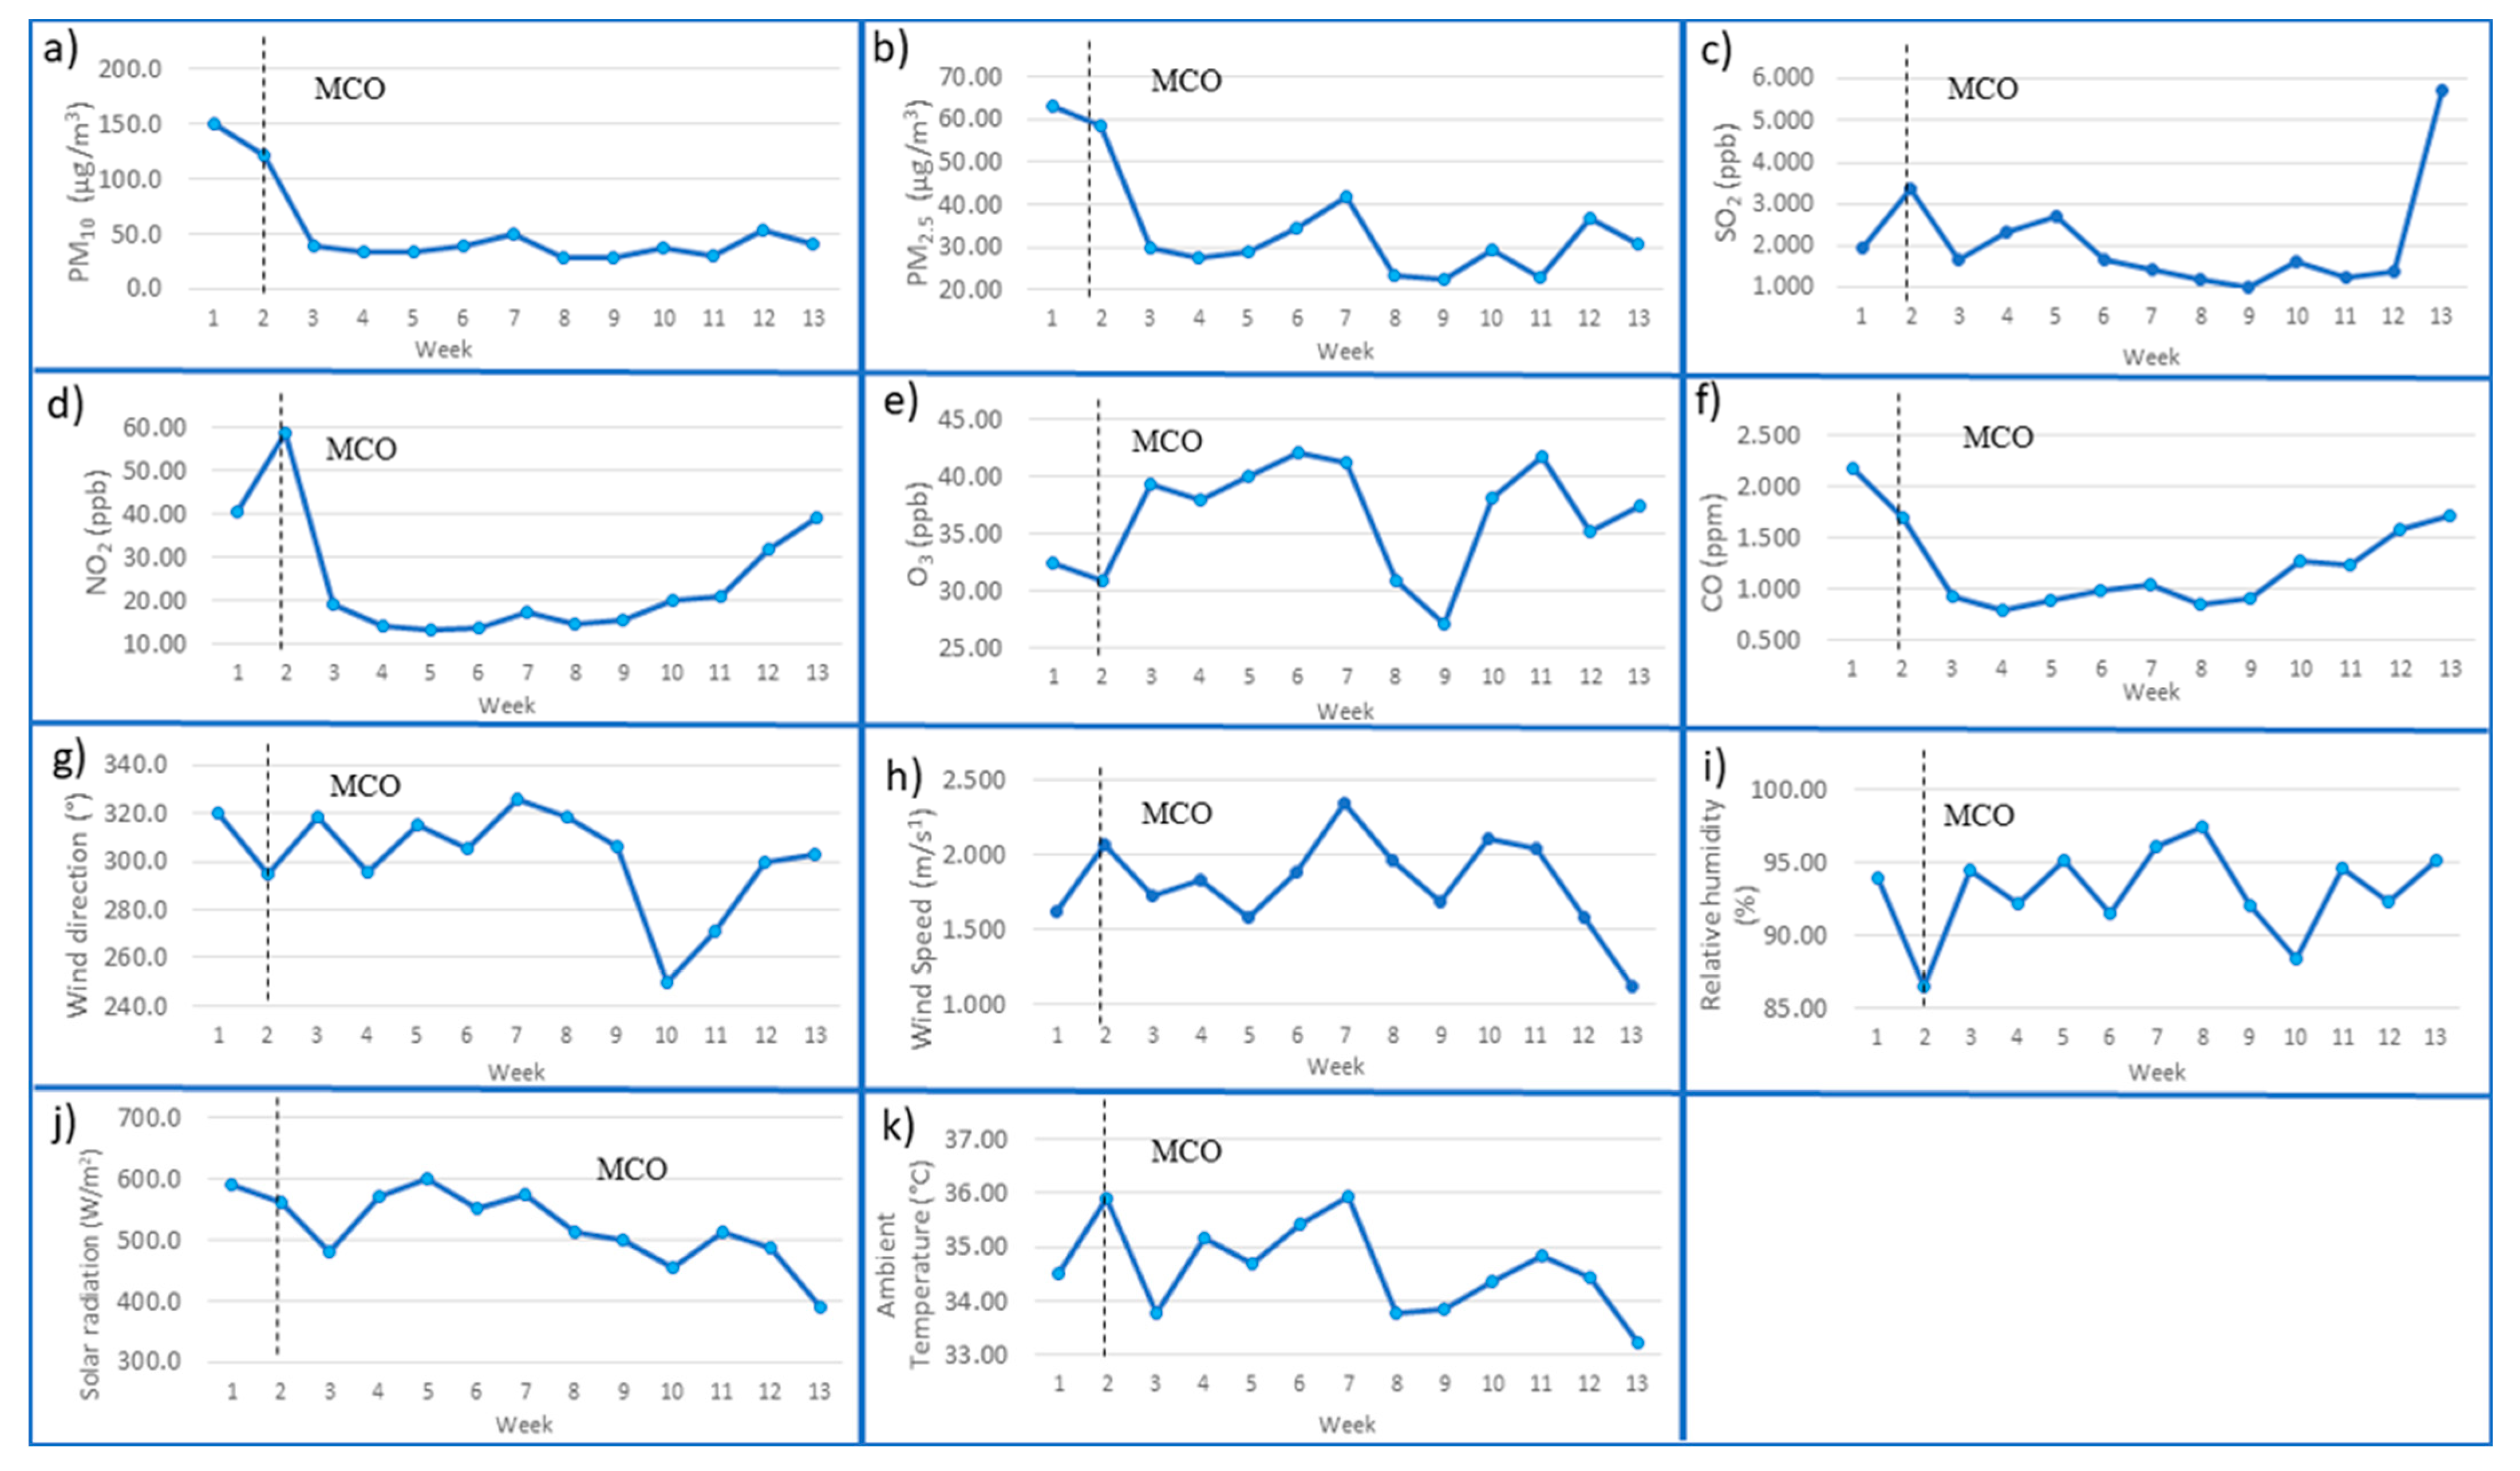
Figure 5 and
Figure 6 indicate the weekly average levels of air pollutants and meteorological factors beginning from 4 March to 1 June 2020 (13 weeks) in Kuala Lumpur and Selangor, respectively. The measurements were categorized into two periods: (1) before the MCO (4 March 2020 to 17 March 2020, also Week 1–Week 2), and (2) during the MCO (18 March to 1 June 2020, also Week 3–Week 13). The 13-week duration was designated as (1) Week 1 from 4 March to 10 March, (2) Week 2 from 11 March to 17 March, (3) Week 3 from 18 March to 24 March, (4) Week 4 from 25 March to 31 March, (5) Week 5 from 1 April to 7 April, (6) Week 6 from 8 April to 14 April, (7) Week 7 from 15 April to 21 April, (8) Week 8 from 22 April to 28 April, (9) Week 9 from 29 April to 5 May, (10) Week 10 from 6 May to 12 May, (11) Week 11 from 13 May to 19 May, (12) Week 12 from 20 May to 26 May, and (13) Week 13 from 27 May to 1 June.
All air pollutants were significantly reduced, excluding O3 in Selangor and PM2.5 and O3 in Kuala Lumpur and O3 in Selangor, during the third and fourth weeks of the MCO. PM10 and PM2.5 concentrations in Kuala Lumpur did not decrease after MCO from Week 3 until Week 5, but the concentrations increased drastically in Week 10. In contrast, PM10 in Selangor showed decreasing trends, which were from the range of 120.9–151 μg m−3 before MCO to the range of 29.2–53.1 μg m−3 during MCO; PM2.5 in Selangor exhibited declining trends, which were from the range of 58.2–62.8 μg m−3 before MCO to the range of 22.3–41.8 μg m−3 during MCO.
There are industrial areas and heavy road traffic around the monitoring station, so when MCO was implemented, the restriction of movement and operation of industries also stopped, decreasing the production of particulate matter in the atmosphere. However, trucks used to transport foods and other essential goods during the MCO were operating as usual. Consequently, the concentrations of PM
2.5 and PM
10 in Kuala Lumpur did not reduce during MCO due to the ongoing essential activities in the region [
30].
As a result of reduced manufacturing operations in Malaysia throughout MCO, SO
2 concentrations also decreased. Nevertheless, the SO
2 concentration increased drastically in Week 13 in Selangor. This finding could be due to the reopening of many economic sectors and activities when MCO moved to a new phase, the Conditional Movement Control Order (CMCO). Apart from this finding, concentrations of CO
2 and NO
2 in Kuala Lumpur and Selangor had recorded higher concentrations before MCO than during MCO. A decreased number of vehicles on the road caused fewer emissions from motor vehicles, which explained the significant reductions in NO
2 and CO emissions. Previous studies reported on CO reduction in the megacity of Delhi, India, and a decline in NO
2 levels in the city of Rio de Janeiro, Brazil, due to a reduction in vehicle movement and the closure of industrial complexes and power plants during the COVID-19 lockdown [
42,
43]. Therefore, shutting down transport and industrial sectors mainly explains why these pollutants declined sharply during the lockdown phase.
Furthermore, Lefohn et al. [
44] and Paoletti et al. [
45] indicated that the reduction of nitrogen oxide (NO
x) concentrations had an inverse relationship with O
3 concentrations. Contrastingly, concentrations of O
3 fell rapidly at higher concentrations of NO
x [
46,
47]. In the presence of sunlight, photolysis of NO
x and volatile organic compounds (VOCs) produces O
3 [
48]. As a result of restricted movements and operations during the lockdown phase, decreased NO
2 emissions increased O
3 concentrations [
49,
50].
The climate of Malaysia is categorized as hot and humid throughout the year because its location is just north of the equator, with average temperatures around 28 degrees on the mainland. There are two monsoon wind seasons: the southwest monsoon from May to September and the northeast monsoon from October to March. These monsoon seasons bring in more rainfall with a higher RH, lower SR, and lower AT on average than hot seasons. Kuala Lumpur experienced the transitional period of the inter-monsoon season during the study period, March–April. For meteorological parameters, excluding WD and RH, the concentrations of all the variables were reduced during the first week of the MCO. The RH increase was expected to continue until May 2020 due to the monsoon season, which can cause frequent rain. Malaysia experienced an inter-monsoon season between March and April throughout the research period. In early May, we experienced the early stage of the Southwest monsoon; hence, more rainfall will happen as a result of increasing RH and decreasing SR and AT.
Nonetheless, on average, WS showed a slightly decreasing trend at the end of the MCO for Kuala Lumpur (2.65 to 2.17 m s−1) and Selangor (1.11 to 2.33 m s−1), where the WS might be attributed to seasonal change. The RH value was slightly higher during the MCO compared to the pre-MCO period, ranging from 88.40% to 97.47% and from 89.87% to 97.40% in Selangor and Kuala Lumpur, respectively. In comparison, the AT during MCO presented similar trends for both states, which were higher trends at the beginning of MCO but lower trends at the end of MCO.
In a broader context, these movement restrictions are not just to control the outbreak of COVID-19 but also to minimize the air pollution problem in Malaysia. The restrictions on pollution-generating activities and human mobility during the lockdown period resulted in an overall improvement in air quality throughout the world, including Malaysia. The present results are consistent with earlier reports [
51], in which low levels of contaminants (CO, PM
2.5, and PM
10) were documented in the Klang Valley during the MCO. In the same manner, studies from other countries such as India (Delhi) and Spain (Barcelona) also reported on the reduction of PM
2.5, PM
10, CO, and NO
2 but the increment of O
3 during the lockdown period in Delhi, India [
43] and Barcelona, Spain [
50]. In addition, studies from major cities in China and Morocco also showed a significant reduction in concentrations of PM
2.5, PM
10, NO
2, SO
2, and CO during the lockdown phase [
8,
52].
3.3. Relationship between Air Quality, Meteorological Factors, and COVID-19 Cases
COVID-19 has a 1–14-day incubation period [
53], and the impact of meteorological parameters could last for a few days [
4]. Another study evaluated the correlations between COVID-19 cases, related mortality, and the concentrations of air pollutants between the years in which COVID-19 cases occurred and the years before the pandemic [
54]. In line with their findings, applying the lag effect of various air quality and meteorological variables was reasonable in this study. Assuming that the usual duration from virus transmission to infection is 7 days, the average daily air quality and meteorological parameters of 7 days ago were compared with the total reported cases during MCO. For instance, COVID-19 cases on 18 March 2020, were analyzed against the average air pollution parameters on 11 March 2019, and meteorological factors on 11 March 2020, as applied previously in a local study by Suhaimi et al. [
55].
Table 4 depicts the correlations of meteorological parameters and air pollutant variables in the cumulative cases of COVID-19 in Selangor and Kuala Lumpur. Only NO
2, O
3, PM
10, and PM
2.5 were associated with the cumulative COVID-19 cases among air pollutant variables. Meanwhile, RH, WS, and SR were the only meteorological parameters that demonstrated significant correlations with the outcome variable. Conversely, WD, O
3, SO
2, and AT reflected no significant correlations with COVID-19 cases. Besides, weak positive correlations were observed for cumulative COVID-19 cases and NO
2, O
3, PM
2.5, and PM
10, while RH exhibited a strong positive correlation. However, WS and SR had negative correlations with COVID-19 cases. Up to this point, the impact of outdoor air pollution levels and meteorological conditions on COVID-19 infections was statistically significant.
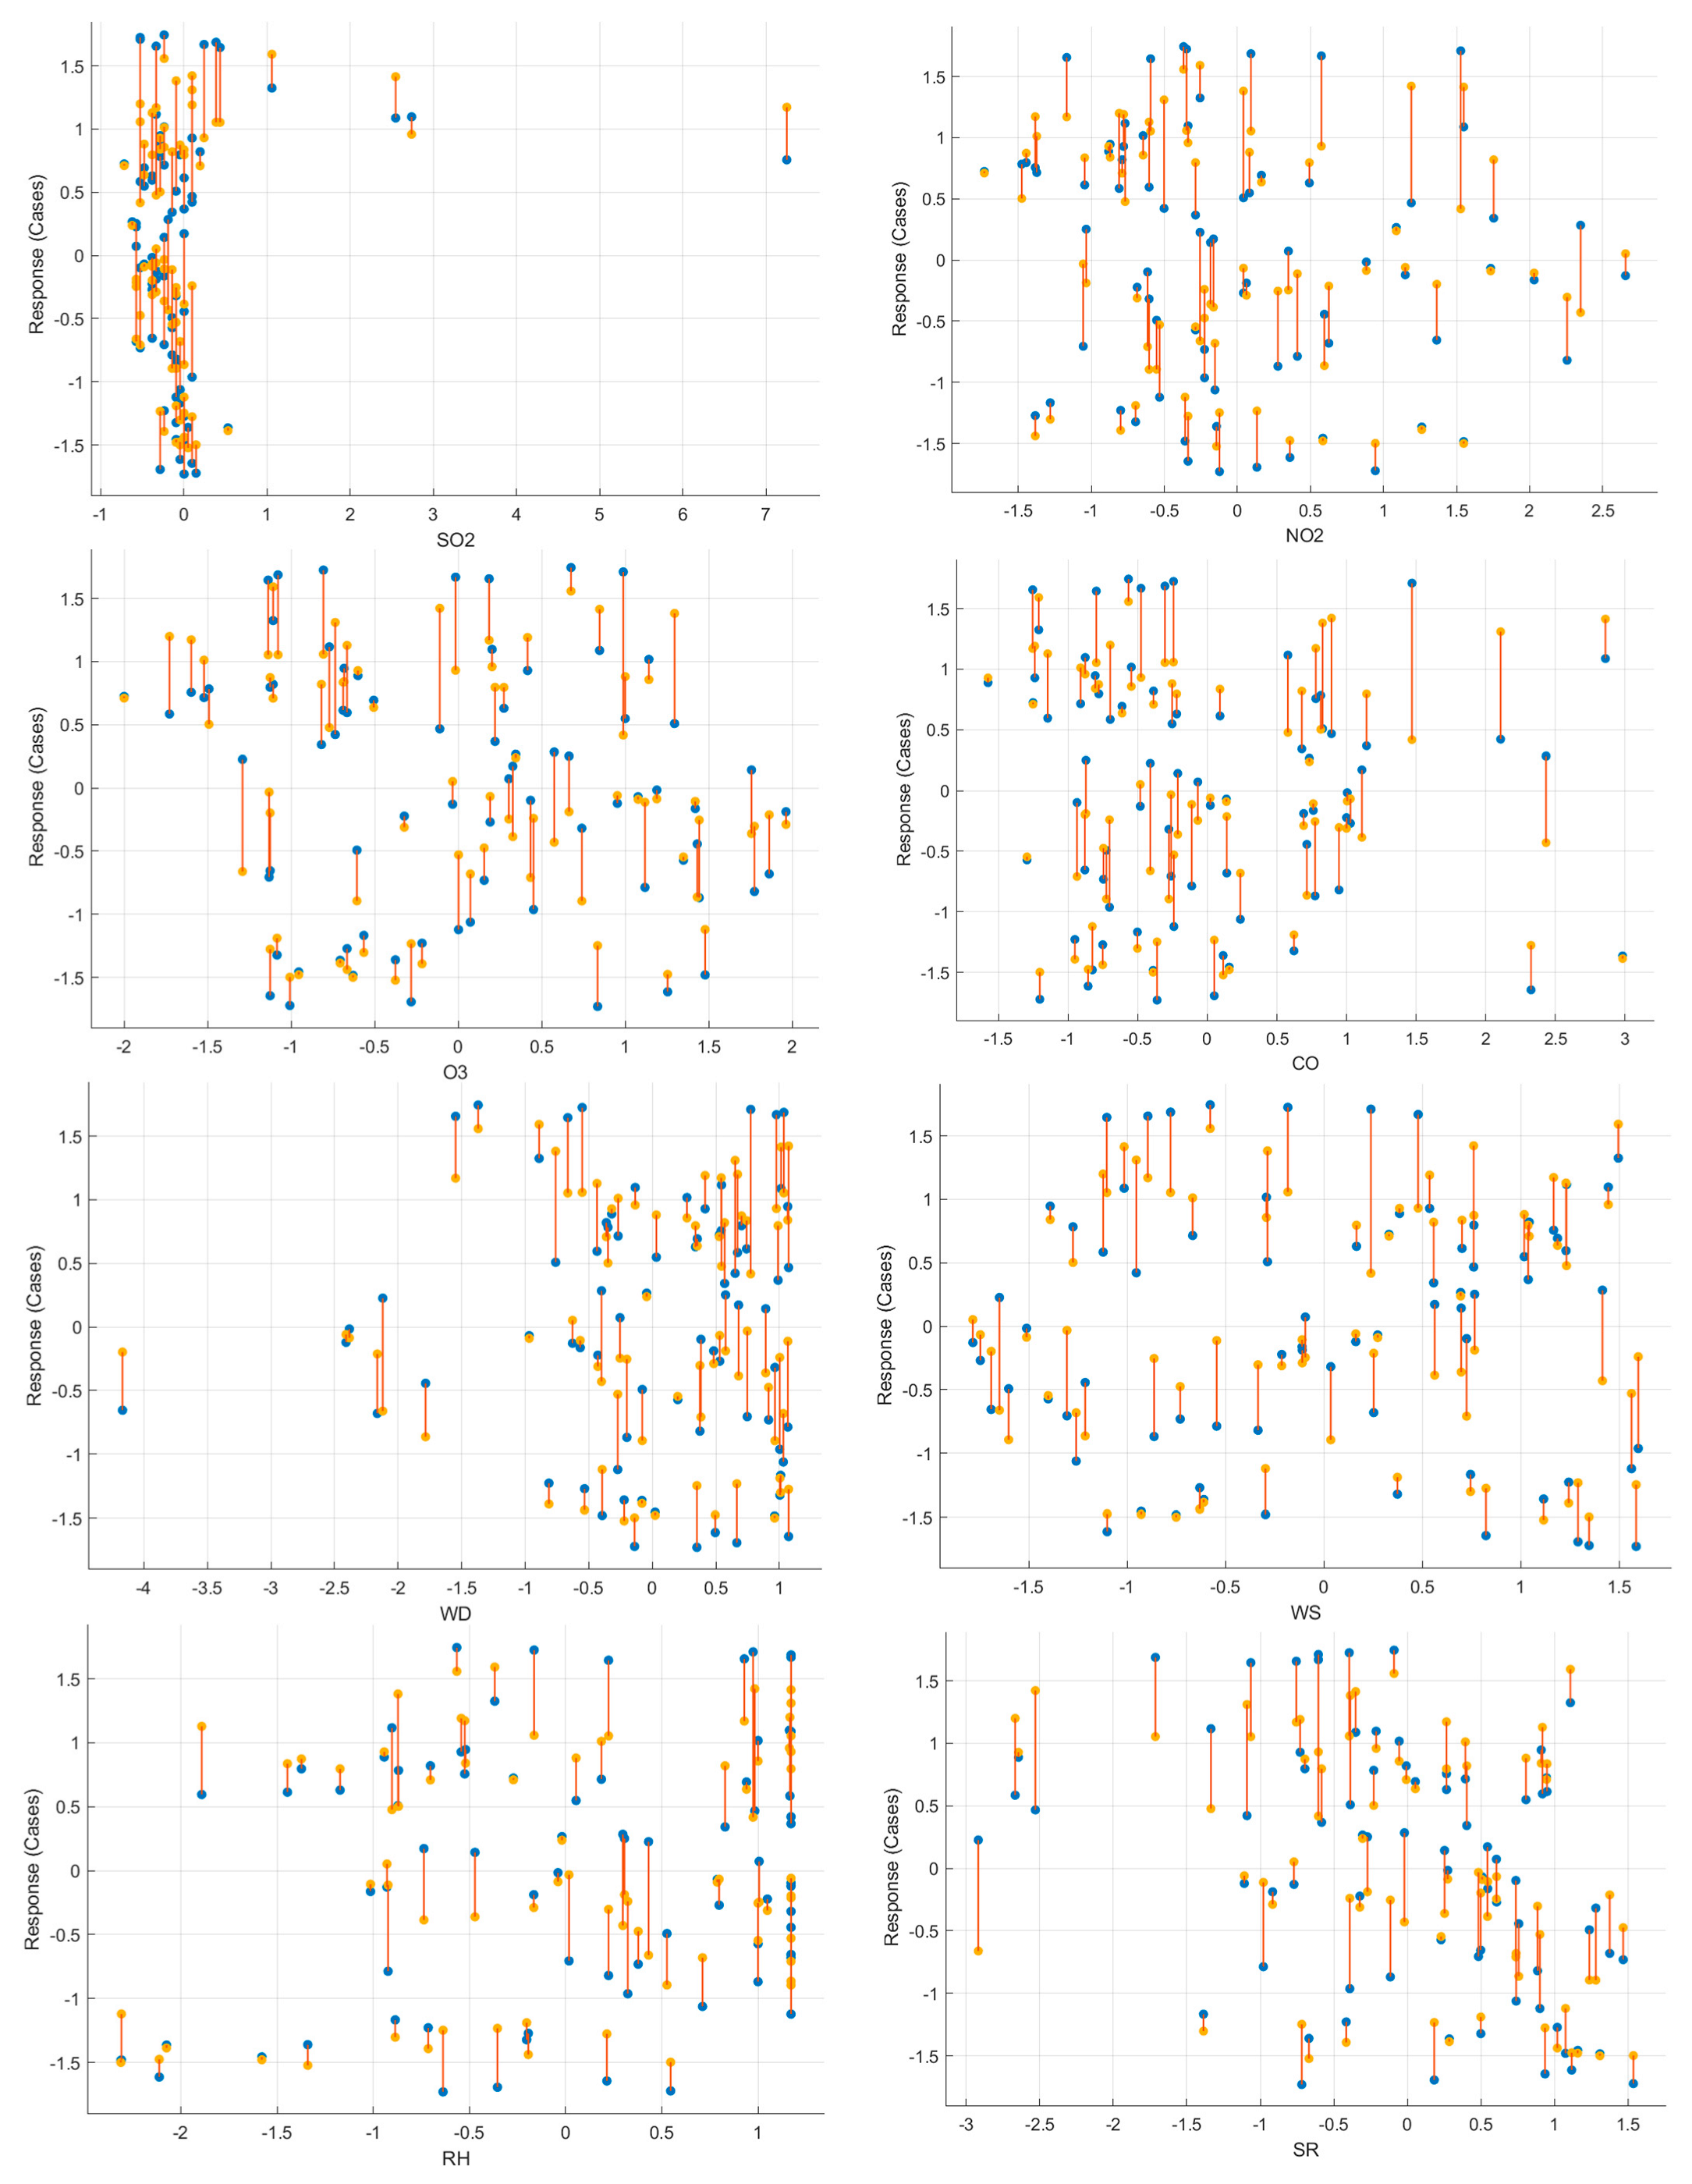
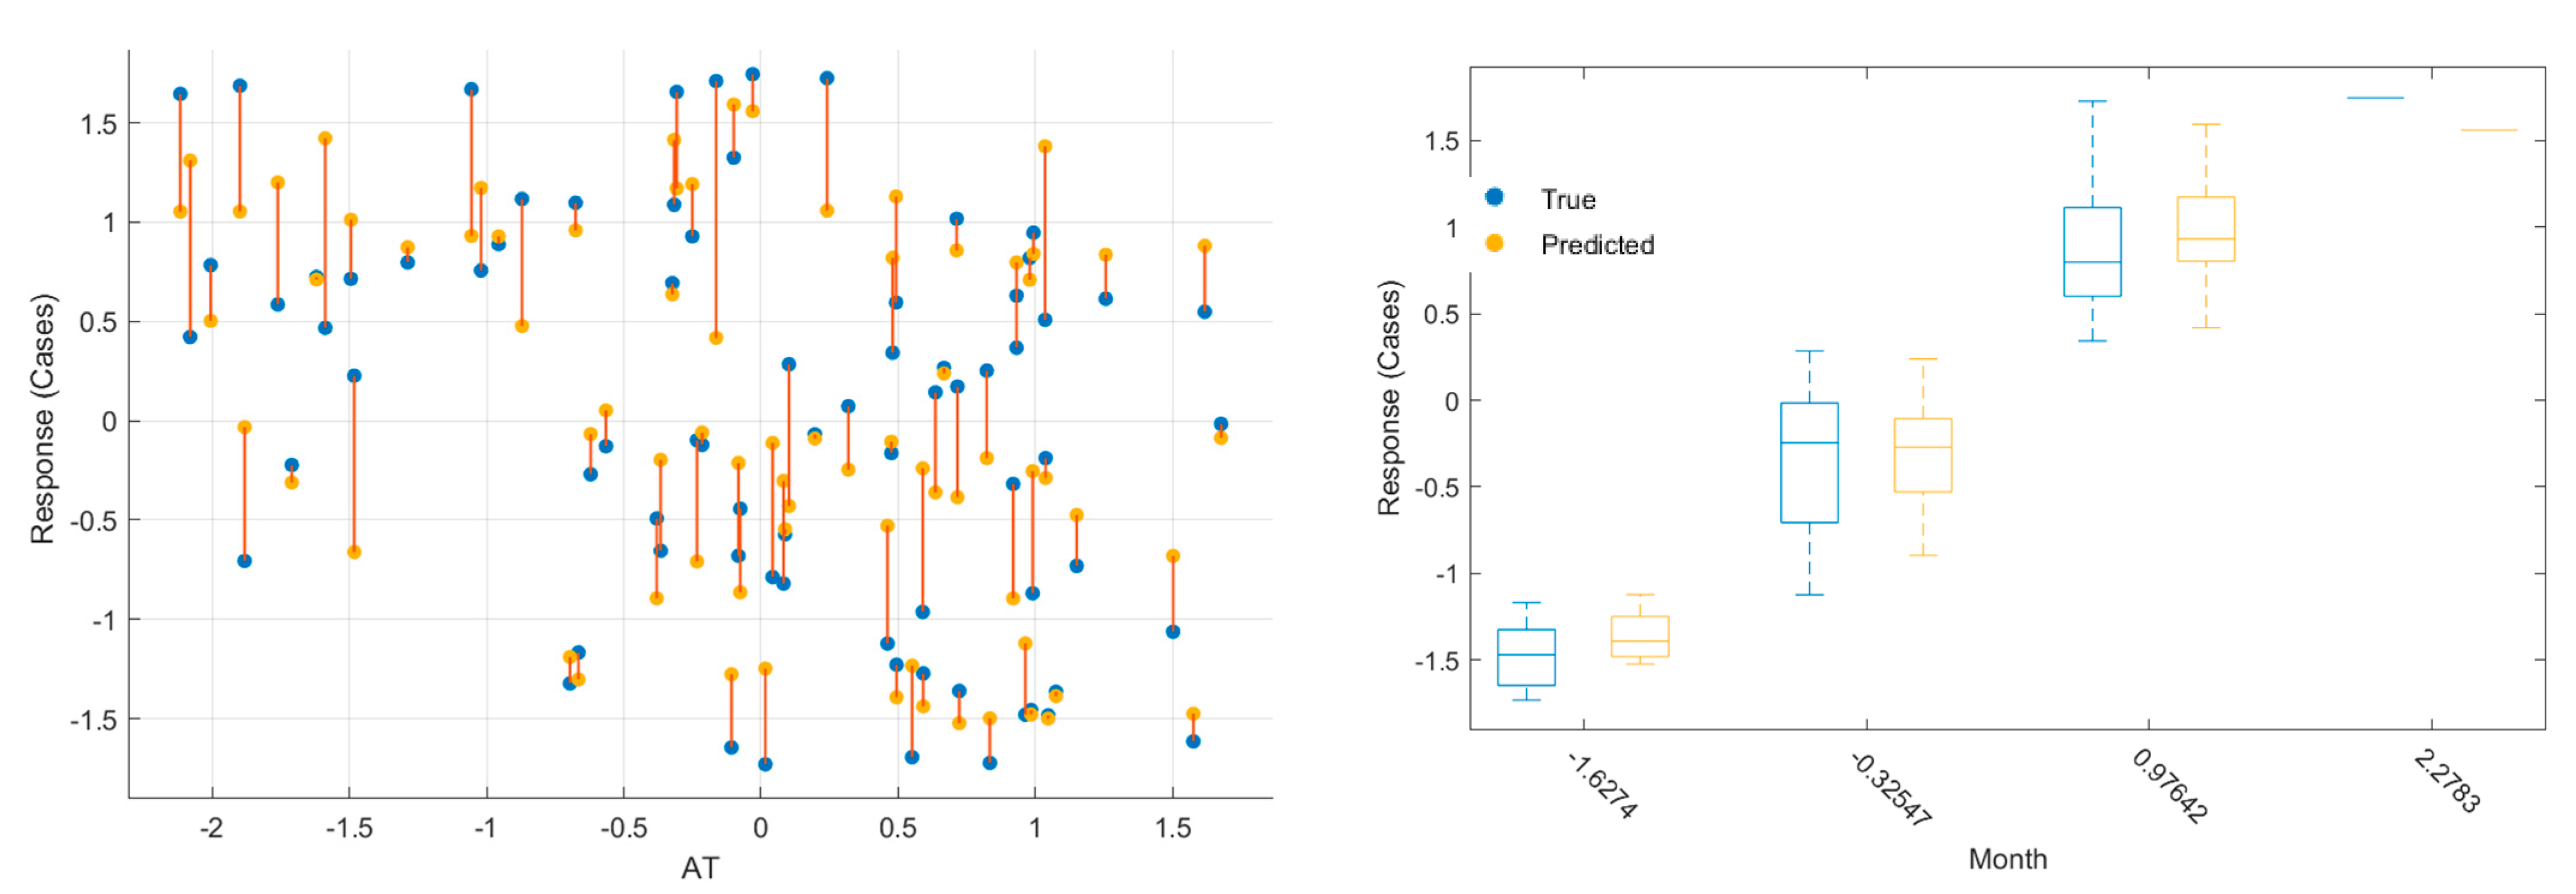
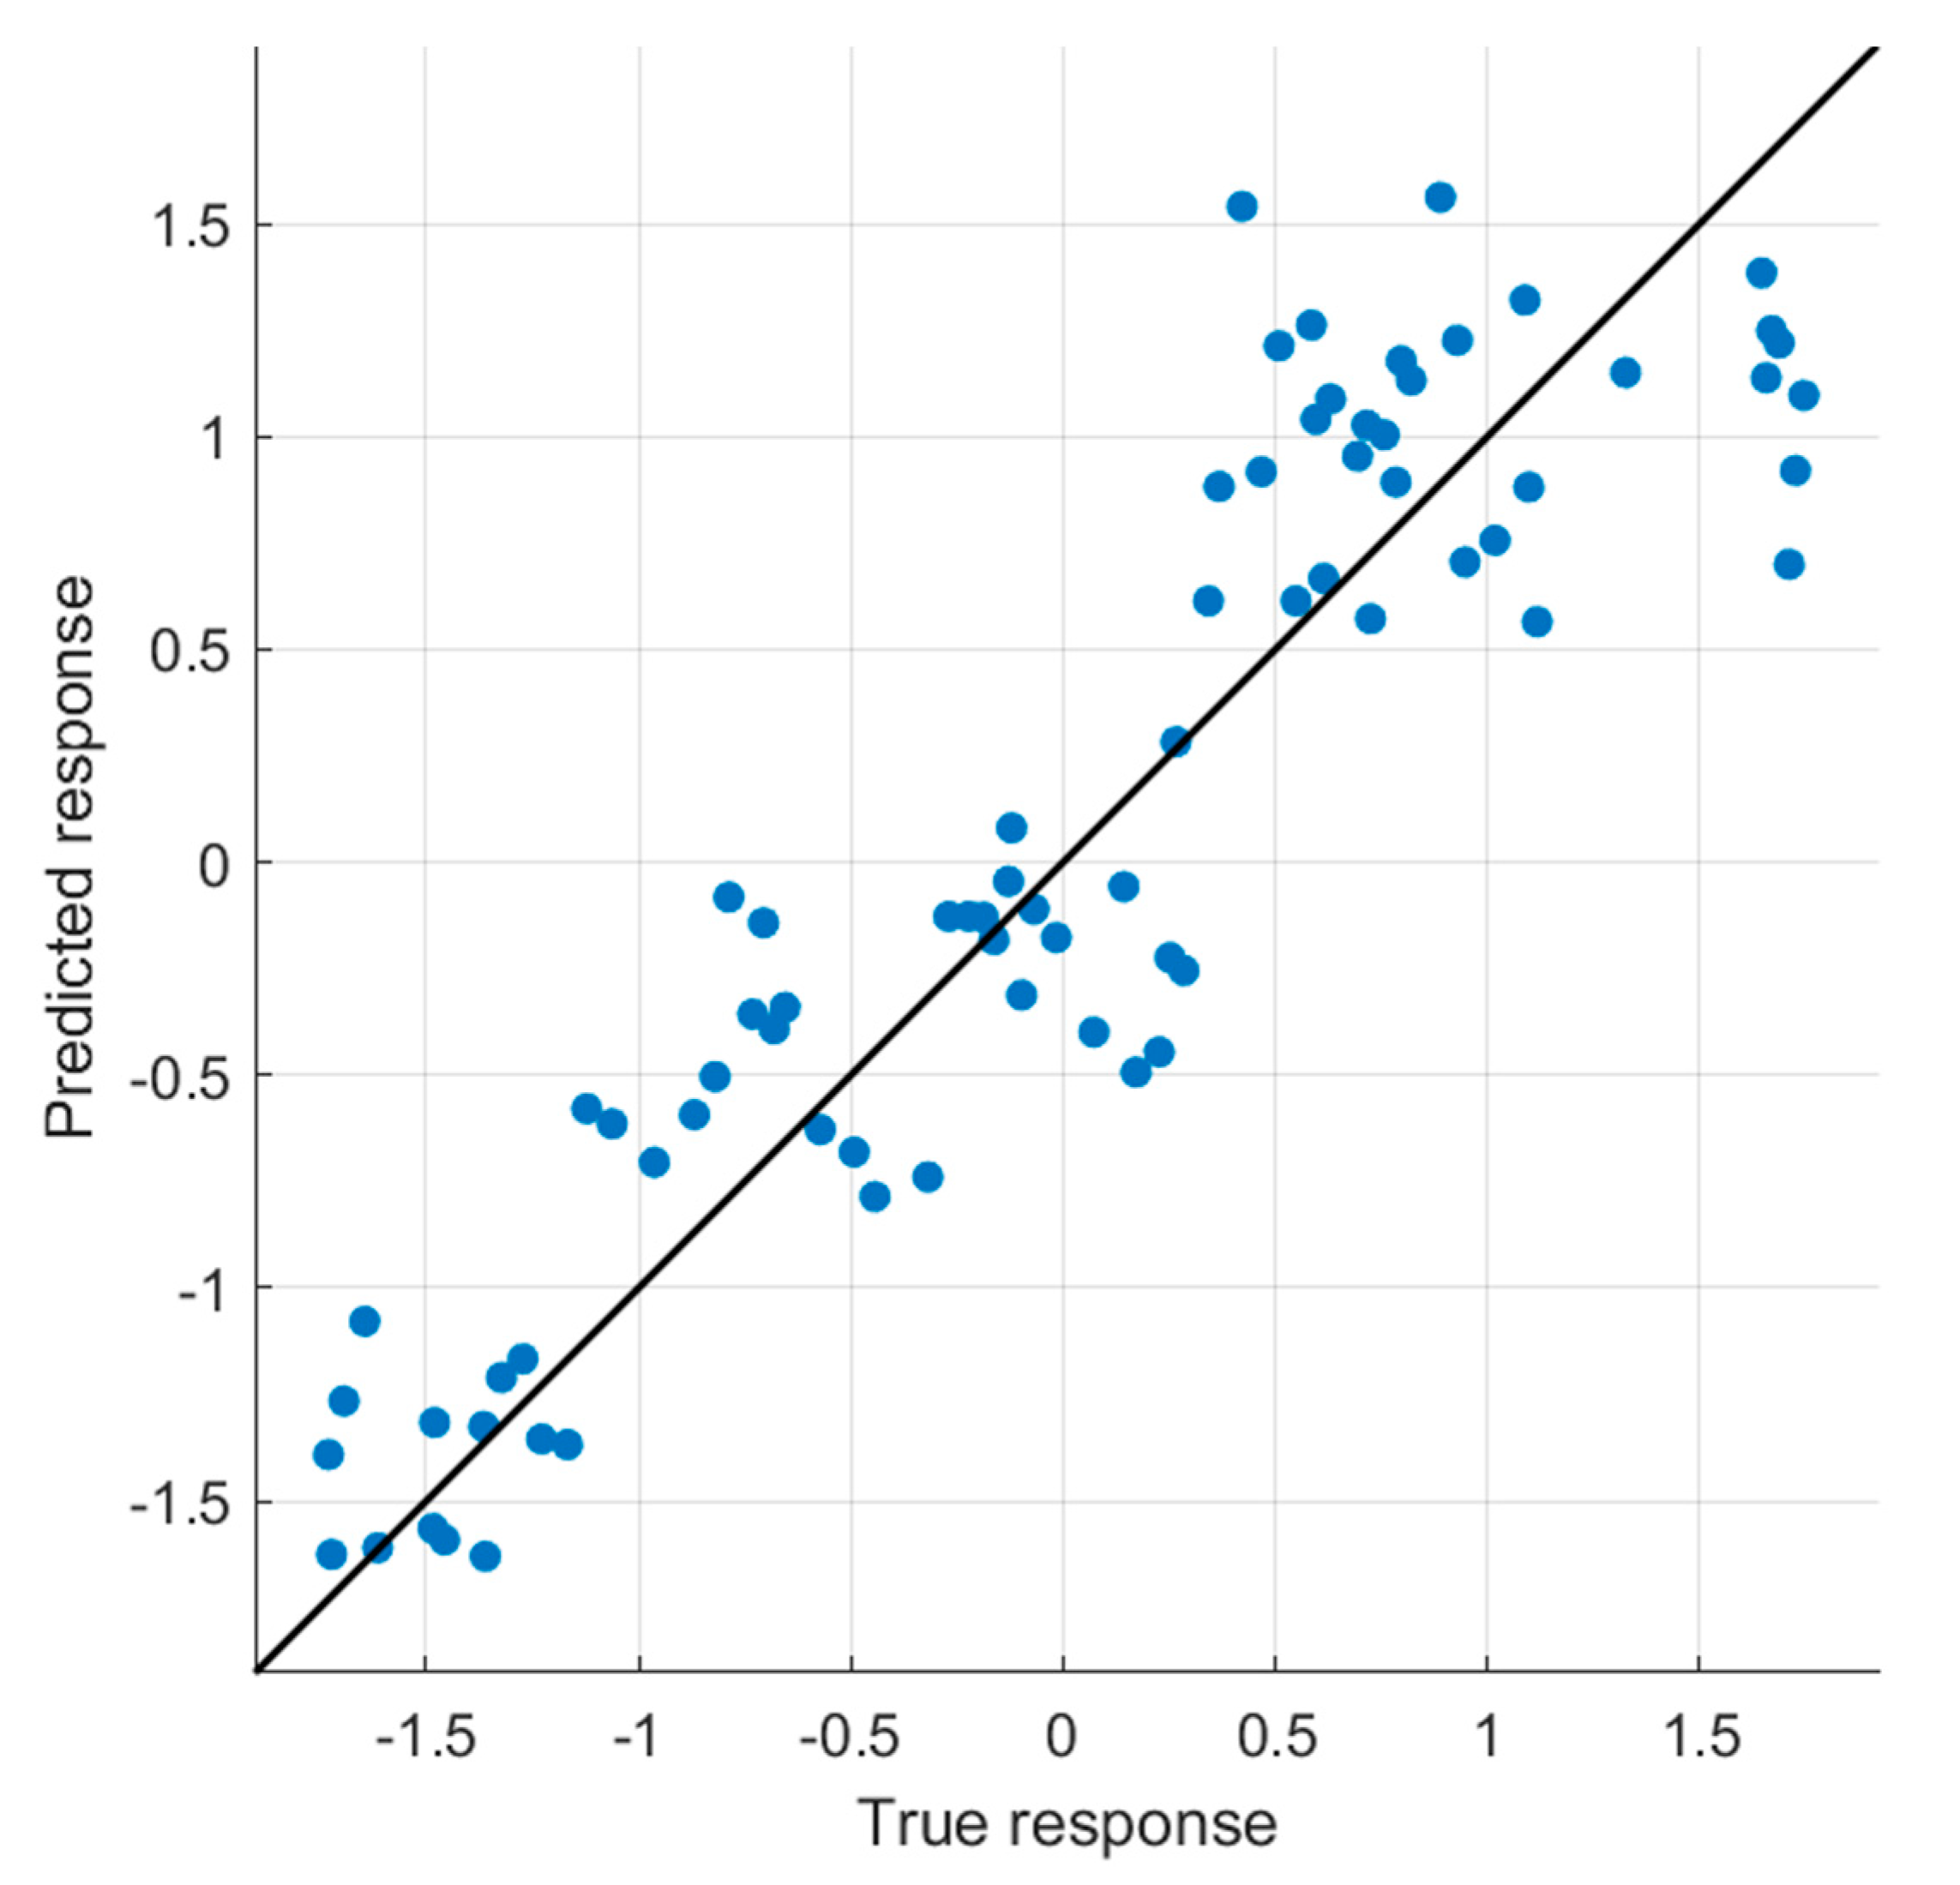
Moving on, the variables that were statistically significant at the bivariate level were analyzed at the multivariate level by applying multiple linear regression. Kuala Lumpur had six predictor variables (PM
10, PM
2.5, NO
2, WS, RH, and SR), whereas Selangor had five predictor variables (PM
10, PM
2.5, NO
2, O
3, and SR). Only variables with a significant
p < 0.05 were selected from this model when the model was fitted with the stepwise method.
Table 5 and
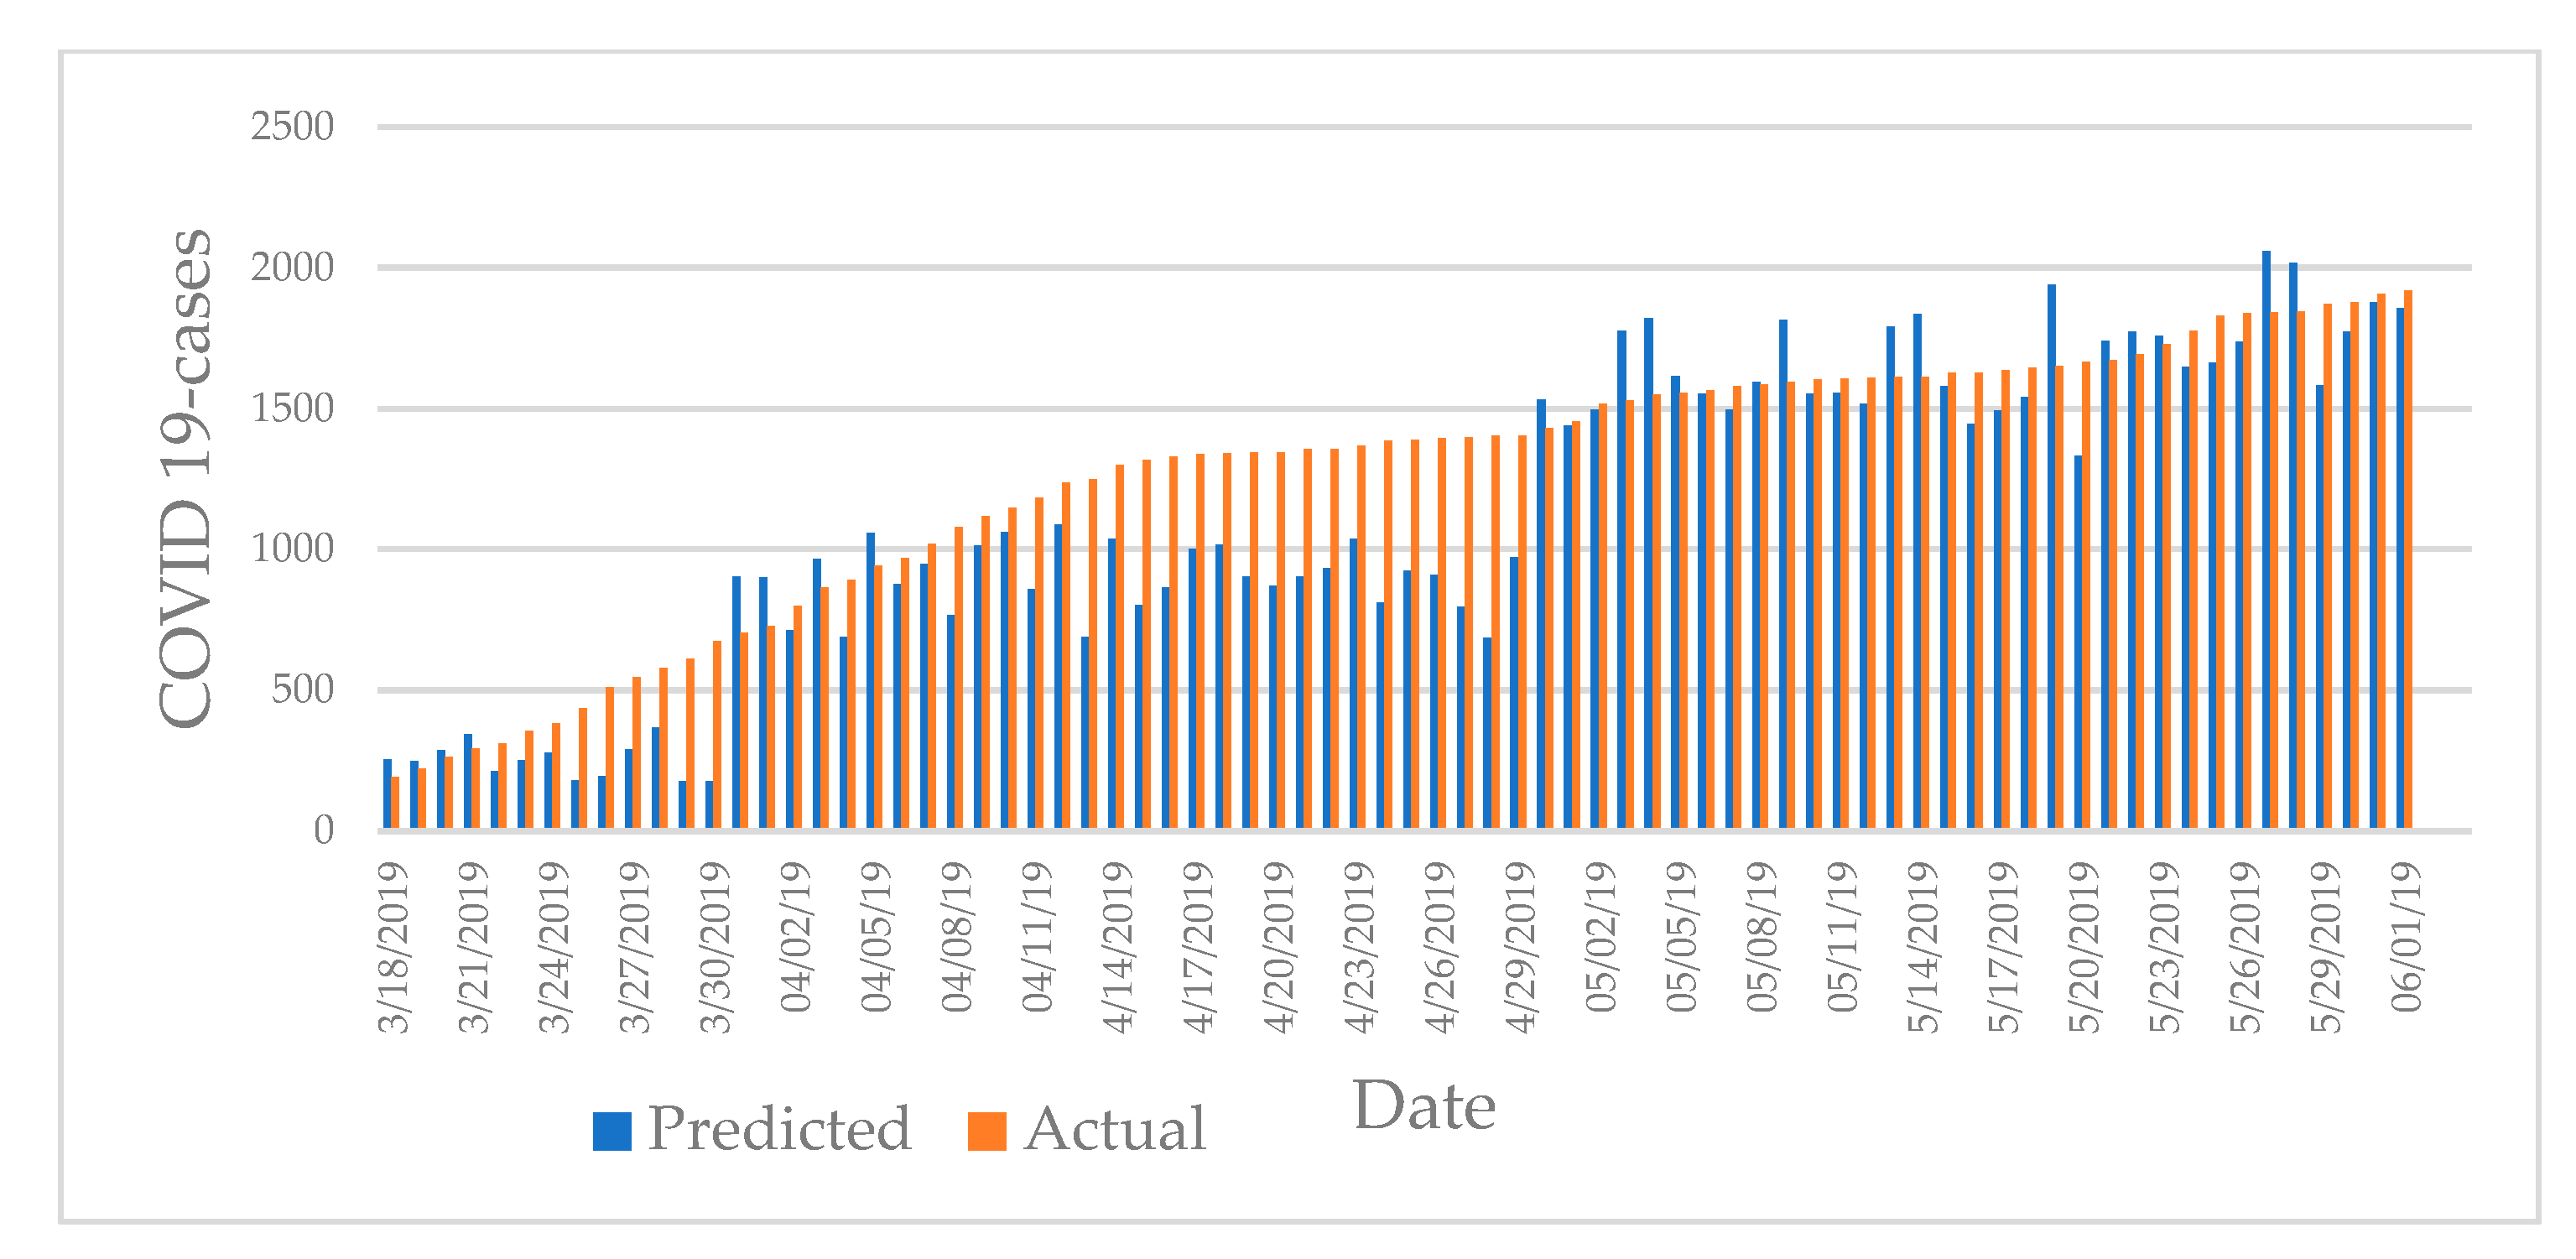
Table 6 show variables for each region representing air quality and meteorological factor variables that were strongly linked to cumulative COVID-19 cases in Kuala Lumpur and Selangor. From the analysis, results revealed that RH was the most contributing meteorological indicator that significantly influenced the incidence of COVID-19 in Kuala Lumpur, followed by Equation (4).
For every unit (1%) increase in RH, COVID-19 cases will increase by 47.84. Beta values were significant at 0.05. VIF readings were less than five, which showed no multicollinearity concern. Additionally, 33.4% of the variance in COVID-19 cases could be explained by RH, R2 = 0.379, F (5, 70) = 8.54, p < 0.001. These findings can be presumed to have a large combined effect (f2 = 0.61), thus showing RH has a large contribution to COVID-19 cases.
As for Selangor, PM
2.5 was strongly linked to cumulative COVID-19 cases. The equation is portrayed in Equation (5).
For every unit (1 μg m−3) increase in PM2.5, COVID-19 cases will increase by 13.25. Beta values were significant at 0.05. VIF readings were less than five, which showed no multicollinearity concern. Moreover, 20.1% of the variance in COVID-19 cases can be explained by PM2.5, R2 = 0.244, F (4, 71) = 5.72, p < 0.001. A combined effect of this magnitude can be considered large (f2 = 0.73); hence, PM2.5 has a huge influence on COVID-19 cases. However, several factors that were not considered in this study might influence the incidence of COVID-19.
Our findings demonstrated a link between COVID-19 cumulative cases, air contaminants, meteorological factors, and their relationships. This scientific study supports the evidence that chronic illnesses are linked to environmental pollution, particularly in urban areas. Air pollution is a well-known contributor to chronic inflammation, resulting in an overactive innate immune system [
7]. Long-term air pollution exposure can lead to persistent immune system disturbances [
56]. It may result in a weakened circulatory and respiratory viral invasion, thus increasing the risk of the severe outcome of COVID-19 [
7].
In our study, the correlation test showed that air pollutant parameters PM
10, PM
2.5, NO
2, and O
3 had positively significant correlations with COVID-19 cumulative cases. Results from our study are comparable with those from a prior investigation that revealed a positive relationship between cumulative COVID-19 cases and O
3 in China [
9]. Moreover, a study discovered that a rise in the long-term O
3 average is linked to COVID-19 mortality and morbidity [
54].
On the other hand, our findings were contrasted with findings from previous studies by Sahoo et al. [
57] in India, Zhu et al. [
8] in China, and Bashir et al. [
58] in California, who reported that the air pollutants (PM
10, PM
2.5, and NO
2) were negatively and significantly correlated with COVID-19 cases; another study reported that O
3 was negatively correlated with daily COVID-19 cases [
59].
PM
2.5 and PM
10 have been related to several health effects, including inflammatory responses, oxidative damage, DNA damage, and respiratory, cardiovascular, and nervous system problems [
60]. PM
2.5 impairs bronchial immunity and affects the integrity of the epithelial cells [
61], and these events reduce the capacity of the antibodies to combat viruses and increase susceptibility to respiratory diseases. Hence, the current findings regarding the positive correlation between cumulative COVID-19 cases and both particulate matter components (PM
2.5 and PM
10) are consistent with the report in Millan, Italy [
60]. The researchers also found a positive correlation between PM
2.5 and PM
10 and daily cases of COVID-19. The presence of atmospheric PM can serve as a means of transportation for viruses, facilitating their spread in aerosol form and creating an environment that is conducive to their survival. This is because PM
10 and PM
2.5 can be inhaled, along with any associated microorganisms. Studies have shown that particle concentration and dimension can have a significant impact on the composition and concentration of microbial communities. When particles are inhaled, particularly those smaller than 2.5 microns, such as PM
2.5 and UFPs, they can penetrate deep into the lungs, allowing viruses to develop within the respiratory tract and cause infections.
It has been proven that NO
2, SO
2, and CO emissions are connected to an increased prevalence of lung and cardiovascular disease infections [
62]. Nonetheless, the present findings reflect no significant correlation between CO and SO
2 and the cumulative cases of COVID-19. Meanwhile, positive correlations were found between cumulative COVID-19 cases and NO
2, aligning with research conducted in China and Italy [
8,
63]. Furthermore, a study in England shows that exposure to such pollutants could prevent pulmonary antimicrobial responses, limiting virus clearance from the lungs and increasing infectivity [
54]. They also stated that 3.3% of cases and 3.1% of deaths were linked to an increase of 1 mg m
−3 of NO
2 concentration in 2018.
Moving on to susceptibility to diseases from air pollution exposure, demonstrated how chronic exposure to air pollutants can cause respiratory symptoms and lead to COVID-19 infection [
64]. This study revealed that the expression level of Angiotensin-Converting Enzyme 2 (ACE-2) in the alveolar cells of the lungs is a strong determinant of the different categories of severity exhibited by COVID-19 patients. These could range from being asymptomatic to mildly symptomatic to severely symptomatic if the ACE-2 in the aforementioned location is low (↑), moderate (↑↑), or high (↑↑↑) for NO
2, PM
2.5, and NO
X, respectively. Exposure to these air pollutants may contribute to low host defenses and immunity, increase susceptibility to diseases, and cause a high viral load of the SARS-CoV-2 virus.
In addition, meteorological factors are considered influential determinants for viability, transmission, and range of virus transmission [
65,
66]. These meteorological indicators can also impact droplet stability in the environment or virus survival; hence, they influence coronavirus transmission [
10]. From our findings, the meteorological factors of WS, RH, and RH were correlated with cumulative COVID-19 cases in Kuala Lumpur and Selangor. A study from Jordan discovered a higher infection rate with low levels of WS, RH, and SR, thus promoting the coronavirus’s survival [
67].
In this study, a moderately positive correlation was detected between the cumulative COVID-19 cases and RH (r = 0.494,
p < 0.001), indicating that the cases increased positively with an increment in RH. Our findings are consistent with those of researchers in India [
68], who demonstrated that cumulative cases increased rapidly with RH. Similarly, previous studies in Singapore and Thailand, which are neighboring countries of Malaysia, had shown significant positive correlations between RH and daily COVID-19 cases [
9,
69]. However, a group of researchers found a negative association between RH and daily new COVID-19 cases [
70]. Based on the findings from these tropical nations, it can be concluded that high RH supported COVID-19 spread in tropical nations, such as Malaysia, Singapore, and Thailand, but not in colder regions, such as Europe and the United States of America, as previously stated by Suhaimi et al. [
55].
Moving on with our findings on another meteorological indicator. SR had a weak negative correlation with COVID-19 cases in Kuala Lumpur (r = −0.368,
p = 0.001) and Selangor (r = −0.249,
p = 0.030). These findings implied that the number of confirmed cases was reduced with SR. Moreover, these outcomes may be due to our study period because there was a monsoon season that caused the cloud to cover the sun and led to decreasing SR concentration (
Figure 4j and 5j). UV rays, especially in the summer period, might be vital for the prevention of COVID-19 transmission given their deleterious effects on a variety of viruses such as SARS and MERS [
71].
Furthermore, a study identified that the growth of SARS-CoV-2 can be promoted by lower UV rays [
72]. In another study in Jordan, the researchers established an adverse correlation between SR and COVID-19 cases and discovered that SR plays a crucial role in COVID-19 outbreaks, which matched our findings [
67]. Overall, meteorological factors contributed more to SARS-CoV-2 transmission in regions and months with colder and drier conditions and lower UV radiation than in regions and months with warmer, wetter seasons and higher UV radiation levels, as previously claimed by [
73].
Negative correlations were detected between the cumulative COVID-19 cases and WS in Kuala Lumpur (r = −0.311,
p = 0.006), but such an association was lacking in Selangor. Our findings in Kuala Lumpur were in agreement with the outcomes reported by Alkhowailed et al. [
74], who reported a negative relationship between WS and the incidence of COVID-19. They also claimed that WS influenced COVID-19 transmission in cities with a high population, which could be due to a low WS in these areas, favoring the spread of the SARS-COV-2 virus among persons living near congested areas as compared to areas with a higher WS. Our findings on WS in Selangor found no significant correlation with COVID-19 cases, although the relationship was positive, which was in line with a previous study in Africa [
75]. On days when AT was cooler, increased WS might cause people to remain indoors, reducing the spread of COVID-19 [
76].
3.5. Limitations
Despite the findings highlighted in this study, it has limitations. First, the study only considered two major locations (Kuala Lumpur and Selangor), thereby leading to some outcomes that were different from the real influence of meteorological factors and ambient pollution on the transmission of the novel SARS-CoV-2 in Malaysia. Second, there was only one station studied for the whole state. More data and relationships could be explored if more stations were included in this study. Third, the data on air quality parameters and meteorological factors were only studied for 11 weeks to compare when COVID-19 was absent and when COVID-19 was present. By lengthening the study period, better results could represent the year without COVID-19 and with COVID-19. Fourth, the ecological study design used in this research may contain an ecological fallacy. Individual-level data on air pollutant exposure and coexisting health conditions were not collected, resulting in limited assumptions for group-level analysis of the available data.
These limitations need to be addressed in future studies involving cohort groups in which factors such as gender, age, occupation, underlying conditions, and high-risk or vulnerable groups are considered in the Malaysian context. Examples of high-risk individuals include those with tuberculosis, cardiovascular diseases, diabetes, asthma, and chronic obstructive pulmonary disease. Chronic exposure to polluted air can lead to a compromised immune system; hence, the affected individuals will be more susceptible to any kind of respiratory disease, including COVID-19. Moreover, changes in the SARS-CoV-2 virus have been detected over time and need more study, particularly on its transmission as it is related to the environment, such as meteorological factors.
Considering the potential effects of air pollution, it could be considered a confounding factor in the association between close interaction among people, population density, and eating and drinking behaviors. Air pollution can weaken the respiratory and immune systems, which may heighten the vulnerability of individuals to infectious diseases such as COVID-19. Additionally, people living in areas with high levels of air pollution might be more likely to spend time indoors or in overcrowded spaces, amplifying the risk of transmission. Therefore, when studying the relationship between close interactions between people, it is important to consider the potential confounding effects of air pollution. This may involve controlling for air pollution levels in the analysis or conducting stratified analyses based on air pollution levels. By taking into account the potential effects of air pollution, researchers can better understand the true relationship between these factors and develop appropriate interventions to prevent the spread of infectious diseases.
