Article

Air Temperature Variations Due to Different Roofs and Their Impact on Energy Consumption and Emissions: Mexicali University Campus Case Study

by
Néstor Santillán-Soto
1,*,
Alejandro A. Lambert-Arista
2,*,
David E. Flores-Jiménez
1,
Sara Ojeda-Benítez
1,
Samantha E. Cruz-Sotelo
2,
Nicolás Velázquez-Limón
1 and
Ricardo López-Zavala
1
1
Instituto de Ingeniería, Universidad Autónoma de Baja California, Blvd. Benito Juárez y Calle de la Normal s/n, Col. Insurgentes Este, Mexicali 21280, Mexico
2
Facultad de Ingeniería, Universidad Autónoma de Baja California, Blvd. Benito Juárez s/n, Parcela 44, Mexicali 21280, Mexico
*
Authors to whom correspondence should be addressed.
Atmosphere 2023, 14(6), 945; https://doi.org/10.3390/atmos14060945
Submission received: 30 March 2023 / Revised: 17 May 2023 / Accepted: 23 May 2023 / Published: 28 May 2023

Abstract

:
Roof surfaces on which air conditioning equipment is installed cause significant air temperature increases around the condensers due to roof thermal properties, resulting in excess electrical energy consumption and greenhouse gas (GHG) emissions. An experiment to quantify such excesses during the summer was conducted at a university campus in Mexicali, Mexico. The air temperatures and surface temperatures for three types of roofs were recorded. Temperatures (condenser inlet air temperatures) were used as the input data to a priori estimate the electrical consumption of a 5-ton A/C equipment working over these different roofs. Temperatures recorded by a nearby meteorological station were used as a reference. The results indicate a differential of up to 4.81 °C, resulting in an excess of electricity consumption of 5.55 kWh and an additional 3.9 kg of CO2 emissions, representing an 8.2% energy surplus and differences of up to 2.1% in electricity consumption provoked by microclimate.

1. Introduction

A considerable portion of the energy consumed worldwide is used in buildings. For this reason, several studies on energy consumption and efficiency improvement have been performed. Some of these studies review energy consumption, CO2 emissions, and energy policies in the residential sector. Nejar et al. [1], for example, found that global residential energy consumption increased by 14% from 2000 to 2011, mainly in developing countries. Other studies have focused on improving the efficiency of end-use energy in buildings. This aspect has become a main task of the European Commission [2,3,4]. According to the US Energy Information Administration, commercial and residential buildings consumed 40% of the nation’s total end-use energy in 2015 [5]. In 2010, the residential building sector used most of its allocated energy to heat spaces (28%), cool spaces (15%), and heat water (13%), whereas the commercial sector used 20% to light spaces, 16% to heat spaces, and 15% to cool spaces [6]. These figures show that a large proportion of the heating and cooling energy use is associated with building envelope systems such as windows, walls, and roofs. Konopacki et al. [7] concluded that heat gain through the roof may be a dominant component of the total cooling load of a building since it is highly susceptible to solar radiation.
Therefore, to improve the indoor conditioning of buildings and increase urban albedo, different studies have been carried out to analyze the conversion of hot roofs to cold roofs using membranes to increase their reflectance and reduce the indoor thermal load [8,9,10,11,12,13,14,15,16]. Due to their low solar absorptivity and high thermal emissivity, cool roofs maintain lower surface temperatures and reduce heat flow into buildings [13]. Indeed, low solar absorption increases solar reflectance, and high thermal emittance enhances the roof surface’s ability to radiate any absorbed solar energy [17,18]. Beyond the evaluation of energy performance, there are incentives for complying with energy-saving criteria [19,20], where opportunities are identified to save energy, reduce costs, and mitigate greenhouse gas emissions [21,22,23]. In addition to albedo or surface reflectance, there are thermal characteristics that are inherent to the materials that make up the roofs of buildings, and even modifying the albedo, their thermal properties are dominant within their surrounding environment [24,25] generating a microclimate, i.e., an area where the climate differs from its surroundings [26]. Features of an urban microclimate include variations in the outdoor air temperature, surface temperature, humidity, wind speed, and wind direction [27]. Several human-induced factors can cause urban microclimates. Building and construction materials can affect albedo, thermal conductivity, and urban surface heat capacities, consequently impacting the amount of reflected energy [28]. Yang et al. [29] pointed out the interest in studying urban microclimates and their impact on the built environment; they also stressed that urban heat islands (UHI) are among the most widely discussed topics in urban microclimates. In some cities, it has been estimated that between 5 and 10% of the electrical energy is used to mitigate the temperature increases caused by UHIs [30,31] since air conditioning equipment increases its workload during the summer, which leads to excessive electrical consumption [32,33].
When analyzing the effect of urban characteristics on the consumption of electrical energy for space cooling in the city of Mexicali, Santillán-Soto et al. [34] found a difference of around 2% in electricity consumption when comparing a well-planned residential area with an unplanned one in which different construction materials, for example, different types of roof materials with few green areas, among others, were used. Given this situation, the present study focused on three roofs built with different types of materials, all of which have A/C equipment installed. Their surface temperatures and the temperatures of the air entering the condensers were measured, and the excess energy induced by the temperatures reached on each roof was estimated. Finally, the EPA (Environmental Protection Agency, USA) calculator was used to determine the corresponding GHG emissions. The results of this document can help urban planners and designers develop guidelines banning urban roofing materials that create adverse microclimates for A/C equipment to reduce the energy needs of a building, mainly in cities with extremely hot weather.

2. Materials and Methods

The experiment was carried out in Mexicali, Baja California, Mexico (32.55° N, 115.47° W), on the roofs of three Universidad Autónoma de Baja California buildings. This city, located in the northwest of the country and adjacent to the southwestern border of the United States, is characterized by an arid climate, where maximum temperatures are up to 52 °C and maximum averages of 42.2 °C in summer have been reached. The coldest month is January, with a monthly average temperature of 12.4 °C [35]. This study focuses on the summer, when the need to condition indoor spaces is essential. The university campus does not have heating equipment for the winter season.
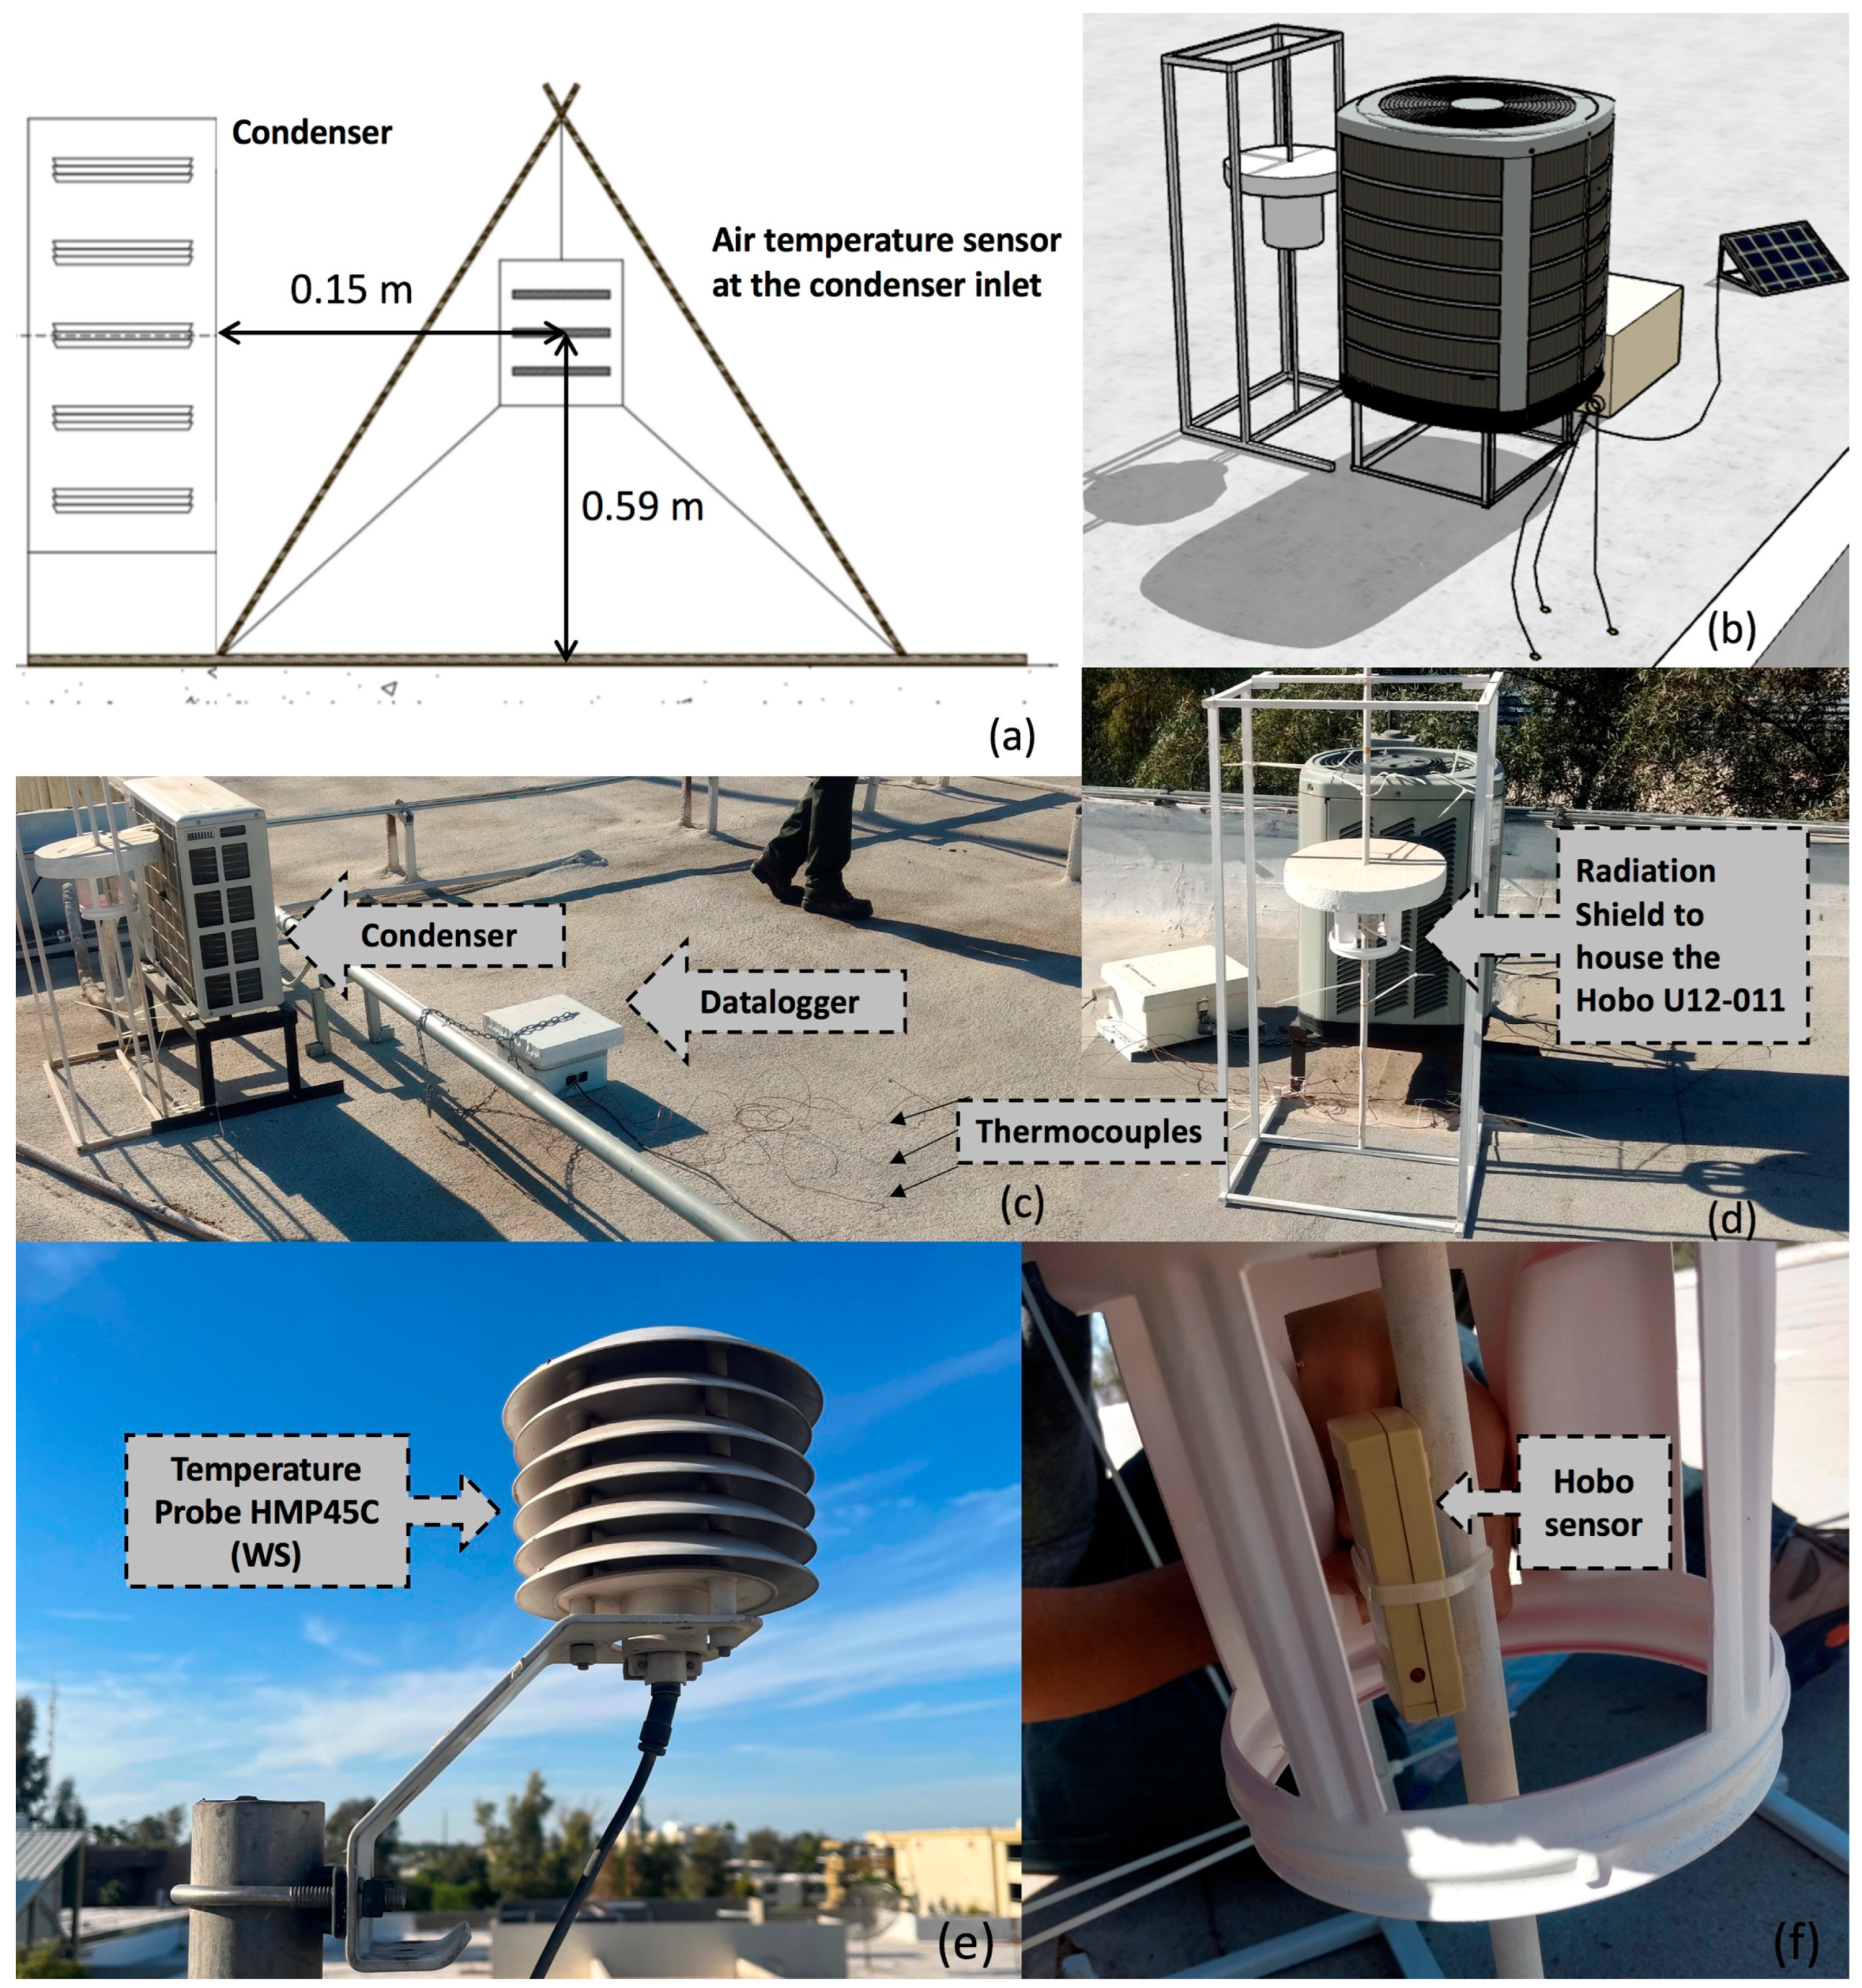
During the 2018 summer, temperature measurements were made on three buildings at the university campus with air conditioning equipment installed on their roofs. These were the Electrical Engineering Laboratory (EEL), the Basic Sciences Laboratory (BSL), and the Faculty of Engineering (FE). A weather station (WS) installed on the roof of the Engineering Institute, 15 m above ground level, was used to record the reference air temperature. The characteristics of these roofs are shown in Table 1, while the experimental locations are in Figure 1. A description of the instrumentation used in the experimentation is shown in Table 2, as well as the range and possible error associated with the values. For each surface, three T-type thermocouples were used, and the records of each one were averaged to obtain a representative hourly value of the surface temperature. To measure the air temperature at the condenser inlet, Hobo sensors were used with a protective shield from solar radiation, which was specially made to protect the sensor and correctly ensure the hourly average values at each site. The WS reference station has constant ambient air temperature measurements, which were measured with a temperature probe. A CR23X data acquisition unit was used to record and store the data of the latter and for the thermocouples. The experimental setup is presented in Figure 2.
The experiment was based on findings and considerations documented in a study by Wray and Akbari [19]. These authors developed a meticulous and detailed methodology that established experimental design criteria. They established that 0.59 m is the most representative height at which the condenser absorbs air and that the placement of the air temperature sensors must be close to the condenser; in the present study, they were installed 0.15 m away from the condenser (Figure 2). Thus, the data obtained represent the condenser inlet air temperature (Ta).
The measurement campaign lasted 20 days in July 2018. Once the data were obtained, the behavior and magnitudes of each day were analyzed. Hourly data were averaged, and the temperature differences between each roof were obtained. These air temperature data at a height of 0.59 m for each cover were used to estimate the electrical consumption of a hypothetical condensing unit with a capacity of 5 tons as a reference. Electrical consumption and outdoor temperature specifications were obtained from the Woodman manufacturer’s manual [36] to propose a mathematical model between these variables considering an indoor temperature of 23.8 °C (75 °F). Subsequently, once the model was obtained, the air temperature average hourly values were substituted to obtain the electricity consumption per hour, as was performed in a previous study in which it was shown that temperature is the most important climatic variable to estimate said parameter considering different urban surfaces [34]. The sum of electricity consumption for 12 h per day, from 7:00 a.m. to 7:00 p.m., was obtained. This period was considered due to the significant temperature differences between each surface and the reference temperature registered at the weather station (WS). The Energy Efficiency Ratio (EER) behavior with respect to outdoor temperature was analyzed. Finally, with the accumulated electricity consumption (kWh), the mass of greenhouse gases and their energy equivalents were obtained using the Environmental Protection Agency calculator [37]. This tool is based on Avoided Emissions and the geneRation Tool (AVERT), which uses the US National Weighted Average Marginal CO2 Emission Rate to convert electricity consumption into carbon dioxide emissions [38].

3. Results

3.1. Temperature and Model

Figure 3 shows the temperatures recorded in each site (FE, EEL, and BSL), both at the roof surface (Ts) and the condenser inlet (Ta), on 11 July 2018. In addition, the air temperature recorded at the weather station (WS) is displayed. As expected, the maximum and minimum values are consistent with the diurnal cycle of the solar energy transfer. As can be seen, the surface temperature (Ts EEL) of the Electrical Engineering Laboratory (EEL) roof and its corresponding condenser inlet air temperature (Ta EEL) were the highest. This behavior was expected for this metal roof. It was the same during the 20 days of the experiment since the facades and roofs that are partially covered with metal or dark colors raise surface temperatures [39,40]. The ambient temperature recorded by the WS weather station presents the lowest values because the heating of the roof surface has no effect on the station temperature sensor, as pointed out by the World Meteorological Organization concerning the installation of weather stations; it records the natural variation of ambient temperature during the day only [41].
We used an analysis of variance (ANOVA) to compare the means of the measured data of the air temperature Ta between EEL and BSL, BSL and FE, and EEL and FE, as well as Ta and WS between EEL and WS, BSL and WS, and FE and WS, considering a level of significance of α = 0.05. In all cases, the p-value obtained was <0.05; the differences between the means of Ta for each pair of sites considered are statistically significant, and the alternative hypothesis is fulfilled (Ha); therefore, it is convenient to use them for the analysis of energy (Table 3).
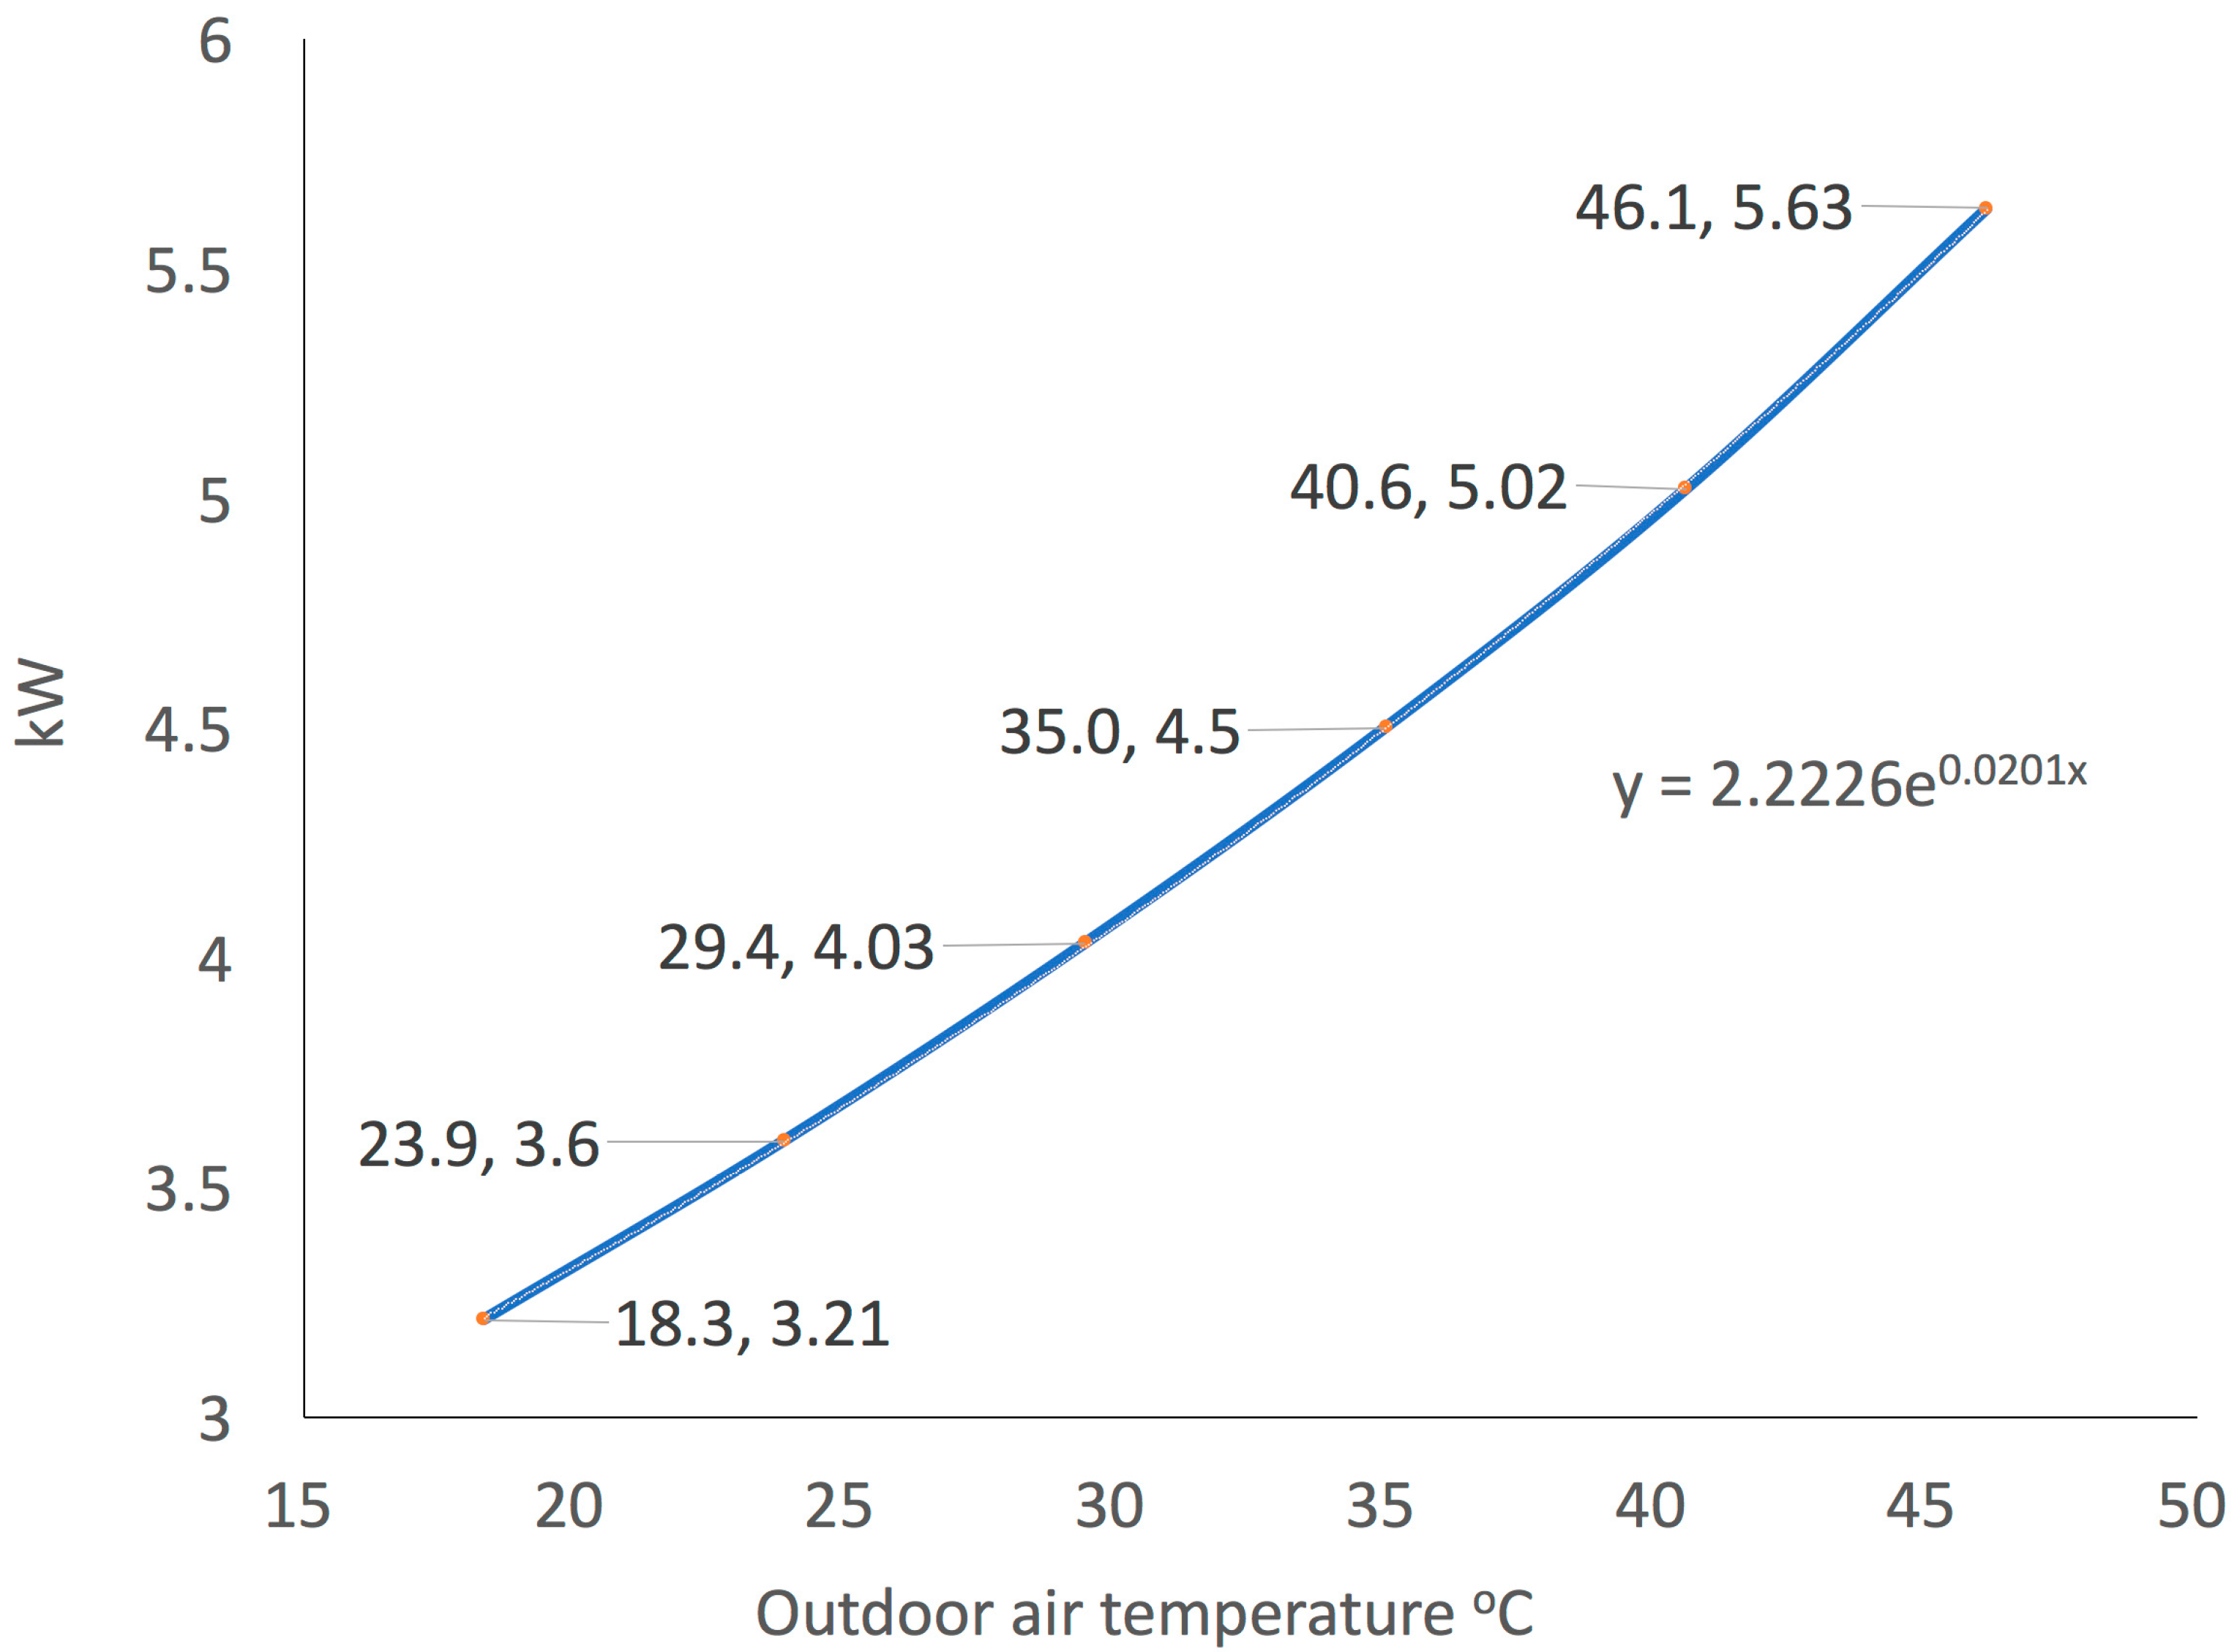
After validating the data measured at the sites, an electrical model was obtained with the data provided by the manufacturer for 5-ton refrigeration equipment. Thus, the electrical consumption for this type of equipment at the study sites could be estimated. Figure 4 shows the mathematical model for the proposed hypothetical equipment. This type of exponential model has been used in other studies to estimate electricity consumption for different periods considering different variables, such as temperature [42,43]. On the other hand, Table 4 shows the hourly average temperature for each experimental site and for the WS, which will be the input data to obtain the electrical consumption in each site. The standard deviation (Std. Dev.) was lower at the condenser inlet air temperature than at the surface temperature due to heat transfer at the air–surface boundary.
The previous table shows the differences between the average temperatures Ta and WS to highlight each roof’s influence on the microclimate around the condenser. Thus, TaΔEEL-WS is 4.81 °C, TaΔBSL-WS is 3.82 °C, and TaΔFE–WS is 3.8 °C. An important aspect to observe in Figure 3 and Table 4 is that at the beginning (7:00 a.m.) and at the end (7:00 p.m.) of the day, the difference between the surface temperature of the roof (Ts) and the condenser inlet air temperature (Ta) is in a range of 1 to 5 °C (depending on the roofing material), while between 1:00 p.m. and 2:00 p.m., this difference increases to approximately 22 to 30 °C. The standard deviation of Ts for the three sites is greater than that obtained for Ta, mostly in EEL and SE, due to the variability of hourly temperatures.

3.2. Temperature and Efficiency

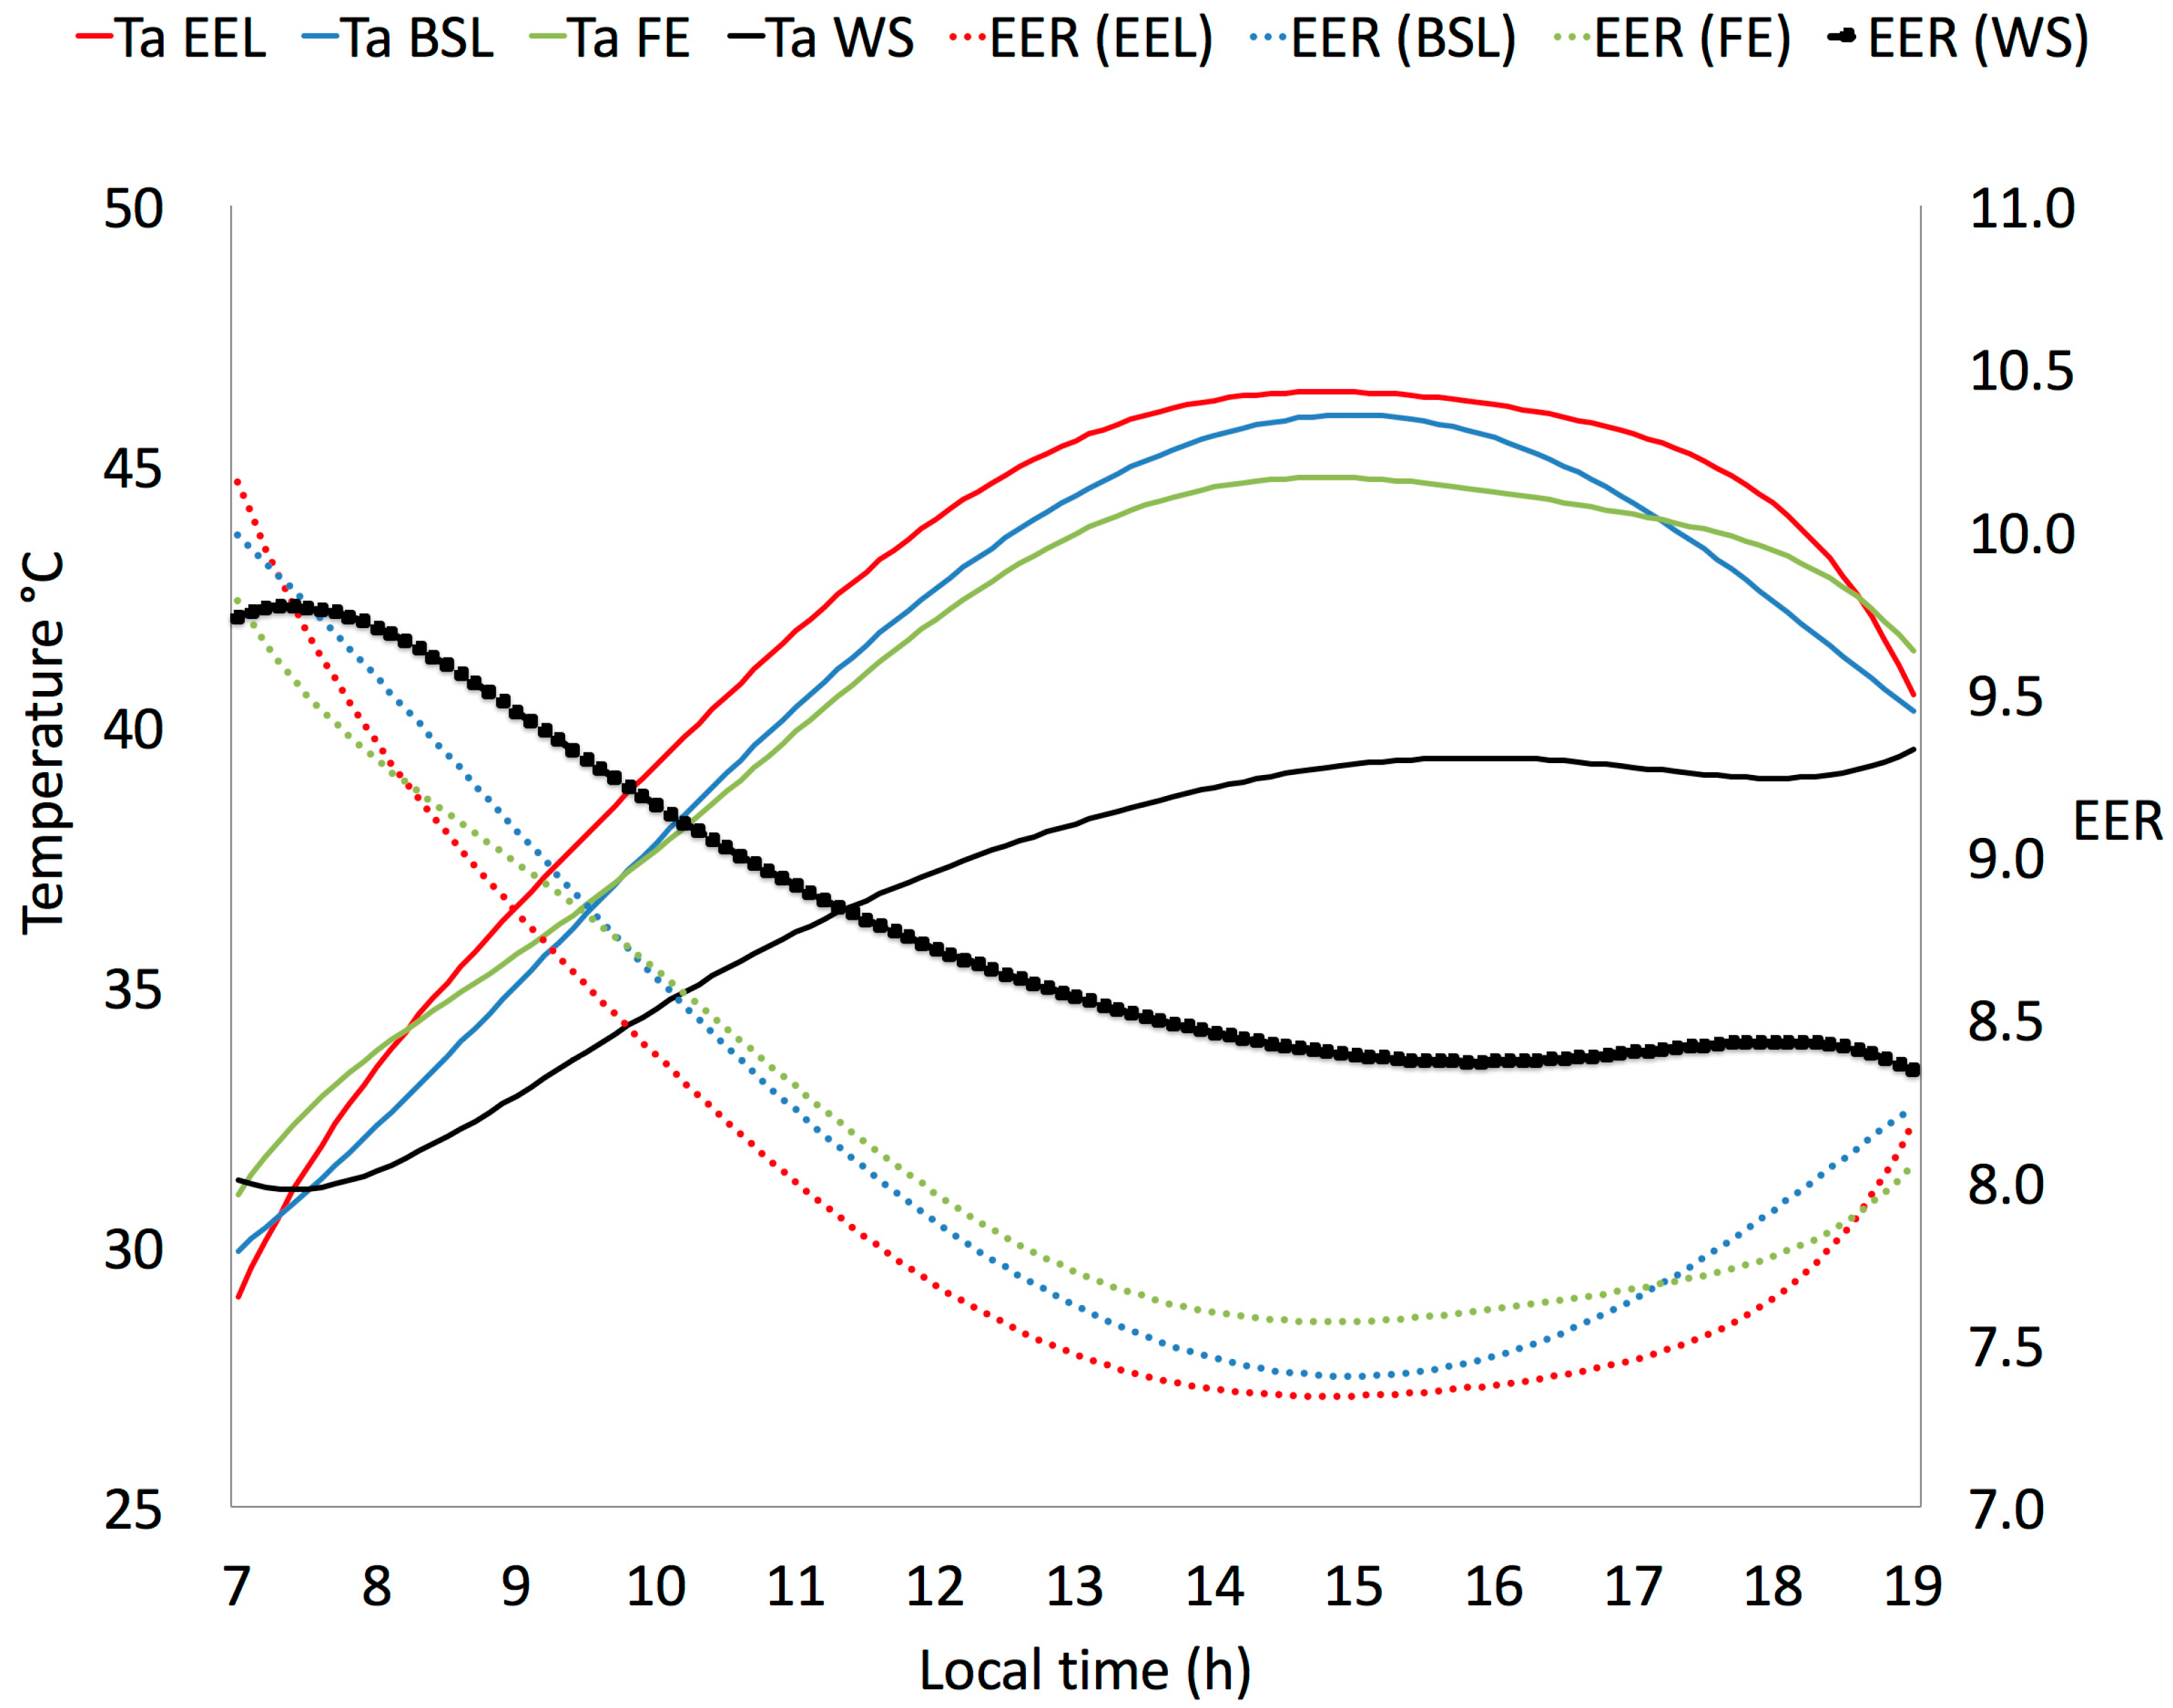
It is important to note that the condenser inlet air temperature is affected by Ts. This behavior will have a relevant effect on the efficiency of air conditioners because the airflow temperature in the condenser (condenser inlet air temperature, Ta) produces approximately 90% of the variation in the efficiency of the equipment, as mentioned by Pérez-Tello et al. [44]. In their research, they present the following model (Equation (1)) that indicates the variations of the Energy Efficiency Ratio (EER) as Ta varies, having a maximum EER when Ta is the minimum (between 3 and 4 a.m.) and a minimum EER when Ta is the maximum (around 3 p.m.).
EER = e ( α β T a ) ,
Correlation coefficients α and β were obtained with experimental information provided by the manufacturers. In the case of a 5-ton Woodman equipment, similar to the one used in this study, Pérez-Tello et al. reported that α = 3.1499 and β = 0.00987 [44]. With the outdoor temperatures from Table 4 and Equation (1), Figure 5 shows the variation that the EER has as Ta varies during the day, from 7:00 a.m. to 7:00 p.m. After 9:00 a.m., the rate of change or slope of EER and Ta decreases until reaching maximum and minimum values, respectively, between 2:00 p.m. and 3:00 p.m.
The air conditioner efficiency, influenced by outdoor temperatures, affects peak summer electricity demand. Higher efficiencies reduce maximum capacity requirements and benefit the electric company and the consumer by reducing electricity consumption [44], which also causes environmental benefits by reducing GHG emissions.

3.3. Electricity Consumption and GHG Emissions

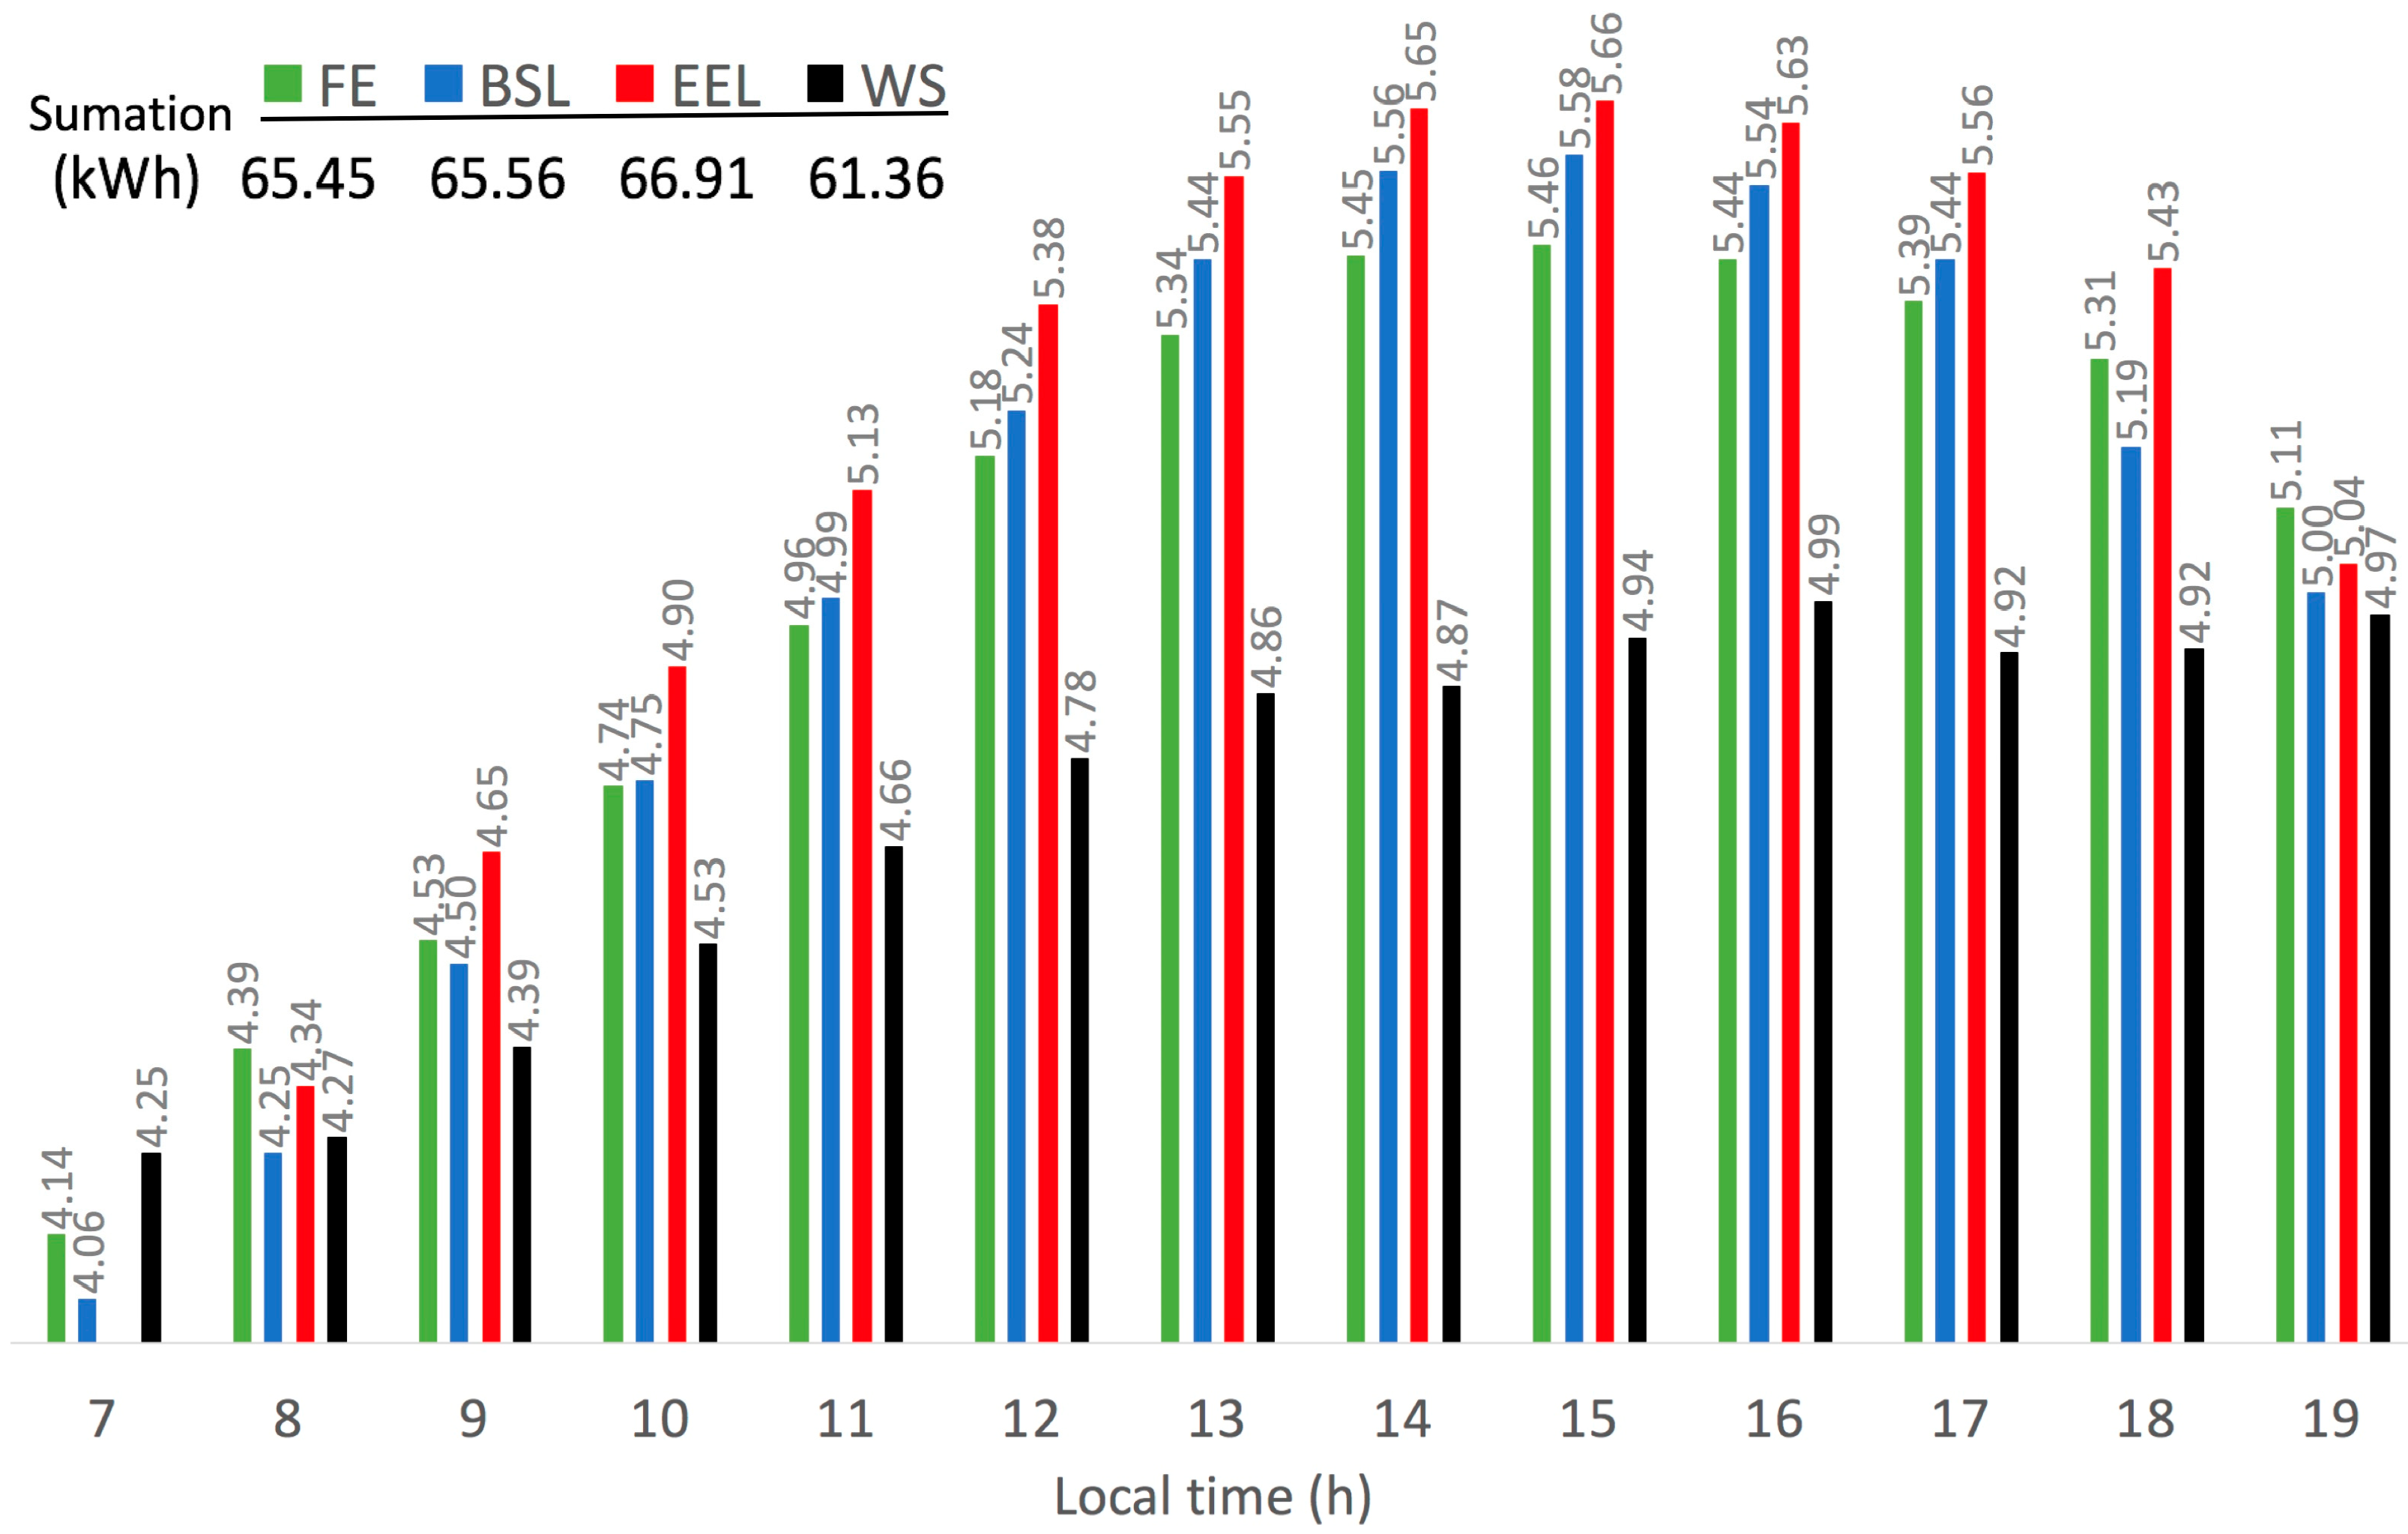
Figure 6 shows the hourly electricity consumption of the hypothetical equipment installed on the three surfaces, EEL, BSL, and FE, as well as the hourly electricity consumption calculated with the temperature WS. In addition, the total electricity consumption is shown.
The surplus energy between each site and WS was calculated. Thus, the total electrical consumption at EEL minus the value given by WS is 5.55 kWh (Figure 6). In the same way, the excess electrical consumption for BSL and FE is 4.2 and 4.09 kWh, respectively. Therefore, the total extra energy consumption is 13.84 kWh.
Hourly surplus energy between every study site and WS, with the highest values between 1:00 p.m. and 3:00 p.m. due to the highest temperatures on all the surfaces, can also be observed. The following table, with data from the Environmental Protection Agency Calculator [37], presents the mass of greenhouse gas emissions and their equivalents derived from excess electricity consumption (Table 5).

4. Discussion

The main objective of this study was to highlight the impact of different roof coverings on the performance of air conditioning units due to the microclimate generated by roof heat gain, which results in a temperature increase in the adjacent air mass that flows to the condensers. The continuous operation of the equipment during the daytime period from 7:00 a.m. to 7:00 p.m. was considered for this analysis, as well as the theoretical electrical consumption of the A/C equipment indicated by the manufacturer.
It is important to point out that the estimation of the performance of an air conditioning unit considers the weather conditions of a zone or region commonly monitored through the ambient temperatures recorded by the available weather stations. However, the microclimate conditions surrounding the condenser are characterized by temperatures higher (Ta) than the ambient temperature (WS) due to heat gain from the roof. In turn, heat gain depends on the thermal characteristics of the materials used in each roof, and the surface temperature magnitude (Ts) reflects the impact on the amount of heat energy gained [28,45,46]. The results of this study highlight the importance of air temperatures registered close to the condenser (Ta) (Figure 2) because air conditioning equipment will be working in conditions that will reduce its performance and cause extra electrical energy consumption. That is, the equipment performance decrease (Figure 5) and the electrical consumption increase (Figure 6) are related to the air temperature (Ta) increase around the condenser due to the heat gain produced by the roof surface. Thus, the registered differences between the air temperatures at the inlet of the condensers occur due to the thermal properties of each surface. The galvanized steel sheet used in the EEL is a material that quickly stores thermal energy; it increases its temperature due to its high conductivity and heat capacity. As a result, the surface temperature TsEEL will be quite significant. The other two covers have materials with a lower thermal capacity and less conductivity since both are insulators. As a result, the surface temperatures, TsFE and TsBSL, will be lower [39,47]. On the other hand, the conduction of heat from the roof surface to the adjacent air mass and the convection up to 0.59 m in height cause air temperatures at the inlet of the condensers to present the registered magnitudes. That means that the highest surface temperature (TsEEJ) corresponds to the highest condenser inlet air temperature (TaEEL), and the lowest surface temperatures (TsBSL and TsFE) correspond to the lowest condenser inlet air temperatures (TaBSL and TaFE).
Thus, when considering the temperature recorded by the weather station WS, the electrical consumption predicted by the manufacturer for a 5-ton air conditioning unit would be 61.36 kWh. However, when considering the condenser inlet air temperature (microclimate), the electrical energy consumption increases by 8.2% for EEL, 6.8% for BSL, and 6.6% for FE. Other studies show significant and unexpected energy differences when considering the effects of the microclimate [27,48,49,50]. In the present study, these percentages represent an additional consumption of 13.84 kWh for the condensation process of the equipment to maintain the comfort conditions established inside the building. It is worth noting that this extra energy consumption represents an additional emission of 9.8 kg of CO2e into the atmosphere. From the point of view of energy savings, if strategies were proposed to minimize the increase in condenser inlet air temperature, we would avoid extra energy consumption and its corresponding CO2e emissions into the atmosphere. In this sense, energy-saving strategies based on thermal insulation and green roofs, as those presented in [51], can contribute to lowering the condenser inlet air temperature in such a way that the energy savings reported (13 to 21 kWh) could be due, to some degree, to the control of the microclimate on the roofs as an indirect result of the strategy.
To exemplify this additional emission, Table 5 presents some activities that emit the same amount of equivalent CO2 to the atmosphere. For example, it could drive a compact car 24.3 miles (39.1 km) or fully charge 1193 smartphones. The emissions will increase significantly if several air conditioning units with the same characteristics (5 tons) work on similar coverage. For example, for 500 A/C equipment installed over roofs similar to the Electrical Engineering Laboratory’s, the additional consumption would be 2775 kWh, which is equivalent to an emission of 1996 kg of CO2e, 4882 miles of compact car travel, 222 gallons of gasoline consumed, 2176 pounds of coal burned, 239,222 full smartphone charges, 80.4 cylinders of propane gas used, or 34% of the annual electricity consumption of a home in the city of Mexicali, where there is an average annual consumption of 8193 kWh in the residential sector [52].
On the other hand, some studies have projected that both northern Mexico [53] and the southwestern United States [54] will have warmer conditions in the coming years, so their energy demand will be higher. This projection highlights the importance of finding mechanisms to reduce energy consumption when using air conditioning equipment. For now, this study shows a way to estimate the excess energy consumption associated with microclimates on different types of roofs where air conditioning equipment is installed.
Finally, considering the findings in this research, design calculations for an air conditioning unit must be made in the context of the microclimate in which the equipment will be installed to truly function with microsite conditions. Unfortunately, homogeneous roofs are not always possible since cities grow at different rates and with different designs. However, applying the information presented in this paper, urban planners can intentionally propose designs aimed at reducing the generation of microclimates that significantly impair the performance of air conditioning equipment and, therefore, cause higher energy consumption related to the comfort of the inhabitants.

5. Conclusions

The most relevant aspects among the results of this study are as follows: (a) roof materials generate microclimates around the condensers of air conditioning equipment; (b) roof surfaces reach high temperatures due to their thermal properties, which heat the air entering the condensers; (c) electrical energy consumption is up to 8.2% higher due to the microclimates generated by roofs; and (d) excess greenhouse gas emissions are generated due to microclimates where air conditioner units work.
There are few on-site experimental efforts such as that described in the present study. In most cases, the microclimate simulations developed by these approaches produce outstanding results. Another consideration that stands out, in this case, is the fact of the extreme summer conditions that occur in the city of Mexicali, which involve a challenge for the electrical supply, not only in this city but in others with hot climates, considering a climate change scenario that is already taking place and will continue in the future. The expected urban scenario is critical, and it will require the construction of more power plants, that is, more electrical generation to cover the demand for A/C equipment, plus surpluses not considered due to microclimates.
This information is also helpful for manufacturers because it provides data on the performance of their equipment under microclimate conditions and the opportunity to establish new criteria to consider the actual temperature of the air that can enter the condenser; that is, not only the ambient temperature is sufficient to calculate capacities when proposing an air conditioning system, but also the condenser inlet air temperature.
Investigation on urban microclimates, empirical or experimentally, should continue to reach the goal of saving electricity and reducing GHG emissions provoked by air conditioning equipment. There are many opportunities to improve the microclimate surrounding current and future university campus facilities and the city. Planners, designers, decision-makers, and other professionals responsible for the city’s growth must establish construction standards and regulations that minimize the impact generated by microclimates on the emission of greenhouse gases and counteract global warming.

Author Contributions

Conceptualization, N.S.-S. and A.A.L.-A.; methodology, N.S.-S. and A.A.L.-A.; formal analysis, N.S.-S. and A.A.L.-A.; investigation, N.S.-S. and A.A.L.-A.; resources, N.S.-S. and N.V.-L.; data curation, N.S.-S., A.A.L.-A. and D.E.F.-J.; writing—original draft preparation, N.S.-S. and A.A.L.-A.; writing—review and editing, N.S.-S., A.A.L.-A. and D.E.F.-J.; visualization, S.O.-B., S.E.C.-S. and R.L.-Z.; supervision, N.S.-S.; project administration, N.S.-S. All authors have read and agreed to the published version of the manuscript.

Funding

This research received no external funding.

Institutional Review Board Statement

Not applicable.

Informed Consent Statement

Not applicable.

Data Availability Statement

Not applicable.

Acknowledgments

The authors are grateful to the Engineering Institute of Autonomous University of Baja California for the facilities and equipment provided to conduct this project.

Conflicts of Interest

The authors declare no conflict of interest.

References

  1. Nejat, P.; Jomehzadeh, F.; Taheri, M.M.; Gohari, M.; Abd Majid, M.Z. A global review of energy consumption, CO2 emissions and policy in the residential sector (with an overview of the top ten CO2 emitting countries). Renew. Sustain. Energy Rev. 2015, 43, 843–862. [Google Scholar] [CrossRef]
  2. The European Parliament and the Council of the Europe. Directive (EU) 2018/844 of the European Parliament and of the Council of May 30 2018 amending Directive 2010/31/EU on the energy performance of buildings and Directive 2012/27/EU on energy efficiency. Off. J. Eur. Union 2018, 156, 77. Available online: https://eur-lex.europa.eu/legal-content/EN/TXT/PDF/?uri=CELEX:32018L0844&from=IT (accessed on 1 February 2022).
  3. Patiño-Cambeiro, F.; Armesto, J.; Bastos, G.; Prieto-López, J.I.; Patiño-Barbeito, F. Economic appraisal of energy efficiency renovations in tertiary buildings. Sustain. Cities Soc. 2019, 47, 101503. [Google Scholar] [CrossRef]
  4. Valdiserri, P.; Biserni, C. Energy performance of an existing office building in the northern part of Italy: Retrofitting actions and economic assessment. Sustain. Cities Soc. 2016, 27, 65–72. [Google Scholar] [CrossRef]
  5. United States Energy Information Administration. Energy Consumption Estimates by Sector. Available online: http://www.eia.gov/consumption/ (accessed on 10 January 2022).
  6. D&R International, Ltd. 2011 Buildings Energy Data Book; United States Department of Energy: Washington, DC, USA, 2012. Available online: https://ieer.org/resource/energy-issues/2011-buildings-energy-data-book/ (accessed on 7 February 2022).
  7. Konopacki, S.; Akbari, H.; Gartland, L. Cooling Energy Savings Potential of Light-Colored Roofs for Residential and Commercial Buildings in 11 US Metropolitan Areas; Lawrence Berkeley National Laboratory: Berkeley, CA, USA, 1997. [CrossRef]
  8. Akbari, H.A.; Konopacki, S.J. The impact of reflectivity and emissivity of roofs on building cooling and heating energy use. In Proceedings of the Thermal Performance of the Exterior Envelopes of Buildings VII, Clear-water Beach, FL, USA, 6–10 December 1998; Available online: https://web.ornl.gov/sci/buildings/conf-archive/1998%20B7%20papers/003_Akbari.pdf (accessed on 2 December 2021).
  9. Konopacki, S.; Gartland, L.; Akbari, H.; Rainer, L. Demonstration of Energy Savings of Cool Roofs, Lawrence Berkeley National Laboratory Report LBNL-40673, Berkeley, CA, USA. 1998. Available online: https://eta-publications.lbl.gov/sites/default/files/lbnl-40673.pdf (accessed on 2 December 2021).
  10. Konopacki, S.; Akbari, H. Measured Energy Savings and Demand Reduction from a Reflective Roof Membrane on a Large Retail Store in Austin, Lawrence Berkeley National Laboratory Report, LBNL-47149. 2001. Available online: https://www.osti.gov/servlets/purl/787107 (accessed on 2 December 2021).
  11. Akbari, H.; Levinson, R.M.; Rainer, L. Monitoring the energy use effects of cool roofs on California commercial buildings. Energy Build. 2005, 37, 1007–1016. [Google Scholar] [CrossRef]
  12. Akbari, H.; Konopacki, S. Calculating energy saving potentials of heat island reduction strategies. Energy Policy 2005, 33, 721–756. [Google Scholar] [CrossRef]
  13. Levinson, R.; Akbari, H. Potential benefits of cool roofs on commercial buildings: Conserving energy, saving money, and reducing emission of greenhouse gases and air pollutants. Energy Effic. 2010, 3, 53–109. [Google Scholar] [CrossRef]
  14. Jandaghian, Z.; Akbari, H. The Effect of Increasing Surface Albedo on Urban Climate and Air Quality: A Detailed Study for Sacramento, Houston, and Chicago. Climate 2018, 6, 19. [Google Scholar] [CrossRef]
  15. Saffari, M.; Piselli, C.; De Gracia, A.; Pisello, A.L.; Cotana, F.; Cabeza, L.F. Thermal stress reduction in cool roof membranes using phase change materials (PCM). Energy Build. 2018, 158, 1097–1105. [Google Scholar] [CrossRef]
  16. Silva, H., III; Fillpot, B.S. Modeling nexus of urban heat island mitigation strategies with electricity/power usage and consumer costs: A case study for Phoenix, Arizona, USA. Theor. Appl. Climatol. 2018, 131, 661–669. [Google Scholar] [CrossRef]
  17. ASHRAE & ANSI/ASHRAE. Advanced Energy Design Guide for Small to Medium Office Buildings; American Society of Heating, Refrigerating, and Air-Conditioning Engineers, Inc.: Atlanta, GA, USA, 2011; Available online: https://thermalbridgingsolutions.com/wp-content/uploads/2019/12/AEDG_50percent-energy-reduction_Small-to-Medium-Commercial-Buildings.pdf (accessed on 12 January 2022).
  18. Berdahl, P.; Bretz, S. Preliminary survey of the solar reflectance of cool roofing materials. Energy Build. 1997, 25, 149–158. [Google Scholar] [CrossRef]
  19. Wray, C.; Akbari, H. The effects of roof reflectance on air temperatures surrounding a rooftop condensing unit. Energy Build. 2008, 40, 11–28. [Google Scholar] [CrossRef]
  20. Testa, J.; Krarti, M. Evaluation of energy savings potential of variable reflective roofing systems for US buildings. Sustain. Cities Soc. 2017, 31, 62–73. [Google Scholar] [CrossRef]
  21. Oropeza-Perez, I.; Østergaard, P. Energy saving potential of utilizing natural ventilation under warm conditions—A case study of Mexico. Appl. Energy 2014, 130, 20–32. [Google Scholar] [CrossRef]
  22. Rosas-Flores, J.A.; Rosas-Floresa, D.; Morillόn-Gálvezb, D. Saturation, energy consumption, CO2 emission and energy efficiency from urban and rural households appliances in Mexico. Energy Build. 2011, 43, 10–18. [Google Scholar] [CrossRef]
  23. Tong, Z.; Chen, Y.; Malkawi, A.; Liu, Z.; Freeman, R.B. Energy saving potential of natural ventilation in China: The impact of ambient air pollution. Appl. Energy 2016, 179, 660–668. [Google Scholar] [CrossRef]
  24. Boot, L.M.; Wang, Y.H.; Chiang, C.M.; Lai, C.M. Effects of a Green Space Layout on the Outdoor Thermal Environment at the Neighborhood Level. Energies 2012, 5, 3723–3735. [Google Scholar] [CrossRef]
  25. Lai, M.M.; Wang, Y.H. Energy-Saving Potential of Building Envelope Designs in Residential Houses in Taiwan. Energies 2011, 4, 2061–2076. [Google Scholar] [CrossRef]
  26. TKE Blog 2019. Taking Care of Urban Microclimates through Better Design and Greater Energy Efficiency. Available online: https://www.urban-hub.com/energy_efficiency/rethinking-the-use-of-urban-microclimates/ (accessed on 27 April 2023).
  27. Javanroodi, K.; Nik, V.M. Impacts of Microclimate Conditions on the Energy Performance of Buildings in Urban Areas. Buildings 2019, 9, 189. [Google Scholar] [CrossRef]
  28. Taha, H. Urban climates and heat islands: Albedo, evapotranspiration, and anthropogenic heat. Energy Build. 1997, 25, 99–103. [Google Scholar] [CrossRef]
  29. Yang, S.; Wang, L.; Stathopoulos, T.; Marey, A.M. Urban microclimate and its impact on built environment—A review. Build. Environ. 2023, 238, 110334. [Google Scholar] [CrossRef]
  30. Akbari, H.; Pomerantz, M.; Taha, H. Cool surfaces and shade trees to reduce energy use and improve air quality in urban areas. Sol. Energy 2001, 70, 295–310. [Google Scholar] [CrossRef]
  31. Li, X.; Zhou, Y.; Yu, S.; Jia, G.; Li, H.; Li, W. Urban heat island impacts on building energy consumption: A review of approaches and findings. Energy 2019, 174, 407–419. [Google Scholar] [CrossRef]
  32. Alshahrani, J.; Boait, P. Reducing high energy demand associated with air-conditioning needs in Saudi Arabia. Energies 2019, 12, 87. [Google Scholar] [CrossRef]
  33. Shahmohamadi, P.; Che-Ani, A.I.; Maulud, K.N.A.; Tawil, N.M.; Abdullah, N.A.G. The Impact of Anthropogenic Heat on Formation of Urban Heat Island and Energy Consumption Balance. Urban Stud. Res. 2011, 2011, 1–9. [Google Scholar] [CrossRef]
  34. Santillán-Soto, N.; García-Cueto, O.R.; Lambert-Arista, A.A.; Ojeda-Benítez, S.; Cruz-Sotelo, S. Comparative Analysis of Two Urban Microclimates: Energy Consumption and Greenhouse Gas Emissions. Sustainability 2019, 11, 2045. [Google Scholar] [CrossRef]
  35. García-Cueto, O.R.; Santillán-Soto, N. Modeling Extreme Climate Events: Two Case Studies in México; Intechopen: London, UK, 2012; Available online: https://www.intechopen.com/books/climate-models/modeling-extreme-climate-events-two-case-studies-in-mexico (accessed on 10 December 2021). [CrossRef]
  36. Goodman Air Conditioning & Heating. Available online: http://www.goodmanmfg.com/Portals/0/pdf/SS/SS-GPC14H.pdf (accessed on 28 January 2021).
  37. Environmental Protection Agency EPA. Greenhouse Gas Equivalencies Calculator. 2019. Available online: https://www.epa.gov/energy/greenhouse-gas-equivalencies-calculator (accessed on 16 March 2023).
  38. EPA AVERT, U.S. Greenhouse Gas Equivalencies Calculator-Calculations and References 2019. Available online: https://www.epa.gov/energy/greenhouse-gases-equivalencies-calculator-calculations-and-references (accessed on 2 December 2021).
  39. Lee, S.; Moon, H.; Choi, Y.; Yoon, D.K. Analyzing thermal characteristics of urban streets using a thermal imaging camera: A case study on commercial streets in Seoul, Korea. Sustainability 2018, 10, 519. [Google Scholar] [CrossRef]
  40. Doulos, L.; Santamouris, M.; Livada, I. Pasive cooling of outdoor urban spaces. The role of materials. Sol. Energy 2004, 77, 231–249. [Google Scholar] [CrossRef]
  41. WMO. World Meteorological Organization. Guide to Instruments and Methods of Observation. Volume I—Measurement of Meteorological Variables. 2021. Available online: https://library.wmo.int/index.php?id=12407&lvl=notice_display (accessed on 27 April 2023).
  42. Deng, C.; Zhang, X.; Huang, Y.; Bao, Y. Equipping Seasonal Exponential Smoothing Models with Particle Swarm Optimization Algorithm for Electricity Consumption Forecasting. Energies 2021, 14, 4036. [Google Scholar] [CrossRef]
  43. Obringer, R.; Nateghi, R.; Maia-Silva, D.; Mukherjee, S.; Cr, V.; McRoberts, D.B.; Kumar, R. Implications of increasing household air conditioning use across the United States under a warming climate. Earth’s Future 2022, 10, e2021EF002434. [Google Scholar] [CrossRef]
  44. Pérez-Tello, C.; Campbell-Ramírez, H.; Suástegui-Macías, J.A.; Reinhardt, M.S. Methodology of Energy Management in Housing and Buildings of Regions with Hot and Dry Climates, HVAC System; IntechOpen: London, UK, 2018; Available online: https://www.intechopen.com/chapters/61924 (accessed on 28 January 2021). [CrossRef]
  45. Rawat, M.; Singh, R.N. A study on the comparative review of cool roof thermal performance in various regions. Energy Built Environ. 2022, 3, 327–347. [Google Scholar] [CrossRef]
  46. Hernández-Pérez, I.; Xamán, J.; Macías-Melo, E.V.; Aguilar-Castro, K.M.; Zavala-Guillén, I.; Hernández-López, I.; Simá, E. Experimental thermal evaluation of building roofs with conventional and reflective coatings. Energy Build. 2018, 158, 569–579. [Google Scholar] [CrossRef]
  47. Santillán-Soto, N.; García-Cueto, R.; Haro-Rincón, Z.; Ojeda-Benítez, S.; Quintero-Núñez, M.; Velázquez-Limón, N. Radiation Balance of Urban Materials and Their Thermal Impact in Semi-Desert Region: Mexicali, México Study Case. Atmosphere 2015, 6, 1578–1589. [Google Scholar] [CrossRef]
  48. Natanian, J.; Maiullari, D.; Yezioro, A.; Auer, T. Synergetic urban microclimate and energy simulation parametric workflow. J. Phys. Conf. Ser. 2019, 1343, 012006. [Google Scholar] [CrossRef]
  49. Hong, T.; Xu, Y.; Sun, K.; Zhang, W.; Luo, X.; Hooper, B. Urban microclimate and its impact on building performance: A case study of San Francisco. Urban Clim. 2021, 38, 100871. [Google Scholar] [CrossRef]
  50. Xu, L.; Tong, S.; He, W.; Zhu, W.; Mei, S.; Cao, K.; Yuan, C. Better understanding on impact of microclimate information on building energy modelling performance for urban resilience. Sustain. Cities Soc. 2022, 80, 103775. [Google Scholar] [CrossRef]
  51. Karpio, K.; Łukasiewicz, P.; Nafkha, R. New Method of Modeling Daily Energy Consumption. Energies 2023, 16, 2095. [Google Scholar] [CrossRef]
  52. Suástegui-Macías, J.A.; Pérez Tello, C.; Acuña Ramírez, A.; Lambert Arista, A.A.; Magaña Almaguer, H.D.; Rosales Escobedo, P.F.; Ruelas Puente, A.H. Assessment of electrical saving from energy efficiency programs in the residential sector in Mexicali, Mexico. Sustain. Cities Soc. 2018, 38, 795–805. [Google Scholar] [CrossRef]
  53. Jim, C.Y. Air-conditioning energy consumption due to green roofs with different building thermal insulation. Appl. Energy 2014, 128, 49–59. [Google Scholar] [CrossRef]
  54. García-Cueto, O.R.; López-Velázquez, E.; Santillán-Soto, N.; Casilla-Higuera, A.; Bojórquez-Moráles, G.; Flores-Jiménez, D. Aplicación del Modelo Estadístico de Reducción de Escala a Algunas Ciudades de México. Book: El Clima, Aire, Agua, Tierra y Fuego. 2018. Available online: https://www.researchgate.net/publication/319434922_Extremos_climaticos_en_ciudades_de_Mexico_Climate_extremes_in_mexican_cities (accessed on 27 April 2022).
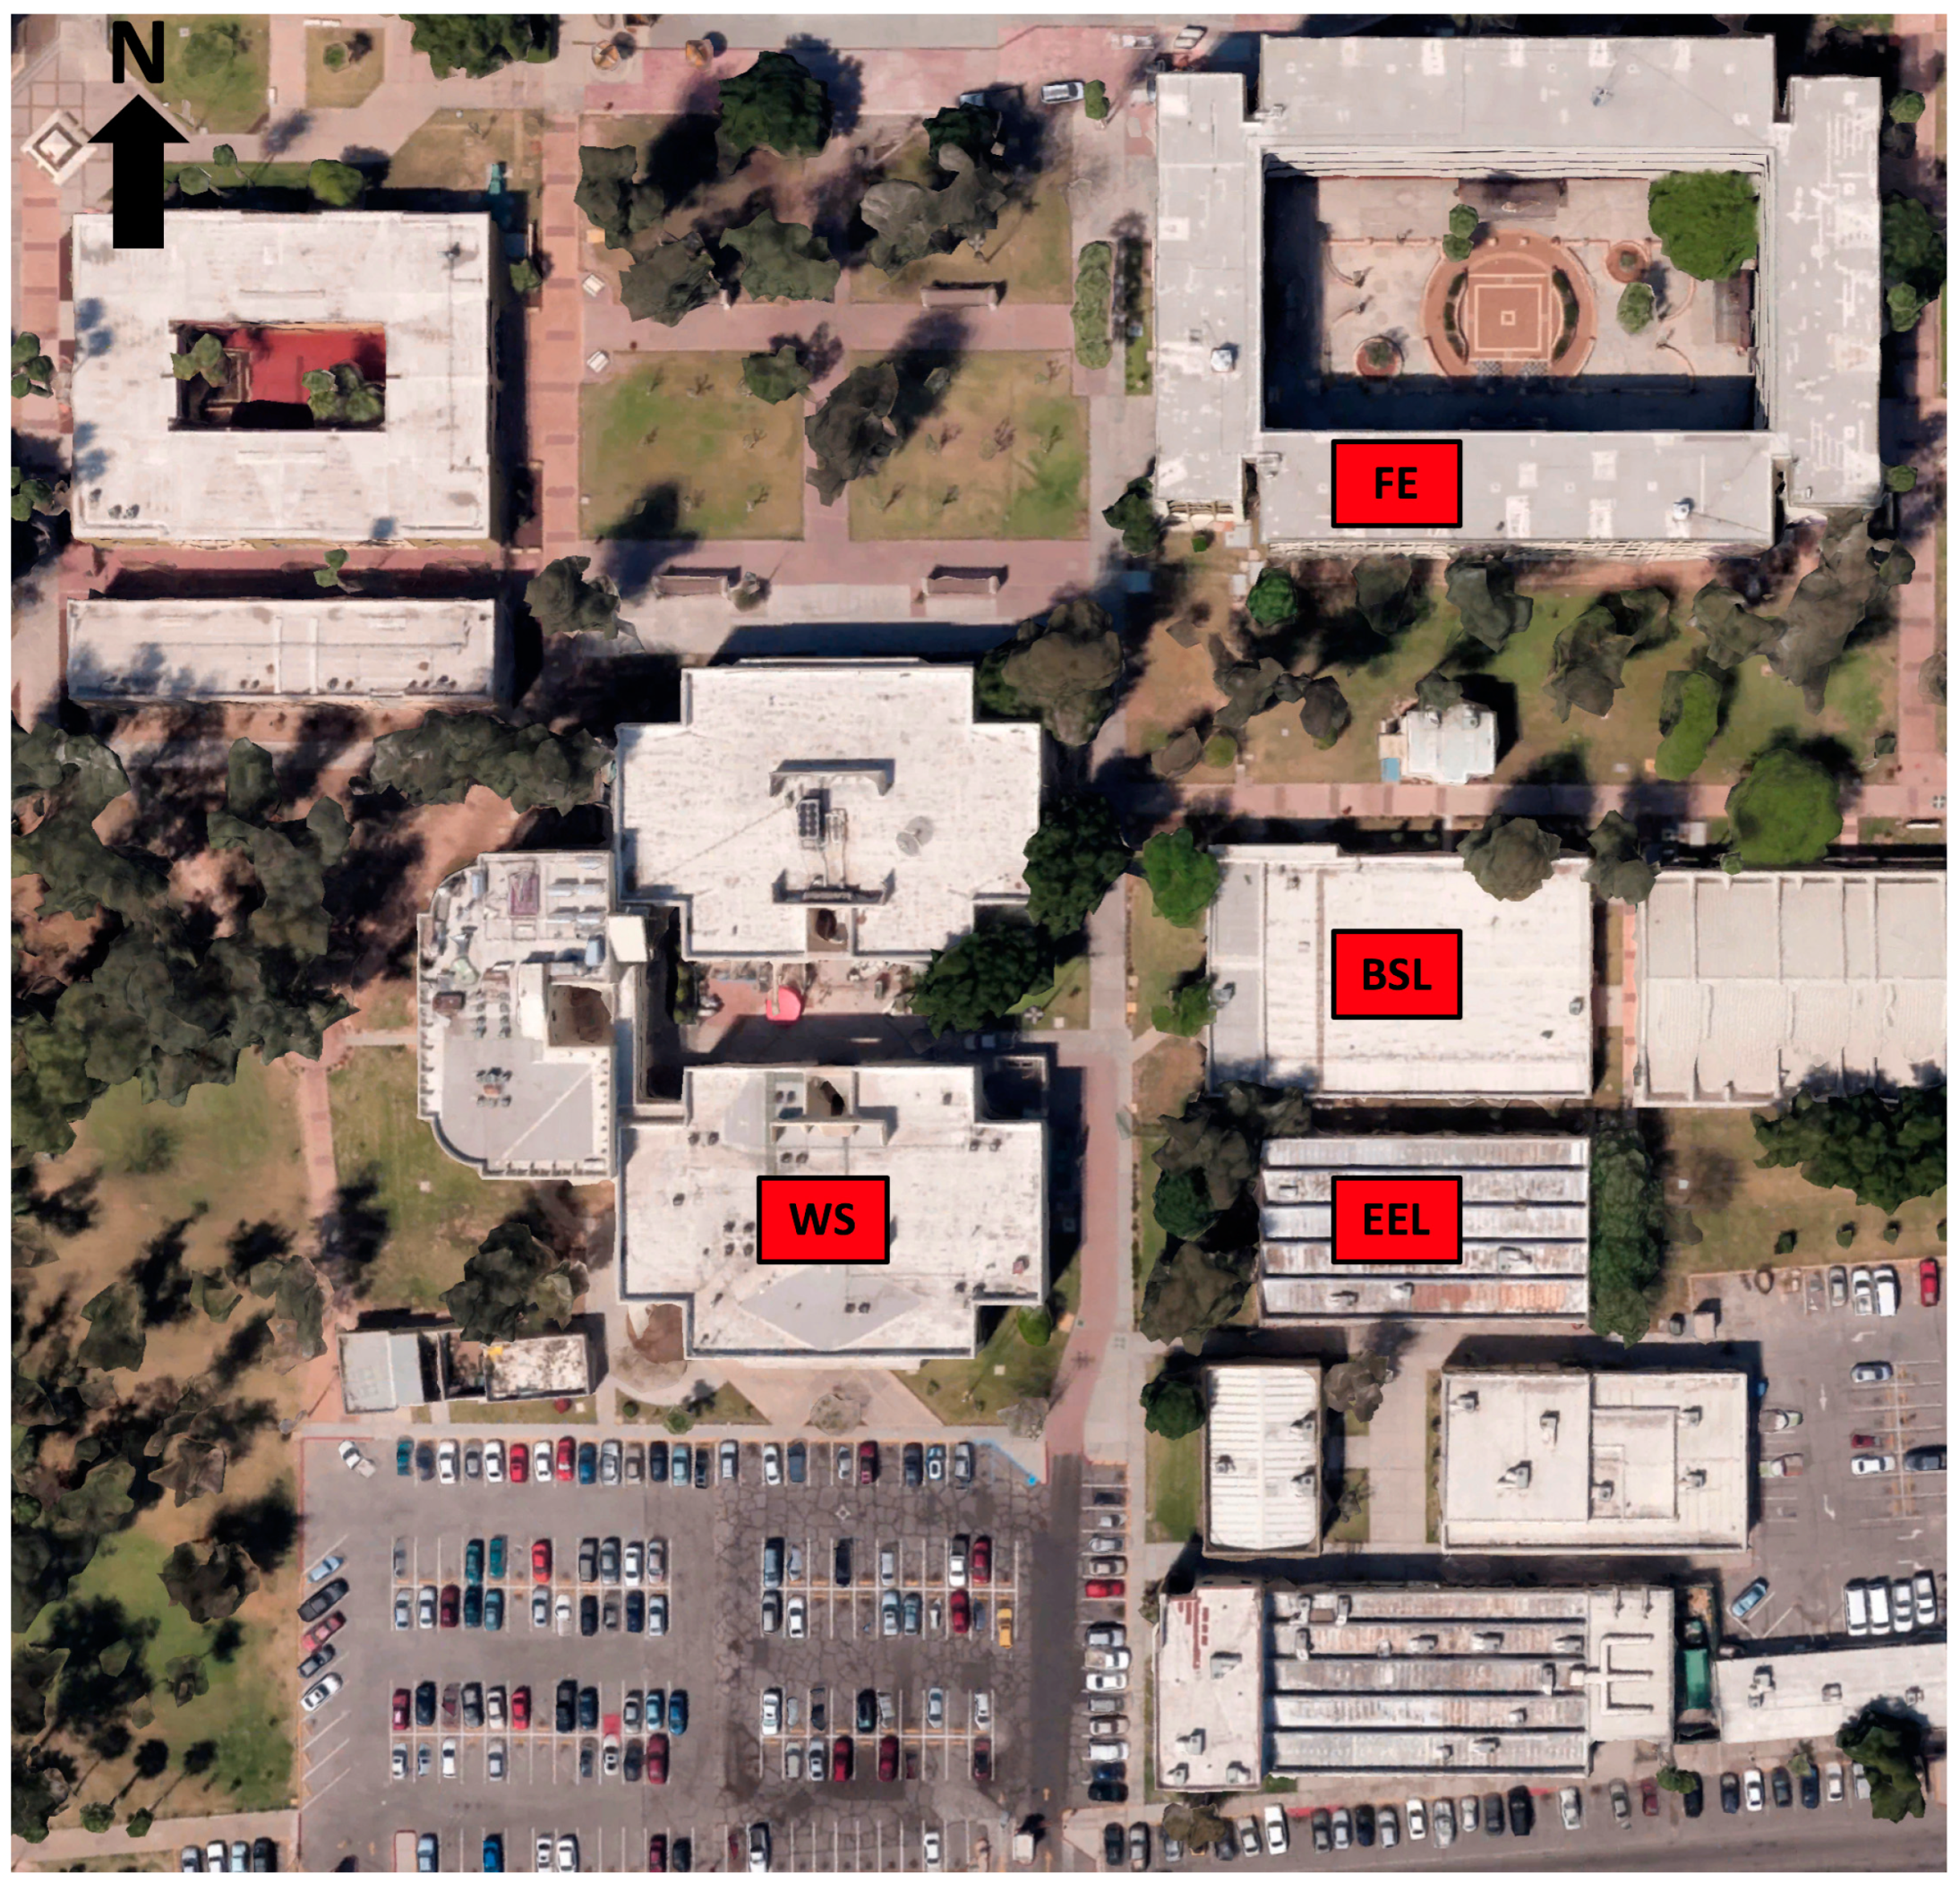
Figure 1. Location of the experimentation sites of the university campus.
Atmosphere 14 00945 g001
Figure 2. (a) Arrangement of air temperature sensor at condenser inlet; (b) arrangement of instrumentation; (c) location of measuring equipment; (d) location of the Radiation Shield to house the Hobo U12-011 sensor; (e) HMP45C WS Temperature Probe; and (f) U12-011 Hobo sensor inside the Radiation Shield.
Atmosphere 14 00945 g002
Figure 3. Condenser inlet air (Ta) and surface (Ts) temperatures at the three experimental sites, 11 July 2018.
Atmosphere 14 00945 g003
Figure 4. Model obtained from the data provided in the operating manual, Woodman, 2018.
Atmosphere 14 00945 g004
Figure 5. Behavior of Energy Efficiency Ratio (EER) with respect to the condenser inlet air temperature.
Atmosphere 14 00945 g005
Figure 6. Hourly electrical consumption and total consumption for 12 h.
Atmosphere 14 00945 g006
Table 1. Description of the roofs on which the experimentation was carried out.
BuildingRoof Materials
EELElectrical Engineering LaboratoryGalvanized steel sheet painted with gray paint
BSLBasic Sciences LaboratoryGalvanized steel sheet covered with sprayed polyurethane
FE.Faculty of EngineeringInsulated concrete slab with 2″ expanded polystyrene covered with gray roofing felt
Table 2. Description of the instrumentation used in the experimentation.
InstrumentModelPurposeQuantityRangeError
Datalogger CR23XCampbell ScientificThermocouple data storage3N/AN/A
a Thermocouple TOmegaSurface temperature reading9−40 °C to 350 °C+/−0.35 °C
b Hobo U12-011OnsetAir temperature reading at the condenser inlet3−20 °C to 70 °C+/−0.35 °C
c Temperature Probe HMP45C (WS.)VaisalaAir temperature reading at the weather station1−40 °C to 60 °C+/−0.4 °C
a Thermocouple attachment pads were used to maintain the thermocouples in contact on each surface. Surface temperature data were recorded every 10 min, and hourly averages were obtained. b The Hobo sensors were placed at a height of 0.59 m from each roof that was analyzed. Condenser inlet air temperature data were recorded every 10 min, and hourly averages were obtained. c WS ambient temperature. It was located 15 m above the ground; temperature probe data were recorded every 10 min, and hourly averages were obtained.
Table 3. Analysis of variance for the air temperature data sets considering a significance level of α = 0.05 for the air temperature (Ta) data sets measured at the study sites.
Pairs of Study Sites Considered *EEL vs. BSLBSL vs. FEEEL vs. FEEEL vs. WSBSL vs. WSFE vs. WS
p-value0.0080.0048.22 × 10−87.35 × 10−252.09 × 10−207.63 × 10⁻¹⁶
* Null hypothesis (H0): The means of each data set are equal. Alternative hypothesis (Ha): The means of each data set are different.
Table 4. Hourly averages of temperatures (°C) for July 2018 at the study sites.
Site07:0008:0009:0010:0011:0012:0013:0014:0015:0016:0017:0018:0019:00Avg.Std. Dev.
Temperature at 0.59 m (Ta)
EEL29.0933.3036.7539.3341.6644.0145.5646.3846.4646.2145.6144.4640.7241.505.54
BSL29.9432.2835.1437.7640.2442.6944.5645.6345.8245.4644.5642.2340.3240.515.29
FE30.9833.8735.4737.6939.9042.1143.6344.6044.7444.5644.0543.3541.4540.494.60
Surface temperature (Ts)
EEL25.2733.8946.3156.1564.6971.9276.0775.5572.0566.4959.4949.3637.2556.5016.87
BSL28.4336.1441.0946.7452.7254.3057.3957.6956.3654.0751.1246.0840.4447.899.10
FE26.6632.6142.5651.0557.9864.3868.6669.5167.4663.8759.1052.8145.2353.9913.86
Weather station (WS)
WS31.2831.5232.9234.4936.0037.3638.3538.4539.2339.7838.9939.0539.5836.693.12
Table 5. Surplus electricity consumption, greenhouse gases, and equivalents.
Δ Kilowatt Hour = Δ EmissionsGreenhouse Gas Emissions Equivalent to
5.55 kWh = 3.9 kg CO2e9.8 miles driven by an average passenger vehicle
0.443 gallons of gasoline consumed
4.4 pounds of coal burned
478 smartphones charged
0.161 propane cylinders used for home barbeques
4.2 = 3 kg CO2e7.4 miles driven by an average passenger vehicle
0.335 gallons of gasoline consumed
3.3 pounds of coal burned
362 smartphones charged
0.122 propane cylinders used for home barbeques
4.09 = 2.9 kg CO2e
Summary:
13.84 = 9.8 kg CO2e
7.2 miles driven by an average passenger vehicle
0.326 gallons of gasoline consumed
3.2 pounds of coal burned
353 smartphones charged
0.181 propane cylinders used for home barbeques
4.3 miles driven by an average passenger vehicle
1.1 gallons of gasoline consumed
10.9 pounds of coal burned
1193 smartphones charged
0.401 propane cylinders used for home barbeques
Disclaimer/Publisher’s Note: The statements, opinions and data contained in all publications are solely those of the individual author(s) and contributor(s) and not of MDPI and/or the editor(s). MDPI and/or the editor(s) disclaim responsibility for any injury to people or property resulting from any ideas, methods, instructions or products referred to in the content.