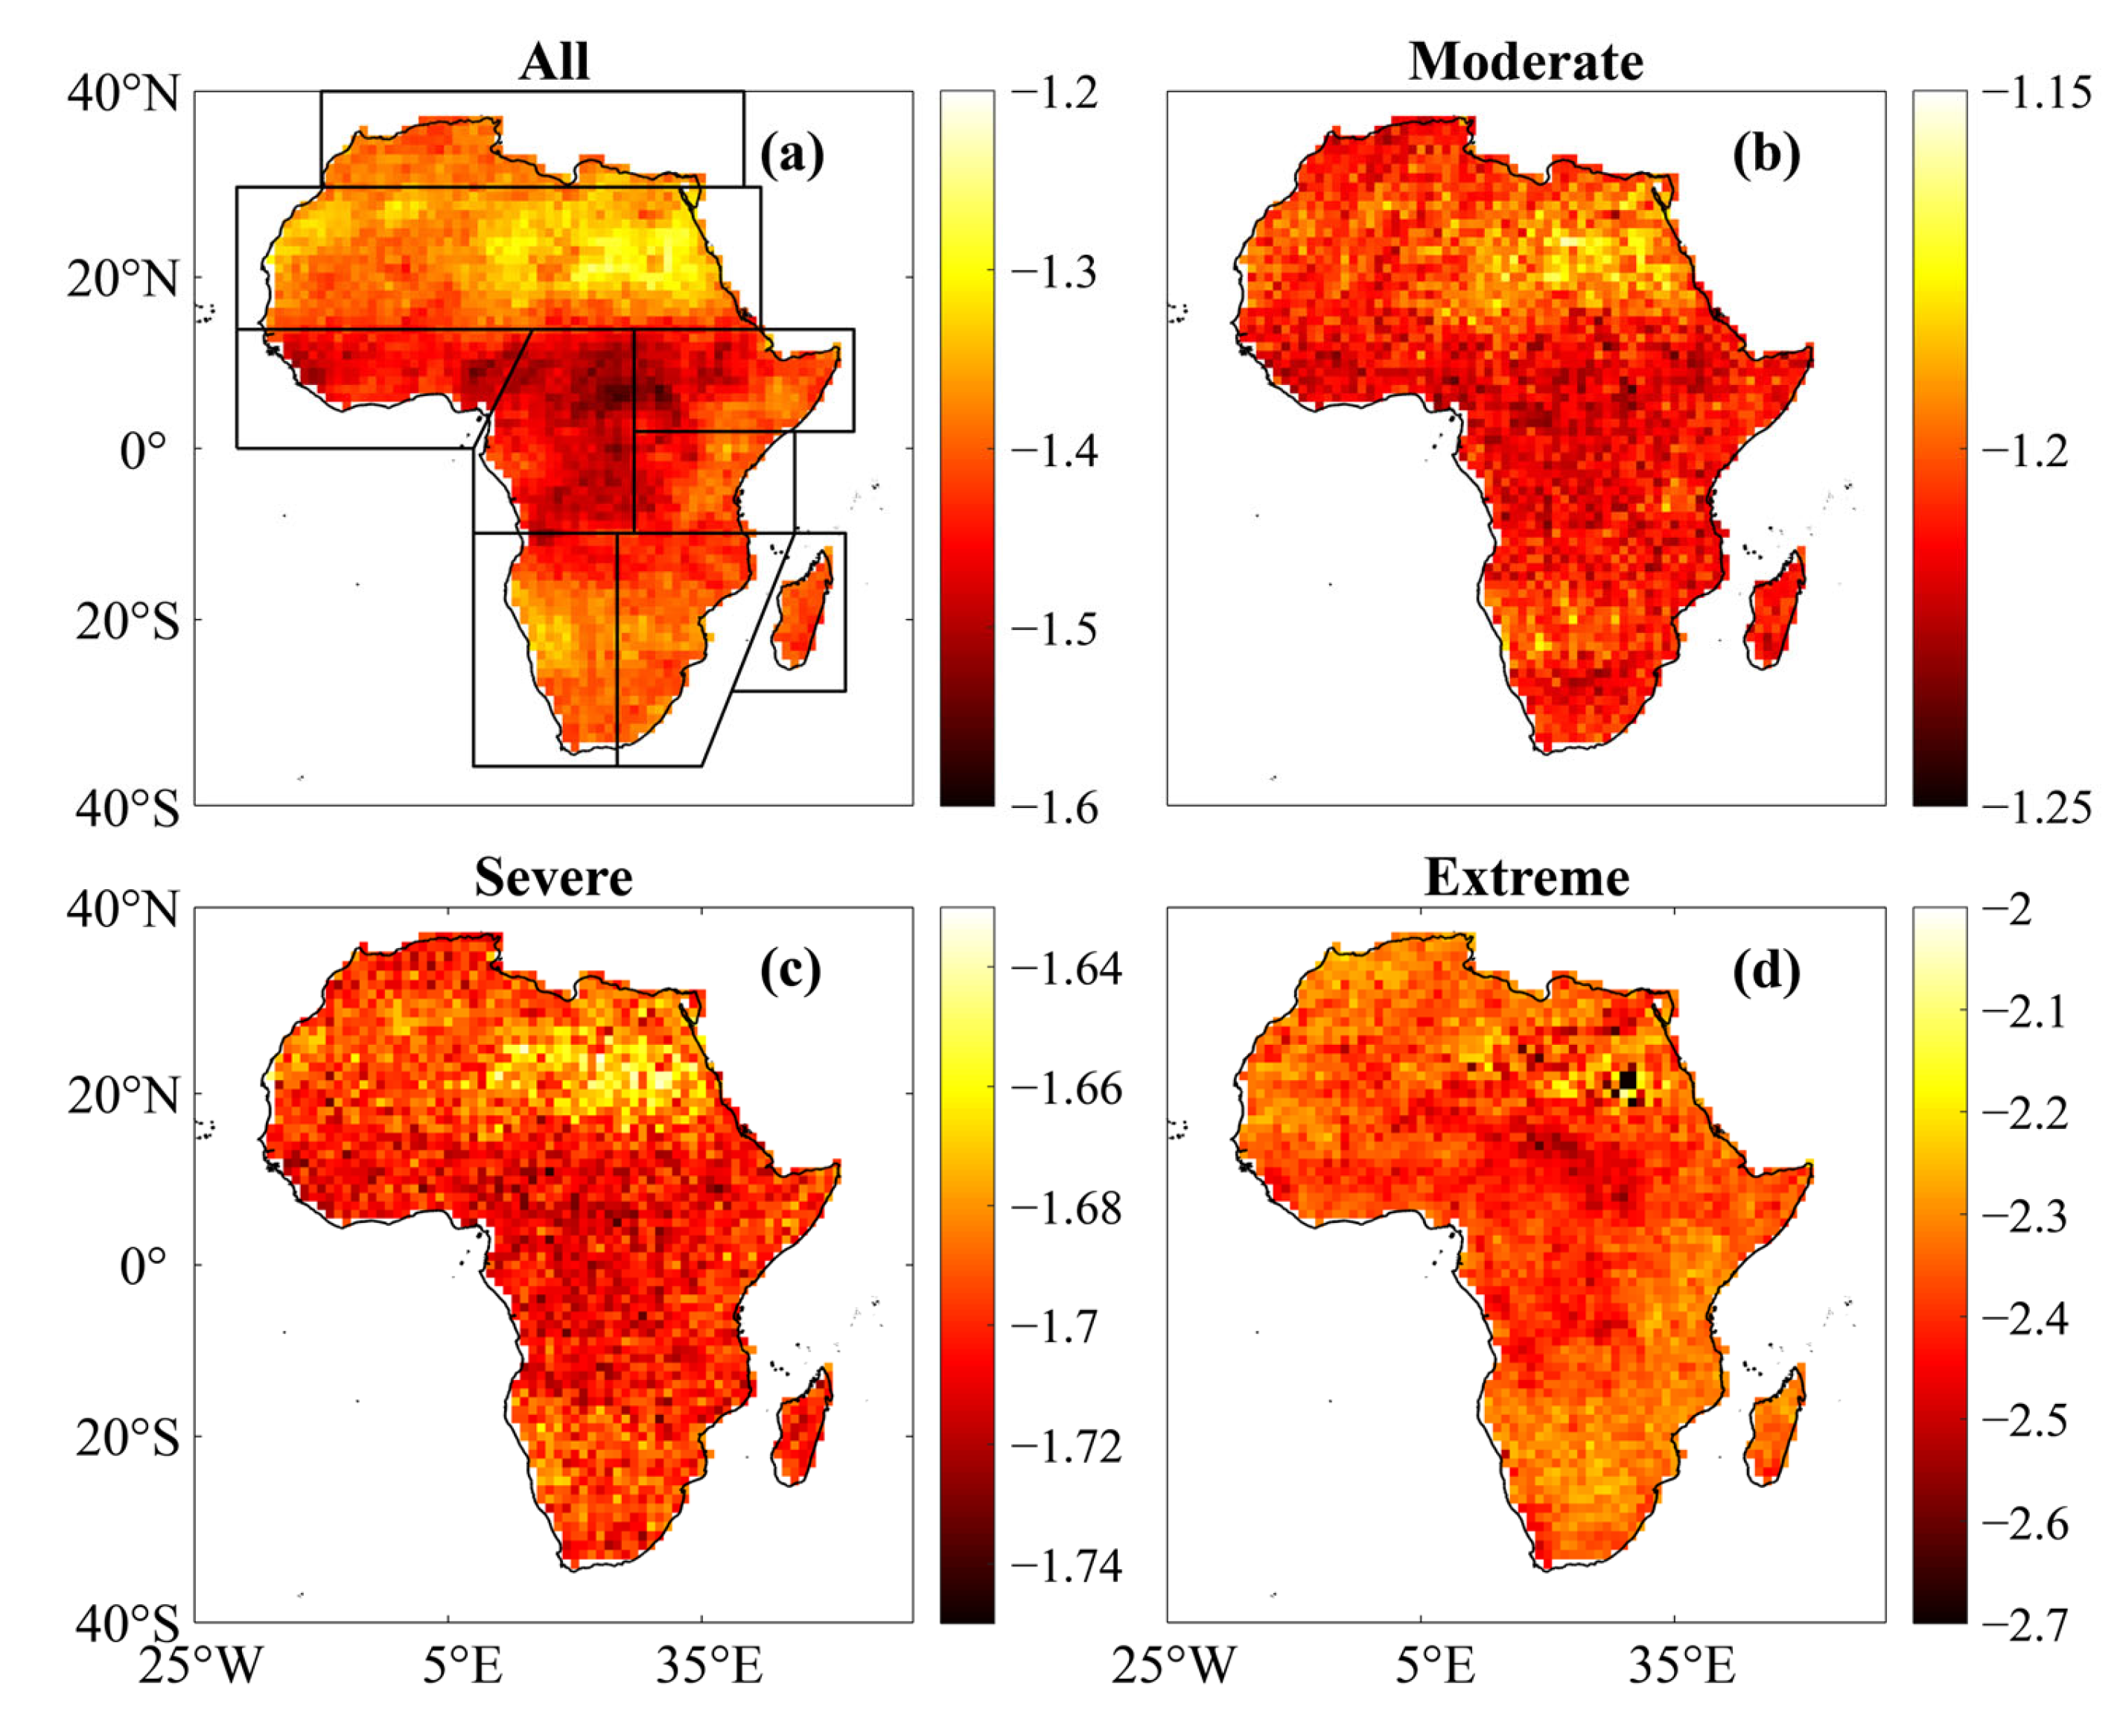
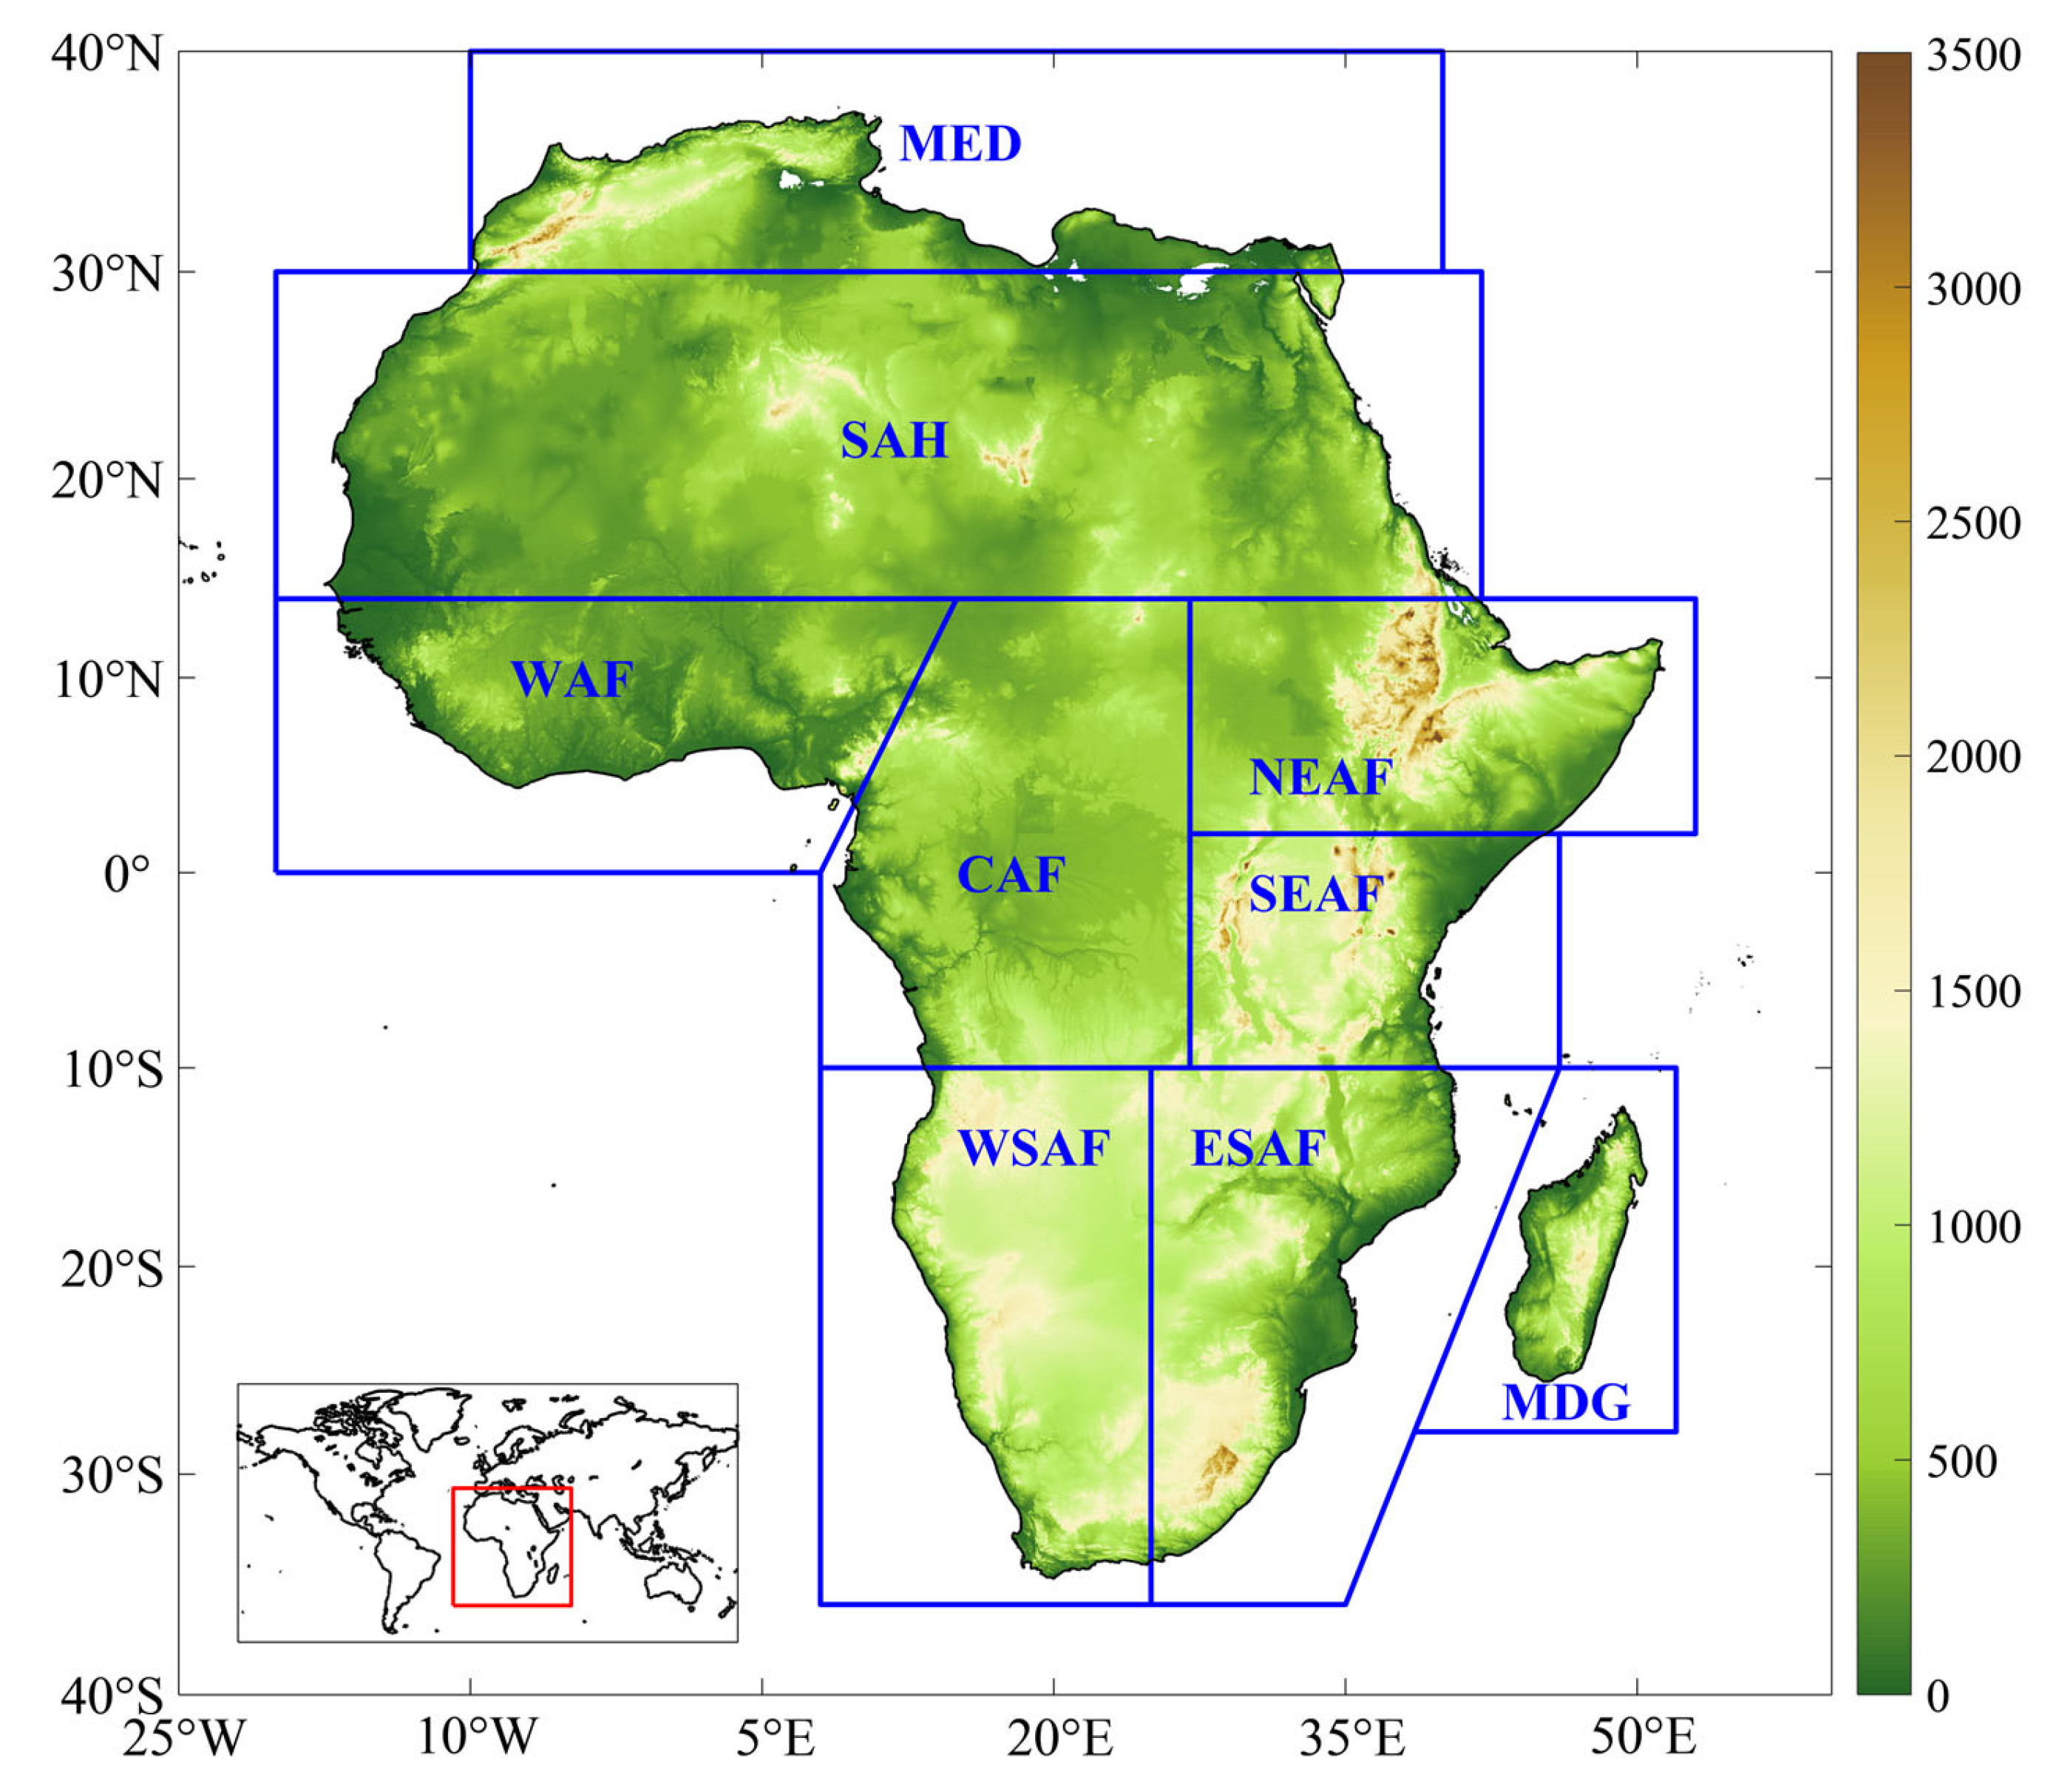
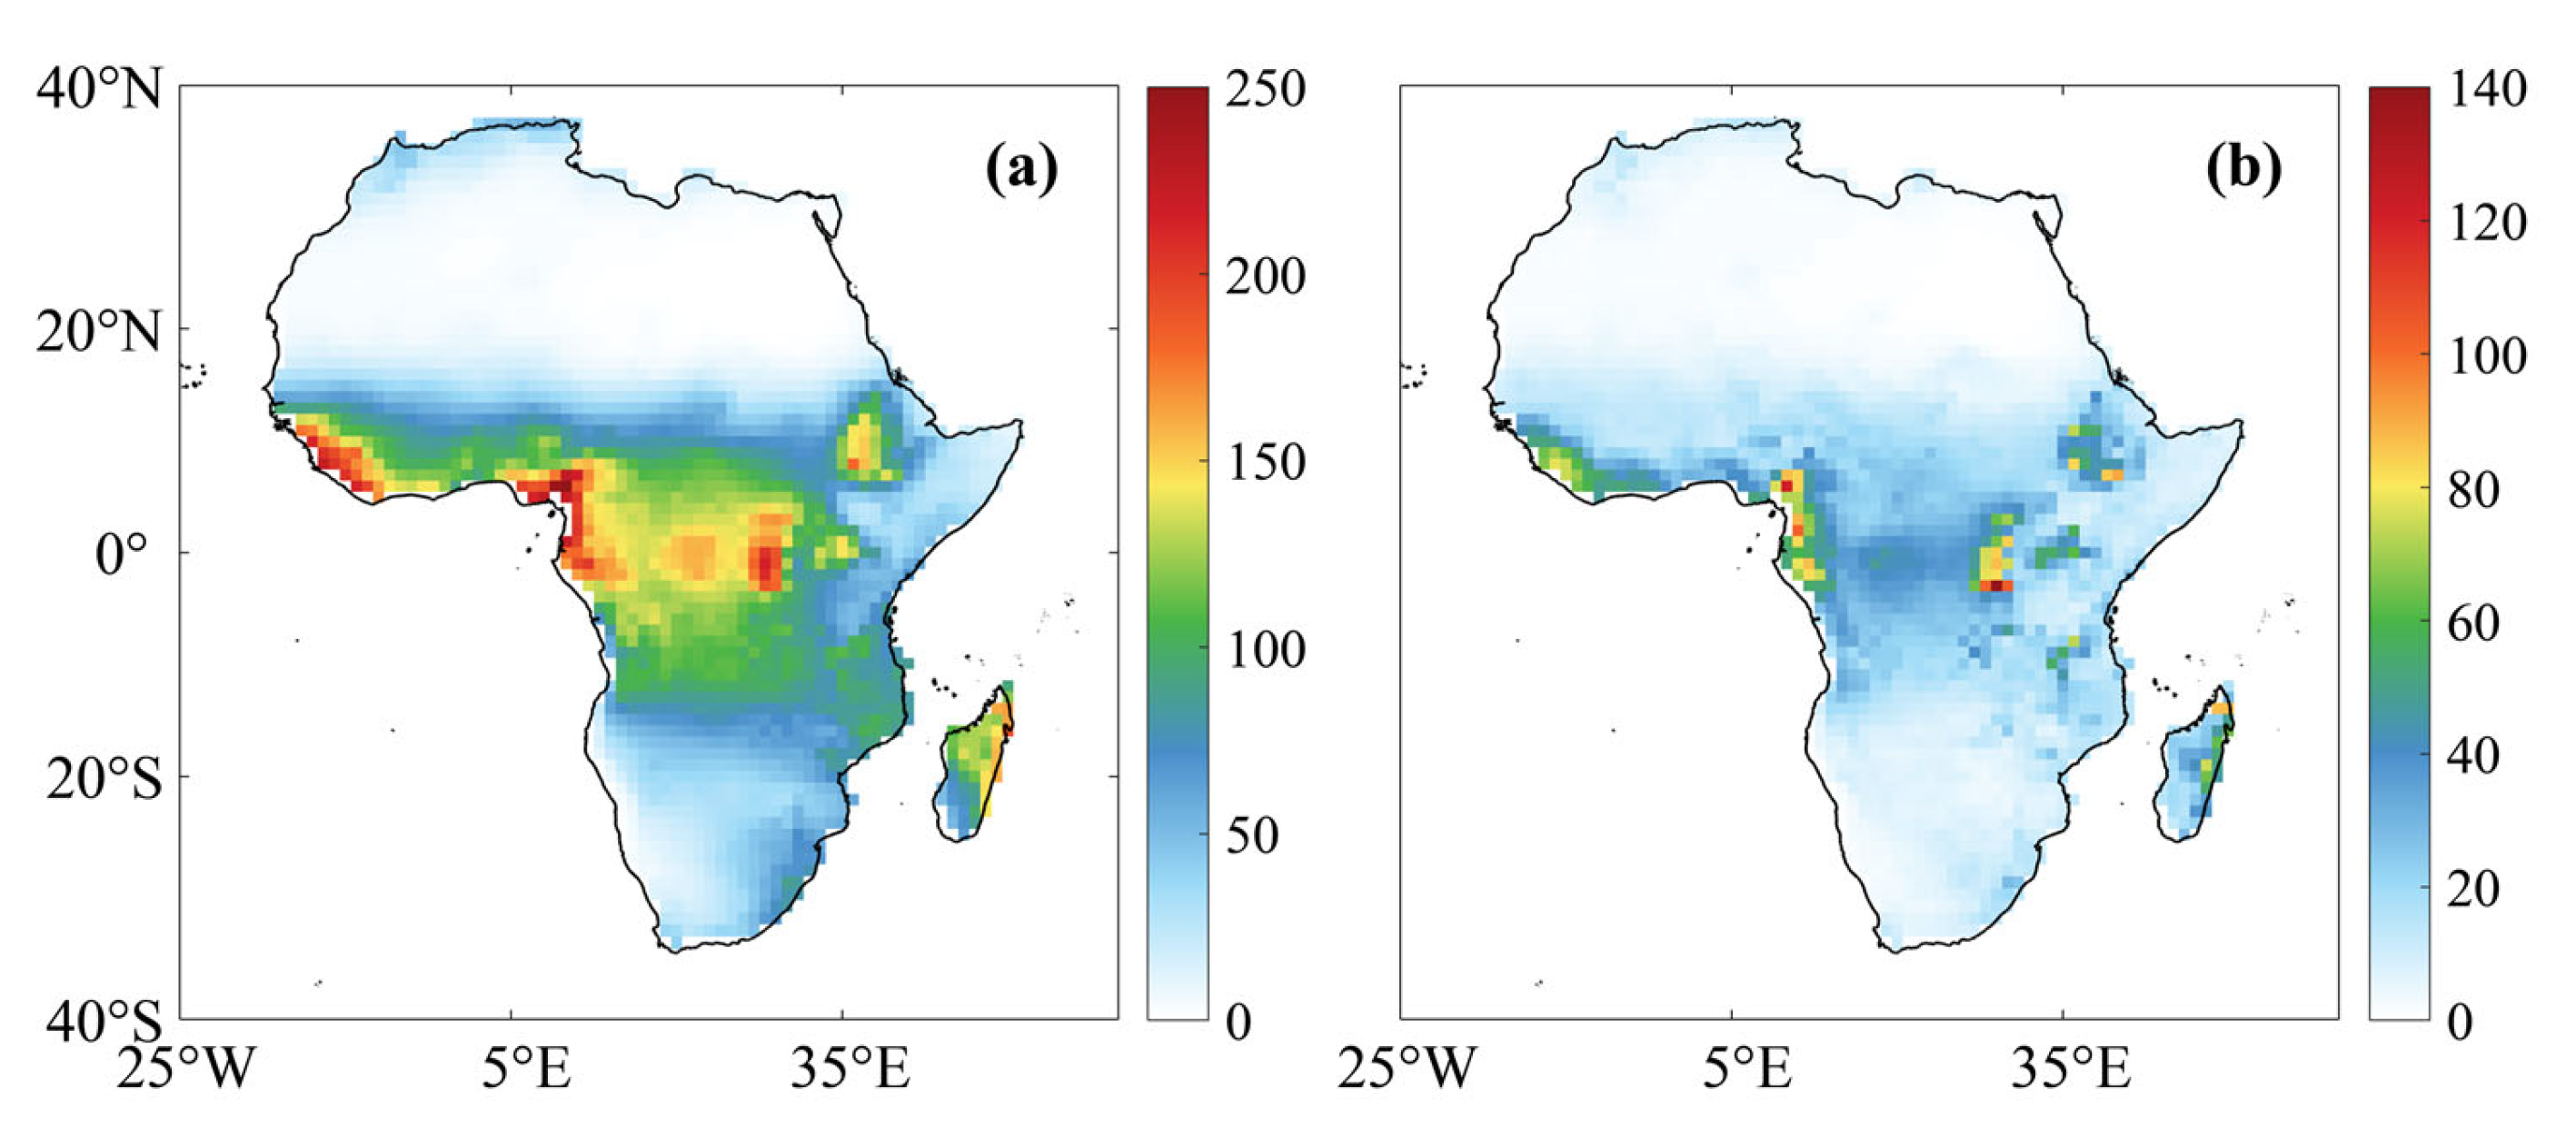
Figure 1.
Spatial distribution of SPI-3 ensemble mean over Africa during 1983–2014 from the gauge-based, satellite-based, and reanalysis data for different drought categories. (a) All; (b) moderate; (c) severe; and (d) extreme drought. The demarcations in (a) delineate the climate subregions of Africa. Note that the colour bars have different ranges.
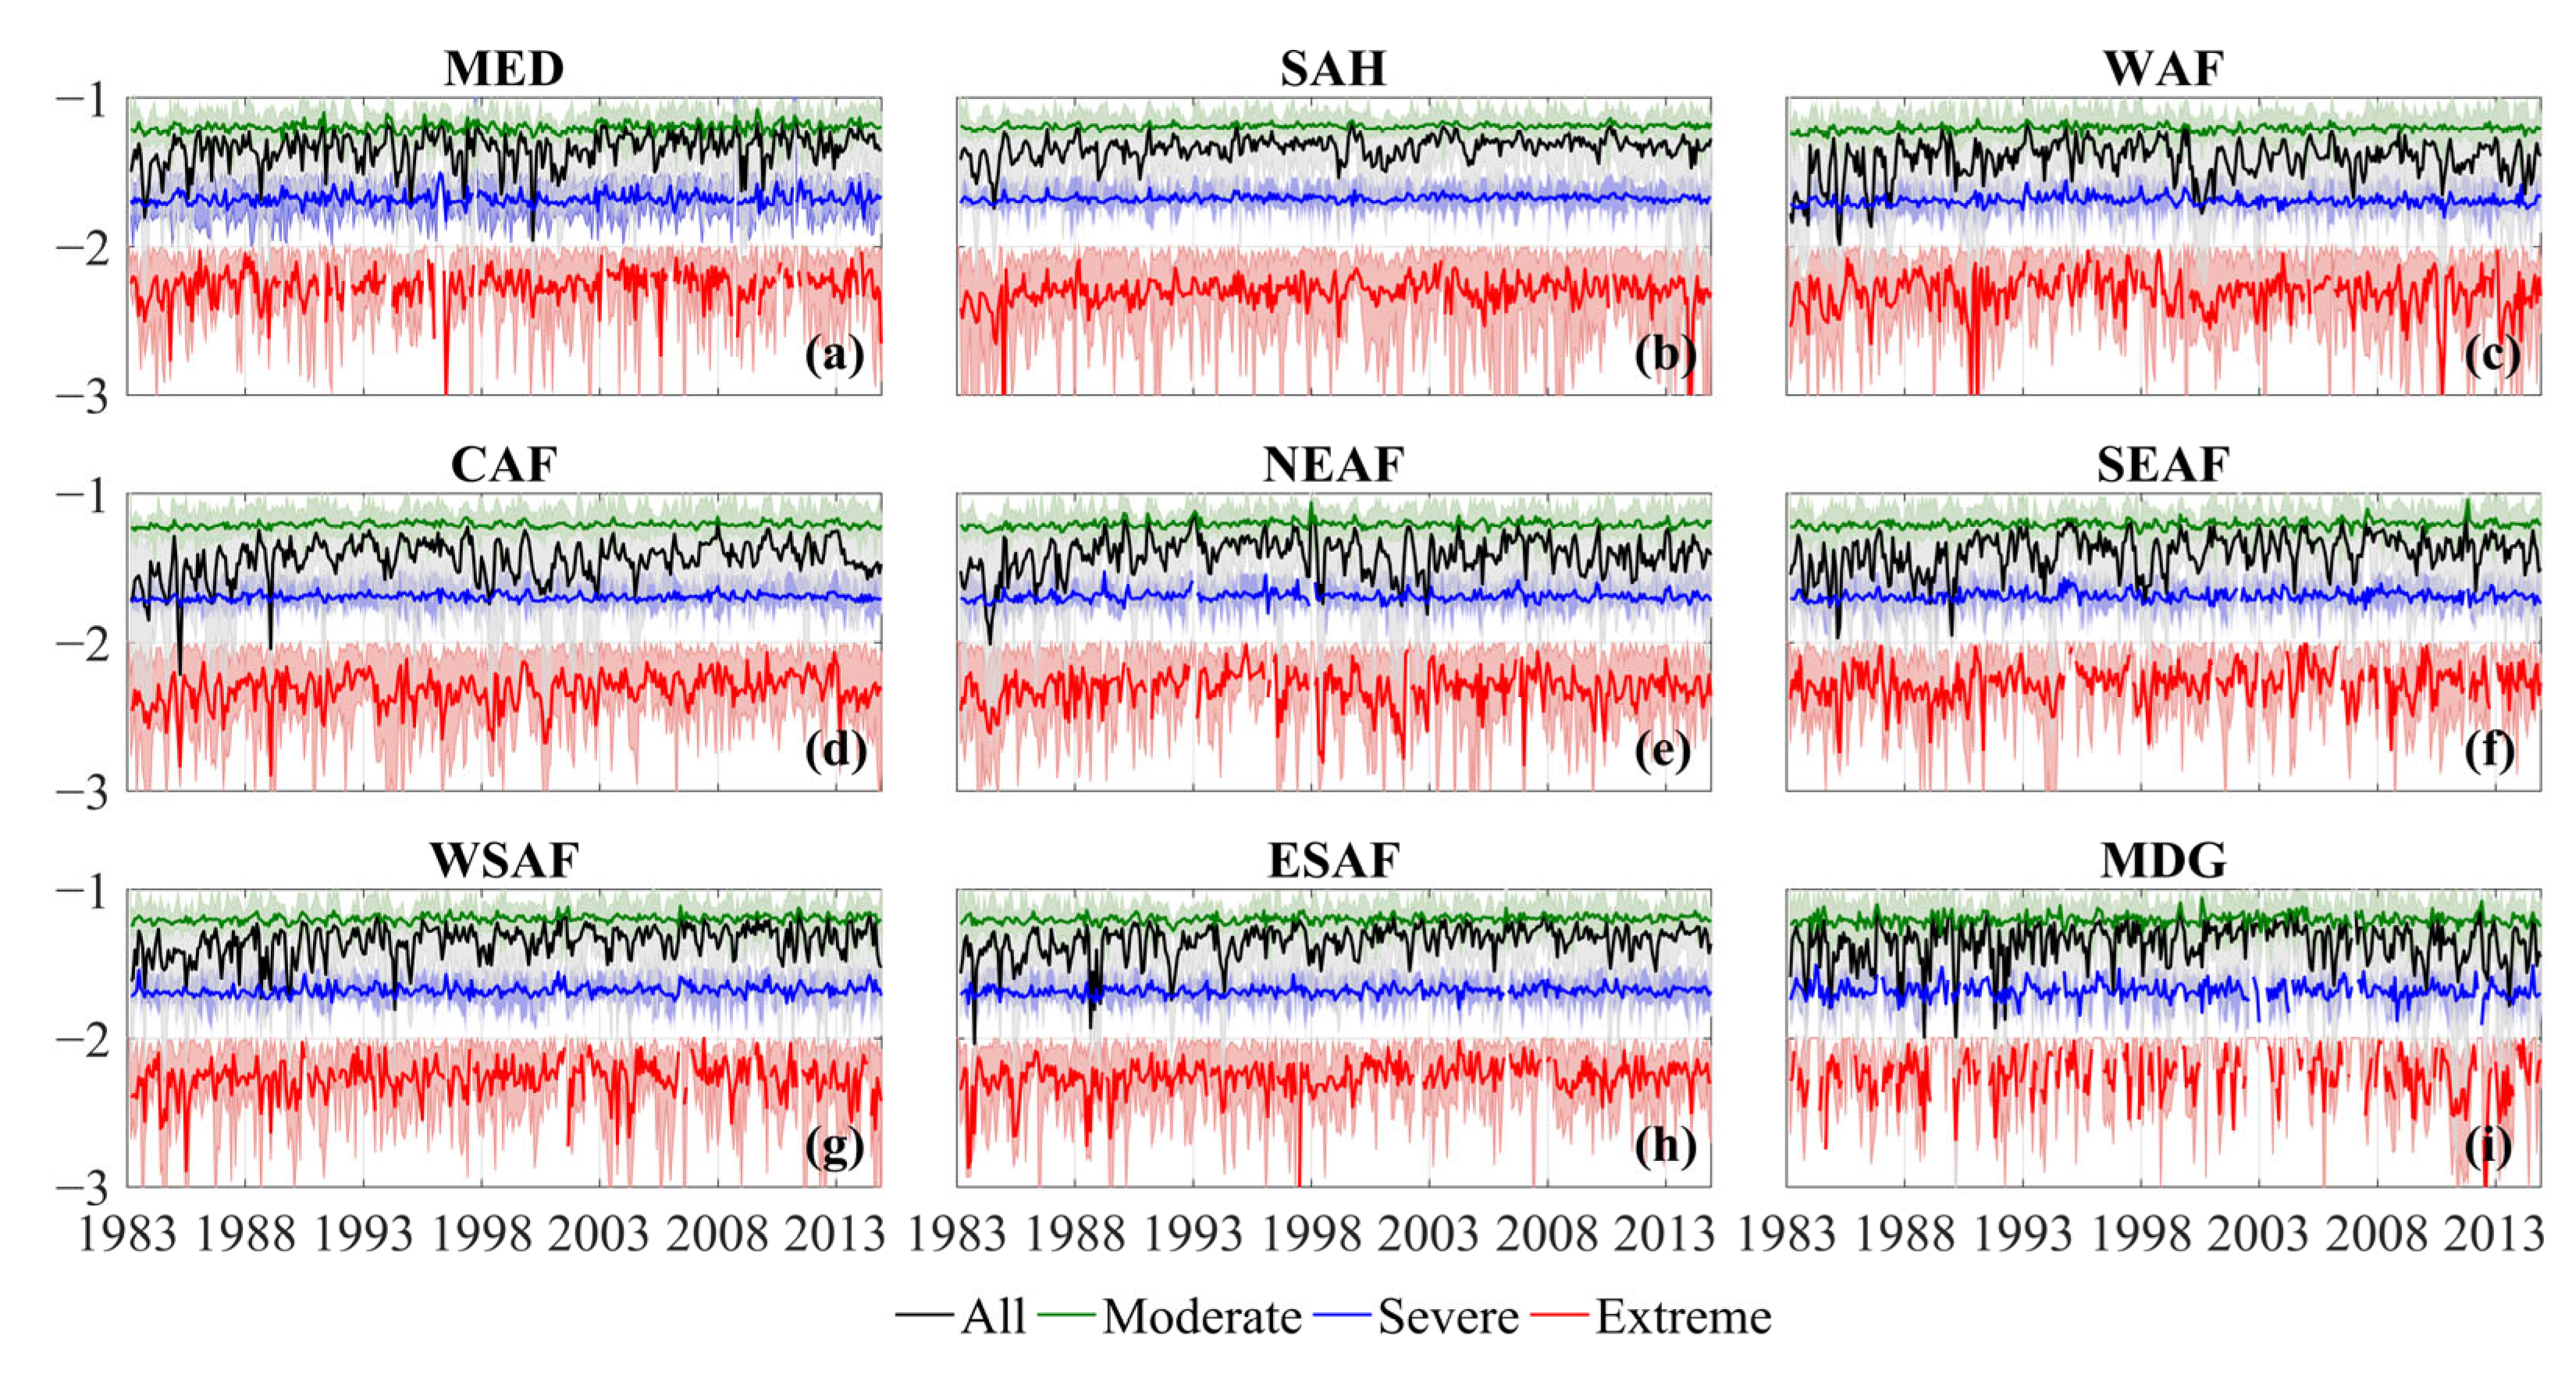
Figure 2.
Interannual variability of drought from the ensemble mean of SPI-3 over the subregions of Africa during 1983–2014. (a) MED; (b) SAH; (c) WAF; (d) CAF; (e) NEAF; (f) SEAF; (g) WSAF; (h) ESAF; and (i) MDG. Black, red, blue, and green represent all, moderate, severe, and extreme drought months, respectively. The shadings are the maximum and minimum SPI values from the individual datasets.
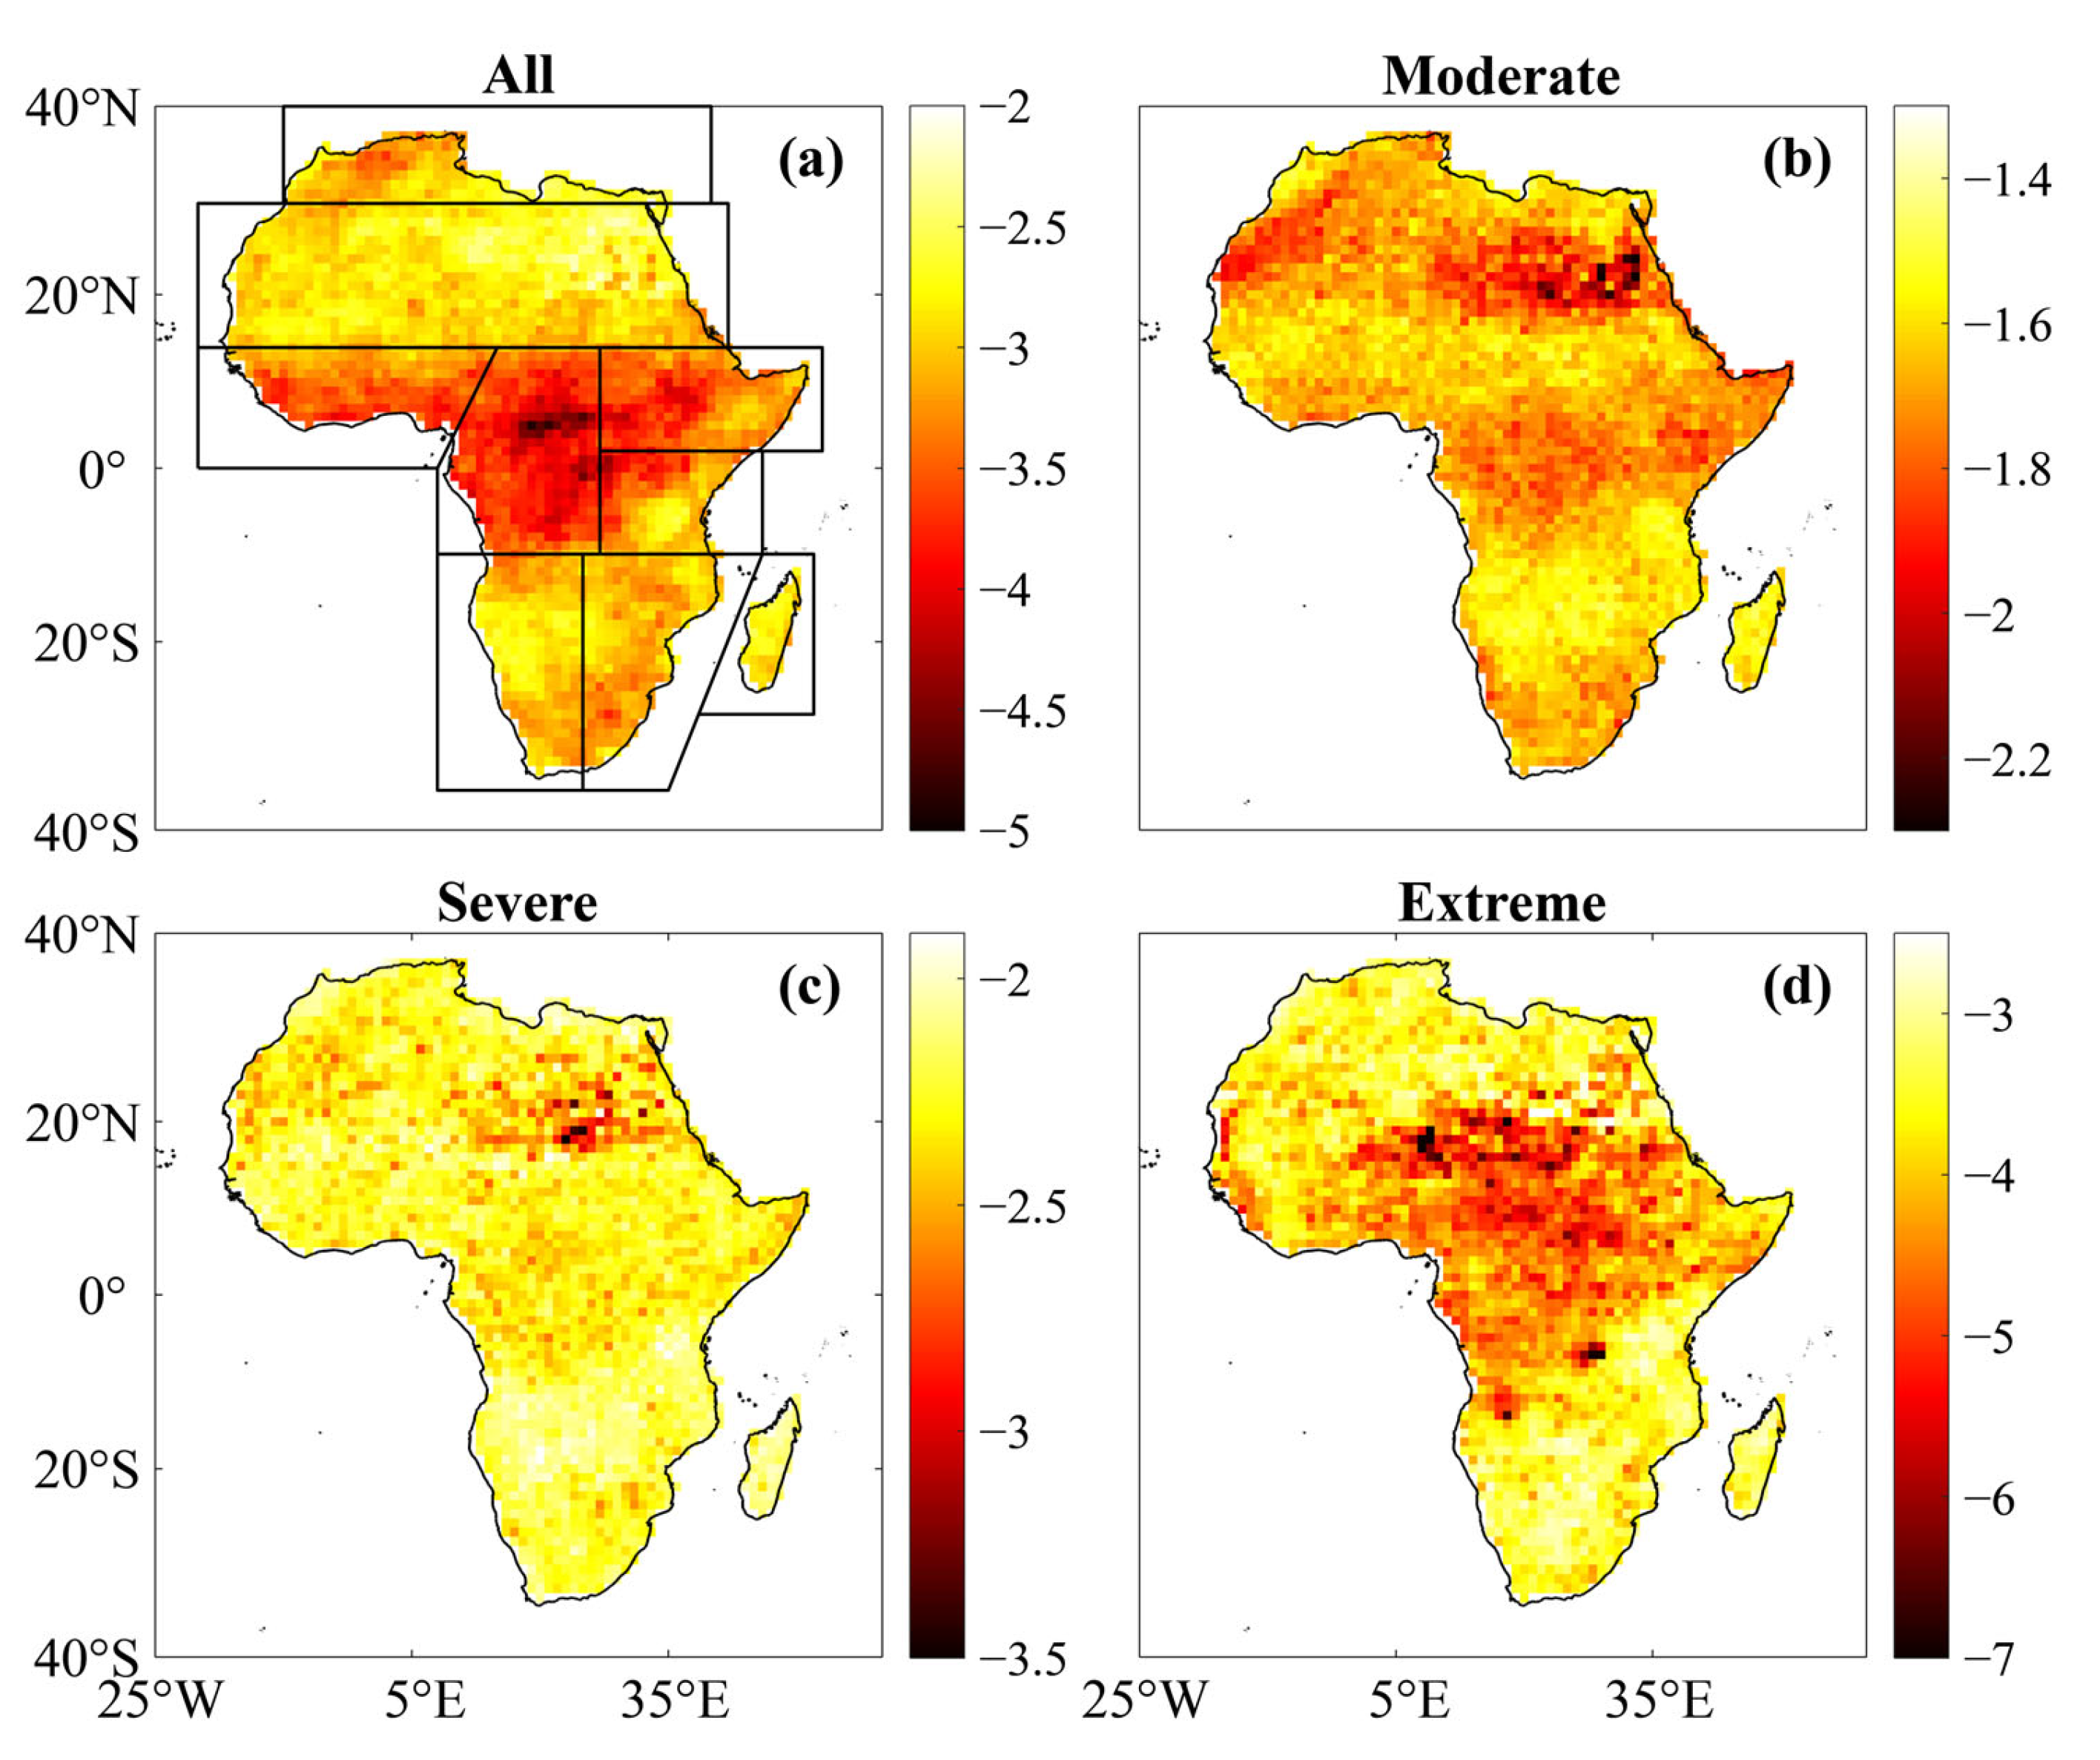
Figure 3.
Spatial distribution of drought duration (months) over Africa during 1983–2014 averaged from the gauge-based, satellite-based, and reanalysis data for different drought categories. (a) All; (b) moderate; (c) severe; and (d) extreme drought. The demarcations in (a) delineate the climate subregions of Africa.
Figure 4.
Spatial distribution of drought events over Africa during 1983–2014 averaged from the gauge-based, satellite-based, and reanalysis data for different drought categories. (a) All; (b) moderate; (c) severe; and (d) extreme drought. The demarcations in (a) delineate the climate subregions of Africa.
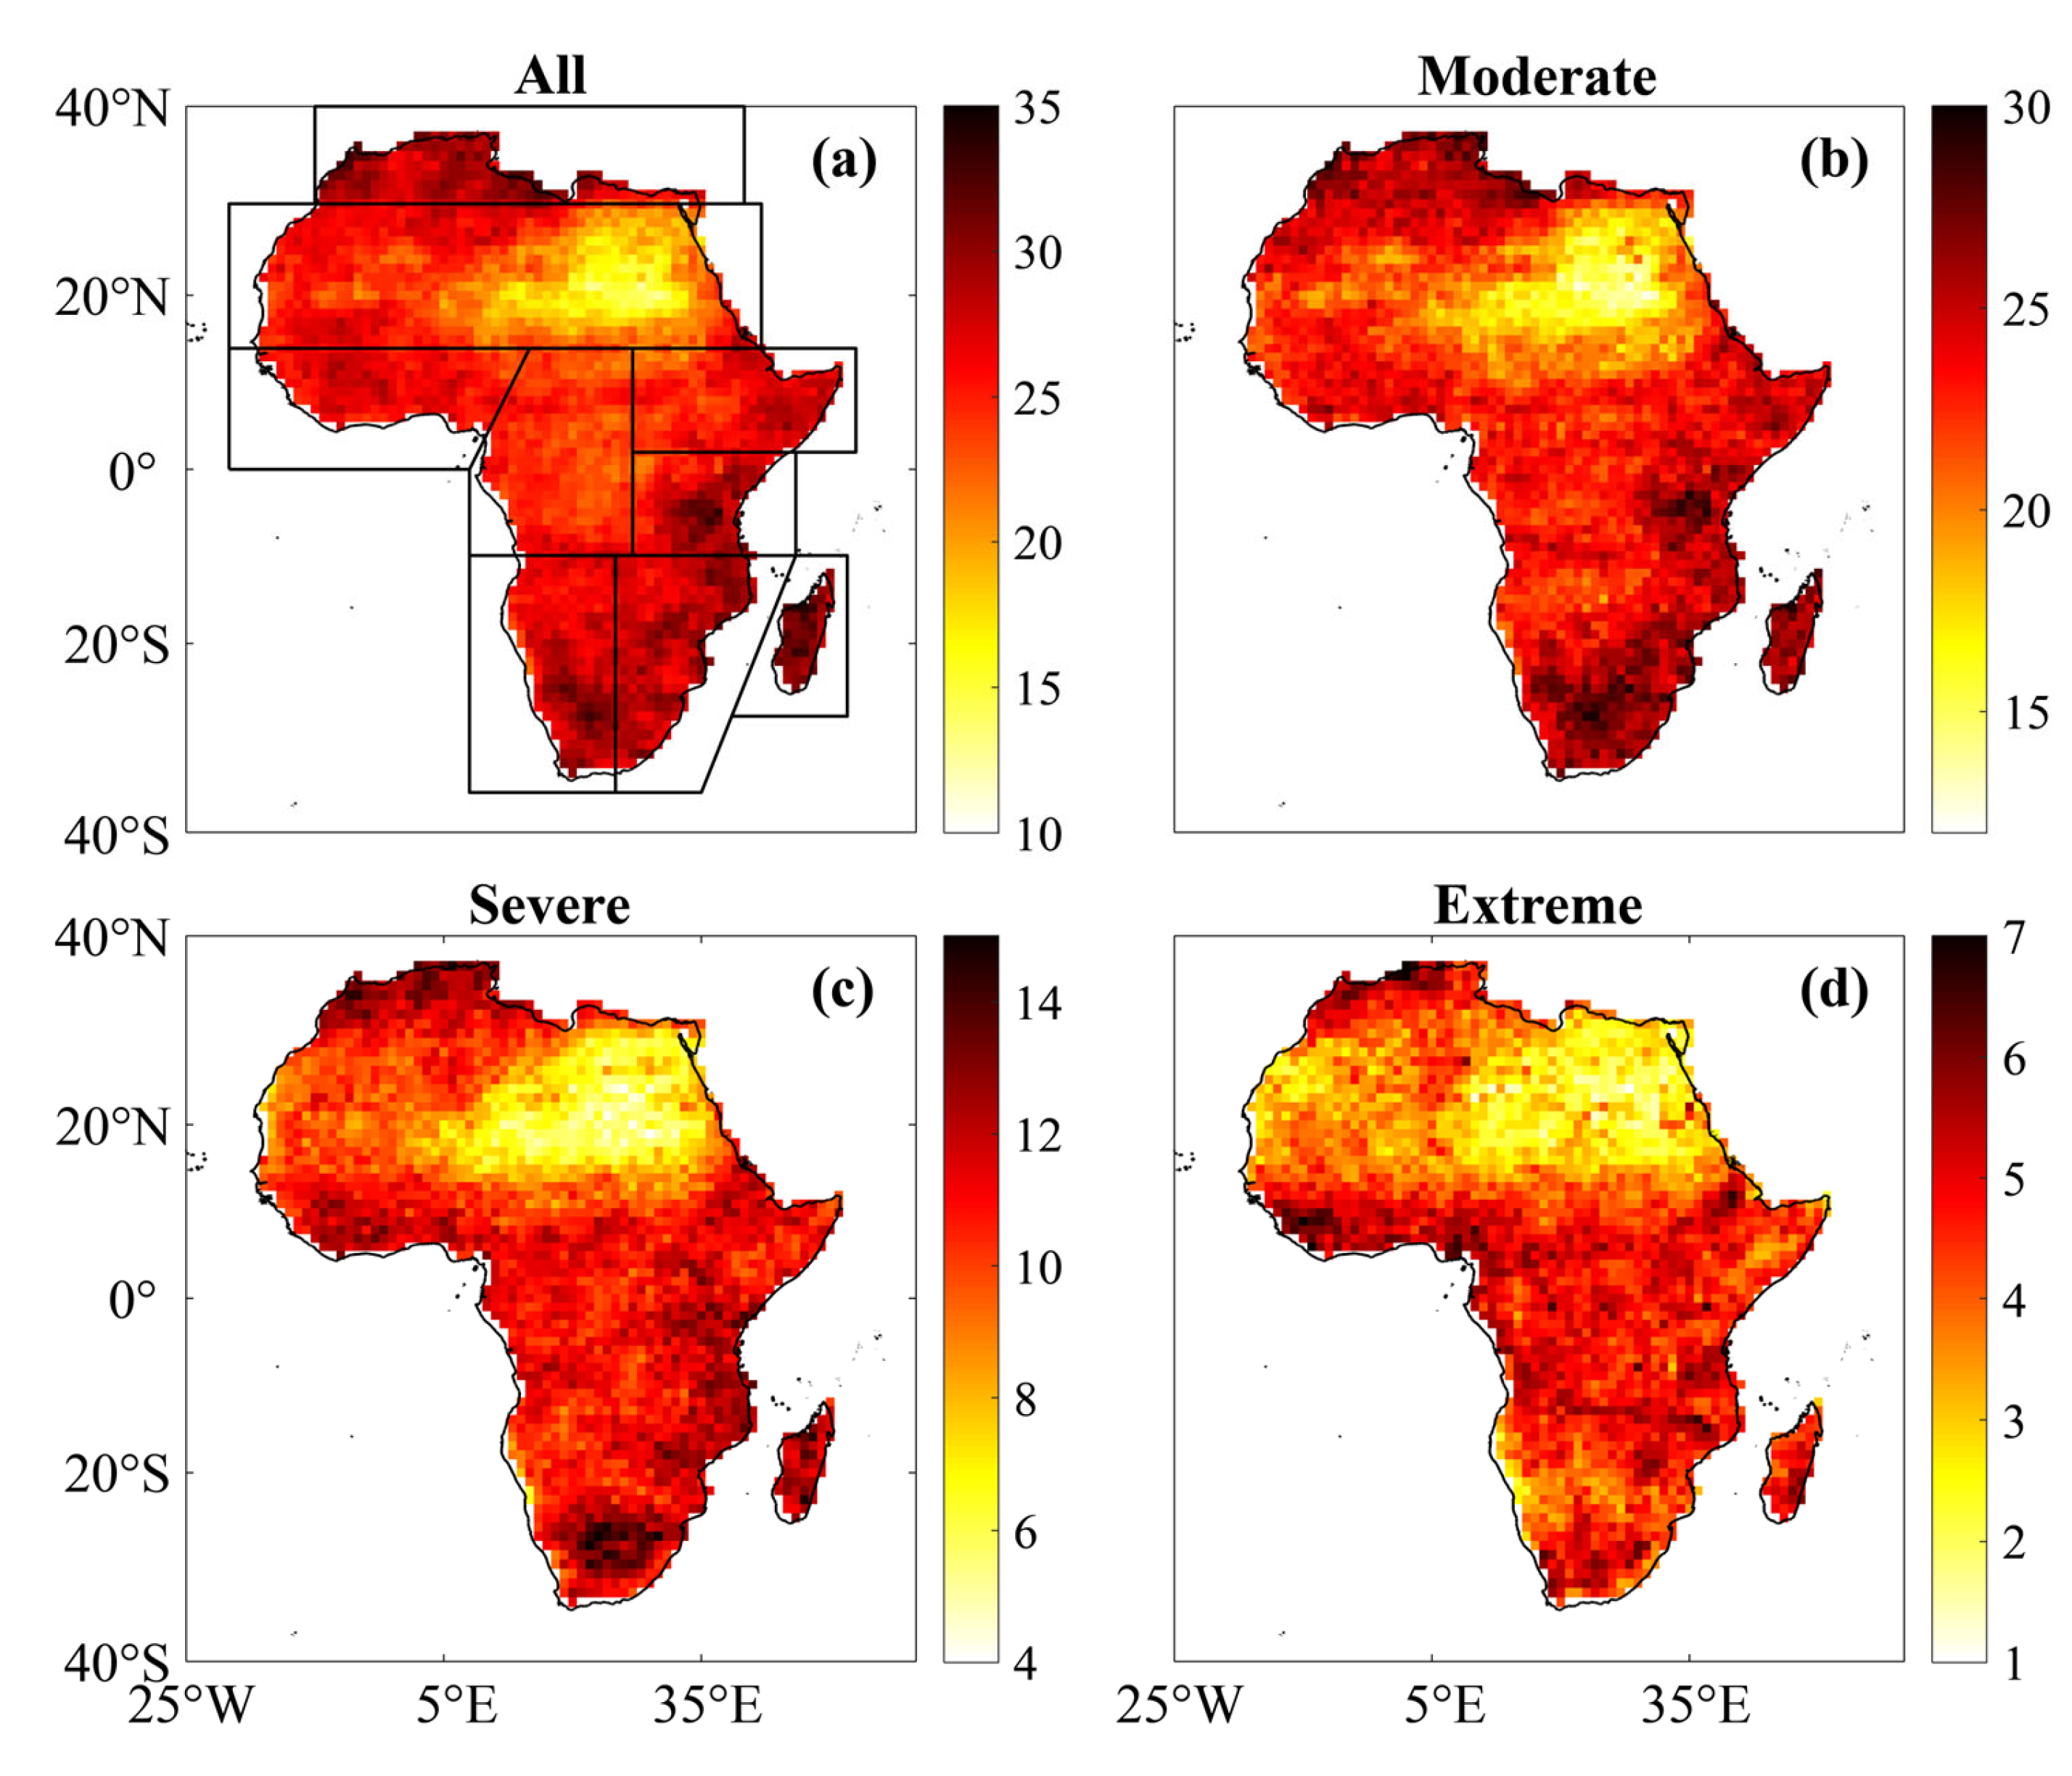
Figure 5.
Spatial distribution of drought frequency (%) over Africa during 1983–2014 averaged from the gauge-based, satellite-based, and reanalysis data for different drought categories. (a) All; (b) moderate; (c) severe; and (d) extreme drought. The demarcations in (a) delineate the climate subregions of Africa.
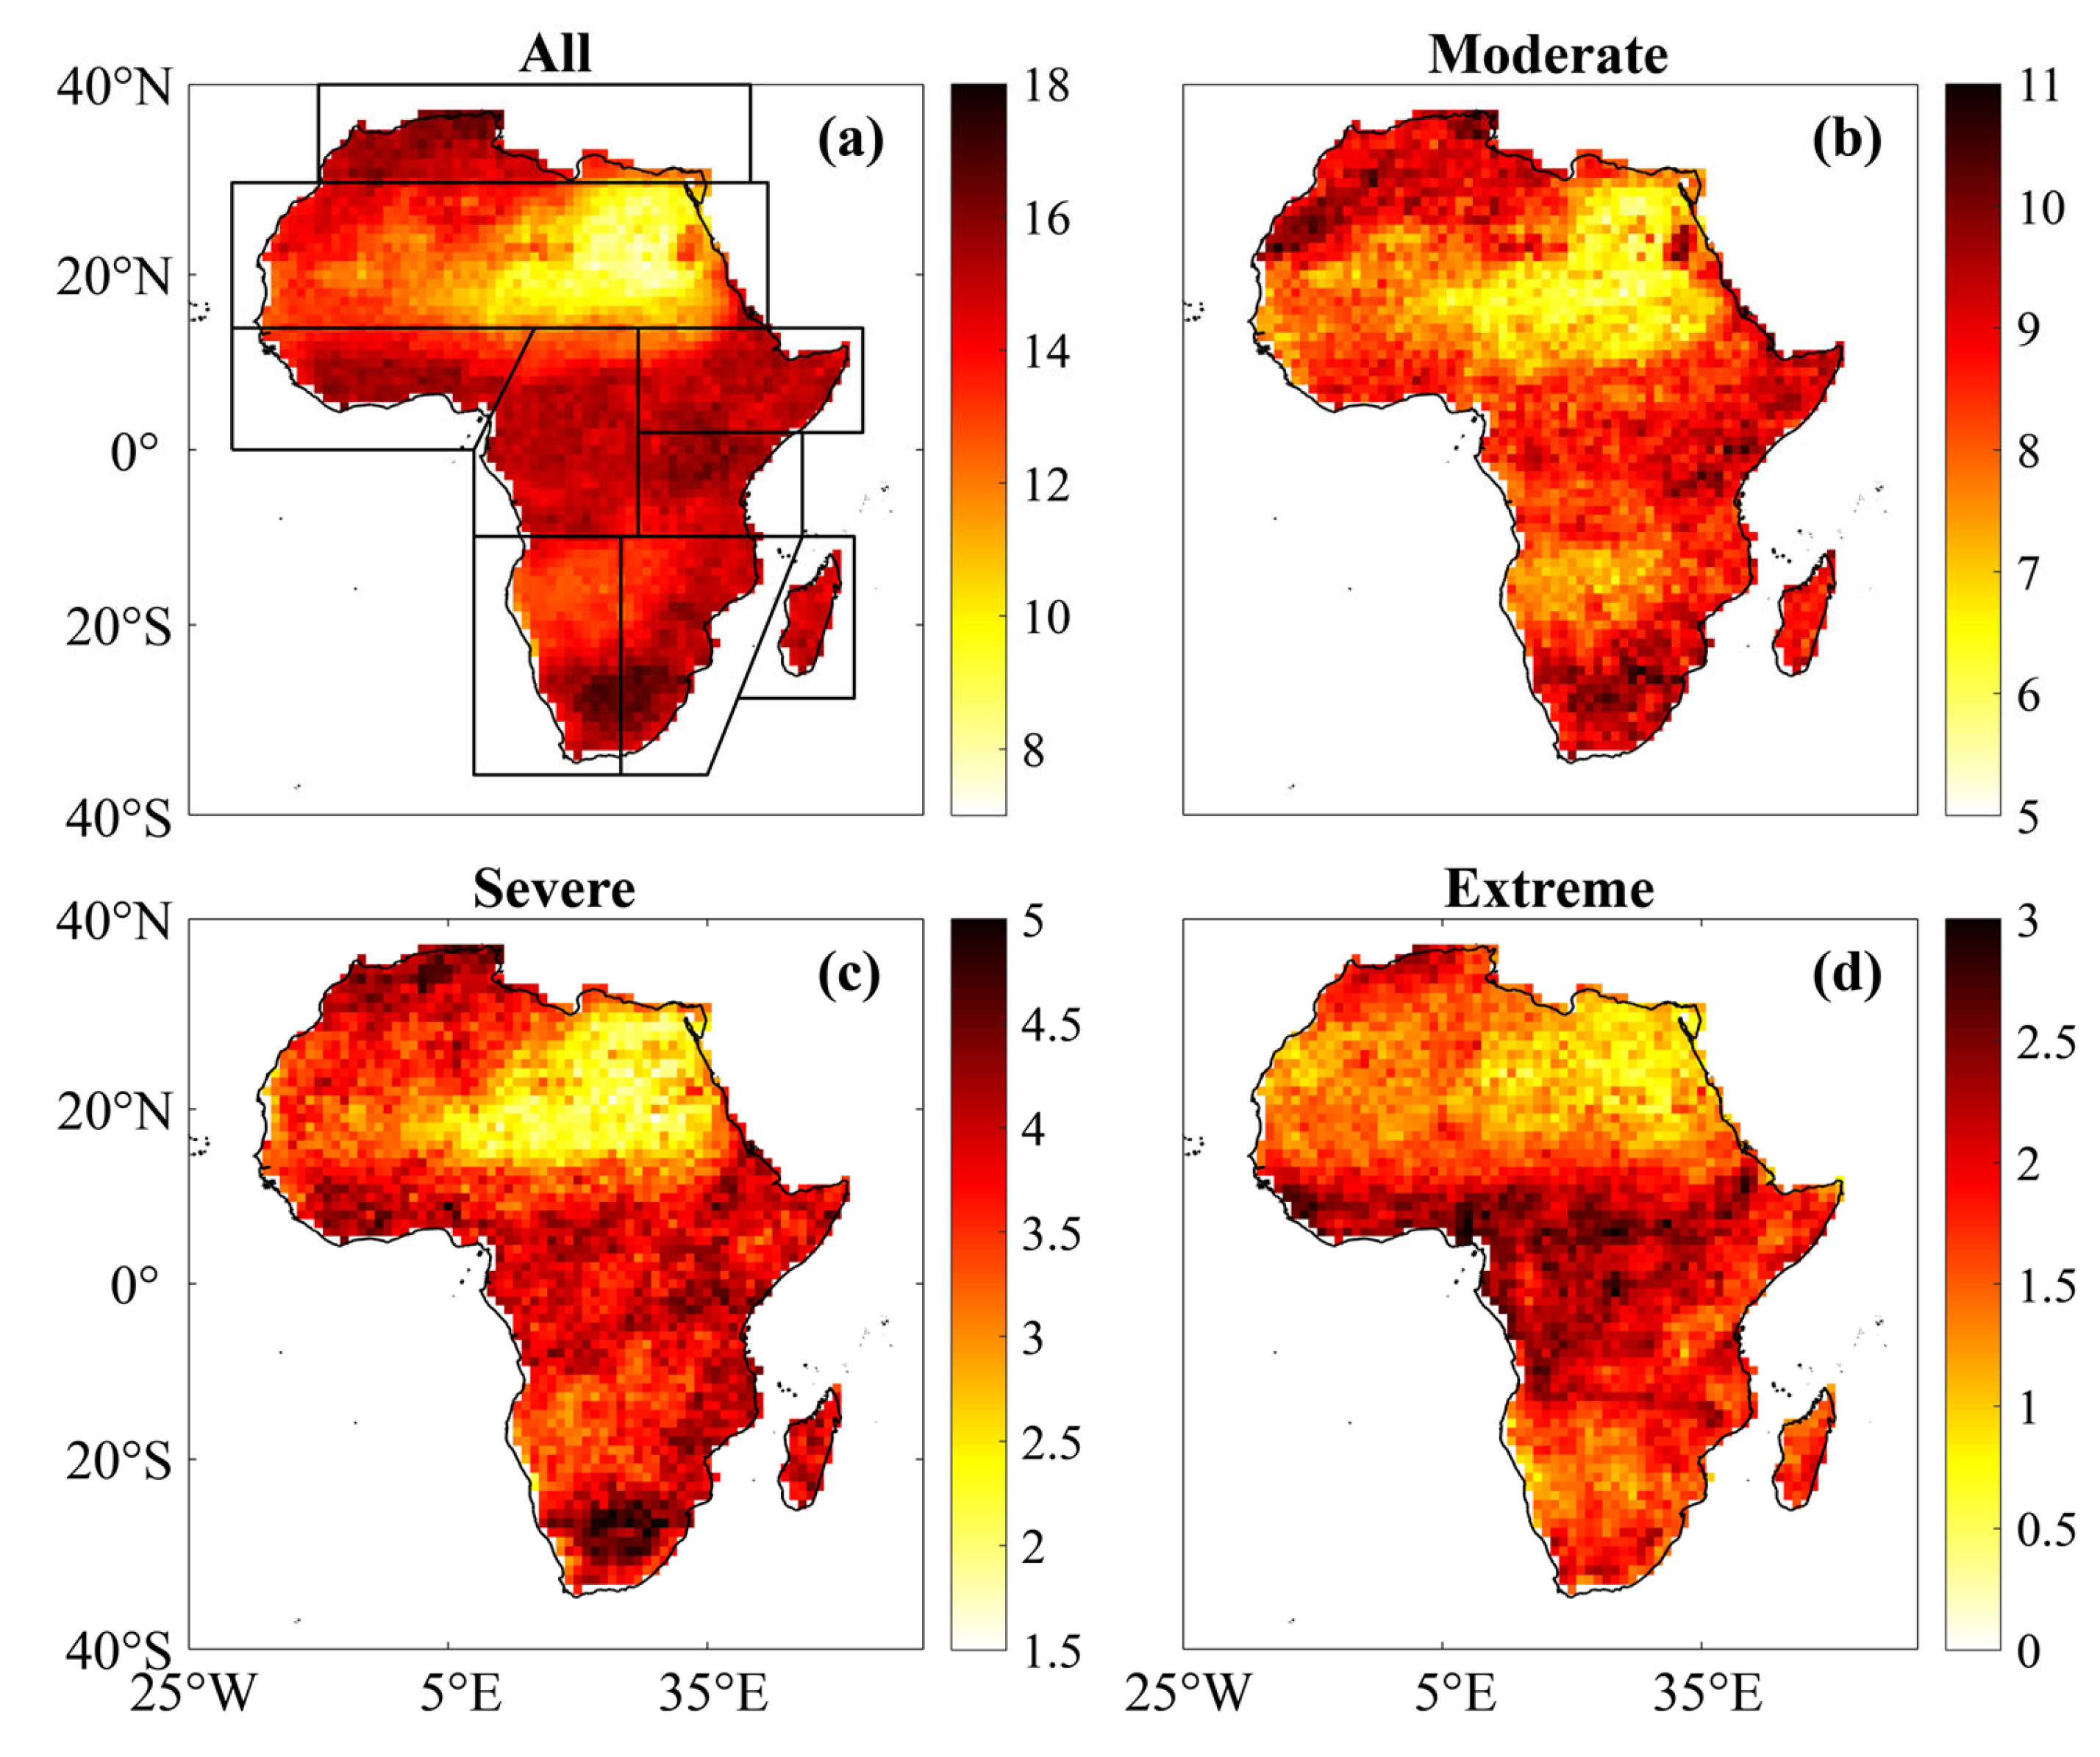
Figure 6.
Spatial distribution of drought intensity over Africa during 1983–2014 averaged from the gauge-based, satellite-based, and reanalysis data for different drought categories. (a) All; (b) moderate; (c) severe; and (d) extreme drought. The demarcations in (a) delineate the climate subregions of Africa.
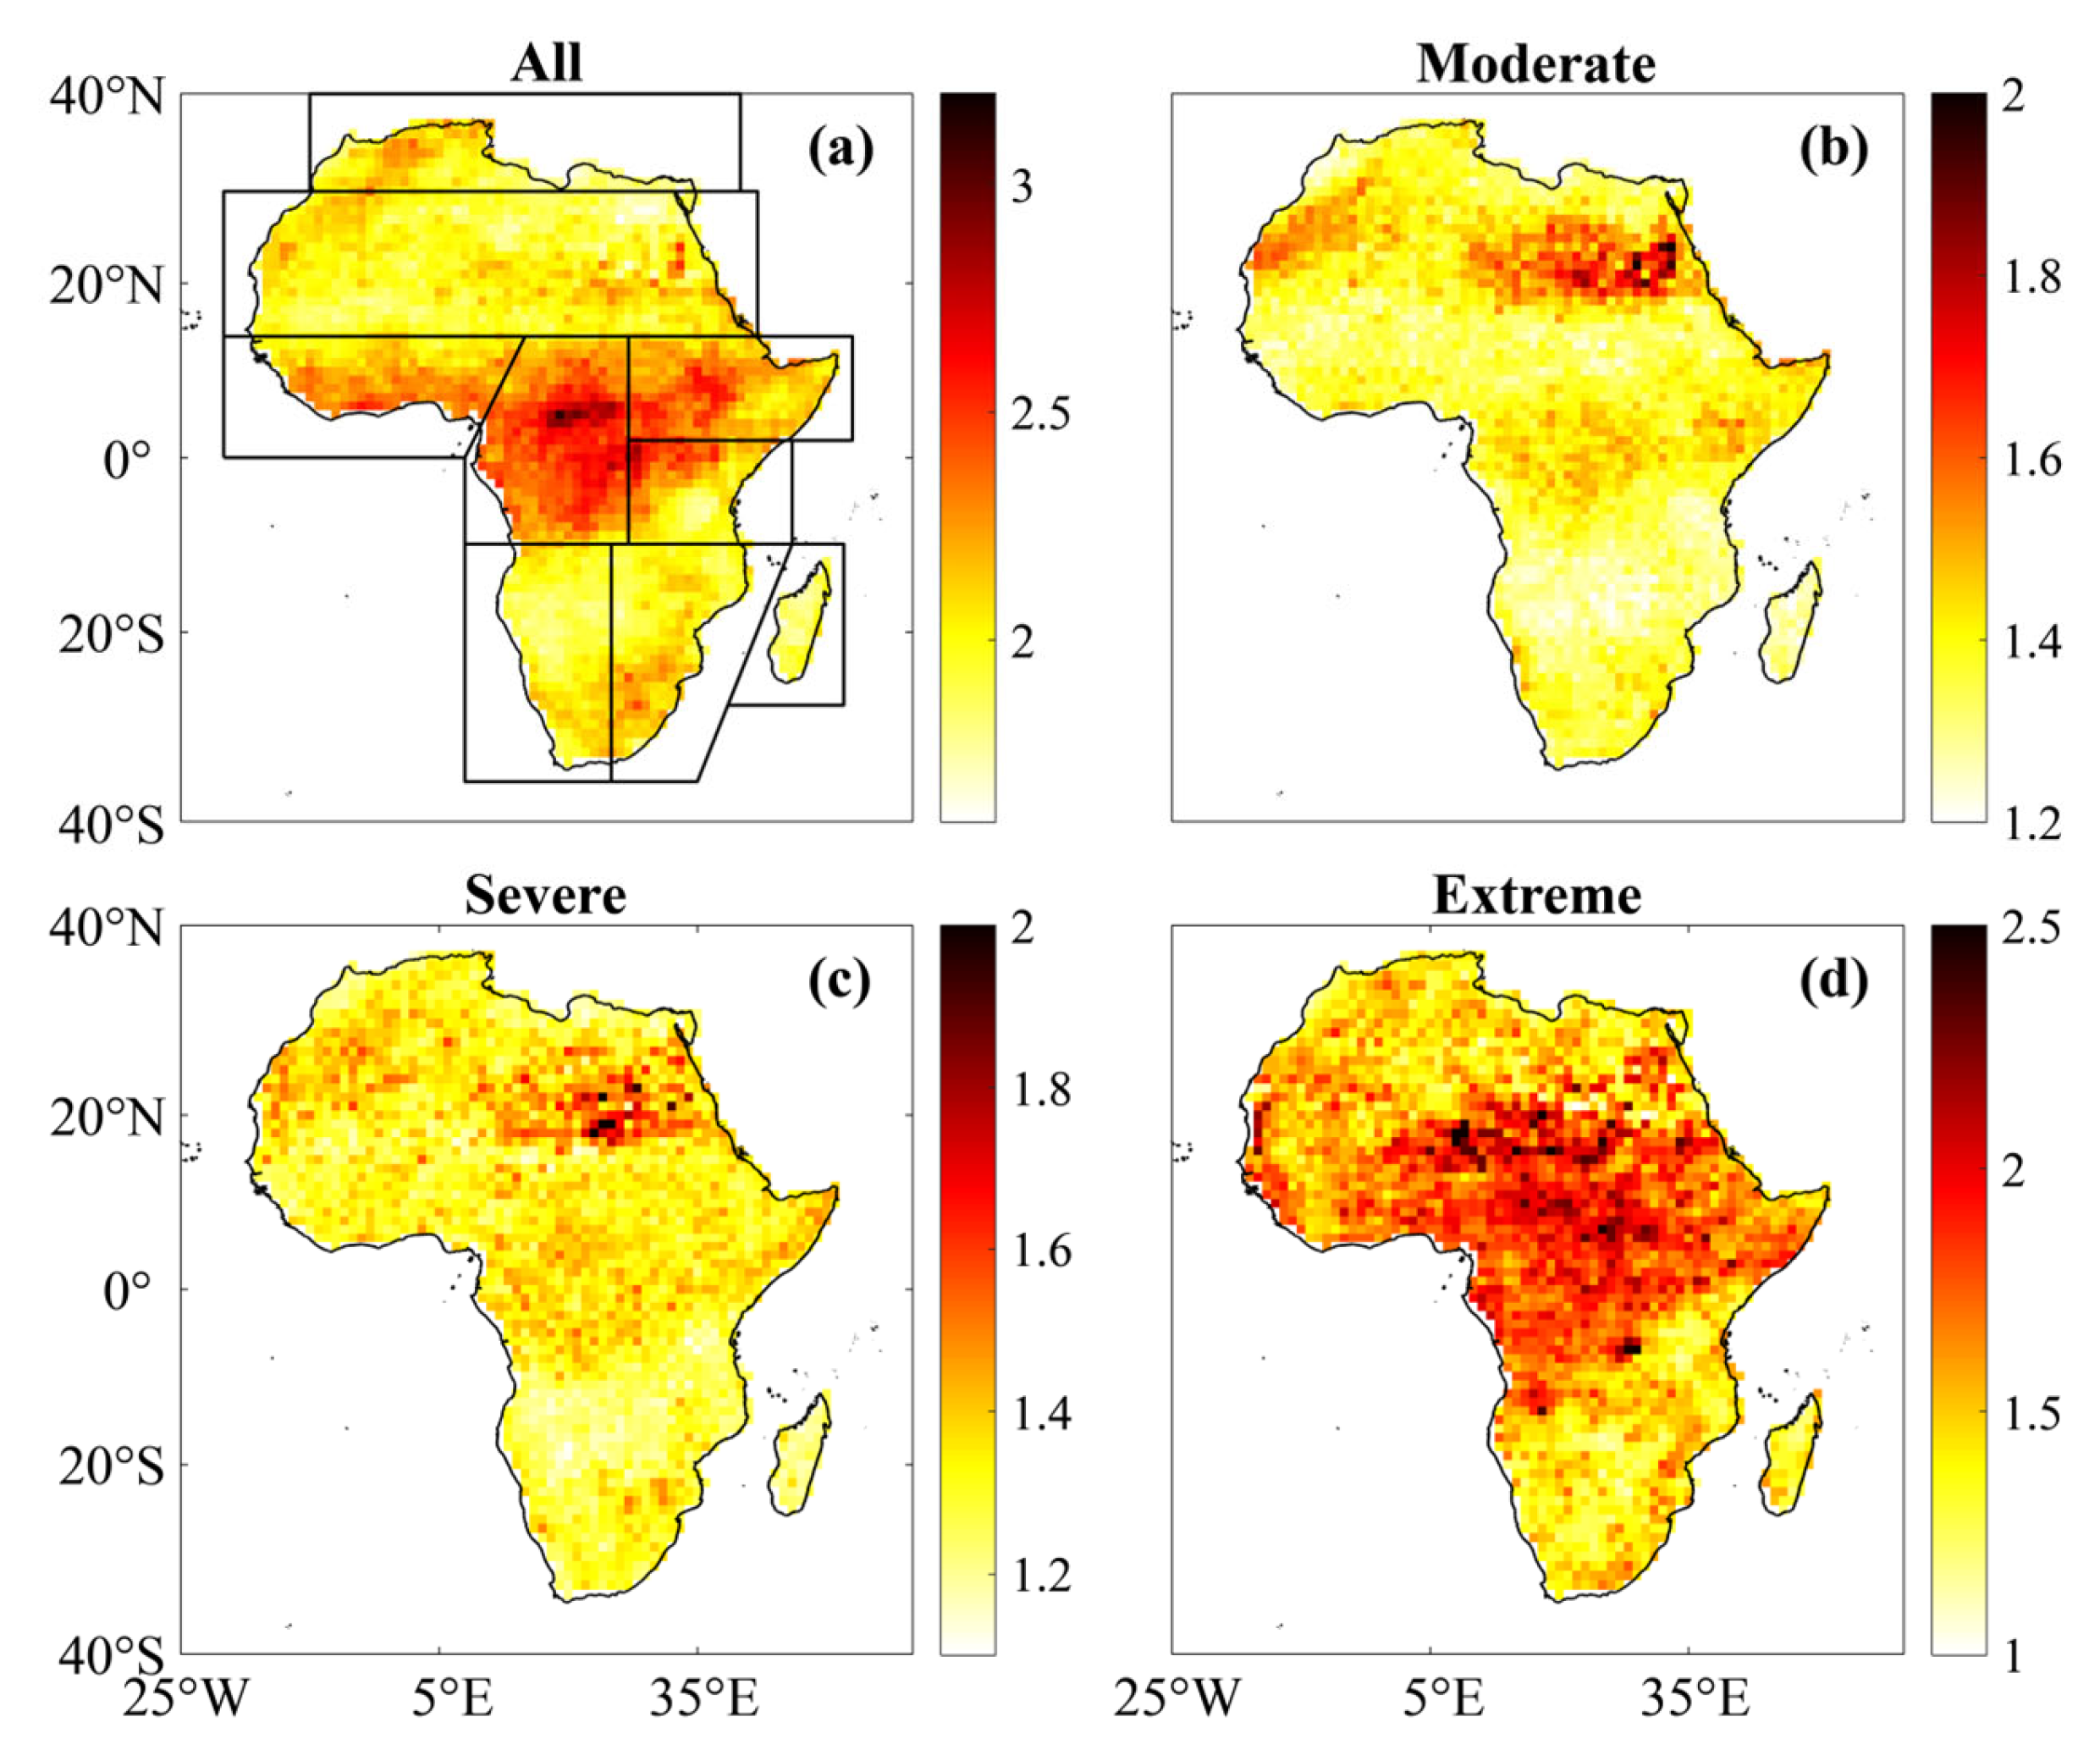
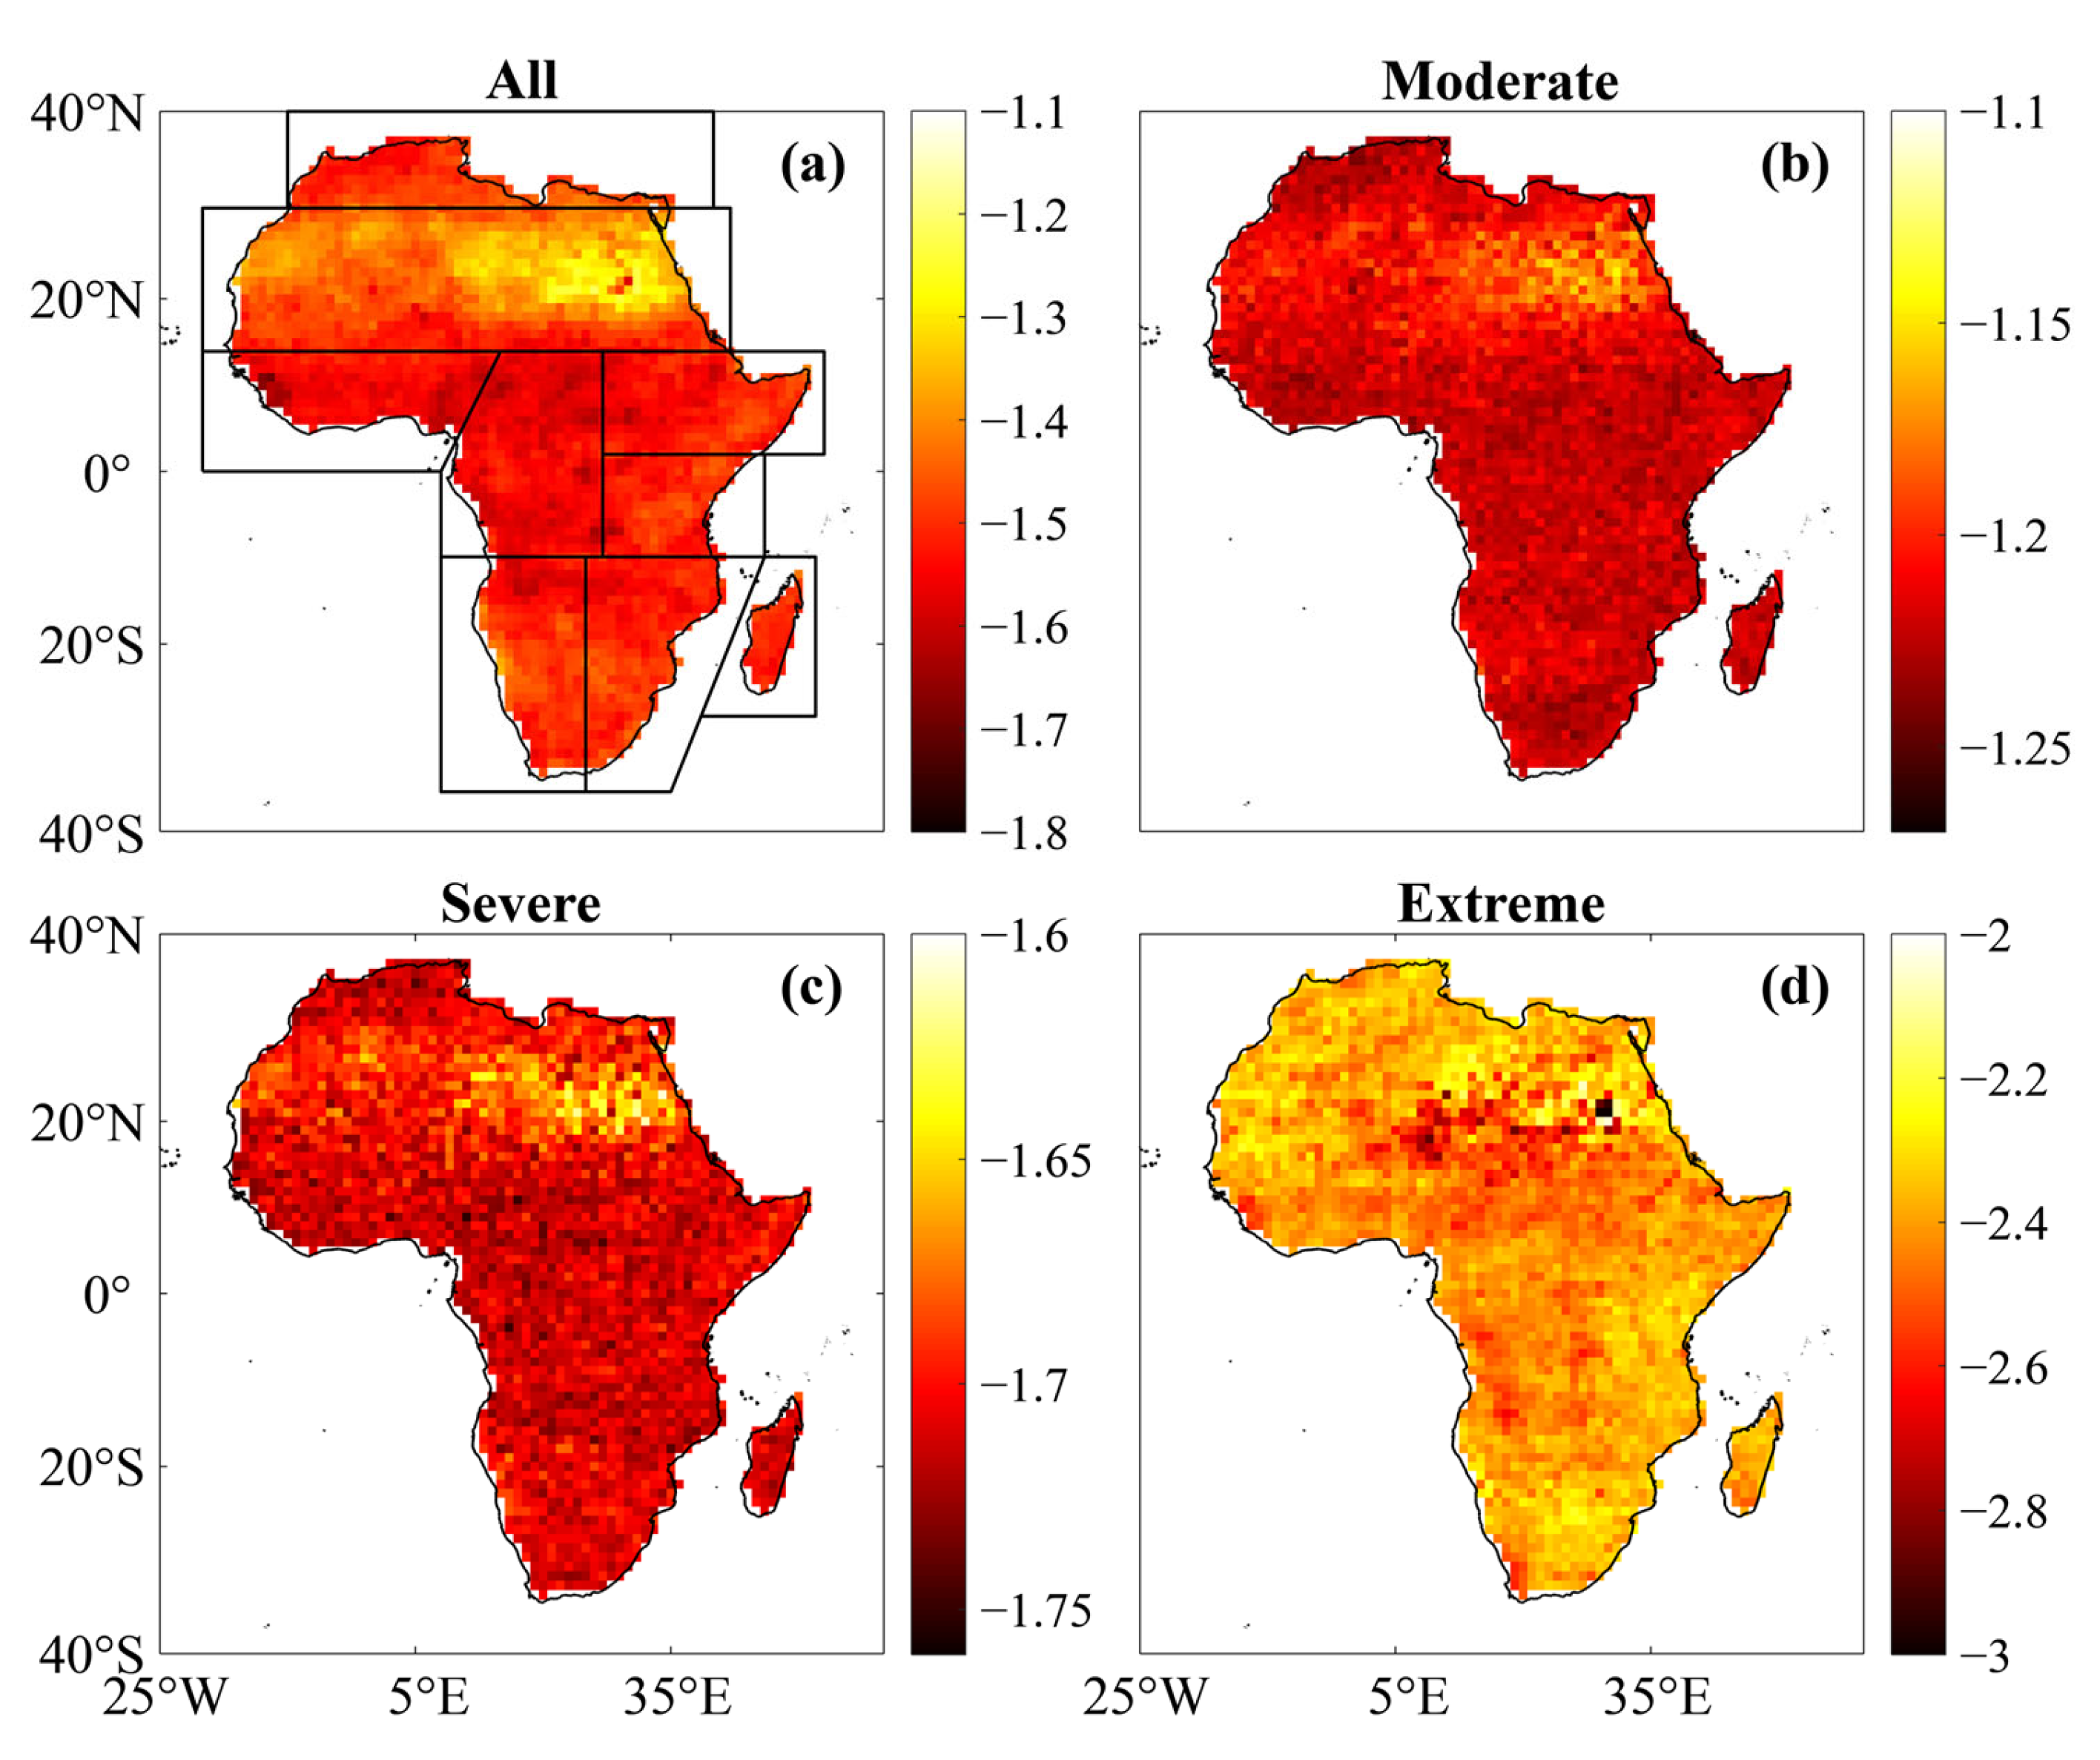
Figure 7.
Spatial distribution of drought severity over Africa during 1983–2014 averaged from the gauge-based, satellite-based, and reanalysis data for different drought categories. (a) All; (b) moderate; (c) severe; and (d) extreme drought. The demarcations in (a) delineate the climate subregions of Africa.
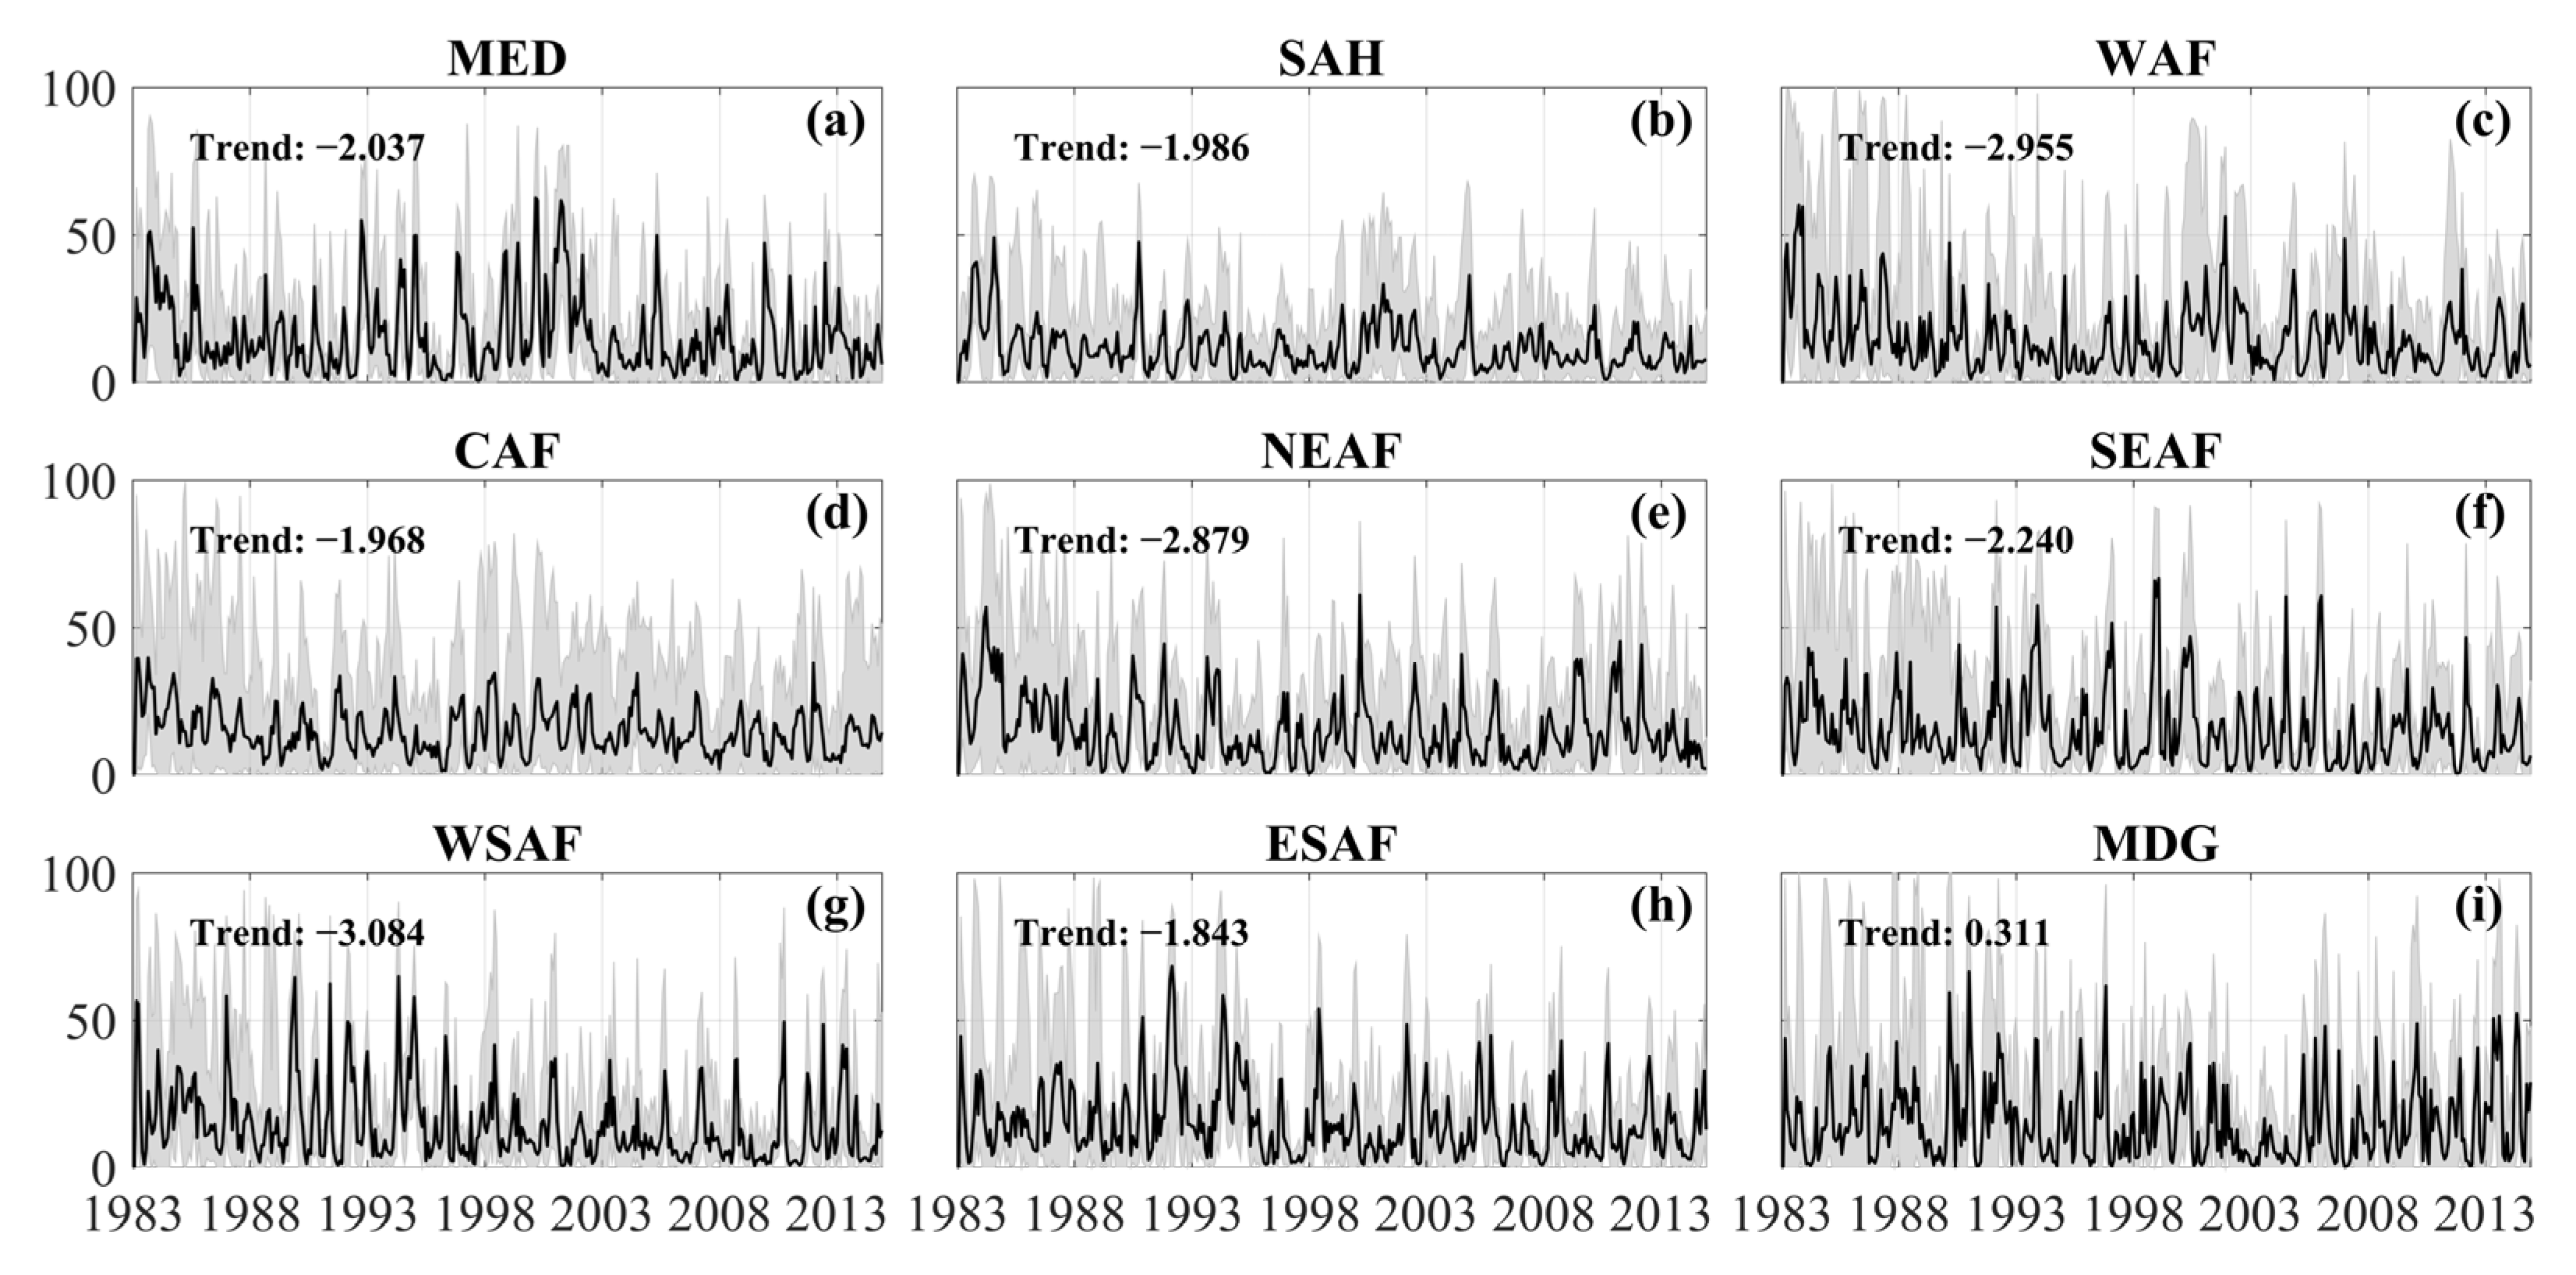
Figure 8.
Percentage of Africa’s subregions experiencing drought months. The black line is the mean of all the datasets and the grey shading shows the uncertainty range using maximum–minimum values from the individual datasets. Trend is the magnitude of linear change (% year–1; scale: ×10–2) calculated using the Theil–Sen slope estimator. (a) MED; (b) SAH; (c) WAF; (d) CAF; (e) NEAF; (f) SEAF; (g) WSAF; (h) ESAF; and (i) MDG.
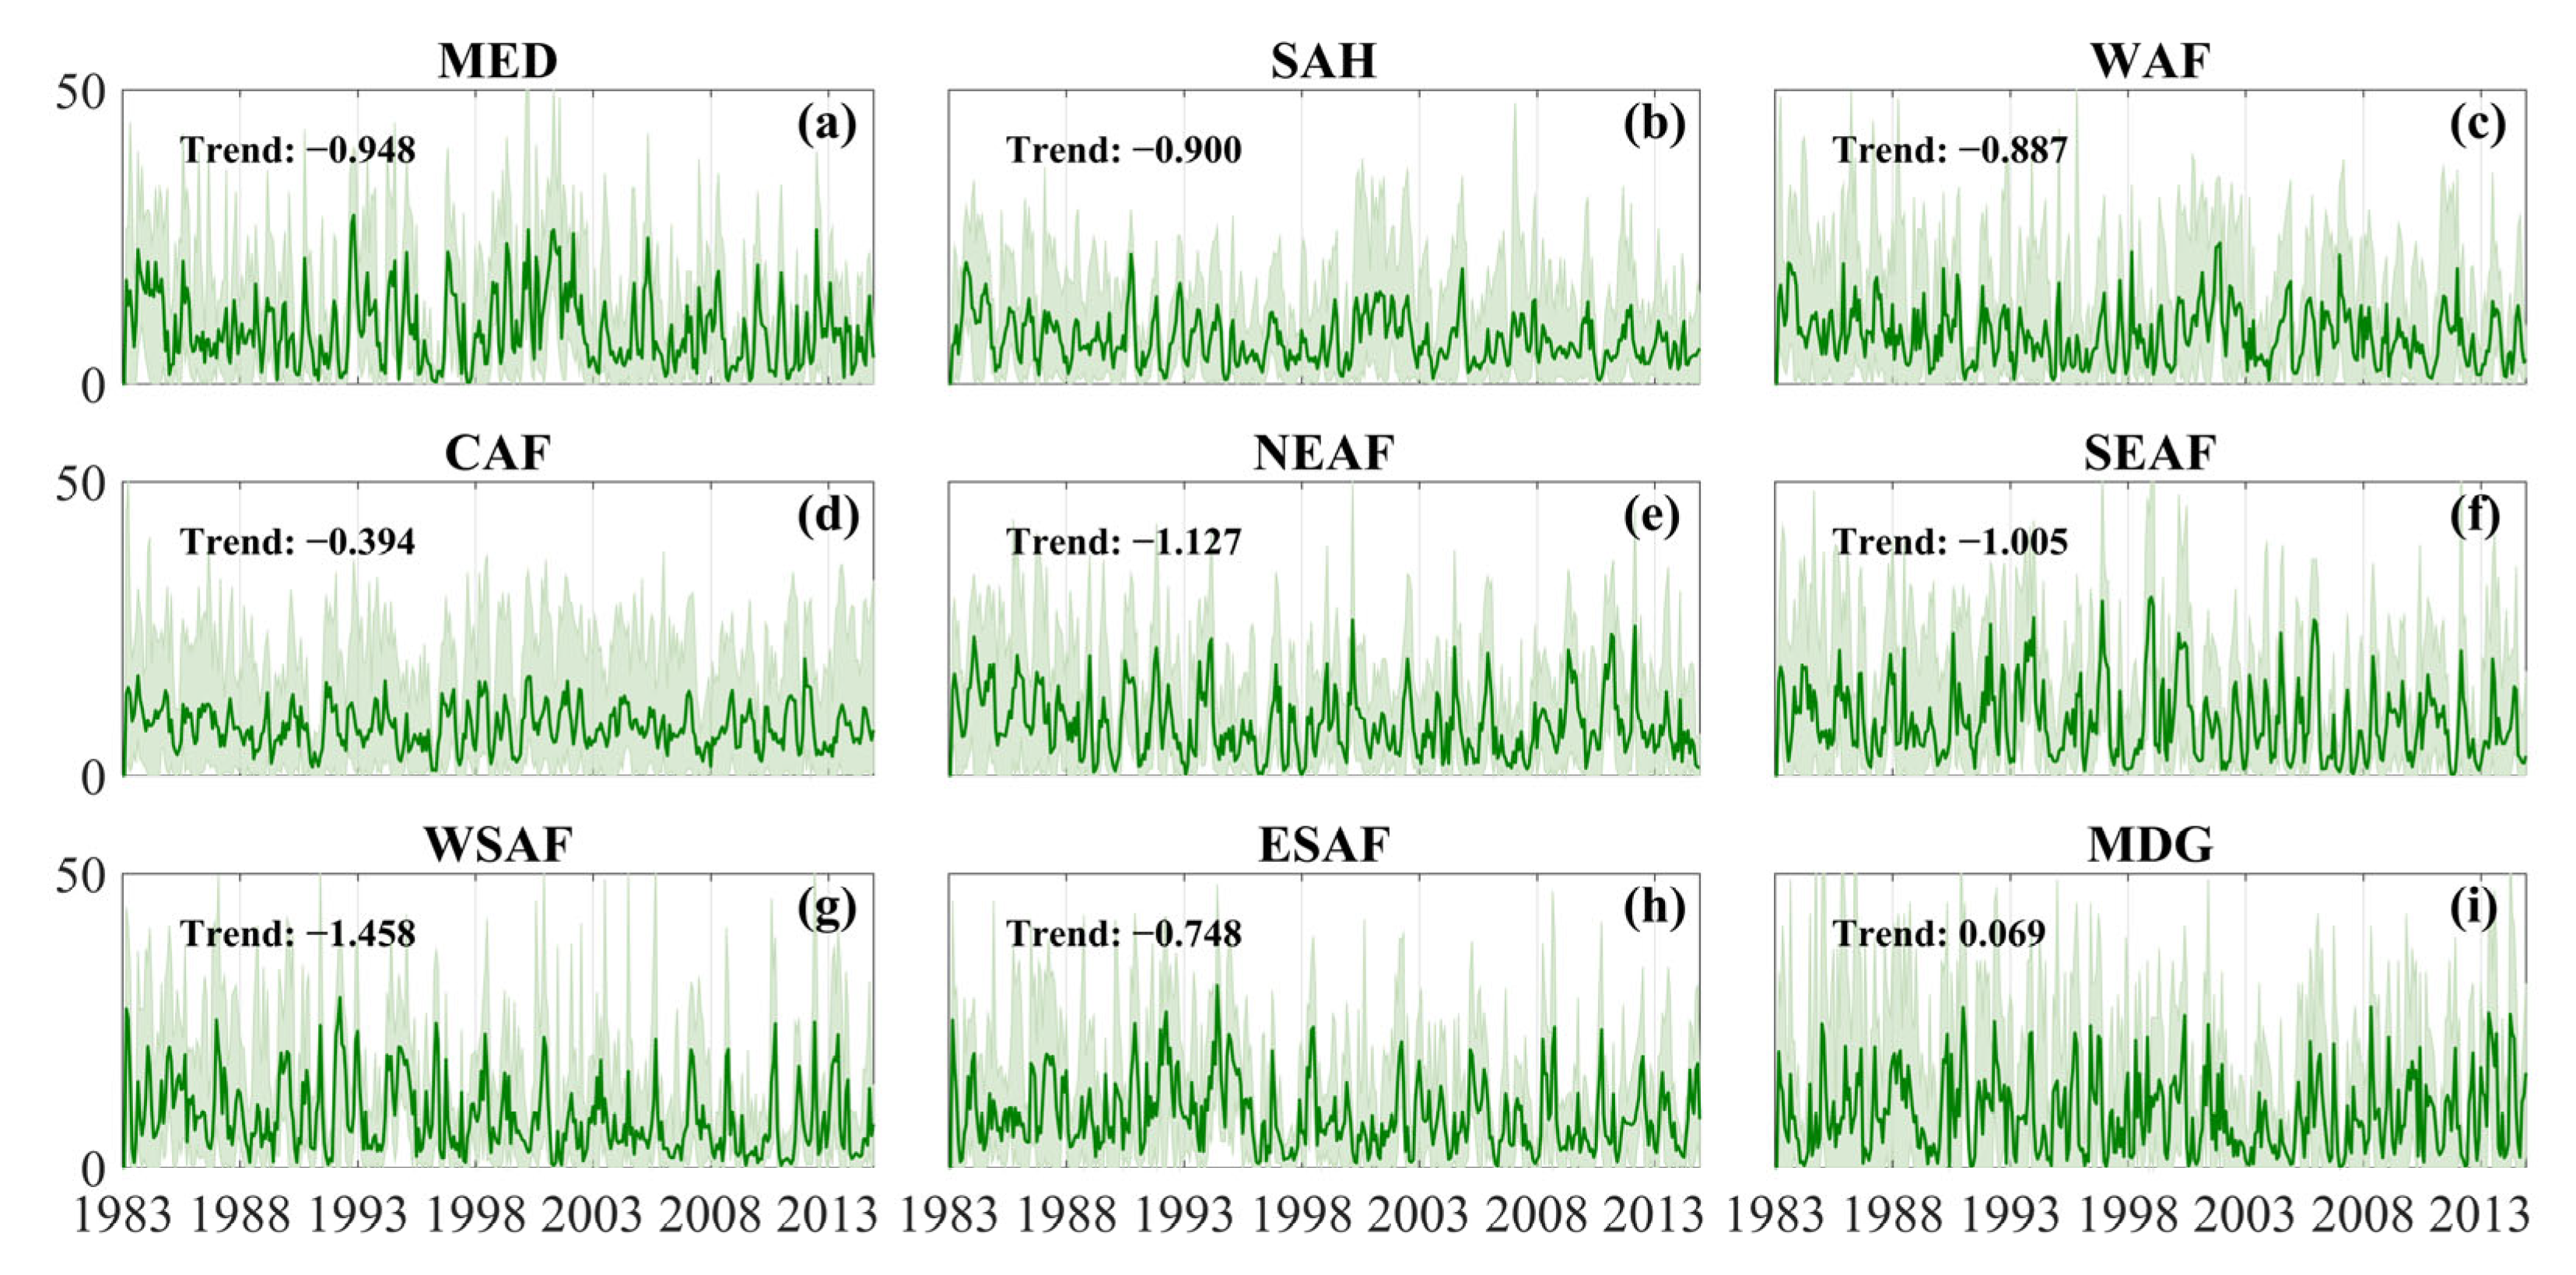
Figure 9.
Percentage of Africa’s subregions experiencing moderate drought conditions. The green line is the mean of all the datasets and the shading shows the uncertainty range using maximum–minimum values from the individual datasets. Trend is the magnitude of linear change (% year–1; scale: ×10–2) calculated using the Theil–Sen slope estimator. (a) MED; (b) SAH; (c) WAF; (d) CAF; (e) NEAF; (f) SEAF; (g) WSAF; (h) ESAF; and (i) MDG.
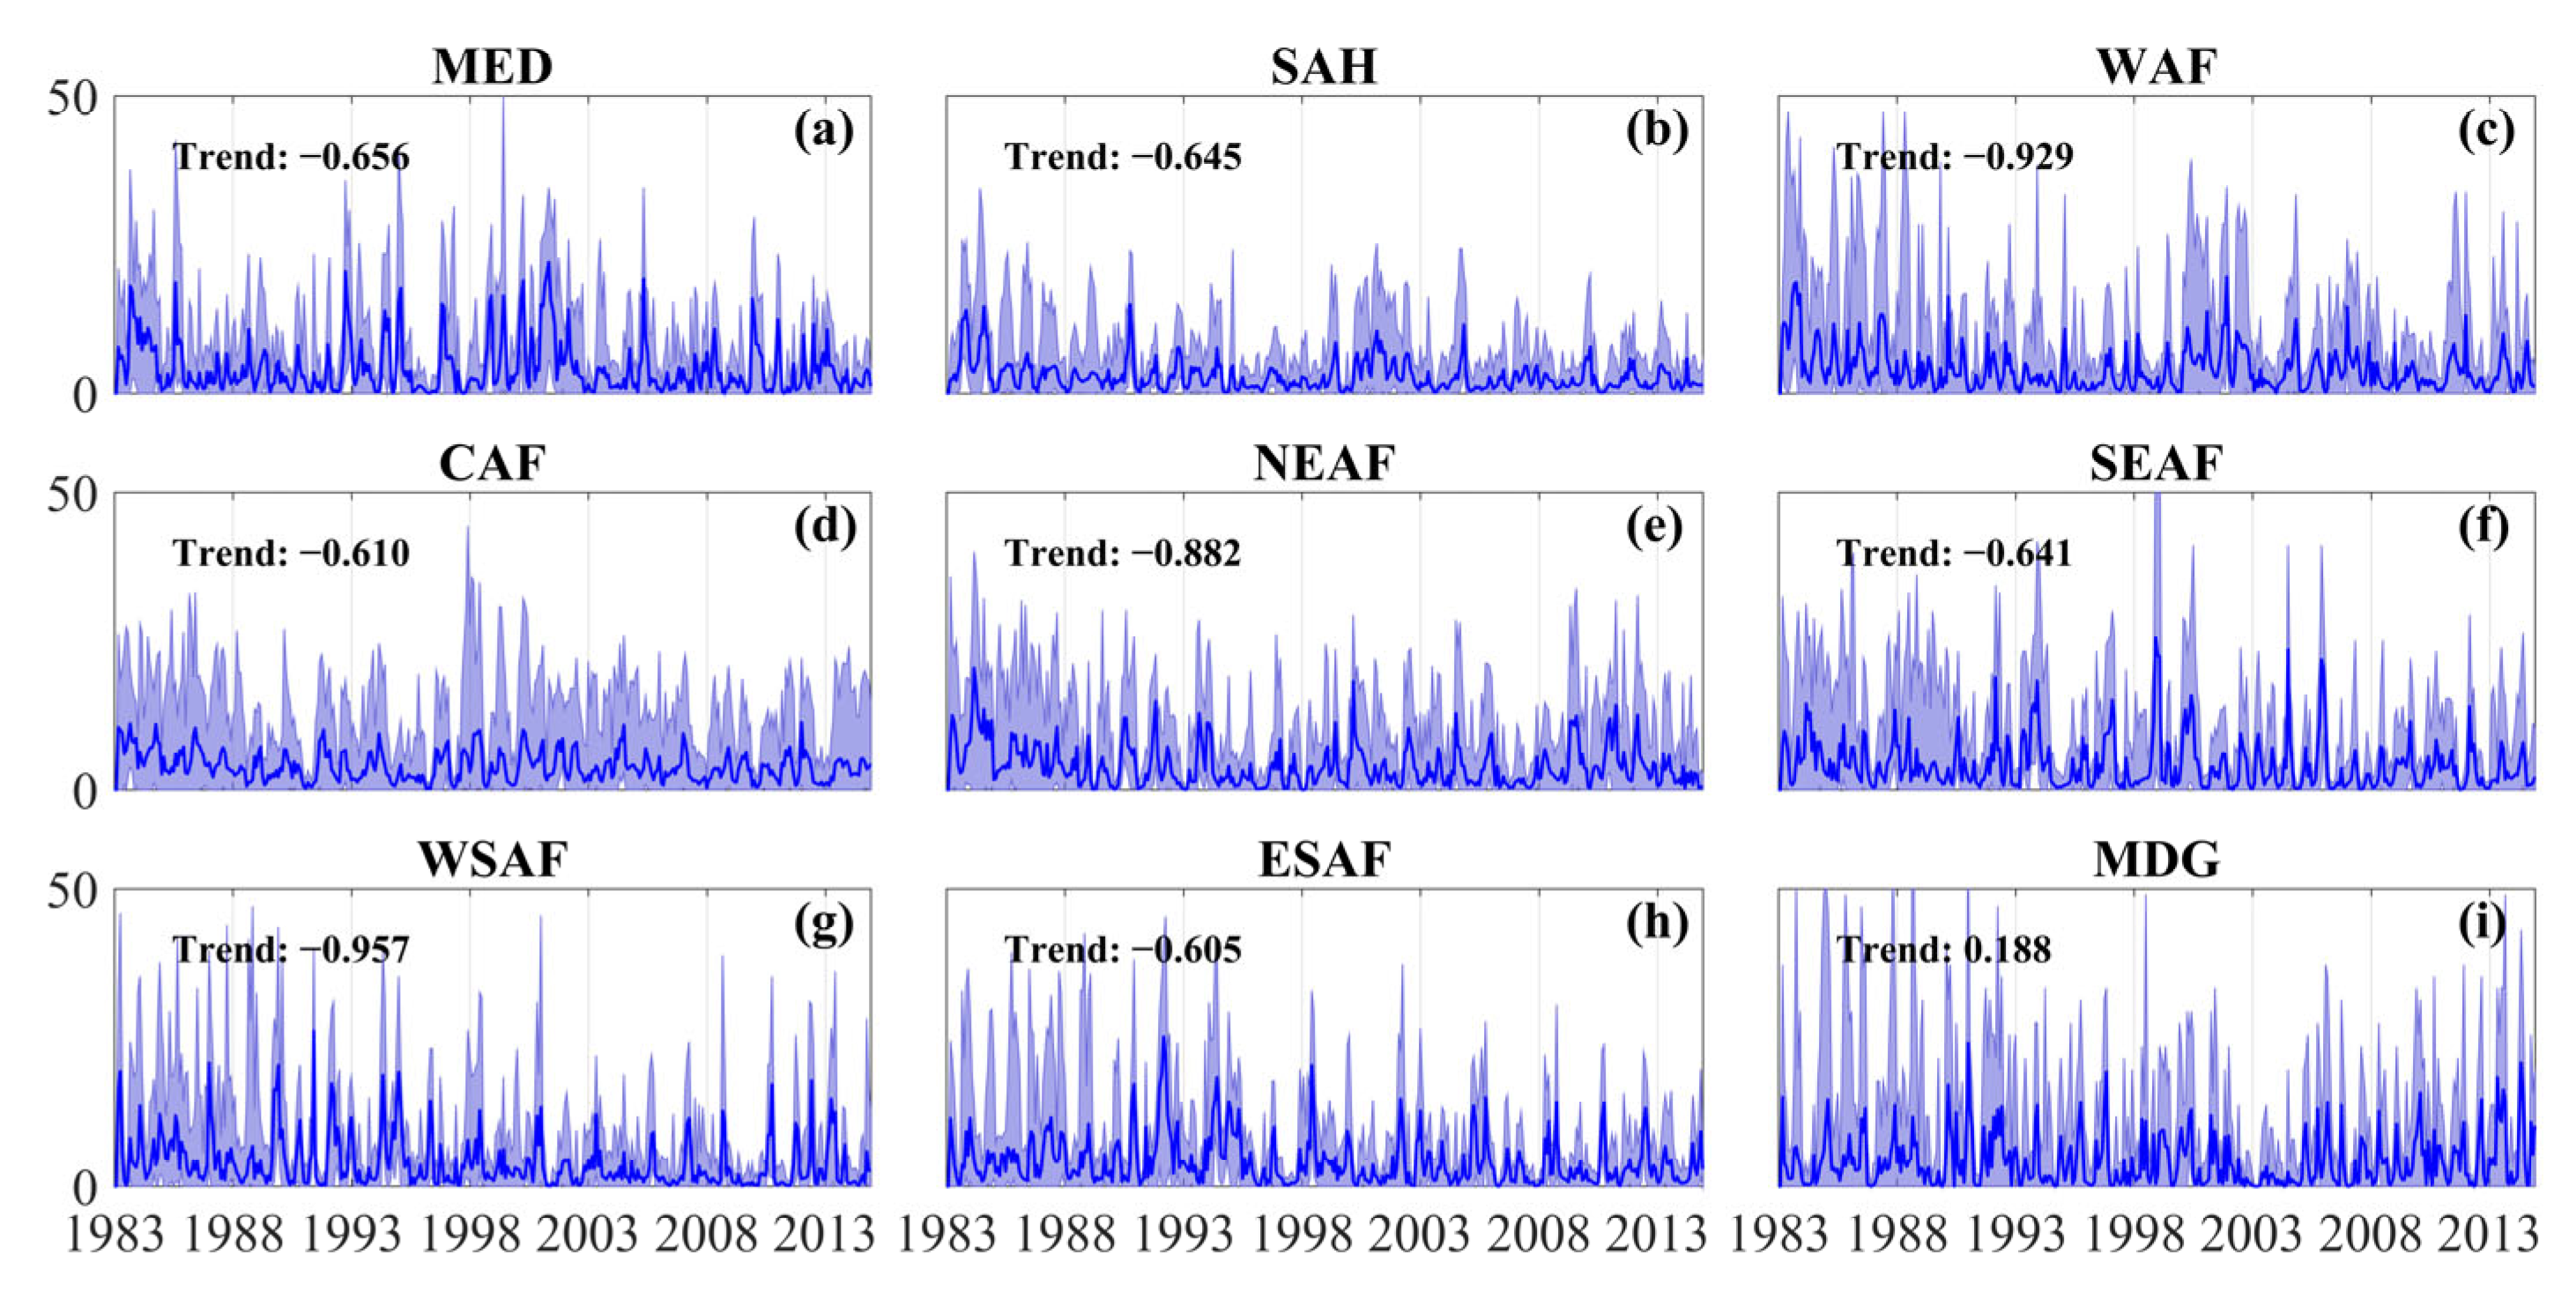
Figure 10.
Percentage of Africa’s subregions experiencing severe drought conditions. The blue line is the mean of all the datasets and the shading shows the uncertainty range using maximum–minimum values from the individual datasets. Trend is the magnitude of linear change (% year–1; scale: ×10–2) calculated using the Theil–Sen slope estimator. (a) MED; (b) SAH; (c) WAF; (d) CAF; (e) NEAF; (f) SEAF; (g) WSAF; (h) ESAF; and (i) MDG.
Figure 11.
Percentage of Africa’s subregions experiencing extreme drought conditions. The red line is the mean of all the datasets and the shading shows the uncertainty range using maximum–minimum values from the individual datasets. Trend is the magnitude of linear change (% year–1; scale: ×10–2) calculated using the Theil–Sen slope estimator. (a) MED; (b) SAH; (c) WAF; (d) CAF; (e) NEAF; (f) SEAF; (g) WSAF; (h) ESAF; and (i) MDG.
Table 1.
List of datasets used in this study was downloaded from FROGS. The datasets are categorised under station-based data, satellite-based data, and reanalysis data. All datasets are regridded by FROGS to a 1° × 1°.
Table 1.
List of datasets used in this study was downloaded from FROGS. The datasets are categorised under station-based data, satellite-based data, and reanalysis data. All datasets are regridded by FROGS to a 1° × 1°.
| Category | No. | Dataset | Temporal Coverage | Native Resolution | References |
|---|
| Station-based | 1 | CPC_v1.0 | 1979–2020 | 0.5° × 0.5° | [39] |
| 2 | GPCC_FDD_v2018 | 1982–2016 | 1° × 1° | [40] |
| 3 | GPCC_FDD_v2020 | 1982–2019 | 1° × 1° | [41] |
| 4 | REGEN_ALL_2019 | 1950–2016 | 1° × 1° | [42] |
| 5 | REGEN_LONG_2019 | 1950–2016 | 1° × 1° |
| Satellite-based | 6 | ARC2 | 1983–2020 | 0.1° × 0.1° | [43] |
| 7 | CHIRP_v1.0 | 1981–2020 | 0.05° × 0.05° | [44] |
| 8 | CHIRPS_v2.0 | 1981–2020 | 0.25° × 0.25° |
| 9 | PERSIANN_CCS_CDR | 1983–2020 | 0.04° × 0.04° | [45] |
| 10 | PERSIANN-CDR_v1_r1 | 1983–2020 | 0.25° × 0.25° | [46] |
| 11 | TAMSAT_v2 | 1983–2017 | 0.0375° × 0.0375° | [47] |
| 12 | TAMSAT_v3 | 1983–2020 | 0.0375° × 0.0375° |
| Reanalysis | 13 | CFSR | 1979–2019 | 0.5° × 0.5° | [48] |
| 14 | ERA5 | 1979–2020 | 0.25° × 0.25° | [49] |
| 15 | ERA-I | 1979–2018 | 0.75° × 0.75° | [50] |
| 16 | GSWP3 | 1901–2014 | 0.25° × 0.25° | [51] |
| 17 | JRA-55 | 1958–2019 | 0.5625° × 0.5625° | [52] |
| 18 | MERRA1 | 1979–2015 | 0.25° × 0.25° | [53] |
| 19 | MERRA2 | 1980–2019 | 0.625° × 0.5° | [54] |
Table 2.
Classification of drought level from SPI values [
55].
Table 2.
Classification of drought level from SPI values [
55].
| SPI Values | Drought Level Classification |
|---|
| –1.0 > SPI | all drought |
| –1.0 ≥ SPI > –1.5 | moderate drought |
| –1.5 ≥ SPI > –2 | severe drought |
| –2.0 ≥ SPI | extreme drought |
Table 3.
Drought characteristics used in the study, where drought months are months with SPI ≤ −1. D: drought duration (month); de: duration of eth drought event; e: number of drought events; n: number of drought months; F: frequency (%); N: total number of months; I: drought intensity; SPIi: SPI value during ith drought month; S: drought severity; A: drought area (%); p: number of pixels with SPI ≤ −1; and P: total number of pixels.
| Drought Characteristic | Equation |
|---|
| Drought duration | |
| Drought frequency | |
| Drought intensity | |
| Drought severity | S = D × I |
| Drought impact area | |
Table 4.
Trend analysis of drought months over the climate subregions of Africa using the modified Mann-–Kendall test and the Theil–Sen slope estimator. Slope is the magnitude of linear-trend change (scale: ×10–3), and positive and negative values of Z represent increasing and decreasing trends, respectively, and p is the statistical significance at a 95% confidence level.
| | | MED | SAH | WAF | CAF | NEAF | SEAF | WSAF | ESAF | MDG |
|---|
| All | Slope | 0.290 | 0.222 | 0.322 | 0.377 | 0.232 | 0.358 | 0.337 | 0.349 | 0.089 |
| Z | 4.027 | 5.538 | 0.900 | 3.458 | 1.518 | 4.309 | 6.755 | 5.016 | 1.215 |
| p | 0.000 | 0.000 | 0.368 | 0.001 | 0.129 | 0.000 | 0.000 | 0.000 | 0.224 |
| Moderate | Slope | 0.061 | 0.036 | 0.039 | 0.031 | 0.035 | 0.043 | 0.061 | 0.051 | 0.016 |
| Z | 4.782 | 5.007 | 3.220 | 10.213 | 2.786 | 3.762 | 5.739 | 4.774 | 1.157 |
| p | 0.000 | 0.000 | 0.001 | 0.000 | 0.005 | 0.000 | 0.000 | 0.000 | 0.247 |
| Severe | Slope | 0.046 | 0.032 | 0.023 | 0.032 | 0.025 | 0.026 | 0.073 | 0.050 | −0.028 |
| Z | 1.949 | 4.821 | 1.180 | 2.795 | 1.439 | 2.600 | 4.543 | 4.289 | −0.696 |
| p | 0.051 | 0.000 | 0.238 | 0.005 | 0.150 | 0.009 | 0.000 | 0.000 | 0.486 |
| Extreme | Slope | 0.113 | 0.154 | −0.028 | 0.252 | 0.083 | 0.161 | 0.093 | 0.240 | −0.035 |
| Z | 2.864 | 4.995 | −1.065 | 3.907 | 0.539 | 3.183 | 1.677 | 2.885 | −0.103 |
| p | 0.004 | 0.000 | 0.287 | 0.000 | 0.590 | 0.001 | 0.093 | 0.004 | 0.918 |
Table 5.
Drought duration (months year–1) averaged over the climate subregions of Africa for all, moderate, severe, and extreme drought months during 1983–2014. Mean represents the ensemble mean of all datasets, and max and min are the upper and lower bound of the uncertainty range, respectively, obtained from the maximum and minimum duration from the individual datasets.
| | | MED | SAH | WAF | CAF | NEAF | SEAF | WSAF | ESAF | MDG |
|---|
| All | Max | 2.11 | 2.39 | 2.69 | 3.87 | 2.95 | 2.57 | 2.26 | 2.27 | 2.14 |
| Mean | 2.03 | 1.97 | 2.20 | 2.39 | 2.24 | 2.15 | 1.98 | 2.05 | 1.89 |
| Min | 1.88 | 1.77 | 1.88 | 1.97 | 1.94 | 1.91 | 1.72 | 1.77 | 1.72 |
| Moderate | Max | 1.40 | 1.72 | 1.51 | 1.59 | 1.48 | 1.50 | 1.40 | 1.41 | 1.39 |
| Mean | 1.34 | 1.44 | 1.35 | 1.38 | 1.39 | 1.36 | 1.32 | 1.34 | 1.29 |
| Min | 1.30 | 1.31 | 1.27 | 1.26 | 1.30 | 1.27 | 1.27 | 1.26 | 1.18 |
| Severe | Max | 1.33 | 1.52 | 1.44 | 1.59 | 1.50 | 1.44 | 1.35 | 1.39 | 1.28 |
| Mean | 1.28 | 1.37 | 1.31 | 1.35 | 1.34 | 1.31 | 1.26 | 1.29 | 1.23 |
| Min | 1.24 | 1.27 | 1.20 | 1.25 | 1.25 | 1.22 | 1.22 | 1.21 | 1.18 |
| Extreme | Max | 1.59 | 2.07 | 2.41 | 2.70 | 2.07 | 1.74 | 1.58 | 1.66 | 1.58 |
| Mean | 1.40 | 1.60 | 1.71 | 1.85 | 1.72 | 1.57 | 1.45 | 1.44 | 1.38 |
| Min | 1.31 | 1.45 | 1.35 | 1.53 | 1.39 | 1.39 | 1.26 | 1.24 | 1.16 |
Table 6.
Drought events (year–1) averaged over the climate subregions of Africa for all, moderate, severe, and extreme drought months during 1983–2014. Mean represents the ensemble mean of all datasets, and max and min are the upper and lower bound of the uncertainty range, respectively, obtained from the maximum and minimum duration from the individual datasets.
| | | MED | SAH | WAF | CAF | NEAF | SEAF | WSAF | ESAF | MDG |
|---|
| All | Max | 30.62 | 34.29 | 30.90 | 28.78 | 28.67 | 29.76 | 31.42 | 30.88 | 33.89 |
| Mean | 29.21 | 22.61 | 25.99 | 24.05 | 25.64 | 27.72 | 27.80 | 28.35 | 30.39 |
| Min | 25.69 | 12.22 | 21.56 | 17.87 | 22.36 | 24.86 | 24.97 | 24.45 | 19.89 |
| Moderate | Max | 28.00 | 31.57 | 26.20 | 26.60 | 26.91 | 27.23 | 29.17 | 28.88 | 29.87 |
| Mean | 25.97 | 20.53 | 23.09 | 22.36 | 23.41 | 25.19 | 24.54 | 25.46 | 26.31 |
| Min | 22.14 | 10.87 | 19.58 | 18.36 | 21.39 | 22.48 | 22.18 | 20.48 | 17.72 |
| Severe | Max | 13.25 | 12.77 | 12.93 | 12.23 | 12.44 | 13.04 | 12.84 | 13.04 | 13.76 |
| Mean | 12.23 | 8.29 | 11.20 | 10.67 | 10.78 | 11.67 | 11.19 | 11.69 | 12.03 |
| Min | 9.09 | 4.18 | 8.92 | 8.34 | 7.43 | 8.22 | 8.01 | 8.41 | 7.65 |
| Extreme | Max | 6.58 | 5.17 | 7.06 | 7.78 | 6.38 | 7.37 | 5.75 | 6.54 | 6.45 |
| Mean | 4.85 | 3.09 | 5.11 | 4.74 | 4.43 | 4.75 | 4.47 | 4.61 | 4.61 |
| Min | 2.23 | 1.70 | 3.29 | 2.18 | 1.65 | 1.79 | 2.37 | 2.19 | 2.14 |
Table 7.
Drought frequency (% year–1) averaged over the climate subregions of Africa for all, moderate, severe, and extreme drought months during 1983–2014. Mean represents the ensemble mean of all datasets, and max and min are the upper and lower bound of the uncertainty range, respectively, obtained from the maximum and minimum duration from the individual datasets.
| | | MED | SAH | WAF | CAF | NEAF | SEAF | WSAF | ESAF | MDG |
|---|
| All | Max | 16.47 | 18.99 | 16.08 | 17.03 | 16.38 | 16.20 | 16.09 | 16.61 | 16.21 |
| Mean | 15.39 | 11.75 | 14.63 | 14.49 | 14.60 | 15.24 | 14.30 | 15.03 | 14.87 |
| Min | 12.96 | 5.67 | 12.78 | 12.21 | 11.86 | 12.98 | 11.85 | 12.39 | 11.06 |
| Moderate | Max | 10.14 | 12.86 | 9.50 | 10.45 | 10.14 | 10.52 | 10.40 | 10.30 | 10.05 |
| Mean | 9.13 | 7.74 | 8.16 | 8.12 | 8.53 | 8.99 | 8.53 | 8.94 | 8.92 |
| Min | 7.74 | 3.92 | 6.77 | 6.45 | 7.58 | 7.51 | 7.47 | 6.84 | 5.48 |
| Severe | Max | 4.42 | 4.57 | 4.23 | 4.78 | 4.47 | 4.39 | 4.23 | 4.46 | 4.60 |
| Mean | 4.10 | 2.93 | 3.83 | 3.75 | 3.77 | 3.97 | 3.69 | 3.95 | 3.88 |
| Min | 2.94 | 1.54 | 3.08 | 2.94 | 2.69 | 2.84 | 2.54 | 2.67 | 2.34 |
| Extreme | Max | 2.41 | 2.12 | 3.99 | 4.00 | 3.06 | 2.91 | 2.22 | 2.62 | 2.27 |
| Mean | 1.75 | 1.23 | 2.20 | 2.24 | 1.94 | 1.89 | 1.67 | 1.71 | 1.62 |
| Min | 0.78 | 0.63 | 1.51 | 0.98 | 0.79 | 0.69 | 0.90 | 0.72 | 0.66 |
Table 8.
Drought intensity (year–1) averaged over the climate subregions of Africa for all, moderate, severe, and extreme drought months during 1983–2014. Mean represents the ensemble mean of all datasets, and max and min are the upper and lower bound of the uncertainty range, respectively, obtained from the maximum and minimum duration from the individual datasets.
| | | MED | SAH | WAF | CAF | NEAF | SEAF | WSAF | ESAF | MDG |
|---|
| All | Max | −1.41 | −1.29 | −1.49 | −1.44 | −1.43 | −1.38 | −1.42 | −1.39 | −1.38 |
| Mean | −1.50 | −1.42 | −1.56 | −1.56 | −1.52 | −1.51 | −1.51 | −1.50 | −1.50 |
| Min | −1.57 | −1.57 | −1.71 | −1.73 | −1.62 | −1.63 | −1.58 | −1.63 | −1.63 |
| Moderate | Max | −1.21 | −1.17 | −1.22 | −1.21 | −1.21 | −1.21 | −1.20 | −1.21 | −1.21 |
| Mean | −1.22 | −1.20 | −1.22 | −1.22 | −1.22 | −1.22 | −1.22 | −1.22 | −1.22 |
| Min | −1.23 | −1.22 | −1.23 | −1.23 | −1.23 | −1.23 | −1.23 | −1.23 | −1.23 |
| Severe | Max | −1.69 | −1.67 | −1.70 | −1.70 | −1.70 | −1.69 | −1.69 | −1.69 | −1.69 |
| Mean | −1.71 | −1.69 | −1.71 | −1.71 | −1.71 | −1.71 | −1.71 | −1.71 | −1.71 |
| Min | −1.72 | −1.71 | −1.73 | −1.73 | −1.72 | −1.72 | −1.72 | −1.73 | −1.73 |
| Extreme | Max | −2.29 | −2.28 | −2.38 | −2.29 | −2.30 | −2.28 | −2.34 | −2.27 | −2.28 |
| Mean | −2.36 | −2.41 | −2.43 | −2.45 | −2.43 | −2.36 | −2.40 | −2.37 | −2.39 |
| Min | −2.49 | −2.63 | −2.51 | −2.79 | −2.58 | −2.44 | −2.58 | −2.48 | −2.50 |
Table 9.
Drought severity (year–1) averaged over the climate subregions of Africa for all, moderate, severe, and extreme drought months during 1983–2014. Mean represents the ensemble mean of all datasets, and max and min are the upper and lower bound of the uncertainty range, respectively, obtained from the maximum and minimum duration from the individual datasets.
| | | MED | SAH | WAF | CAF | NEAF | SEAF | WSAF | ESAF | MDG |
|---|
| All | Max | −2.65 | −2.40 | −2.93 | −2.94 | −2.78 | −2.64 | −2.45 | −2.46 | −2.41 |
| Mean | −3.05 | −2.82 | −3.43 | −3.76 | −3.43 | −3.27 | −3.00 | −3.11 | −2.85 |
| Min | −3.34 | −3.37 | −4.41 | −6.32 | −4.78 | −3.99 | −3.51 | −3.81 | −3.71 |
| Moderate | Max | −1.58 | −1.60 | −1.55 | −1.55 | −1.59 | −1.57 | −1.56 | −1.54 | −1.43 |
| Mean | −1.64 | −1.73 | −1.65 | −1.69 | −1.70 | −1.67 | −1.62 | −1.64 | −1.58 |
| Min | −1.70 | −2.08 | −1.85 | −1.95 | −1.81 | −1.83 | −1.71 | −1.72 | −1.68 |
| Severe | Max | −2.11 | −2.14 | −2.06 | −2.14 | −2.14 | −2.13 | −2.07 | −2.07 | −2.01 |
| Mean | −2.20 | −2.33 | −2.25 | −2.32 | −2.29 | −2.25 | −2.16 | −2.22 | −2.10 |
| Min | −2.29 | −2.57 | −2.46 | −2.73 | −2.56 | −2.46 | −2.30 | −2.38 | −2.19 |
| Extreme | Max | −3.07 | −3.33 | −3.27 | −3.69 | −3.30 | −3.28 | −2.99 | −2.96 | −2.77 |
| Mean | −3.33 | −3.93 | −4.19 | −4.61 | −4.23 | −3.76 | −3.54 | −3.49 | −3.34 |
| Min | −3.99 | −5.01 | −5.88 | −7.25 | −5.43 | −4.22 | −4.10 | −4.26 | −3.89 |


 ,
, 


