Article

Influence of Dynamic and Thermal Effects of Asian Topography on Tropical Cyclone Activity as Simulated in a Global Climate Model

1
Shanghai Investigation, Design and Research Institute Co., Ltd., Shanghai 200434, China
2
State Key Laboratory of Numerical Modeling for Atmospheric Sciences and Geophysical Fluid Dynamics, Institute of Atmospheric Physics, Chinese Academy of Sciences, Beijing 100029, China
Atmosphere 2023, 14(5), 905; https://doi.org/10.3390/atmos14050905
Submission received: 5 April 2023 / Revised: 7 May 2023 / Accepted: 15 May 2023 / Published: 22 May 2023

Abstract

:
Asian topography plays a significant role in regional and global weather and climate change. Based on the dataset of climate system model named CAS FGOALS-f3 participated in Global monsoons Model Inter-comparison (GMMIP), the MIP endorsement of Coupled Model Intercomparison Project Phase 6 (CMIP6), the role of Asian topography to the formation and movement of tropical cyclones (TCs) are discussed in this study. This study provides the first comparative analysis of the dynamic and thermal effects of Asian topography on the regional and global activity of TCs. The results indicate that the Asian topography promotes the generation and development of TCs, especially in the Northwest Pacific (WNP). The contribution of the Asian topography to the number of TCs reached about 50% in WNP. It is worth noting that there are still positive biases of TC track density in the experiment named “AMIP-NS”, which means the thermal effect of Asian topography is also essential for TC formation and development in WNP, which has not received much attention before. Besides, the possible reasons for the modulation of TC activity are given from two aspects: (1) The existence of Asian topography has changed the large-scale factors related to TC activities such as warm core, sea-level pressure, genesis potential index (GPI), which are beneficial to the generation and movement of TC. (2) Asian topography promotes the spread of Madden–Julian oscillation (MJO), which is also beneficial to the generation and movement of TC. It is worthwhile to investigate further the mechanisms by which Asian topography affects the activity of TCs.

1. Introduction

Tropical cyclones (TCs) are one of the most destructive natural hazards generated in the tropical ocean. The high surface wind speed and the heavy precipitation are the signatures of TCs, which have a significant impact on the social economy and public safety in the coastal areas. Thus, TCs activity has always been the core content of disaster prevention and mitigation. Unfortunately, due to insufficient knowledge of TCs and unskilled prediction accuracy, human society has suffered huge losses from TCs every year. In the past 2018, there were 102 named TCs generated globally. Furthermore, the direct economic losses caused by TCs exceeded 95 billion U.S. dollars and caused more than 1700 deaths. Previous studies [1] pointed out that global warming makes hurricane forecasting more complicated, and many recognized characteristics of TC may be changed in the future. Thus, continuous research on the TC dynamics and the improvement of TC prediction skills are necessary.
Changes in large-scale circulation and oceanic conditions are strongly related to the formation and development of TCs [2,3]. The Atlantic Multidecadal Oscillation (AMO) could affect the Walker circulation and lead to the increment of the vertical wind shear in the genesis region of TC at the WNP [4]. Pacific Decadal Oscillation (PDO) is a long-lived El Niño-like pattern of Pacific climate variability, which could contribute to the TC genesis in the northern Indian Ocean (NIO) [5], the WNP [6], and the North Atlantic (NA) [4]. El Niño–Southern Oscillation (ENSO) is one of the dominant interannual variability in the tropics [7,8], which could modulate the atmospheric and oceanic circulation. The TC activity in WNP was influenced by the ENSO [9] and quasi-biennial oscillation (QBO) [10]. The previous study [11] indicated a solid lead-lag relationship between the ENSO indices and the accumulated cyclone energy (ACE) of TC. Madden-Julian oscillation (MJO) contributes to the variability of tropical atmospheric and oceanic circulation in sub-seasonal to seasonal (S2S) timescale, especially on the tropical convection and tropical waves aspects. The researchers [12] systematically summarized the influences of MJO on weather and climate timescale, and the results indicated that the TC genesis and movement were influenced by the MJO in each phase. The previous study [13] explained the impact of MJO on TC activity in the different basins from the perspective of large-scale factors. In terms of TC dynamics, the researcher [14] considered the eye dynamics in the steady-state theory to fix the predicted biases of TC maximum intensity, which is known as the maximum potential intensity (MPI). Then, the GPI is developed [15] based on the MPI and large-scale factors, and GPI becomes an excellent method to establish a linkage between TC and large-scale factors [16].
Using the global climate model (GCM) to simulate global TC activity began in the 1960s [17]. Subject to the low resolution and simple physical processes, only the TC-like signal was recognized in the model of that era [18,19]. The fine-resolution regional climate models were good transitions to make the detailed simulation for the horizontal and vertical structure of TC [20,21]. With the rapid development of computing science, improved horizontal/vertical resolution, and reasonable parameterization of physical processes, the GCM has the potential to simulate the characteristics of TC in many aspects [22,23]. A 20 km-mesh global atmospheric model was used to simulate the frequency and wind intensity of TC in a global-warming climate [24]. The Geophysical Fluid Dynamics Laboratory (GFDL) 50 km GCM named HiRAM was used to simulate the global TC activity in climatology, seasonal cycle, and interannual variability aspects [25]. With the consistent increase in horizontal resolution of GCMs, some international plans, such as the High-resolution model intercomparison project (HighResMIP V1.0) for CMIP6 and the US CLIVAR working group on hurricanes, regarded the simulated performance of TC as an essential scoring indicator for the high-resolution GCMs. Since then, the GCMs have been widely used in the prediction, projection, and theoretical research of global TC activity [26,27,28].
The Asian Topography, especially the Tibetan-Iranian Plateau (hereafter TIP), significantly impact Asia and the global climate [29,30,31,32]. There is a robust physical relationship between the Tibetan Plateau (TP) and the Asian summer monsoon (ASM), but the contributions between the thermodynamic process and mechanical process stirred up heated discussions. The previous study [33] cleared that sensible heating on the slopes of the TP was a crucial driver of the South Asian monsoon. A new viewpoint was proposed, which considered the mechanical barrier of TP to play a dominant role in the evolution of the South Asian monsoon [34]. While the maintenance of the South Asian summer monsoon was still controversial, the contribution of TP to large-scale circulation was already a consensus [35,36]. In addition, the TIP also affects atmospheric circulation on a synoptic scale [37,38]. Besides, a relationship between the TP winter snow cover and the WNP tropical cyclone genesis frequency was found [39].
In this study, the role of Asian topography on TC formation was discussed based on the dataset of CAS FGOALS-f3 that participated in Global monsoons Model Inter-comparison (GMMIP) [40,41], the MIP endorsement of CMIP6 [42]. The previous study evaluated the simulation performance of TC activity in FAMIL2, which was the atmospheric component of CAS FGOALS-f3 in low horizontal resolution (approximately 100 km) [26]. The results indicated that the TC climatology and variability could be well reproduced by FAMIL2, which provides a good foundation for studying the role of the Asian topography in tropical cyclone activities. Based on the Tier 3 experiment of GMMIP, the impact of Asian topography on TC activity in the climatology aspect will be given. Then the possible reason will be discussed in order to understand these phenomena. The highlights of this study are (1) The quantitative analysis of the dynamic and thermal effects of Asian topography on regional and global tropical cyclone activity through numerical simulation; (2) The possible reasons for the impact of Asian topography on tropical cyclone activity are identified.
The paper is organized as follows. The datasets of observation and model simulation are introduced in Section 2. Section 3 shows the results of TC simulation within the experiments in tier 3 of GMMIP, then the possible reason that caused these changes are given in Section 4. Section 5 provides a brief discussion and a summary of the results.

2. Dataset and Method

2.1. Model Description

The Chinese Academy of Sciences (CAS) Flexible Global Ocean–Atmosphere–Land System model, finite-volume version 3 (CAS FGOALS-f3) is the latest climate system model for Coupled Model Intercomparison Project Phase 6 (CMIP6) developed by the State Key Laboratory of Numerical Modeling for Atmospheric Sciences and Geophysical Fluid Dynamics (LASG), Institute of Atmospheric Physics (IAP). CAS FGOALS-f3 consists of 4 components: (1) the atmospheric component is the Finite-volume Atmospheric Model version 2.2 (FAMIL2.2) [26,43], which is the successor of the atmospheric general circulation model of the Spectral Atmosphere Model of LASG (SAMIL) [44,45]; (2) the oceanic component is the LASG/IAP Climate System Ocean Model version 3 (LICOM3) [46]; (3) the land surface component is the Community Land Model version 4.0 (CLM4) [47,48], but the processes from the dynamic global vegetation model (DGVM) in CLM4.0 used in FGOALS-f2 are turned off compared to its original version in CESM; (4) the sea-ice component is the Los Alamos Sea Ice Model version 4.0 (CICE 4.0) [49,50]. These four components are coupled by the version 7 coupler in CESM [51]. The Previous study [26] has introduced the atmospheric component, FAMIL2 detail, and there is no essential difference with FAMIL2.2.

2.2. Simulation of FGOALS-f3 in GMMIP Tier 3

CAS FGOALS-f3 have participated in the CMIP6 activities, GMMIP, and HighresMIP [52]. In this study, the datasets submitted to the GMMIP are analyzed. The horizontal resolution of CAS-FGOALS-f3-L is approximately 100 km, and the configuration of model experiments is introduced in Table 1. For writing convenience, we use the abbreviations: AMIP, NTP, and NS for the experiment named amip-hist, amip-TIP, and amip-TIP-nosh, respectively. The first experiment, named amip-hist (http://doi.org/10.22033/ESGF/CMIP6.3182, accessed on 20 May 2023), was designed as the control run. The other two experiments named amip-TIP (http://doi.org/10.22033/ESGF/CMIP6.3186, accessed on 20 May 2023) and amip-TIP-nosh (http://doi.org/10.22033/ESGF/CMIP6.3189, accessed on 20 May 2023) are designed as the sensitivity runs. In amip-TIP, the topography above 500 m was set to 500 m. In amip-TIP-nosh, the vertical diffusion heating term in the boundary layer scheme was set to zero in the same region. Besides, we have made differences between the two types of data. AMIP-NTP represents the difference between amip-hist and amip-TIP, which will highlight the widespread impact of Asian topography on global TC activities. AMIP-NS represents the difference between amip-hist and amip-TIP-nosh, which will highlight the impact of surface sensible heating of Asian topography on global TC activities.

2.3. Tracking Algorithms

An objective feature-tracking approach is used to detect the model-generated TCs based on the 6-h outputs of CAS FGOALS-f3-L. According to the tracking scheme, sea level pressure, warm core (the temperature anomaly Tm averaged between 300 and 500 hPa), 10 m wind, and 850 hPa vorticity are mainly used to diagnose TC activity, which is similar to the method used in a climate model of GFDL [25,53,54]. The researchers [26] used this scheme to evaluate the simulated performance of TC in CAS FGOALS-f3-L and CAS FGOALS-f3-H and show a reasonable performance compared to the observation. Besides, for post-analysis convenience, we performed TC diagnostics on all data from FGOALS-f3-L participation in GMMIP.

3. The Changes in Global Climatology of TC Activities due to Asian Topography

A large number of previous studies have indicated that both the mechanical blocking and thermal effects of the Asian topography have the ability to change the climatology and variability of Asian monsoon circulation and precipitation [32,34]. The sensitive experiments based on multiple models indicated that the Asian topography, especially the Qinghai-Tibetan Plateau, contributes to the formation of Asian summer monsoon precipitation [40]. Figure 1 shows the anomalies of daily precipitation and 850-hPa wind between the control run and the sensitive runs introduced in Section 3. The result indicates that Asian topography increases the daily precipitation from June to August (JJA), and this phenomenon is most pronounced in East and South Asia. At the same time, the southwesterly airflow that sustains the monsoon moisture transport has also strengthened significantly (Figure 1a). It is worth noting that Asian summer monsoon precipitation is significantly suppressed in India, the Bay of Bengal, the Indochina Peninsula, and Eastern China when the model only removes the surface sensible heating from topographies above 500 m (Figure 1b). This phenomenon of CAS FGOALS-based sensitive experiment suggests a significant modulation of Asian summer monsoon precipitation by surface sensible heating by Asian topography.
The WNP is a frequent region for TCs, and about 30–40 TCs are generated annually. TC is active in WNP from about May to November [55,56], which coincides with the typical cycle of the Asian summer monsoon. The extreme precipitation caused by TCs reaches hundreds of millimeters per day, which is one of the essential contributors to summer precipitation in East Asia. Some studies have pointed out that the extreme precipitation events caused by TCs activities will directly affect East Asian summer monsoon precipitation, especially in terms of total precipitation and variability aspects [57,58,59]. The track density of TC can synthesize the characteristics of TC generation, movement, landing, and influence range. The previous study shows that the variation of TC track density is regulated by large-scale factors. Previous studies found that the TC track densities in WNP and NA are modulated by ENSO, PDO, North Atlantic oscillation (NAO), Arctic oscillation (AO), etc. Topography is a significant large-scale external forcing in current climate system models, and the topographic changes will affect regional atmospheric circulation and climatic patterns.
Figure 2 shows the global track density anomalies of TCs. The result indicates that the uplift of the Asian topography promotes the formation and movement of TC globally, especially in the WNP. The value decreases by 4 in TC generation and movement in WNP when Asian topography is not considered in the model (Figure 2a). However, the track density in the NA is a seesaw-like variation. It is worth noting that there is still a significant reduction in global TC track density when the surface sensible heating is removed from topographies above 500 m in the model. The essential differences in TC track density between “AMIP-NTP” and “AMIP-NS” are concentrated in the South China Sea (SCS). In the “AMIP-NS,” TC track density shows a negative bias in the SCS but a positive bias in the “AMIP-NTP.” This phenomenon suggests that surface sensible heating from Asian topography will inhibit the westward movement of TCs. Furthermore, Asian topography can directly affect the number of TCs globally. Figure 3 shows the climatological number of tropical cyclones in the three experiments, and the results indicate that the presence of Asian topography allows for more TC generation. The contribution of the Asian topography to the number of TCs reached about 50% in WNP, South Pacific (SP), and North Indian Ocean (NI). The results indicate that both the dynamic and thermal effects of Asian topography have significant impacts on the formation and tracks of global TCs.

4. Possible Reasons for the Influence of Asian Topography on Tropical Cyclone Activities

4.1. The Changes in Large-Scale Factors Associated with Tropical Cyclone Activities

Many studies have pointed out that large-scale factors directly determine the generation and development of TCs [60,61,62]. Since the TC events in the model experiments are directly identified by our tracker, it is necessary to analyze the changes in the large-scale factors used for TC identification. The warm core, sea-level pressure, surface wind, and 850-hPa vorticity are used to identify global TC activity. The results indicate that there is a positive bias of warm core in the TCs generation and movement region in “AMIP-NTP” (Figure 4a) and “AMIP-NS” (Figure 4b), which means the Asian topography is conducive to the formation and maintenance of warm core in the middle and upper troposphere. Besides, the negative bias of sea-level pressure (Figure 4c,d) and the positive bias of surface wind (Figure 4e,f) and 850-hPa vorticity (Figure 4g,h) favor the generation and development of TCs, especially in WNP.
Furthermore, the genesis potential index (GPI) [15] is used to explain the connection between the TC genesis and large-scale pattern. The GPI used in this paper is defined as:
G P I = 10 5 v o r t 850 3 2 R H 50 V m 70 1 + 0.1 V s h e a r 2
where vort850 is the 850-hPa absolute vorticity (s−1), RH is the 600-hPa relative humidity (%), Vm is the maximum potential intensity [14], and Vshear is the magnitude of the wind shear between 850 hPa and 200 hPa (m s−1). Figure 5 shows the annual tropical cyclone GPI, and the results indicate that the GPI is decreasing globally, especially in WNP. This phenomenon suggests that the relationship between large-scale factors and TCs is weakened when we remove the effect of Asian topography (Figure 5b,c) in the model compared to the AMIP run (Figure 5a). We further analyzed the contribution of each of the GPI to the overall changes (Figure 6), and the results indicate that there is a positive bias of 600-hPa relative humidity in “AMIP-NTP” and “AMIP-NS,” and a negative bias of the wind shear between 850 hPa and 200 hPa, which are favorable to the generation and development of TCs. Besides, the western Pacific Subtropical High (WPSH) has a regulatory effect on East Asian summer monsoon (EASM) and WNP TCs activities [63,64]. The researcher [65] found a robust correlation between 850-hPa geopotential high and TCs in WNP. When the 850-hPa geopotential high is strengthened, the generation and development of TCs will be inhibited. Figure 7 shows the differences in annual 850-hPa geopotential high in WNP, and the result indicates that the presence of Asian topography suppresses the intensity of subtropical high in WNP, which provides a large-scale environment for the generation and development of TCs.

4.2. Asian Topography Affects the Phase Variation of Madden–Julian Oscillation (MJO)

There is clear evidence of the connection between MJO and tropical cyclone activity worldwide [13,61]. The researchers [12] summarized the connection between the MJO and global tropical cyclone activity and found that the MJO affects the formation and movement of tropical cyclones in each phase. Figure 8 shows the composite May–October 20–100-day precipitation and 850-hPa wind as a function of the MJO phase. Phase 6 and phase 7 of MJO indicate that the center of the MJO system is in the WNP, which will modulate the large-scale regional circulation. The previous study [66] found that the Asian topography promotes the activity of the boreal summer intraseasonal oscillation (BSISO). The results indicate that Asian topography facilitates the spread of MJO in the WNP. Both in “AMIP-NS” (Figure 8a,b) and “AMIP-NTP” (Figure 8c,d), the WNP exhibit evident westerly wind anomalies, which favor the propagation of the MJO. Besides, Asian topography promotes precipitation due to MJO in WNP.

5. Discussion and Conclusions

The role of Asian topography on TC formation was discussed based on the dataset of CAS FGOALS-f3 that participated in the GMMIP, the MIP endorsement of CMIP6. Three experiments are designed to quantify the impact of Asian topography on regional and global weather and climate. CAS FGOALS-f3 provides a long-term dataset with six-hour intervals, which provides a possibility for TCs detection. The previous study [43] has proved that CAS FGOALS-L can simulate the climatology, seasonal cycle, and interannual variability of TCs globally, which provides the model basis to carry out TC research. Based on the Tier 3 experiment of GMMIP, the impact of Asian topography on TC activity in climatology has been given. Then the possible reasons have to be discussed in order to understand these phenomena. The main findings and conclusions in this study are shown as follows:
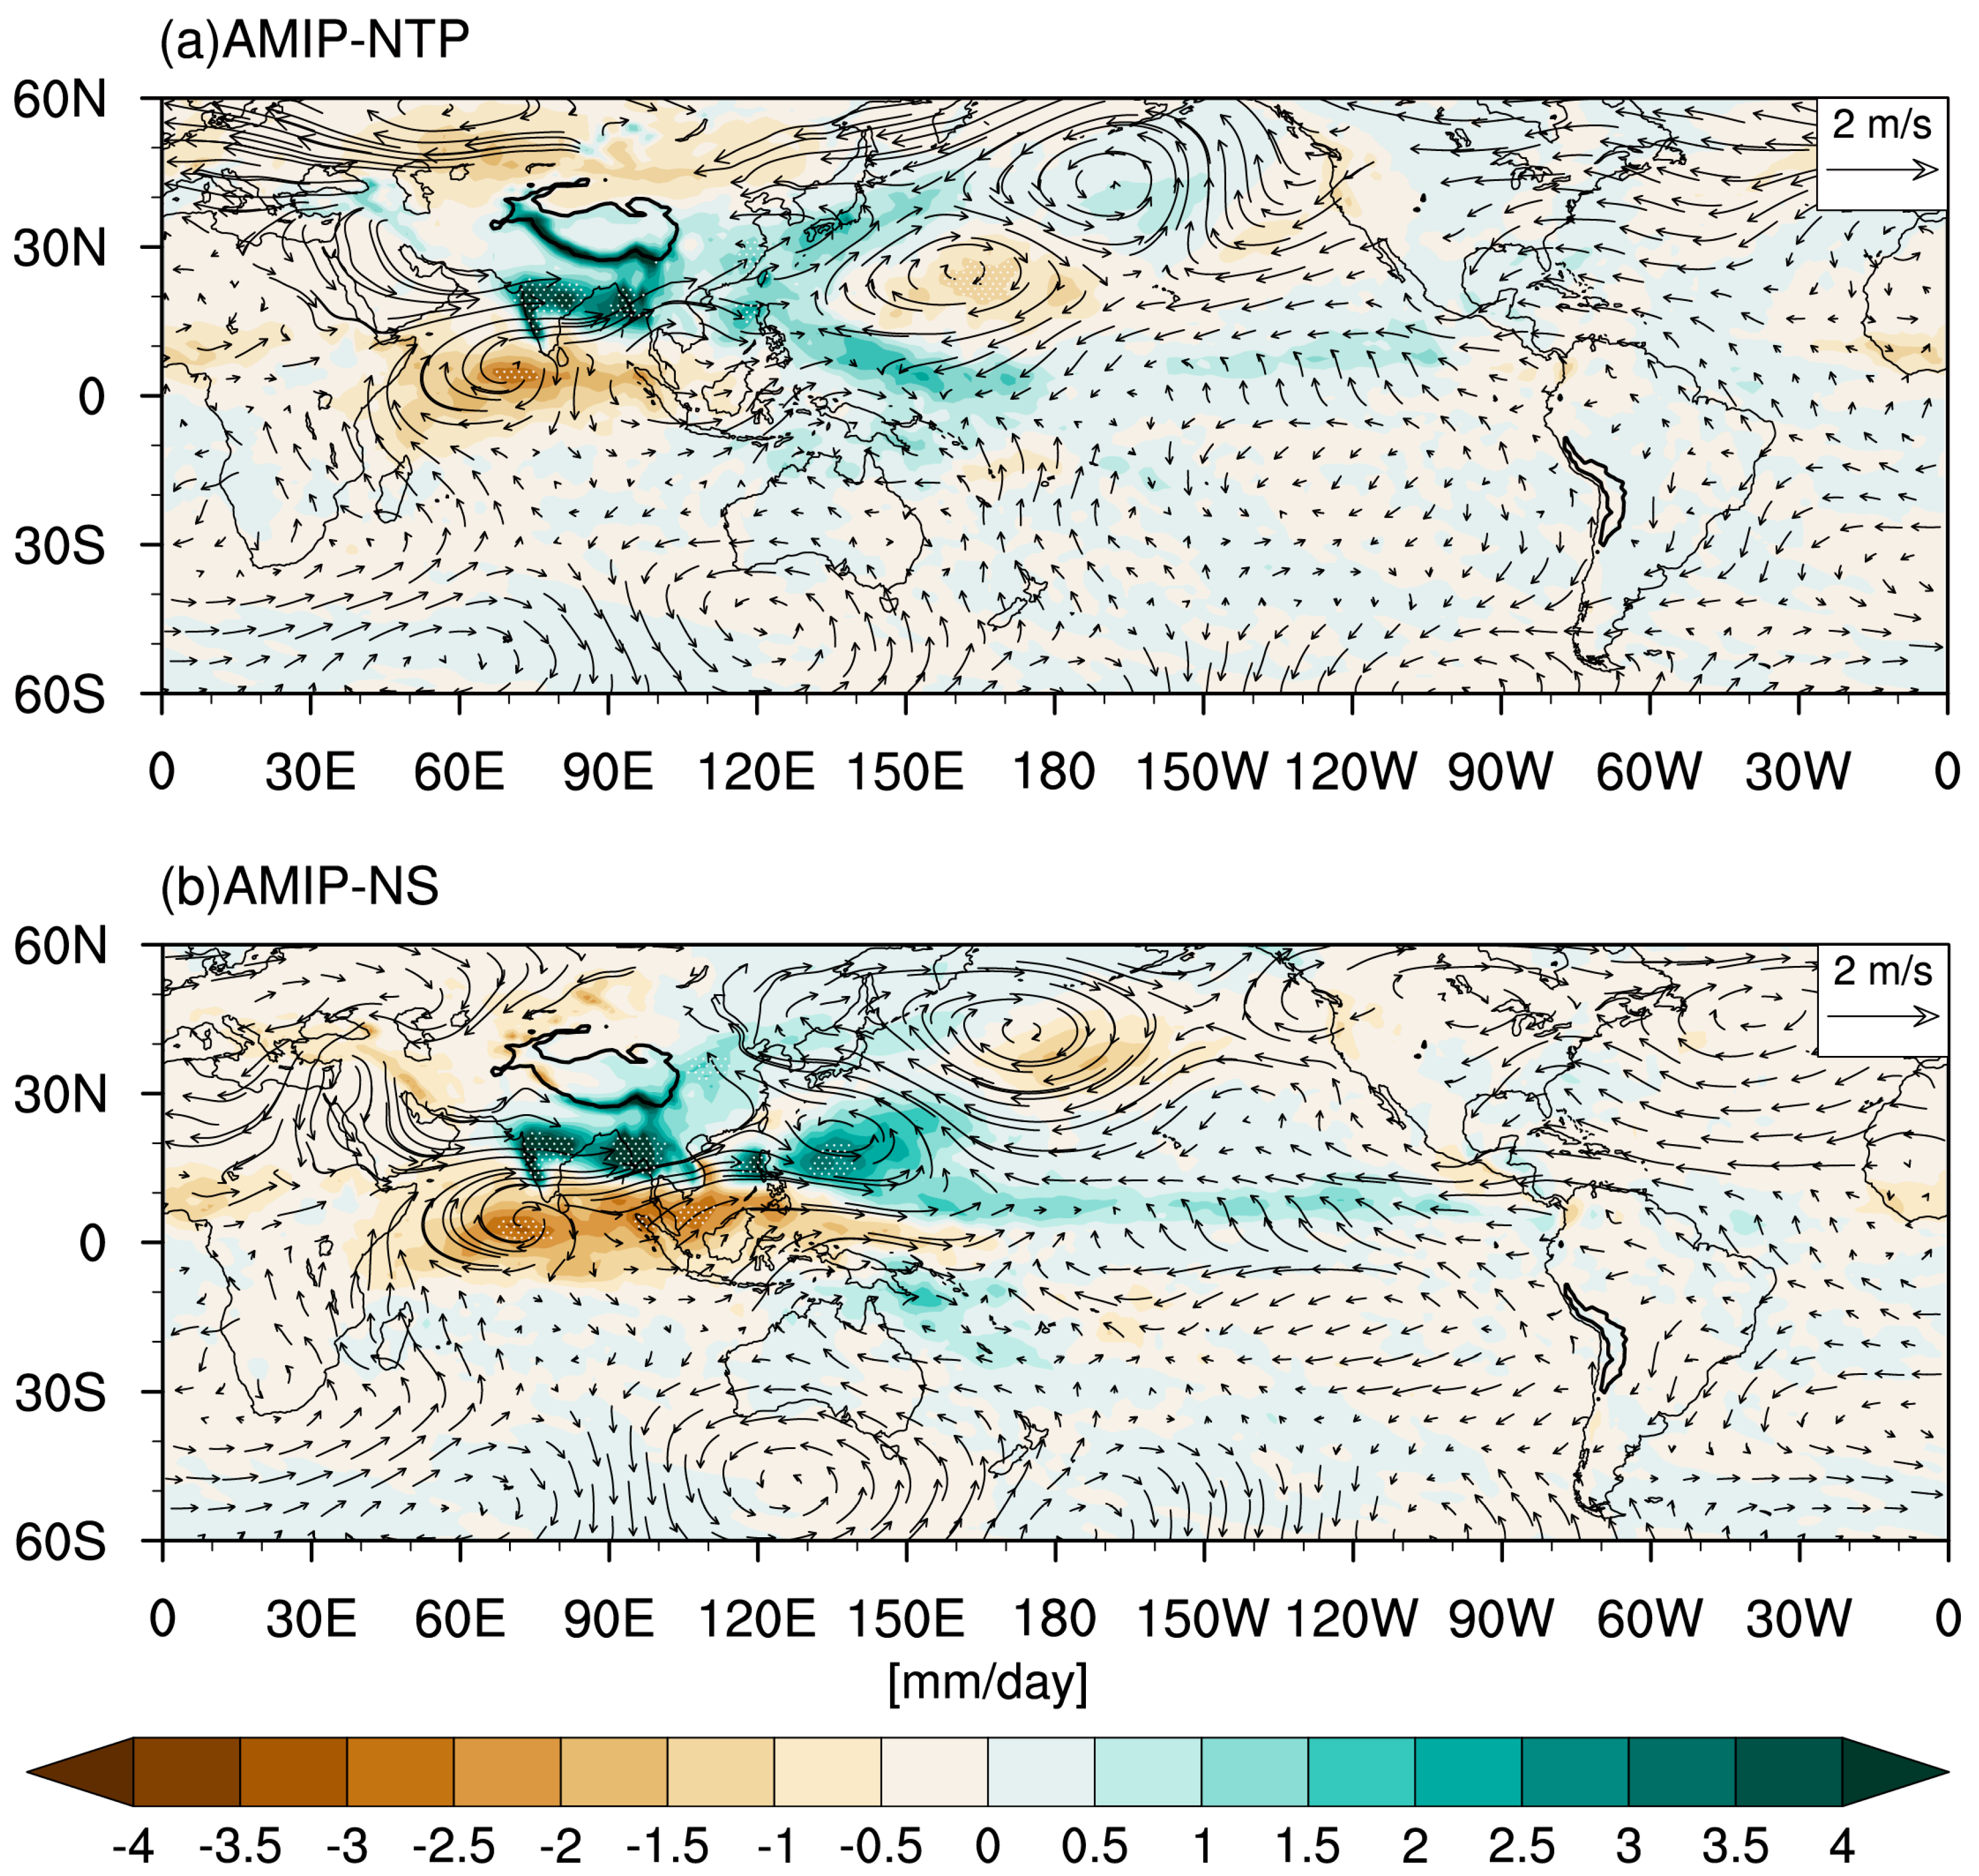
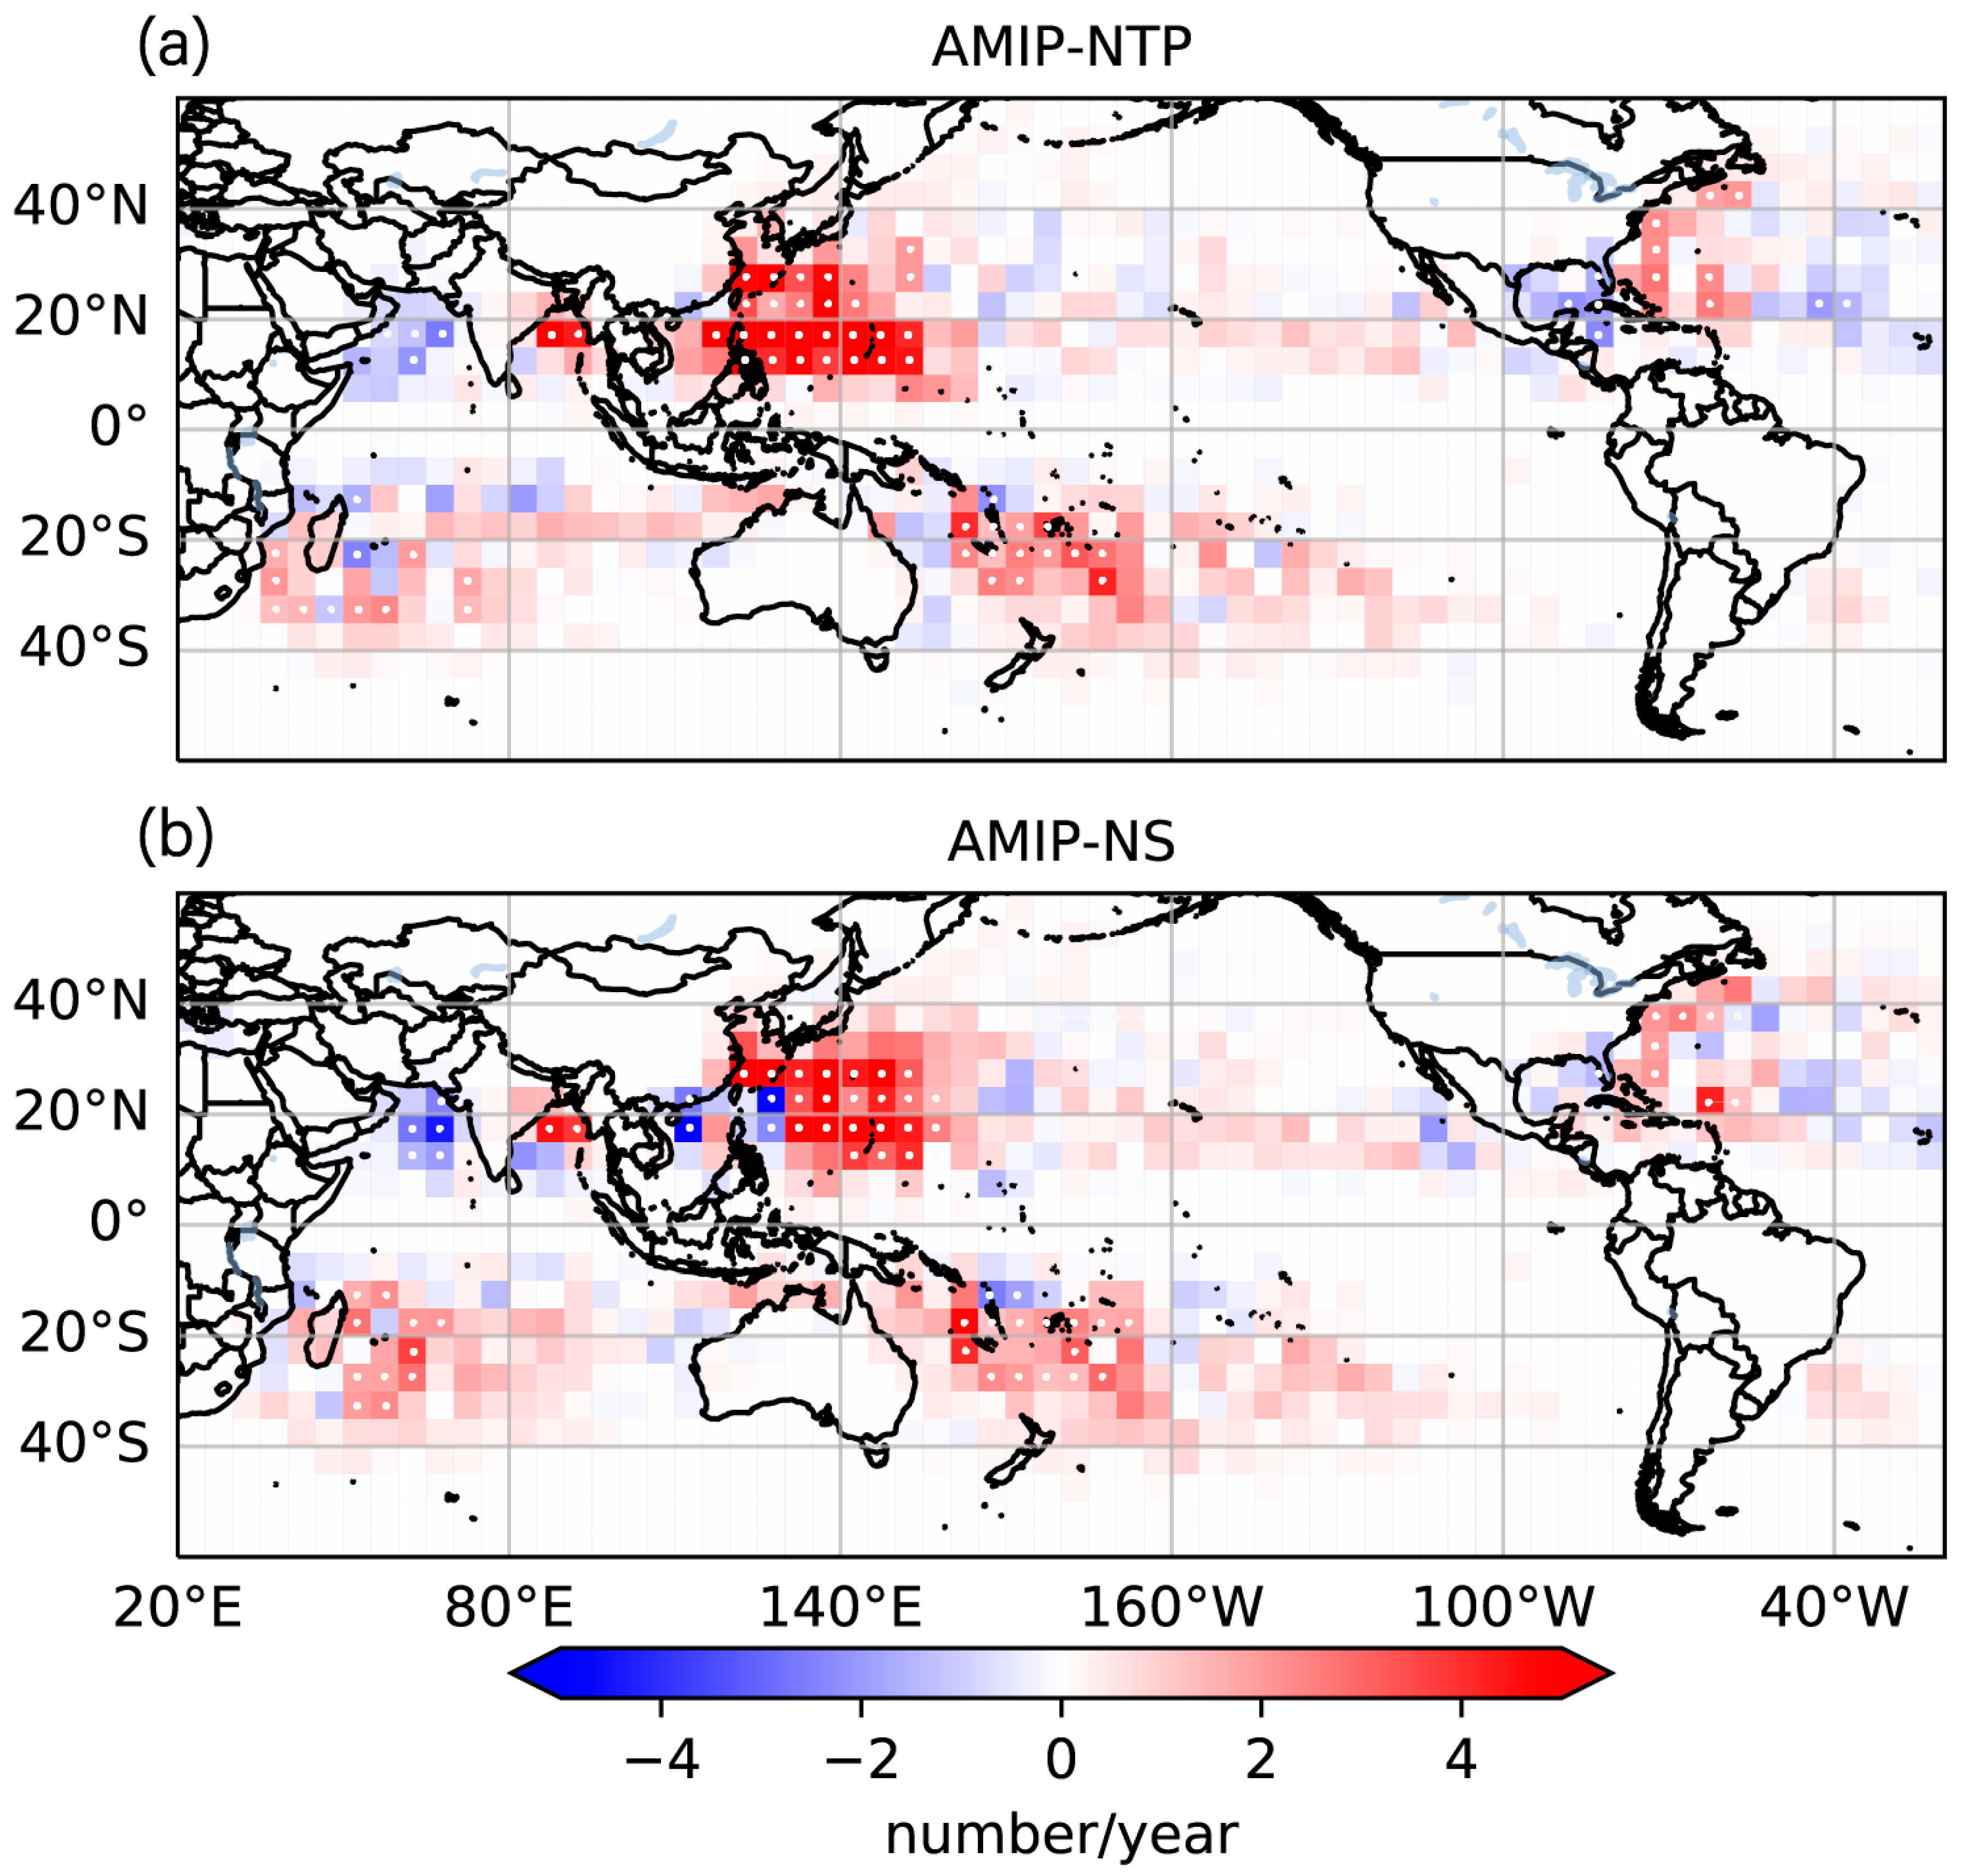
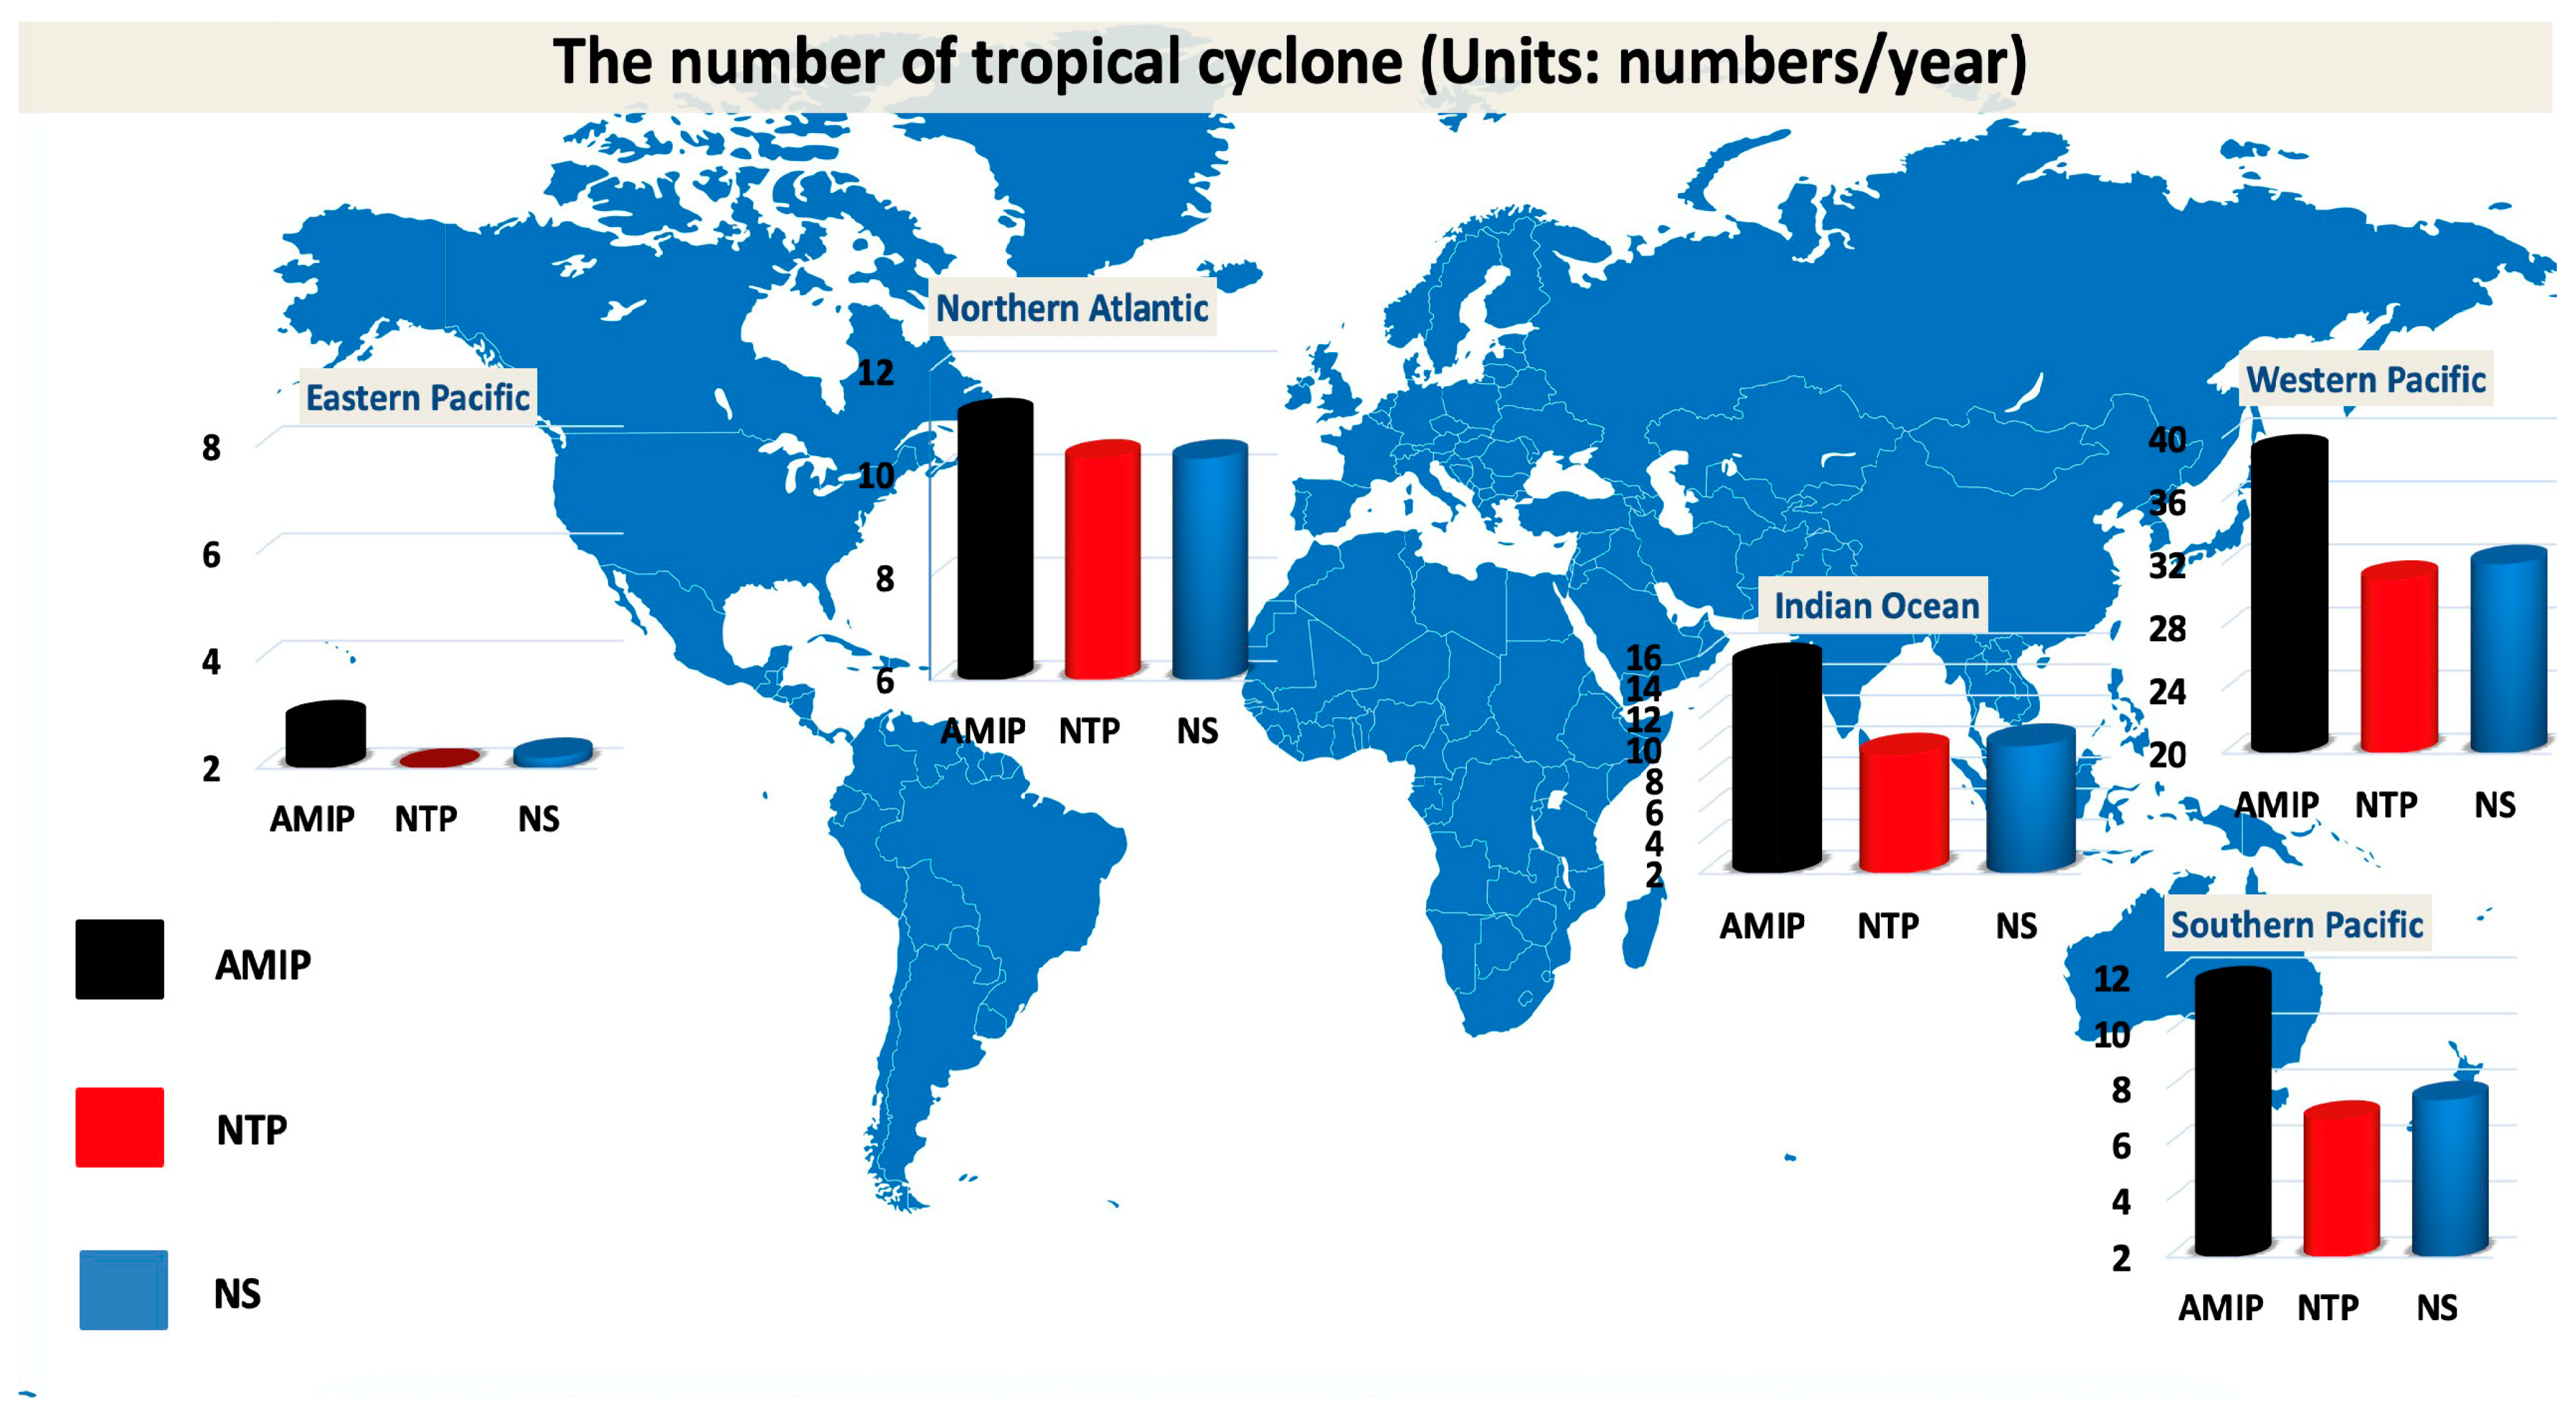
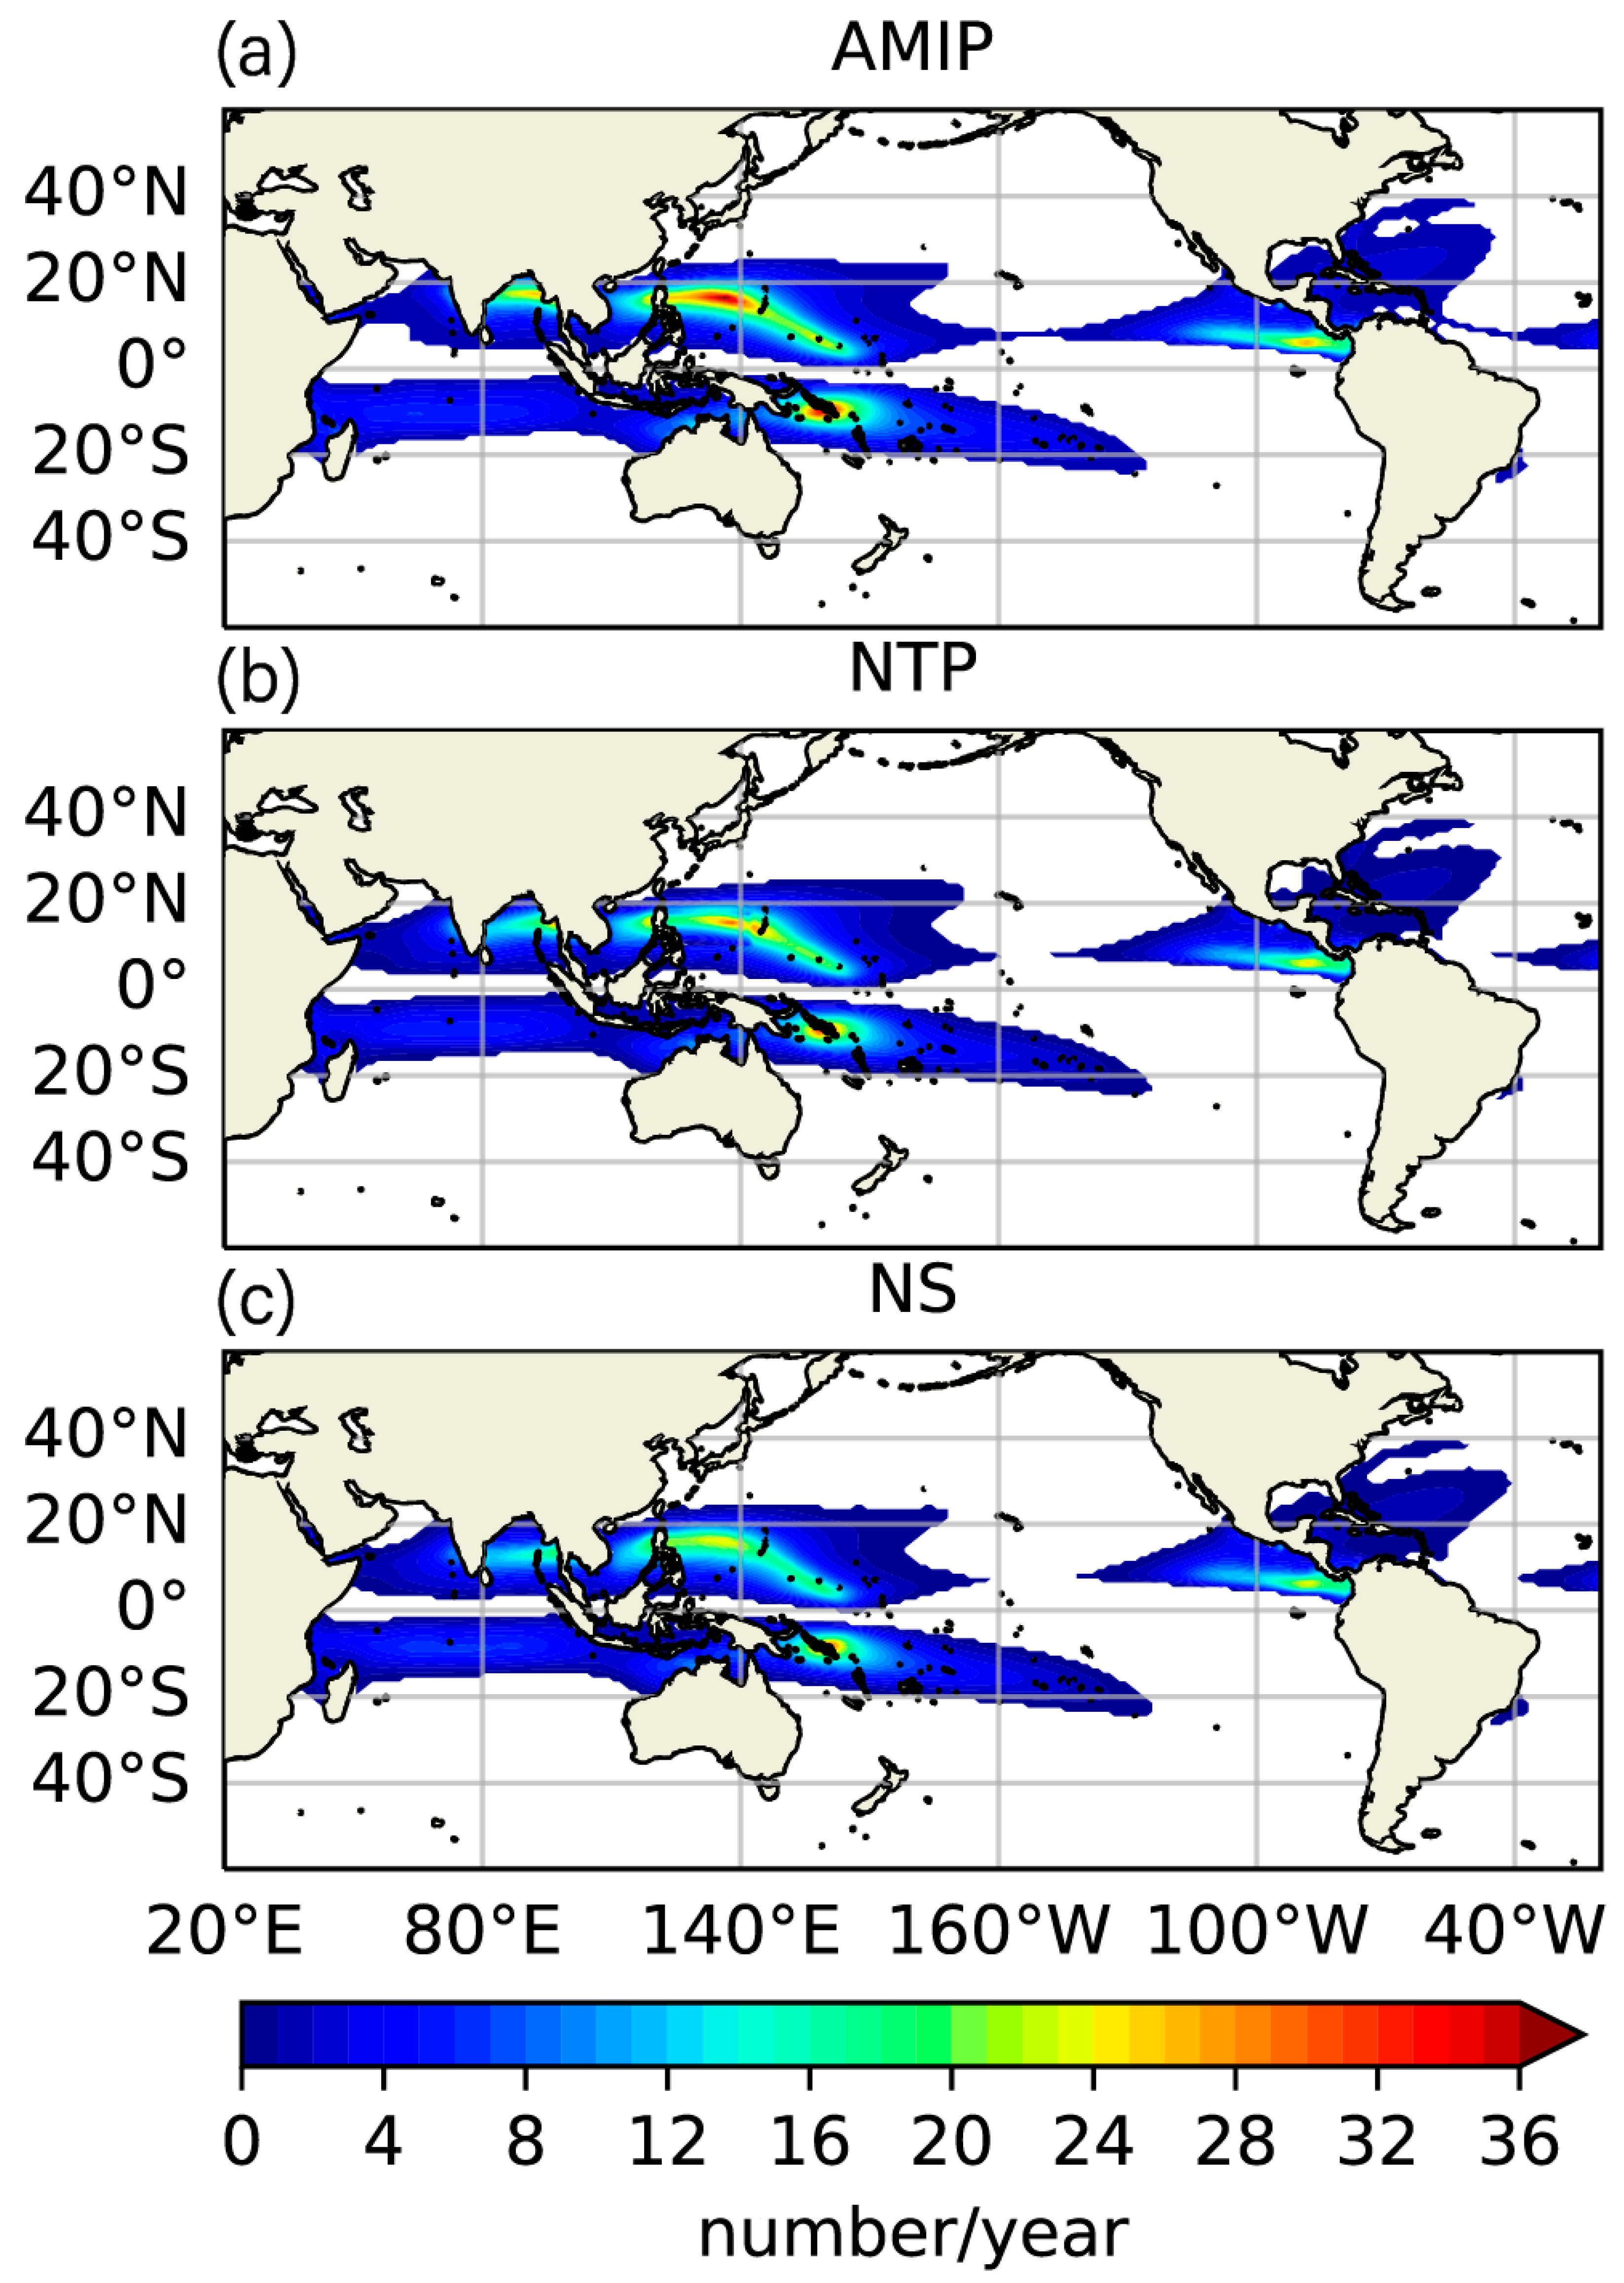
  • Asian topography promotes the formation and precipitation of the Asian summer monsoon. We analyzed the changes of TCs, under the background of southwest winds and positive precipitation anomalies. The results indicate that the Asian topography promotes the generation and development of TCs, especially in WNP. It is worth noting that there is still a positive bias of TC track density in “AMIP-NS”, which means the thermal effect of Asian topography is also essential for TC formation and development.
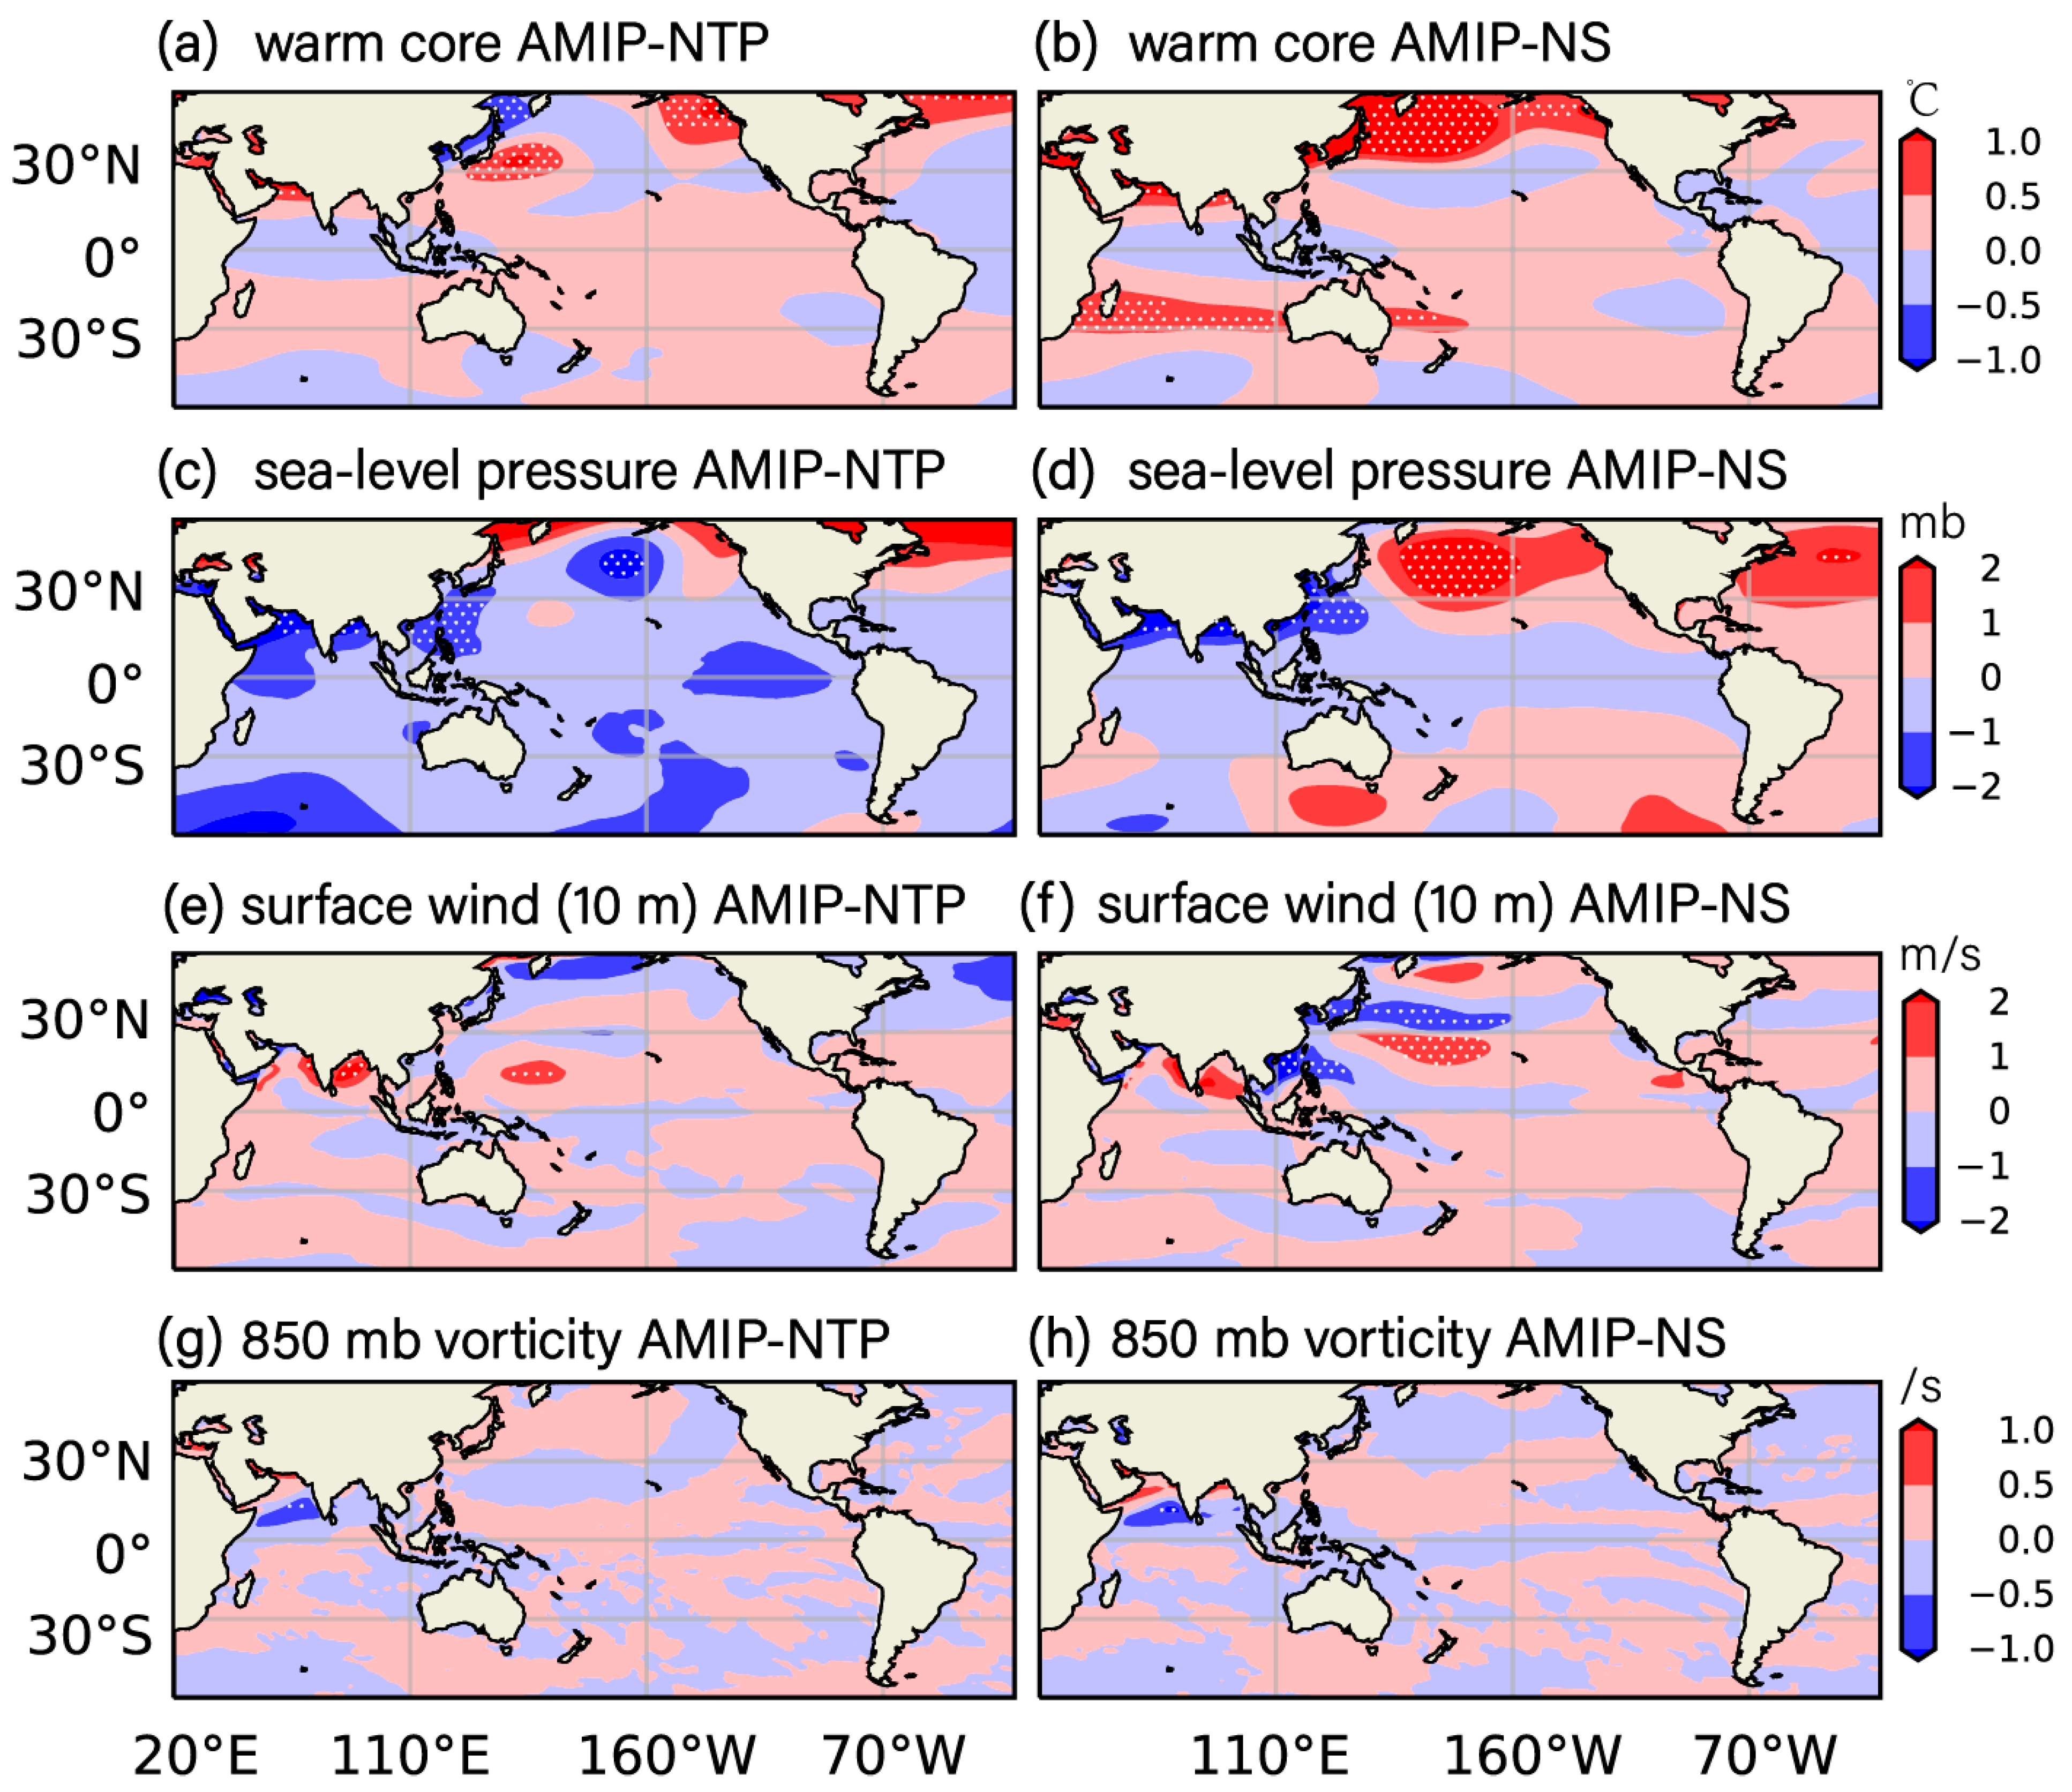
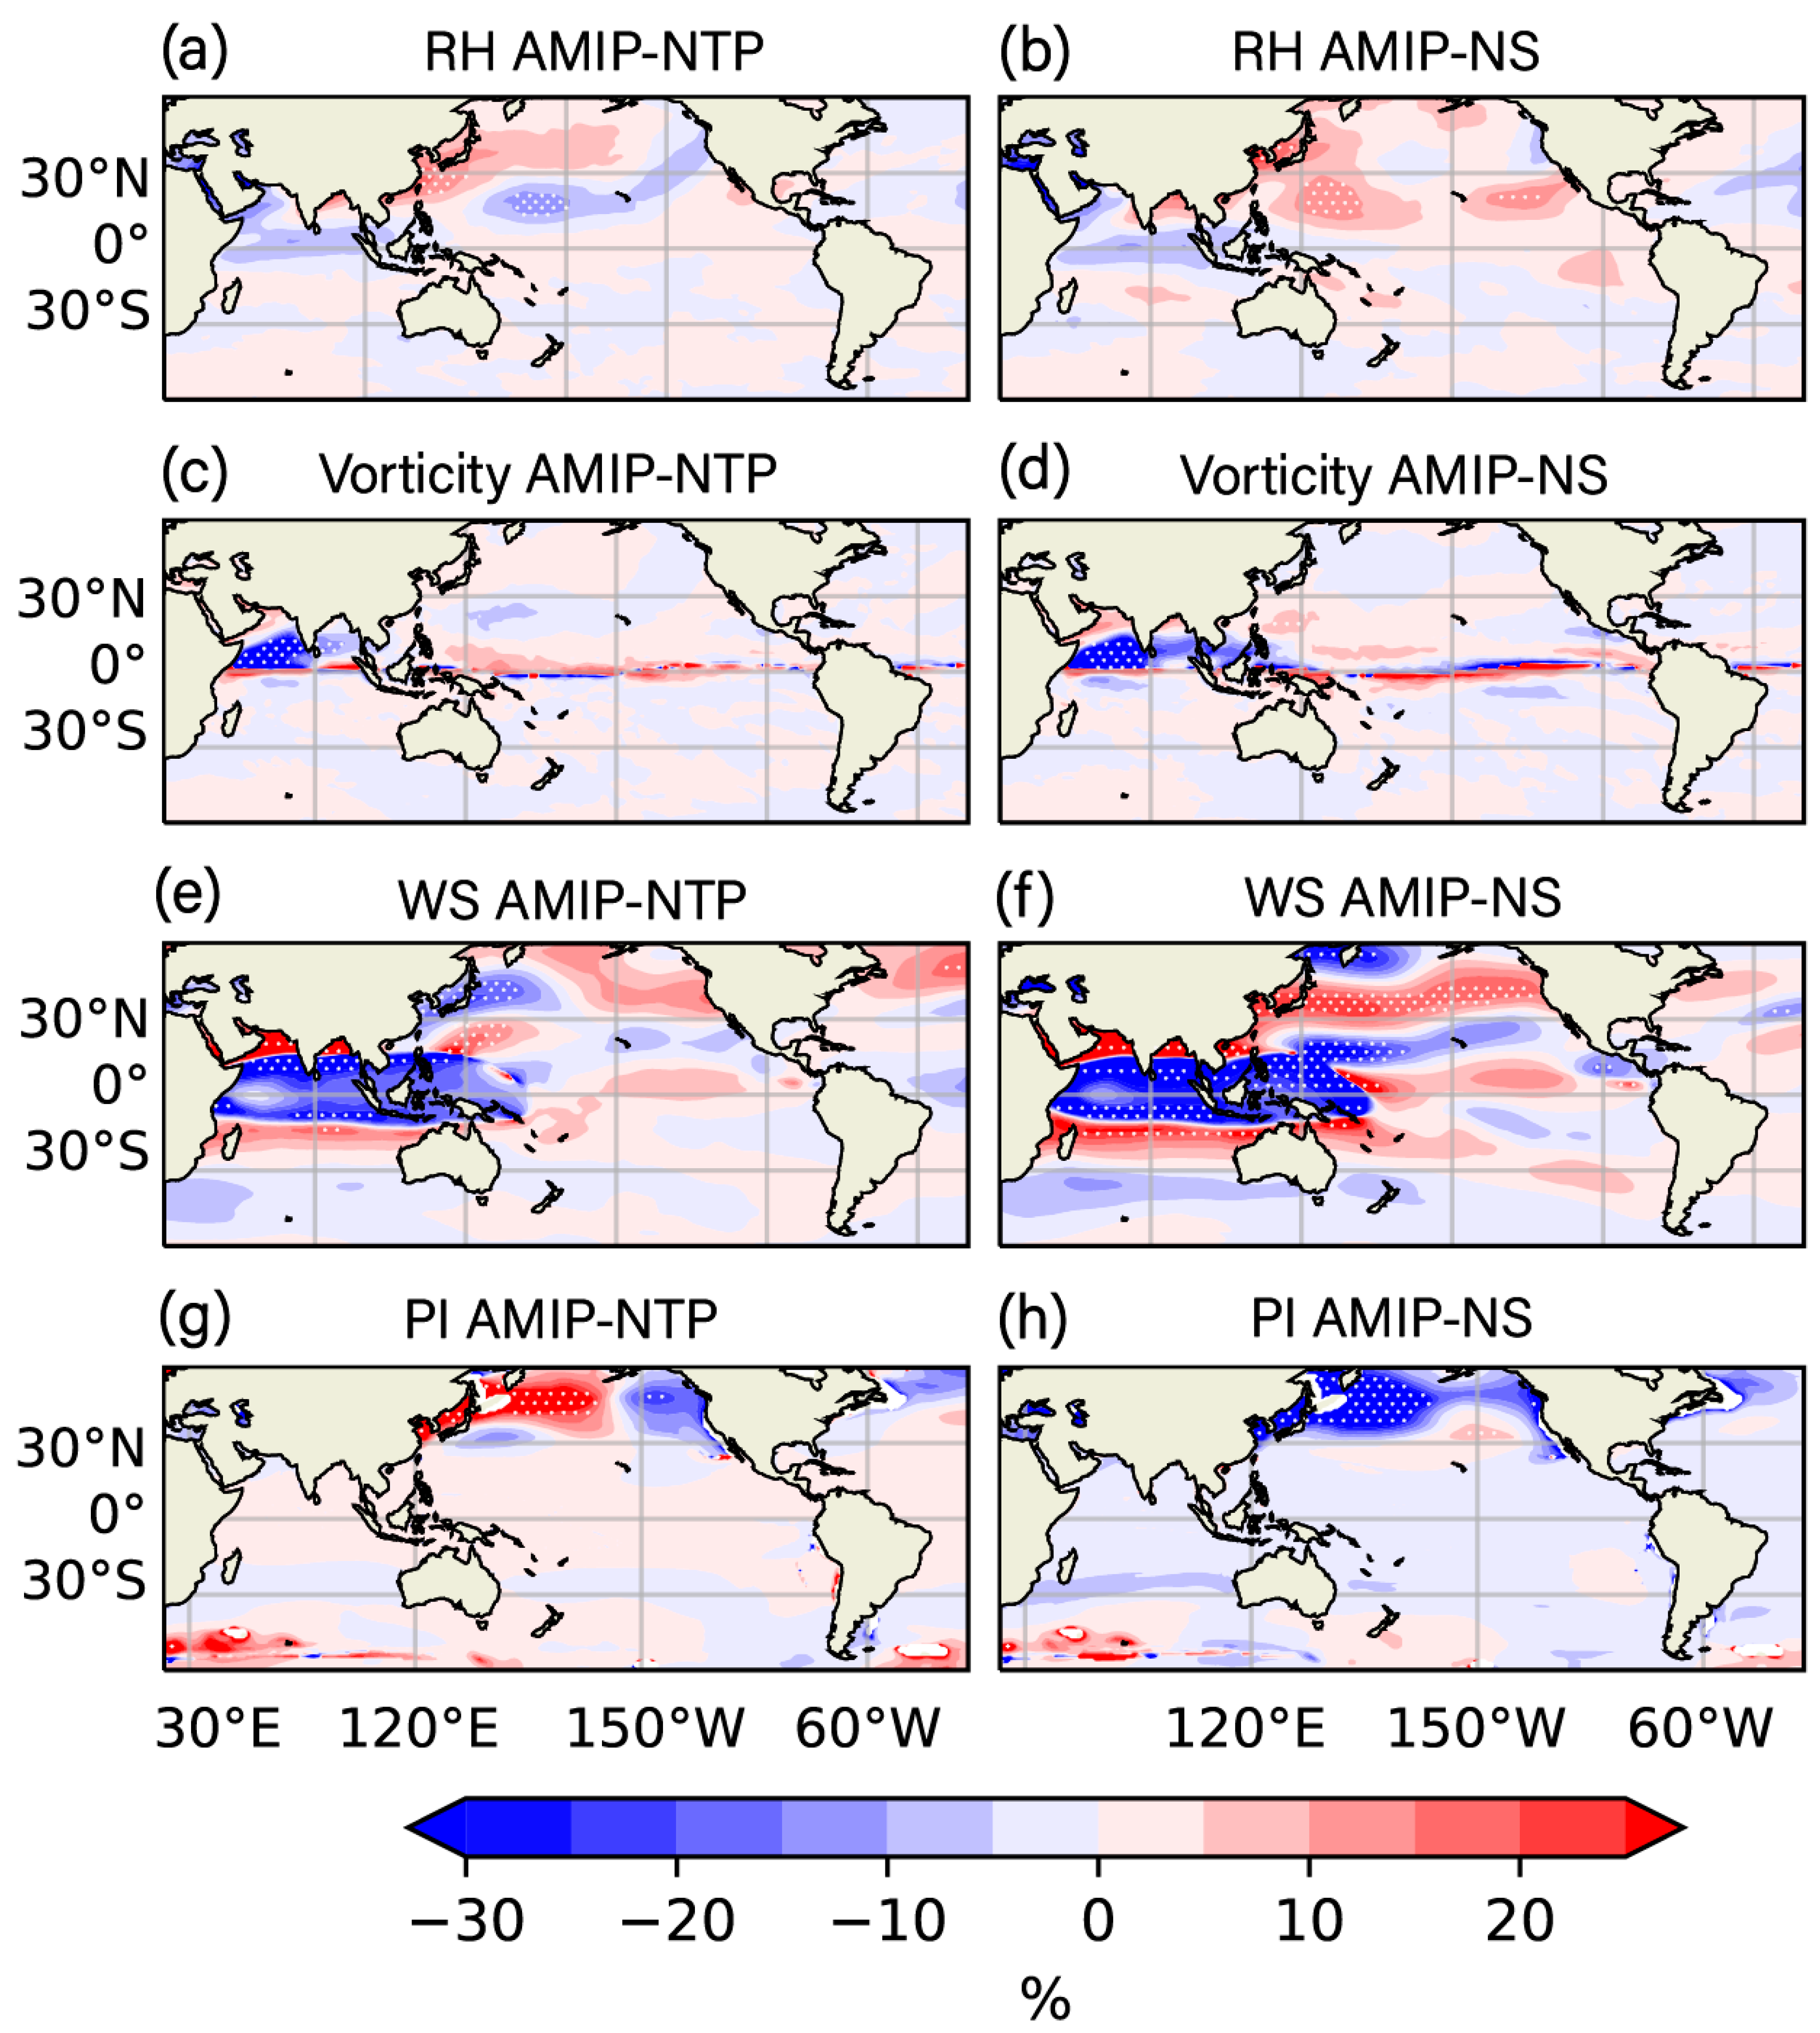
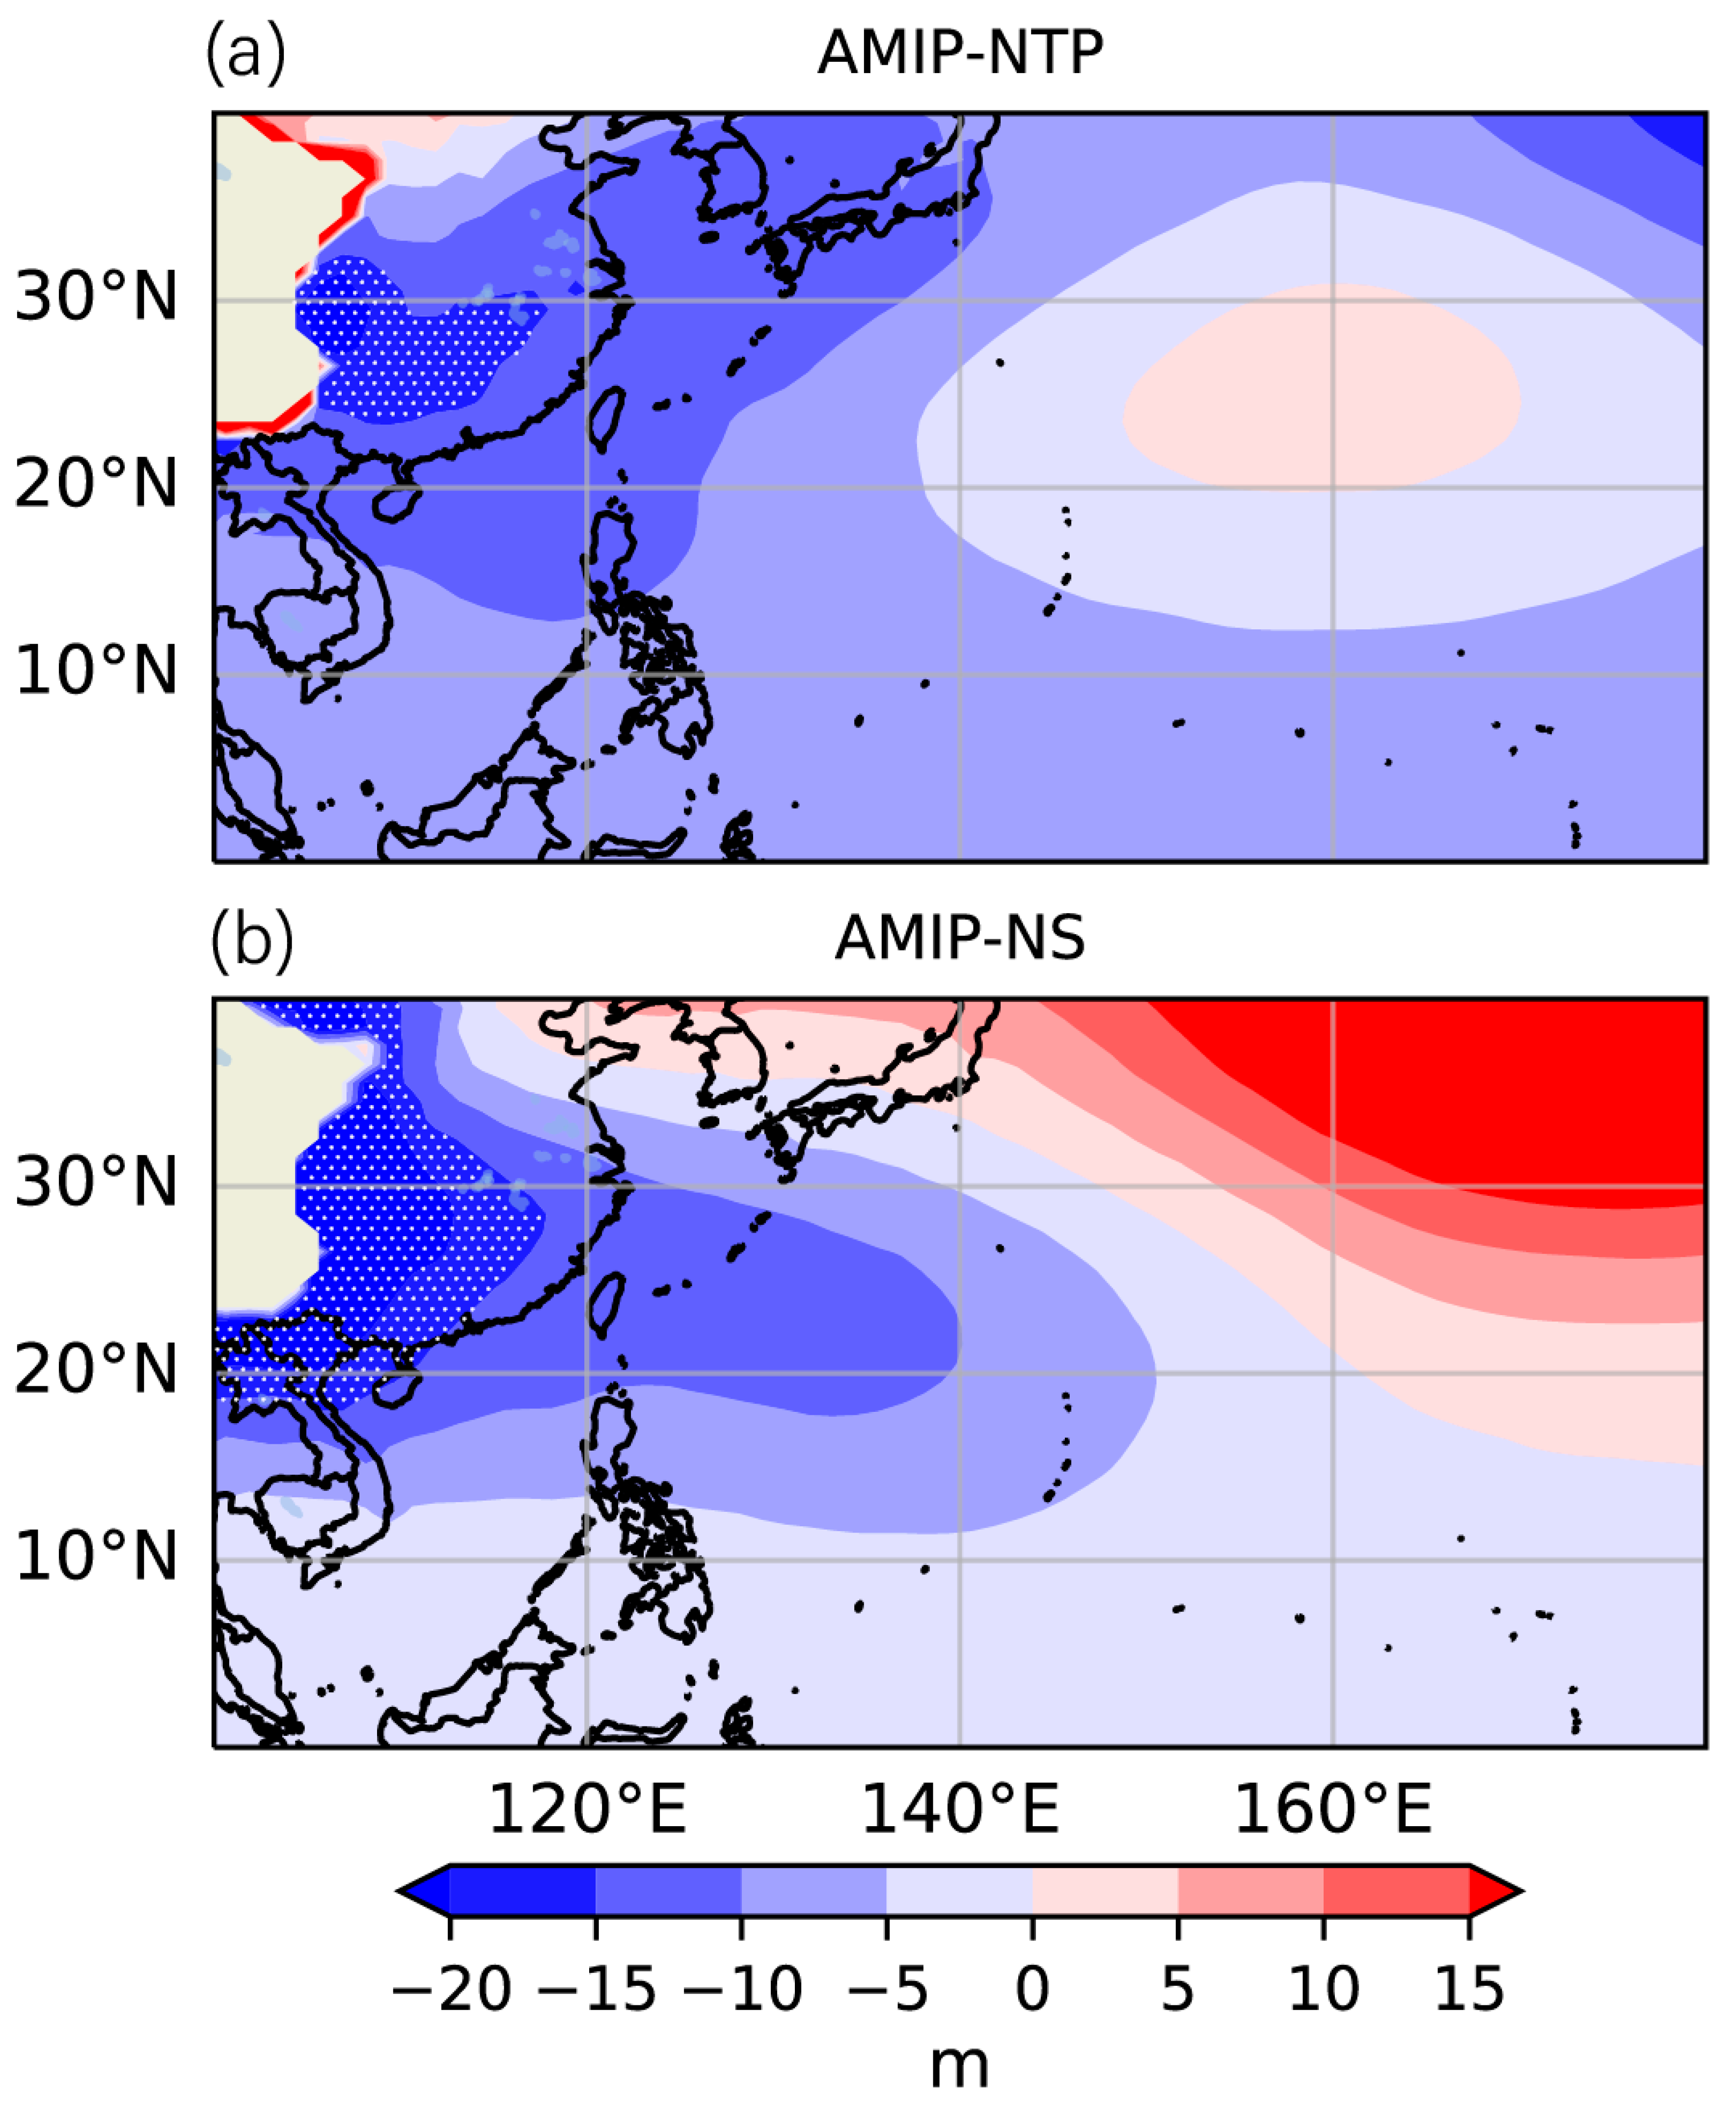
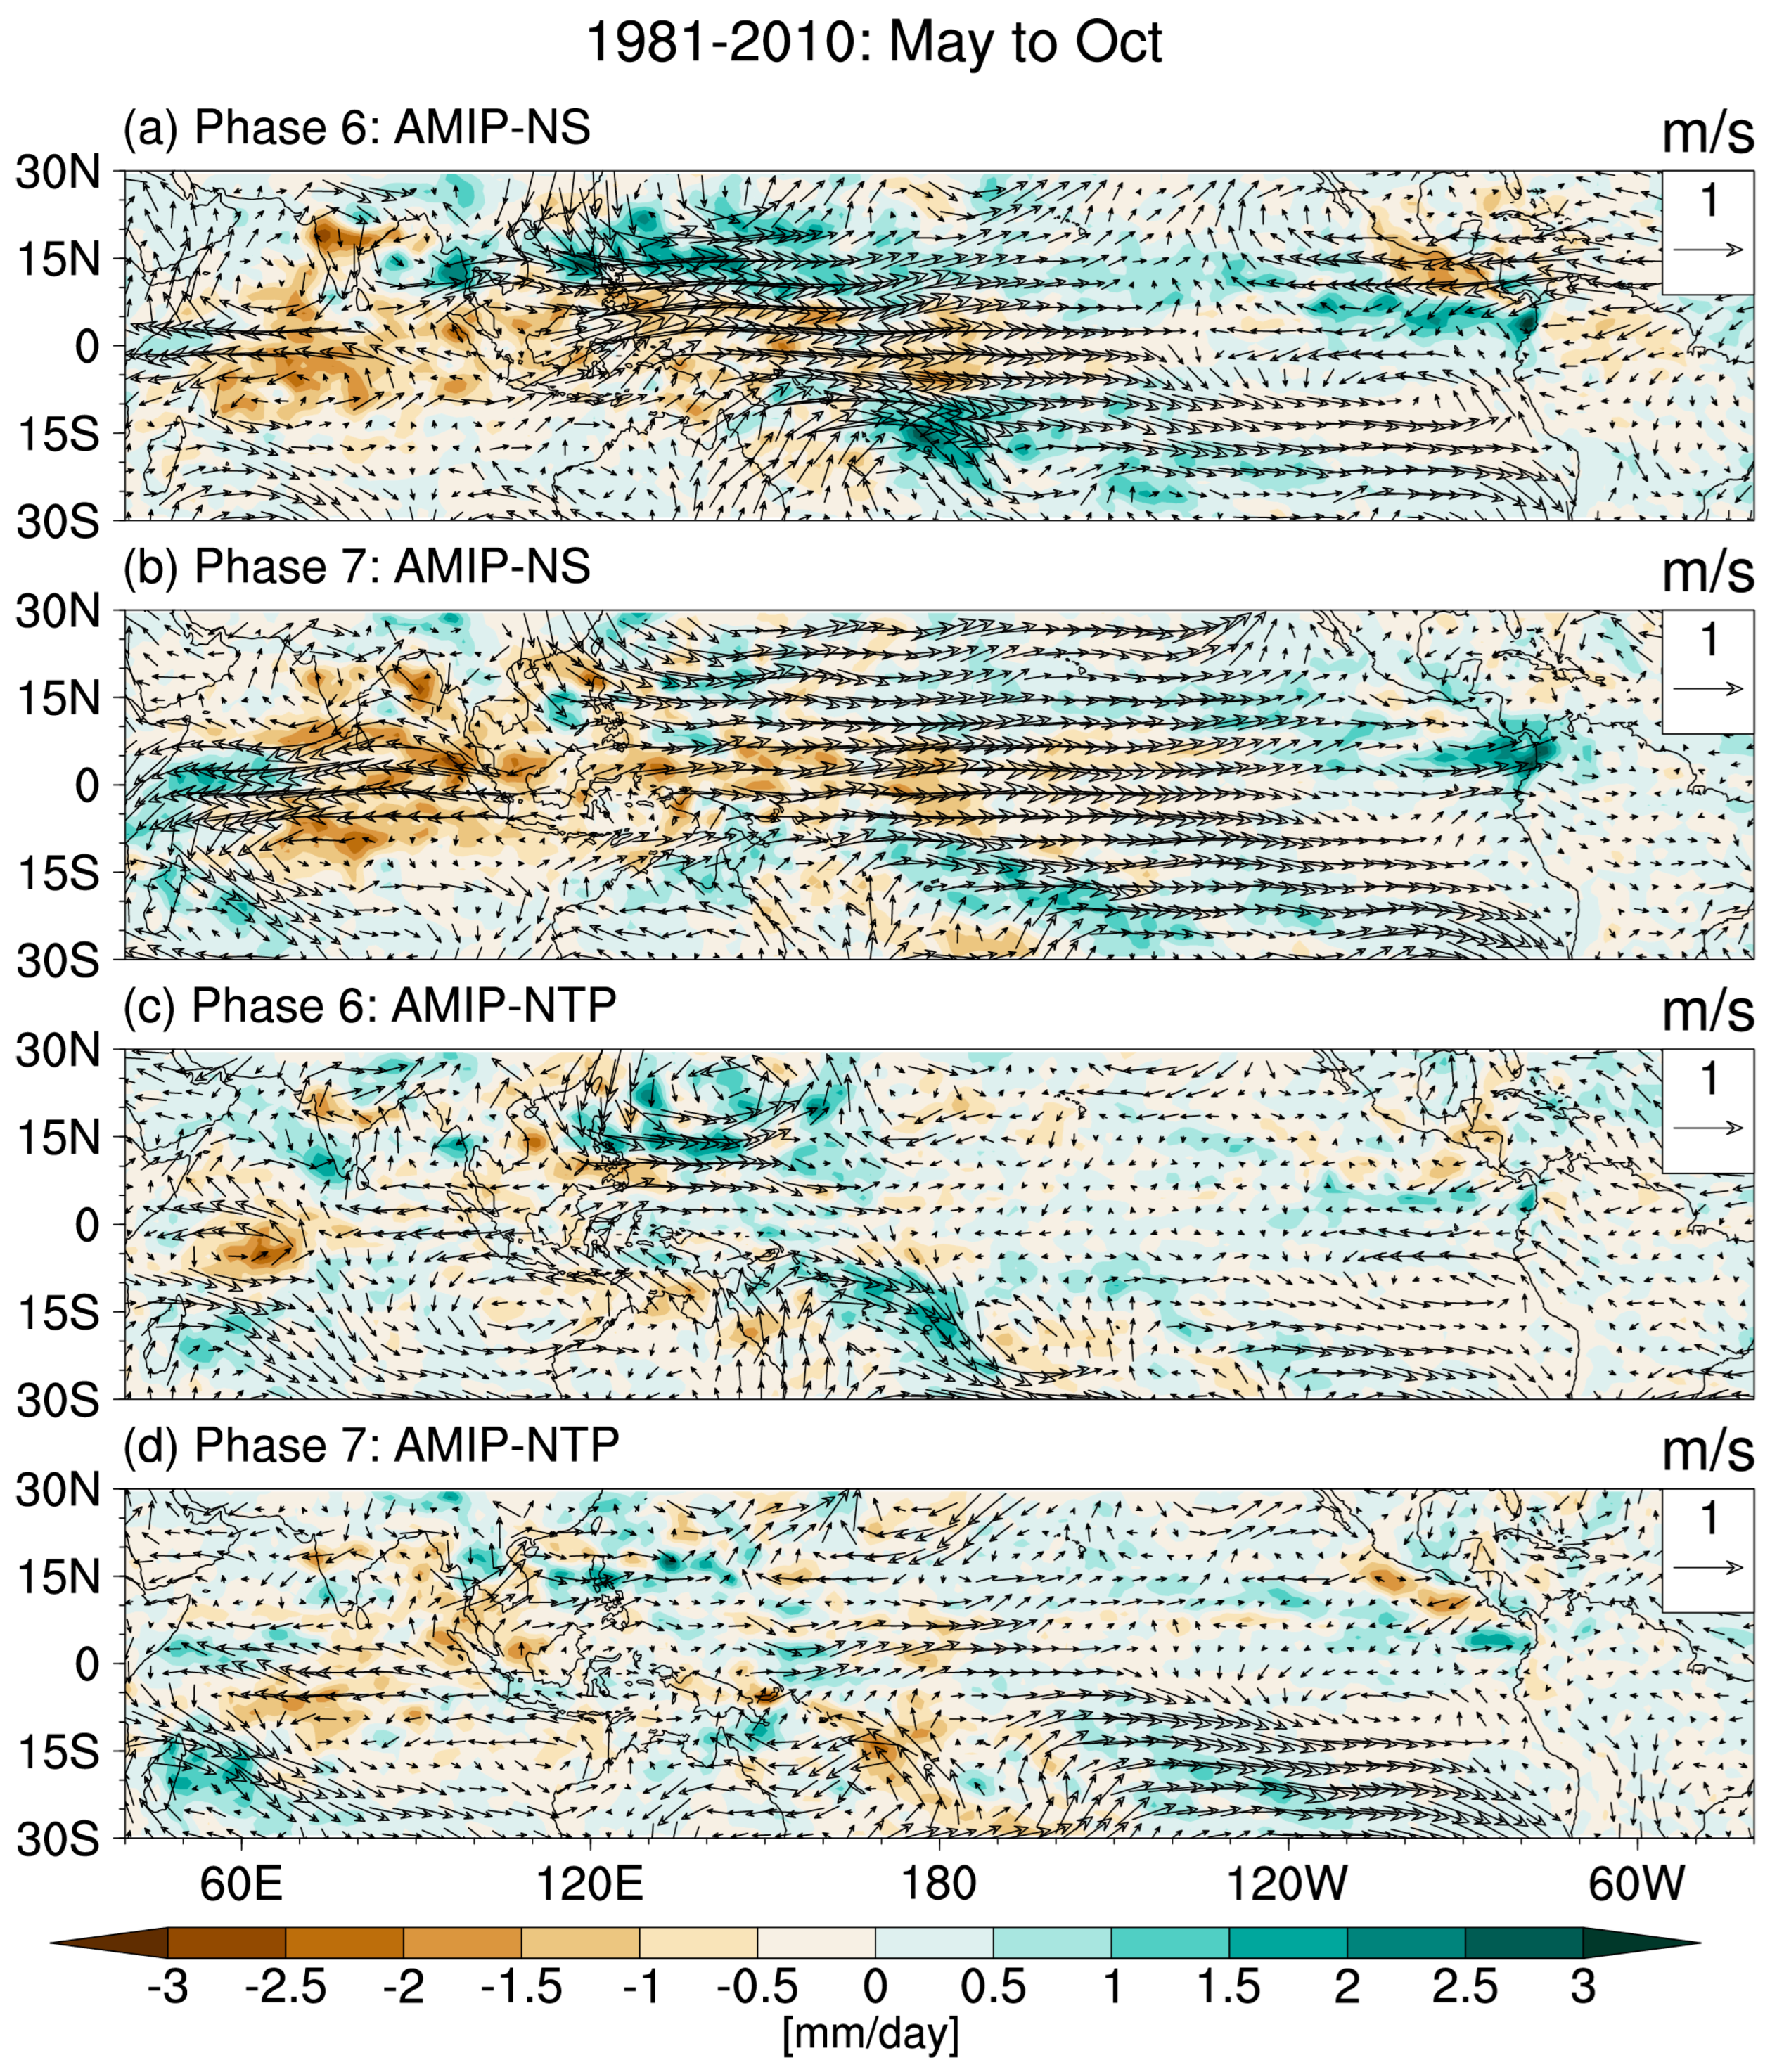
  • In terms of large-scale factors and MJO activity, the possible reasons that the Asian topography modulates the regional TC activities are given. The results indicate that the presence of Asian topography is conducive to the formation of warm core and sea-level pressure, which make a positive contribution to the generation and development of TCs. The genesis potential (GPI is used to explain the connection between the TC genesis and large-scale pattern, and the result indicates that the GPI globally decreased when the Asian topography or surface sensible heating was removed from the CAS FGOALS-f3-L. On the other hand, the existence of Asian topography will facilitate the eastward propagation and the precipitation of MJO, which provides a large-scale environment for TC generation and development.
The results of this study indicate that both the dynamic and thermodynamic effects of Asian topography have a significant impact on the activity of regional and global tropical cyclones. The mechanisms and possible reasons for this phenomenon require further investigation. The main issues that need to be further investigated in the future are: (1) It is necessary to clarify the model dependency of the impact of the dynamic and thermal effects of Asian topography on global TCs activity. We need to perform sensitivity experiments using more numerical models. (2) The air-sea interaction needs to be considered in numerical experiments to explore the impact of Asian topography on ocean processes. Previous studies have found that Asian topography can affect sea surface temperature and thus influence the formation of TCs [67].

Funding

This research was supported by the National Natural Science Foundation of China (grant no. 42005117), the Strategic Priority Research Program of the Chinese Academy of Sciences (grant no. XDB40030205), and the Key Special Project for the Introduced Talents Team of the Southern Marine Science and Engineering Guangdong Laboratory (Guangdong) (grant no. GML2019ZD0601).

Informed Consent Statement

Informed consent was obtained from all subjects involved in the study.

Data Availability Statement

All observed and reanalysis dataset used in this study are freely available for public. The IBTrACS datasets are from https://www.ncei.noaa.gov/data/international-best-track-archive-for-climate-stewardship-ibtracs/v04r00/access/csv/, accessed on 20 May 2023; amip-hist data are from http://doi.org/10.22033/ESGF/CMIP6.3182, accessed on 20 May 2023. The other two experiments named amip-TIP and amip-TIP-nosh are from http://doi.org/10.22033/ESGF/CMIP6.3186, accessed on 20 May 2023 and http://doi.org/10.22033/ESGF/CMIP6.3189, accessed on 29 May 2023.

Conflicts of Interest

The authors declare no conflict of interest.

References

  1. Emanuel, K. Will global warming make hurricane forecasting more difficult? Bull. Am. Meteorol. Soc. 2017, 98, 495–501. [Google Scholar] [CrossRef]
  2. Tippett, M.K.; Camargo, S.J.; Sobel, A.H. A Poisson regression index for tropical cyclone genesis and the role of large-scale vorticity in genesis. J. Clim. 2011, 24, 2335–2357. [Google Scholar] [CrossRef]
  3. Wu, L.; Wang, B. Assessing impacts of global warming on tropical cyclone tracks. J. Clim. 2004, 17, 1686–1698. [Google Scholar] [CrossRef]
  4. Zhang, W.; Vecchi, G.A.; Murakami, H.; Villarini, G.; Delworth, T.L.; Yang, X.; Jia, L. Dominant role of Atlantic Multidecadal Oscillation in the recent decadal changes in western North Pacific tropical cyclone activity. Geophys. Res. Lett. 2018, 45, 354–362. [Google Scholar] [CrossRef]
  5. Girishkumar, M.; Prakash, V.T.; Ravichandran, M. Influence of Pacific Decadal Oscillation on the relationship between ENSO and tropical cyclone activity in the Bay of Bengal during October–December. Clim. Dyn. 2015, 44, 3469–3479. [Google Scholar] [CrossRef]
  6. Lee, H.S.; Yamashita, T.; Mishima, T. Multi-decadal variations of ENSO, the Pacific Decadal Oscillation and tropical cyclones in the western North Pacific. Prog. Oceanogr. 2012, 105, 67–80. [Google Scholar] [CrossRef]
  7. Rasmusson, E.M.; Wallace, J.M. Meteorological aspects of the El Nino/southern oscillation. Science 1983, 222, 1195–1202. [Google Scholar] [CrossRef]
  8. Trenberth, K.E.; Hoar, T.J. The 1990–1995 El Niño-Southern Oscillation event: Longest on record. Geophys. Res. Lett. 1996, 23, 57–60. [Google Scholar] [CrossRef]
  9. Chan, J.C. Tropical cyclone activity in the northwest Pacific in relation to the El Niño/Southern Oscillation phenomenon. Mon. Weather Rev. 1985, 113, 599–606. [Google Scholar] [CrossRef]
  10. Chan, J.C. Tropical cyclone activity in the western North Pacific in relation to the stratospheric quasi-biennial oscillation. Mon. Weather Rev. 1995, 123, 2567–2571. [Google Scholar] [CrossRef]
  11. Camargo, S.J.; Sobel, A.H. Western North Pacific tropical cyclone intensity and ENSO. J. Clim. 2005, 18, 2996–3006. [Google Scholar] [CrossRef]
  12. Zhang, C. Madden–Julian oscillation: Bridging weather and climate. Bull. Am. Meteorol. Soc. 2013, 94, 1849–1870. [Google Scholar] [CrossRef]
  13. Klotzbach, P.J. The Madden–Julian oscillation’s impacts on worldwide tropical cyclone activity. J. Clim. 2014, 27, 2317–2330. [Google Scholar] [CrossRef]
  14. Emanuel, K.A. Sensitivity of tropical cyclones to surface exchange coefficients and a revised steady-state model incorporating eye dynamics. J. Atmos. Sci. 1995, 52, 3969–3976. [Google Scholar] [CrossRef]
  15. Emanuel, K.; Nolan, D.S. Tropical cyclone activity and the global climate system. In Proceedings of the 26th Conference on Hurricanes and Tropical Meteorolgy, Miami, FL, USA, 3–7 May 2004; pp. 240–241. [Google Scholar]
  16. Camargo, S.J.; Giulivi, C.F.; Sobel, A.H.; Wing, A.A.; Kim, D.; Moon, Y.; Strong, J.; Del Genio, A.D.; Kelley, M.; Murakami, H. Characteristics of Model Tropical Cyclone Climatology and the Large-Scale Environment. J. Clim. 2020, 33, 4463–4487. [Google Scholar] [CrossRef]
  17. Ooyama, K. Numerical simulation of the life cycle of tropical cyclones. J. Atmos. Sci. 1969, 26, 3–40. [Google Scholar] [CrossRef]
  18. Manabe, S.; Broccoli, A. Mountains and arid climates of middle latitudes. Science 1990, 247, 192–195. [Google Scholar] [CrossRef] [PubMed]
  19. Wu, G.; Lau, N.-C. A GCM simulation of the relationship between tropical-storm formation and ENSO. Mon. Weather Rev. 1992, 120, 958–977. [Google Scholar] [CrossRef]
  20. Walsh, K.; Nguyen, K.-C.; McGregor, J. Fine-resolution regional climate model simulations of the impact of climate change on tropical cyclones near Australia. Clim. Dyn. 2004, 22, 47–56. [Google Scholar]
  21. Landman, W.A.; Seth, A.; Camargo, S.J. The effect of regional climate model domain choice on the simulation of tropical cyclone–like vortices in the southwestern Indian Ocean. J. Clim. 2005, 18, 1263–1274. [Google Scholar] [CrossRef]
  22. Camargo, S.J.; Wing, A.A. Tropical cyclones in climate models. Wiley Interdiscip. Rev. Clim. Chang. 2016, 7, 211–237. [Google Scholar] [CrossRef]
  23. Walsh, K.J.; McBride, J.L.; Klotzbach, P.J.; Balachandran, S.; Camargo, S.J.; Holland, G.; Knutson, T.R.; Kossin, J.P.; Lee, T.C.; Sobel, A. Tropical cyclones and climate change. Wiley Interdiscip. Rev. Clim. Chang. 2016, 7, 65–89. [Google Scholar] [CrossRef]
  24. Oouchi, K.; Yoshimura, J.; Yoshimura, H.; Mizuta, R.; Kusunoki, S.; Noda, A. Tropical cyclone climatology in a global-warming climate as simulated in a 20 km-mesh global atmospheric model: Frequency and wind intensity analyses. J. Meteorol. Soc. Jpn. Ser. II 2006, 84, 259–276. [Google Scholar] [CrossRef]
  25. Zhao, M.; Held, I.M.; Lin, S.-J.; Vecchi, G.A. Simulations of global hurricane climatology, interannual variability, and response to global warming using a 50-km resolution GCM. J. Clim. 2009, 22, 6653–6678. [Google Scholar] [CrossRef]
  26. Li, J.; Bao, Q.; Liu, Y.; Wu, G.; Wang, L.; He, B.; Wang, X.; Li, J. Evaluation of FAMIL2 in Simulating the Climatology and Seasonal-to-Interannual Variability of Tropical Cyclone Characteristics. J. Adv. Model. Earth Syst. 2019, 11, 1117–1136. [Google Scholar] [CrossRef]
  27. Zhao, M.; Golaz, J.C.; Held, I.M.; Guo, H.; Balaji, V.; Benson, R.; Chen, J.H.; Chen, X.; Donner, L.; Dunne, J. The GFDL global atmosphere and land model AM4. 0/LM4. 0: 1. Simulation characteristics with prescribed SSTs. J. Adv. Model. Earth Syst. 2018, 10, 691–734. [Google Scholar] [CrossRef]
  28. Camp, J.; Wheeler, M.C.; Hendon, H.H.; Gregory, P.A.; Marshall, A.G.; Tory, K.J.; Watkins, A.B.; MacLachlan, C.; Kuleshov, Y. Skilful multiweek tropical cyclone prediction in ACCESS-S1 and the role of the MJO. Q. J. R. Meteorol. Soc. 2018, 144, 1337–1351. [Google Scholar] [CrossRef]
  29. Yeh, T.-C. The wind structure and heat balance in the lower troposphere over the Tibetan Plateau and its surroundings. Acta Meteorol. Sin. 1957, 28, 108–121. [Google Scholar]
  30. Flohn, H. Large-scale aspects of the “summer monsoon” in South and East Asia. J. Meteorol. Soc. Jpn. Ser. II 1957, 35, 180–186. [Google Scholar] [CrossRef]
  31. Duan, A.; Wu, G. Role of the Tibetan Plateau thermal forcing in the summer climate patterns over subtropical Asia. Clim. Dyn. 2005, 24, 793–807. [Google Scholar] [CrossRef]
  32. Wu, G.; Liu, Y.; Zhang, Q.; Duan, A.; Wang, T.; Wan, R.; Liu, X.; Li, W.; Wang, Z.; Liang, X. The influence of mechanical and thermal forcing by the Tibetan Plateau on Asian climate. J. Hydrometeorol. 2007, 8, 770–789. [Google Scholar] [CrossRef]
  33. Wu, G.; Liu, Y.; He, B.; Bao, Q.; Duan, A.; Jin, F.-F. Thermal controls on the Asian summer monsoon. Sci. Rep. 2012, 2, 404. [Google Scholar] [CrossRef] [PubMed]
  34. Boos, W.R.; Kuang, Z. Dominant control of the South Asian monsoon by orographic insulation versus plateau heating. Nature 2010, 463, 218–222. [Google Scholar] [CrossRef] [PubMed]
  35. Wang, H.; Fan, K.; Sun, J.; Li, S.; Lin, Z.; Zhou, G.; Chen, L.; Lang, X.; Li, F.; Zhu, Y. A review of seasonal climate prediction research in China. Adv. Atmos. Sci. 2015, 32, 149–168. [Google Scholar] [CrossRef]
  36. Zhao, C.; Ren, H.L.; Eade, R.; Wu, Y.; Wu, J.; MacLachlan, C. MJO modulation and its ability to predict boreal summer tropical cyclone genesis over the northwest Pacific in Met Office Hadley Centre and Beijing Climate Center seasonal prediction systems. Q. J. R. Meteorol. Soc. 2019, 145, 1089–1101. [Google Scholar] [CrossRef]
  37. Yu, J.; Liu, Y.; Ma, T.; Wu, G. Impact of surface potential vorticity density forcing over the Tibetan Plateau on the South China extreme precipitation in January 2008. Part ll: Numerical Simulation. J. Meteorol. Res. 2019, 33, 416–432. [Google Scholar] [CrossRef]
  38. Ma, T.; Wu, G.; Liu, Y.; Jiang, Z.; Yu, J. Impact of surface potential vorticity density forcing over the Tibetan Plateau on the South China extreme precipitation in January 2008. Part I: Data analysis. J. Meteorol. Res. 2019, 33, 400–415. [Google Scholar] [CrossRef]
  39. Zhan, R.; Ding, Y.; Wu, L.; Lei, X. Role of ENSO in the interannual relationship between Tibetan Plateau winter snow cover and Northwest Pacific tropical cyclone genesis frequency. Sci. China Earth Sci. 2016, 59, 2009–2021. [Google Scholar] [CrossRef]
  40. Zhou, T.; Turner, A.G.; Kinter, J.L.; Wang, B.; Qian, Y.; Chen, X.; Wu, B.; Liu, B.; Zou, L.; Bian, H. GMMIP (v1. 0) contribution to CMIP6: Global monsoons model inter-comparison project. Geosci. Model Dev. 2016, 9, 3589–3604. [Google Scholar] [CrossRef]
  41. He, B.; Liu, Y.; Wu, G.; Bao, Q.; Zhou, T.; Wu, X.; Wang, L.; Li, J.; Wang, X.; Li, J. CAS FGOALS-f3-L Model Datasets for CMIP6 GMMIP Tier-1 and Tier-3 Experiments. Adv. Atmos. Sci. 2020, 37, 18–28. [Google Scholar] [CrossRef]
  42. Eyring, V.; Bony, S.; Meehl, G.A.; Senior, C.A.; Stevens, B.; Stouffer, R.J.; Taylor, K.E. Overview of the Coupled Model Intercomparison Project Phase 6 (CMIP6) experimental design and organization. Geosci. Model Dev. 2016, 9, 1937–1958. [Google Scholar] [CrossRef]
  43. Zhou, L.; Bao, Q.; Liu, Y.; Wu, G.; Wang, W.C.; Wang, X.; He, B.; Yu, H.; Li, J. Global energy and water balance: Characteristics from F inite-volume A tmospheric M odel of the IAP/LASG (FAMIL 1). J. Adv. Model. Earth Syst. 2015, 7, 1–20. [Google Scholar] [CrossRef]
  44. Wu, G.; Liu, H.; Zhao, Y.; Li, W. A nine-layer atmospheric general circulation model and its performance. Adv. Atmos. Sci. 1996, 13, 1–18. [Google Scholar]
  45. Bao, Q.; Lin, P.; Zhou, T.; Liu, Y.; Yu, Y.; Wu, G.; He, B.; He, J.; Li, L.; Li, J. The flexible global ocean-atmosphere-land system model, spectral version 2: FGOALS-s2. Adv. Atmos. Sci. 2013, 30, 561–576. [Google Scholar] [CrossRef]
  46. Liu, H.; Lin, P.; Yu, Y.; Zhang, X. The baseline evaluation of LASG/IAP climate system ocean model (LICOM) version 2. Acta Meteorol. Sin. 2012, 26, 318–329. [Google Scholar] [CrossRef]
  47. Oleson, K.W.; Lawrence, D.M.; Gordon, B.; Flanner, M.G.; Kluzek, E.; Peter, J.; Levis, S.; Swenson, S.C.; Thornton, E.; Feddema, J. Technical description of version 4.0 of the Community Land Model (CLM). NCAR Tech. Note NCAR/TN-478+ STR 2010, 257, 1–257. [Google Scholar]
  48. Lawrence, D.M.; Oleson, K.W.; Flanner, M.G.; Thornton, P.E.; Swenson, S.C.; Lawrence, P.J.; Zeng, X.; Yang, Z.L.; Levis, S.; Sakaguchi, K. Parameterization improvements and functional and structural advances in version 4 of the Community Land Model. J. Adv. Model. Earth Syst. 2011, 3, 1–27. [Google Scholar]
  49. Hunke, E.; Lipscomb, W.; Turner, A.; Jeffery, N.; Elliott, S. CICE: The Los Alamos Sea Ice Model, Documentation and Software; Version 4.0; LA-CC-06-012; Los Alamos National Laboratory: Los Alamos, NM, USA, 2008. [Google Scholar]
  50. Hunke, E.; Lipscomb, W.; Turner, A.; Jeffery, N.; Elliott, S. CICE: The Los Alamos Sea Ice Model Documentation and Software User’s Manual; Version 4.1; Los Alamos National Laboratory: Los Alamos, NM, USA, 2010. [Google Scholar]
  51. Craig, A.P.; Vertenstein, M.; Jacob, R. A new flexible coupler for earth system modeling developed for CCSM4 and CESM1. Int. J. High Perform. Comput. Appl. 2012, 26, 31–42. [Google Scholar] [CrossRef]
  52. Haarsma, R.J.; Roberts, M.J.; Vidale, P.L.; Senior, C.A.; Bellucci, A.; Bao, Q.; Chang, P.; Corti, S.; Fučkar, N.S.; Guemas, V. High resolution model intercomparison project (HighResMIP v1. 0) for CMIP6. Geosci. Model Dev. 2016, 9, 4185–4208. [Google Scholar] [CrossRef]
  53. Chen, J.-H.; Lin, S.-J. Seasonal predictions of tropical cyclones using a 25-km-resolution general circulation model. J. Clim. 2013, 26, 380–398. [Google Scholar] [CrossRef]
  54. Xiang, B.; Lin, S.-J.; Zhao, M.; Zhang, S.; Vecchi, G.; Li, T.; Jiang, X.; Harris, L.; Chen, J.-H. Beyond weather time-scale prediction for Hurricane Sandy and Super Typhoon Haiyan in a global climate model. Mon. Weather Rev. 2015, 143, 524–535. [Google Scholar] [CrossRef]
  55. Li, J.; Bao, Q.; Liu, Y.; Wu, G.; Wang, L.; He, B.; Wang, X.; Yang, J.; Wu, X.; Shen, Z. Dynamical seasonal prediction of tropical cyclone activity using the fgoals-f2 ensemble prediction system. Weather Forecast. 2021, 36, 1759–1778. [Google Scholar] [CrossRef]
  56. Li, J.; Bao, Q.; Liu, Y.; Wang, L.; Yang, J.; Wu, G.; Wu, X.; He, B.; Wang, X.; Zhang, X. Effect of horizontal resolution on the simulation of tropical cyclones in the Chinese Academy of Sciences FGOALS-f3 climate system model. Geosci. Model Dev. 2021, 14, 6113–6133. [Google Scholar] [CrossRef]
  57. Chang, C.-P.; Yang, Y.-T.; Kuo, H.-C. Large increasing trend of tropical cyclone rainfall in Taiwan and the roles of terrain. J. Clim. 2013, 26, 4138–4147. [Google Scholar] [CrossRef]
  58. Li, R.C.; Zhou, W. Interdecadal changes in summertime tropical cyclone precipitation over southeast China during 1960–2009. J. Clim. 2015, 28, 1494–1509. [Google Scholar] [CrossRef]
  59. Jones, E.; Wing, A.A.; Parfitt, R. A global perspective of tropical cyclone precipitation in reanalyses. J. Clim. 2021, 34, 8461–8480. [Google Scholar] [CrossRef]
  60. Chen, G.; Tam, C.Y. Different impacts of two kinds of Pacific Ocean warming on tropical cyclone frequency over the western North Pacific. Geophys. Res. Lett. 2010, 37, 1–6. [Google Scholar] [CrossRef]
  61. Camargo, S.J.; Wheeler, M.C.; Sobel, A.H. Diagnosis of the MJO modulation of tropical cyclogenesis using an empirical index. J. Atmos. Sci. 2009, 66, 3061–3074. [Google Scholar] [CrossRef]
  62. Chan, J.C.; Shi, J.-E.; Lam, C.-M. Seasonal forecasting of tropical cyclone activity over theWestern North Pacific and the South China Sea. Weather Forecast. 1998, 13, 997–1004. [Google Scholar] [CrossRef]
  63. Liu, Y.; Wu, G.; Ren, R. Relationship between the subtropical anticyclone and diabatic heating. J. Clim. 2004, 17, 682–698. [Google Scholar] [CrossRef]
  64. Zhou, T.; Yu, R.; Zhang, J.; Drange, H.; Cassou, C.; Deser, C.; Hodson, D.L.; Sanchez-Gomez, E.; Li, J.; Keenlyside, N. Why the western Pacific subtropical high has extended westward since the late 1970s. J. Clim. 2009, 22, 2199–2215. [Google Scholar] [CrossRef]
  65. Wang, B.; Xiang, B.; Lee, J.-Y. Subtropical high predictability establishes a promising way for monsoon and tropical storm predictions. Proc. Natl. Acad. Sci. USA 2013, 110, 2718–2722. [Google Scholar] [CrossRef] [PubMed]
  66. Hu, W.; Duan, A.; He, B.; Hao, S. Dynamic and Thermal Effects of the Tibetan and Iranian Plateaus on the Northward-Propagating Intraseasonal Oscillation during Boreal Summer. J. Clim. 2022, 35, 2173–2188. [Google Scholar] [CrossRef]
  67. Baldwin, J.W.; Vecchi, G.A.; Bordoni, S. The direct and ocean-mediated influence of Asian orography on tropical precipitation and cyclones. Clim. Dyn. 2019, 53, 805–824. [Google Scholar] [CrossRef]
Figure 1. The anomalies of daily precipitation (unit: mm/day) and 850-hPa wind (m/s) from June to August 1981–2014. (a) is the difference between the AMIP and NTP, and (b) is the difference between the AMIP and NS. The notation “AMIP” is the abbreviation of the experiment of Atmospheric Model Intercomparison Project type, which is regarded as the control run in this study; the notation “NTP” means the “amip-TIP” experiment, which the topography above 500 m is set to 500 m in CAS FGOALS-f3; the notation “NS” means the “amip-TIP-nosh”, which the sensible heating is removed from topographies above 500 m in CAS FGOALS-f3. White dot means the correlation coefficients that are significant at a two-sided p = 0.05 level.
Atmosphere 14 00905 g001
Figure 2. The panel shows the global track density anomalies of TCs during 1981–2014. The track density is analyzed in a 5° × 5° equidistance grid box with 6-h intervals, and the unit of colormap is the number per year from 1981 to 2014. (a) is the track density anomaly between the AMIP experiment (amip-hist: control run) and NTP experiment (amip-TIP: topography above 500 m is set to 500 m); (b) is the track density anomaly between the AMIP experiment and NS experiment (amip-TIP-nosh: sensible heating is removed from topographies above 500 m). The description of the experimental design is shown in Table 1. White dot means the correlation coefficients that are significant at a two-sided p = 0.05 level.
Atmosphere 14 00905 g002
Figure 3. The climatological number of tropical cyclones (TC) in the Western Pacific (WNP), Southern Pacific (SP), Northern Indian Ocean (NI), Northern Atlantic (NA), and Eastern Pacific (EP) (unit: day) during 1981–2014. The color black is the result of the AMIP experiment (amip-hist: control run), the color red is the result of the NTP experiment (amip-TIP: topography above 500 m is set to 500 m), and the color blue is the result of NS (amip-TIP-nosh: sensible heating is removed from topographies above 500 m). The description of the experimental design is shown in Table 1.
Atmosphere 14 00905 g003
Figure 4. The differences of warm core (The temperature average between the 300 and 500 hPa; unit: °C), sea-level pressure (unit: mb), surface wind (10 m) (unit: m/s), and 850 mb vorticity (/s) between the three experiments. The differences of the four variables between the AMIP (amip-hist: control run) and NTP (amip-TIP: topography above 500 m is set to 500 m) are shown in (a,c,e,g). The differences of the four variables between the AMIP (amip-hist: control run) and NS (amip-TIP-nosh: sensible heating is removed from topographies above 500 m) are shown in (b,d,f,h). White dot means the correlation coefficients that are significant at a two-sided p = 0.05 level.
Atmosphere 14 00905 g004
Figure 5. The annual tropical cyclone GPI during 1981–2014 (unit: number/year), based on the experiment of AMIP (amip-hist: control run) (a), NTP (amip-TIP: topography above 500 m is set to 500 m) (b), NS (amip-TIP-nosh: sensible heating is removed from topographies above 500 m) (c).
Atmosphere 14 00905 g005
Figure 6. The differences of 600-hPa relative humidity (RH; unit: %), 850-hPa absolute vorticity (s-1), the wind shear between 850 hPa and 200 hPa (WS; unit: m/s), and the maximum potential intensity (PI) between the three experiments. The differences of the four variables between the AMIP (amip-hist: control run) and NS (amip-TIP-nosh: sensible heating is removed from topographies above 500 m) are shown in (b,d,f,h). The differences of the four variables between the AMIP (amip-hist: control run) and NS (amip-TIP-nosh: sensible heating is removed from topographies above 500 m) are shown in (b,d,f,h). White dot means the correlation coefficients that are significant at a two-sided p = 0.05 level.
Atmosphere 14 00905 g006
Figure 7. The differences of annual 850-hPa geopotential high in the western Pacific. (a) is the difference in annual 850-hPa geopotential high between AMIP and NTP. (b) is the difference in annual 850-hPa geopotential high between AMIP and NS. White dot means the correlation coefficients that are significant at a two-sided p = 0.05 level.
Atmosphere 14 00905 g007
Figure 8. Composite May–October band-pass filtering precipitation and 850-hPa wind as a function of MJO phase. The results only show the MJO activities in phase 6 and phase 7, which is the active phase of MJO in WNP. The differences between the results in AMIP and NS are shown in (a,b), and the differences between the results in AMIP and NTP are shown in (c,d).
Atmosphere 14 00905 g008
Table 1. The configuration of experiments.
Experimental NameVariant LabelIntegration TimeDescriptionHorizontal Resolution/Vertical Layer
amip-histr1i1p1f11981–2014The model integration starts from 1 January 1861 with the external forcings, including greenhouse gases, solar irradiance, ozone, aerosols, SSTs, and sea ice, similar to the experimental design of AMIP. The outputs from 1870 to 2014 are provided but selected from 1981 to 2014 for this study.C96 (approximately 100 km)/32 layers
amip-TIPr1i1p1f11981–2014The topography of TIP above 500 m is set to 500 m in a polygon region. The coordinates of the polygon corners are as follows: longitude coordinates (from west to east) are 25° E, 40° E, 50° E, 70° E, 90° E and 180° E; latitude coordinates (from south to north) are 5° N, 15° N, 20° N, 25° N, 35° N, 45° N and 75° N. The outputs from 1979 to 2014 are provided but selected from 1981 to 2014 for this study.Same as amip-hist
amip-TIP-noshr1i1p1f11981–2014The surface sensible heating is removed from topographies above 500 m in order to compare the impact of thermal effects. The coordinates of the polygon corners are the same as amip-TIP. One practical method is to set the vertical temperature diffusion term to zero in the atmospheric thermodynamic equation at the bottom boundary layer. The outputs from 1979 to 2014 are provided but selected from 1981 to 2014 for this study.Same as amip-hist
Disclaimer/Publisher’s Note: The statements, opinions and data contained in all publications are solely those of the individual author(s) and contributor(s) and not of MDPI and/or the editor(s). MDPI and/or the editor(s) disclaim responsibility for any injury to people or property resulting from any ideas, methods, instructions or products referred to in the content.

