Article

Impact of Soil Moisture in the Monsoon Region of South America during Transition Season

by
Vivian Bauce Machado Arsego
*,
Luis Gustavo Gonçalves de Gonçalves
,
Diogo Alessandro Arsego
,
Silvio Nilo Figueroa
,
Paulo Yoshio Kubota
and
Carlos Renato de Souza
Instituto Nacional de Pesquisas Espaciais (INPE), Cachoeira Paulista 12630-000, SP, Brazil
*
Author to whom correspondence should be addressed.
Atmosphere 2023, 14(5), 804; https://doi.org/10.3390/atmos14050804
Submission received: 9 February 2023 / Revised: 6 March 2023 / Accepted: 28 March 2023 / Published: 28 April 2023
(This article belongs to the Section Biosphere/Hydrosphere/Land–Atmosphere Interactions)

Abstract

:
The land surface is an important component of numerical weather and climate forecast models due to their effect on energy–water balances and fluxes, and it is essential for forecasts on a seasonal scale. The present study aimed to understand the effects of land surface processes on initialization of seasonal forecasts in the austral spring, in particular soil moisture. We built forecasts with the Brazilian global Atmospheric Model hindcast from 2000 to 2010, with a configuration similar to those used in the operational environment. To improve it, we developed a new initial condition of the land surface using the Land Information System over South America and the Global Land Data Assimilation System for the rest of the globe and used it as the input in the forecast model. The results demonstrated that the model is sensitive to changes in soil moisture and that the new high–resolution soil moisture dataset can be used in model initialization, which resulted in an increase in the correlation of precipitation over part of South America. We also noticed an improvement in the representation of surface fluxes and an increase in soil moisture content and specific humidity at medium and low levels of the atmosphere. The analysis of the coupling between the land surface and the atmosphere showed that, for Central Brazil, the states of the continental surface define the surface fluxes. For the Amazon and La Plata Basins, the model did not correctly represent the coupling because it underestimated the soil moisture content.

1. Introduction

Forecasting at sub–seasonal and seasonal scales is essential for planning various socioeconomic activities. Most of the Brazilian energy system is associated with hydroelectric generation, which corresponds to 53.7% of the energy generation [1]. Another activity that benefits from these forecasts is agribusiness, whose share in Brazil’s Gross Domestic Product (GDP) in 2021 represented approximately 27.6% of national production [2].
The most–relevant information for seasonal forecasting comes from boundary conditions with slow variations. and the main source of seasonal predictability is the El Niño Southern Oscillation (ENSO) [3]. In addition to the ENSO, other mechanisms linked to Sea Surface Temperature (SST) influence South America [4]. For SST forcings, the predictive ability is greatest in the tropics, a region where natural variability is comparatively low and the atmosphere responds strongly to SST and decreases at mid– and high–latitudes, where natural variability is high and the tropical SST signal is attenuated [3].
In addition to SST, soil moisture has a significant memory since the states of the land surface vary more slowly than the atmospheric states, with their peak of influence reached in the interval of one to several weeks, thus becoming a potential predictor in the sub–seasonal and seasonal scales [5,6,7]. Studies have shown that soil moisture plays an important role in forecasts at the seasonal scale [8,9], as an adequate initialization of energy and water reserves by forecasting models is essential [10] due to its effects on surface energy fluxes and water balance through the evapotranspiration process and heat fluxes [11,12]. The greatest impacts of soil moisture on precipitation generally occur in transition zones between humid and arid climates [13].
The climatology of circulation and seasonal precipitation in South America demonstrates the existence of a monsoon regime over part of the continent [14], with wet and dry periods in a wide area between the Equator and 20 S [15] with the peak of the rainy season in central Amazonia during the austral summer [16]. For the Indian Monsoon, studies have shown that the soil moisture content can advance or delay the onset of the rainy season [17]. For South America, Collini et al. [18] demonstrated that reductions in soil moisture influence convective instability and moisture flux convergence and then impact the precipitation at the beginning of the rainy season. Grimm et al. [19] demonstrated that the austral spring has an inverse correlation with the precipitation in the austral summer in Central–Eastern Brazil. Still, some regions of South America stand out for presenting greater coupling between the land surface and the atmosphere (north of the continent, the North and Northeast regions of Brazil [9,20], which makes the interactions between these two particularly important components for the climate scale, and therefore, their correct representation in climate models is necessary [21].
General circulation models have been used in climate simulations to study climate variability, climate change, and seasonal forecasting and also to examine their abilities to describe the main characteristics of the atmosphere [22]. The global atmospheric model of the Center for Weather Forecast and Climatic Studies of the National Institute for Space Research (CPTEC/INPE) has been used operationally in the production of seasonal forecasts with forecasts and quarterly forecasts. Baker et al. [21] suggested that the low water content in the soil of the Amazon region, simulated by the CPTEC global model, leads to an erroneous coupling between the land surface and the atmosphere.
Given the challenges for seasonal forecasting at mid–latitudes, the role of the land surface as a forecasting source on this time scale, the transition from the dry to the rainy season during the austral spring in the central region of South America, and the need for improvement in the surface processes of the CPTEC global model, the main objective of this study was to evaluate how seasonal forecasts of the CPTEC global model respond to a more realistic condition in the initialization of soil moisture during the pre–rainy season of the South American Monsoon System (SAMS). To fulfill this objective, the following questions were established: (1) Does a more realistic initial condition of soil moisture improve the predictive ability of precipitation? (2) What is the impact on surface fluxes? (3) How do surface fluxes affect the circulation pattern? (4) Is the model capable of capturing land surface processes?

2. Materials and Methods

2.1. Description of the Global Model

The Brazilian global Atmospheric Model (BAM) was developed at CPTEC/INPE to provide time/extended forecasts. Its first version (BAM–1.0 [23]) replaced the previous version of the CPTEC Atmospheric General Circulation Model (AGCM–CPTEC [22]), and its current version (BAM–1.2 [24,25]) has been operational since 2020 and also produces climate forecasts.
The BAM is a global–scale model, with triangular truncation at the zonal wave number 126 and 42 vertical sigma levels (T0126L42) and approximately a 105 km horizontal resolution near the Equator (about 1 × 1 ). The primitive equations are discretized using the spectral method and the hydrostatic approximation. The model uses the land surface scheme, the Integrated Biosphere Simulator (IBIS–CPTEC [26]), and Willmott’s climatology [27] for soil moisture. A complete description of the BAM, Version 1.2, and its physical components was provided by Coelho et al. [25], which demonstrated that the model reproduces the main climatological features for seasonal forecasts for the four seasons of the year, despite some biases in relation to the ERA5 reanalysis [28]. A summary of the main BAM specifications used in this study is presented in Table 1.

2.2. Numerical Experiments

The present study made retrospective forecasts in an environment similar to those that would be executed in real–time. The seasonal forecasts generated with the BAM used the persistent SST anomaly and initial atmospheric conditions from the ERA–Interim reanalysis for a period over 11 years (2000 to 2010), with 1 initialization for the austral spring, for consecutive days from 8 to 22, executed at 00 UTC for the four synoptic times (00, 06, 12, and 18 UTC), that is they were based on a set with 15 integrated members for approximately 145 days over 11 years (Table 2). Likewise, as is done in the operational environment of CPTEC, the initial forecast period (month of the initial condition and the current month) was discarded, focusing on the last 90 days, which represent the period of interest for each execution, that is July and August were discarded, with the aim of September, October, and November (SON). The atmospheric variables needed to initialize the model are: meridional and zonal wind, specific humidity and virtual temperature at 23 vertical levels between 1000 and 1 hPa, and surface pressure. The chosen ERA–Interim resolution was 1.5 × 1.5 , which was interpolated to the spectral resolution of the model. Two experiments were carried out: (1) a Control experiment (BAM CTRL) and (2) an experiment with new Soil Moisture in the initial condition (BAM SM).

2.3. Production of a New Soil Moisture Field

The BAM SM experiment used the innovative soil moisture field of the South American Land Data Assimilation System (SALDAS) [37]. Land states (Land Data Assimilation Systems (LDAS)) with regional dominance over South America were provided and incorporated into the Land Information System (LIS) [38]. The LIS was implemented to run with the IBIS surface model decoupled from the BAM global model, with a resolution of 10 km, and outputs every 3 h. For the process of making these new initializations, Princeton atmospheric forcing [39] was used from 1969 to 2000, totaling a spinup of 30 years. As of January 2000, the Global Data Assimilation System (GDAS) [40], Integrated Multi–satellite Retrievals for GPM (IMERG) [41], and Clouds and the Earth’s Radiant Energy System (CERES) [42] were used as atmospheric forcings. The new global field of soil moisture was established by placing the output of SALDAS in the field of the Global Land Data Assimilation System (GLDAS) [43]; that is, in the domain of South America, we have SALDAS and, in the rest of the globe, GLDAS.

2.4. Reference Datasets

The following references were used for model evaluation: the Global Precipitation Climatology Project (GPCP [44]) for precipitation, ERA5 reanalysis for atmospheric circulation and specific humidity, and ERA5–Land reanalysis [45] for sensible and latent heat fluxes, precipitation, evapotranspiration, soil moisture (0–7 cm), and air temperature at 2 m. As a reanalysis, ERA5–Land theoretically occupies an intermediate position between observations and pure simulation and may provide insights over regions where observational data are unavailable, such as areas of the Amazon region [21].

2.5. Land–Atmosphere Coupling Metrics

The strength of the coupling between the land surface and the atmosphere over three regions of South America (Figure 1) was estimated based on 5 methods, similarly to that presented by Baker et al. [21]: (1) Terrestrial Coupling Index (TCI) [46], used to estimate the response of surface fluxes to changes in the land surface; (2) the Temperature–Evapotranspiration Metric (T_ET), used to infer whether evapotranspiration is controlled by the availability of moisture on the land surface [47,48]; (3) Zeng’s Gamma (ZG), providing the coupling force between the land surface and precipitation [49]; (4) Betts’ approach [50], providing a graphical representation of the relationships between climate variables in a domain of interest; (5) the Two–Legged coupling metric (TL), where the coupling analysis is divided into two parts: the first, referring to the land surface (TCI), the second, related to the atmosphere. The product between the two components results in the complete feedback of the interaction between the land surface and atmosphere [13,21,46,51].

2.6. Areas of Interest

Given that changes in soil moisture initialization were concentrated in South America, the metrics for evaluating precipitation and coupling were analyzed over three specific regions: (1) Central Brazil (60 W–50 W/20 S–10 S); (2) Amazon Basin (70 W–60 W/8 S–2 N); (3) La Plata Basin (60 W–50 W/35 S–25 S) (Figure 1).
The impact of soil moisture can be decisive to evaluate these regions during the beginning of the rainy season. Region 1 was chosen based on the work by Gan et al. [15], who proved its importance for detecting the beginning of the SAMS rainy season, and also, it is an area with strong land–atmosphere coupling [21]. Region 2 is located in a transition area between the southwest of the Amazon Basin, which has higher volumes of precipitation during the austral summer, and the northwest of the Amazon, which records its peaks of precipitation during the austral winter [52]. Finally, Region 3 is located in an area of the continent that presents a precipitation dipole characteristic during the rainy season when compared to the South American Convergence Zone (SACZ) configuration range [53]. These regions also present distinct features of the precipitation regime and the influence of the ENSO. While Regions 1 and 2 have a high seasonality of precipitation, Region 3 has a more homogeneous distribution throughout the year [54]. In addition, Regions 2 and 3 are found in areas with opposite effects related to the ENSO, while Region 1 has a small effect [55], which suggests that land–atmosphere interactions become even more important in this area. The boxes were constructed so as not to overlap, to be of equivalent size, and to represent areas with more evident signs, and for these reasons, Boxes 2 and 3 do not exactly correspond to the total area of their respective basins.

3. Results

3.1. Forecast Ability for Precipitation

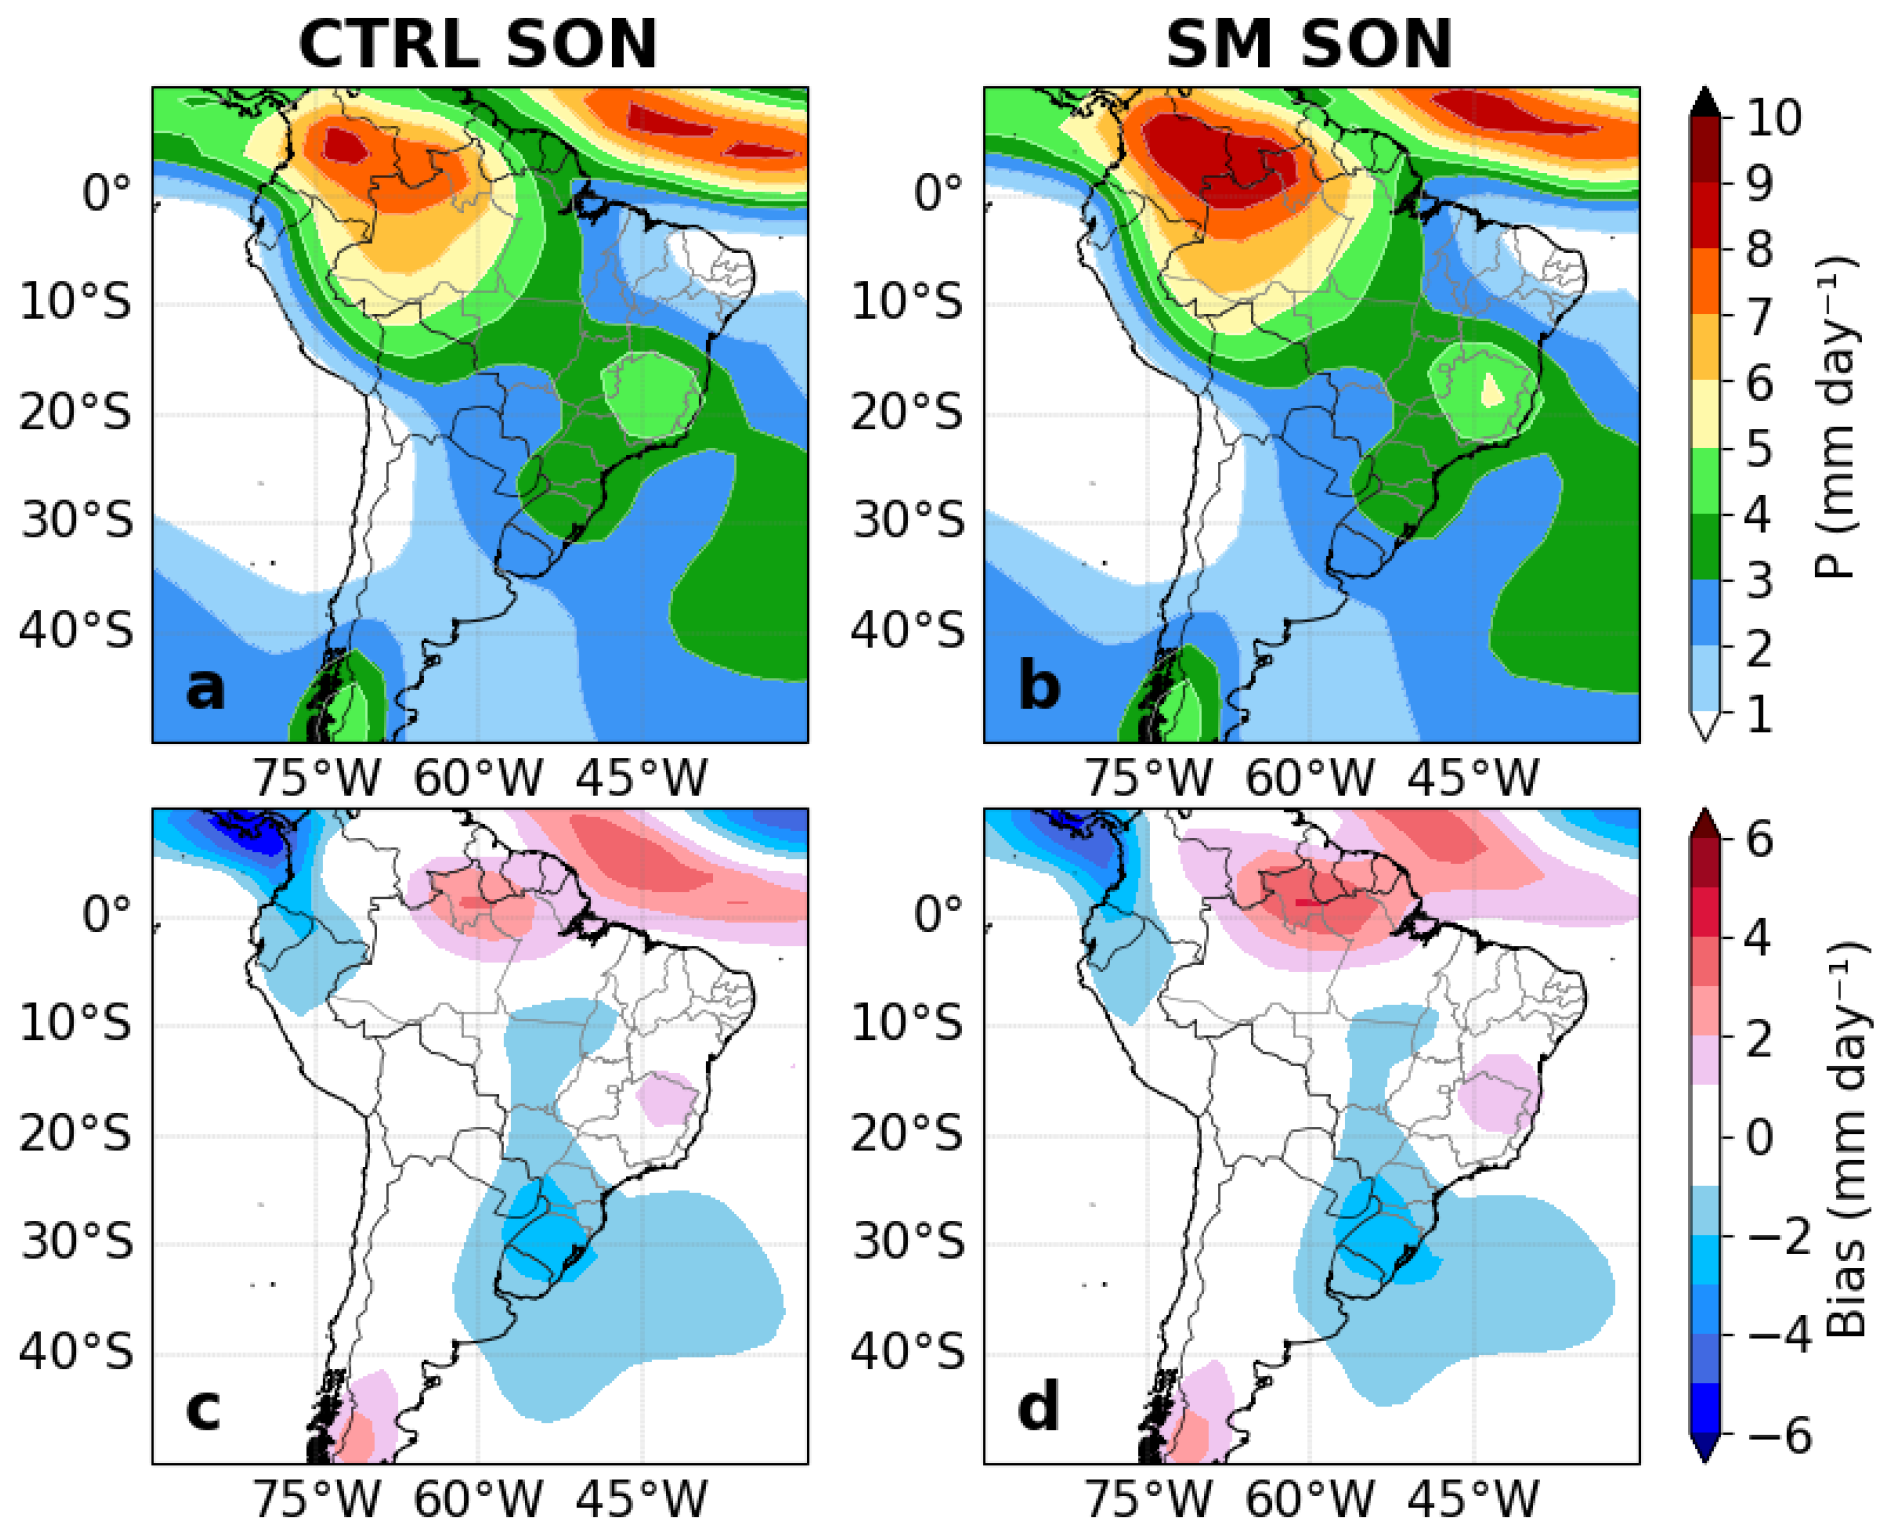
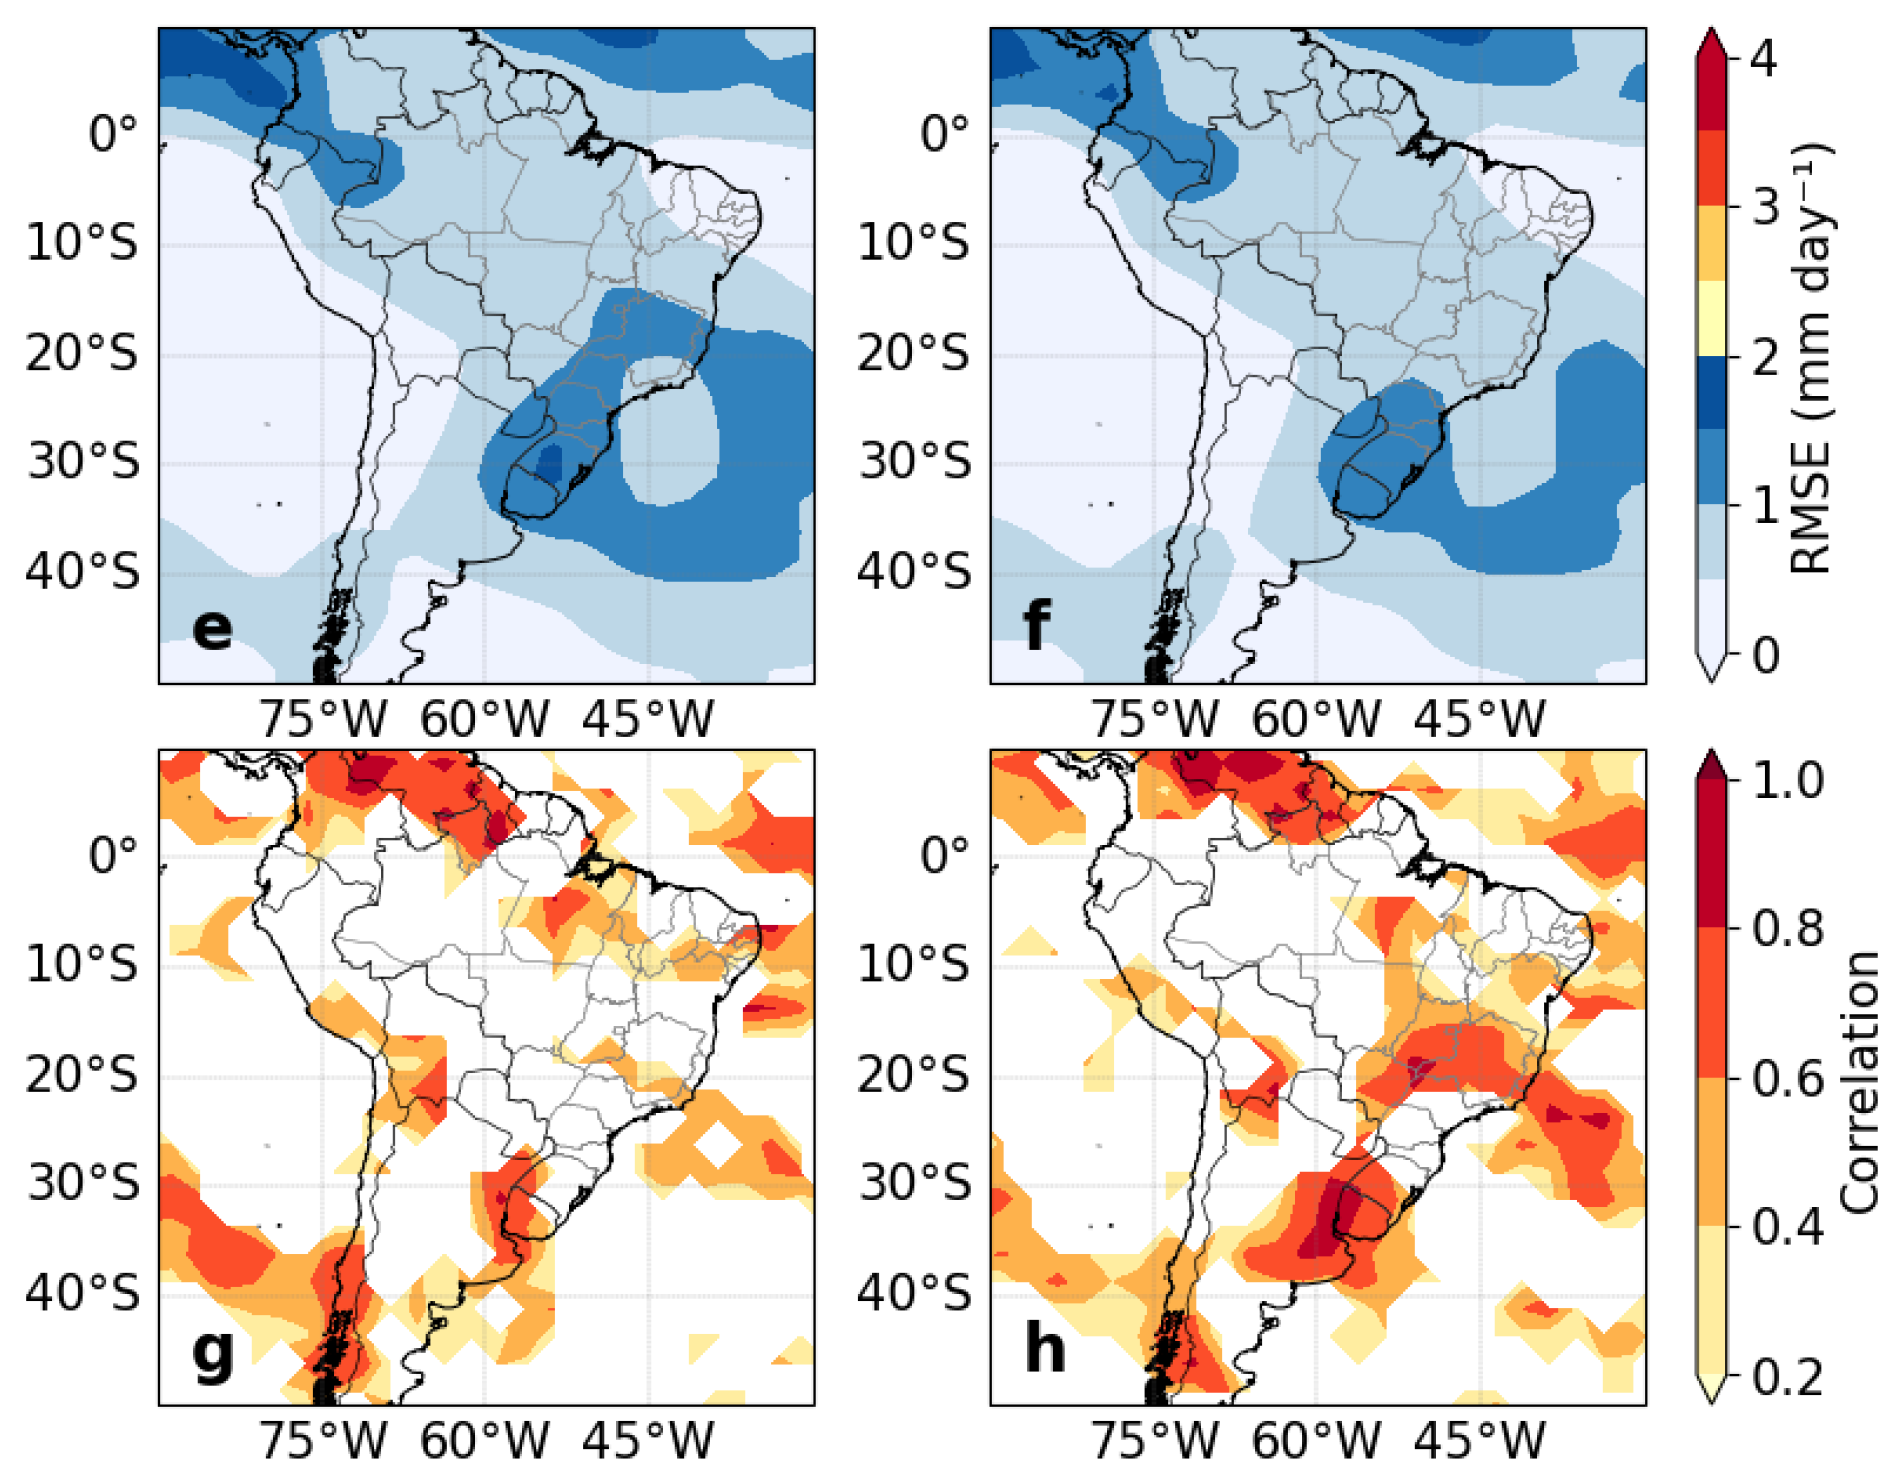
Figure 2 presents the seasonal climatology of precipitation (Figure 2a,b), the climatological bias (Figure 2c,d), the Root–Mean–Squared Error (RMSE) (Figure 2e,f), and the correlation of anomalies (Figure 2g,h), having the GPCP as a reference, for the period of austral spring over South America for the BAM CTRL (first column) and BAM SM (second column) experiments.
In the maps of mean seasonal precipitation (Figure 2a,b), it can be seen that the model reproduced the maximum precipitation associated with the action of the Intertropical Convergence Zone (ITCZ) and SACZ well. Although the main precipitation patterns were well represented by the model, areas in the northwest, central, and southern portions of South America, as well as in the adjacent ocean and the Equatorial Pacific are noted to have an underestimation of precipitation, while for the north and extreme south of the continent and in the Equatorial Atlantic, there was an overestimation.
For the BAM SM experiment, an increase in precipitation volumes was observed, more broadly in Northern South America and an increase in bias (Figure 2d), and also, in the ITCZ configuration region, in the Atlantic Equatorial, the highest precipitation values extended over a larger area, while the associated bias and RMSE were restricted to a smaller area than that observed in the BAM CTRL. The increase of precipitation in a small area of the southeastern portion of Brazil for the BAM SM was also observed, with the corresponding increase of the area with a positive bias and a decrease of the RMSE over this region. Furthermore, a decrease in the bias and RMSE was observed in the Equatorial Pacific, while for a small area in Southern Brazil, only the RMSE decreased.
The areas of South America with the highest correlation values for the model were the North, Northeast, and South areas (Figure 2g,h). However, the most–relevant change between the two experiments was observed in the central area and southeast of South America, where the increase in the correlation was evident (Figure 2h), as well as the decrease in the RMSE (Figure 2f) for the BAM SM experiment in the area covered by the SAMS.
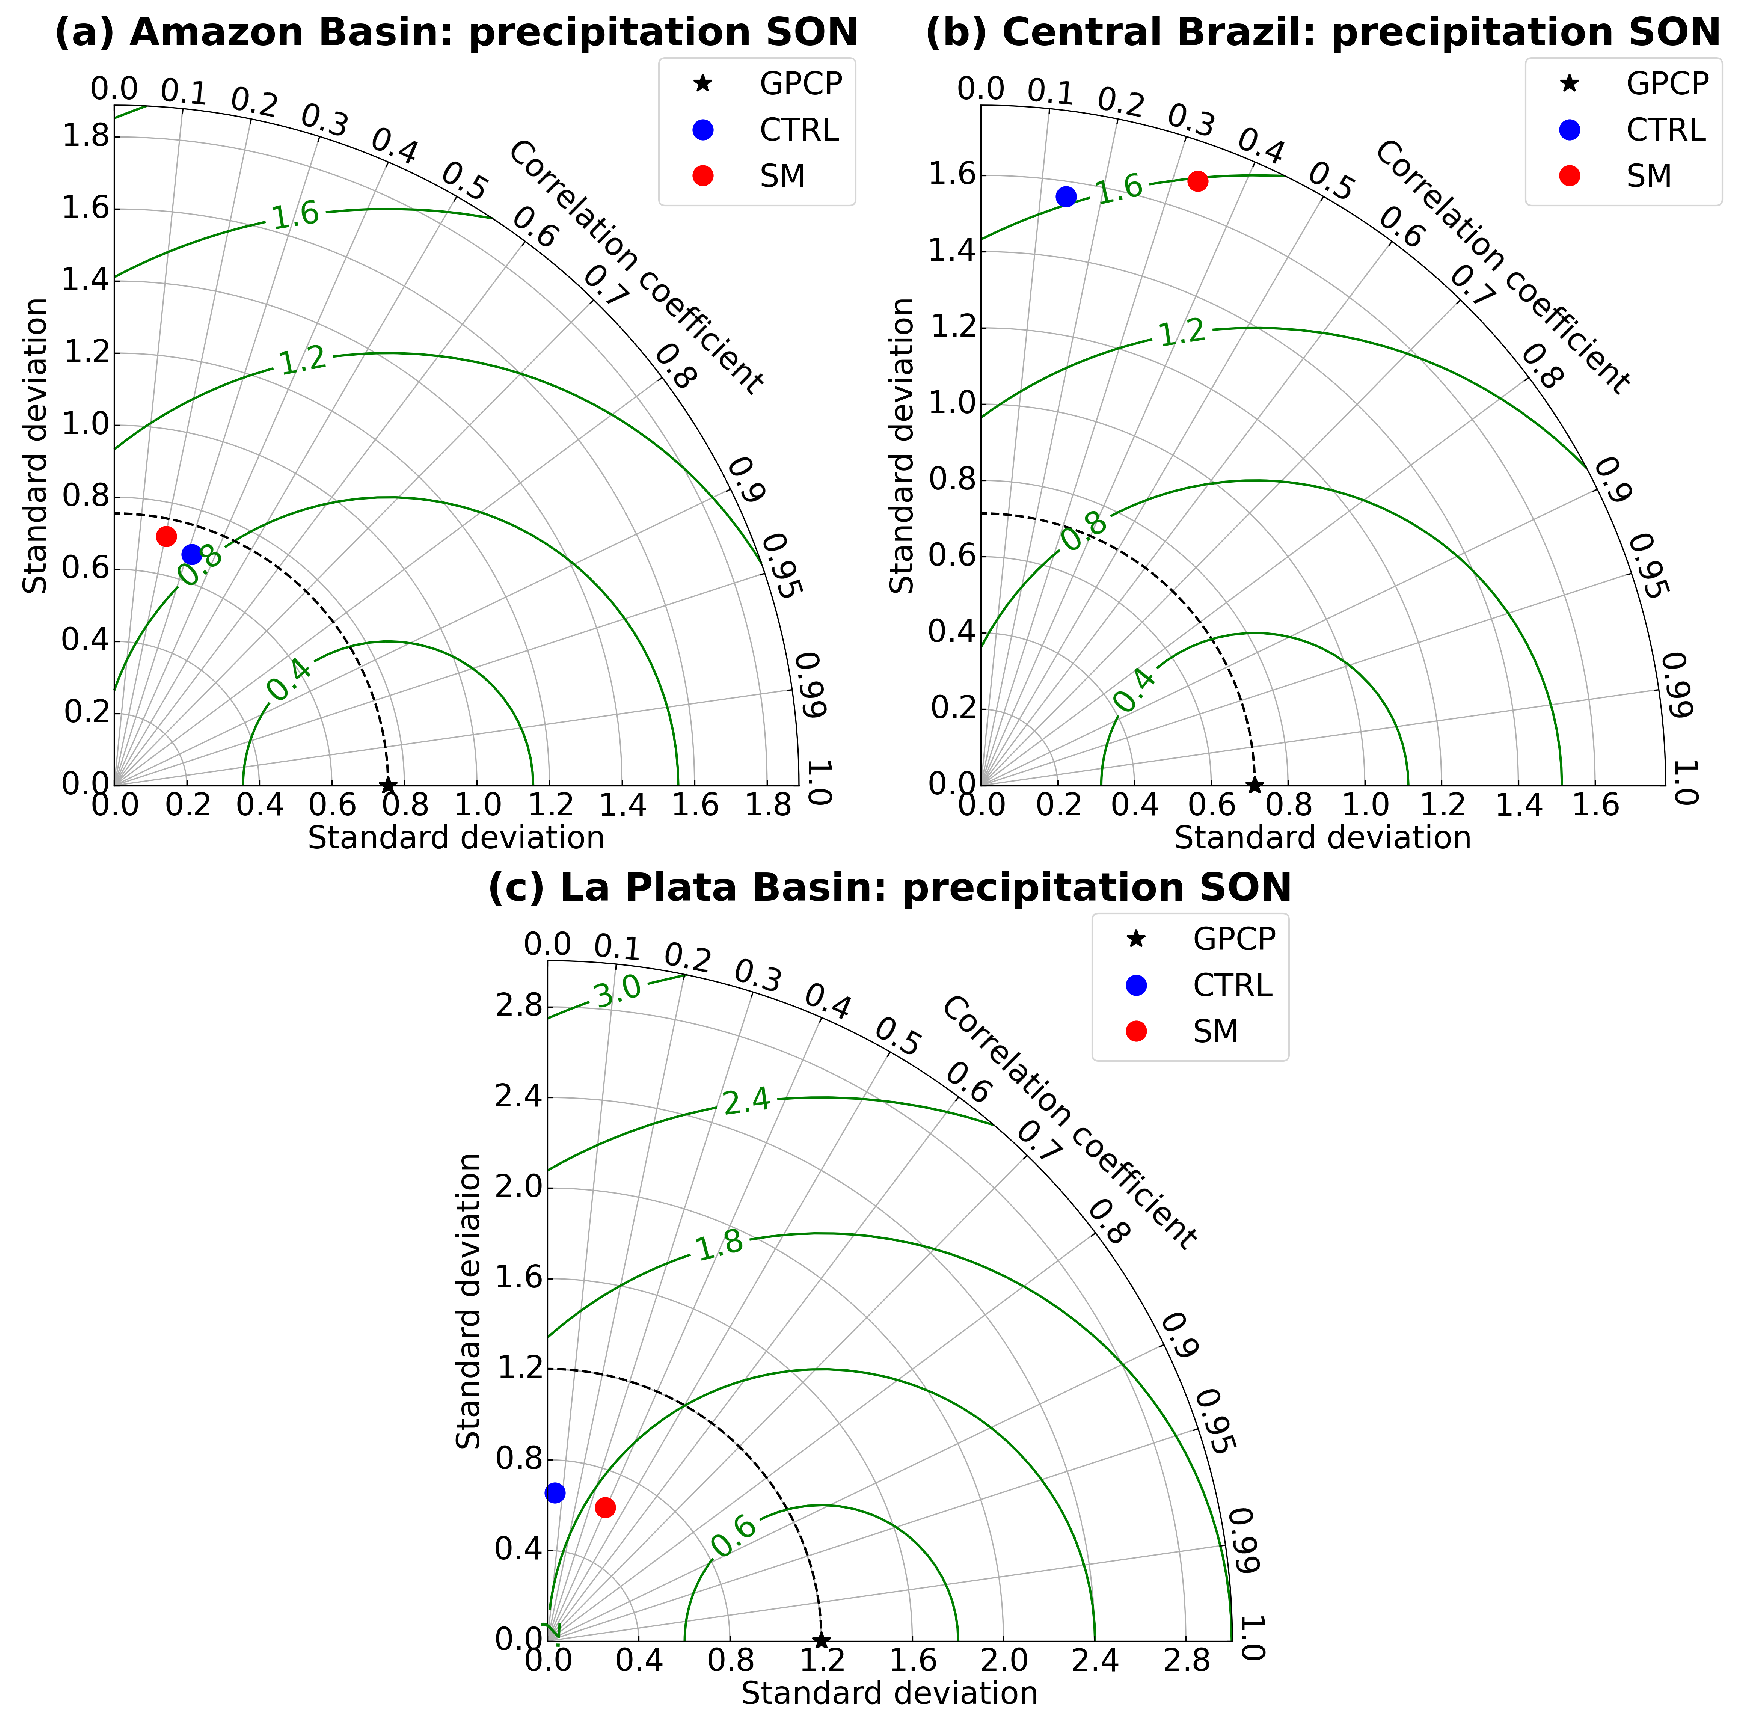
In the Taylor diagram, it can be observed that, for the La Plata Basin (Figure 3c), the modification of the soil moisture resulted in an improvement in the evaluation metrics associated with precipitation, with an increase in the correlation accompanied by a reduction in the RMSE. On the other hand, for the Amazon Basin (Figure 3a), the BAM SM experiment showed inferior performance with a small increase in the standard deviation and RMSE accompanied by a reduction in the correlation. Regarding Central Brazil (Figure 3b), there was a notable increase in the correlation with a subtle increase (decrease) in the standard deviation (RMSE).

3.2. Circulation at Low and High Levels

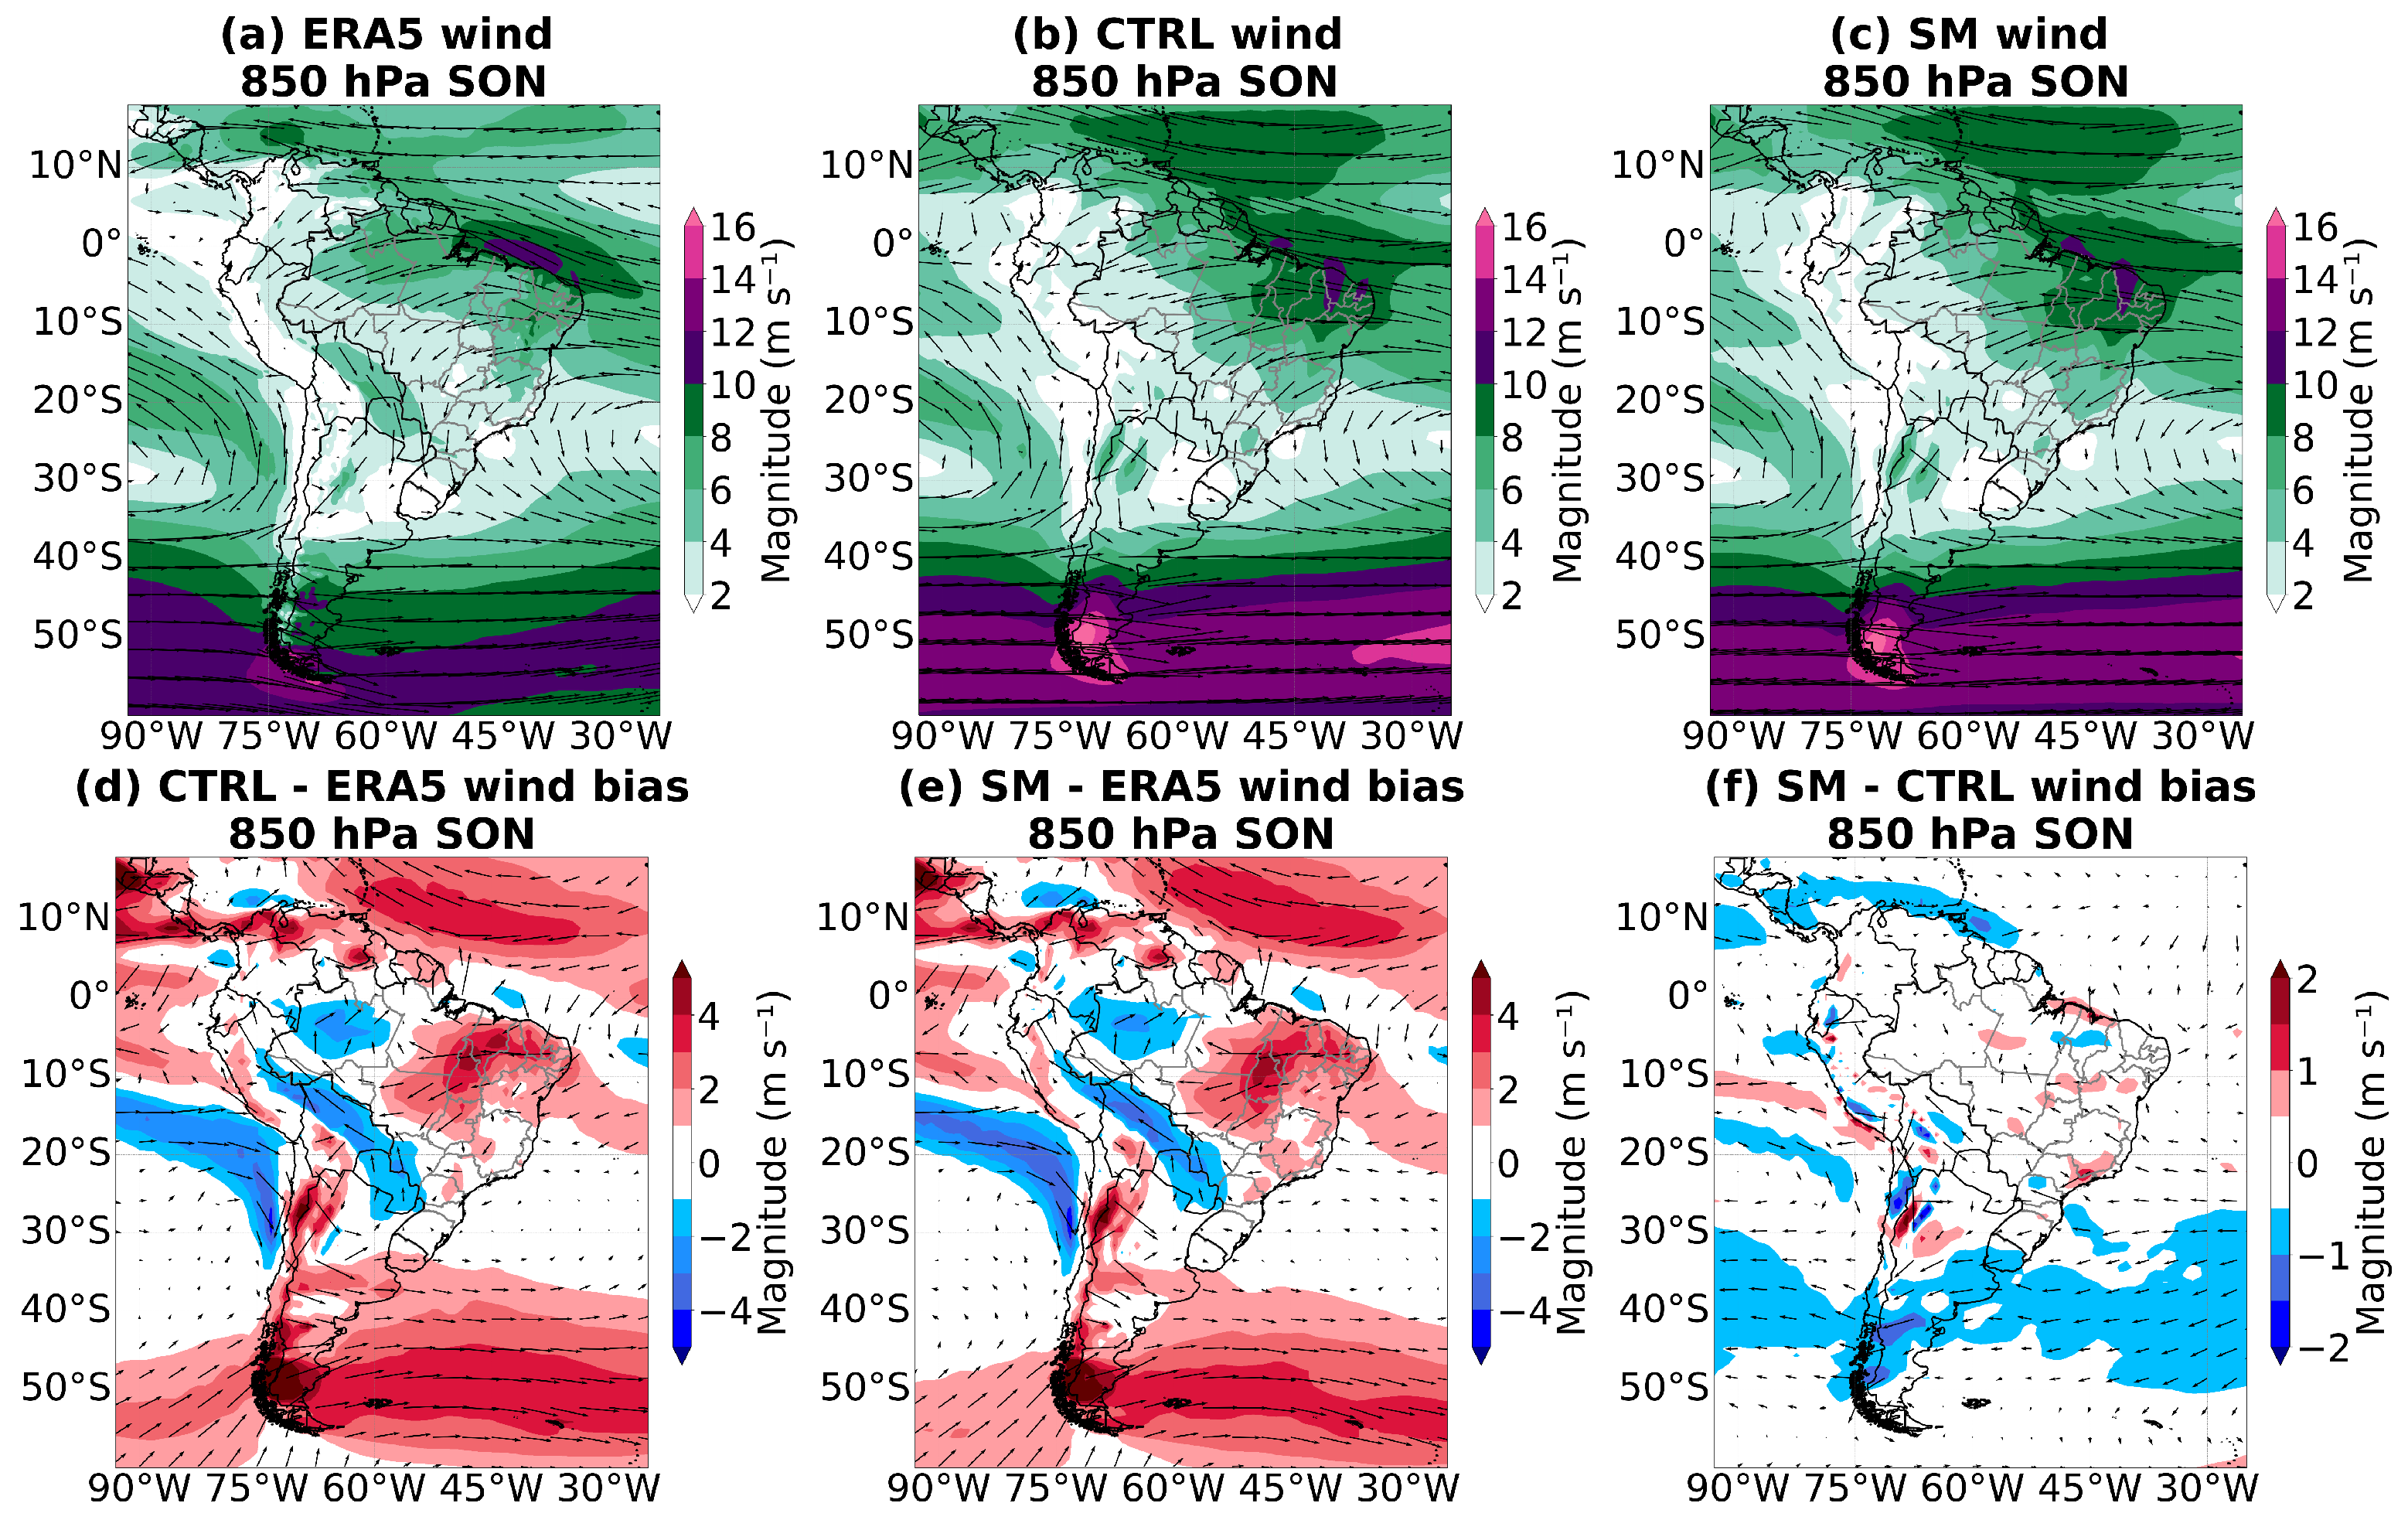
Figure 4 shows the mean circulation at 850 hPa for SON and the bias against the reanalysis for the two experiments. Note that the pattern of circulation at low levels did not differ between the reanalysis (Figure 4a) and the BAM CTRL (Figure 4b) and BAM SM (Figure 4c) experiments. Despite this, when analyzing the corresponding biases (Figure 4d,e) and between the experiments (Figure 4f), the overestimation of the east wind through the interior of the Northeast and, also, the underestimation of the circulation from the north of the Low–Level Jet for both experiments became more evident. It is also noteworthy that the most-notable differences between the two experiments occurred between 30 S and 50 S, where, in the BAM SM experiment (Figure 4e), the overestimation of the west winds was smaller in relation to the BAM CTRL experiment (Figure 4d).
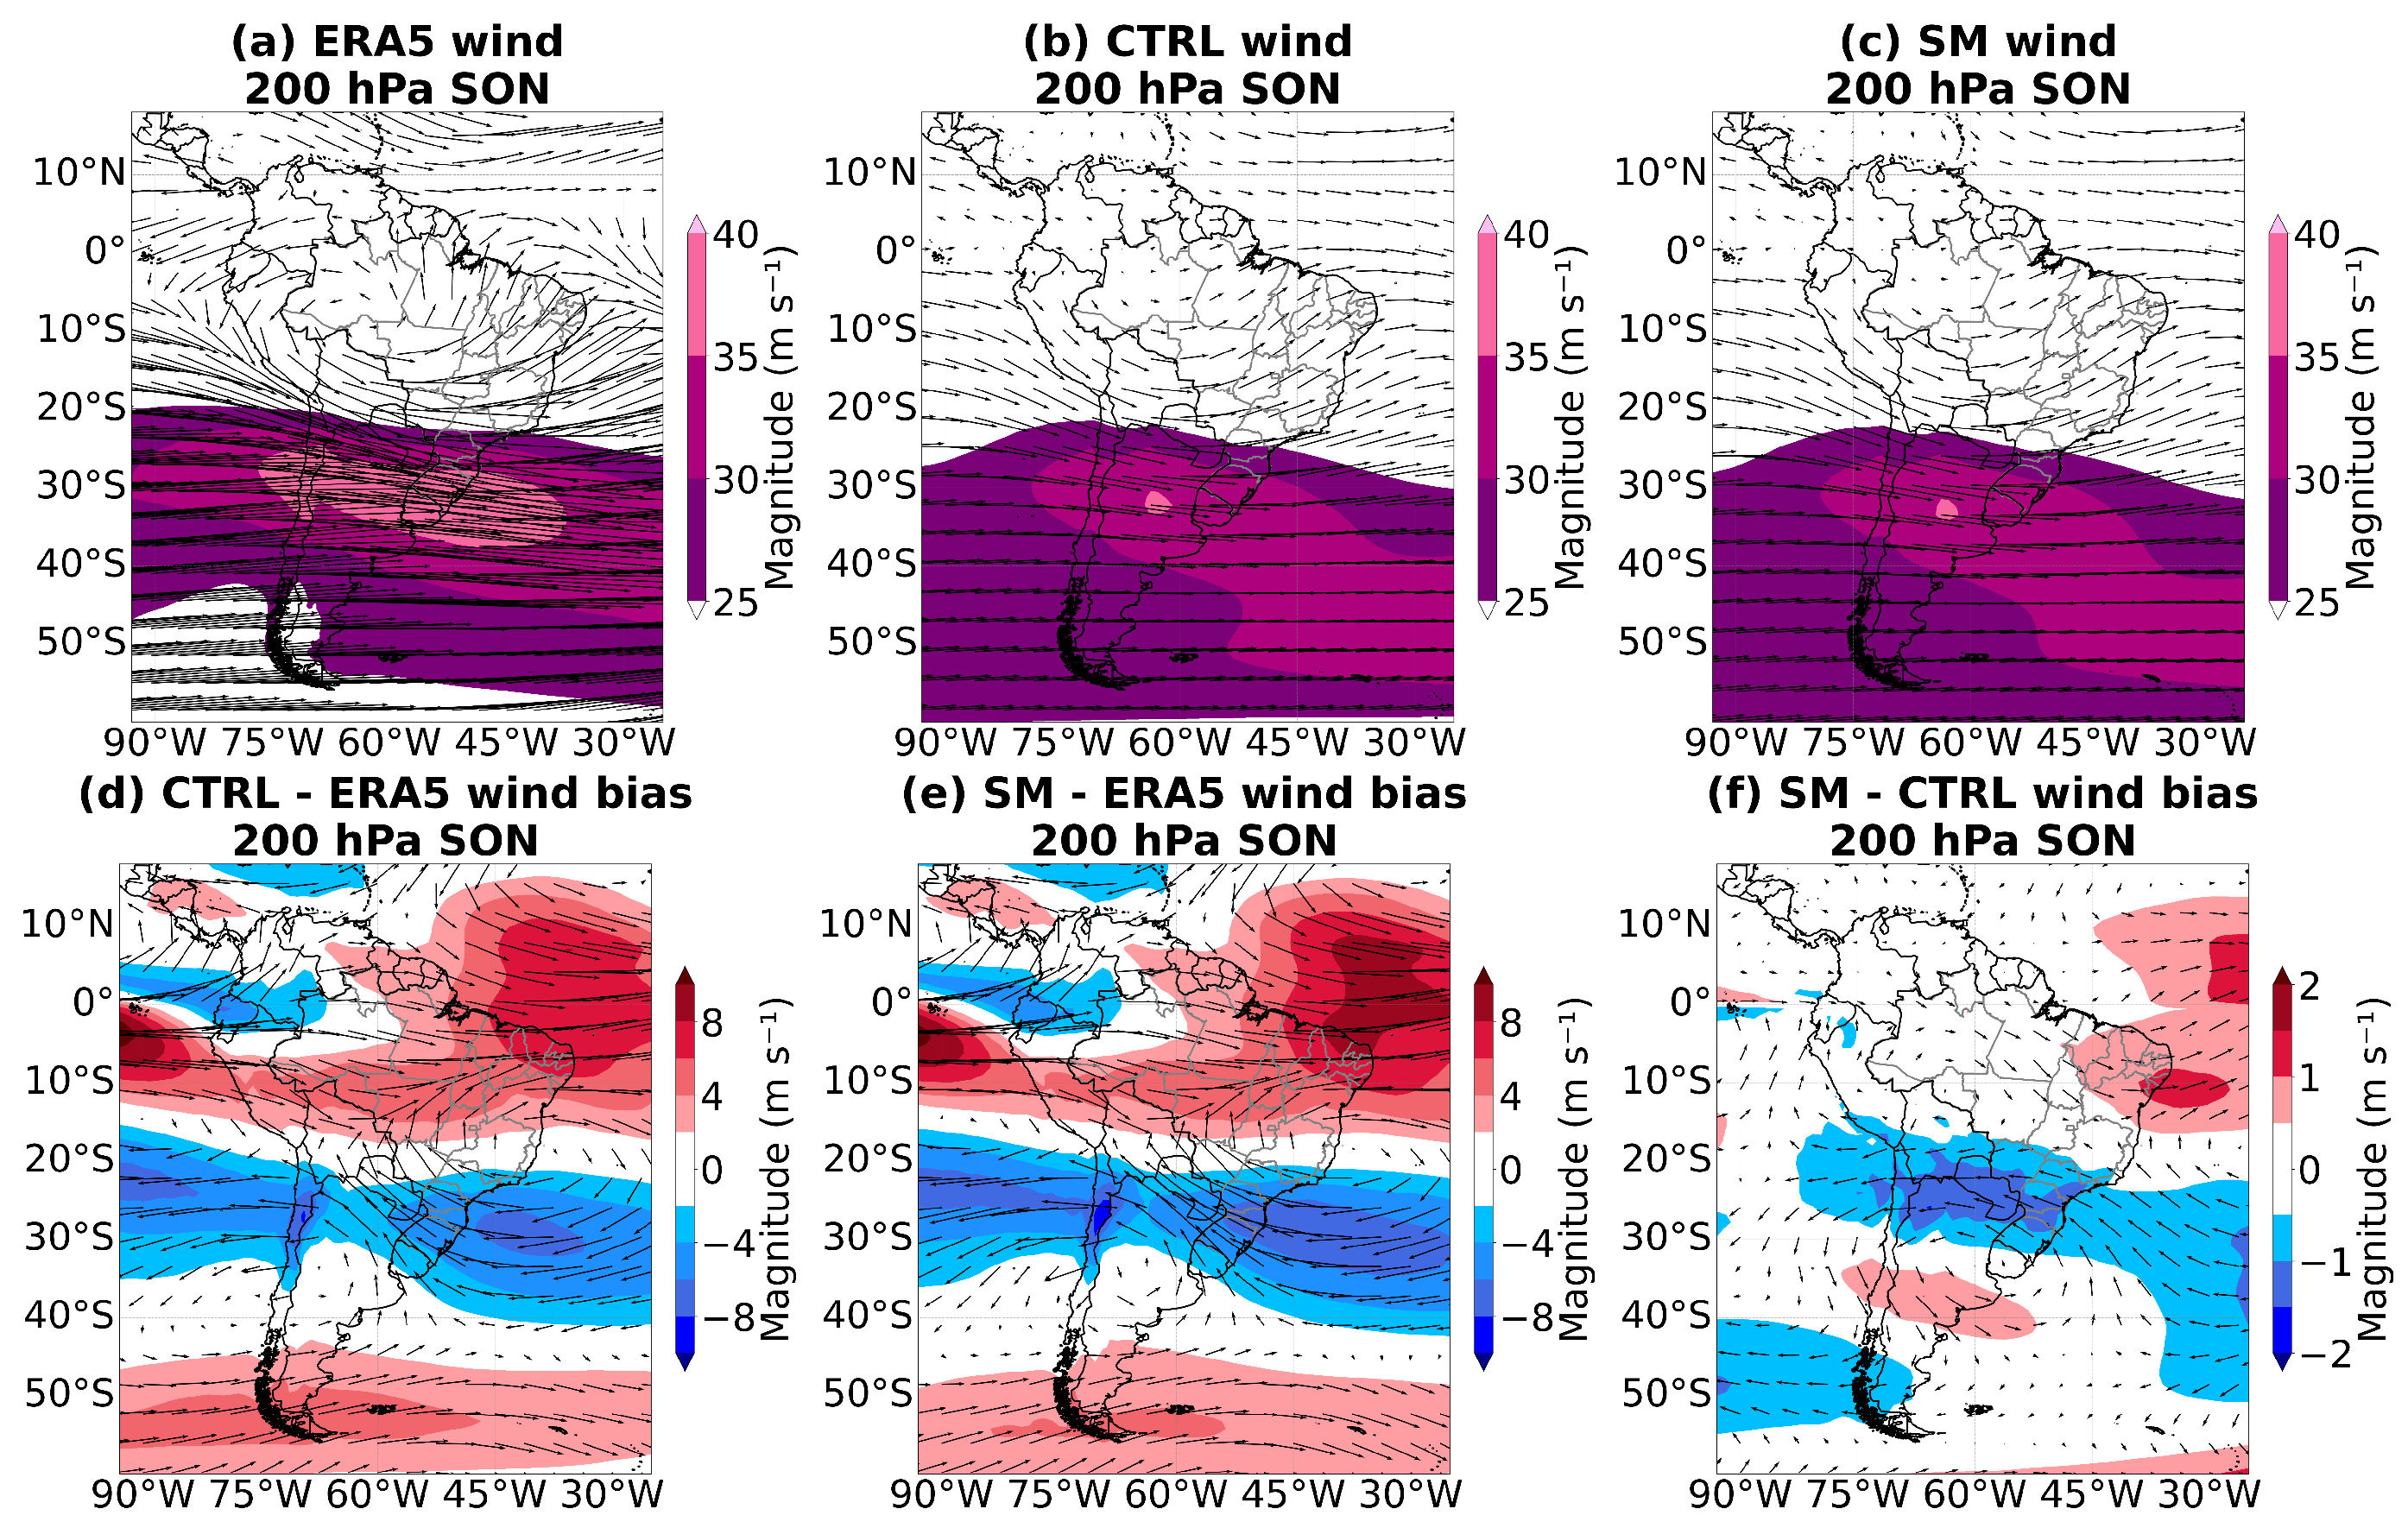
Figure 5 shows the mean circulation at 200 hPa for SON and the bias against the reanalysis for the two experiments. The first striking feature, already highlighted above, is that, for both experiments, the model did not close the circulation related to the Bolivian High. It is also noteworthy that the model tended to overestimate the circulation in the tropical region of the continent, with the exception of areas over Ecuador and Colombia, and, on the other hand, underestimated the circulation in the subtropical region. The comparison between the two experiments (Figure 5f) demonstrated that, in general, there was an increase in the positive bias in the equatorial region and a negative bias in the subtropical region in the BAM SM experiment.
The BAM model tended to underestimate the temperature in the polar region of the Southern Hemisphere [25], a factor that may explain the overestimations of wind speed at low (Figure 4) and high (Figure 5) levels at high latitudes due to the increase in the temperature gradient in this region.

3.3. Meridional Wind Component

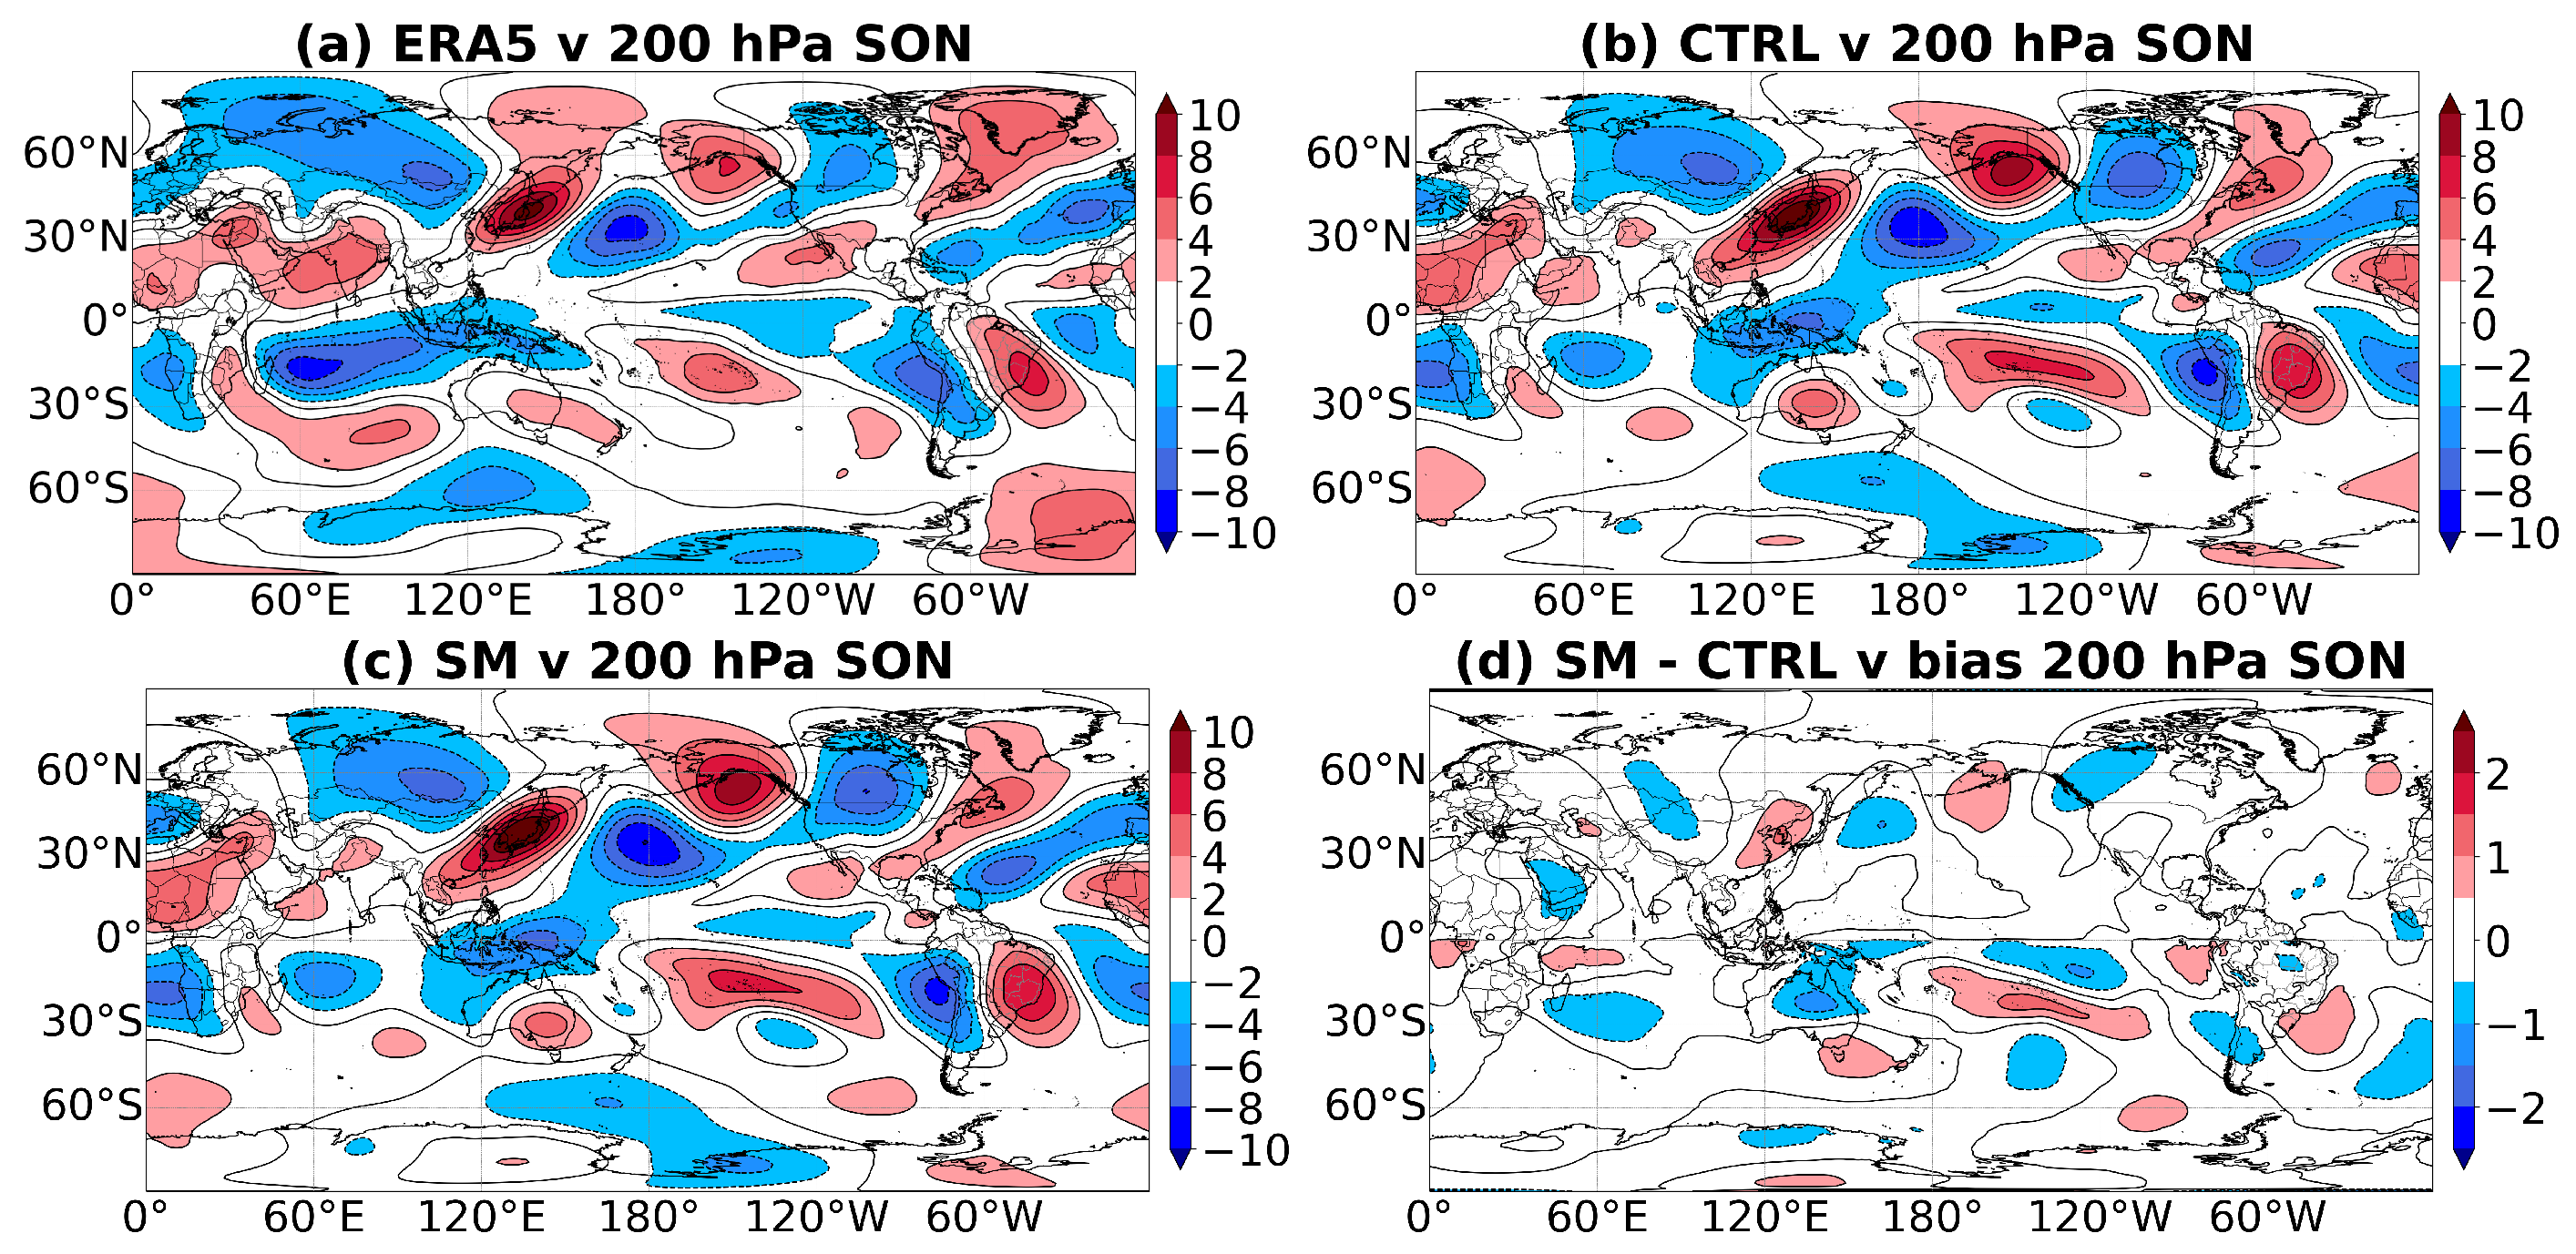
Figure 6 presents the v-component of the wind at high levels (200 hPa) for SON to verify whether changing the initial soil moisture resulted in impacts on meridional wind component. It is noted that the model, for both experiments, presented a behavior similar to that observed in the reanalysis. In the Northern Hemisphere, it can be observed that, although the BAM presented the circulation with the same number of waves, the model tended to overestimate the south and north components between the latitudes of 90 N and 35 N for both experiments. For the Southern Hemisphere, the model’s atmospheric wave patterns showed the greatest differences over the Indian and Pacific Oceans. Regarding South America, it is noted that, while ERA5 presented the most–inclined wave pattern, for the two BAM experiments, the north and south components of the circulation were more aligned. A comparison between the two experiments (Figure 6d) demonstrated that the BAM SM experiment had a more intense southern component close to the coast of the South and Southeast regions, which would favor the amplification of the Northeast trough.

3.4. Humidity Distribution

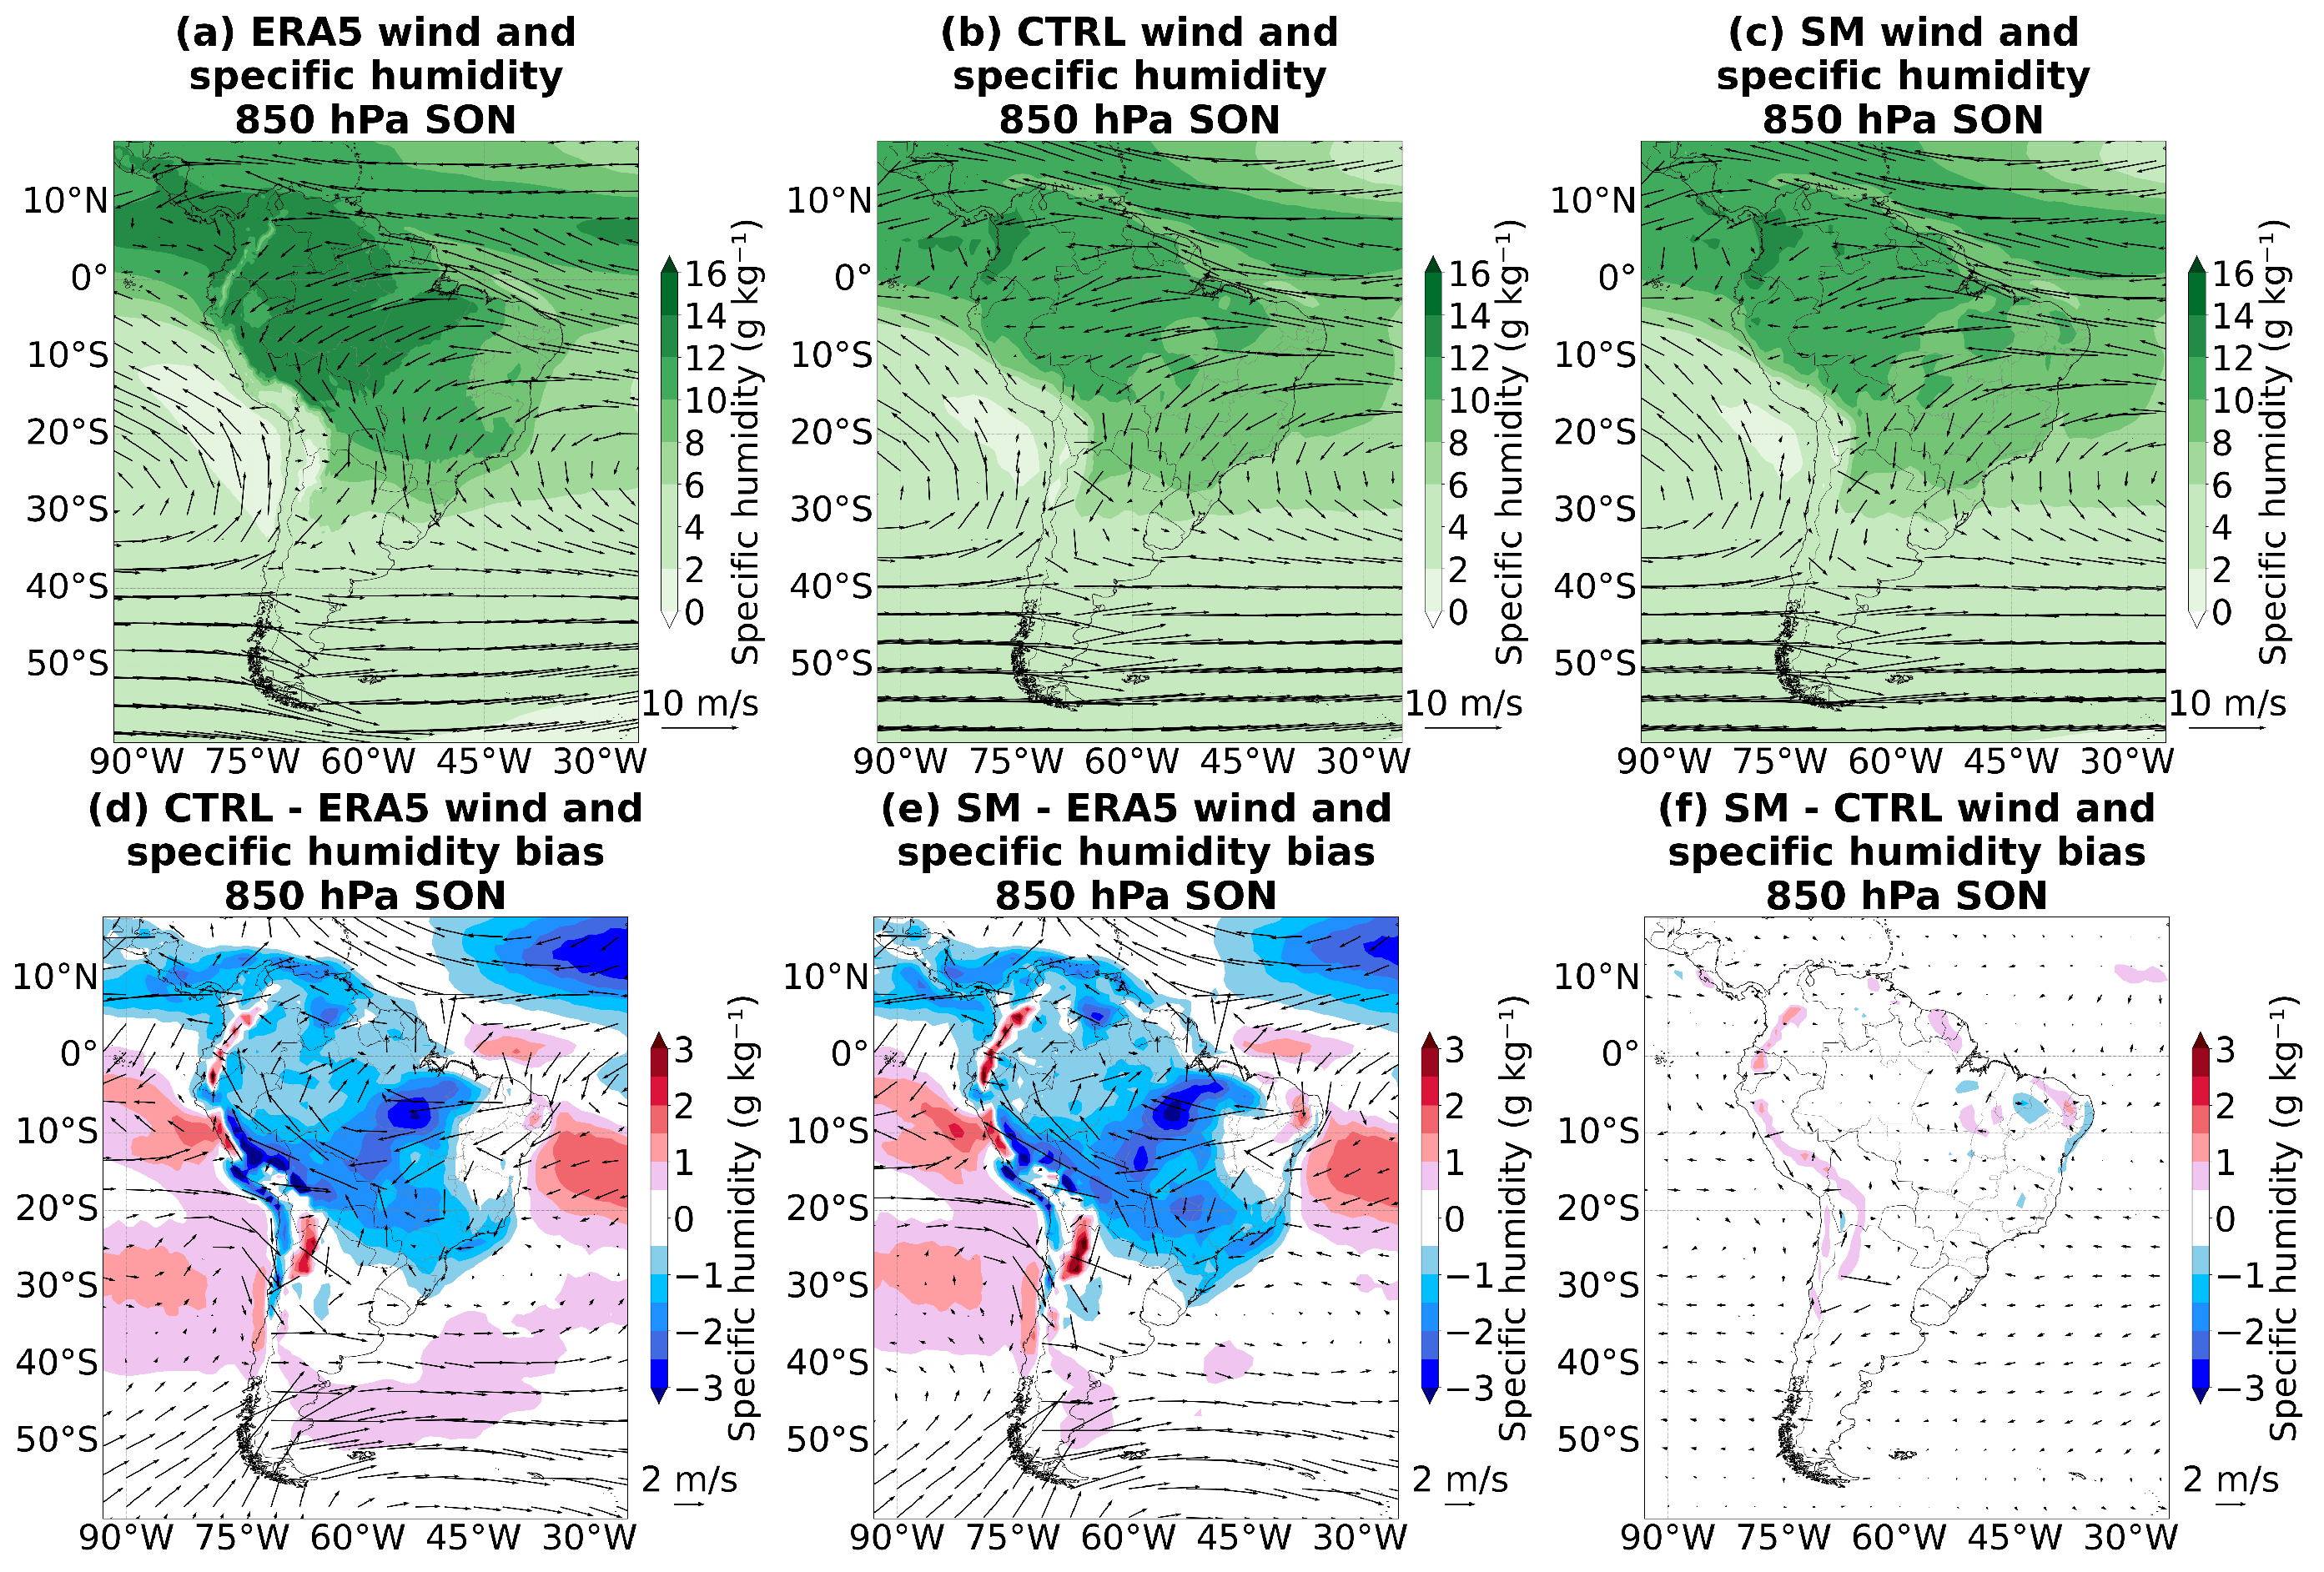
Figure 7 shows the mean circulation and specific humidity for SON at 850 hPa. It is noted that the model underestimated the specific humidity over a large part of the continent, with a greater negative bias in the area between the south of the North region and the Midwest of Brazil. The comparison between the two experiments (Figure 7f) demonstrated that no major differences were observed.
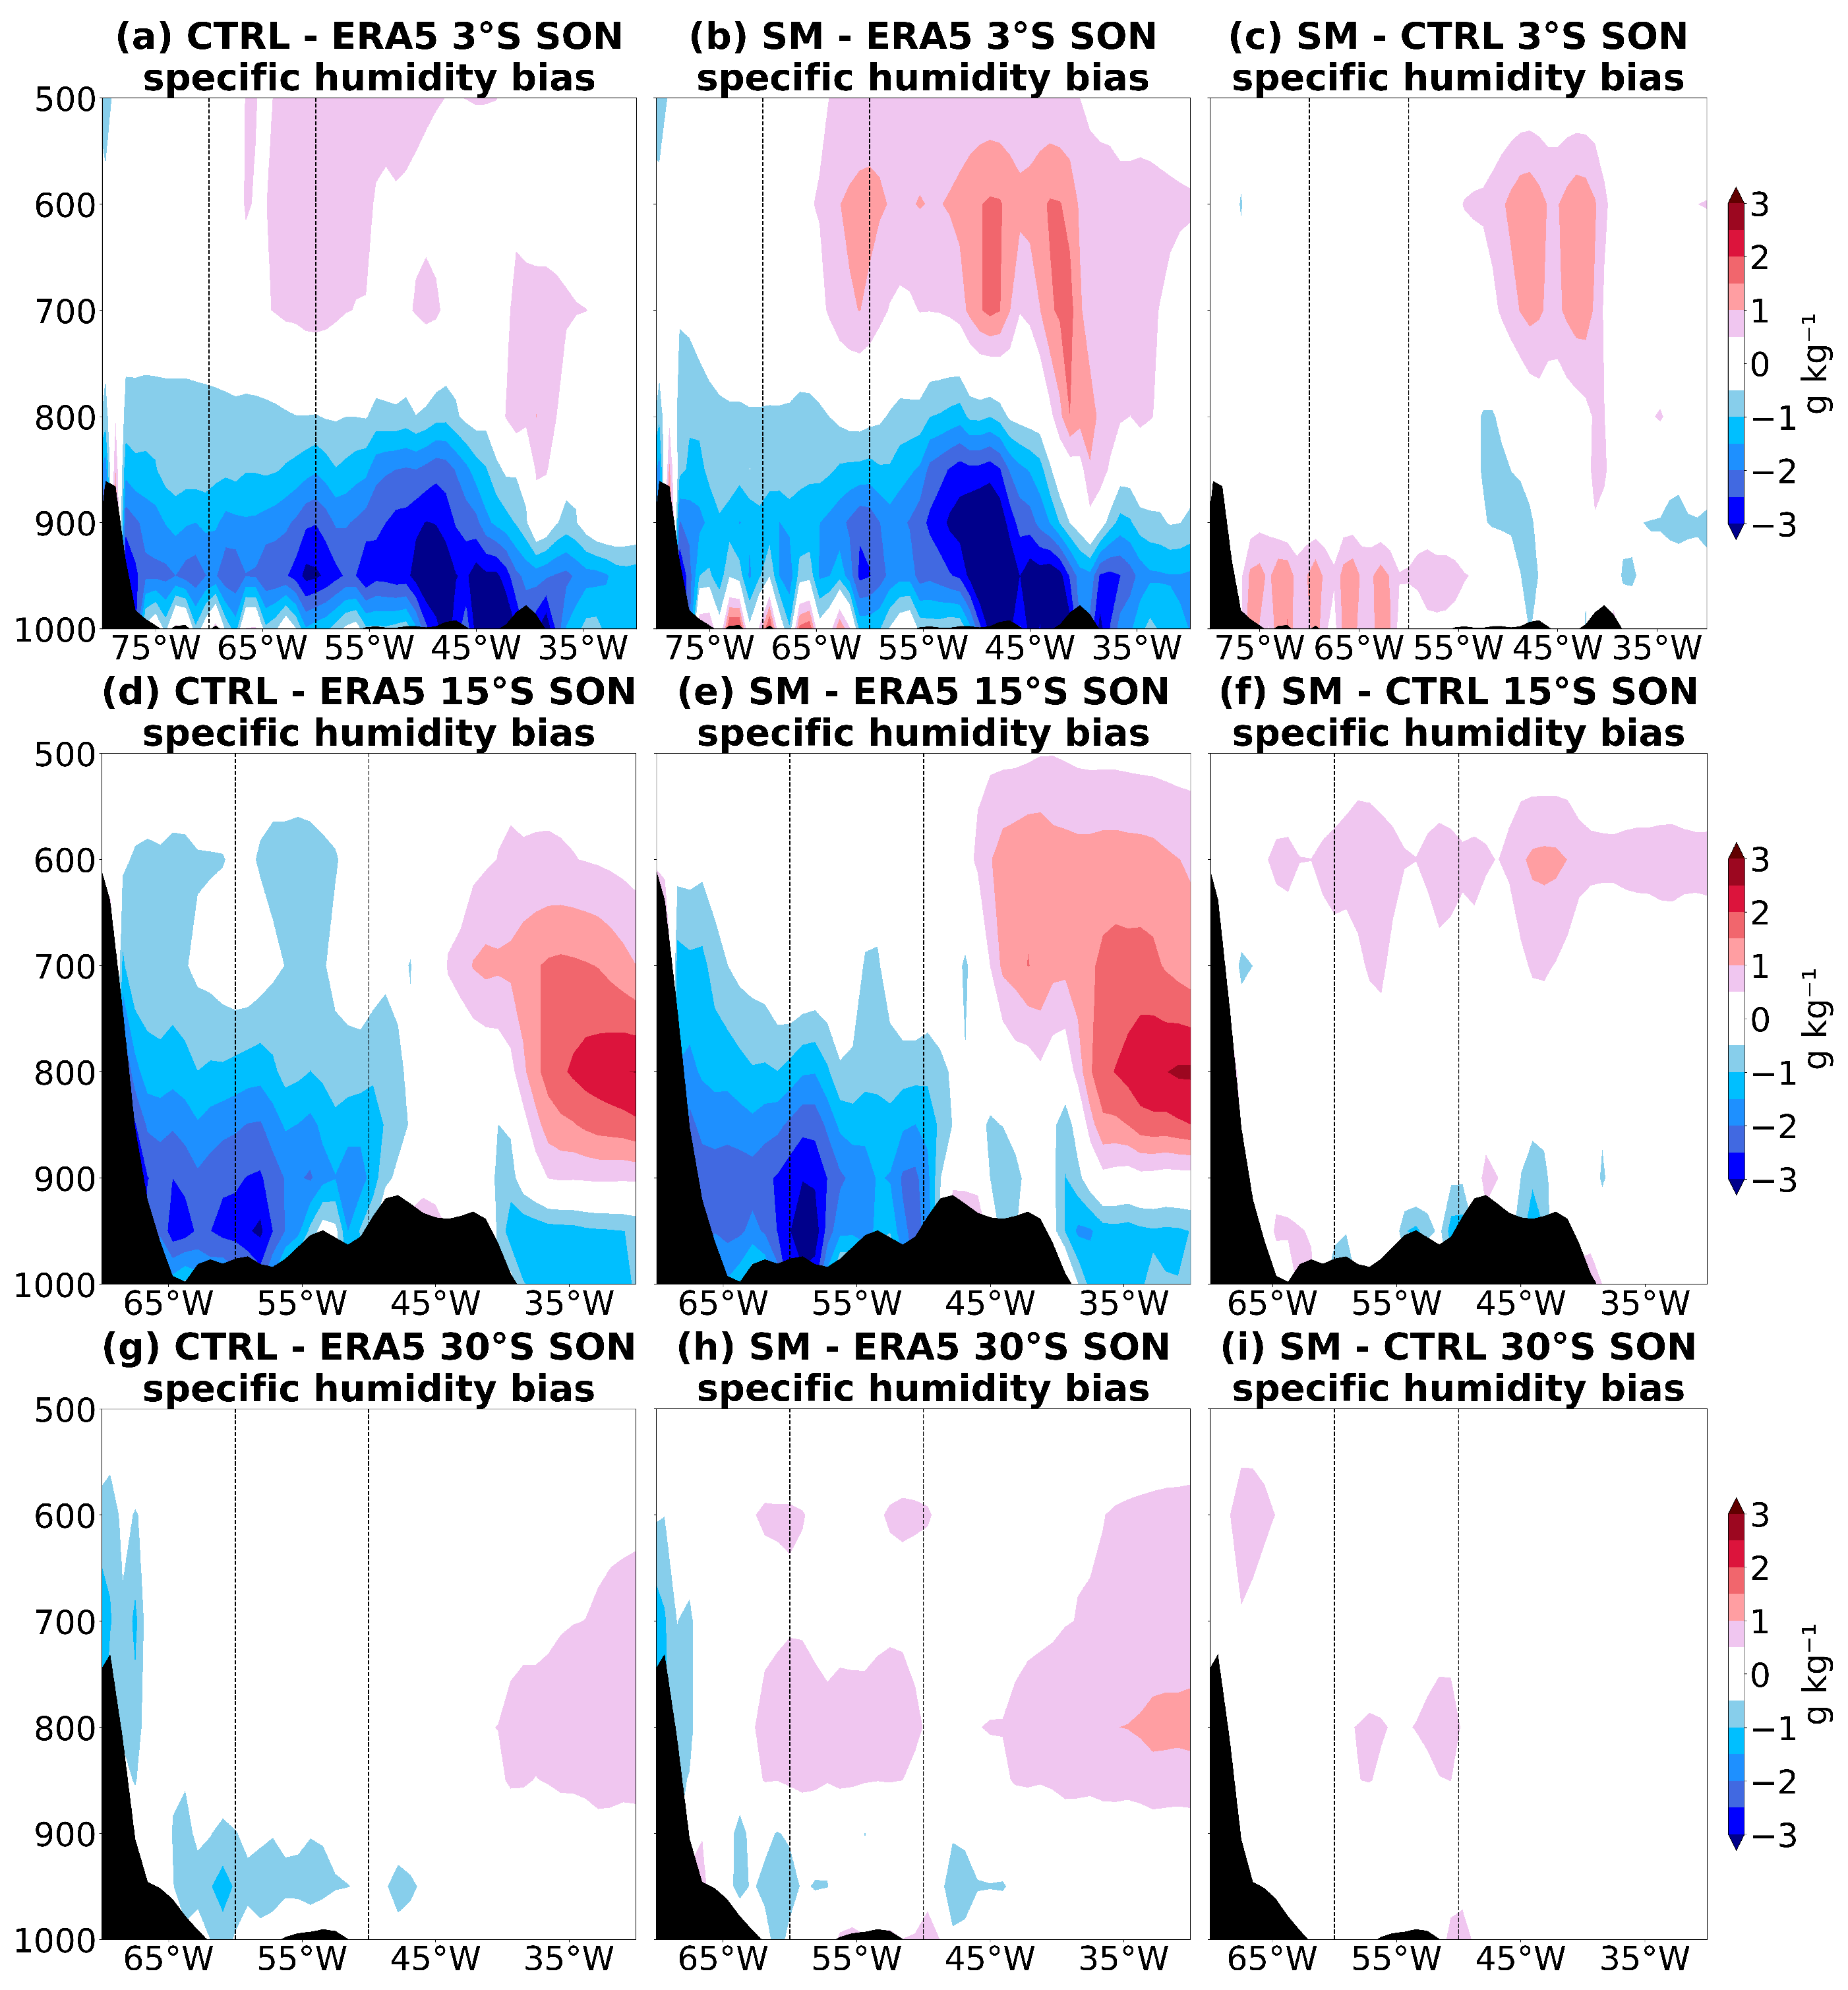
Figure 8 presents the longitudinal section of the specific moisture content in the central latitudes of the Amazon Basin (Figure 8a–c), Central Brazil (Figure 8d–f), and La Plata Basin (Figure 8g–i) boxes. Initially, we highlight the fact that the BAM model presented a moisture deficit at low levels for the three regions analyzed in both experiments (Figure 8a,b,d,e,g,h). In fact, for the central strip of the continent, this moisture deficit was already reported in the work by Coelho et al. [56]. The comparison between the BAM CTRL and BAM SM experiments (Figure 8c,f,i) demonstrated that, in general, the BAM SM experiment resulted in an increase in the moisture content in the atmosphere over the continent, especially between 750 and 500 hPa. For the Amazon Basin (Figure 8c), it is noted that the BAM SM experiment also resulted in an increase in the moisture content close to the surface, which contributed to the reduction of the negative bias in relation to the ERA5 data (Figure 8b). For the La Plata Basin (Figure 8i), the BAM SM experiment resulted in an increase in the moisture content in the entire column of the analysis, which resulted in a reduction (increase) of the bias in relation to the surface reanalysis (800 hPa) (Figure 8h).

3.5. Soil Moisture

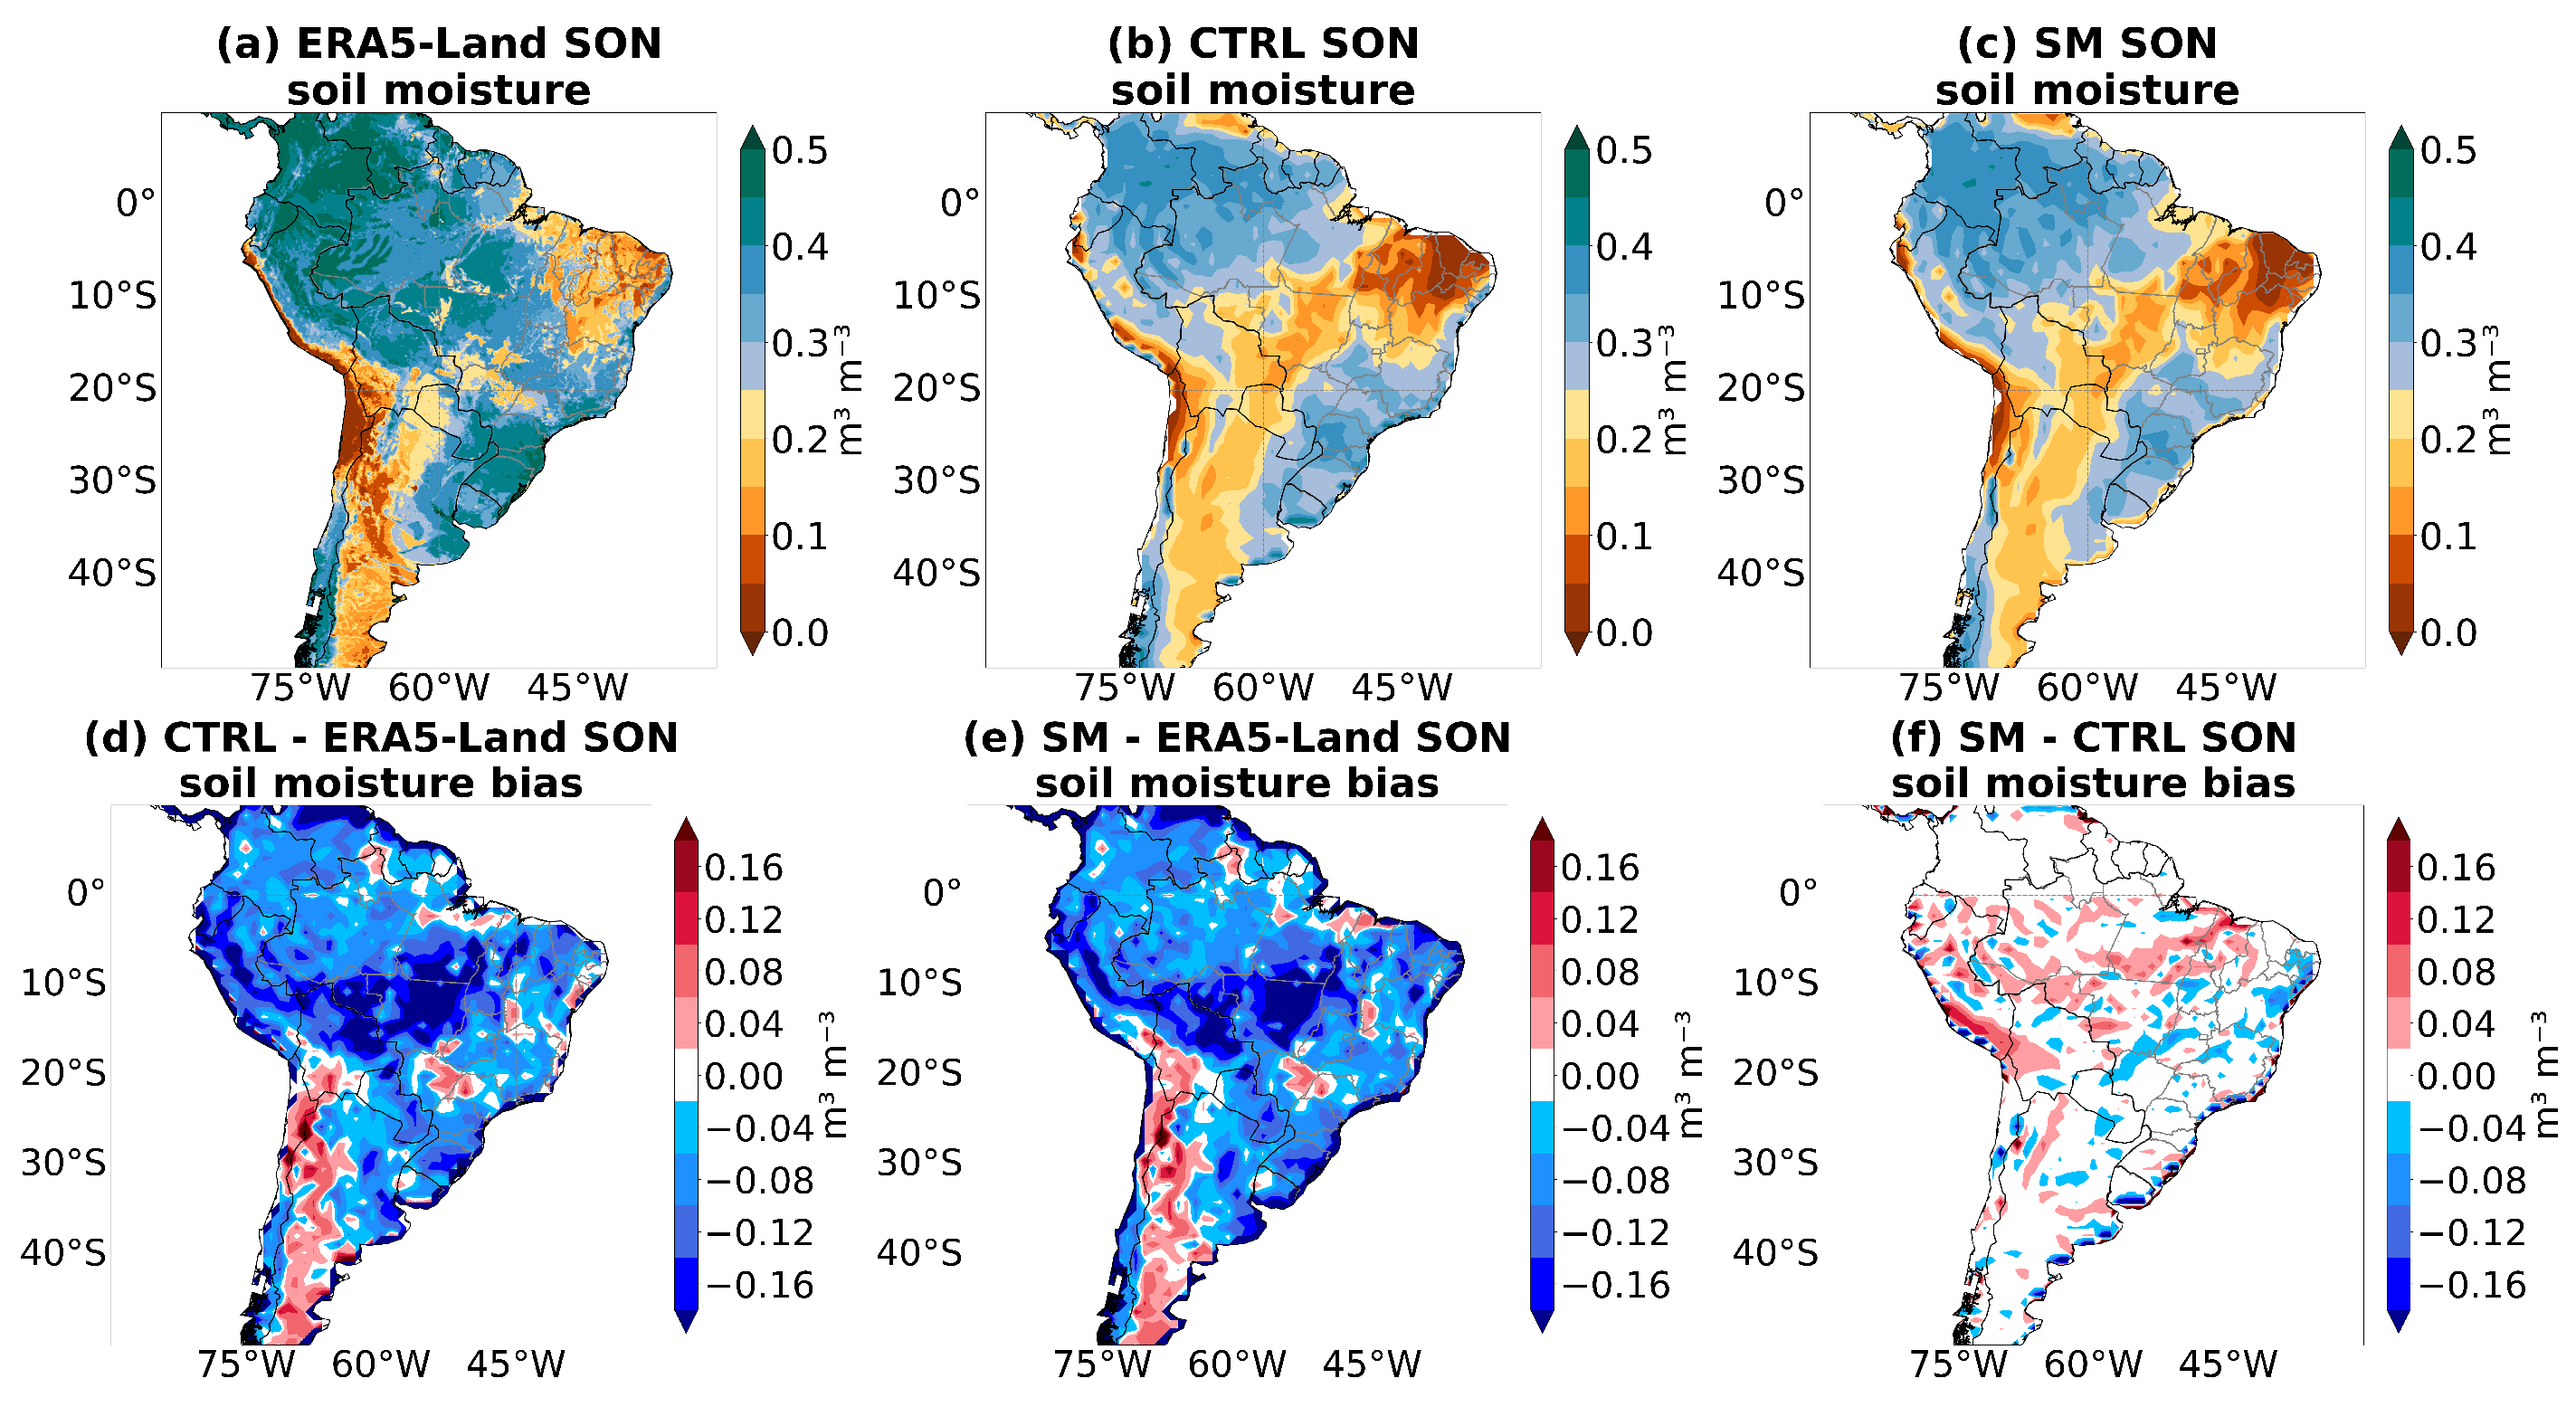
Figure 9 presents the soil moisture for SON and the biases of the BAM CTRL and BAM SM experiments to a reanalysis (Figure 9d,e) and between experiments (Figure 9f). It is noted that the model tended to underestimate, for both experiments, soil moisture over most of the continent, and this deficit was most pronounced in the area over Northern Bolivia and the Midwest of Brazil. Only over the Andes, Patagonia, and more isolated in the center of the continent, the model had higher moisture content than the reanalysis. The comparison between the two experiments (Figure 9f) demonstrated that the BAM SM experiment resulted in a small increment of the moisture content in soil over Northern Brazil.

3.6. Surface Temperature

Figure 10 presents the mean 2 m air temperature for SON and the biases of the BAM CTRL and BAM SM experiments to a reanalysis (Figure 10d,e) and between experiments (Figure 10f). Note that the BAM model, for both experiments, presented an underestimation (overestimation) of the temperature in a wide area in the south of the continent and over the Northeast of Brazil (south of the Amazon region). The comparison between the two experiments (Figure 10f) demonstrated an increase in the negative bias for the BAM SM in the center−east of the continent.

3.7. Surface Heat Fluxes

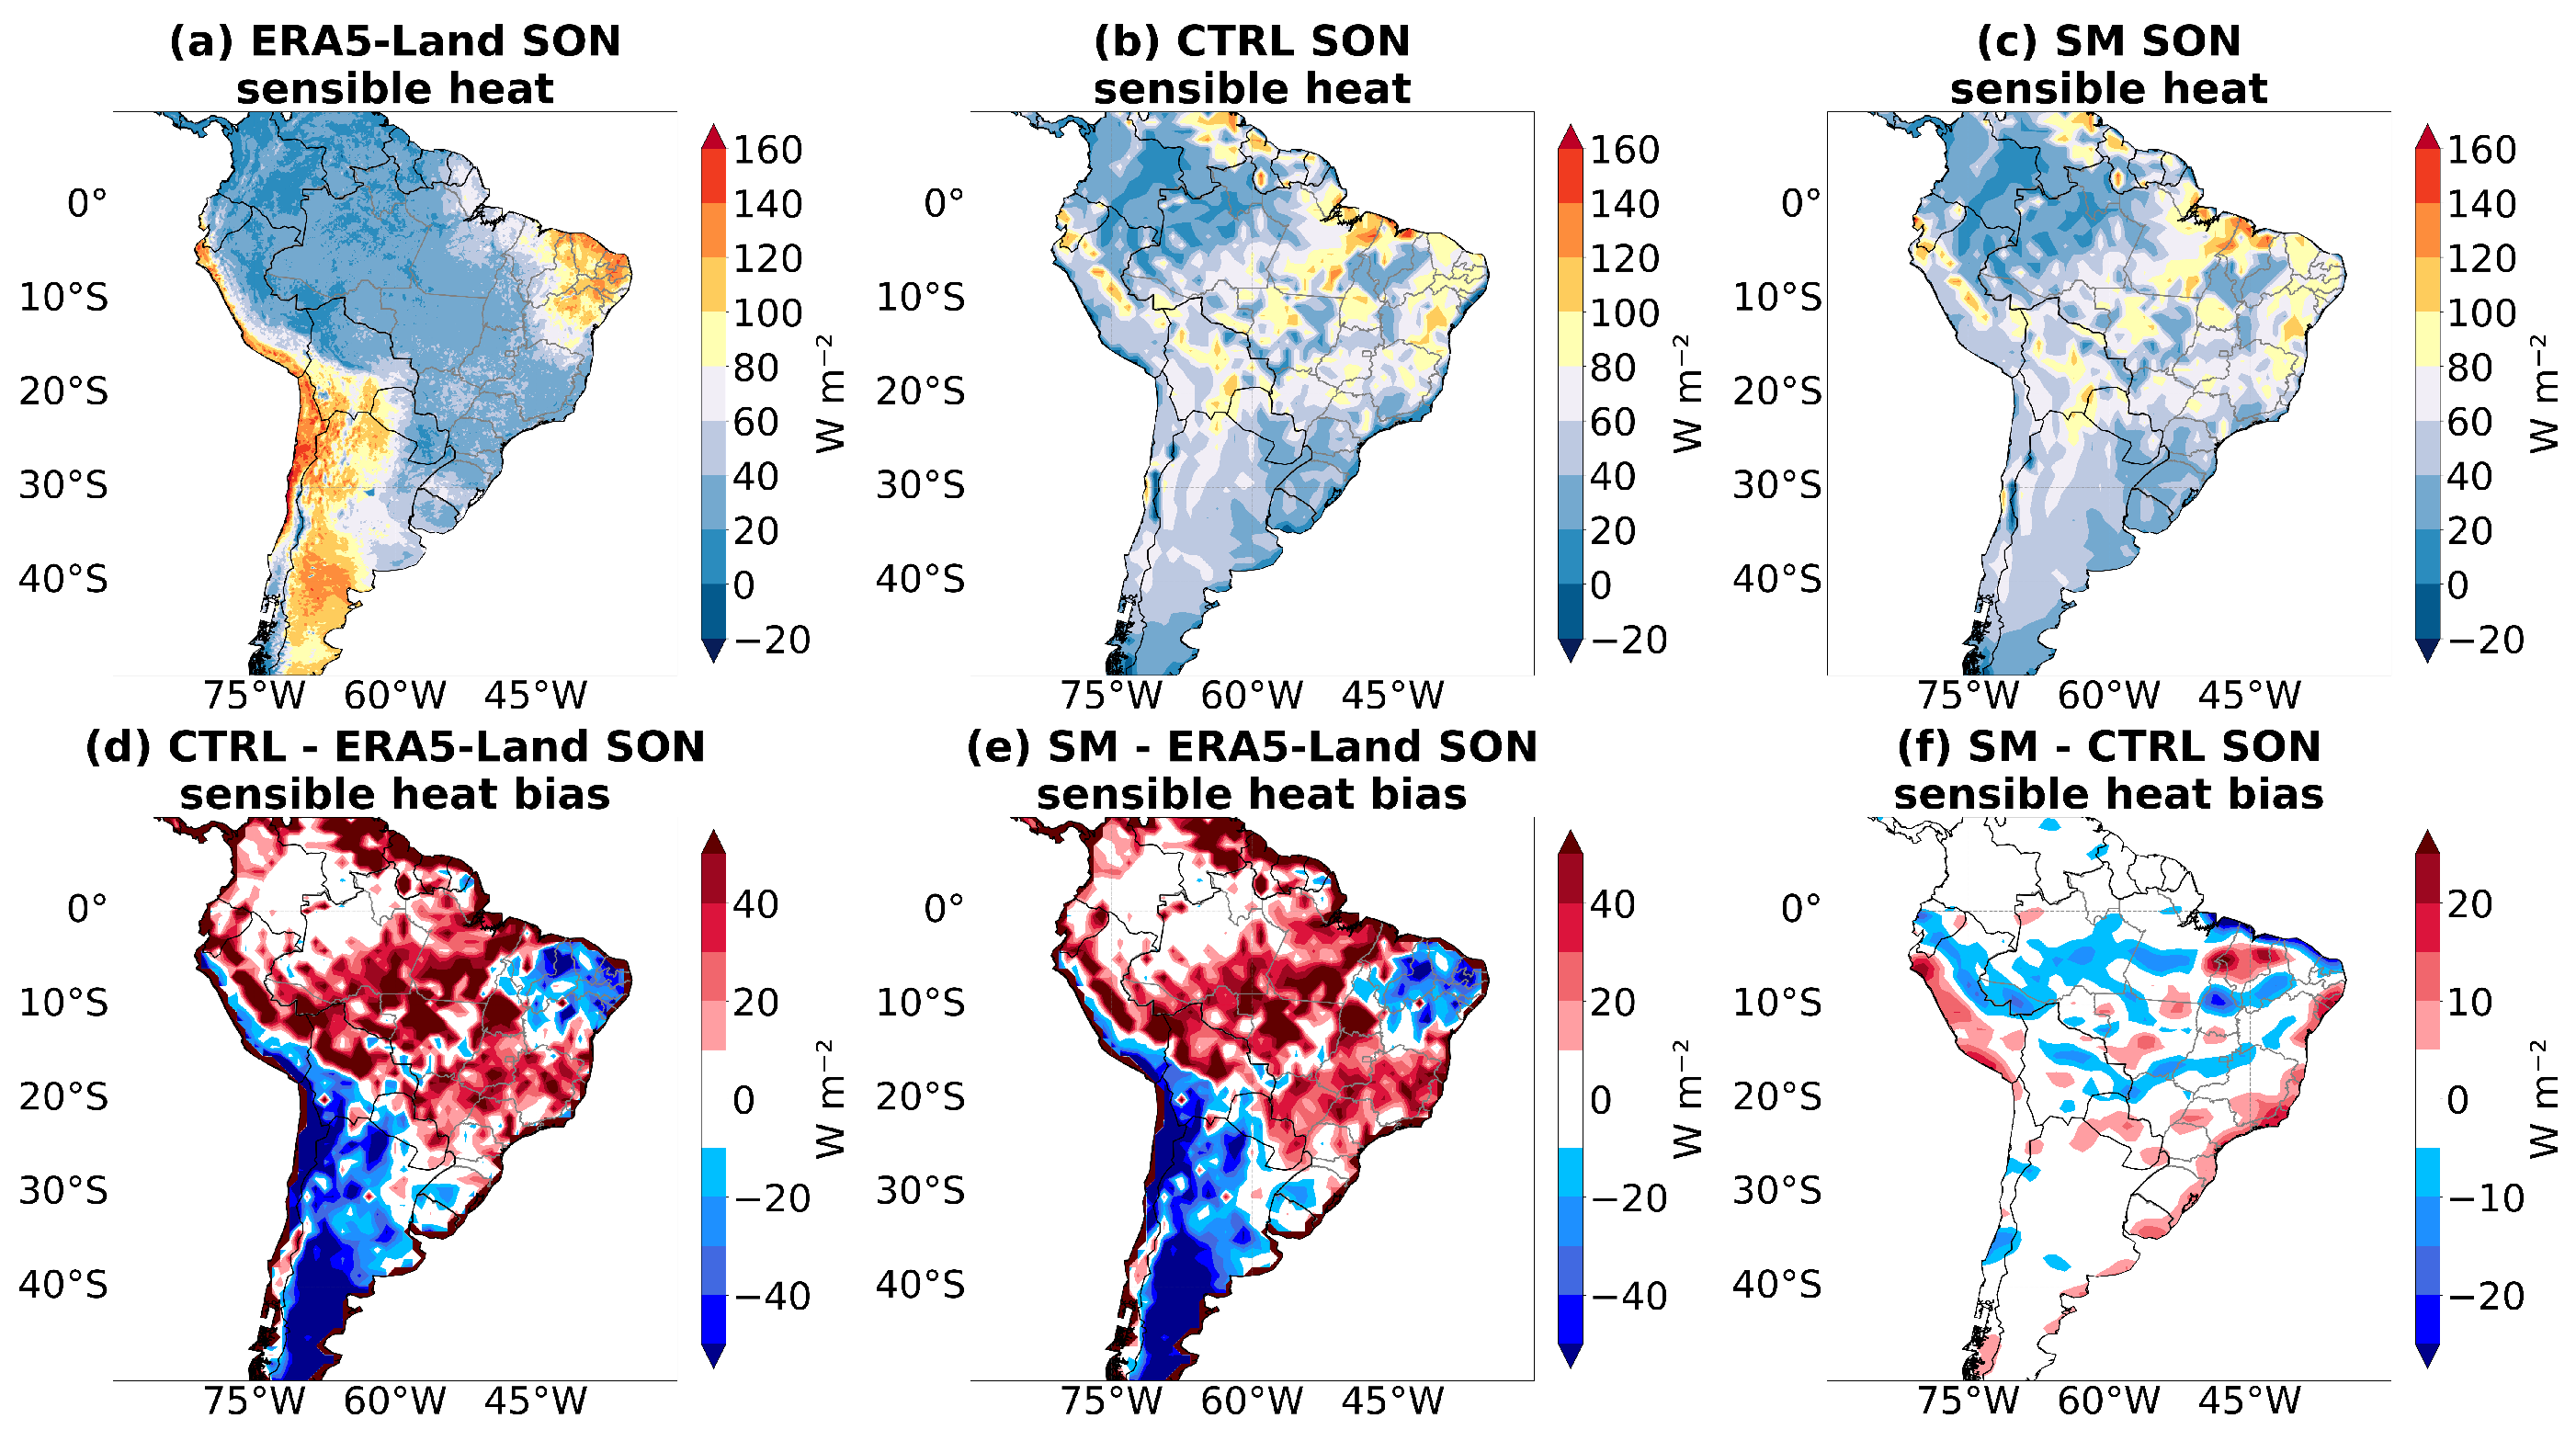
The sensible heat flux data for SON (Figure 11) demonstrated that the highest values observed in areas with lower precipitation rates (Figure 2) since most of the energy received is used to heat the air. Note that the BAM overestimated the sensible heat flux over most of the North, Midwest, and Southeast regions of Brazil, as well as areas in the north and northwest of the continent for both experiments. On the other hand, in the southern range of Bolivia, the major parts of Chile and Argentina, and points in the South and Northeast regions, the model tended to underestimate the sensible heat flux. The comparison between the BAM CTRL and BAM SM experiments (Figure 11f) demonstrated that, in the BAM SM experiment, there was a small improvement in the representation of the sensible heat flux at points in the south of the North region and part of the Midwest, areas in the which there was a reduction in the positive bias observed in relation to ERA5–Land (Figure 11d,e).
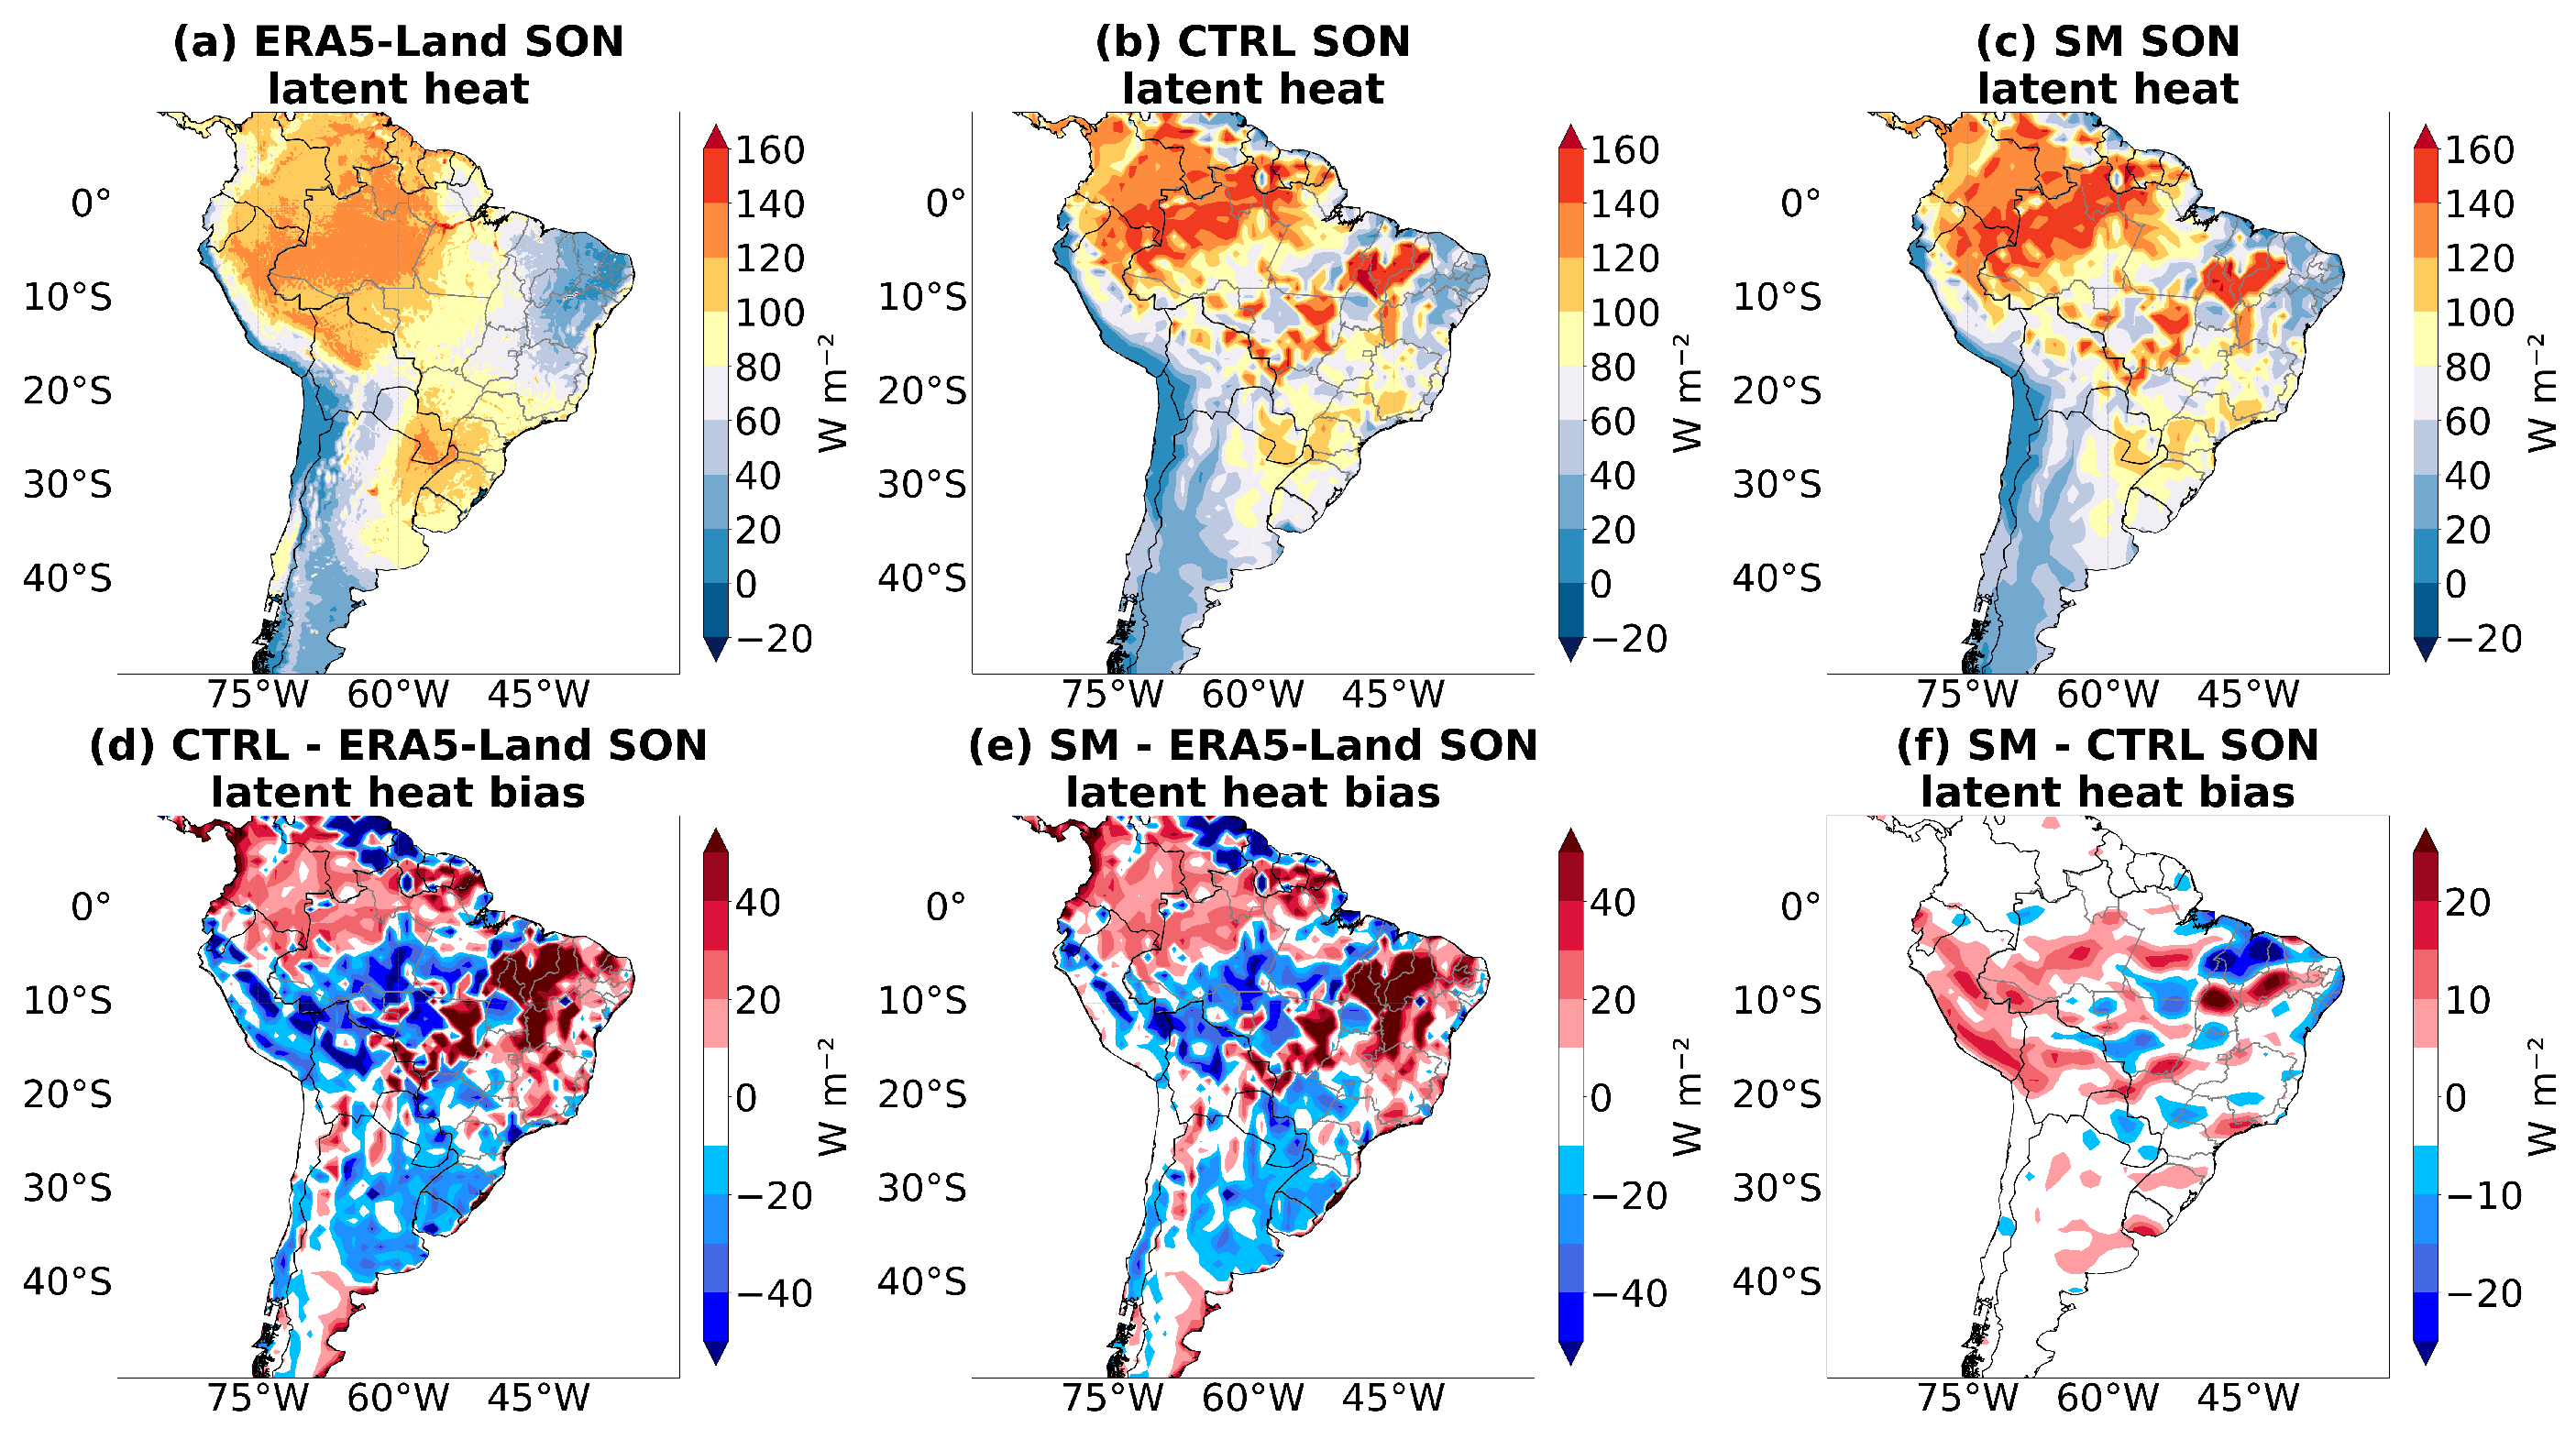
The estimates of latent heat flux for SON (Figure 12) demonstrated that the highest values were concentrated in the northwest of the continent, an area where the accumulated precipitation is highest at this time of year (Figure 2). Another area with high values of latent heat fluxes was concentrated between Argentina, Paraguay, and the South region of Brazil, although it did not have such high seasonal accumulations compared to the northwest of South America and had a more constant precipitation regime throughout the year, which contributed to higher soil moisture content. It is noted that the model tended to underestimate the values in an area between the south of the Amazon region, part of the Midwest, and the La Plata Basin. On the other hand, there was an overestimation of the values in the northern part of the continent, in the interior of the Northeast, and part of the Southeast of Brazil. The comparison between the two experiments (Figure 12f) demonstrated that the BAM SM experiment showed little improvement in latent heat flux estimates in the area between the south of the North region and part of Peru and Bolivia.
The analysis of the Bowen ratio (Figure 13) showed that the model represented the ratio between sensible and latent heat flux over most of the continent well, with higher values near the Andes Mountains south of 20 S and, also in Northeast Brazil, and lower values in the northwest of the continent. The relationship also demonstrated that, in the central strip of South America, in the area that extends from the south of the North region to the Southeast, the model presented the greatest divergences in relation to the reanalysis. The comparison between the two experiments (Figure 13f) demonstrated that the BAM SM experiment presented Bowen ratio values slightly lower than the BAM CTRL in the Midwest region, which was a result of the small improvement in the representation of the sensible (Figure 11) and latent (Figure 12) heat fluxes in this region. As seen in the study by Collini et al. [18], surface fluxes impact the boundary layer and moisture transfer to the SAMS, and the small improvement in the representation of fluxes, by the BAM SM experiment, could be an explanation for the improvement in the metrics associated with precipitation in SON over the central strip of South America (Figure 2).

3.8. Land–Atmosphere Interactions

Figure 14 displays the coupling metrics for the previously mentioned study regions. In addition to the analysis, precipitation, evapotranspiration, soil moisture, and seasonal mean temperature for these regions are also presented. Negative TCI (Figure 14a) and ZG (Figure 14g) and positive T_ET (Figure 14d) values for the ERA5–Land reference data in the Amazon Basin (first column) indicated that, at this time of year, surface flux processes are dictated by the atmosphere and controlled by radiation availability. Similar results, for annual means, were presented by Baker et al. [21], who highlighted that the high values of precipitation over the region (Figure 14j) keep the soil moist, which makes the availability of radiation a limiting factor for evapotranspiration. The fact that, for both experiments, there was a sign inversion in the TCI and ZG metrics and the magnitude of T_ET was smaller in relation to ERA5–Land stood out. This fact was also reported by Baker et al. [21], who pointed out that the soil moisture in the BAM model is lower than that observed, which makes the surface fluxes processes limited by the availability of moisture in the model simulations. It is also noted that, although the BAM SM experiment showed coupling measures of the T_ET and ZG metrics slightly closer to ERA5–Land, the simulated values were still far from the reference data.
In Central Brazil (Figure 14, second column), it is noted that, for the ERA5–Land reanalysis, during the austral spring, evapotranspiration is limited by soil moisture content, as positive TCI values were observed (Figure 14b), T_ET negative (Figure 14e), and ZG positive (Figure 14h). The experiments also showed land–atmosphere coupling, although with less intensity than that observed in the reference for the TCI and T_ET metrics. When comparing the two experiments, it is noted that the BAM SM experiment was closer to the reference for the TCI metric, possibly due to the subtle increase in soil moisture compared to the BAM CTRL experiment. There was also a small improvement in precipitation for the BAM SM experiment. On the other hand, for the T_ET metric, there was a worsening for the BAM SM in relation to the BAM CTRL experiment due to the underestimation of the temperature over this region.
Finally, for the La Plata Basin (Figure 14, third column), there was a weak atmosphere–land coupling for the reference (Figure 14c,f,i), which denotes that evapotranspiration is controlled by the availability of radiation; however, the experiments showed that the land surface regulates, although with weak intensity, the surface fluxes, due to the underestimation of the precipitation (Figure 14l), soil moisture (Figure 14r), and temperature surface (Figure 14u) values. Among the experiments, the BAM SM presented worse results for the air temperature.
Figure 15, Figure 16 and Figure 17 show the spatial variability of the metrics TCI, T_ET, and ZG, respectively, for SON. The ERA5–Land fields (Figure 15a, Figure 16a and Figure 17a) demonstrate that, for this period, most of the continent presented strong land–atmosphere coupling, this strong coupling not being restricted to the area delimited as Central Brazil, but in much of the Midwest and Southeast of Brazil, which, at this time of the year, register the transition of their precipitation regimes from the dry season to the rainy season. On the other hand, the areas in the South of Brazil and the northwest of the continent, regions in which a good part of the limits that configure the La Plata Basin and the Amazon Basin are inserted, highlighted in this study and according to the analyses presented in Figure 14, we can observe if the coupling is controlled by the states of the atmosphere.
Figure 15b,c and Figure 17b,c show equivalent results, but with greater intensity for the ZG metric. It can be seen that Central Brazil is located in the area where the model, for both experiments, presented greater variability for the metric, with areas intercalated with strong and weak atmosphere–land coupling, with stronger signals for the BAM SM experiment; furthermore, it was evident that this coupling also reached a large part of the Cerrado. This result differed from Baker et al. [21], in which it was presented that, for the BAM model, the water content in the soil is determinant for the surface fluxes in these regions. For the region of the Amazon Basin and La Plata Basin, the results were similar to those found by Baker et al. [21], but with a weaker signal for the TCI metric. A possible explanation for such a discrepancy in signal strength is that, in this research, it was decided to calculate the metrics with the mean ensemble member, while Baker et al. [21] calculated individual metrics for each member and, after the calculation, the mean of the metrics. When analyzing the spatial variability of the T_ET coupling metric (Figure 16b,c) for the Central part of Brazil, it is noted that the BAM CTRL experiment presented strong land–atmosphere coupling; on the other hand, in the BAM SM, there were areas in which the surface fluxes were controlled by the atmosphere, and this pattern extended across southeastern Brazil. In the Amazon Basin, there was a strong positive and negative coupling signal for the BAM CTRL and a predominance of land surface conditions in the BAM SM, however with a less intense signal than that observed in the BAM CTRL. The region of the La Plata Basin presented a strong signal of atmosphere–land coupling for both experiments, with a broader area in the BAM SM experiment; such intensity was not observed by Baker et al. [21].
In Figure 18, the relationship shown demonstrated the association between soil moisture variability and evapotranspiration over the three areas of interest (Figure 1). The high ratio between the two variables for the reanalysis over Central Brazil (Figure 18b) demonstrated that surface fluxes are highly dependent on soil moisture content in this region. As seen for some coupling metrics (Figure 14), the relationship established between the mean members of the two experiments was smoothed (Figure 18e,h), but a positive correlation was still observed between the two variables for both experiments. On the other hand, for the Amazon Basin and the La Plata Basin (Figure 18, first and third column, respectively), the reanalysis showed us that there is no dependence between soil moisture and evapotranspiration; however, the predictions of the experiments showed the opposite, a positive relationship.
Figure 19 presents the results of the two–legged metric for the total transfer of moisture from the land surface to the atmosphere (SM–ET–P). The results demonstrated that the model, for both experiments, reproduced the positive association between soil moisture and precipitation over a large part of South America (Figure 19h,i), although with a lower magnitude compared to ERA5–Land (Figure 19g). In a similar analysis, but for the December, January, and February (DJF) period, Baker et al. [21] observed that, although in some situations, the model presented the correct feedback between soil moisture and precipitation, this can occur for the wrong reasons, as observed for SON in northwest South America and in the Central Brazil area for the BAM CTRL and BAM SM experiments.

4. Discussion and Conclusions

This study consisted of the evaluation of retrospective forecasts for the austral spring (SON) over South America, built with a more realistic initialization of the Soil Moisture over South America (BAM SM). The presented results demonstrated that the model was sensitive to changes in soil moisture content. There was an improvement in the metrics associated with precipitation in areas where the Control experiment (BAM CTRL) had greater limitations in the central part of the continent, especially in the Southeast of Brazil and also in the area of the La Plata Basin, with an increase in the correlation and a reduction in the RMSE for the BAM SM experiment.
To understand the influence of the change in the initialization of soil moisture on the precipitation of SON, an analysis was carried out of the circulation at low and high levels over South America, the meridional wind component at high levels, the distribution of moisture over the continent, the temperature at 2 m, soil moisture, and surface fluxes. In the analysis of the circulation at low and high levels, the specific humidity distribution at 850 hPa, and the v–component of mean wind at high levels, it was observed that the modification in the humidity initialization did not cause a marked alteration in the configuration of the atmospheric circulation.
On the other hand, the analysis of soil moisture showed that, in the BAM SM experiment, there was an increase in water content, especially in the southern part of the Amazon region. For sensible and latent heat fluxes, it was observed that the BAM SM experiment resulted in a small improvement in the estimates of fluxes in the area between the south of the North Region and part of the Midwest of Brazil, regions in which the change from a low precipitation volume to the rainy season during SON occurs. For the temperature at 2 m, there was an increase in the negative bias in the BAM SM experiment compared to the reanalysis for a major part of the Northeast, Midwest, and Southeast of Brazil.
In more detail, this study compared the two experiments for three specific regions of South America: (1) Central Brazil; (2) Amazon Basin; (3) La Plata Basin. The analysis of the Taylor diagram for the precipitation, over these regions, demonstrated that the BAM SM experiment presented superior performance to the BAM CTRL experiment over the areas of Central Brazil and La Plata Basin, while over the Amazon Basin, the BAM CTRL experiment performed slightly higher. The longitudinal profiles of specific humidity up to 500 hPa showed that the BAM SM experiment resulted in an increase in the moisture content of the atmosphere.
It is known that the greatest effects of the land surface occur in regions with a moisture deficit [48] and that surface fluxes are fundamental for the processes of atmospheric instability and moisture convergence in the central strip of the continent during the beginning of the season rainy season [18]. Not necessarily the increase in evaporation in a place results in an increase in precipitation over it [48], but the best representation of heat fluxes over part of the Amazon Region and increased soil moisture in this same area, observed in the BAM SM experiment, may have been fundamental factors for the increase in humidity at low and medium levels of the atmosphere over Central Brazil and, more discreetly, over the La Plata Basin and, consequently, for the improvement observed in the metrics of precipitation observed over these regions.
Still, in the three mentioned regions, the analysis of the spatial variation of some meteorological variables was also carried out, and a set of coupling metrics was applied since the ability of the models to reproduce the mean climatological of the precipitation is linked to the representation of the land–atmosphere coupling [20]. For both experiments, in the Amazon Basin, the coupling metrics denote that the surface fluxes are regulated by the availability of soil moisture in the model, an opposite relationship to that observed in the reference, as in Baker et al. [21]. For this region, the model underestimated soil moisture for both experiments.
In Central Brazil, the analysis of the coupling metrics demonstrated that the surface fluxes were dictated by the states of the land surface as in the reanalysis; however, there are points with strong atmosphere–land coupling, different from what was presented in Baker et al. [21]. The experiments presented an underestimation of this influence, mainly due to the underestimation of the moisture content in the soil in this area. Between the two experiments, the slight improvement (worsening) in the representation of moisture content (temperature) in the BAM SM experiment stood out. The maps of the coupling metrics showed that Central Brazil is the area where the greatest variability and differences between experiments occurred.
For the La Plata Basin, similar to what was observed for the Amazon Basin, land surface conditions were predominant over surface fluxes for the experiments, although the reanalysis showed atmosphere–land coupling. Both experiments had lower values of precipitation and soil moisture compared to the reference, and from the comparison between the two experiments, it is noteworthy that the BAM SM experiment resulted in a worse representation of the spatial variation of temperature over the region.
Soil moisture has the greatest influence on precipitation over Central Brazil and Southern Amazon Basin as seasonal precipitation intensifies as the rainy season approaches (DJF), while the La Plata Basin presents very low seasonality and according to Pinault [55] it is controlled by ocean–atmosphere interactions, with a mean period of 8 years.
The results presented in this study demonstrated that the model was sensitive to changes in soil moisture initialization and that a more realistic representation led to improvement in precipitation forecasts during the SAMS pre-rainy season over the central and southern part of South America. The observed effects that had the greatest influence on the energy and precipitation cycle were the increase in soil moisture in the southern Amazon region, accompanied by an increase in latent heat flux and a decrease in sensible heat flux. As a result, an increase in soil moisture content was observed, not only in the Amazon Basin, but also in Central Brazil and, to a lesser extent, in the La Plata Basin. The combination of these factors may be the main explanation for the improvement in precipitation estimates in SON over part of the continent.
However, this work showed the deficit of soil moisture in the model at a large scale in the seasonal forecast over South America. Therefore, the land–atmosphere interactions did not reflect the reanalysis overall continent and need to be improved, opening several opportunities for future research.

Author Contributions

Conceptualization, V.B.M.A., L.G.G.d.G., and S.N.F.; methodology, V.B.M.A.; software, V.B.M.A., D.A.A., P.Y.K., and C.R.d.S.; validation, V.B.M.A. and D.A.A.; formal analysis, V.B.M.A.; investigation, V.B.M.A.; resources, V.B.M.A.; data curation, V.B.M.A.; writing–original draft preparation, V.B.M.A. and D.A.A.; visualization, V.B.M.A.; supervision, L.G.G.d.G. and S.N.F.; project administration, V.B.M.A. All authors have read and agreed to the published version of the manuscript.

Funding

This study was financed in part by the Coordenação de Aperfeiçoamento de Pessoal de Nível Superior (CAPES), Finance Code 001, and the Conselho Nacional de Desenvolvimento Científico e Tecnológico (CNPq), Grant Number 140346/2019-8.

Institutional Review Board Statement

Not applicable.

Informed Consent Statement

Not applicable.

Data Availability Statement

The datasets used in this study are available at the following repositories: CERES (https://ceres.larc.nasa.gov/data/, accessed on 1 January 2023), ERA–Interim reanalysis (http://apps.ecmwf.int/datasets/data/interim-full-daily/levtype=sfc/, accessed on 1 January 2023), ERA5 reanalysis (https://cds.climate.copernicus.eu/cdsapp#!/dataset/reanalysis-era5-pressure-levels-monthly-means?tab=overview, accessed on 1 January 2023), ERA5–Land reanalysis (https://cds.climate.copernicus.eu/cdsapp#!/dataset/reanalysis-ERA5--Land-monthly-means?tab=overview, accessed on 1 January 2023), GDAS (https://rda.ucar.edu/datasets/ds083.3/, accessed on 1 January 2023), GLDAS (https://disc.gsfc.nasa.gov/datasets/GLDAS_NOAH025_3H_2.1/summary?keywords=GLDAS, accessed on 1 January 2023), GPCP (https://www.ncei.noaa.gov/data/global-precipitation-climatology-project-gpcp-monthly/access/, accessed on 1 January 2023) IMERG (https://https://disc.gsfc.nasa.gov/datasets/GPM_3IMERGHHL_06/summary?keywords=imerghh, accessed on 1 January 2023), and Princeton atmospheric forcing (http://hydrology.princeton.edu/data.pgf.php, accessed on 1 January 2023).

Acknowledgments

We thank the anonymous reviewers for their suggestions and comments for the improvement of the manuscript. This work was supported by the following Brazilian research agencies: CAPES and CNPq, and constitutes part of V.B.M. Arsego’s doctoral dissertation at the Instituto Nacional de Pesquisas Espaciais (INPE).

Conflicts of Interest

The authors declare no conflict of interest.

Abbreviations

The following abbreviations are used in this manuscript:
AGCMAtmospheric General Circulation Model
BAMBrazilian global Atmospheric Model
BAM CTRLBAM Control experiment
BAM SMBAM Soil Moisture experiment
CERESClouds and the Earth’s Radiant Energy System
CPTECCentro de Previsão de Tempo e Estudos Climáticos
CTRLControl
DJFDecember, January, and February
ENSOEl Niño Southern Oscillation
ETEvapotranspiration
GDASGlobal Data Assimilation System
GDPGross Domestic Product
GLDASGlobal Land Data Assimilation System
GPCPGlobal Precipitation Climatology Project
GPMGlobal Precipitation Measurement mission
IBISIntegrated Biosphere Simulator
IMERGIntegrated Multi-satellite Retrievals for GPM
INPEInstituto Nacional de Pesquisas Espaciais
ITCZIntertropical Convergence Zone
LDASLand Data Assimilation Systems
LISLand Information System
PPrecipitation
RMSERoot-Mean-Squared Error
SACZSouth American Convergence Zone
SALDAS     South American Land Data Assimilation System
SAMSSouth American Monsoon System
SMSoil Moisture
SONSeptember, October, and November
SSTSea Surface Temperature
TSurface temperature
TCITerrestrial Coupling Index
T_ETTemperature–Evapotranspiration Metric
TLTwo-Legged coupling metric
ZGZeng’s Gamma

References

  1. Balanço Energético Nacional 2021: Ano Base 2020. Available online: https://www.epe.gov.br/sites-pt/publicacoes-dados-abertos/publicacoes/PublicacoesArquivos/publicacao-675/topico-638/BEN2022.pdf (accessed on 1 November 2022).
  2. PIB DO AGRONEGÓCIO BRASILEIRO. Available online: https://www.cepea.esalq.usp.br/br/pib-do-agronegocio-brasileiro.aspx (accessed on 1 November 2022).
  3. Stockdale, T.; Alves, O.; Boer, G.; Deque, M.; Ding, Y.; Kumar, A.; Kumar, K.; Landman, W.; Mason, S.; Nobre, P.; et al. Understanding and Predicting Seasonal-to-Interannual Climate Variability—The Producer Perspective. Procedia Environ. Sci. 2010, 1, 55–80. [Google Scholar] [CrossRef]
  4. Folland, C.K.; Colman, A.W.; Rowell, D.P.; Davey, M.K. Predictability of North East Brazil rainfall and real-time forecast skill, 1987–1998. J. Clim. 2001, 14, 1937–1958. [Google Scholar] [CrossRef]
  5. Dirmeyer, P.A.; Lidard-Peters, C.; Balsamo, G. Land-Atmosphere Interactions and the Water Cycle; World Meteorological Organization: Geneve, Switzerland, 2015. [Google Scholar]
  6. Halder, S.; Dirmeyer, P.A.; Marx, L.; Kinter, J.L. Impact of Land Surface Initialization and Land-Atmosphere Coupling on the Prediction of the Indian Summer Monsoon with the CFSv2. Front. Environ. Sci. 2018, 5, 92. [Google Scholar] [CrossRef]
  7. Douville, H.; Conil, S.; Tyteca, S.; Voldoire, A. Soil moisture memory and West African monsoon predictability: Artefact or reality? Clim. Dyn. 2007, 28, 723–742. [Google Scholar] [CrossRef]
  8. Koster, R.D.; Mahanama, S.P.P.; Yamada, T.J.; Balsamo, G.; Berg, A.A.; Boisserie, M.; Dirmeyer, P.A.; Doblas-Reyes, F.J.; Drewitt, G.; Gordon, C.T.; et al. Contribution of land surface initialization to subseasonal forecast skill: First results from a multi-model experiment. Geophys. Res. Lett. 2010, 6, 1–6. [Google Scholar] [CrossRef]
  9. Mattos, J.G.Z. A análise do Acoplamento de Processos de Superfície Continental e Atmosfera e o Impacto da Assimilação de Dados no Modelo Global do CPTEC/INPE; Doutorado em Meteorologia, Instituto Nacional de Pesquisas Espaciais (INPE): São José dos Campos, Brazil, 2016.
  10. de Gonçalves, L.G.G.; Shuttleworth, W.J.; Burke, E.J.; Houser, P.; Toll, D.L.; Rodell, M.; Arsenault, K. Toward a South America Land Data Assimilation System: Aspects of land surface model spin-up using the Simplified Simple Biosphere. J. Geophys. Res. 2006, 111, 1–13. [Google Scholar] [CrossRef]
  11. Koster, R.D.; Dirmeyer, P.A.; Guo, Z.; Bonan, G.; Chan, E.; Cox, P.; Gordon, C.T.; Kanae, S.; Kowakczyk, E.; Lawrence, D.; et al. Regions of Strong Coupling Between Soil Moisture and Precipitation. Science 2004, 305, 1138–1140. [Google Scholar] [CrossRef] [PubMed]
  12. Liu, D.; Wang, G.; Mei, R.; Yu, Z.; Yu, M. Impact of initial soil moisture anomalies on climate mean and extremes over Asia. J. Geophys. Res. Atmos. 2014, 119, 529–545. [Google Scholar] [CrossRef]
  13. Guo, Z.; Dirmeyer, P.A.; Koster, R.D.; Bonan, G.; Chan, E.; Cox, P.; Gordon, C.T.; Kanae, S.; Kowalkczyk, E.; Lawrence, D.; et al. GLACE: The Global Land-Atmosphere Coupling Experiment. Part II: Analysis. J. Hydrometeor. 2006, 7, 611–625. [Google Scholar] [CrossRef]
  14. Zhou, J.; Lau, K.-M. Does a Monsoon Climate Exist over South America? J. Clim. 1998, 11, 1020–1040. [Google Scholar] [CrossRef]
  15. Gan, M.A.; Kouski, V.E.; Repelewski, C.F. The South America Monsoon Circulation and Its Relationship to Rainfall over West-Central Brazil. J. Clim. 2004, 17, 47–66. [Google Scholar] [CrossRef]
  16. Jones, C.; Carvalho, L.M.V. Active and Break Phases in the South American Monsoon System. J. Clim. 2002, 15, 905–914. [Google Scholar] [CrossRef]
  17. Moon, S.; Ha, K. Early Indian Summer Monsoon Onset Driven by Low Soil Moisture in the Iranian Desert. Geophys. Res. Lett. 2019, 46, 10568–10577. [Google Scholar] [CrossRef]
  18. Collini, E.A.; Berbery, E.; Barros, V.R.; Pyle, M.E. How Does Soil Moisture Influence the Early Stages of the South American Monsoon? J. Clim. AMS 2008, 21, 195–213. [Google Scholar] [CrossRef]
  19. Grimm, A.M.; Pal, J.S.; Giorgi, F. Connection between Spring Conditions and Peak Summer Monsoon Rainfall in South America: Role of Soil Moisture, Surface Temperature, and Topography in Eastern Brazil. J. Clim. 2007, 20, 5929–5945. [Google Scholar] [CrossRef]
  20. Koster, R.D.; Sud, Y.C.; Guo, Z.; Dirmeyer, P.A.; Bonan, G.; Oleson, K.W.; Chan, E.; Verseghy, D.; Cox, P.; Davies, H.; et al. GLACE: The Global Land–Atmosphere Coupling Experiment. Part I: Overview. J. Hydrometeor. 2006, 7, 590–610. [Google Scholar] [CrossRef]
  21. Baker, J.C.A.; de Souza, C.; Kubota, P.Y.; Buermann, W.; Coelho, C.A.S.; Andrews, M.B.; Gloor, M.; Garcia-Carreras, L.; Figueroa, S.N.; Spracklen, D.V. An Assessment of Land–Atmosphere Interactions over South America Using Satellites, Reanalysis, and Two Global Climate Models. J. Hydrometeor. 2021, 22, 905–922. [Google Scholar] [CrossRef]
  22. Cavalcanti, I.F.; Marengo, J.A.; Satyamurty, P.; Nobre, C.A.; Trosnikov, I.; Bonatti, J.P.; Manzi, A.O.; Tarasova, T.; Pezzi, L.P.; D’almeida, C.; et al. Global Climatological Features in a Simulation Using the CPTEC–COLA AGCM. J. Clim. 2002, 15, 2965–2988. [Google Scholar] [CrossRef]
  23. Figueroa, S.N.; Bonatti, J.P.; Kubota, P.Y.; Grell, G.A.; Morrison, H.; Barros, S.R.M.; Fernez, J.P.R.; Ramirez, E.; Siqueira, L.; Luzia, G.; et al. The Brazilian Global Atmospheric Model (BAM): Performance for Tropical Rainfall Forecasting and Sensitivity to Convective Scheme and Horizontal Resolution. Weather Forecast. 2016, 31, 1547–1572. [Google Scholar] [CrossRef]
  24. Guimarães, B.S.; Coelho, C.A.S.; Woolnough, S.J.; Kubota, P.Y.; Bastarz, P.Y.; Figueroa, S.N.; Bonatti, J.P.; de Souza, D.C. Configuration and hindcast quality assessment of a Brazilian global sub-seasonal prediction system. Q. J. R. Meteorol. Soc. 2020, 146, 1067–1084. [Google Scholar] [CrossRef]
  25. Coelho, C.A.S.; de Souza, D.C.; Kubota, P.Y.; Costa, S.M.S.; Menezes, L.; Guimarães, B.S.; Figueroa, S.N.; Bonatti, J.P.; Cavalcanti, I.F.A.; Sampaio, G.; et al. Evaluation of climate simulations produced with the Brazilian global atmospheric model version 1.2. Clim. Dyn. 2002, 56, 873–898. [Google Scholar] [CrossRef]
  26. Kubota, P.Y. Variabiliade de Energia Armazenada na Superfície e seu Impacto na Definição do Padrão de Precipitação na América do Sul; Doutorado em Meteorologia, Instituto Nacional de Pesquisas Espaciais (INPE): São José dos Campos, Brazil, 2012.
  27. Willmott, C.J.; Rowe, C.M.; Mintz, Y. Climatology of the terrestrial seasonal water cycle. J. Clim. 1985, 5, 589–606. [Google Scholar] [CrossRef]
  28. Hersbach, H.; Bell, B.; Berrisford, P.; Hirahara, S.; Horanyi, A.; Munoz-Sabater, J.; Nicolas, J.; Peubey, C.; Radu, R.; Schepers, D.; et al. The ERA5 global reanalysis. Q. J. R. Meteorol. Soc. 2020, 146, 1999–2049. [Google Scholar] [CrossRef]
  29. Dee, D.P.; Uppala, S.M.; Simmons, A.J.; Berrisford, P.; Poli, P.; Kobayashi, S.; Andrae, U.; Balmaseda, M.A.; Balsamo, G.; Bauer, D.P.; et al. The ERA-Interim reanalysis: Configuration and performance of the data assimilation system. Q. J. R. Meteorol. 2011, 137, 553–597. [Google Scholar] [CrossRef]
  30. Han, J.; Pan, H. Revision of Convection and Vertical Diffusion Schemes in the NCEP Global Forecast System. Weather Forecast. 2011, 26, 520–533. [Google Scholar] [CrossRef]
  31. Tiedke, M.A. Comprehensive Mass Flux Scheme for Cumulus Parameterization in Large–Scale Models. Mon. Weather Rev. 1989, 117, 1779–1800. [Google Scholar] [CrossRef]
  32. Morrison, H.; Curry, J.A.; Khvorostyanov, V.I. A New Double-Moment Microphysics Parameterization for Application in Cloud and Climate Models. Part I: Description. J. Atmos. Sci. 2005, 62, 1665–1677. [Google Scholar] [CrossRef]
  33. Chou, M.D.; Suarez, M.J.; Liang, X.; Yan, M.M. Technical Report Series on Global Modeling and Data Assimilation Vol. 19: A Thermal Infrared Radiation Parameterization for Atmospheric Studies; NASA: Washington, DC, USA, 2001.
  34. Chou, M.D.; Suarez, M.J. Technical Report Series on Global Modeling and Data Assimilation Vol. 15: A Solar Radiation Parameterization for Atmospheric Studies; NASA: Washington, DC, USA, 1999.
  35. Tarasova, T.A.; Fomin, B.A. Solar Radiation Absorption due to Water Vapor: Advanced Broadband Parameterizations. J. Appl. Meteorol. 2000, 39, 1947–1951. [Google Scholar] [CrossRef]
  36. Bretherton, C.S.; Park, S. A New Moist Turbulence Parameterization in the Community Atmosphere Model. J. Clim. 2009, 22, 3422–3448. [Google Scholar] [CrossRef]
  37. de Gonçalves, L.G.G.; Shuttleworth, W.J.; Vila, D.; Larroza, E.; Bottino, M.J.; Herdies, D.L.; Aravéquia, J.A.; de Mattos, J.G.Z.; Toll, D.L.; Rodell, M.; et al. The South American Land Data Assimilation System (SALDAS) 5-yr Retrospective Atmospheric Forcing Datasets. J. Hydrometeor. 2009, 10, 999–1010. [Google Scholar] [CrossRef]
  38. Kumar, S.V.; Peters-Lidard, C.D.; Tian, Y.; Houser, P.R.; Geiger, J.; Olden, S.; Lighty, L.; Eastman, J.L.; Doty, B.; Dirmeyer, P.; et al. Land information system: An interoperable framework for high resolution land surface modeling. Environ. Model. Softw. 2006, 21, 1402–1415. [Google Scholar] [CrossRef]
  39. Sheffield, J.; Goteti, G.; Wood, E.F. Development of a 50-Year High-Resolution Global Dataset of Meteorological Forcings for Land Surface Modeling. J. Clim. 2006, 19, 3088–3111. [Google Scholar] [CrossRef]
  40. Kleist, D.T.; Parrish, D.F.; Derber, J.C.; Treadon, R.; Wu, W.-S.; Lord, S. Introduction of the GSI into the NCEP Global Data Assimilation system. Weather Forecast. 2009, 24, 1691–1705. [Google Scholar] [CrossRef]
  41. Huffman, G.J.; Bolvin, D.T.; Braithwaite, D.; Hsu, K.; Joyce, R.; Kidd, C.; Nelkin, E.J.; Sorooshian, S.; Tan, J.; Xie, P. NASA Global Precipitation Measurement (GPM) Integrated Multi-satellitE Retrievals for GPM (IMERG); NASA: Washington, DC, USA, 2019.
  42. Loeb, N.G.; Doelling, D.R.; Wang, H.; Su, W.; Nguyen, C.; Corbett, J.G.; Liang, L.; Mitrescu, C.; Rose, F.G.; Kato, S. Clouds and the Earth’s Radiant Energy System (CERES) Energy Balanced and Filled (EBAF) Top-of-atmosphere (toa) Edition-4.0 Data Product. J. Clim. 2018, 31, 895–918. [Google Scholar] [CrossRef]
  43. Rodell, M.; Houser, P.R.; Jambor, U.; Gottschalck, J.; Mitchell, K.; Meng, C.-J.; Arsenault, K.; Cosgrove, B.; Radakovich, J.; Bosolivich, M.; et al. The Global Land Data Assimilation System. Bull. Am. Meteorol. Soc. 2004, 85, 381–394. [Google Scholar] [CrossRef]
  44. Adler, R.F.; Huffman, G.J.; Chang, A.; Ferraro, R.; Xie, P.; Janowiak, J.; Rudolf, B.; Schneider, U.; Curtis, S.; Bolvin, D.; et al. The Version2 Global Precipitation Climatology Project (GPCP) Monthly Precipitation Analysis (1979-Present); NASA: Washington, DC, USA, 2003.
  45. Balsamo, G.; Albergel, C.; Beljaars, A.; Boussetta, S.; Brun, E.; Cloke, H.; Dee, D.; Dutra, E.; Sabater, J.M.; Pappenberger, F.; et al. ERA-Interim/Land: A global land surface reanalysis data set. Hydrol. Earth Syst. Sci. 2015, 19, 389–407. [Google Scholar] [CrossRef]
  46. Dirmeyer, P.A. The terrestrial segment of soil moisture–climate coupling. Geophys. Res. Lett. 2011, 38, 16. [Google Scholar] [CrossRef]
  47. Seneviratne, S.I.; Luthi, D.; Litschi, M.; Schar, C. Land-atmosphere coupling and climate change in Europe. Nature 2006, 443, 205–209. [Google Scholar] [CrossRef]
  48. Seneviratne, S.I.; Corti, T.; Davin, E.L.; Hirschi, M.; Jaeger, E.B.; Lehner, I.; Orlowsky, B.; Teuling, A.J. Investigating soil moisture-climate interactions in a changing climate: A review. Earth-Sci. Rev. 2010, 99, 125–161. [Google Scholar] [CrossRef]
  49. Zeng, X.; Barlage, M.; Castro, C.; Fling, K. Comparison of Land–Precipitation Coupling Strength Using Observations and Models. J. Hydrometeor. 2010, 11, 979–994. [Google Scholar] [CrossRef]
  50. Betts, A.K. Understanding hydrometeorology using global models. Bull. Am. Meteorol. Soc. 2004, 85, 1673–1688. [Google Scholar] [CrossRef]
  51. Dirmeyer, P.A.; Wang, Z.; Mbuh, M.J.; Norton, H.E. Intensified land surface control on boundary layer growth in a changing climate. Geophys. Res. Lett. 2014, 41, 1290–1294. [Google Scholar] [CrossRef]
  52. Figueroa, S.N.; Nobre, C.A. Precipitation distribution over central and western tropical South America. Climanálise 1990, 5, 36–45. [Google Scholar]
  53. Herdies, D.L.; da Silva, A.; Silva Dias, M.A.; Nieto Ferreira, R. Moisture budget of the bimodal pattern of the summer circulation over South America. J. Geophys. Res. Atmos. 2002, 107, LBA 42-1–LBA 42-10. [Google Scholar] [CrossRef]
  54. Reboita, M.S.; Gan, M.A.; da Rocha, R.P.; Ambrizzi, T. Regimes de precipitação na América do Sul: Uma revisão bibliográfica. Rev. Bras. Meteorol. 2010, 25, 185–204. [Google Scholar] [CrossRef]
  55. Pinault, J.-L. Regions Subject to Rainfall Oscillation in the 5–10 Year Band. Climate 2018, 6, 2. [Google Scholar] [CrossRef]
  56. Coelho, C.A.S.; de Souza, D.C.; Kubota, P.Y.; Cavalcanti, I.F.A.; Baker, J.C.A.; Figueroa, S.N.; Firpo, M.A.F.; Guimarães, B.S.; Costa, S.M.S.; Gonçalves, L.J.M.; et al. Assessing the representation of south american monsoon features in brazil and u.k. climate model simulations. Clim. Resil. Sustain. 2022, 1, 1. [Google Scholar] [CrossRef]
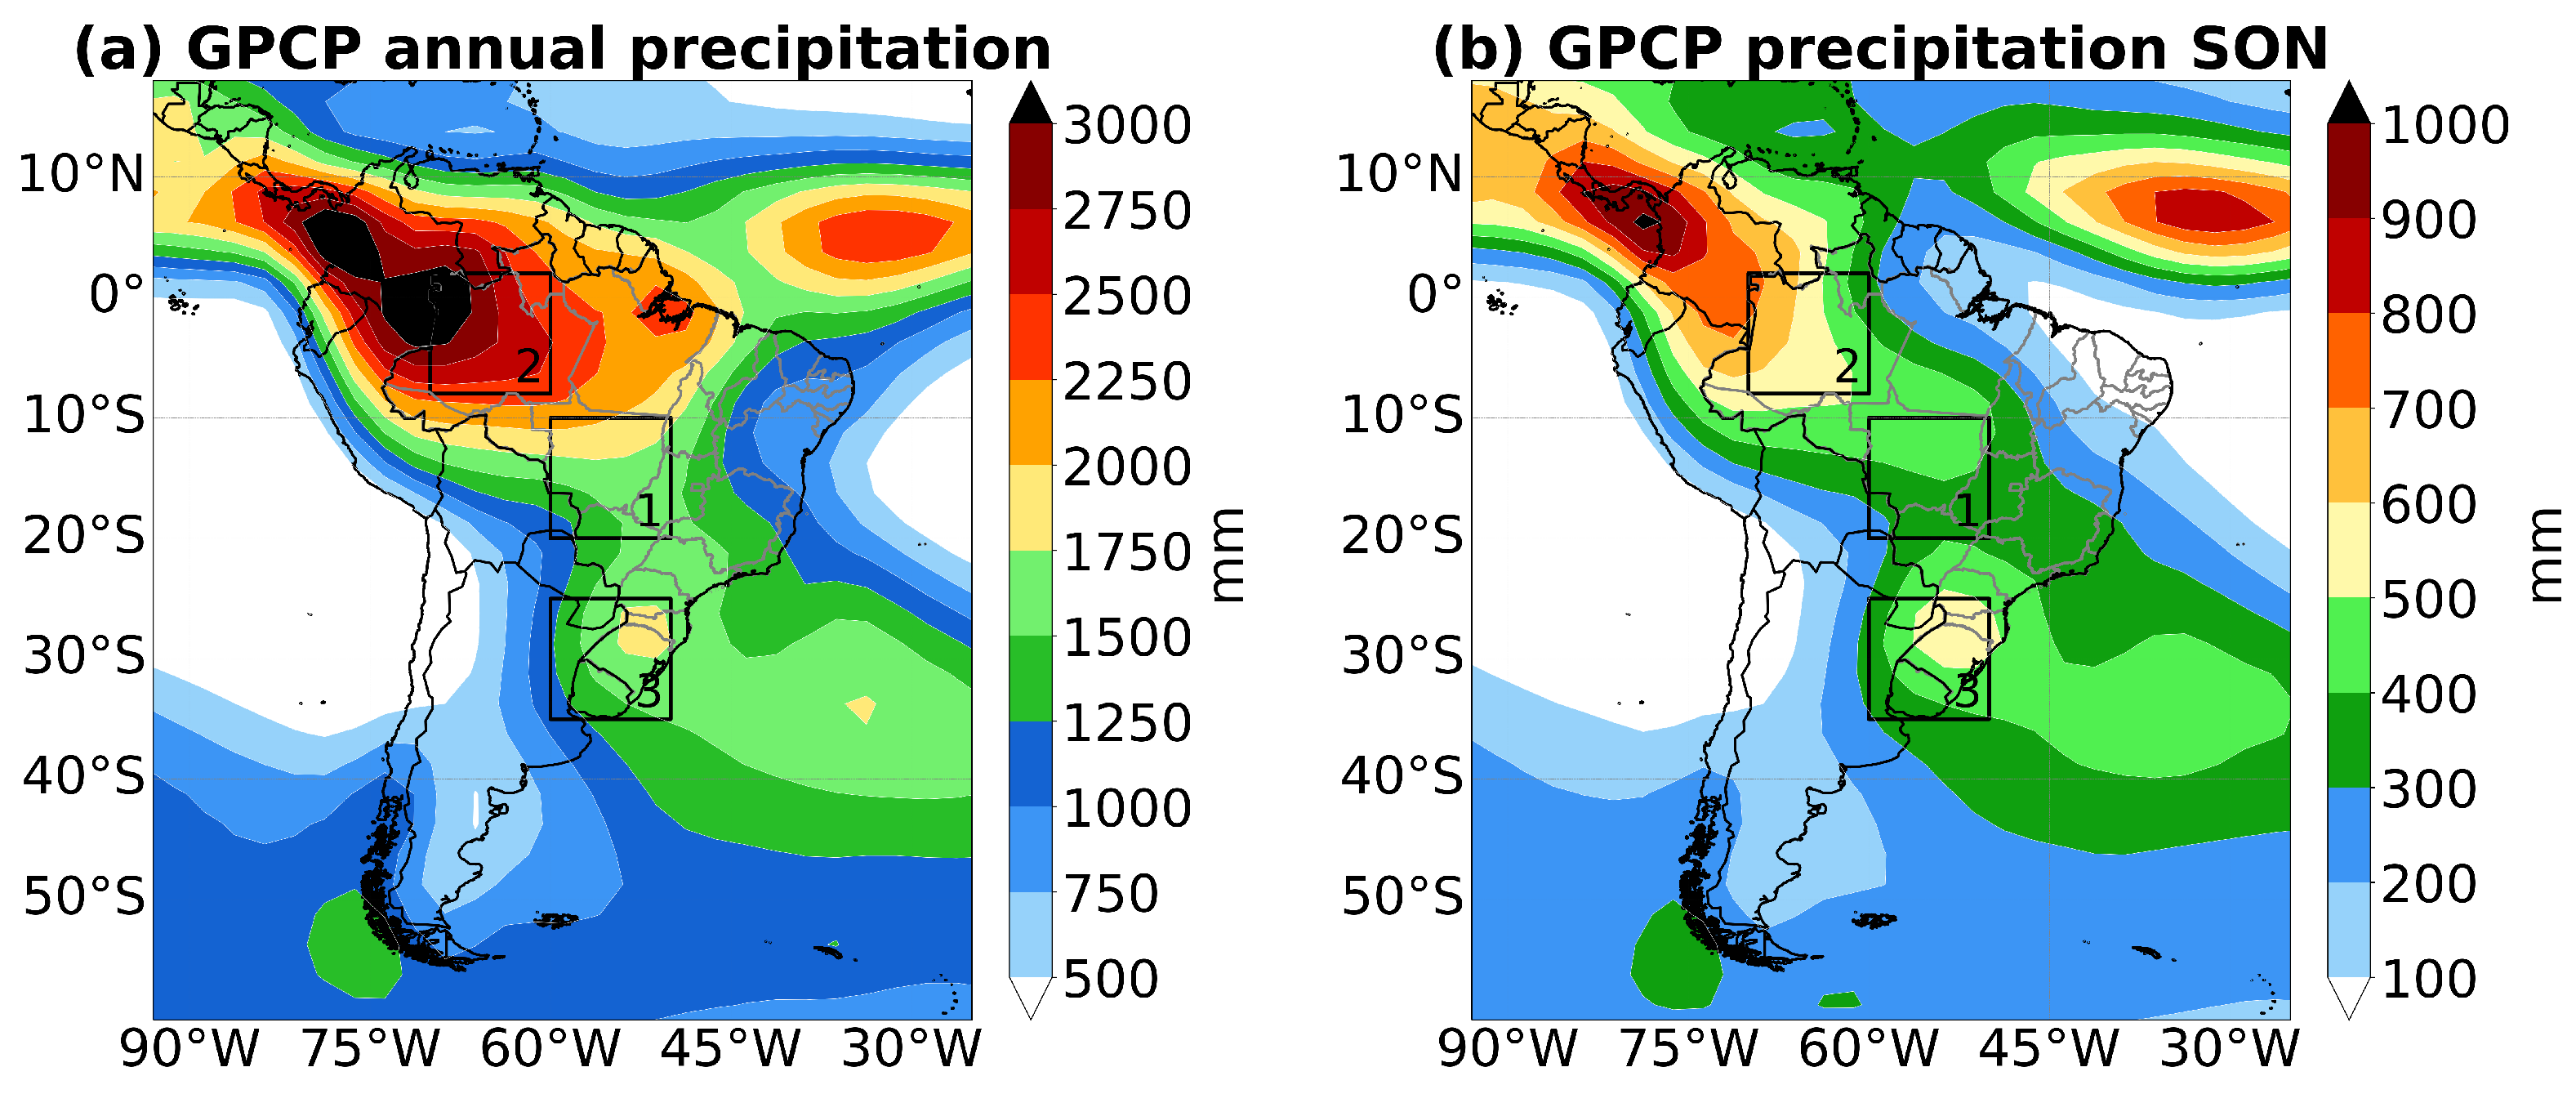
Figure 1. Mean annual precipitation (2000–2010) (a) and mean seasonal precipitation for SON (2000–2010) (b) over South America. The boxes represent the areas selected for this study: (1) Central Brazil, (2) Amazon Basin, and (3) La Plata Basin.
Atmosphere 14 00804 g001
Figure 2. Metrics for precipitation over South America for the austral spring. The maps show the mean accumulated precipitation (a,b), the bias (c,d), the RMSE (e,f), and the correlation of anomalies (g,h), using the GPCP as a reference, for the BAM CTRL (first column) and BAM SM (second column) experiments.
Atmosphere 14 00804 g002aAtmosphere 14 00804 g002b
Figure 3. Taylor diagram for the mean cumulative precipitation for the austral spring. The diagrams show the statistical metrics (correlation coefficient, RMSE (green line), and standard deviation) over the three areas highlighted in Figure 1. The star indicates perfect agreement and the circles the BAM CTRL (blue) and BAM SM (red) experiments.
Atmosphere 14 00804 g003
Figure 4. Circulation at low level over South America for the austral spring. The maps show the mean circulation at 850 hPa of the ERA5–Land (a), BAM CTRL (b), and BAM SM (c) experiments and the biases, using the ERA5–Land as a reference, from the BAM CTRL (d) and BAM SM (e) and between the BAM SM and BAM CTRL (f).
Atmosphere 14 00804 g004
Figure 5. Circulation at high level over South America for the austral spring. The maps show the mean circulation at 200 hPa of the ERA5 (a), BAM CTRL (b), and BAM SM (c) experiments and the biases, using the ERA5 as a reference, from the BAM CTRL (d) and BAM SM (e) and between the BAM SM and BAM CTRL (f).
Atmosphere 14 00804 g005
Figure 6. Meridional wind component at high level for the austral spring. The maps show the v–component of mean wind at 200 hPa of the ERA5 (a), BAM CTRL (b), and BAM SM (c) experiments and the bias between the BAM SM and BAM CTRL (d).
Atmosphere 14 00804 g006
Figure 7. Moisture distribution at low level over South America for the austral spring. The maps show the mean circulation and specific humidity at 850 hPa of the ERA5 (a), BAM CTRL (b), and BAM SM (c) experiments and the biases, using the ERA5 as a reference, from the BAM CTRL (d) and BAM SM (e) and between the BAM SM and BAM CTRL (f).
Atmosphere 14 00804 g007
Figure 8. Specific humidity profile for the austral spring over three areas in South America. The panel shows the bias between the BAM CTRL and ERA5 (first column), BAM SM and ERA5 (second column), and BAM SM and BAM CTRL experiments (third column) for cuts in the central latitude of the Amazon Basin—3 S (ac), Central Brazil—15 S (df), and La Plata Basin—30 S (gi).
Atmosphere 14 00804 g008
Figure 9. Soil moisture over South America for the austral spring. The maps show the soil moisture of the ERA5–Land (0–7 cm) (a), BAM CTRL (b), and BAM SM (c) experiments (0–10 cm) and the biases, using the ERA5–Land as a reference, from the BAM CTRL (d) and BAM SM (e) and between BAM SM and BAM CTRL (f).
Atmosphere 14 00804 g009
Figure 10. Temperature at 2 m over South America for the austral spring. The maps show the temperature at 2 m of the ERA5–Land (a), BAM CTRL (b), and BAM SM (c) experiments and the biases, using the ERA5–Land as a reference, from the BAM CTRL (d) and BAM SM (e) and between the BAM SM and BAM CTRL (f).
Atmosphere 14 00804 g010
Figure 11. Sensible heat flux over South America for the austral spring. The maps show the flux of the ERA5–Land (a), BAM CTRL (b), and BAM SM (c) experiments and the biases, using the ERA5–Land as a reference, from the BAM CTRL (d) and BAM SM (e) and between the BAM SM and BAM CTRL (f).
Atmosphere 14 00804 g011
Figure 12. Latent heat flux over South America for the austral spring. The maps show the flux of the ERA5–Land (a), BAM CTRL (b), and BAM SM (c) experiments and the biases, using the ERA5–Land as a reference, from the BAM CTRL (d) and BAM SM (e) and between the BAM SM and BAM CTRL (f).
Atmosphere 14 00804 g012
Figure 13. Bowen ratio over South America for the austral spring. The maps show the relation of the ERA5–Land (a), BAM CTRL (b), and BAM SM (c) experiments and the biases, using the ERA5–Land as a reference, from the BAM CTRL (d) and BAM SM (e) and between the BAM SM and BAM CTRL (f).
Atmosphere 14 00804 g013
Figure 14. Climate variables and land–atmosphere coupling for the austral spring over three areas in South America. The boxes show the spatial variation in the seasonal mean for the metrics TCI (ac), T_ET (df) and ZG (gi) and the variables precipitation (P; (jl)), evapotranspiration (ET; (mo)), soil moisture (SM; (pr)), and surface temperature (T; su) from the ERA5–Land (green), BAM CTRL (blue), and BAM SM (red) experiments for the areas highlighted in Figure 1: Amazon Basin (first column), Central Brazil (second column), and La Plata Basin (third column). The boxes show quartiles and extremes. In some figures, the y-axis scales differ, and for T_ET (second line), they have the reverse scale.
Atmosphere 14 00804 g014
Figure 15. Terrestrial Coupling Index (TCI) over South America for the austral spring. The maps show the relationship between soil moisture and evapotranspiration, calculated based on the ERA5–Land (a), BAM CTRL (b), and BAM SM (c) experiments. The boxes delimit the areas highlighted in Figure 1. Red shading indicates land–atmosphere coupling, and blue shading indicates atmosphere–land coupling.
Atmosphere 14 00804 g015
Figure 16. Temperature–Evapotranspiration metric (T_ET) over South America for the austral spring. The maps show the relationship between soil moisture and evapotranspiration over South America, calculated based on the ERA5–Land (a), BAM CTRL (b), and BAM SM (c) experiments. The boxes delimit the areas highlighted in Figure 1. Red shading indicates land–atmosphere coupling, and blue shading indicates atmosphere–land coupling.
Atmosphere 14 00804 g016
Figure 17. Zeng’s Gamma metric (ZG) over South America for the austral spring. The maps show the relationship between precipitation and evapotranspiration, calculated based on the ERA5–Land (a), BAM CTRL (b), and BAM SM (c) experiments. The boxes delimit the areas highlighted in Figure 1. Red shading indicates land–atmosphere coupling, and blue shading indicates atmosphere–land coupling.
Atmosphere 14 00804 g017
Figure 18. Betts’ relationship for the austral spring over three areas in South America. The maps show the relationship between anomalies of surface soil moisture (SM) and evapotranspiration (ET) averaged from the ERA5–Land (ac), BAM CTRL (df), and BAM SM (gi) experiments for the areas highlighted in Figure 1: Amazon Basin (first column), Central Brazil (second column), and La Plata Basin (third column). Pearson’s correlation coefficients (r), the probability (p) of observing a difference as large or greater than that observed under the null hypothesis, and the normalized distributions of each variable are shown in each panel. The panels do not have the same scales.
Atmosphere 14 00804 g018
Figure 19. Two–legged metric for the surface–to–atmosphere moisture transfer pathway, over South America, for the austral spring. The maps show the relationship between the surface variable and surface flux variable (ac), flux variable and an atmospheric variable (df), and the full pathway (gi), calculated based on the ERA5–Land (first column), BAM CTRL (second column), and BAM SM (third column) experiments. The boxes delimit the areas highlighted in Figure 1.
Atmosphere 14 00804 g019
Table 1. BAM configuration.
Spatial resolutionT0126L042
Initial conditionERA–Interim [29]
SST and ozoneERA–Interim [29]
DynamicsEulerian (spectral) [23]
Deep convectionSimplified Arakawa and Schubert [30]
Shallow convectionTiedke [31]
MicrophysicsMorrison [32]
Longwave radiationCLIRAD–LW [33]
Shortwave radiationCLIRAD–SW [34] modified by
Tarasova et al. [35]
Planetary boundary layerMoist diffusion scheme [36]
Land surfaceIBIS–CPTEC [26]
Soil moistureWillmott’s climatology [27]
Table 2. Experiment design.
SSTPersistent SST anomaly
Ensemble15 members
InitializationJuly
Lead-timeSON
Period11 years
Disclaimer/Publisher’s Note: The statements, opinions and data contained in all publications are solely those of the individual author(s) and contributor(s) and not of MDPI and/or the editor(s). MDPI and/or the editor(s) disclaim responsibility for any injury to people or property resulting from any ideas, methods, instructions or products referred to in the content.