Article

Influences of the Mid-Level Vortex on the Formation of Tropical Cyclone Toraji (2013)

1
Department of Atmospheric Sciences, National Taiwan University, Taipei 10617, Taiwan
2
Research and Development Center, Central Weather Bureau, Taipei 100006, Taiwan
3
The Office of Sustainability, National Taiwan University, Taipei 10617, Taiwan
4
International Master/Doctoral Degree Program in Climate Change and Sustainable Development, National Taiwan University, Taipei 10617, Taiwan
5
Weather Forecast Center, Central Weather Bureau, Taipei 100006, Taiwan
6
National Center for Atmospheric Research, Boulder, CO 80307, USA
7
Center for Weather Climate and Disaster Research, National Taiwan University, Taipei 10617, Taiwan
*
Authors to whom correspondence should be addressed.
Atmosphere 2023, 14(4), 709; https://doi.org/10.3390/atmos14040709
Submission received: 23 February 2023 / Revised: 6 April 2023 / Accepted: 10 April 2023 / Published: 12 April 2023
(This article belongs to the Special Issue Typhoon/Hurricane Dynamics and Prediction)

Abstract

:
This study analyzes the influences of the mid-level vortex on the formation of Tropical Cyclone Toraji (2013). A rare case of a tropical cyclone that formed near Taiwan involved a mid-level vortex that was a remnant of Tropical Cyclone Kong-Rey (2013). The piecewise potential vorticity inversion method is applied to examine the contribution of the mid-level vortex to the low-level wind field under quasi-balanced conditions. Numerical sensitivity experiments are conducted to quantify the importance of the mid-level vortex on Toraji formation, in which the mid-level vortex is removed with different removing factors (percentages) from the initial field. The results indicate that mid-level positive potential vorticity anomalies significantly contribute to the low-level positive vorticity before Toraji formation. Furthermore, when the removing factors increase in the sensitivity experiments, either the intensity of the simulated low-level vortex or the development trend of pre-Toraji decreases. However, there is no significant relationship between the convection’s magnitude and the intensity of the mid-level vortex. The main difference comes from the mid-level vortex’s intensity, which would result in a greater high-level warm core structure and cause stronger vertical mass flux. In summary, the mid-level vortex plays a critical role in the formation of Toraji. It provides a favorable environment for forming the pre-Toraji vortex by maintaining a high-level warm-core structure, leading to the formation of Toraji.

1. Introduction

Tropical cyclone (TC) formation involves mesoscale processes that have been discussed for a long time. A TC originates from an ambient tropical cloud cluster [1,2,3,4,5,6] under specific environments [3,7,8,9,10,11,12]. Different background environments and various basins may support different favorable conditions for TC formation [13,14,15,16]. Gray (1998) [4] and Zehr (1992) [17] indicated that the processes of TC formation could be generally categorized into certain stages. Briefly, TC formation might be determined by a synoptic-scale environmental forcing mechanism and then a self-sustaining convergence process in a mesoscale, highly concentrated area [18,19,20].
Thus, in mesoscale, it is widely accepted that TC formation is preceded by a long-lasting, moistening mid-level vortex and vigorous convective bursts [9,20,21,22,23,24]. However, there has been a long debate regarding the route to TC formation in the mesoscale internal dynamics. One suggestion is that the mesoscale convective vortices intensify low-level vorticity via certain processes, including the merging of mesoscale convective vortices to enhance vorticity downward penetration [22,25] and the evaporative cooling effect to advect the mid-level vortex downward [26]. This suggestion is called the “top-down” theory.
On the other hand, the “bottom-up” theory is characterized by convection processes producing diabatic heating, leading to the redistribution of potential vorticities to intensify the system [18,19]. Their observation and simulation results also indicate that rotating vortical hot towers might be generated from a strong updraft in the convective region tilting the horizontal vorticity tube caused by significant changes in vertical wind shear in the convection area. Thus, vortical hot towers would lead to positive potential vorticity (PV) anomalies in the low troposphere and create a favorable environment for coupling mesoscale convective vortices and low-level pressure systems.
Recent studies generally emphasized the importance of the “bottom-up” process and suggested that the mid-level vortex would play an assistant role in TC formation. Houze et al. (2009) [20] stated that although low troposphere vorticity is mainly created and accumulated by vortical hot towers, mesoscale convective vortices, presumably developed in the stratiform region by vortical hot towers [27], would last longer than other convective systems, eventually symmetrizing the system (Montgomery et al., 2006). Wang et al. (2010a, b) [28,29] and Wang (2012) [30] investigated the cyclogenesis of hurricanes by simulation and Pre-Depression Investigation of Cloud Systems in the Tropics (PREDICT) field data. They indicated that some protected areas embedded in the easterly wave, the so-called “wave pouch”, block dry air intrusion and shear deformation, as well as provide favorable conditions for TC formation, which supports the notion that bottom-up development in the wave pouch is a more efficient and direct route to cyclogenesis. Nonetheless, another result of idealized simulations, provided by Davis (2015) [24], indicated that the mid-level vortex would accelerate the genesis process since increased downdraft leads to a shear-cold pool, promoting the organization of lower-tropospheric updrafts.
However, unlike most TC cases in the western North Pacific, which evolve in several well-identified synoptic patterns before their formation [3,7,10,31,32,33], the environment of Toraji formation (2013) cannot be classified into one of the common synoptic patterns from previous studies [34]. TC Toraji is a rare case. Its formation process started in the northern Taiwan Strait, which is very close to the coastlines of northern Taiwan and southeastern China. It was difficult to accurately capture the formation process in advance in the operational models, leading to a large forecast error of rainfall in southwestern and northeastern Taiwan. Before Toraji formation, a significant mid-level vortex that was likely a part of the former TC Kong-Rey (2013) stayed in the same area where the incipient vortex of Toraji formed [35,36]. This mid-level vortex may impact the formation process of Toraji and increase the forecast challenge.
Furthermore, for landfalling TCs, because the characteristics of TC formation (e.g., location, environment, and subsequent track and size) are related to the disaster severity and impacting area [37,38,39,40], their forecasts are important for disaster prevention [41,42]. Once a disturbance develops into a TC near the coastline in a short time, it is difficult to plan an immediate policy of disaster prevention and management, leading to numerous life and economic losses [43,44,45]. Thus, it is important to investigate a special case that formed near the terrain. In summary, to understand the physical process of TC formation interacting with a mid-level vortex and explore the model forecast capacity of TC formation near a coastline, the Toraji formation process deserves a detailed study.
The main objectives of this study are to answer what role the mid-level vortex plays in the Toraji formation, including: (1) simulating the formation process of Toraji, (2) analyzing the impacts of removing the mid-level vortex via sensitivity experiments, and (3) diagnosing the physical processes during the Toraji formation. In this paper, data and diagnosis methods, i.e., piecewise potential vorticity inversion (PPVI), are described in Section 2. Analyses of observation data, the analysis result of PPVI, and the control simulation are demonstrated in Section 3. Simulation results of sensitivity experiments are given in Section 4. The discussion and conclusions are presented in Section 5.

2. Data and Methodology

2.1. Data

Observation data used in this study include Central Weather Bureau (CWB) radar reflectivity and dual-Doppler data. In this study, radar reflectivity data are taken from the CWB radar reflectivity mosaic, indicating the maximum reflectivity of the vertical column. Located at Kenting, Hualien, Wufenshan, and Qigu, the available coverage of the four CWB radar stations includes Taiwan Island, Taiwan Strait, Bashi Channel, and the northern and eastern areas offshore of Taiwan. The reflectivity data are distributed on 0.0125° grids at 10-min intervals. The dual-Doppler wind fields are also derived using the method by Chang et al. (2009) [46], combining the four CWB radar stations mentioned above and two radar stations from the Republic of China Air Force (ROCAF) located at Makung and Qingquankong. The dual-Doppler wind field data are also distributed on 0.0125° grids at 10-min intervals, with ten layers in the vertical direction (1-, 2-, …, 10-km layers, respectively).
TC’s track data are taken from the Japan Meteorological Agency (JMA) best-track data and the CWB track data. Furthermore, the TC formation time is identified as 0000 UTC 31 August 2013 (denoted as 0 h) based on JMA best-track data. European Centre for Medium-Range Weather Forecasts (ECMWF) Reanalysis—Interim data (ERA-Interim) are distributed on 0.25° × 0.25° grids with 37 vertical layers at 6-h intervals at 00Z, 06Z, 12Z, 18Z for each day, used in this study to analyze the synoptic environment during Toraji formation. Moreover, the ERA-Interim data are applied to the PPVI method to diagnose the contribution of the mid-level vortex to the low-level momentum field and used as the initial field data of the simulations.

2.2. Piecewise Potential Vorticity Inversion (PPVI)

The Ertel PV inversion method is applied in this study to diagnose the contribution of the mid-level vortex to the low-level wind field. Davis and Emanuel (1991) [47], Davis (1992a, b) [48,49], and Wu and Emanuel (1995a, b) [50,51] proposed a method to quantitatively diagnose the development of extratropical cyclones and the steering of TCs by applying the inversion of Ertel PV, developed by using the nonlinear balanced condition [52]. According to their studies, the corresponding and 3-D balanced mass and momentum fields are produced under prescribed balanced conditions and appropriate boundary conditions for a given distribution of PV.
The definition of Ertel PV is
q = 1 ρ η · θ
where q represents PV, η is the 3-D absolute vorticity vector, θ is potential temperature, and ρ is air density. The hydrostatic approximation is applied so that the potential temperature can be expressed for a π-coordinate system as
θ = Φ π  
where Φ represents geopotential height, π = C p p p 0 κ   (the Exner function), κ = R d C p , p is the given pressure, p 0 is the reference pressure (generally, 1000 hPa), C p is the heat capacity of dry air and R d is the ideal gas constant of dry air. The horizontal non-divergent wind V h can be expressed as
V h = k ^ × Ψ
where Ψ is the stream function. In Charney (1955) [52], the balanced equation and Equation (1) formulated in π- and spherical coordinates was derived as
2 Φ = · f Ψ + 2 a 4 cos 2 ϕ   Ψ λ , Ψ ϕ λ , ϕ
q = g κ π p   f + 2 Ψ 2 Φ π 2 1 a 2 cos 2 ϕ   2 Ψ λ π 2 Φ λ π 1 a 2 2 Ψ ϕ π 2 Φ ϕ π
where f is the Coriolis parameter, a is the radius of the Earth, λ is longitude, and Φ is latitude. In addition, the total wind in Equation (1) is replaced by the vertical derivative of the non-divergent wind, which is expressed as the stream function. As a result, the system composed by Equations (4) and (5) is a closed elliptic partial differential system that can be solved for the two unknowns Φ and Ψ , given the distribution of q and other boundary conditions. The lateral boundary conditions of Φ are prescribed by analyzed geopotential height and integrated analyzed horizontal wind to obtain the lateral boundary condition of Ψ with the assumption that it is non-divergent at the lateral boundary of the domain. Moreover, the upper and lower boundary conditions for both Φ and Ψ are the hydrostatic condition Φ π = f 0 Ψ π = θ (Neumann conditions). After non-dimensionalizing relations (1) and (2), the equations become elliptic for two unknowns under the conditions that the static stability and absolute vorticity are positive, resulting in a two-dimensional Poisson equation [47]. The equations can be solved iteratively by using the successive over-relaxation method. In this study, the overrelaxation parameters for geopotential height and stream function are 1.60 and 1.65, respectively, and the under relaxation is set to 0.35. The dimensional convergence threshold is 0.2 m. Furthermore, the scale factors for potential temperature and PV are general ones.
According to Davis (1992a, b) [48,49], Wu and Emanuel (1995a, b) [50,51], Shapiro (1996) [53], and Wu et al. (2004) [54], when the flow field is appropriately divided into mean and perturbation components, the balanced fields associated with each PV perturbation can be obtained. This method is called piecewise PV inversion. In this study, to diagnose the balanced wind attributed to each PV perturbation on different levels, the PV perturbation is divided vertically. However, there are several methods for nonlinear piecewise inversion. The full linear method proposed in Davis and Emanuel (1991) [47] is applied, which keeps the nonlinear term hidden in the coefficient of the linear operator after linearization. The summation of the resolved balanced height and stream function associated with each PV perturbation is equal to the total fields [50]. In this study, the PV perturbation is partitioned into four layers to demonstrate the positive vorticity vertical profile features. These four layers are the upper atmosphere and upper boundary (UA, 450 to 100 hPa), mid-atmosphere (MA, 700 to 500 hPa), lower atmosphere (LA, 900 to 750 hPa), and lower boundary (LB, 1000 to 950 hPa).
Although the PV inversion still works with a high Rossby number [55], the divergence component of the momentum field in higher resolution data would lead to a non-convergent solution for the PPVI. Moreover, some mesoscale or convective processes during Toraji formation should be considered. After examinations, the 0.5° × 0.5° ECMWF ERA-Interim data are selected as the finest resolution data with better convergent solutions.
Furthermore, homogeneous lateral boundary conditions are used to solve the piecewise PV inversion since the PV field has been divided into individual anomalies. Functions Ψ and Φ are both set to zero on the horizontal boundaries in this study. Moreover, to calculate more efficiently, the horizontal domain of PPVI extends from 110° E to 130° E, and 15° N to 35° N (41 × 41 grid cells), centered at northern Taiwan (120° E, 25° N), which is much larger than a tropical cyclone scale. The PV time-averaged mean-field was calculated from 15 August to 15 September from 2010 to 2015. This mean-field is not substantially changed with changing periods (not shown).

2.3. Experiment Design

In this study, the influence of the mid-level vortex on Toraji formation is addressed via simulations. A control simulation of Toraji formation (CTRL) is conducted using version 3.5.1 of the Advanced Research Version (ARW) of the Weather Research and Forecasting Model (WRF; Ref. [56]). The ERA-Interim data is used in CTRL as the initial condition and lateral boundary condition and initialized at 0600 UTC 29 August 2013, 42 h before Toraji formation. The total integration time for all simulations is 78 h, corresponding to 1200 UTC 1 September 2013 (+36 h).
The model settings are designed with three 2-way nested domains with 45, 15, and 5 km horizontal resolutions. As shown in Figure 1, centered at northern Taiwan, 120° E and 25° N, the first domain covers 100.48° E to 139.52° E and 6.30° N to 41.25° N (97 × 97 grid cells). The second domain extends from 106.09° E to 133.49° E and 11.84° N to 36.56° N (202 × 202 grid cells), and the third domain covers 111.39° E to 127.79° E and 16.97° N to 31.84° N (361 × 361 grid cells), respectively. There are 30 levels in the vertical η-coordinate.
The physical parameterization settings of CTRL are the common model settings in TC formation simulation. They are the Kain–Fritsch cumulus scheme (Ref. [57]; except for the 3rd domain), Kessler microphysics scheme [58], Yonsei University boundary layer scheme [59], Rapid Radiative Transfer Model longwave radiation scheme [60], and Dudhia shortwave radiation scheme [61].
To discuss the influence of the mid-level vortex on Toraji formation, the quasi-balanced 3-D momentum and mass fields, inverted by the mid-level PV anomaly, which has the greatest contribution to the low-level positive vorticity before Toraji formation, are defined as the removed part in the initial conditions and lateral boundary conditions in sensitivity experiments (RMPVs). In the WRF Preprocessing System, the wind and mass fields on each level of the input 0.25° gridded EC-Interim data were subtracted by different factors of the balanced wind and mass fields associated with the mid-level PV anomaly. Gradually increasing removing factors, set from 0.1 (10% off) to 1.5 (150% off) with an increment of 0.1, are used to derive different initial fields in RMPVs (denoted as RMPV0.1, RMPV0.2, and RMPV1.5, respectively).
The meaning of the “removing factor” is the amount of removal of the balanced wind and mass field derived from the PPVI result of the mid-level (700 to 500 hPa) PV anomaly. For example, removing 100% quasi-balanced wind field indicates that the initial input data in WRF simulation are subtracted by the corresponding balanced wind and mass field associated with the mid-level PV anomaly. Since the balanced field is not equal to the original EC-Interim data, it is hard to determine a specific number to remove the “total mid-level vortex” in the simulation. Therefore, a series of experiments were designed with different ratios, even larger than 100%, of the removed part, defined as the mid-level PV anomaly’s balanced field. This can examine whether the changes in the experiments have a consistent trend under the condition of weaker mid-level circulation.

3. Observation and Analysis

3.1. The Synoptic and Mesoscale Environment during the Period of Toraji Formation

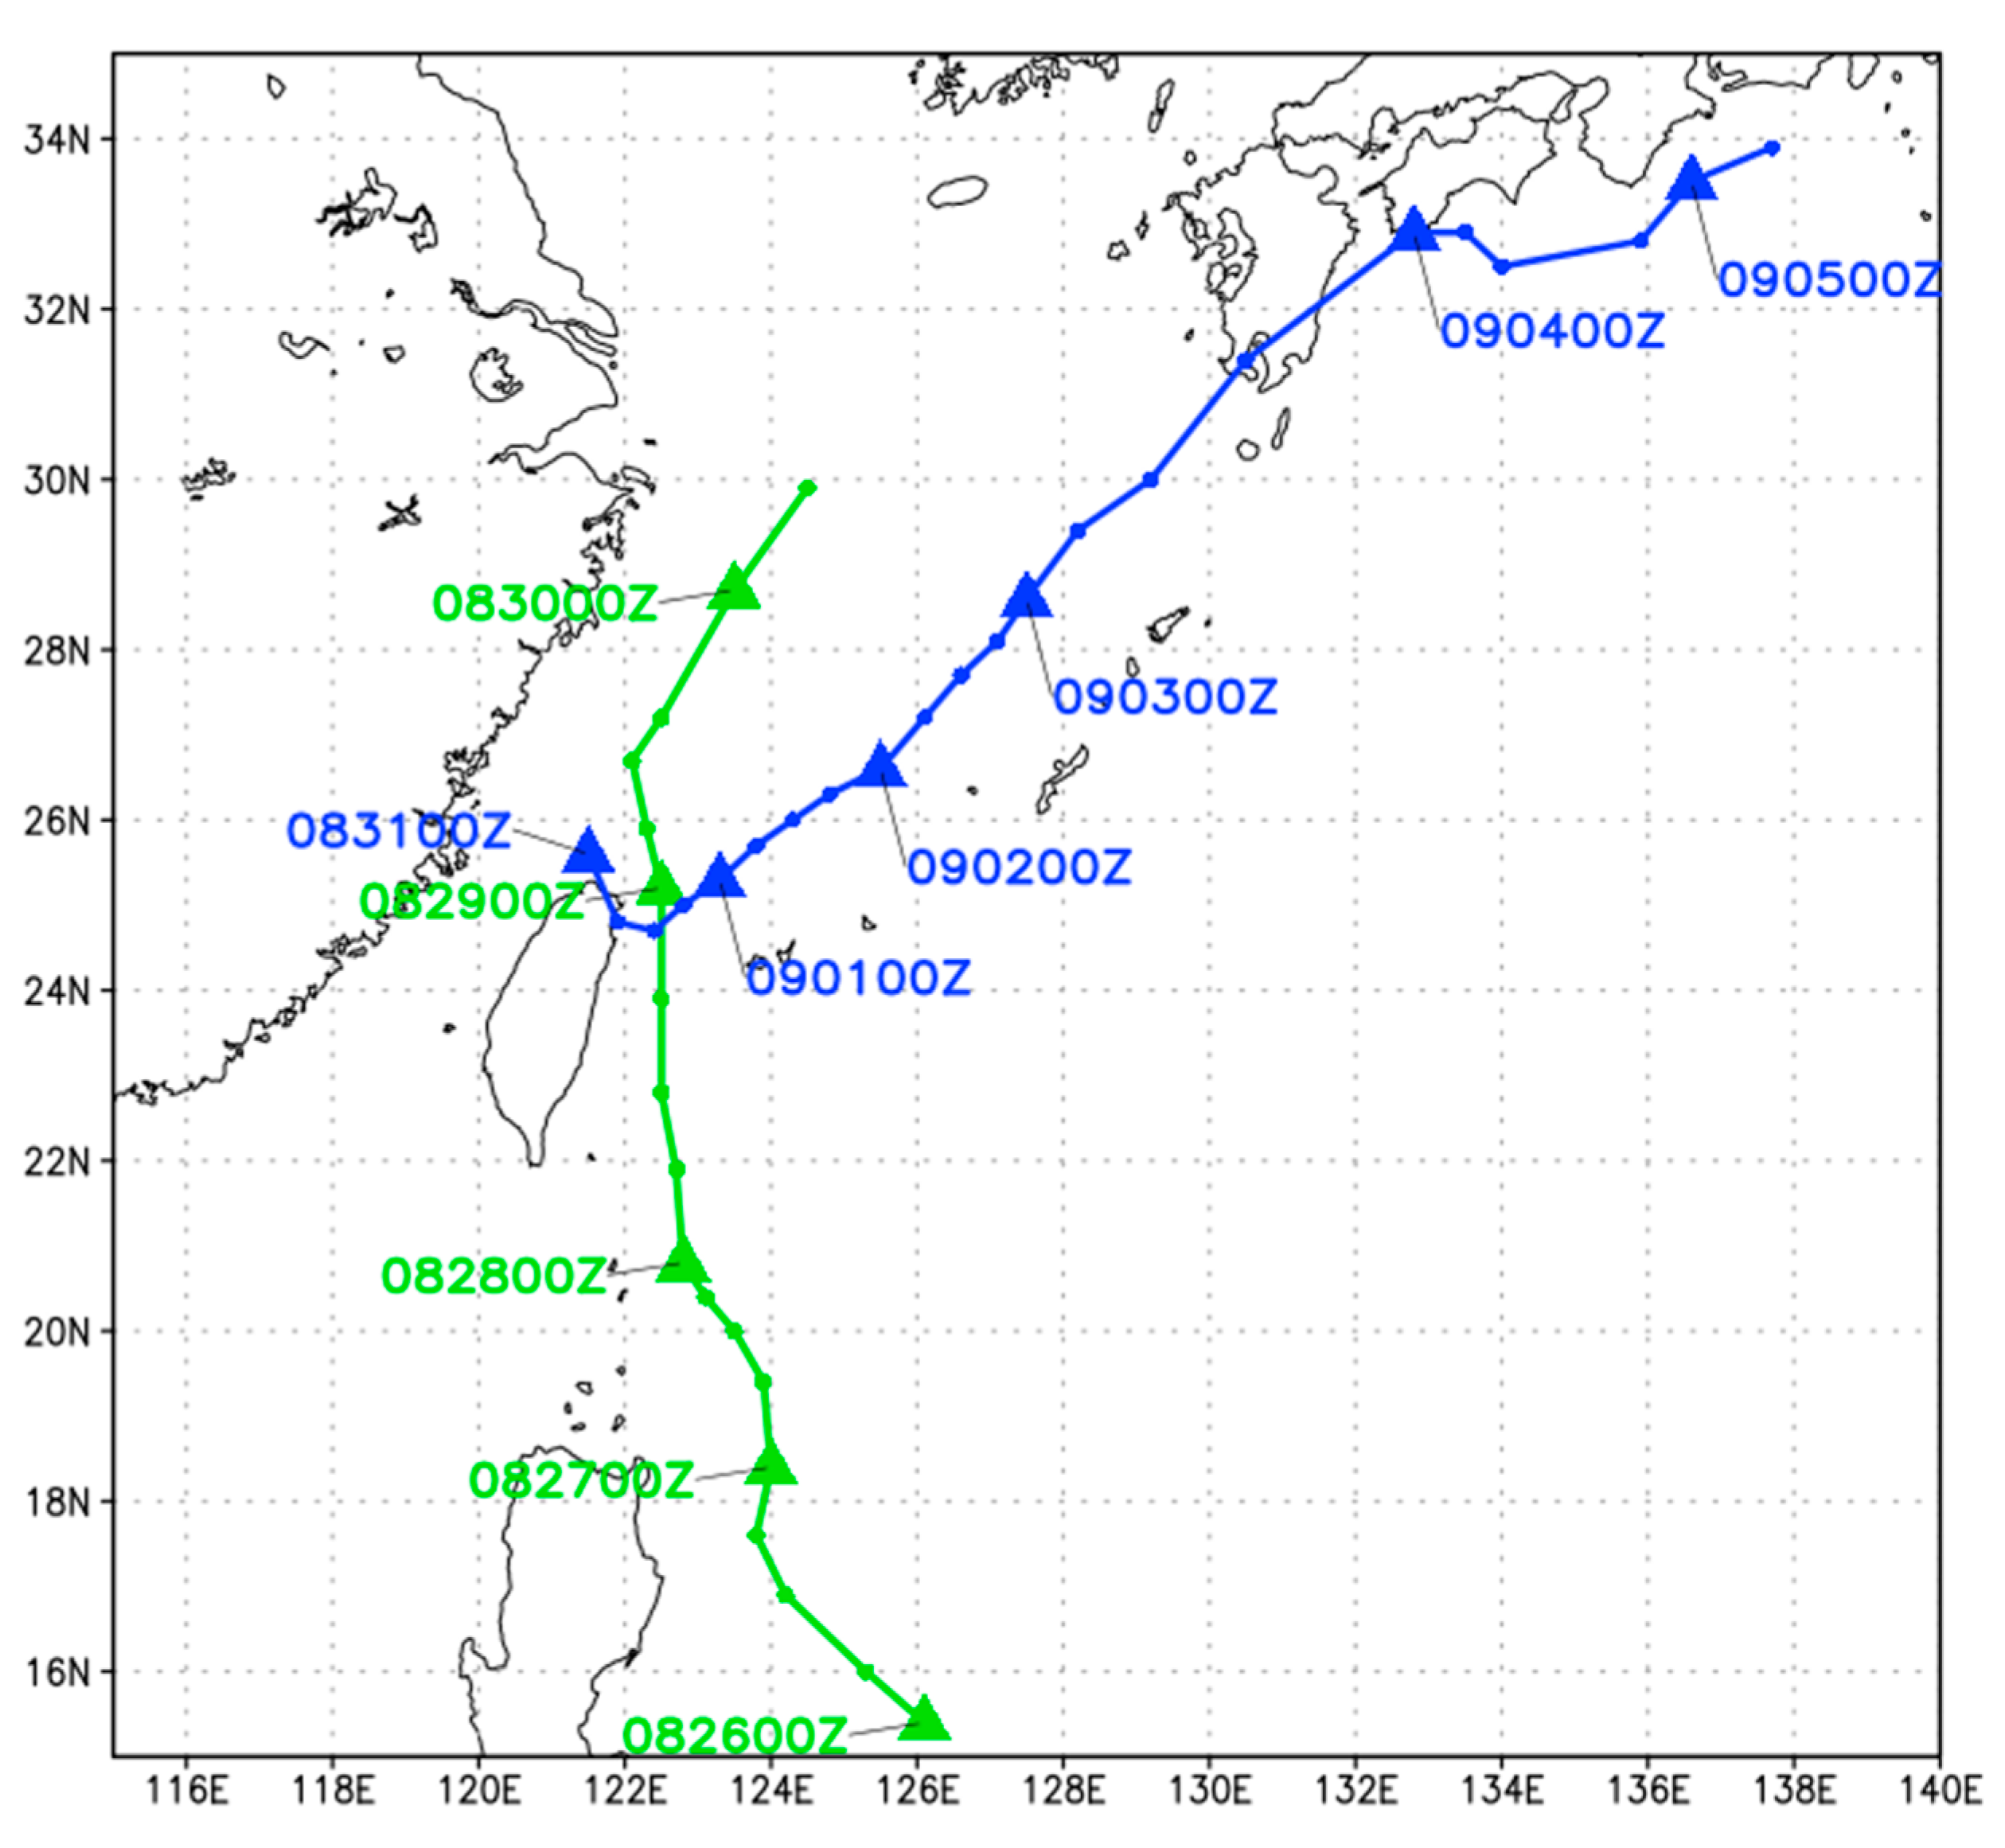
The evolution of Toraji can be traced back to a mid-level vortex, a remnant of Kong-Rey. According to the JMA best track (Figure 2), Kong-Rey formed in the Philippine Sea on 26 August and kept moving northward, east of Taiwan on 28 August 2013. Subsequently, it moved along the eastern offshore of Taiwan and turned northeastward to the East China Sea, followed by the formation of Toraji on 31 August near northern Taiwan. In the next few days, Toraji moved northeastward to Japan.
After Kong-Rey approached the east coast of Taiwan, steered by the western part of a preexisting subtropical high-pressure extending over the western Pacific to Central China, vertical wind shear became stronger in this area due to the breakdown of the subtropical high-pressure ridge. On 29 August, the west edge of the subtropical high extended to Taiwan, causing the 500 hPa vortex to keep moving to the Taiwan Strait (Figure 3e). However, the low-level circulation center was still on the northeast of the island (Figure 3a), implying a decoupling structure of Kong-Rey.
Similar distribution features of Kong-Rey’s mid- and low-level vortices are also clearly found from the CWB radar reflectivity and dual-Doppler wind field (Figure 4a,e). At 0000 UTC 29 August, the 3–6 km mean wind shows an appreciable cyclonic circulation over Taiwan (Figure 4e), and most of the convection systems were on the west side of the island. However, the low-level vortex was located on the northeast coast of Taiwan (Figure 4a).
Twenty-four hours later (August 30), the mid-level vorticity was significantly larger than the low-level in the northern Taiwan Strait to China (Figure 3b,f). At 0000 UTC 30 August, the 500-hPa cyclonic circulation had moved to the northern Taiwan Strait and the southeast coast of China (Figure 3f); however, the 925-hPa low-level vortex kept moving to the East China Sea (Figure 3b), merging into the mid-latitude trough. It is worth noting that although the horizontal shear line seemed to extend to the southeast land of China at the same time, increasing the low-level positive vorticity (Figure 3b), there was no clear cyclonic circulation on 925-hPa over the Taiwan Strait yet.
However, the 500-hPa cyclonic circulation kept deepening and moved southeastward in the following 24 h since the mid-latitude trough deepened and moved southeastward from higher latitude to about 28 to 30° N. This changed the steering wind from southeasterly to westerly (Figure 3e,g). Meanwhile, the subtropical high retreated slightly back to the western Pacific region (Figure 3g; i.e., the 5880-geopotential height contour). As a result, the mid-level vortex approached Taiwan’s northwest coast at 0000 UTC 31 August (Figure 3g). Interestingly, 925-hPa geopotential height and wind show a significant vortex formed in the northern Taiwan Strait with strongly increasing vorticity (Figure 3c). Similarly, Figure 4c shows a distinct 1–2 km vortex formed in the middle of Taiwan Strait with an eastward movement identified by the dual-Doppler wind. Moreover, the well-developing linear convection system, found in Figure 4c,g, might be triggered by the low-level shear line southwest of the low-level vortex, contributing critical diabatic heating to the system. Afterward, the 500-hPa circulation moved eastward and coupled with a low-level vortex at 925-hPa over the island at 1200 UTC 31 August (Figure 3d,h), corresponding to the Radar data shown in Figure 4d,h.

3.2. The Contribution of the Mid-Level Vortex

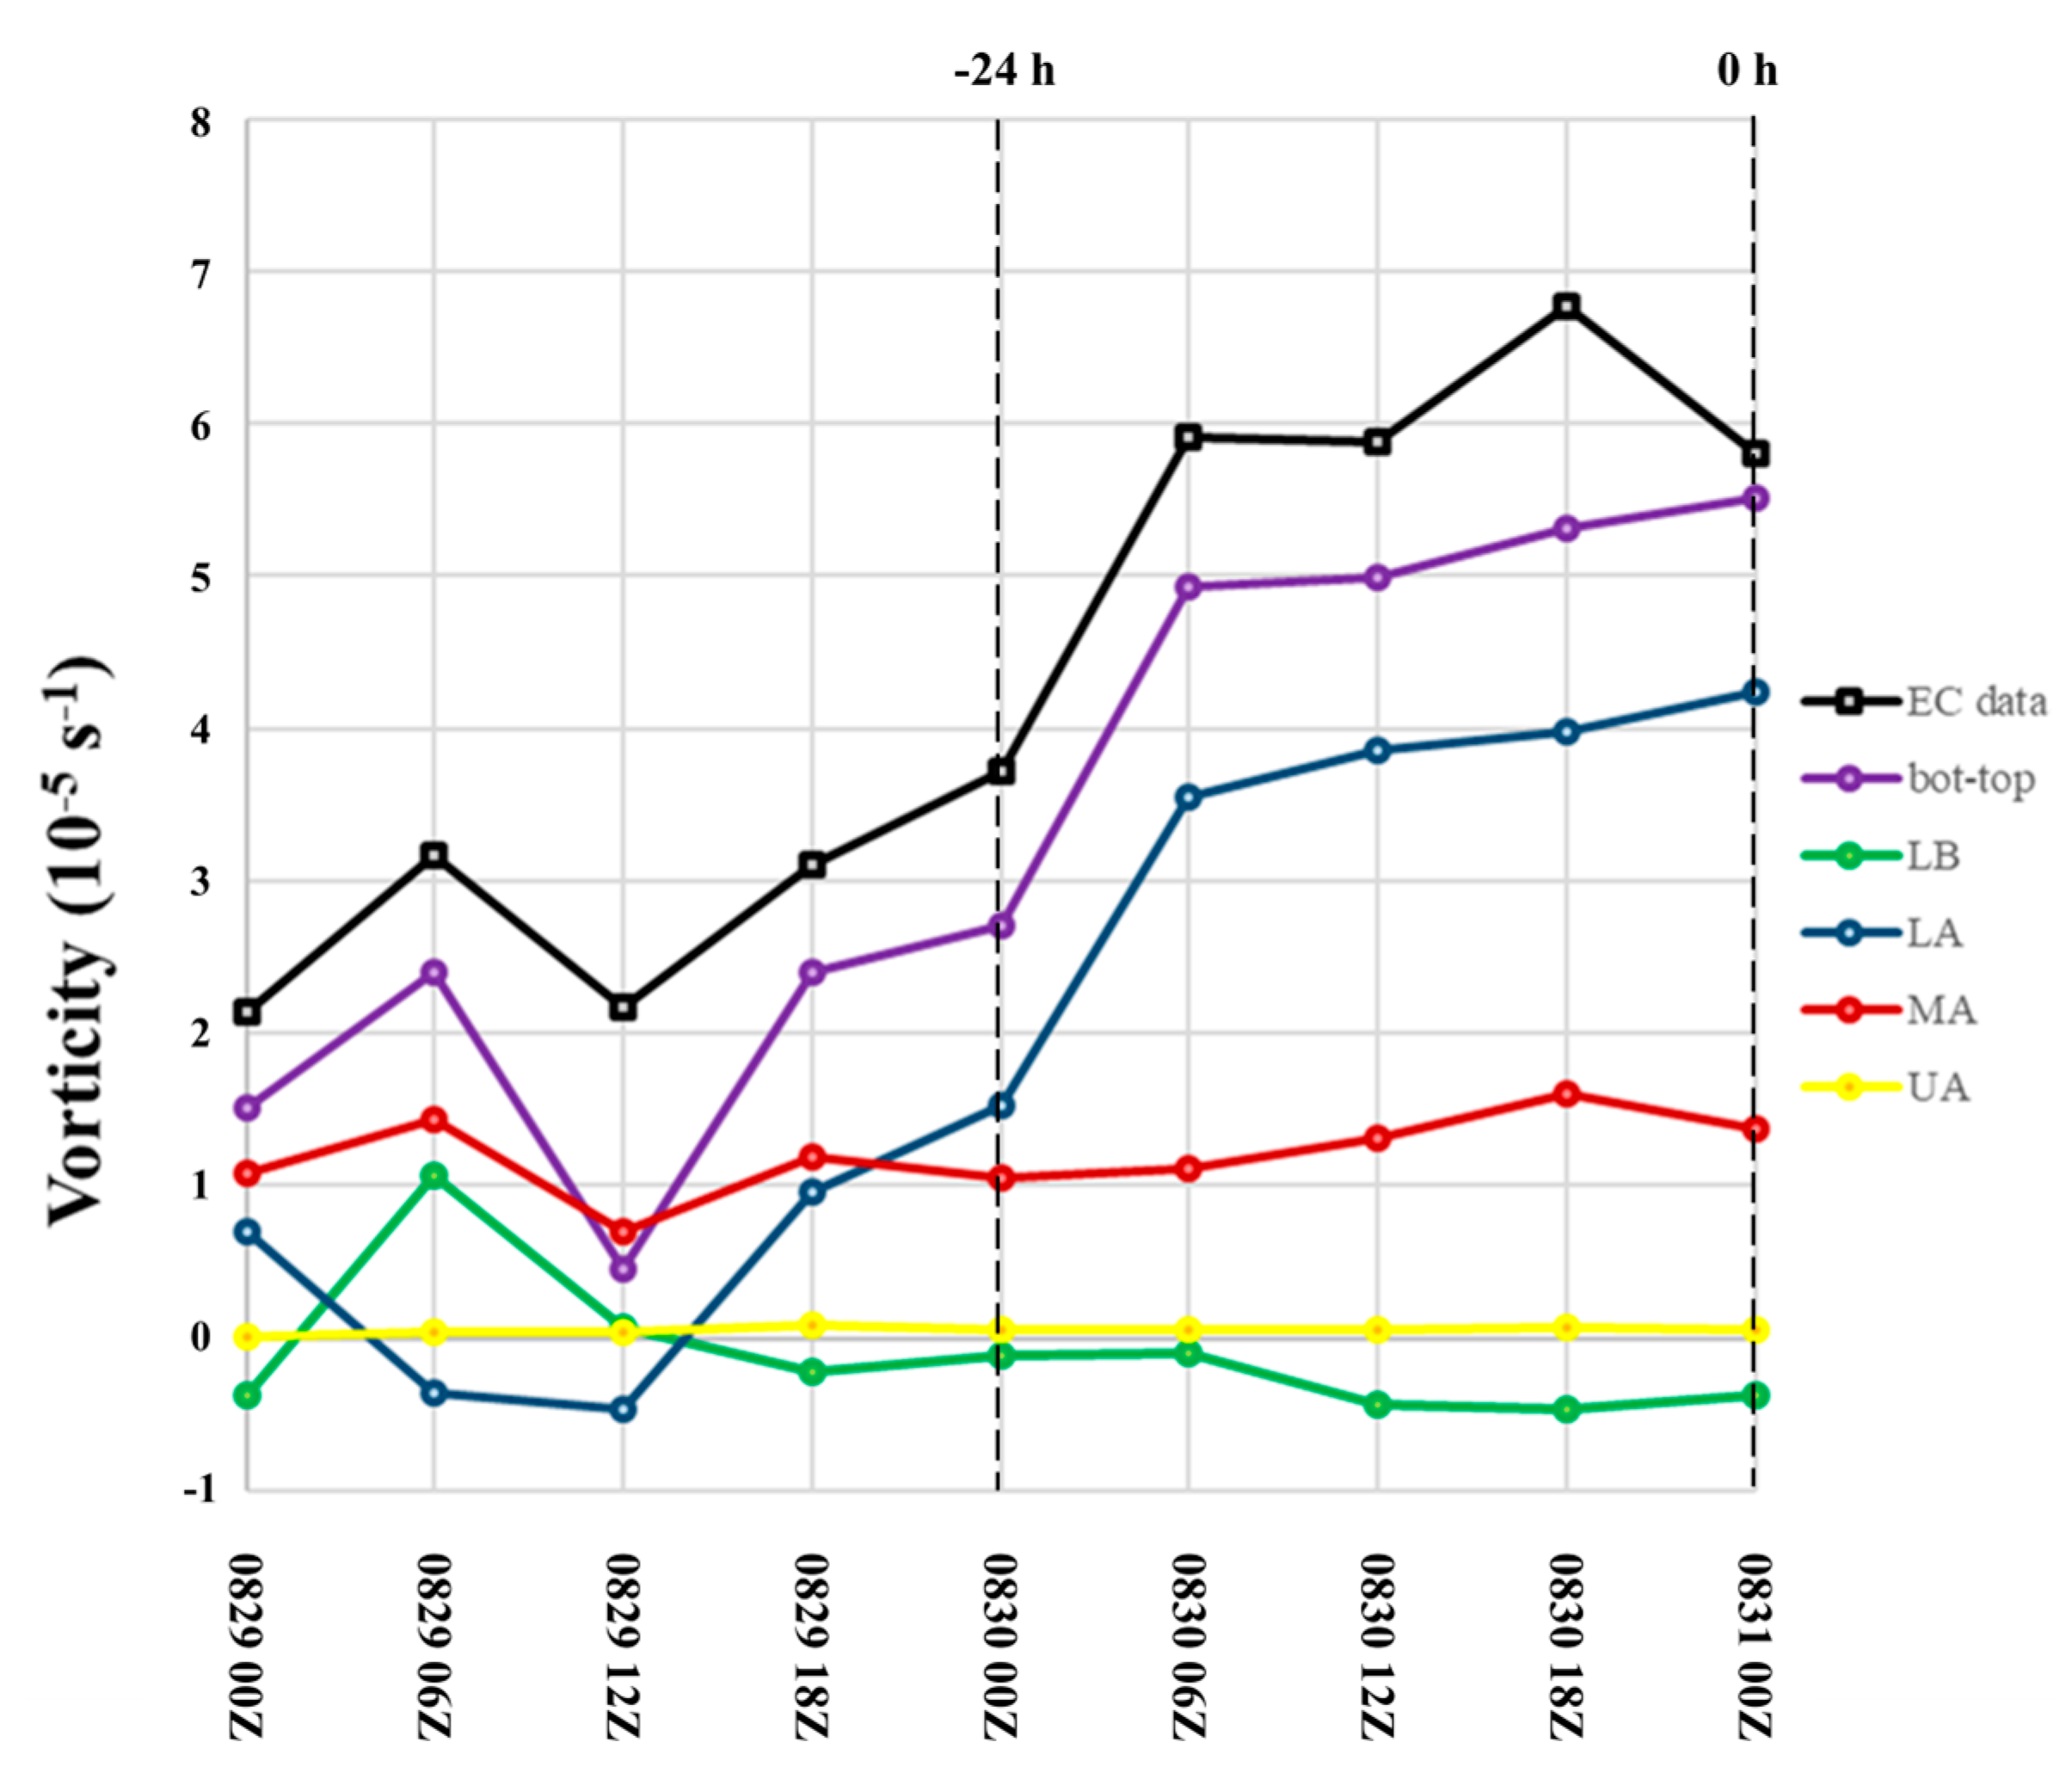
The PPVI for each level at 850 hPa is conducted to diagnose the layer contributing the most to the low-level positive vorticity before Toraji formation in the Taiwan Strait. Figure 5 shows the 850-hPa relative vorticity, averaged over the region from 118° E to 121° E, and from 23.5° N to 26.5°N, derived from ERA-Interim data or the PPVI for each characteristic layer and the entire layer (bottom to top, bot–top).
First, the result of area-averaged vorticity from bot–top is similar to ERA-Interim’s, accounting for 80% of the ERA-Interim’s area-averaged vorticity on average. Thus, the PPVI method could well retrieve the vorticity values in the ERA-Interim data during this period. Second, the low-level vorticity in ERA-Interim had been increasing significantly from 3 × 10⁻⁵ s−1 to 6 × 10⁻⁵ s−1 from 1800 UTC 29 August (−30 h) to 0600 UTC 30 August (−18 h). Before −30 h, MA had accounted for 60% to 70% of bot–top in general, contributing the most relative to other layers. However, LA started to account for over 70% of all retrieved vorticity after −18 h, becoming the majority of vorticity change of retrieved vorticity (bot–top). MA, in contrast, only accounted for less than 30% vorticity at this stage. The results also suggest that the contribution of low-level vorticity from UA and LB can be neglected, as they accounted for only 0% to 10%.
In summary, the result of PPVI shows that before the low-level vorticity intensified, MA (700 to 500 hPa) contributed the most to the low-level positive vorticity, which means the mid-level vortex would affect the low-level wind field under quasi-balanced conditions. However, after the low-level vorticity intensified, MA seemed to have limited impact on the low-level wind field.

3.3. Verification of CTRL

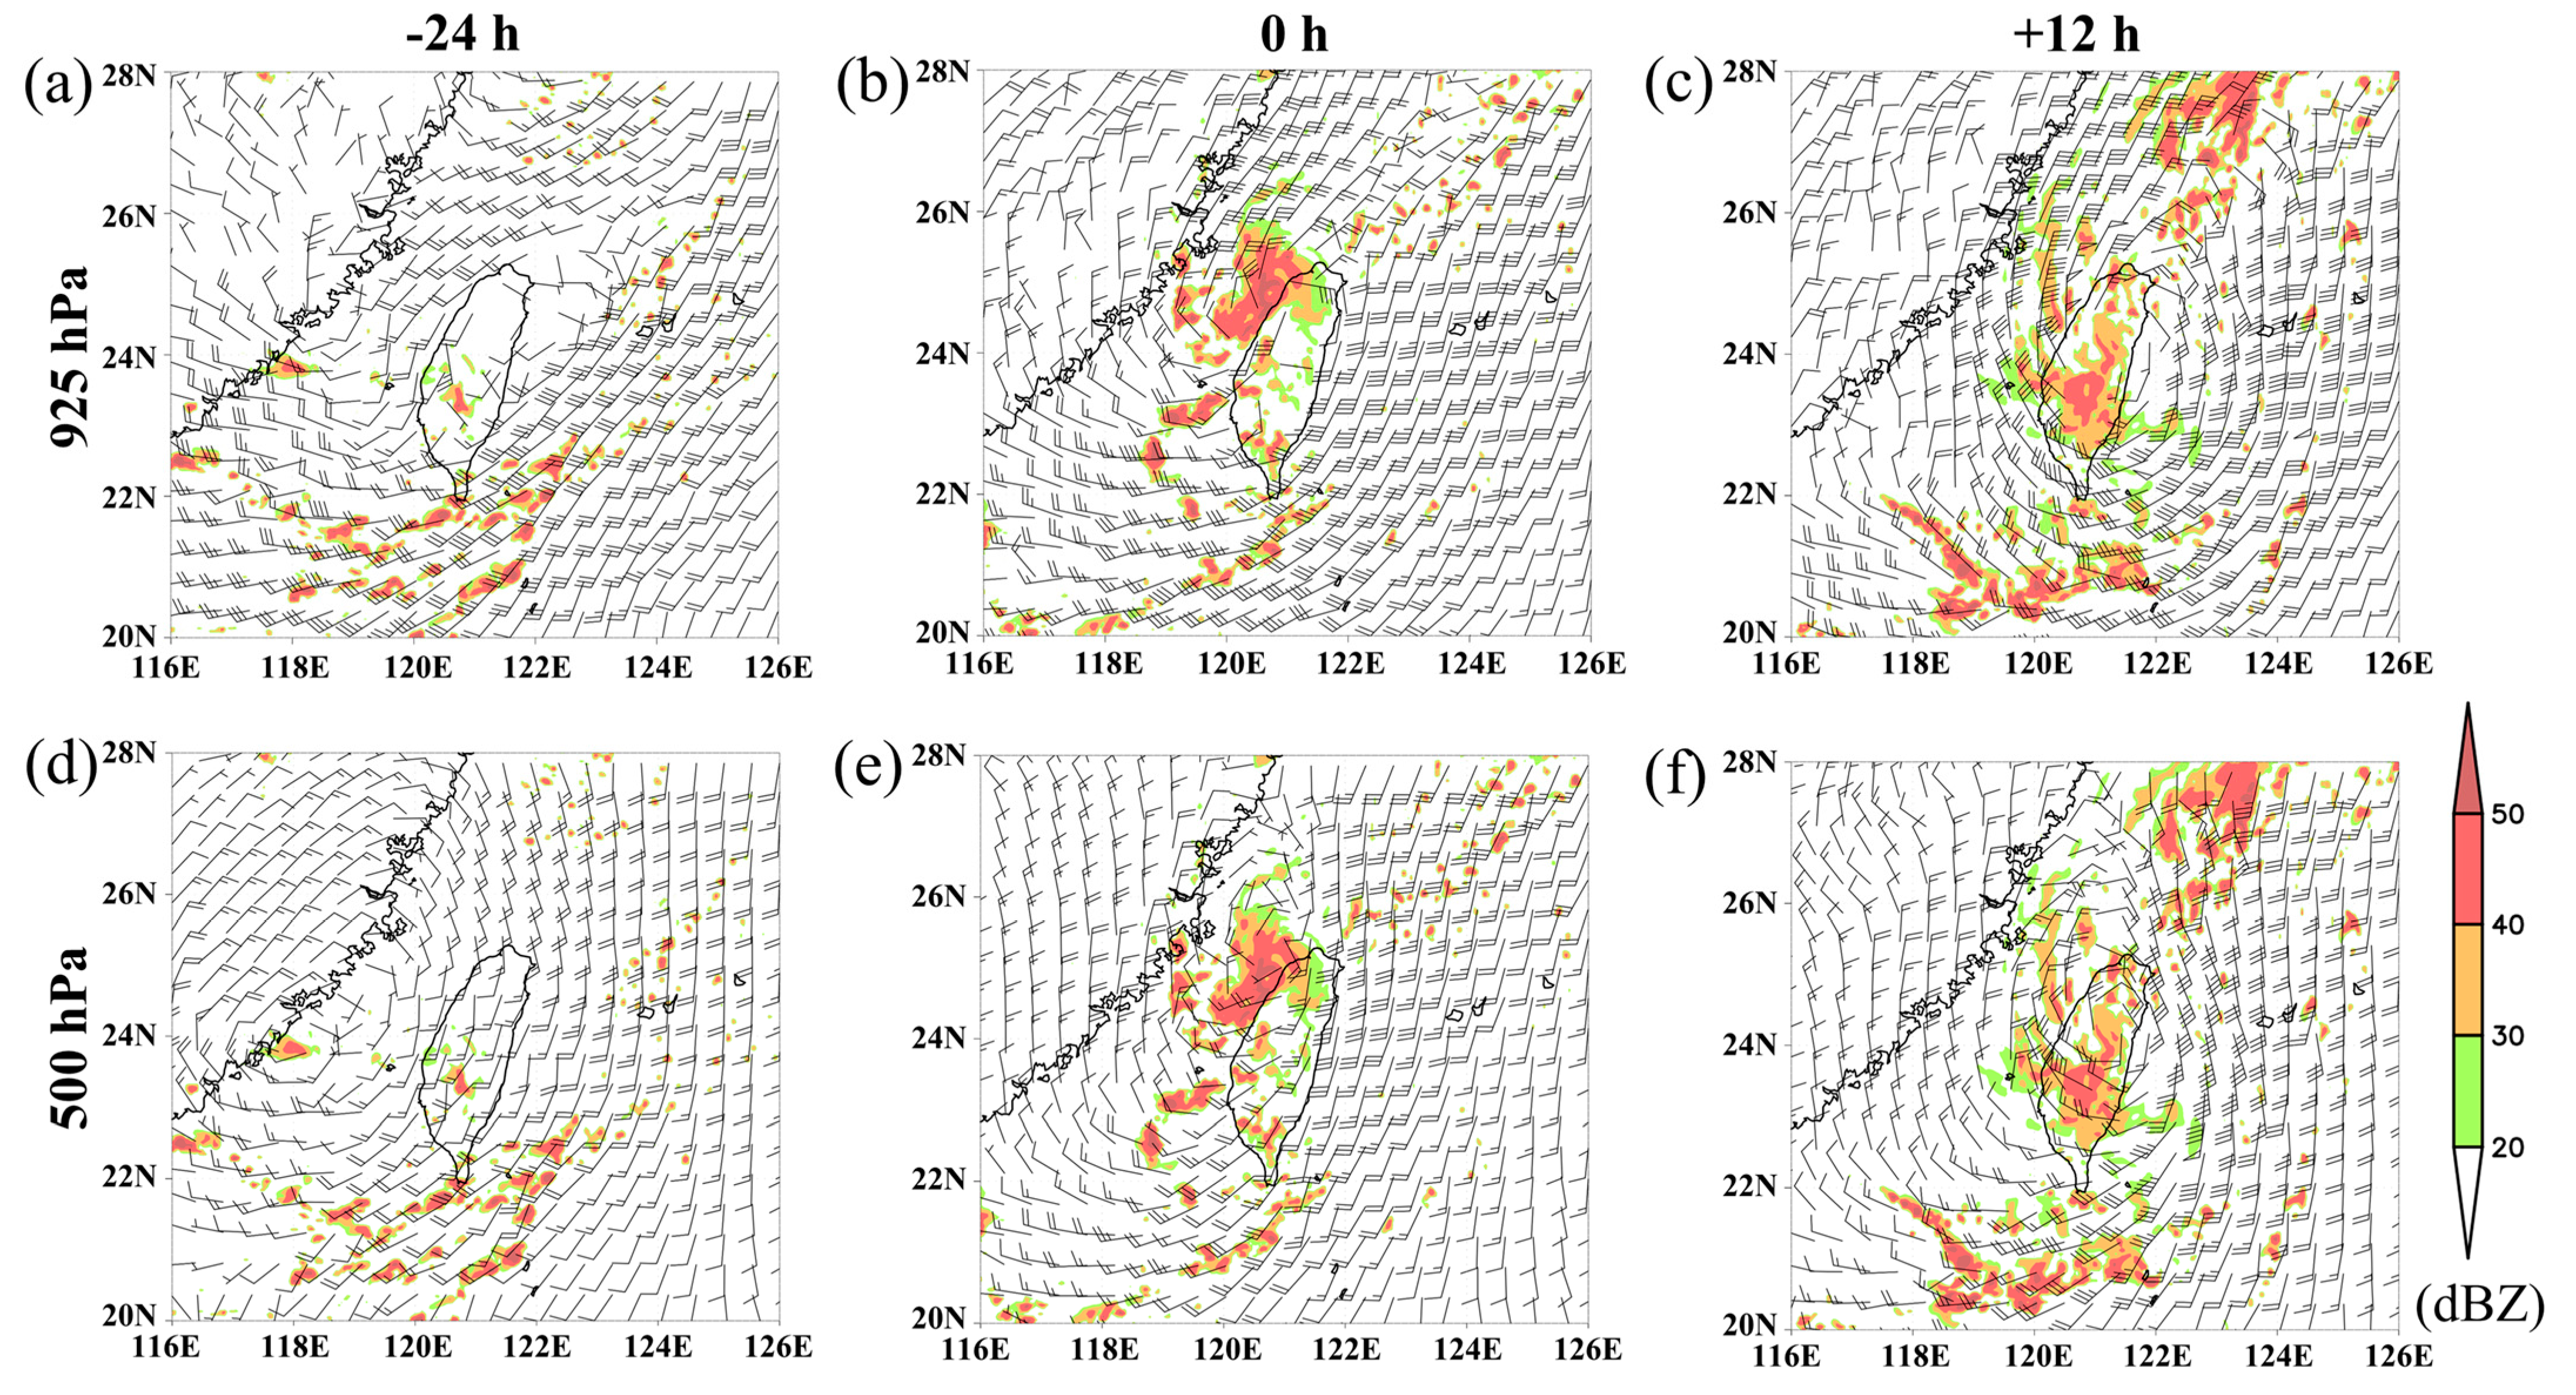
ECMWF ERA-Interim reanalysis data are used as the initial conditions of the simulations. It demonstrates that the synoptic-scale weather systems and the features of Kong-Rey’s mid- and low-level vortex, including the movement, decoupling, and evolution, are similar to those in observation data. The simulation results of the reflectivity, low- and mid-level wind are illustrated in Figure 6. At 0000 UTC 30 August (Figure 6a), it illustrates a low-level shear line on the southeastern coast of China to Taiwan Strait, consistent with the ERA-Interim data in Figure 3b. The 500-hPa wind shows a significant cyclonic circulation in the same area (Figure 6d) that can also be found in Figure 3f.
The low-level shear favors an increase in convergence so that several convective systems started to develop in the Taiwan Strait and the low-level vortex formed a few hours later (Figure 6). Moreover, the rainband (or linear convection system) created by the confluence of westerly and northwesterly (Figure 4c,g) can also be found in CTRL (Figure 6b,e). The low-level vortex dissipated after landing in Taiwan, but the mid-level one passed through the island with several sustained convection systems and coupled with the reformed low-level vortex at 1200 UTC 31 August (Figure 6c,f) and kept moving northeastward slowly.
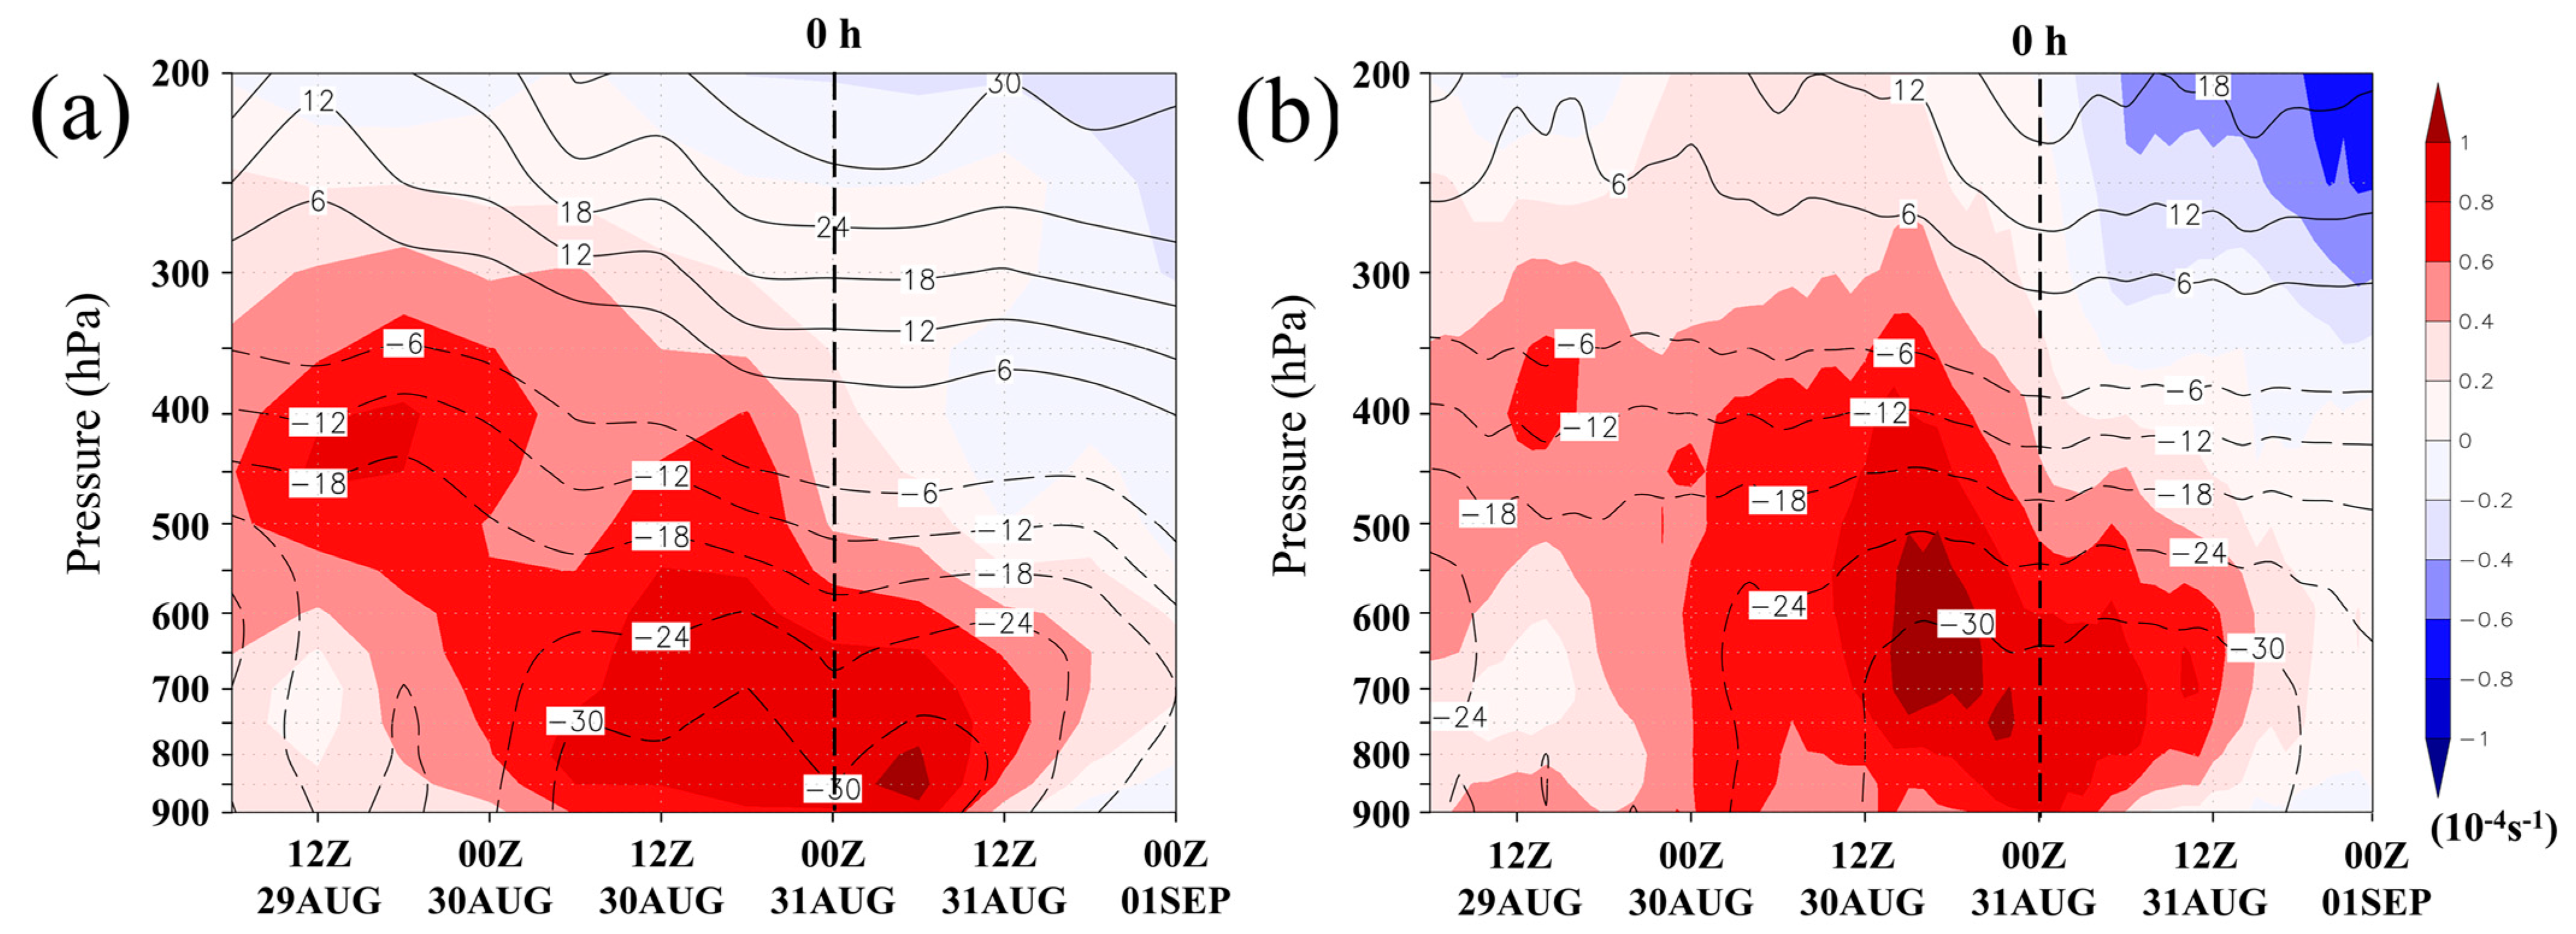
Another comparison between the simulation and reanalysis data is illustrated in Figure 7, the time-height section of vorticity and geopotential anomaly over the northern Taiwan Strait. Before 0000 UTC 30 August (−24 h), positive vorticity had dominated on the mid-level. Then, the low-level shear line moved to this region, followed by the intensification process of the low-level vorticity. Both the vertical distributions and tendencies of the mass and momentum field are simulated.
In summary, the analysis results of CTRL indicate that the process of the formation of Toraji and the intensification of the low-level vorticity can be reasonably simulated. In addition, the appearance of the low-level shear line is supposed to be the external forcing for the low-level convergence and convection bursts. After the development of the convection, the low-level vortex was generated and started to intensify. The mid-level vortex might be important to merge the low- and mid-level vortex, axisymmetrizing the system to become self-sustainable. Moreover, please note, although these disturbances are close to Taiwan’s terrain, the impact of Taiwan’s terrain on the formation of Toraji is not significant. This is concluded by an additional experiment (Removing Taiwan terrain; RMTW) that changed Taiwan’s terrain into aqua-plane (no surface friction and radiation flux). More details are described in Appendix A. Thus, this study focuses on the contribution of the mid-level vortex.

4. RMPVs Experiments

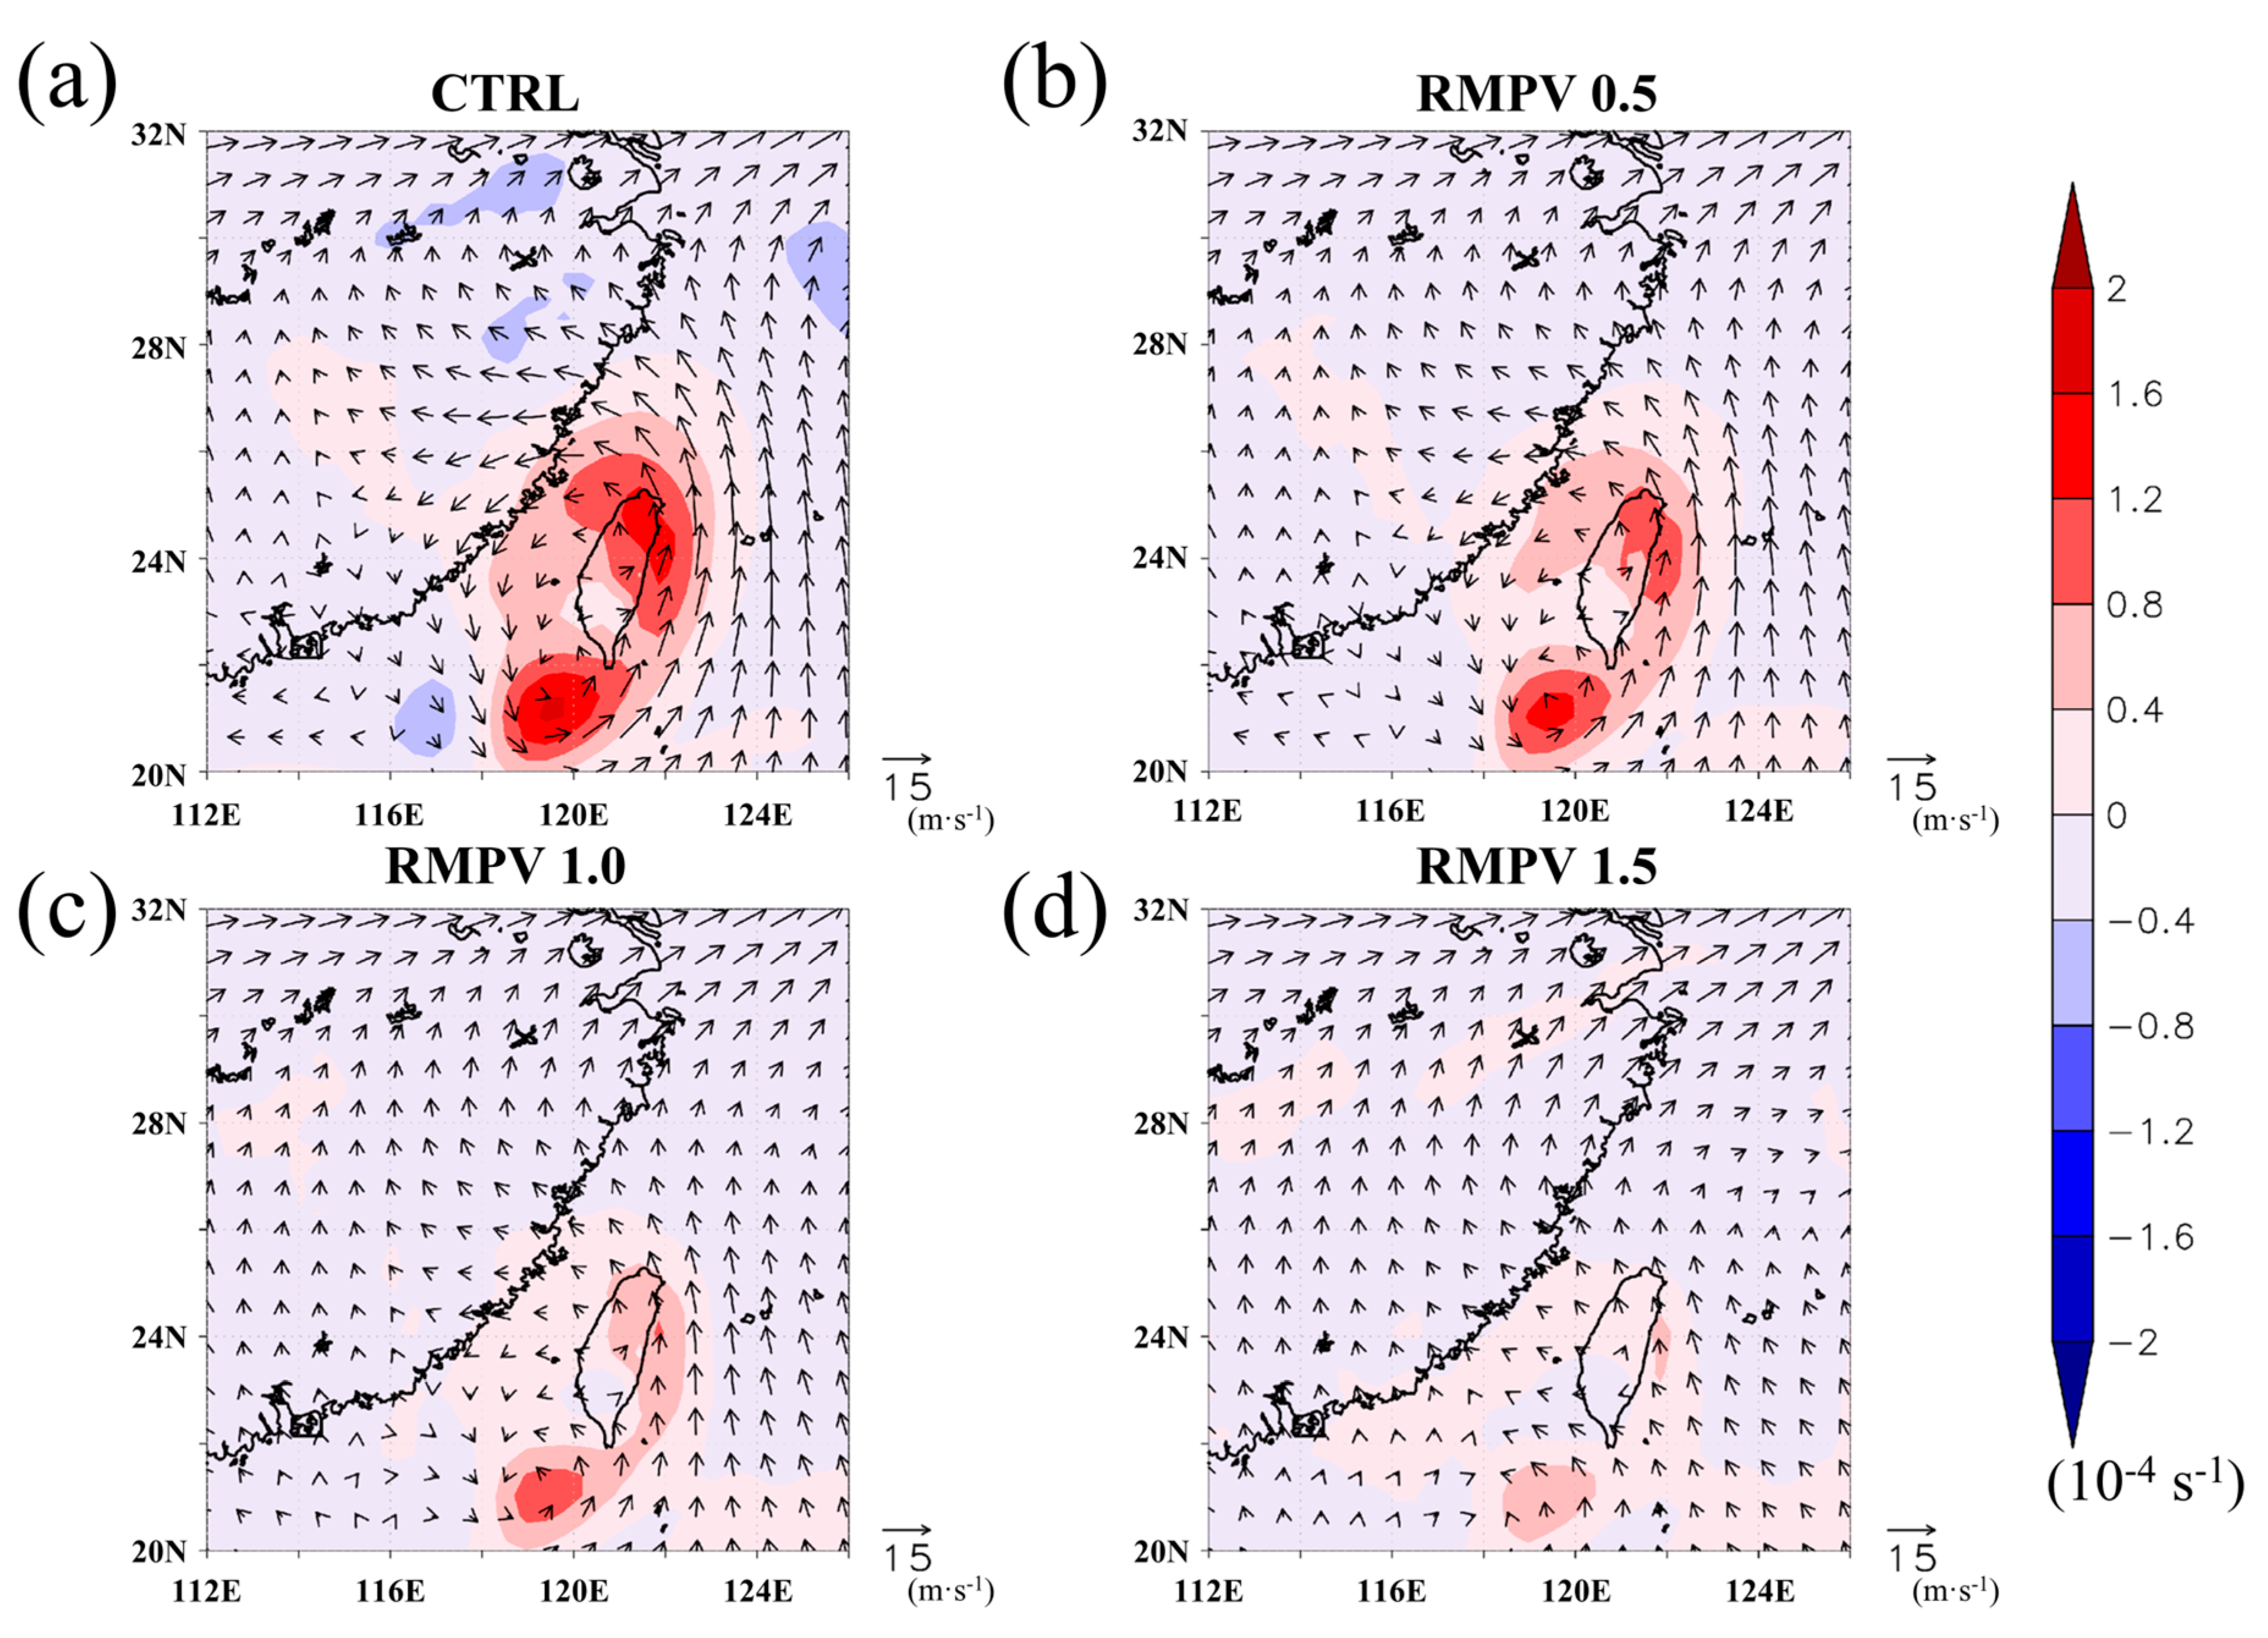
The initial field of 500 hPa cyclonic circulation is successfully changed with a weakening trend (Figure 8). Since the results derived from PPVI are quasi-balanced, they are slightly less than the original value (Figure 5). As a result, removing 100% quasi-balanced wind field of the mid-level vortex (RMPV1.0) does not mean the mid-level vortex would be totally removed, and this is also a reason for examining the sensitivity with different removing factors of the mid-level vortex. In this case, the initial 500-hPa vorticity is close to 0 × 10−5 s−1 when the removing factor reaches 150% (Figure 8d).
Basically, the main differences at the initial state between CTRL and RMPVs are the momentum field of WRF simulation. As shown in Figure 8, the initial mid-level cyclonic circulation gradually becomes weaker as the removing factor becomes larger in RMPVs. Because the removing part is the associated quasi-balanced wind and mass field derived from the 700 to 500 hPa PPVI result, the most distinct parts in the momentum field are at levels from 700 to 500 hPa. However, changes in the mass fields and thermal condition are smaller at the initial state, compared to changes in the momentum field. In addition, because the PPVI diagnosis does not consider moisture, the moisture field has almost remained the same. After the early spin-up stage in RMPVs, the mass field and thermal structure has slightly changed associated with the modified feature of the momentum field (when the removal of the initial mid-level vortex is larger). This implies the adjustment between the wind and mass field during the spin-up stage in the WRF simulation, but the differences among RMPVs are still insignificant. In other words, the main differences come from the momentum field changed by the PPVI mid-level vortex balanced field at the beginning of the WRF simulation. After the early spin-up stage of simulation, the mass field also slightly impacts the mass field and thermal structure patterns in RMPVs. At the end of the simulation, the inappreciable differences in the dynamics and thermal structure at an earlier stage among RMPVs and CTRL are integrated and enlarged.
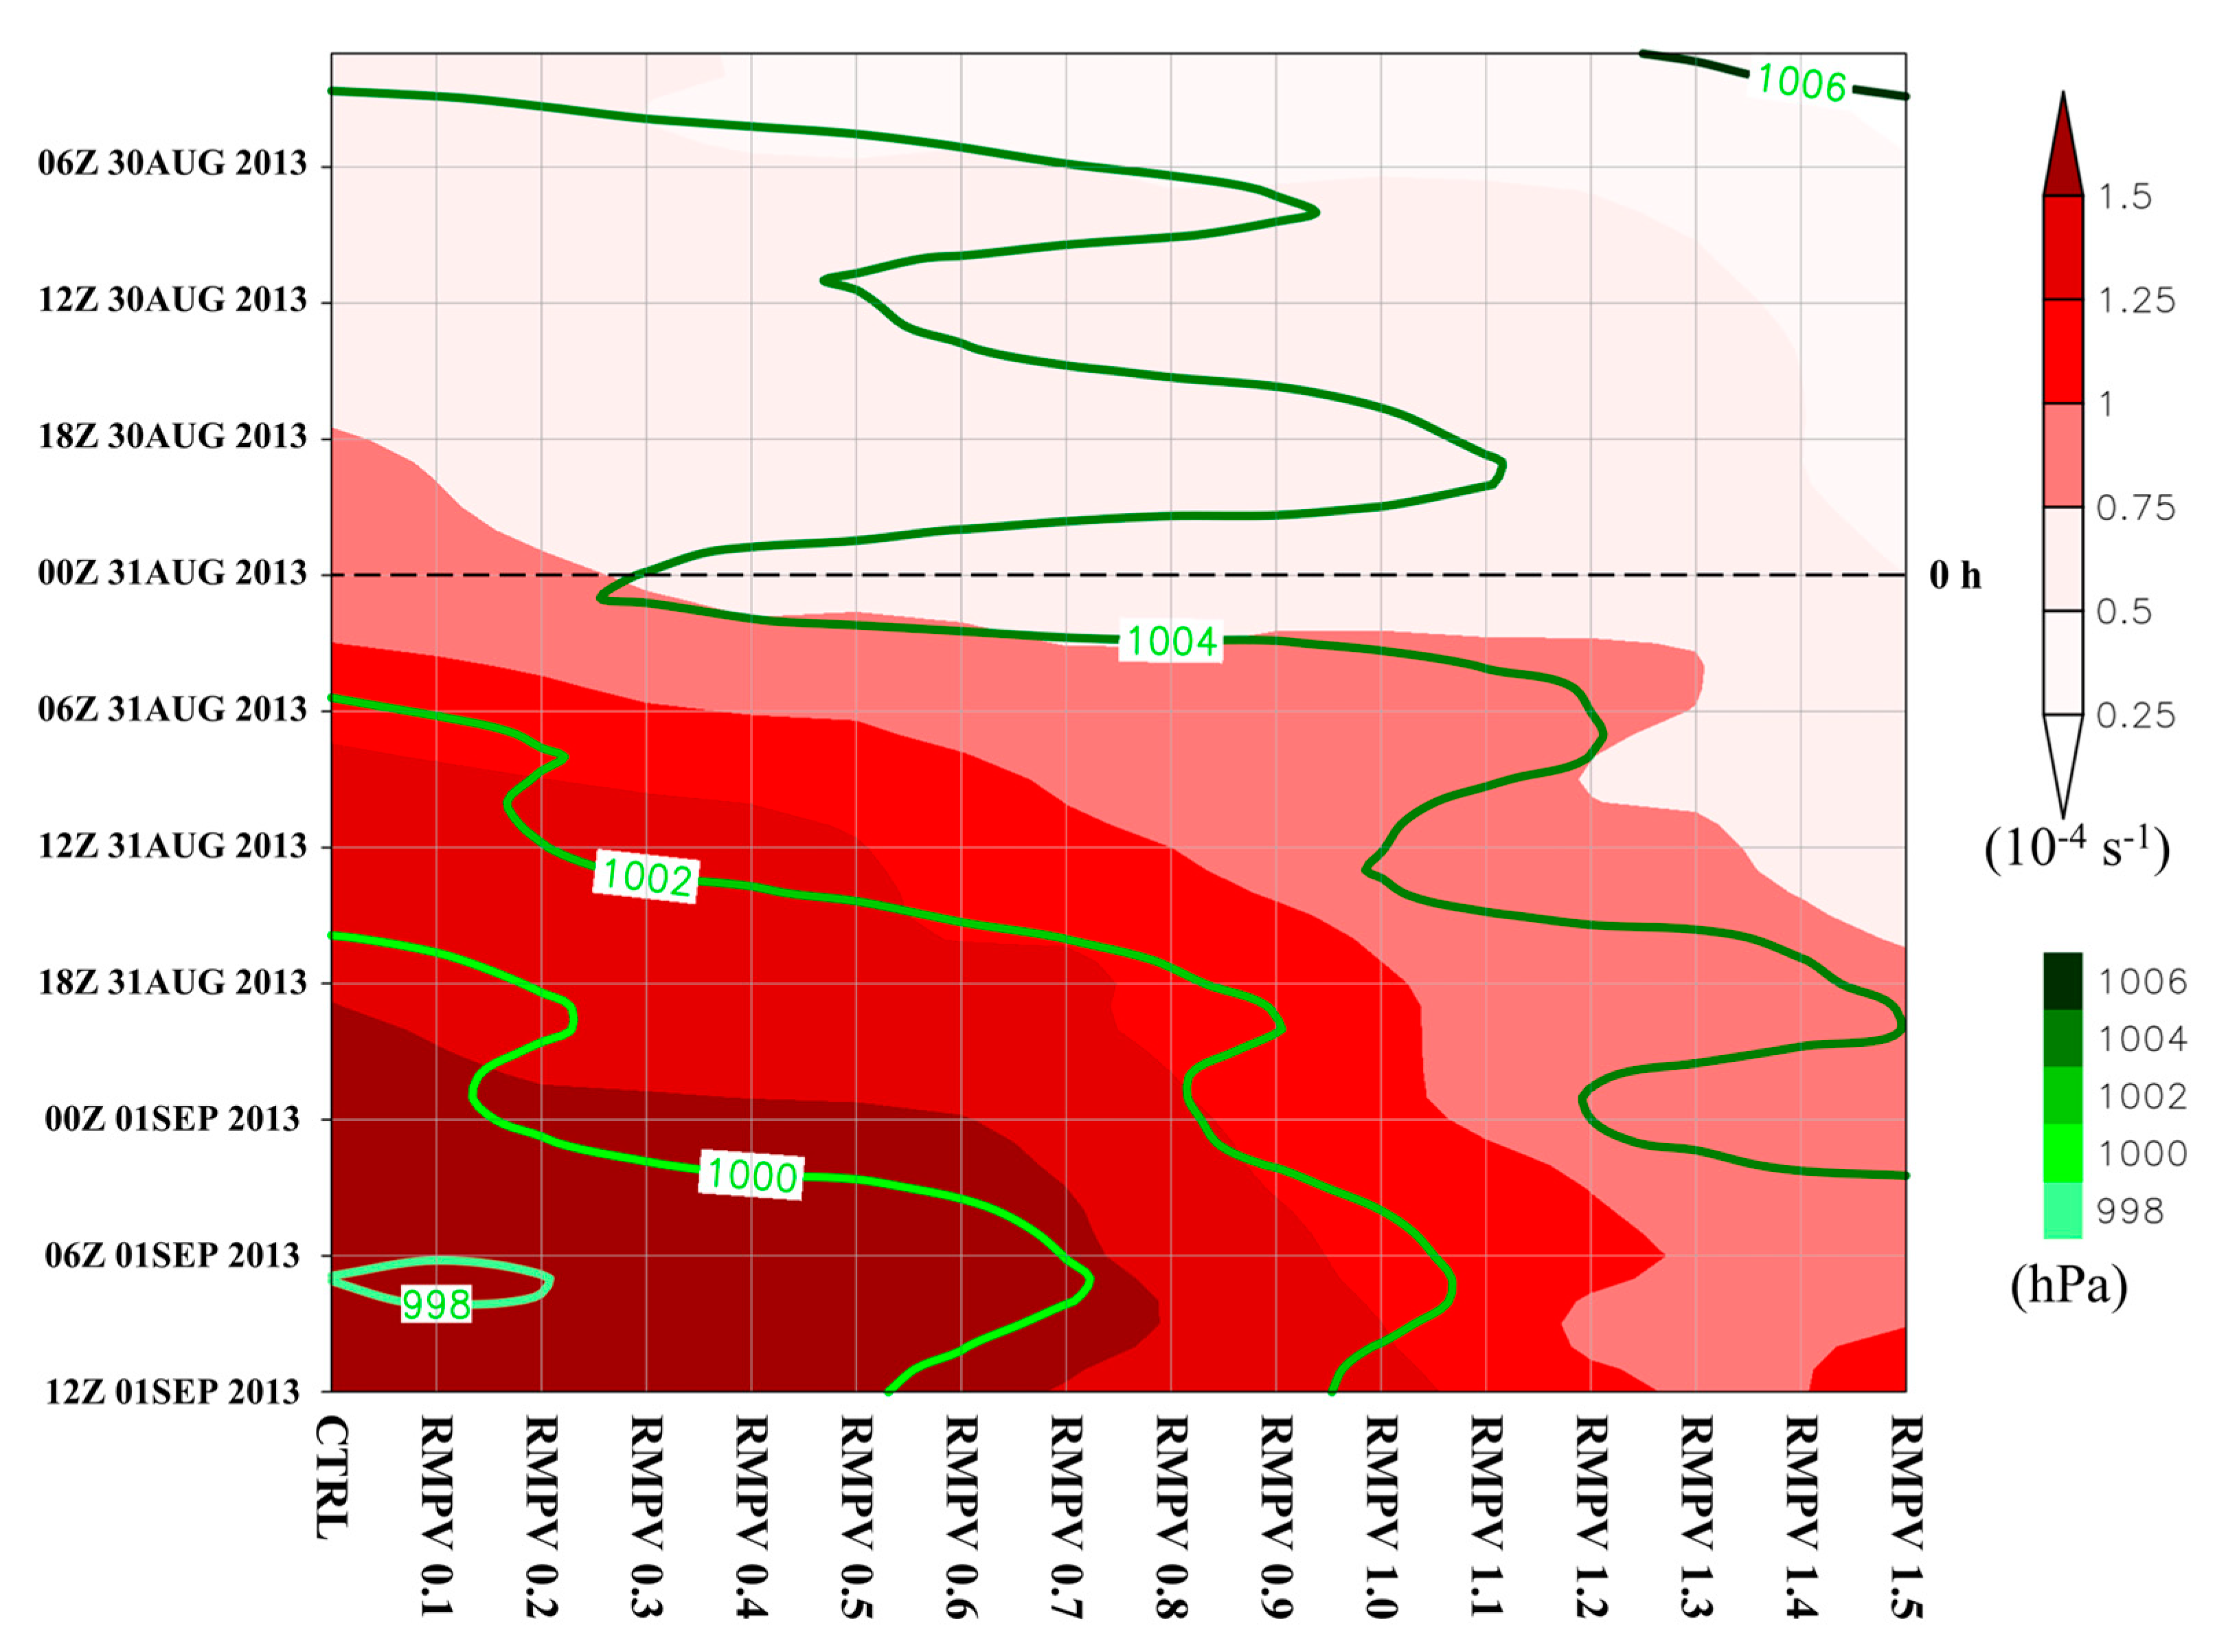
Overall simulation results show that the intensity of the low-level vortex becomes much weaker with larger removing factors, though there is still a closed low-level vortex east of Taiwan in the experiments. Specifically, the minimum sea-level pressure near the system’s center is about 993 hPa in CTRL, but is 995 hPa, 997 hPa, and 999 hPa in RMPV0.5, RMPV1.0, and RMPV1.5, respectively. Additionally, the coverage of reflectivity extends smaller in RMPV1.0 and RMPV1.5.
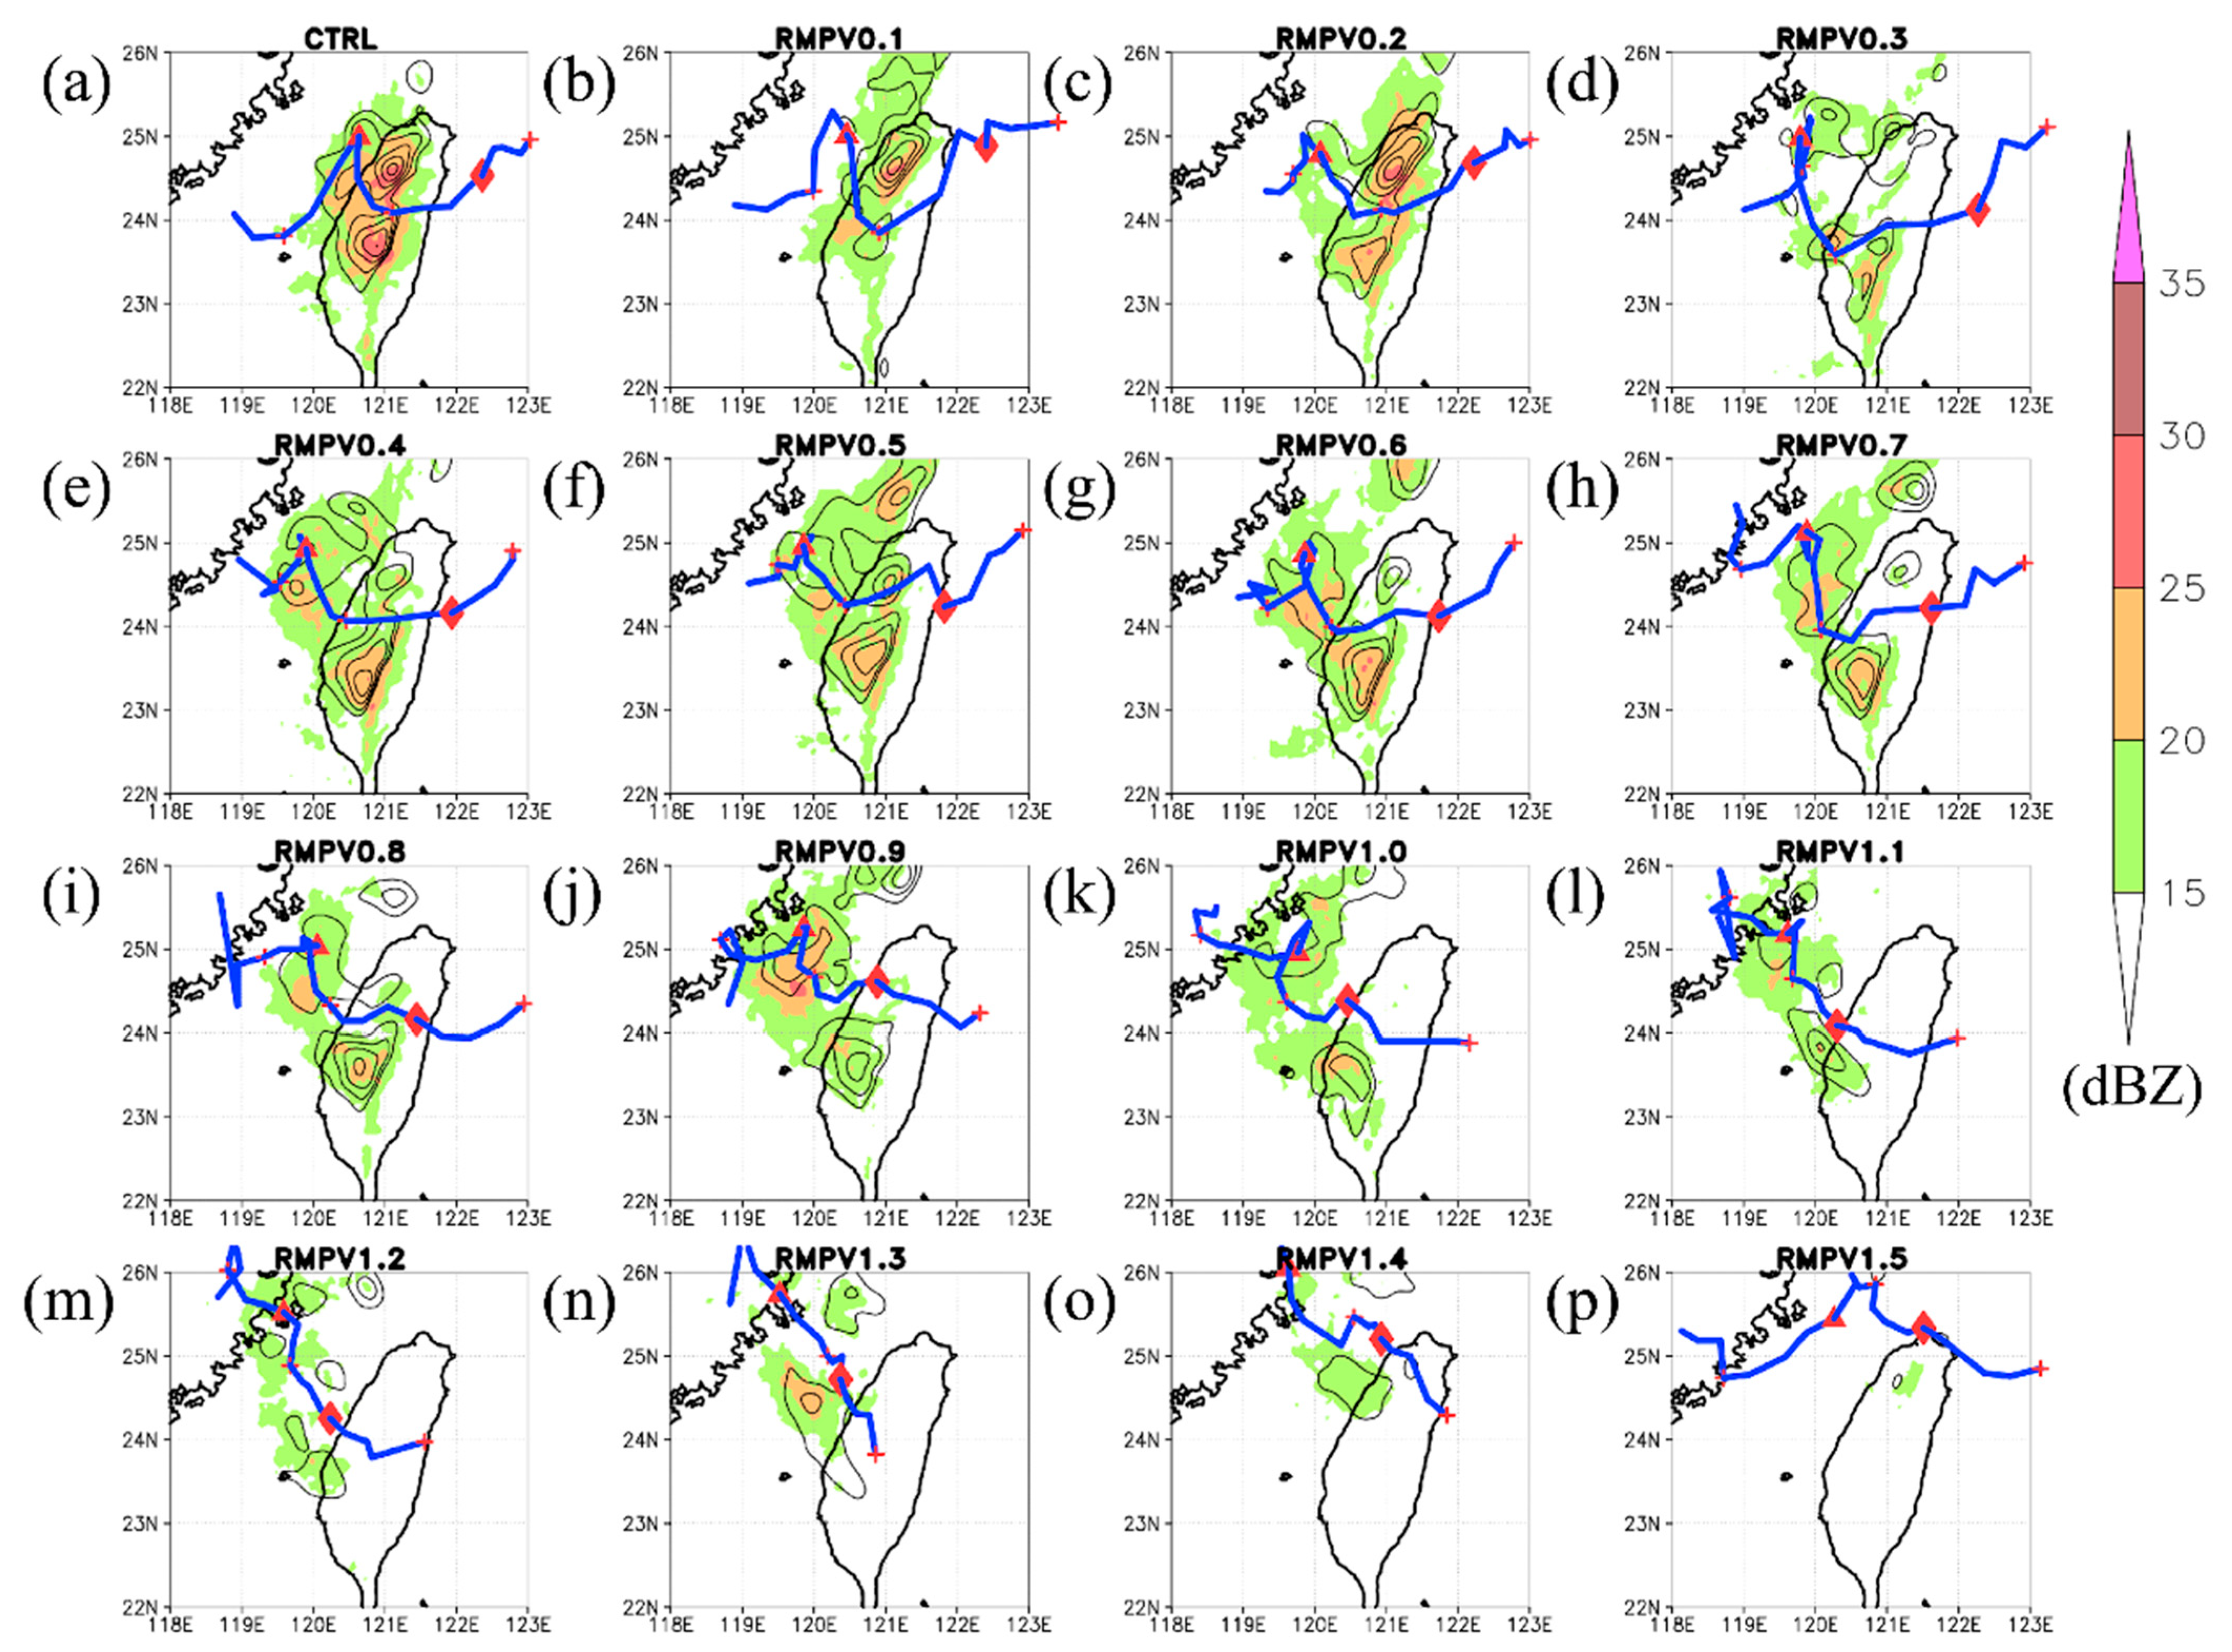
Since it is widely accepted that the convection bursts would dominate the TC formation process, the difference in the development of convection systems in each experiment was analyzed. Figure 9 shows the track of the 700 hPa vortex center and time-averaged vertical motion from 0000 UTC 30 August (−24 h) to 1200 UTC 1 September (+36 h) from each experiment. The 700 hPa vortex center tracks in the RMPVs experiment are similar to that of CTRL, which illustrates the vortex movement from the northern Taiwan Strait to the east of Taiwan with position shift and time delay.
Generally, in all simulations, the most intense convection systems congregate near the vortex center of the 700 hPa vortex (within a 1° to 2° radius area), which also implies convection is related to the intensification of low-level vorticity. Furthermore, it indicates that the absence of the mid-level vortex might impact the development of the convection system, making an unfavorable environment for TC formation, especially for RMPV1.1 to RMPV1.5 (Figure 9k–p). In order to illustrate the evolution of the low-pressure system in all experiments, further analyses focus on the time-series of vertical profile within a 2°-radius area following the 700-hPa vortex in each simulation.
As shown in Figure 10, the low-level vorticity seems to significantly increase around 0000 UTC 31 August (0 h) in most experiments. Additionally, the end of the simulation clearly shows a declining trend in the low-level vortex intensity correlated with the increasing trend of removing factors. In addition, the development of the simulated low-level vortex would be delayed when the mid-level vortex becomes weaker. Furthermore, the low-level vorticity would approach a certain value as the increasing rate drops in the last 12 h simulations. For the experiments with removing factors larger than 120% (RMPV1.2 to RMPV1.5), the low-level vorticity is close to the value 1 × 10⁻⁴ s−1.
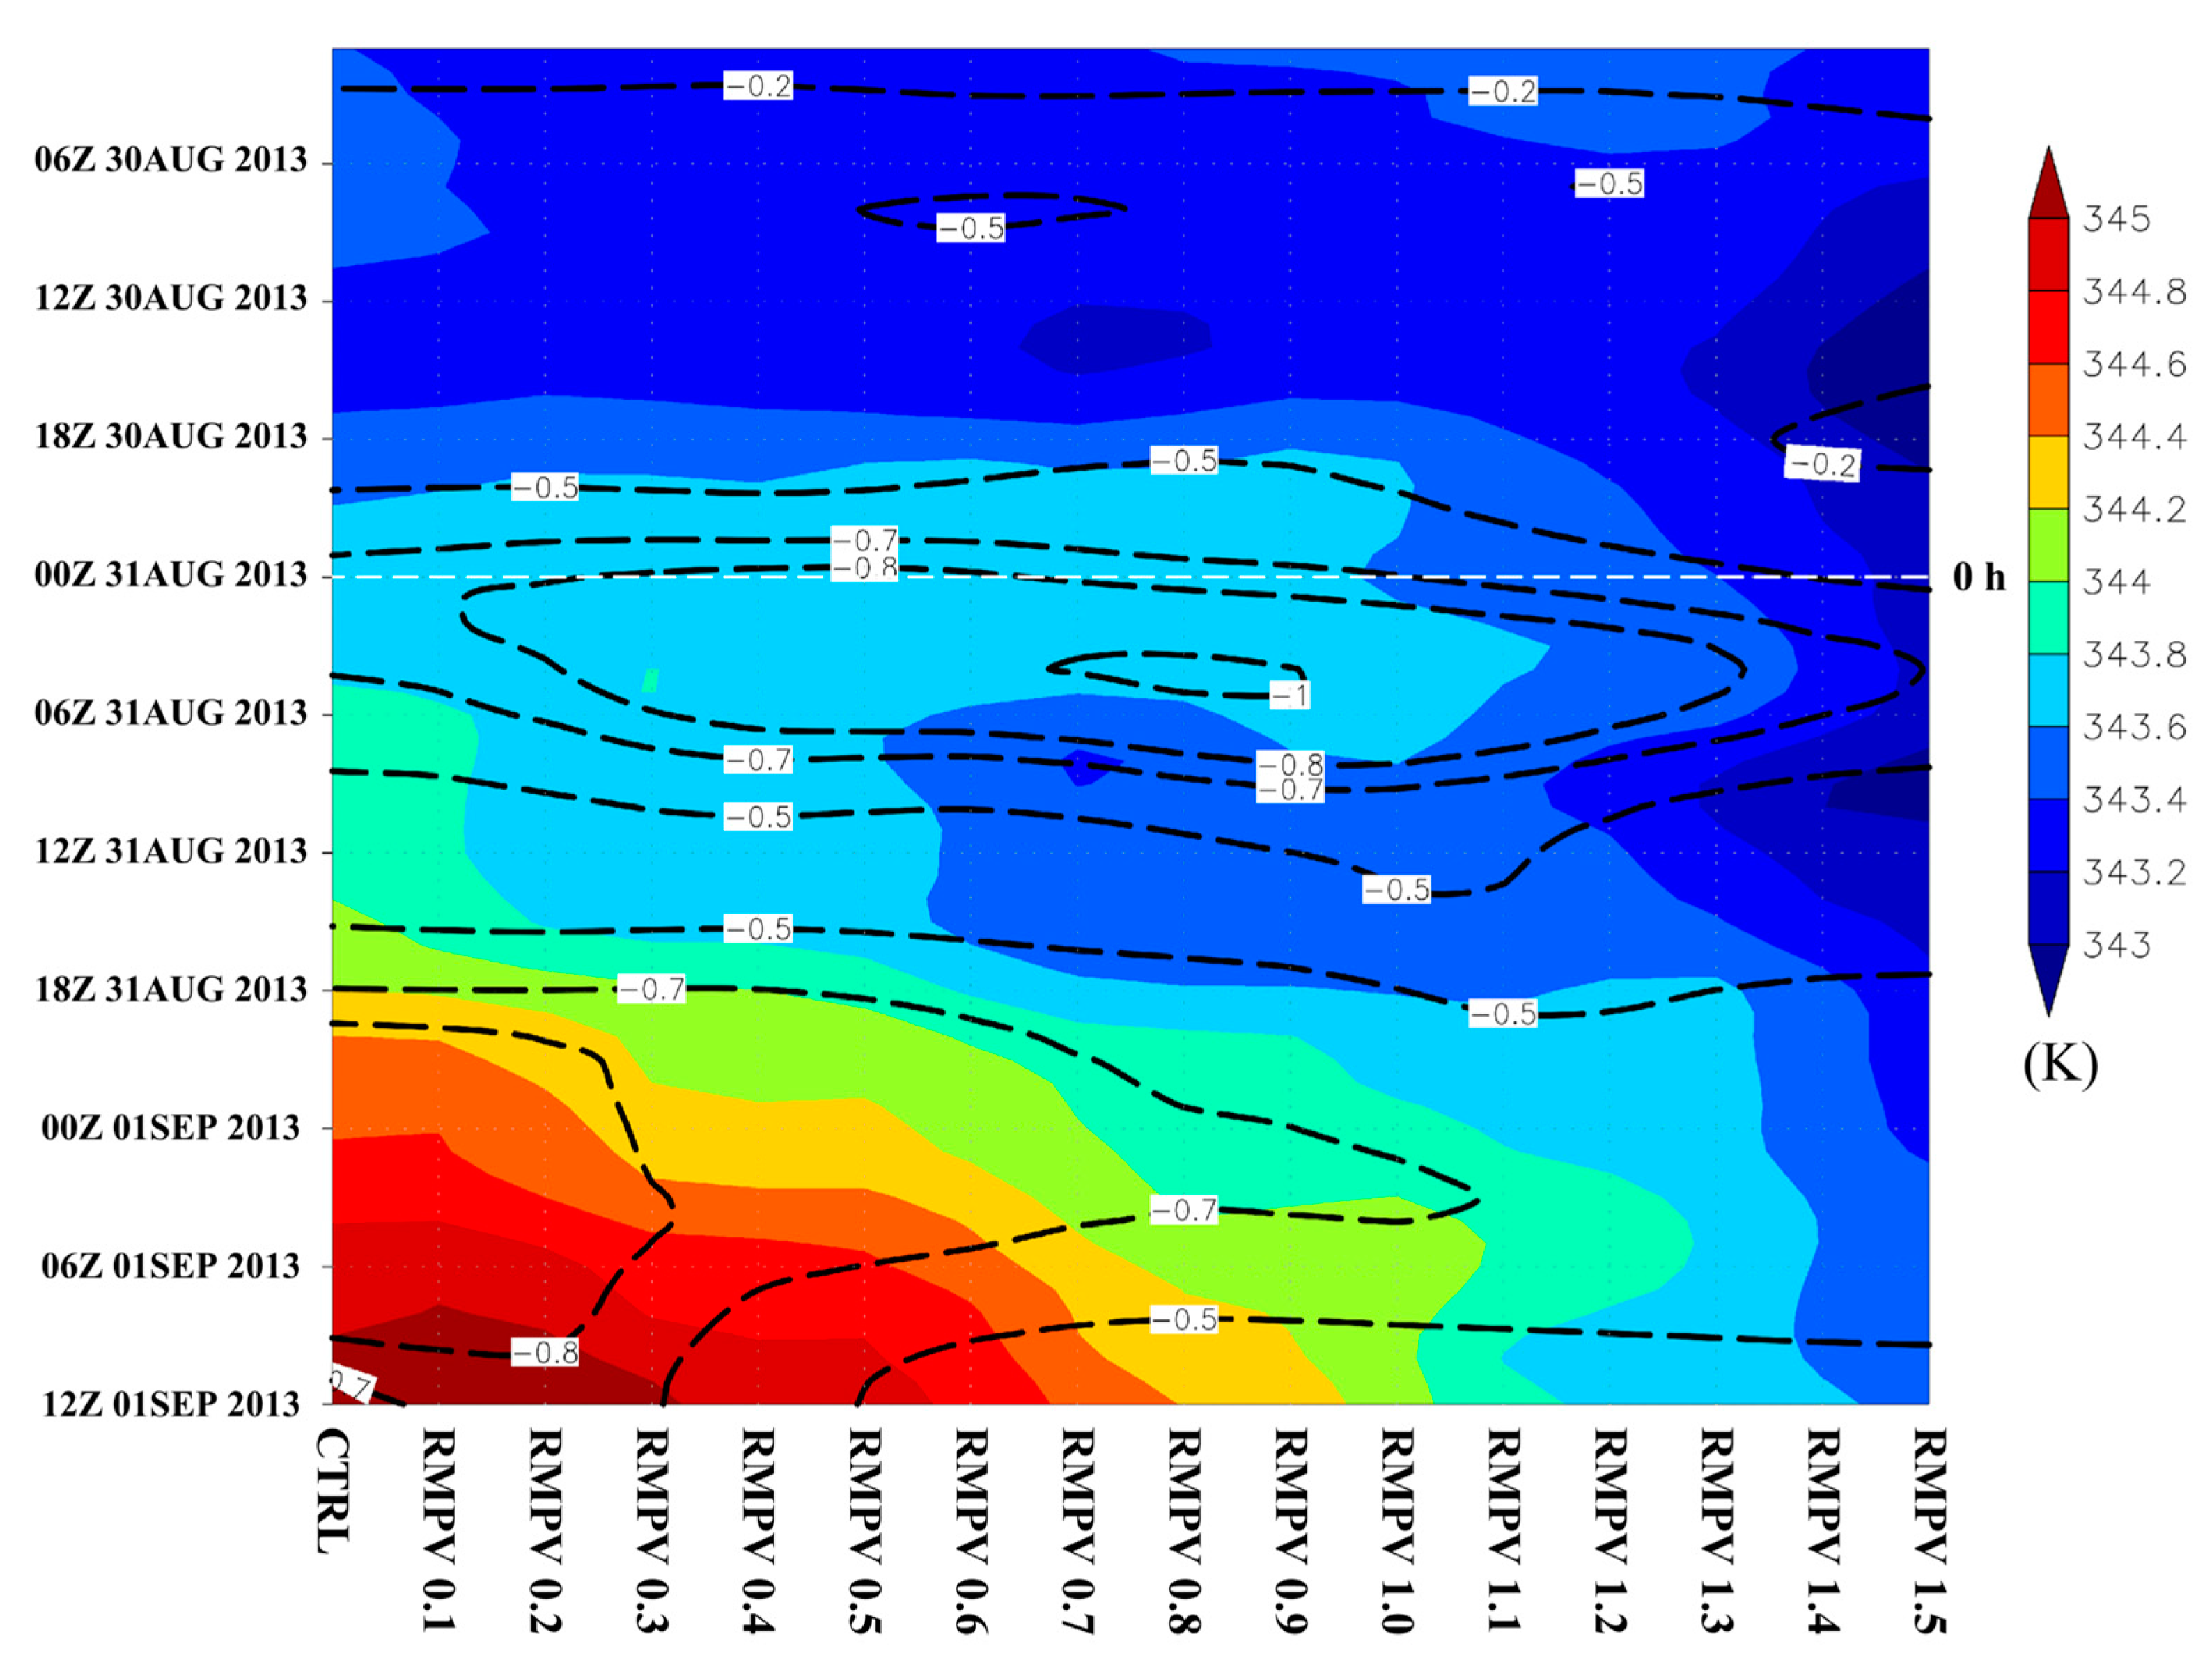
Another related phenomenon is the enhancement of the high-level warm-core of the system as shown in Figure 11. The overall results in RMPVs show that the high-level temperature has been cooling down as the initial mid-level vortex becomes weaker, especially at the end of the simulation. Interestingly, a delaying and limited increasing trend in the high-level potential temperature similar to the low-level vorticity (Figure 10) can also be found in Figure 11. For the experiments CTRL to RMPV 1.0, the high-level potential temperature has increased from 1200 UTC 31 August (12 h) to 1200 UTC 1 September (+36 h) with a delaying trend as the removing factor increases. For example, the high-level potential temperature surpasses 344 K at 1500 UTC 31 August (+15 h) in CTRL, whereas this occurs at 0300 UTC September (+27 h) in RMPV1.0. On the other hand, for the experiments RMPV1.1 to RMPV1.5, the high-level potential temperature would be equal to or less than 344 K, corresponding to the limited development of the low-level vorticity in Figure 10.
Figure 11 also illustrates that the mid-level vertical motion in all experiments has stayed upward near the 700-hPa circulation center after a shear line extended to the area at 0000 UTC 30 August (−24 h) (Figure 3b and Figure 6a). The upward motion becomes greater than −0.5 Pa s−1 after 1800 UTC 30 August (−6 h), which does not vary with experiments. However, a peak value of upward velocity, −1 Pa s−1, appears in from RMPV0.7 to RMPV0.9, with the most intensive convection in the Taiwan Strait after 0 h (Figure 9h–j). It can also be found that the convection systems are closer to the incipient vortex center in RMPV0.5 to RMPV1.0 from a plane view (not shown), which might result from the slow movement or other mesoscale processes in the Taiwan Strait (Figure 9). Moreover, the upward motion rises from CTRL to RMPV1.0 around 0500 UTC 31 August (+5 h). Subsequently, the upward motion drops below −0.5 Pa s−1 at the following time, around 1200 UTC 31 August (+12 h). At the same time, it is worth mentioning that the high-level temperature keeps going up with time or remaining the same in CTRL to RMPV0.5, while it has decreased with time from +5 h in RMPV0.6 to RMPV1.0, which might imply that the intensity of the system tends to retain in experiments with stronger initial mid-level vortex. Furthermore, as the upward motion starts to strengthen again at 1500 UTC 31 August (+15 h), it still shows a declining magnitude trend with a weaker initial mid-level vortex, consistent with high-level potential temperature. Consequently, more vigorous convection at the early stage does not result in stronger high-level warm-core (Figure 11) and low-level vorticity (Figure 10) at the final simulation stage.
As a result, according to the analyses, experiments can be further divided into two groups. For the first group, CTRL to RMPV1.0, there is no clear correlation between the initial mid-level vortex and the magnitude of upward motion (or convection) at an earlier stage (around 0 h). However, these simulations have positive correlation between the amount of initial mid-level vortex and the variables related to the low-pressure development (such as upward motion, high-level potential temperature, and low-level vorticity, including their magnitude and rate) at the end of simulations (+36 h). For the second group, RMPV1.1 to RMPV1.5, not only a similar positive correlation between the amount of initial mid-level vortex and the magnitude of those variables but also a limited value (or a very small tendency) of low-pressure development corresponding to the removal of the initial mid-level vortex can be found in the results.
Generally, the diabatic heating generated by deep convection systems would enhance the warm core structure in the low-pressure system, which is a necessary condition for TC formation. The stronger the high-level warm-core is, the more significant the low-pressure system would be. A thicker physical depth of the higher troposphere would descend the isobaric level at the lower troposphere. Thus, the enhancement of tangential wind and convergence in low-level would change with the strength of high-level warm-core. More inflow and water vapor flux convergence will lead to a self-sustainable condition for the system. Our simulation results also support these.
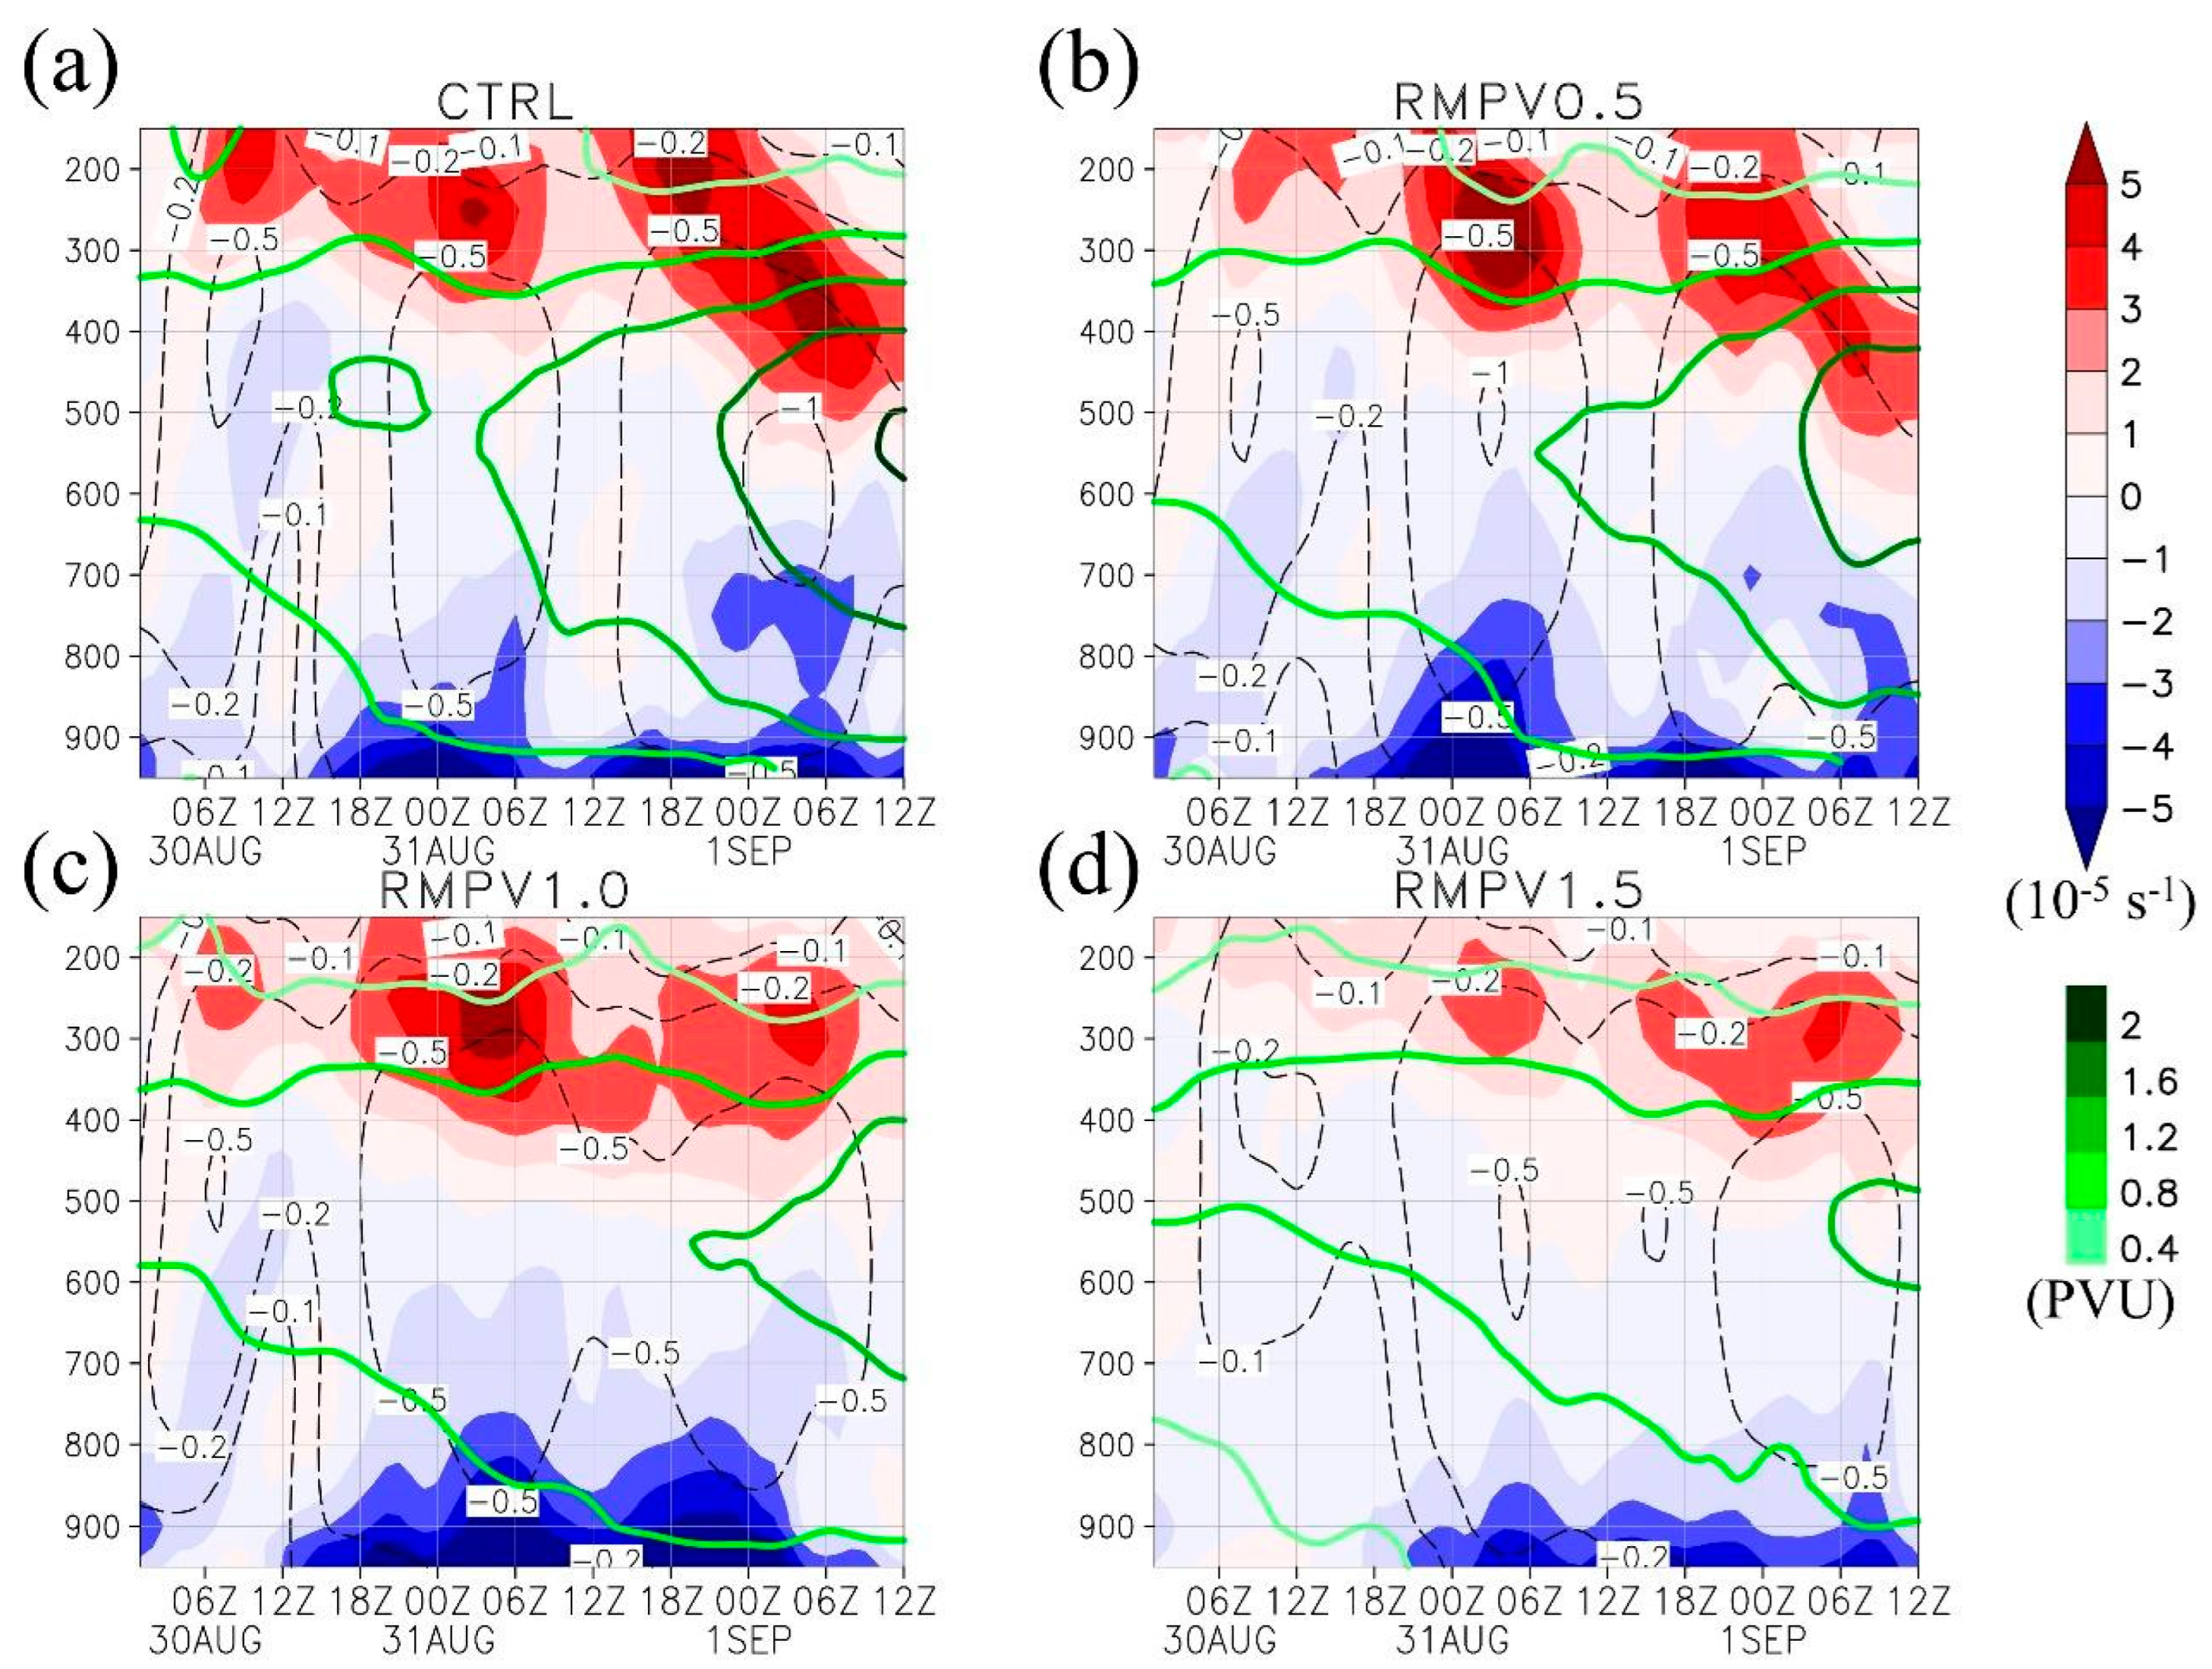
Figure 12 summarizes the vertical profile evolution of the low-level convergence, vertical motion, and PV. The formation of Toraji can be identified with three critical events. First, it starts with a low-level horizontal shear line and low-level convergence at 0000 UTC 30 August (−24 h). Second, the low-level convergence becomes more significant after 1200 UTC 30 August (−12 h), making the mid-level vertical upward motion go up to −0.5 Pa s−1 at level 800- to 300-hPa around 1800 UTC 30 August (−6 h), consistent with Figure 11. Third, after 0600 UTC 31 August (6 h), an intensifying vertical PV structure can be found in the simulation (e.g., PV reaches 1.2 PVU in vertical), followed by the area-averaged high-level potential temperature warmer than 344 K in CTRL (Figure 11).
In general, it turns out to be indistinguishable in CTRL, RMPV0.5 and RMPV1.0 for the first event, including from 600- to 400-hPa PV value (0.8 to 1.2 PVU in average) and the slight low-level convergence (Figure 12a–c). The second critical event in CTRL, RMPV0.5 and RMPV1.0, is similar in occurrence time and magnitude. However, the following third event is delayed in RMPV0.5 and RMPV1.0. For example, the low-level PV reaches 1.2 PVU at 1200 UTC 31 August (+12 h) in CTRL, about 24 h after the second event (−12 h). On the other hand, the low-level PV reaches 1.2 PVU at 0000 UTC 01 September (+24 h) in RMPV0.5, 12 h later than CTRL. Similarly, the third event is also delayed in RMPV1.0, and the low-level PV has remained below 1.2 PVU to the end of the simulation, comparable with the increasing rate of low-level vorticity (Figure 10) and the value of the system’s high-level potential temperature (Figure 11), which are much larger in CTRL than in RMPV0.5 and in RMPV1.0. As for the results of RMPV1.5, three events are considerably different from CTRL in further weakened magnitude and delayed timing of low-level convergence, mid-level vertical motion and PV (Figure 12d). This result indicates that the absence of the initial mid-level vortex would greatly impact the beginning condition for upward motion or convection and result in a poorer incipient vortex, consistent with the evolution of vertical motion and high-level potential temperature in Figure 11.
The first event remains unchanged in all simulations even though the quasi-balanced momentum and mass fields inverted by the mid-level PV anomaly were removed in the initial field. The results also show that while the low-pressure system crossed the Taiwan Strait, convection systems developed near the low-level system’s center in most experiments (the second event). Despite the increasing changes of upward motion with experiments in group CTRL to RMPV1.0 (Figure 11) at an earlier stage, the evolution of the incipient vortex in each simulation still has a significant declining trend of intensification from low-level to high-level when the more initial mid-level vortex component was removed (the third event).
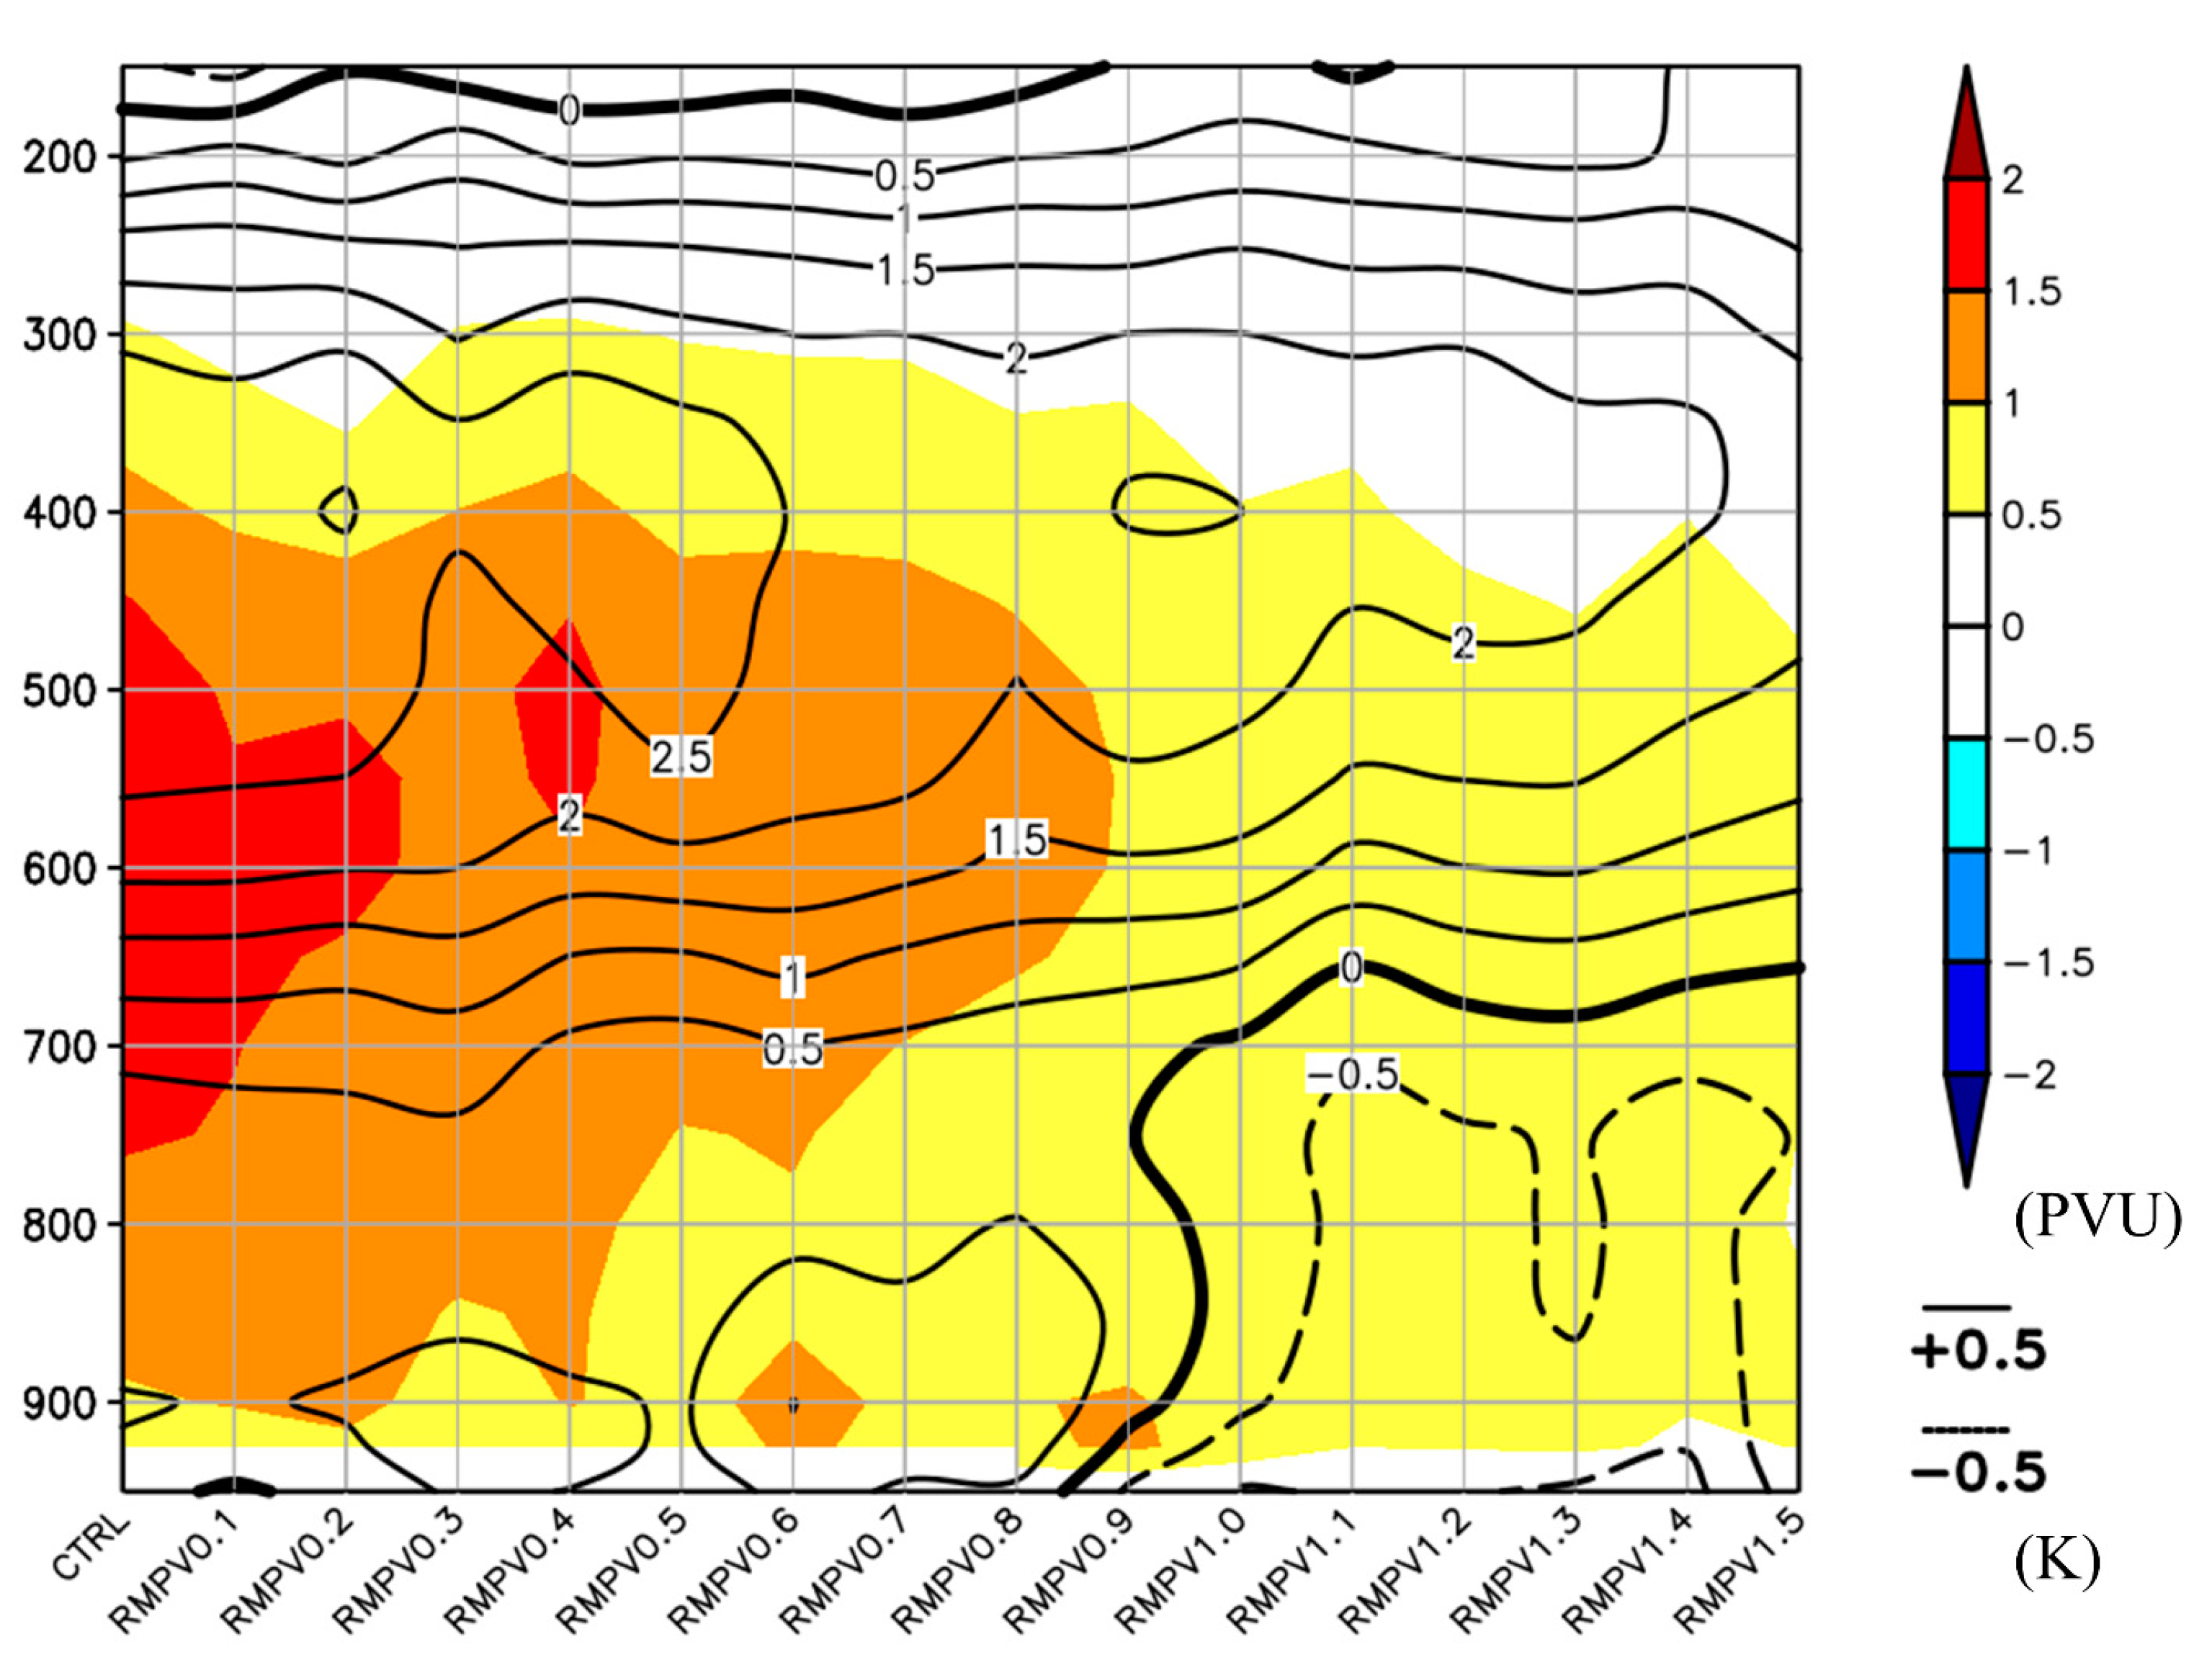
The vertical profile of PV and potential temperature anomaly compared to the ambient mean field at 0000 UTC 01 September (+24 h) are illustrated in Figure 13. The maximum changes in PV and potential temperature among all experiments are at a level from 700- to 500-hPa, and from 500- to 300-hPa, respectively. In CTRL, PV perturbation’s value is above 1.5 PVU, and potential temperature perturbation’s value is above 2.5 K, but with a much weaker structure in RMPV1.5. Thus, the resulted PV, and high-level warm-core structure would be correlated to the intensity of the initial mid-level vortex.
Although there are still some variations among all simulations, the overall results indicate that the mid-level vortex would more likely provide a favorable environment to create a high-level warm-core structure that helps intensify the low-level vortex more efficiently. In other words, a small difference in the mid-level PV will lead to a huge change in the third event. Furthermore, the impacts on the system are almost consistent in all the RMPVs experiments.

5. Discussion and Conclusions

5.1. Discussion

Two theories about the TC formation in mesoscale have been debated for a long time. From aircraft observation data and improvement in model simulations, we could obtain better insight into the convective scale process and realize that the low-level vorticity is more effectively gained from the low-level convergence and diabatic heating [18,19,20,23,28,62] rather than from the advection or extension of the mid-level vortex [22,25,26]. It is apparent to find a similar relationship between the low-level spin-up and convection bursts corresponding to previous studies. Moreover, the mid-level vortex also facilitates the aggregation of low-level vorticity generated by deep convection and the coupling and axisymmetrization of the incipient vortex to intensify to a TC. Thus, the enhancement of mid-level vortex is likely to increase the probability of TC formation [19,20,62].
In most previous studies, instead of playing an essential role in TC formation, the mid-level vortex generally features an auxiliary part to provide a favorable environment for convection and systematic enhancement. Our simulation results partly agree with this. Due to the limitation of the simulation’s length, we cannot exclude any possibility of low-level systems turning out to be a TC in all RMPV simulations, especially after they have crossed Taiwan. However, these results also highlight another finding that there is a limited chance for the convection burst to occur in the Taiwan Strait after the mid-level vortex has been weakened.
Furthermore, the results show a non-significant relationship between convective intensity and the development of the incipient vortex at smaller scales, which agrees with the results of Leppert et al. (2013) [63], Zawislak and Zipser (2014) [64], and Wang (2018) [65]. In our sensitivity simulation, there is no significant relation between the concentration of convections closer to the system center and the formation of Toraji. The main difference comes from the mid-level vortex’s intensity, which would result in a greater high-level warm core structure and cause stronger vertical mass flux. It is more likely for the system to maintain the warm-core structure with stronger mid-level vortex. However, the change in the heating efficiency of convection bursts (e.g., Refs. [66,67]) associated with different mid-level vortex structures is not explored in this study. It deserves further study, especially for TC formation with an asymmetric structure.

5.2. Conclusions

In this study, observation in situ data, analysis data, radar reflectivity, and dual-Doppler wind field data are applied to diagnose the process of Toraji formation. Model simulation and sensitivity experiments have also been conducted to examine the mesoscale processes and the impact of removing the mid-level vortex on Toraji formation.
Analyses of observational data, reanalysis data, and simulation (CTRL) clearly show the decoupling of Kong-Rey’s mid-level and low-level vortex, the former TC that dissipated in the East China Sea. The mid-level vortex had remained in the region from the Taiwan Strait to China until a mid-latitude trough moved eastward, associated with the low-level northeasterly and convergence on the shear line. The most significant contribution to low-level positive vorticity anomalies came from the 700- to 500-hPa PV anomaly before −24 h. After that, one major convection burst occurred (from −24 to 0 h) close to the center of the incipient vortex, while the entirety was crossing the northern Taiwan Strait. The pre-Toraji system then moved eastward and became a well-reorganized and self-sustainable TC in the east of Taiwan. In summary, the preliminary analyses show that the mid-level vortex that originated from the former TC Kong-Rey might play a certain role on Toraji formation.
A systematic RMPV sensitivity experiment has shown a significant declining trend in the intensity of the incipient vortex after removing the mid-level vortex by gradually increasing factors. In addition, each experiment has consistent changes in the magnitude and rate of development of the system’s vertical structure, indicating the importance of mid-level vortex to low-level vorticity enhancement. The thermo-dynamical conditions for convection worsen in the 2° circular areal average analyses, which illustrate an unfavorable environment for TC formation when the mid-level vortex is weaker. In other words, the results in this study demonstrate that the mid-level vortex served as a critical role in determining Toraji formation timing due to the decline of the effect of convection bursts after weakening the mid-level vortex, causing the weaker simulated low-level disturbance. Thus, the mid-level vortex plays a crucial role in the process of Toraji formation, while the pre-Toraji disturbance crosses to the Taiwan Strait.
Toraji is a rare case. Its formation process is impacted by the former TC Kong-Rey and occurs close to the terrain. It provides a good opportunity to understand the contribution of the remaining mid-level vortex to the TC formation through direct radar observations and model simulations. Therefore, although this is just a case study, we can still learn some TC formation physics from the results and expand our knowledge on TC formation. The conclusions can be a key reference for similar cases in the future and for quantifying the importance of mid-level dynamics to convection burst and TC formation.

Author Contributions

Conceptualization: All authors. Formal analysis: C.-H.C. Methodology: C.-H.C., Y.-H.H. and P.-Y.L. Funding acquisition: H.-F.T. and C.-S.L. Supervision: C.-S.L. Visualization: C.-H.C., Y.-H.H. and H.-F.T. Writing—original draft: C.-H.C. Writing—review, editing, and response: All authors. Parts of this work were conducted by C.-H.C. and P.-Y.L. during their master degree studies. All authors have read and agreed to the published version of the manuscript.

Funding

This study and the article processing charge are supported by the Ministry of Science and Technology of the Republic of China (Taiwan) under grants 109-2111-M-002-006, 109-2625-M-002-024, 110-2625-M-002-004, and 110-2111-M-002-006-MY2. The National Center for Atmospheric Research is sponsored by the National Science Foundation.

Institutional Review Board Statement

Not applicable.

Informed Consent Statement

Not applicable.

Data Availability Statement

The radar data and CWB TC track data used in this study can be derived by formal application from the website of the Central Weather Bureau, i.e., https://www.cwb.gov.tw/V8/C/ (accessed on 13 September 2014). The JMA best-track data are available on the website of Japan Meteorological Agency, i.e., https://www.jma.go.jp/jma/index.html (accessed on 11 October 2014). The ECMWF ERA-Interim Reanalysis data can be found from the website of European Centre for Medium-Range Weather Forecasts, i.e., https://www.ecmwf.int/ (accessed on 22 December 2014). The WRF package can be downloaded from WRF Model Users’ Page, i.e., https://www2.mmm.ucar.edu/wrf/users/ (accessed on 2 February 2015).

Acknowledgments

The authors thank three anonymous reviewers who provided constructive comments for this paper.

Conflicts of Interest

The authors declare no conflict of interest.

Appendix A

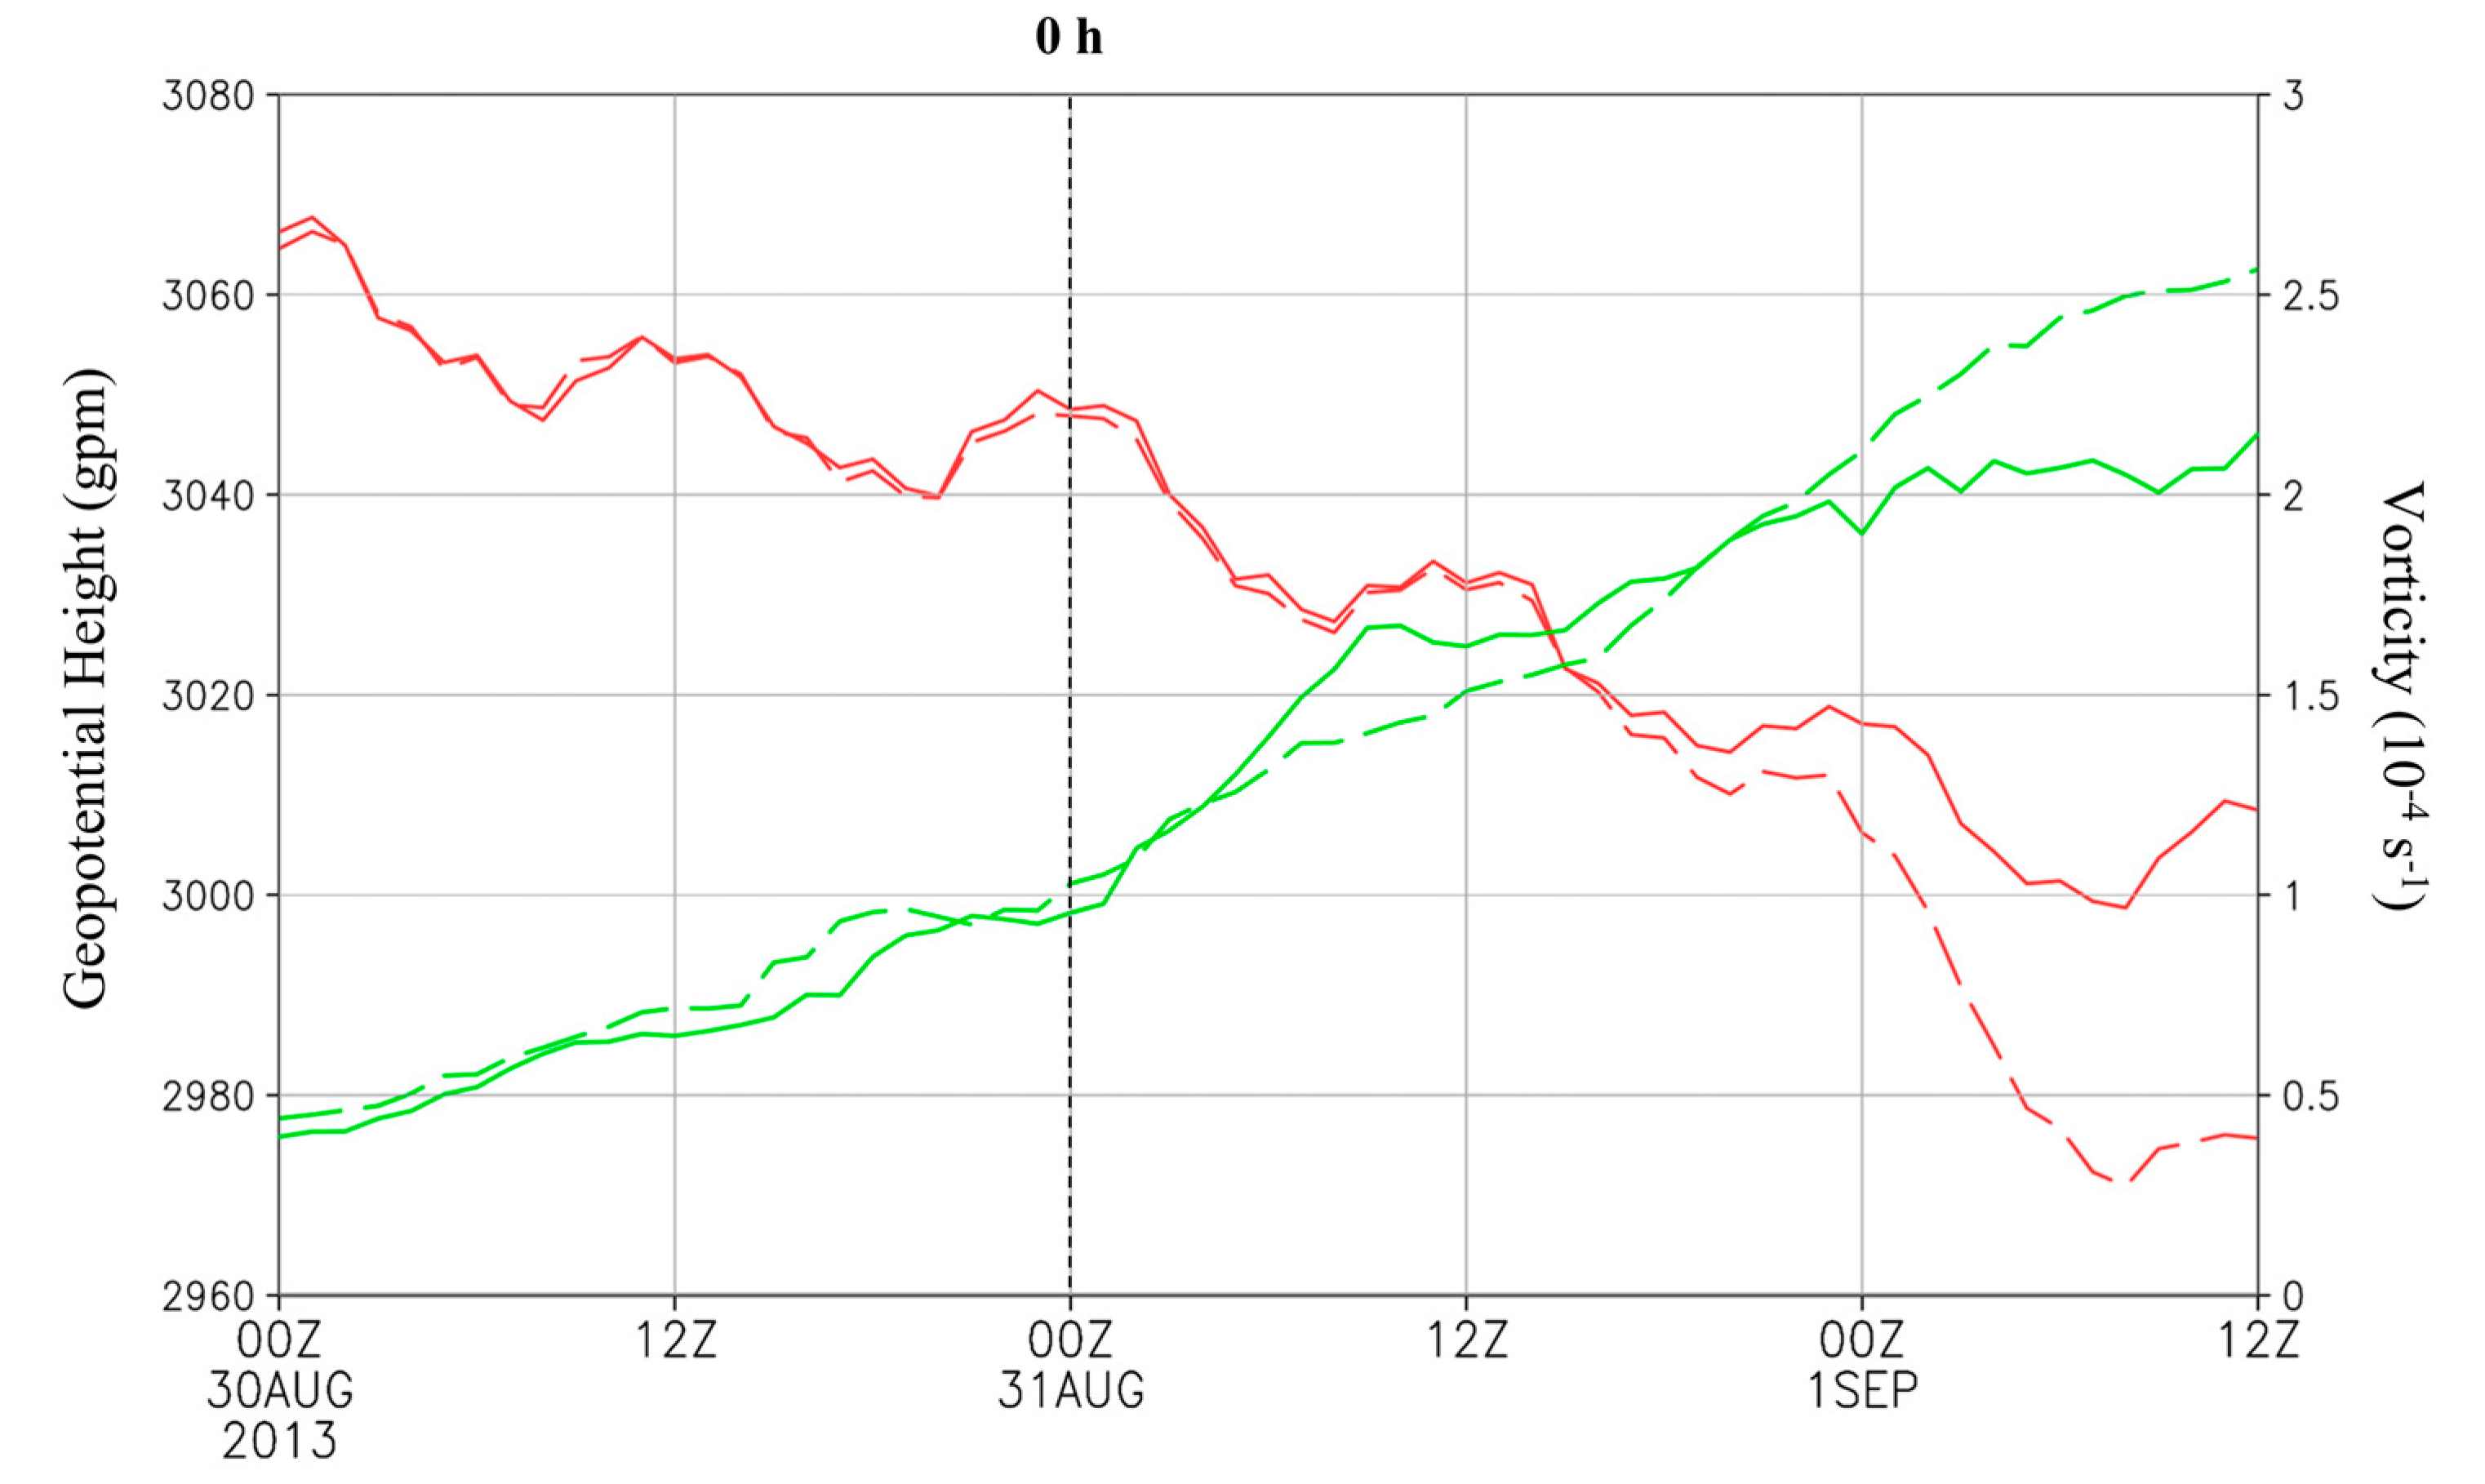
To figure out whether the mountainous terrain of Taiwan would play a crucial role in Toraji formation through the enhancement of the vertical motion or the interaction with the mid-level vortex, an additional experiment (RMTW) that changed Taiwan’s terrain into aqua-plane (no surface friction and radiation flux) was conducted. Figure A1 shows the evolution of the low-level vorticity and geopotential. It is clear that the simulated intensity of low-level pressure becomes stronger after removing the factor of Taiwan’s terrain. In addition, the most significant differences between CTRL and RMTW started at about 1200 UTC 31 August (+12 h) when the low-level vortex made landfall in Taiwan. Before that time, the differences between CTRL and RMTW were indistinguishable. This indicates that the topographic effects are not critical to the intensification of the low-level circulation. In summary, although the convection systems and vertical velocity are enhanced on the west side of Taiwan’s terrain in most experiments (Figure 9), the role of Taiwan’s terrain is supposed to be an unfavorable factor against the formation of Toraji (Figure A1).
Figure A1. Time series of simulated 700-hPa geopotential height (red line; left-axis; gpm) and low-level vorticity averaged over a 2-deg radius from 925 hPa to 700 hPa (green line; right-axis; 10−4 s−1) for CTRL (solid line) and RMTW (long dash). The disturbance center uses the 700-hPa circulation center.
Atmosphere 14 00709 g0a1

References

  1. Lee, C.S. Observational analysis of tropical cyclogenesis in the western North Pacific. Part I: Structural Evolution of Cloud Clusters. J. Atmos. Sci. 1989, 46, 2580–2598. [Google Scholar] [CrossRef]
  2. Lee, C.S. Observational analysis of tropical cyclogenesis in the western North Pacific. Part II: Budget analysis. J. Atmos. Sci. 1989, 46, 2599–2616. [Google Scholar] [CrossRef]
  3. Lee, C.S.; Cheung, K.K.W.; Hui, J.S.N.; Elsberry, R.L. Mesoscale features associated with tropical cyclone formations in the western North Pacific. Mon. Weather Rev. 2008, 136, 2006–2022. [Google Scholar] [CrossRef]
  4. Gray, W.M. The formation of tropical cyclones. Meteorol. Atmos. Phys. 1998, 67, 37–69. [Google Scholar] [CrossRef]
  5. Teng, H.F.; Lee, C.S.; Hsu, H.H. Influence of ENSO on Formation of Tropical Cloud Clusters and their Development into Tropical Cyclones in the Western North Pacific. Geophys. Res. Lett. 2014, 41, 9120–9126. [Google Scholar] [CrossRef]
  6. Teng, H.F.; Lee, C.S.; Hsu, H.H.; Done, J.M.; Holland, G.J. Tropical Cloud Cluster Environments and Their Importance for Tropical Cyclone Formation. J. Clim. 2019, 32, 4069–4088. [Google Scholar] [CrossRef]
  7. Ritchie, E.A.; Holland, G.J. Large-scale patterns associated with tropical cyclogenesis in the western Pacific. Mon. Weather Rev. 1999, 127, 2027–2043. [Google Scholar] [CrossRef]
  8. Lee, C.S.; Lin, Y.L.; Cheung, K.K.W. Tropical cyclone formations in the South China Sea associated with the mei-yu front. Mon. Weather Rev. 2006, 134, 2670–2687. [Google Scholar] [CrossRef]
  9. Dunkerton, T.J.; Montgomery, M.T.; Wang, Z. Tropical cyclogenesis in a tropical wave critical layer: Easterly waves. Atmos. Chem. Phys. 2009, 9, 5587–5646. [Google Scholar] [CrossRef] [Green Version]
  10. Chang, L.Y.; Cheung, K.K.; Lee, C.S. The Role of Trade Wind Surges in Tropical Cyclone Formations in the Western North Pacific. Mon. Weather Rev. 2010, 138, 4120–4134. [Google Scholar] [CrossRef] [Green Version]
  11. Yoshida, R.; Ishikawa, H. Environmental Factors Contributing to Tropical Cyclone Genesis over the Western North Pacific. Mon. Weather Rev. 2013, 141, 451–467. [Google Scholar] [CrossRef]
  12. Fudeyasu, H.; Yoshida, R.; Yamaguchi, M.; Eito, H.; Muroi, C.; Nishimura, S.; Bessho, K.; Oikawa, Y.; Koide, N. Development Conditions for Tropical Storms over the Western North Pacific Stratified by Large-Scale Flow Patterns. J. Meteor. Soc. Japan 2020, 98, 61–72. [Google Scholar] [CrossRef] [Green Version]
  13. Fu, B.; Peng, M.S.; Li, T.; Stevens, D.E. Developing versus nondeveloping disturbances for tropical cyclone formation. Part II: Western North Pacific. Mon. Weather Rev. 2012, 140, 1067–1080. [Google Scholar] [CrossRef] [Green Version]
  14. Peng, M.S.; Fu, B.; Li, T.; Stevens, D.E. Developing versus Nondeveloping Disturbances for Tropical Cyclone Formation. Part I: North Atlantic. Mon. Weather Rev. 2012, 140, 1047–1066. [Google Scholar] [CrossRef] [Green Version]
  15. Yoshida, R.; Fudeyasu, H. How Significant are Low-Level Flow Patterns in Tropical Cyclone Genesis over the Western North Pacific? Mon. Weather Rev. 2020, 148, 559–576. [Google Scholar] [CrossRef]
  16. Teng, H.F.; Kuo, Y.H.; Done, J.M. Importance of Midlevel Moisture for Tropical Cyclone Formation in Easterly and Monsoon Environments over the Western North Pacific. Mon. Weather Rev. 2021, 149, 2449–2469. [Google Scholar]
  17. Zehr, R.M. Tropical Cyclogenesis in the Western North Pacific; NOAA Technical Report NESDIS 61; 1992; p. 181. Available online: https://repository.library.noaa.gov/view/noaa/13116/noaa_13116_DS1.pdf (accessed on 3 March 2012).
  18. Hendricks, E.A.; Montgomery, M.T.; Davis, C.A. The role of “vortical” hot towers in the formation of tropical cyclone Diana (1984). J. Atmos. Sci. 2004, 61, 1209–1232. [Google Scholar] [CrossRef]
  19. Montgomery, M.T.; Nicholls, M.E.; Cram, T.A.; Saunders, A.B. A Vortical Hot Tower Route to Tropical Cyclogenesis. J. Atmos. Sci. 2006, 63, 355–386. [Google Scholar] [CrossRef] [Green Version]
  20. Houze, R.A., Jr.; Lee, W.; Mell, M.M. Convective contribution to the genesis of Hurricane Ophelia (2005). Mon. Weather Rev. 2009, 137, 2778–2800. [Google Scholar] [CrossRef]
  21. McBride, J.L.; Zehr, R. Observational Analysis of Tropical Cyclone Formation. Part II: Comparison of Non-Developing versus Developing Systems. J. Atmos. Sci. 1981, 38, 1132–1151. [Google Scholar] [CrossRef]
  22. Ritchie, E.A.; Holland, G.J. Scale interactions during the formation of Typhoon Irving. Mon. Weather Rev. 1997, 125, 1377–1396. [Google Scholar] [CrossRef]
  23. Raymond, D.J.; López Carrillo, C. The vorticity budget of developing typhoon Nuri (2008). Atmos. Chem. Phys. 2011, 11, 147–163. [Google Scholar] [CrossRef] [Green Version]
  24. Davis, C.A. The Formation of Moist Vortices and Tropical Cyclones in Idealized Simulations. J. Atmos. Sci. 2015, 72, 3499–3516. [Google Scholar] [CrossRef]
  25. Simpson, J.; Ritchie, E.; Holland, G.J.; Halverson, J.; Stewart, S. Mesoscale interactions in tropical cyclone genesis. Mon. Weather Rev. 1997, 125, 2643–2661. [Google Scholar] [CrossRef]
  26. Bister, M.; Emanuel, K.A. The genesis of Hurricane Guillermo: TEXMEX analyses and a modeling study. Mon. Weather Rev. 1997, 125, 2662–2682. [Google Scholar] [CrossRef]
  27. Houze, R.A., Jr. Stratiform precipitation in regions of convection: A meteorological paradox? Bull. Am. Meteor. Soc. 1997, 78, 2179–2196. [Google Scholar] [CrossRef]
  28. Wang, Z.; Montgomery, M.T.; Dunkerton, T.J. Genesis of Pre–Hurricane Felix (2007). Part I: The Role of the Easterly Wave Critical Layer. J. Atmos. Sci. 2010, 67, 1711–1729. [Google Scholar] [CrossRef] [Green Version]
  29. Wang, Z.; Montgomery, M.T.; Dunkerton, T.J. Genesis of Pre–Hurricane Felix (2007). Part II: Warm Core Formation, Precipitation Evolution, and Predictability. J. Atmos. Sci. 2010, 67, 1730–1744. [Google Scholar] [CrossRef] [Green Version]
  30. Wang, Z. Thermodynamic aspects of tropical cyclone formation. J. Atmos. Sci. 2012, 69, 2433–2451. [Google Scholar] [CrossRef]
  31. Hsieh, Y.H.; Lee, C.S.; Sui, C.H. A Study on the Influences of Low-Frequency Vorticity on Tropical Cyclone Formation in the Western North Pacific. Mon. Weather Rev. 2017, 145, 4151–4169. [Google Scholar] [CrossRef]
  32. Hsieh, Y.H.; Lee, C.S.; Teng, H.F. The Characteristics of Tropical Cyclone Formation in an Environment with Large Low-Level Low-Frequency (more than 10 days) Vorticity in the Western North Pacific. Mon. Weather Rev. 2020, 148, 4101–4116. [Google Scholar] [CrossRef]
  33. Teng, H.F.; Done, J.M.; Lee, C.S.; Hsu, H.H.; Kuo, Y.H. Large-Scale Environmental Influences on Tropical Cyclone Formation Processes and Development Time. J. Clim. 2020, 33, 9763–9782. [Google Scholar] [CrossRef]
  34. Liu, J.W. A Case Study of Tropical Cyclone Formation near Taiwan: Toraji (2013). Master’s Thesis, National Taiwan University, Taipei, Taiwan, 2016. [Google Scholar]
  35. Lee, C.S.; Jao, H.C.; Hsieh, Y.H. A Study on the Heavy Rainfall Event Occurred in the Southwestern Taiwan when Typhoon Kong-Rey (2013) was Affecting Taiwan. Atmos. Sci. 2018, 46, 149–171, In Chinese with English Abstract. [Google Scholar]
  36. Wang, C.C.; Chen, Y.H.; Li, M.C.; Kuo, H.C.; Tsuboki, K. On the separation of upper and low-level centres of tropical storm Kong-Rey (2013) near Taiwan in association with asymmetric latent heating. Q. J. R. Meteorol. Soc. 2021, 147, 1135–1149. [Google Scholar] [CrossRef]
  37. Fudeyasu, H.; Hirose, S.; Yoshioka, H.; Kumazawa, R.; Yamasaki, S. A Global View of the Landfall Characteristics of Tropical Cyclones. Trop. Cyclone Res. Rev. 2014, 3, 178–192. [Google Scholar]
  38. Fudeyasu, H.; Yoshida, R. Western North Pacific Tropical Cyclone Characteristics Stratified by Genesis Environment. Mon. Weather Rev. 2018, 146, 435–446. [Google Scholar] [CrossRef]
  39. Teng, H.F.; Done, J.M.; Kuo, Y.H. Landfalling tropical cyclone characteristics and their multi-timescale variability connected to monsoon and easterly formation environments over the western North Pacific. Q. J. R. Meteorol. Soc. 2021, 147, 2953–2977. [Google Scholar] [CrossRef]
  40. Elsberry, R.L.; Tsai, H.-C.; Capalbo, C.; Chin, W.-C.; Marchok, T.P. Critical Pre-Formation Decision Flowchart to Apply Tropical Cyclone Lifecycle Predictions in Eastern North Pacific. Atmosphere 2023, 14, 616. [Google Scholar] [CrossRef]
  41. Hennon, C.C.; Hobgood, J.S. Forecasting Tropical Cyclogenesis over the Atlantic Basin Using Large-Scale Data. Mon. Weather Rev. 2003, 131, 2927–2940. [Google Scholar] [CrossRef]
  42. Matsuoka, D.; Nakano, M.; Sugiyama, D.; Uchida, S. Deep learning approach for detecting tropical cyclones and their precursors in the simulation by a cloud-resolving global nonhydrostatic atmospheric model. Prog. Earth Planet. Sci. 2018, 5, 80. [Google Scholar] [CrossRef] [Green Version]
  43. Bloemendaal, N.; Moel, H.D.; Jantsje, M.M.; Bosma, P.R.M.; Polen, A.N.; Collins, J.M. Adequately reflecting the severity of tropical cyclones using the new Tropical Cyclone Severity Scale. Environ. Res. Lett. 2021, 16, 14048. [Google Scholar] [CrossRef]
  44. Fang, W.; Guo, C.; Han, Y.; Qing, R. Impact of Tropical Cyclone Avoidance on Fishing Vessel Activity over Coastal China Based on Automatic Identification System Data during 2013–2018. Int. J. Disaster Risk Sci. 2022, 13, 561–576. [Google Scholar] [CrossRef]
  45. Li, Q.; Jia, H.; Qiu, Q.; Lu, Y.; Zhang, J.; Mao, J.; Fan, W.; Huang, M. Typhoon-Induced Fragility Analysis of Transmission Tower in Ningbo Area Considering the Effect of Long-Term Corrosion. Appl. Sci. 2022, 12, 4774. [Google Scholar] [CrossRef]
  46. Chang, P.L.; Lin, P.F.; Jou, B.J.D.; Zhang, J. An Application of Reflectivity Climatology in Constructing Radar Hybrid Scans over Complex Terrain. J. Atmos. Ocean. Technol. 2009, 26, 1315–1327. [Google Scholar] [CrossRef]
  47. Davis, C.A.; Emanuel, K.A. Potential vorticity diagnostics of cyclogenesis. Mon. Weather Rev. 1991, 119, 1929–1953. [Google Scholar] [CrossRef]
  48. Davis, C.A. Piecewise potential vorticity inversion. J. Atmos. Sci. 1992, 49, 1397–1411. [Google Scholar] [CrossRef]
  49. Davis, C.A. A potential-vorticity diagnosis of the importance of initial structure and condensational heating in observed extratropical cyclogenesis. Mon. Weather Rev. 1992, 120, 2409–2428. [Google Scholar] [CrossRef]
  50. Wu, C.C.; Emanuel, K.A. Potential vorticity diagnostics of hurricane movement. Part I: A case study of Hurricane Bob (1991). Mon. Weather Rev. 1995, 123, 69–92. [Google Scholar] [CrossRef]
  51. Wu, C.C.; Emanuel, K.A. Potential vorticity diagnostics of hurricane movement. Part II: Tropical Storm Ana (1991) and Hurricane Andrew (1992). Mon. Weather Rev. 1995, 123, 93–109. [Google Scholar] [CrossRef]
  52. Charney, J.G. The use of primitive equations of motion in numerical prediction. Tellus 1955, 7, 22–26. [Google Scholar] [CrossRef] [Green Version]
  53. Shapiro, L.J. The motion of Hurricane Gloria: A potential vorticity diagnosis. Mon. Weather Rev. 1996, 124, 1497–2508. [Google Scholar] [CrossRef]
  54. Wu, C.C.; Huang, T.S.; Chou, K.H. Potential vorticity diagnosis of the key factors affecting the motion of Typhoon Sinlaku (2002). Mon. Weather Rev. 2004, 132, 2084–2093. [Google Scholar] [CrossRef]
  55. Raymond, D.J. Nonlinear Balance and Potential-Vorticity Thinking at Large Rossby Number. Q. J. R. Meteorol. Soc. 1992, 118, 987–1015. [Google Scholar] [CrossRef]
  56. Skamarock, W.C.; Weisman, M.L. The Impact of Positive-Definite Moisture Transport on NWP Precipitation Forecasts. Mon. Weather Rev. 2009, 137, 488–494. [Google Scholar] [CrossRef] [Green Version]
  57. Kain, J.S.; Fritsch, J.M. Convective parameterization for mesoscale models: The Kain-Fritsch scheme. Represent. Cumulus Convect. Numer. Model. Am. Meteorol. Soc. 1993, 165–170. [Google Scholar] [CrossRef]
  58. Kessler, E. On the Distribution and Continuity of Water Substance in Atmospheric Circulations; American Meteorological Society: Boston, MA, USA, 1969; pp. 1–84. [Google Scholar]
  59. Hong, S.; Noh, Y.; Dudhia, J. A New Vertical Diffusion Package with an Explicit Treatment of Entrainment Processes. Mon. Weather Rev. 2006, 134, 2318–2341. [Google Scholar] [CrossRef] [Green Version]
  60. Mlawer, E.J.; Taubman, S.J.; Brown, P.D.; Iacono, M.J.; Clough, S.A. Radiative transfer for inhomogeneous atmospheres: RRTM, a validated correlated-k model for the longwave. J. Geophys. Res. Atmos. 1997, 102, 16663–16682. [Google Scholar] [CrossRef] [Green Version]
  61. Dudhia, J. Numerical study of convection observed during the winter monsoon experiment using a mesoscale two-dimensional model. J. Atmos. Sci. 1989, 46, 3077–3107. [Google Scholar] [CrossRef]
  62. Tory, K.J.; Montgomery, M.T. Internal Influences on Tropical Cyclone Formation. Proc. Sixth Int. Workshop on Tropical Cyclones, San Jose, Costa Rica, WMO, Topic 2.2. 2006. Available online: https://apps.dtic.mil/sti/pdfs/ADA594102.pdf (accessed on 31 May 2015).
  63. Leppert, K.D.; Cecil, D.J.; Petersen, W.A. Relation between tropical easterly waves, convection, and tropical cyclogenesis: A Lagrangian perspective. Mon. Weather Rev. 2013, 141, 2649–2668. [Google Scholar] [CrossRef]
  64. Zawislak, J.; Zipser, E.J. A multisatellite investigation of the convective properties of developing and nondeveloping tropical disturbances. Mon. Weather Rev. 2014, 142, 4624–4645. [Google Scholar] [CrossRef]
  65. Wang, Z. What is the Key Feature of Convection Leading up to Tropical Cyclone Formation? J. Atmos. Sci. 2018, 75, 1609–1629. [Google Scholar] [CrossRef]
  66. Schubert, W.H.; Hack, J.J. Inertial stability and tropical cyclone development. J. Atmos. Sci. 1982, 39, 1687–1697. [Google Scholar] [CrossRef]
  67. Hack, J.J.; Schubert, W.H. Nonlinear response of atmospheric vortices to heating by organized cumulus convection. J. Atmos. Sci. 1986, 43, 1559–1573. [Google Scholar] [CrossRef]
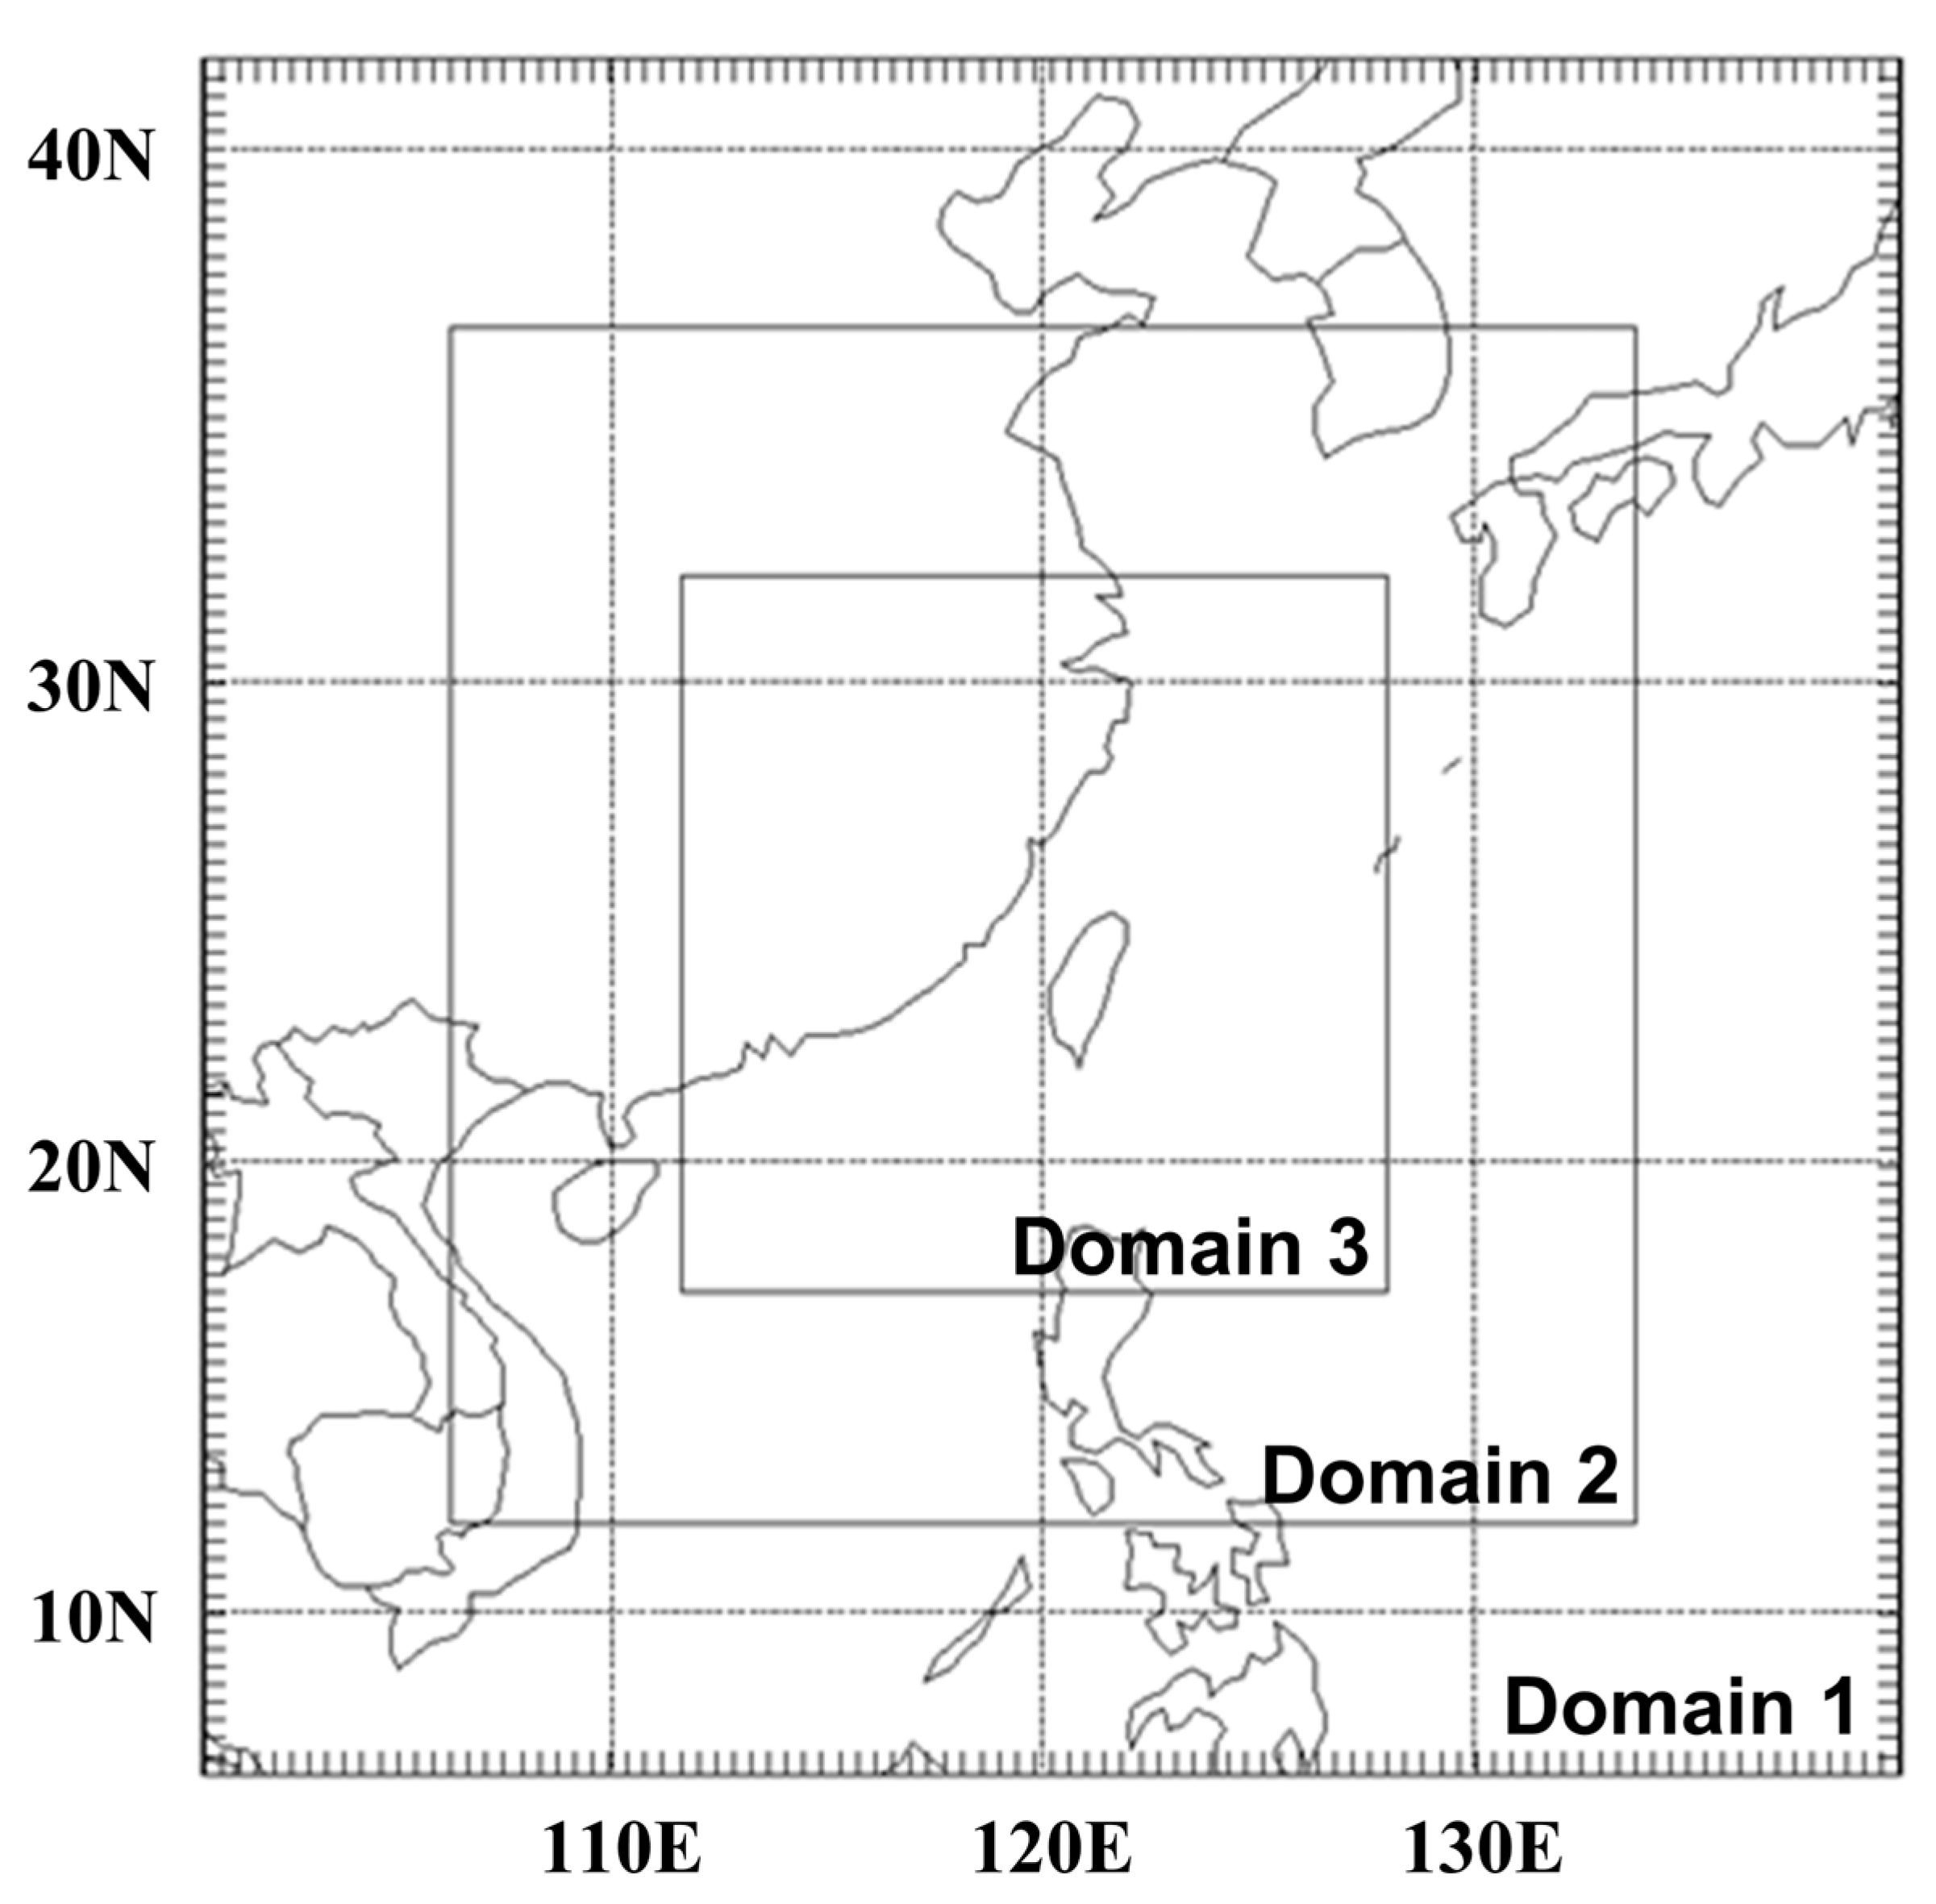
Figure 1. Nested model domain designs for WRF simulation.
Atmosphere 14 00709 g001
Figure 2. JMA Best Track of Kong-Rey (green curve) and Toraji (blue curve).
Atmosphere 14 00709 g002
Figure 3. (ad) 925-hPa and (eh) 500-hPa relative vorticity (shading; 10−4 s−1), wind fields, and geopotential height (contours; gpm) in ERA-Interim reanalysis data at (a,e) 0000 UTC 29, (b,f) 0000 UTC 30, (c,g) 0000 UTC 31 and (d,h) 1200 UTC 31 August 2013.
Atmosphere 14 00709 g003
Figure 4. Radar reflectivity (shading; dBZ) and dual-Doppler wind (barbs; kts) on level (ad) 1–2 km and (eh) 3–6 km, at (a,e) 0000 UTC 29 August, (b,f) 0000 UTC 30 August, (c,g) 0000 UTC 31 August, (d,h) 1200 UTC 31 August. The blue tracks indicate the center of (ad) low-level and (eh) mid-level vortex center according to the CWB observation (cyan curves and signs) and the dual-Doppler wind (blue curves & magenta signs) (1–2 km averaged wind for low-level vortex; 3–6 km averaged wind for mid-level vortex). Square signs denote 0000 UTC 29 August; diamond signs denote 0000 UTC 31 August; triangle signs denote 0600 UTC 31 August; circle signs denote 1200 UTC 31 August; reversed triangle signs denote 1800 UTC 31 August; cross signs denote 1-h time interval.
Atmosphere 14 00709 g004
Figure 5. Time series of the area-averaged 850 hPa relative vorticity (averaging over 118° E to 121° E, 23.5° N to 26.5° N) on ECMWF ERA-Interim data (black line) and those inverted by the PV anomalies of LB (green line), LA (blue line), MA (red line), UA (yellow line) and bot–top (purple line), respectively.
Atmosphere 14 00709 g005
Figure 6. Simulated maximum reflectivity (shading; dBZ) and (ac) 925 hPa, (df) 500 hPa wind (barbs; kts) in CTRL at (a,d) 0000 UTC 30 August 2013, (b,e) 0000 UTC 31 August 2013, and (c,f) 1200 UTC 31 August 2013.
Atmosphere 14 00709 g006
Figure 7. Time-height section of relative vorticity (shading; 10−4 s−1) and geopotential height anomaly (contour; gpm), relative to the areal average over 110° E to 130° E, 15° N to 35° N, averaged over 118° E to 121° E, 23.5° N to 26.5° N of (a) ERA-Interim (6-h) and (b) CTRL (1-h).
Atmosphere 14 00709 g007
Figure 8. Initial field of 500 hPa vorticity (shading; 10−4 s−1) and wind vectors (arrows; m s−1) at 0600 UTC 29 August (−42 h) in (a) CTRL, (b) RMPV0.5, (c) RMPV1.0 and (d) RMPV1.5.
Atmosphere 14 00709 g008
Figure 9. Simulated maximum reflectivity (shading; dBZ), 700 hPa vertical velocity (contours start at −1 with intervals −0.5; Pa s−1) averaged from 0000 UTC 30 August (−24 h) to 1200 UTC 01 September (+36 h) and the 1-hourly track of 700 hPa vortex center (blue curves) in (a) CTRL, (b) RMPV0.1, (c) RMPV0.2, (d) RMPV0.3, (e) RMPV0.4, (f) RMPV0.5, (g) RMPV0.6, (h) RMPV0.7, (i) RMPV0.8, (j) RMPV0.9, (k) RMPV1.0, (l) RMPV1.1, (m) RMPV1.2, (n) RMPV1.3, (o) RMPV1.4 and (p) RMPV1.5. Triangle signs denote the center at 0000 UTC 31 August (0 h); diamond signs denote the center at 0000 UTC 1 September (+24 h); cross signs denote the center at 1200 UTC every day.
Atmosphere 14 00709 g009
Figure 10. Time series of low-level vorticity (averaged from 925 hPa to 700 hPa) (shading; 10−4 s−1) and sea-level pressure (contours; hPa) derived from each experiment averaged over a 2°-radius area centered at 700 hPa vortex center in every 1 h. Time ranges from 0000 UTC 30 August (−24 h) to 1200 UTC 1 September (+36 h).
Atmosphere 14 00709 g010
Figure 11. Time series of high-level potential temperature (averaged from 400 hPa to 300 hPa) (shading; K) and mid-level vertical velocity (averaged from 600 hPa to 400 hPa) (contours; Pa s−1) derived from each experiment averaged over a 2°-radius area centered at 700 hPa vortex center in every 1 h. Time ranges from 0000 UTC 30 August (−24 h) to 1200 UTC 1 September (+36 h).
Atmosphere 14 00709 g011
Figure 12. Time-height section of the divergence (shading; 10−5 s−1), vertical velocity (black contours; Pa s−1) and PV (green contours; PVU) averaged over a 2°-radius area centered at 700 hPa vortex center in every 1 h in (a) CTRL, (b) RMPV0.5, (c) RMPV1.0 and (d) RMPV1.5. The unit of the y-axis is hPa, and the time ranges from 0000 UTC 30 August (−24 h) to 1200 UTC 1 September (+36 h).
Atmosphere 14 00709 g012
Figure 13. Vertical profile of PV perturbation (shading; PVU) and potential temperature perturbation (contours; K) at 0000 UTC 01 September (+24 h). Both are derived from each experiment averaged over a 1.5°-radius area centered at 700 hPa vortex center compared to the areal average value over 115° E to 125° E, 20° N to 30° N.
Atmosphere 14 00709 g013
Disclaimer/Publisher’s Note: The statements, opinions and data contained in all publications are solely those of the individual author(s) and contributor(s) and not of MDPI and/or the editor(s). MDPI and/or the editor(s) disclaim responsibility for any injury to people or property resulting from any ideas, methods, instructions or products referred to in the content.