Article

Mechanics of Particle Motion in a Standing Wave Electric Curtain: A Numerical Study

1
Laboratoire de Génie Electrique, Université 8 Mai 1945, B.P. 401, Guelma 24000, Algeria
2
Institut Pprime, CNRS Université de Poitiers, ISAE-ENSMA, 86962 Poitiers, France
*
Author to whom correspondence should be addressed.
Atmosphere 2023, 14(4), 681; https://doi.org/10.3390/atmos14040681
Submission received: 16 February 2023 / Revised: 31 March 2023 / Accepted: 3 April 2023 / Published: 4 April 2023
(This article belongs to the Special Issue Electrostatics of Atmospheric Aerosols)

Abstract

:
Electrostatic curtains can be simple and yet efficient devices to manipulate micronized particles on flat surfaces. This paper aims to investigate the motion of a 60 µm dielectric particle on the surface of a standing-wave conveyor. The study is based on a numerical model that accounts for the many forces that could potentially influence the particle motion. For that purpose, a numerical calculation of electric field and particle movement was carried out. The particle position above the curtain surface is obtained by a resolution of the dynamic equations using the Runge–Kutta method. The electric field distribution in the space above the curtain is obtained by a finite element calculation of the Laplace equation. The simulation results demonstrated a net dependence of the particle trajectory and movement modes on applied voltage frequency. Overall, low frequencies, typically below 50 Hz, allow for higher levitation and better displacement of the particle over long distances. Conversely, higher frequencies significantly reduce levitation and displacement distance. Moreover, at higher frequencies (around 500 Hz), the particle can vibrate between electrodes without any displacement at all. It is then inferred that low frequency is needed to better carry particles using a standing-wave curtain.

1. Introduction

Over time, photovoltaic (PV) panels and solar concentrators lose their effectiveness due to soiling; a phenomenon that arises from the buildup of dust on the surface and inhibits light from reaching PV cells or reflecting mirrors. Such situations are more frequently seen in arid, dusty places, such as the Sahara. The traditional solution-based systems, such as washing and brushing, despite their efficiency, have drawbacks related primarily to power and water consumption. Therefore, an efficient and economical solution is required to eliminate pollution and clean up flat surfaces [1,2]. Recent studies have shown the potential of electric curtains or electrostatic conveyors (EC) to transport fine particles, but also their ability to clean solar panels [3]. Electrostatic devices are comprised of several parallel electrodes that are incorporated into a dielectric substance and connected to high-voltage power sources [4]. The created electric field can levitate and move the charged particles over the surface without any noticeable energy consumption or moving parts [5]. The ability to move small particles is globally due to the spatial distribution of the electric field, which in turn results from the time variations and phase shifting of the applied voltages. Masuda et al. [6,7,8] demonstrated this method for confining and transporting charged particles based on particle behaviors in the presence of an alternating non-uniform electrostatic field. After the classic concept of electric curtains, originally proposed by Tatom et al. [9], Masuda calculated the electric potential evolution on the surface of an electric curtain. He highlighted the existence of the sum of sine waves called spatial harmonics and showed that only the two first harmonics are effective and propagate in two opposite directions. Moreover, these harmonics could affect the particle trajectory in a three-phase system [10]. Depending on the number of applied AC voltage phases, the electric curtain can be of the single-phase type or the polyphase type. In the former, the electric potential distribution results in a pulsating wave formed by two opposite waves, whereas in the later type (polyphase), the electric potential results in a traveling wave along the surface of the curtain. This traveling wave concept is the electrostatic variant of the linear magnetic motor.
Based on the reported results by Masuda et al. [6,7,8,10,11] and Melcher et al. [12,13], many investigations have been performed to clarify the particle behavior. Schmidlin et al. [14] defined three typical particle transport modes in a traveling wave conveyor, which include “hopping mode”, “surfing mode”, and “curtain mode”. Kawamoto et al. [15,16,17] conducted a series of particle-directed transport experiments and summarized the velocity and direction of particles in the case of the tetra-phase curtain for different conditions. Kawamoto et al. [17] confirmed that the Coulomb force is the predominant force compared to other forces. The particle transport direction is not only dependent on the traveling wave direction, but also depends on the frequency of the traveling wave, the particle diameter, and the electric field. Horenstein et al. [18] analytically calculated the trajectory of a single particle by solving Laplace’s equation for the surface potential on a three-phase conveyor. The smaller particles followed the direction of the traveling wave smoothly, as expected, while certain larger particles moved chaotically and slowly in the direction of the impressed electrostatic potential surface wave. Zhang et al. [19] analytically calculated the electric field in the simulation of the levitation and transport of a particle in a traveling wave. They considered various forces acting on a small particle, including the Coulomb force, the dielectrophoretic force, the image force, the gravity and drag forces, as well as the adhesion force of van der Waals. Zhang et al. noticed the importance of the initial conditions on the particle trajectory. Gu et al. [20] looked into the influence of the key parameters on particle transport by an alternating four-phase traveling-wave electrostatic field. The investigation showed that in addition to frequency, voltage amplitude and the geometric characteristics have an impact on the direction of particle transport. The electric charge acquired by the PMMA spherical particles of 50 µm to 300 µm above a traveling wave conveyor was measured by Zouaghi and Zouzou [21]. According to the reported results, the particles had a specific charge-to-mass ratio (Q/m) of less than 0.01 C/g, and were primarily positively charged. The traveling wave electrostatic conveyor’s efficiency declines as particle size increases because of an increase in gravitational force [22]. A discrete element method for simulating particle motion in electric curtains was discussed and applied by Chesnutt et al. [23] to study particle motion induced by an upward traveling wave on an inclined electric curtain. The electrodes are powered by a four-phase rectangular AC voltage. The upward particle motion induced by the traveling wave is opposed by a downward gravitational motion. It has been found that larger particle sizes have a higher velocity until some critical size is reached where the gravitational force dominates and the particles fall back downward.
In comparison to the large number of studies on traveling waves on electric curtains, relatively little attention has been paid to particle motion in a standing-wave electric curtain. According to Hemstreet [24] the particle motion in a standing-wave curtain can be subjected to two movement modes. In one mode, the particle levitates above the surface and oscillates back and forth without leaving the curtain. In the second mode, a higher levitation of the particles is observed, which allows their transport in both directions by the standing wave. Further experiments on dust mitigation systems for space applications by Sims et al. [25] and Atten et al. [26] demonstrated the existence of active dust transport by the standing wave. Recently, Zouaghi et al. [21] compared the impact of spatial harmonic waves on dielectric particle displacement in standing and traveling wave electric fields. Using electrostatic standing wave, a detachable photovoltaic panel electrostatic cleaning device was developed by Kawamoto et al. [27,28] as retrofitting existing PV panels with transparent electrodes can be cost-prohibitive. The device includes parallel screen electrodes mounted on a plastic frame that applies a high AC voltage between upper and lower electrodes. Tests conducted in a PV plant in Doha, Qatar, showed that the device can effectively clean 80% of the dust when panels are tilted at an angle greater than 20°. Additionally, Altıntaş et al. [29] improved the shape of the electrodes in electrostatic cleaning systems, resulting in an increase in cleaning efficiency from 65% to 75%. Sun et al. [30] analyzed the mechanism of particle movement on a standing-wave electric curtain both by numerical simulation and experimental observation. The hopping and surfing modes during particle removal are shown to depend on the particle electric charge and its initial position. The charged particles are found to leap away from the tops of the electrodes with an intermittent burst of a half period. It is also shown that particles located in the gaps of the electrodes first move transversely toward the edges of the electrodes and then begin to leap up. A part of the particles can be trapped at the edges of the electrodes and this will affect the dust removal efficiency of the electric curtain technique. Despite the few cited studies on the standing wave, there is a need to carry out further investigation to identify the key factors influencing particles’ motion. Such results are so important for the development and expansion of the use of standing-wave electric curtains. Aside from the simple design of their electrodes, the standing-wave type has the advantage of using less high-voltage sources over a traveling wave curtain. Therefore, a standing-wave curtain could be a good choice if similar performance compared to traveling wave can be reached.
In this paper, a dielectric particle motion in a double-phase horizontal standing-wave curtain is numerically studied. The motion equations consider different electric and gravitational forces acting on the particle over the surface of the curtain. The main goal is the measure of the particle velocity and displacement distance and the focus on the influence of parameters such as frequency. The purpose behind this is to characterize the various modes of particles’ movement and investigate the effect of frequency on some movement characteristics, such as maximum levitation height, displacement distance, and maximum velocity, reached by the particles.

2. Numerical Model

2.1. Electric Field and Electric Potential Distribution

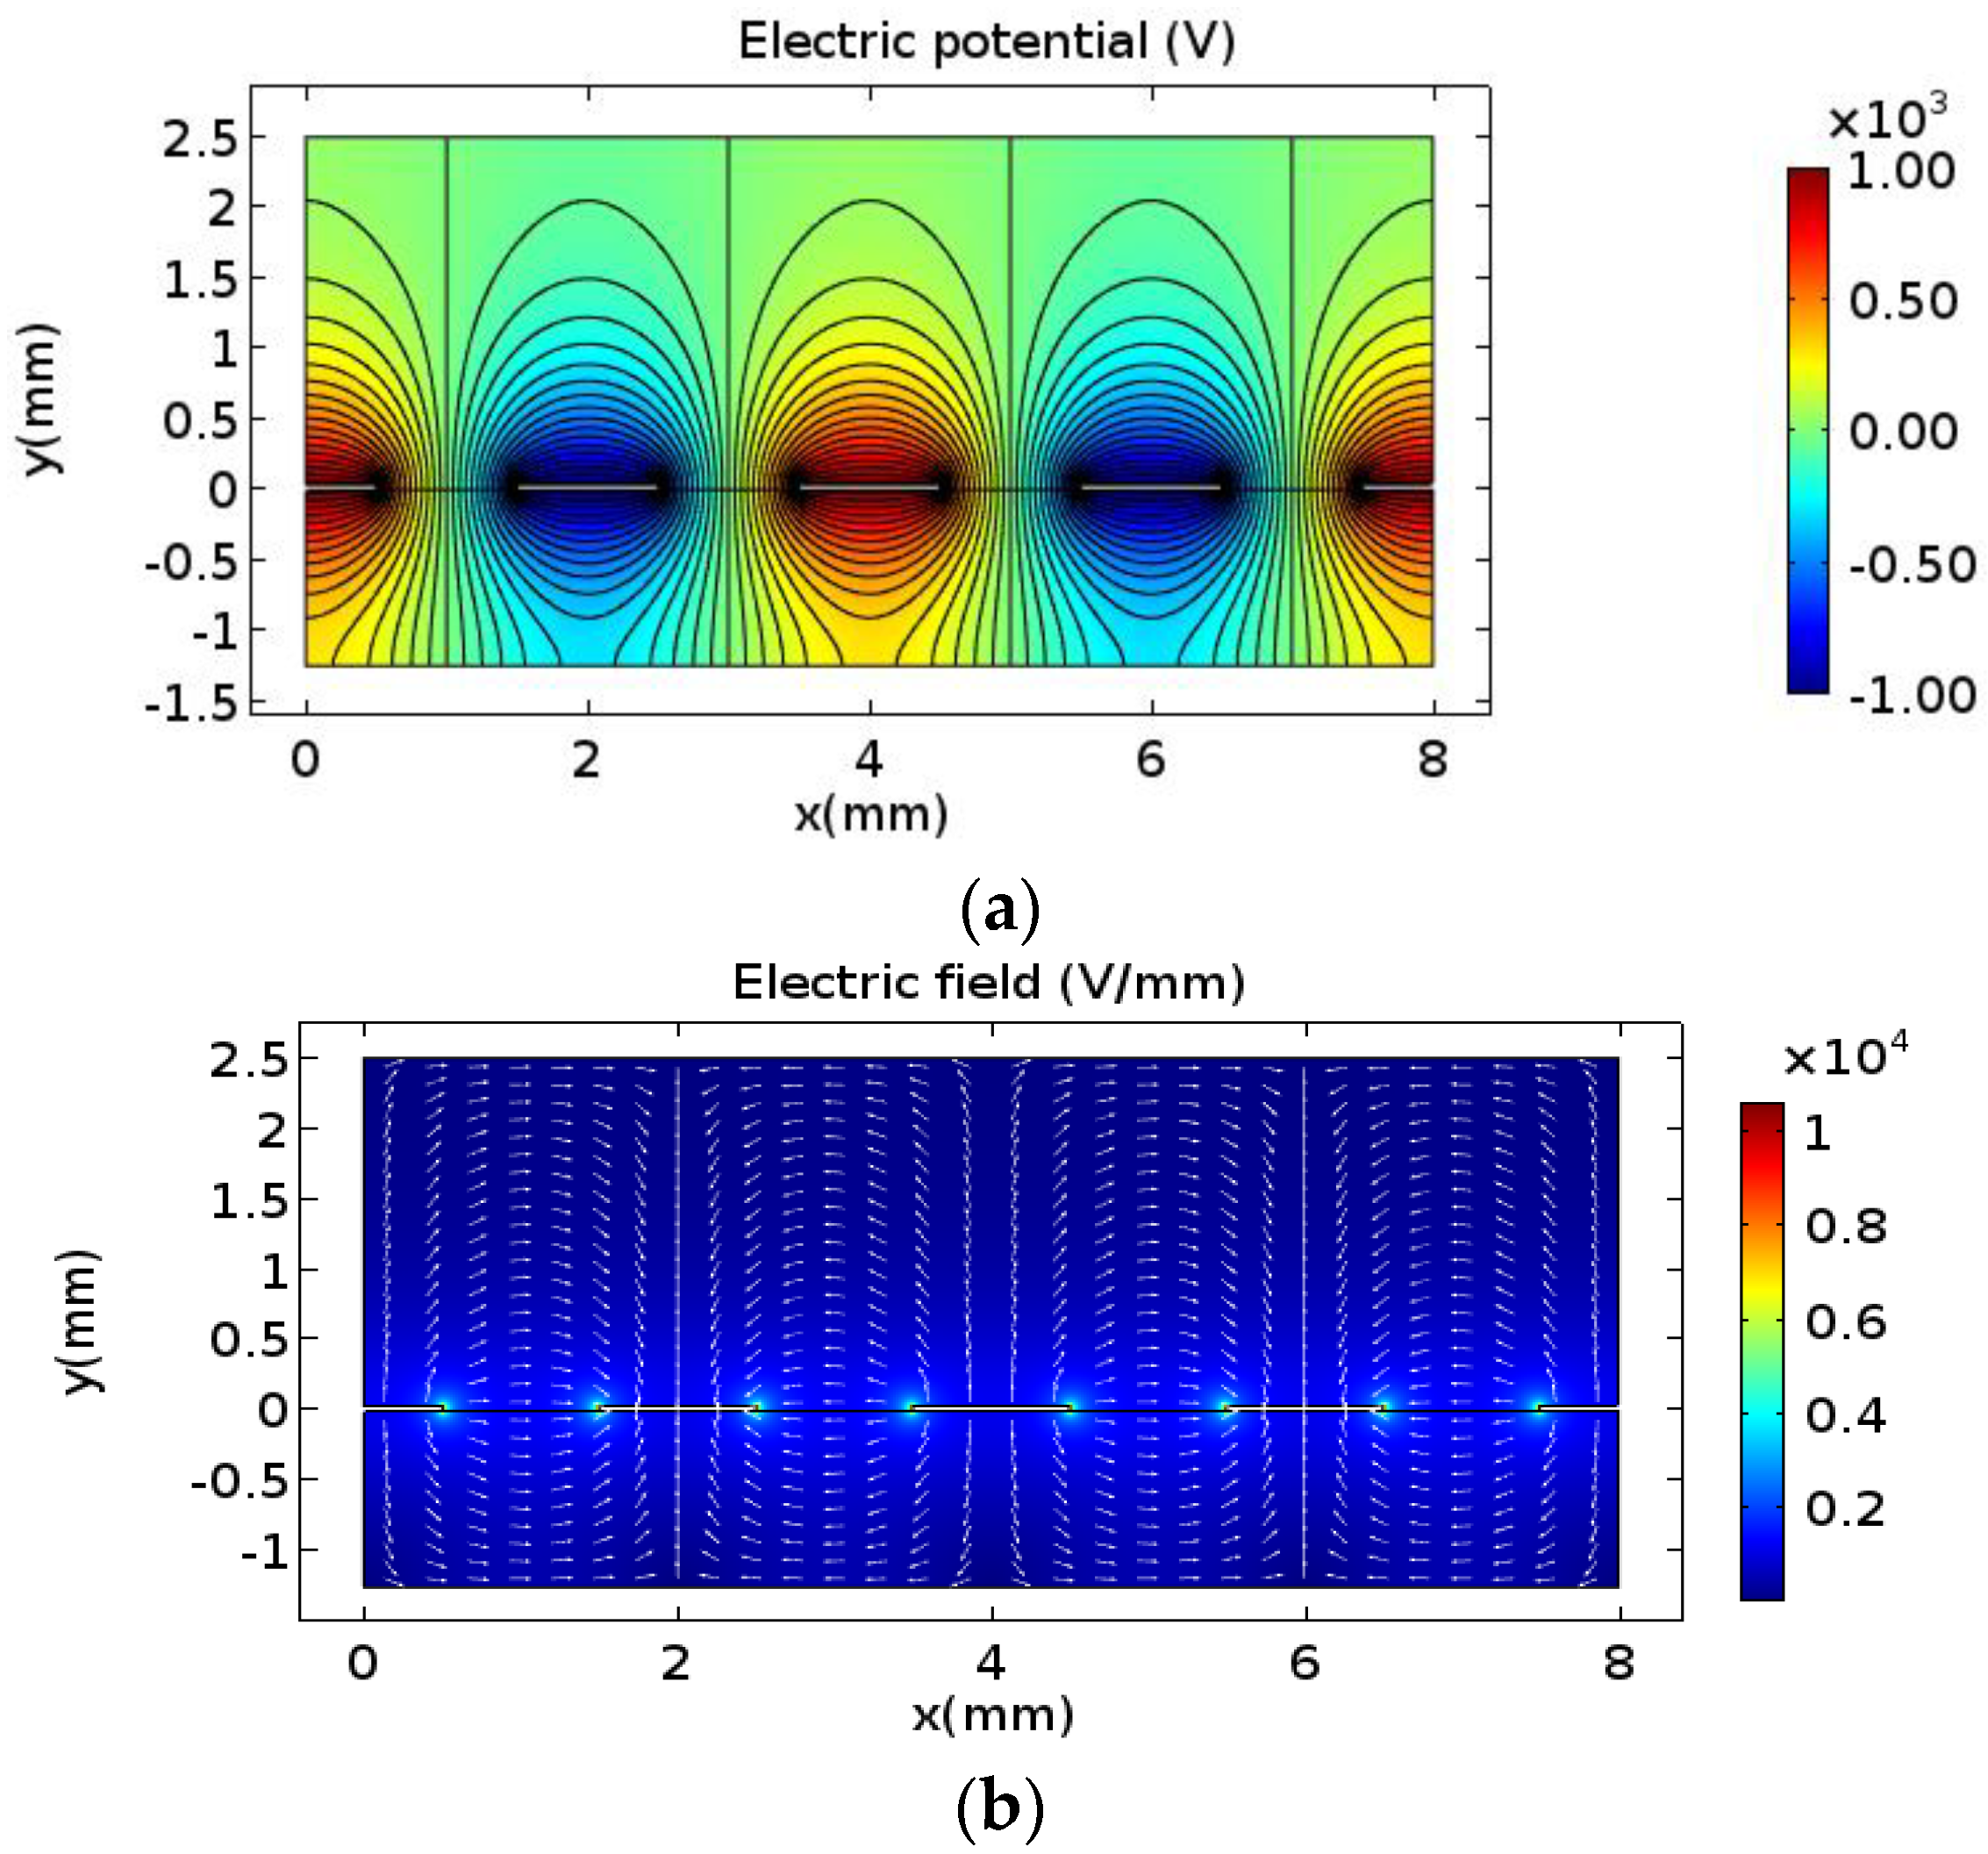
The simulated electric curtain structure and parameters are shown in Figure 1. The electric field and potential distribution were calculated in a COMSOL Multiphysics® software (COMSOL, Grenoble, France). The simulated standing-wave conveyor (SWC) consists of parallel electrodes alternatively connected to two opposite voltages (Figure 1). The parallel copper electrodes were 1 mm width and 35 mm thickness, with a gap between two successive electrodes g = 1 mm. The copper electrodes were supposed to be placed on a dielectric substrate of 10 × 10 cm2 global surface. The geometrical periodicity is λ = 4 mm since the curtain is fed by two high-voltage supplies of 1 kV amplitude.
Laplace’s equation was solved in the space above the curtain. The Dirichlet conditions were imposed on each of the two successive electrodes. The potential was set to equal V 1 and V 2 , expressed, respectively:
V 1 = V 0 cos ω t
V 2 = V 0 cos ω t π
where V 0 = 1000 V is the amplitude of the electric potential and ω is the angular frequency. The Neumann conditions were imposed on the boundary of the considered space in the y direction, whereas periodic conditions were set on the boundary in the x direction. The obtained electric field and potential distribution are shown in Figure 2.
By using the fast Fourier transform (FFT) in a Matlab® environment (MathWorks, Natick, MA, USA), the waveform of the electric potential V x for a given height can be decomposed into multiple harmonics. Beyond the first harmonic, higher frequencies can be ignored since their amplitudes are too low. Therefore, the standing wave of the electric potential can be expressed as the sum of two waves having the same amplitude and the same frequency but propagating in two opposite directions:
V x ,   y ,   t = W R + W L = A y ·   cos ( 2 π λ   x ω t ) + A y · cos ( 2 π λ   x + ω t )
A y = 1 2   V 0   ·   K 1 · e 2 π λ y  
where V 0 is the amplitude of the applied voltage waveforms. λ = 4 mm is the potential wavelength in a two-phase configuration. K 1 is the first Fourier transform coefficient.
The horizontal and vertical components of the electric field E x   x , y , t and E y   x ,   y , t can be determined using Equation (3) by using the formula E = V :
E x , y , t = E x x , y , t E y x ,   y , t     2 π λ   · A y · sin ( 2 π λ   x ω t ) + 2 π λ · A y · sin ( 2 π λ x + ω t ) 2 π λ · A y · cos ( 2 π λ x ω t ) + 2 π λ · A y · cos 2 π λ x + ω t )
Figure 2b illustrates the repartition and the amplitude of the electric field in the space over the electrodes for the two-phase configuration at t = 0 s. The figure shows an intensification of the electric field near the electrodes’ border, but a rather quasi-stable value is observed above the electrodes.

2.2. Motion-Governing Equations

Dust and other small particles on the surface of an electric curtain are subject to a variety of forces. The developed model took into account various electric and gravitational forces when calculating particle trajectories. This includes the Coulomb force, dielectrophoretic force, image force, drag force, gravity force, and van der Waals adhesion force. The latter is relevant only when the particle is in contact with the surface; otherwise, it is neglected. The Coulomb force F c results from the interaction of charged particle with the electric field, given by:
F c = q p · E
where q p is the charge of the particle and E the electric field.
The SWC acts only on charged particles. This charge can be acquired through multiple mechanisms, such a triboelectricity, corona discharge or simply electric induction. Thus, particle charge cannot be predicted theoretically with precision because it depends on various charging parameters. When a particle is fully charged, it reaches a saturation value given by the relation of Pauthenier [31]:
q p s = 4 π r p   2 ε 0 · 3 ε r p ε r p + 2 · E c
where ε 0 and ε r p are the permittivity of the vacuum and the particles, respectively. E c is the dielectric strength of air ( E c ≈ 3 × 10⁶ V/m).
The dielectrophoretic force represents the attraction of dielectric particles towards a non-uniform electric field region. It results from the induced dipole moment in a non-uniform or divergent electric field [32]. The dielectrophoretic force is given by:
F D E P = 2 π r p   3 · ε 0 · ε r m · ε r p ε r m ε r p + 2 ε r m · ( E ) 2
where r p is the particle’s radius. ε r p and ε r m are the relative permittivities of the particle and the medium, respectively. In this simulation, spherical PMMA particles are considered with ε r p = 3.4.
When a charged particle approaches a metallic surface by y p , it induces an image force [33]:
F i m g = q p 2 4 π ε 0 2 y p 2   n
where n is the normal vector perpendicular to the surface and oriented towards the particle [16].
The drag force F D , which describes the friction between a spherical particle and the gas, is given by Stokes relation [34]:
F D   = 6 π · η g   · r p ·   U g   v p ·   1 C u r p , λ g
In this equation, η g   = 1.85 × 10 5   kg . m 1 . s 1 is the dynamic viscosity of the air. U g is the velocity of the flow, and v p is the velocity of the particle. In this study, the particle size is a few orders of magnitude greater than the mean free path; therefore, C u = 1.
The gravity force F g is simply the product of the mass to g :
F g = m p   g = 4 3 π r p 3 · ρ · g
where m p and ρ are the mass and the density of the particle. g is the gravity acceleration.
The van der Waals force F v d w is an adhesion force exerted on a particle when it is in contact with the surface.
In the practical case, asperities can be found on the particle and substrate surfaces. As a result, surface roughness can have a significant impact on adhesion strength. The adhesion force between a smooth particle and a surface with nanometric roughness can be expressed as follows [35]:
F v d w = A h r 0 6 D 2   γ 2 γ 2 + 58.14 ·   R M S · r p + D 2 D + 1.871 · R M S 2   n
with A h being the Hamaker constant (of the order of 10−19 J in vacuum) and D being the shortest distance between the particle and the substrate (of the order of 10−10 m). R M S is the quadratic mean value of the surface roughness (≈3 nm) and γ is the mean distance between the peaks of the asperities (≈20 nm) [35].
Putting all aforementioned forces in the dynamic equation along the x and y axis:
m p x ¨ p = F D + F c x + F D E P x + F g x m p y ¨ p = F D + F c y + F D E P y + F g y + F v d w + F i m g
where m p is the mass and x ¨ p   e t   y ¨ p are the two components of the particle acceleration.
To simplify the problem, we have considered the following assumptions:
  • The particle keeps its initial charge during movement. There is no charge exchange between the particle and the conveyor surface;
  • The resolution of the problem is two-dimensional space ( O x , O y );
  • The simulation is executed for one single particle, neglecting mechanical and electrical interactions between particles;
  • The electrodes are extremely thin, so their thickness is neglected, and there is no dielectric barrier;
  • At the surface, an elastic collision condition with a restitution coefficient of one is considered. This means that when the particle hits the surface, its velocity along the normal axis is inverted: V y a f t e r = V y b e f o r e .
The system of equations solved in this modeling is as follows:
{ m p d 2 x p d t 2 + 6 π η g r p d x p d t = q p E x x p , y p , t + 4 π r p 3 · ε 0 · ε r p 1 ε r p + 2 · E x x p , y p , t E x x p , y p , t x p + E y x p , y p , t E y x p , y p , t x p m p d 2 y p d t 2 + 6 π η g r p d y p d t = q p E y   x p , y p , t + 4 π r p 3 · ε 0 · ε r p 1 ε r p + 2 · E x x p , y p , t E x x p , y p , t y p + E y x p , y p , t E y x p , y p , t y p m p g q p 2 4 π ε 0 2 y p 2 A h r p 6 D 2   · γ 2 γ 2 + 58.14 · r p · R M S + D 2 D + 1.817 · R M S 2 δ y r p }
x p and y p are the coordinates of a particle’s position. δ ( y p r p ) is a function defined as:
δ y p r p = 1   i f   y p = r p 0   e l s e w h e r e
To simplify the system of second-order differential Equation (14), it was decomposed into four first-order differential equations as follows:
{ V x = d x p d t a x = d V x d t =   d 2 x p d t 2 = T d x p d t + C · E x x p , y p , t + K · E x x p , y p , , t E x x p , y p , t x p + E y x p , y p , t E y x p , y p , t x p V y = d y p d t a y = d V y d t = d 2 y p d t 2 =   T d y p d t + C · E y x p , y p , t + K · E x x p , y p , t E x x p , y p , t y p + E y x p , y p , t E y x p , y p , t y p g W · δ y p r p M · 1 y p 2
where ( V x , V y ) and ( a x , a y ) are the particle velocity and acceleration components on the ( O x ) and ( O y ) axes, respectively. T , C , K , W , and M are constants given by
T = 6 π η r p m p
C = q p m p
K = 4 π r p 3 m p · ε 0 · ε r p 1 ε r p + 2
W = 1 m p · A h r p 6 D 2 γ 2 γ 2 + 58.14 r p · R M S + D 2 D + 1.817 · R M S 2
M = q p 2 16 π ε 0 m p
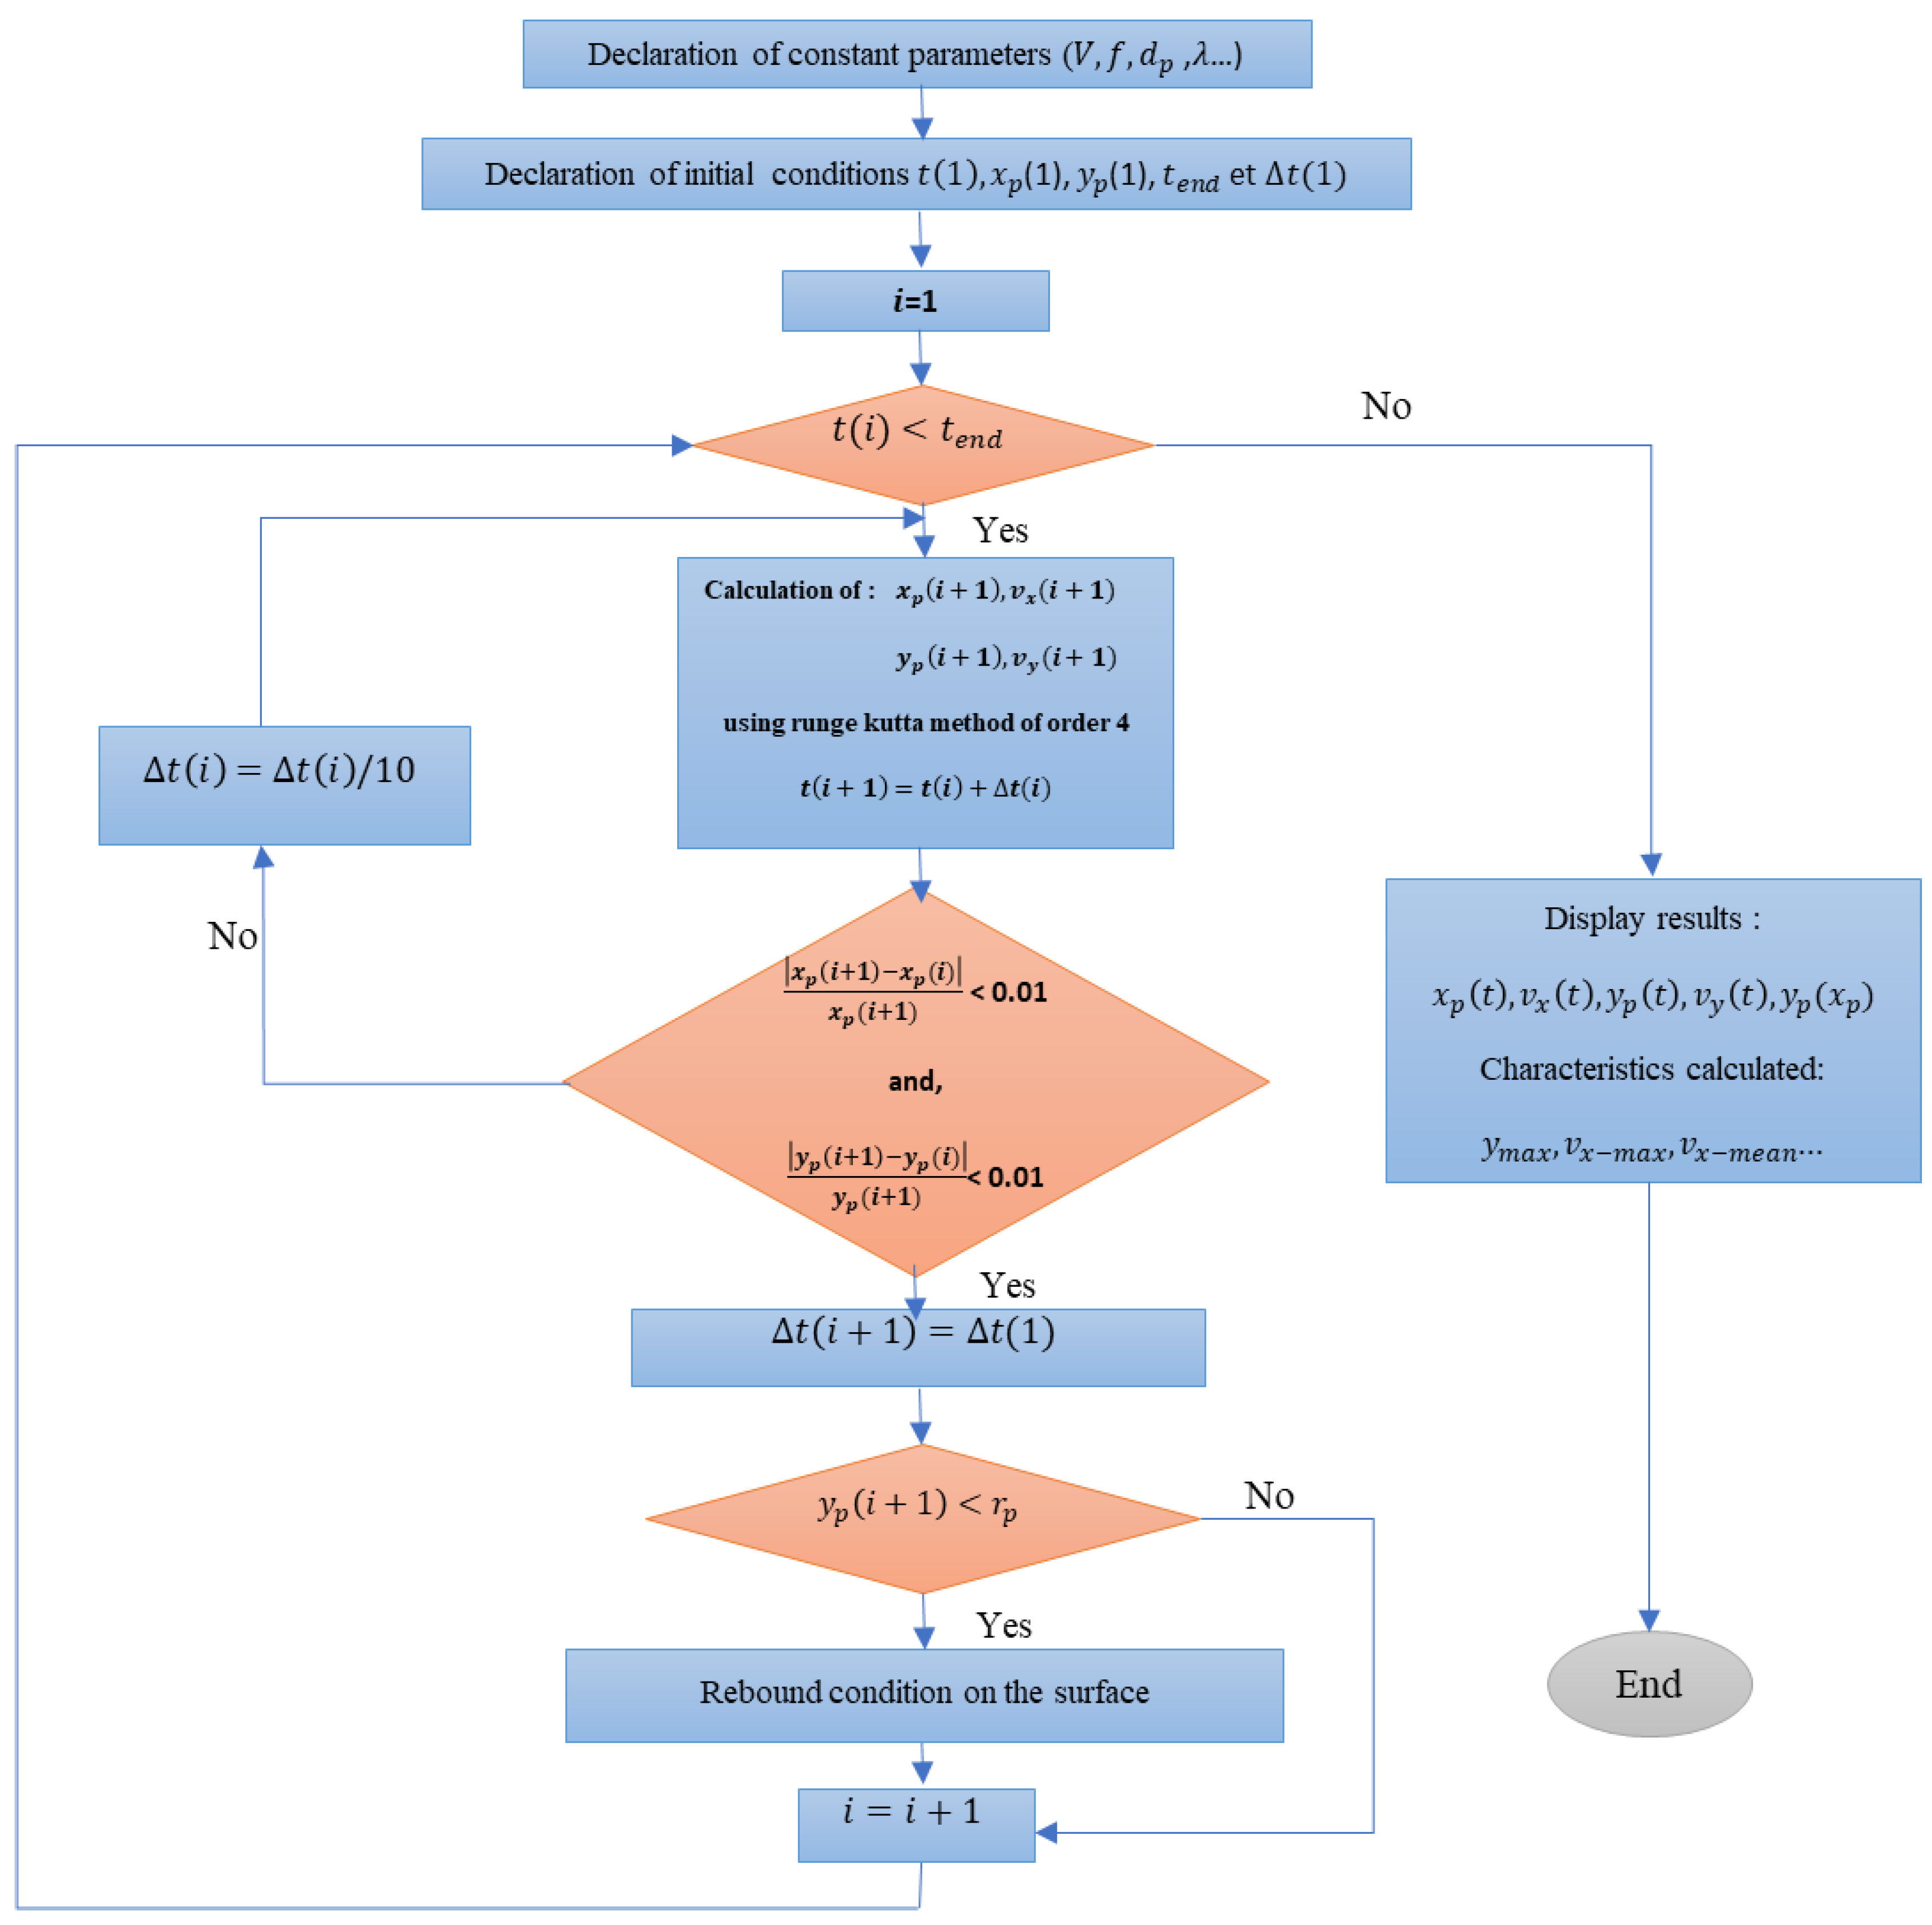
The system of four differential Equation (15) is solved using the fourth order Runge–Kutta (RK4) MATLAB routine. This model is inspired by the PhD thesis of Zouaghi [36] and follows the solution steps shown in Figure 3. The Table 1 presents different values of parameters used during the simulation.

3. Results and Discussion

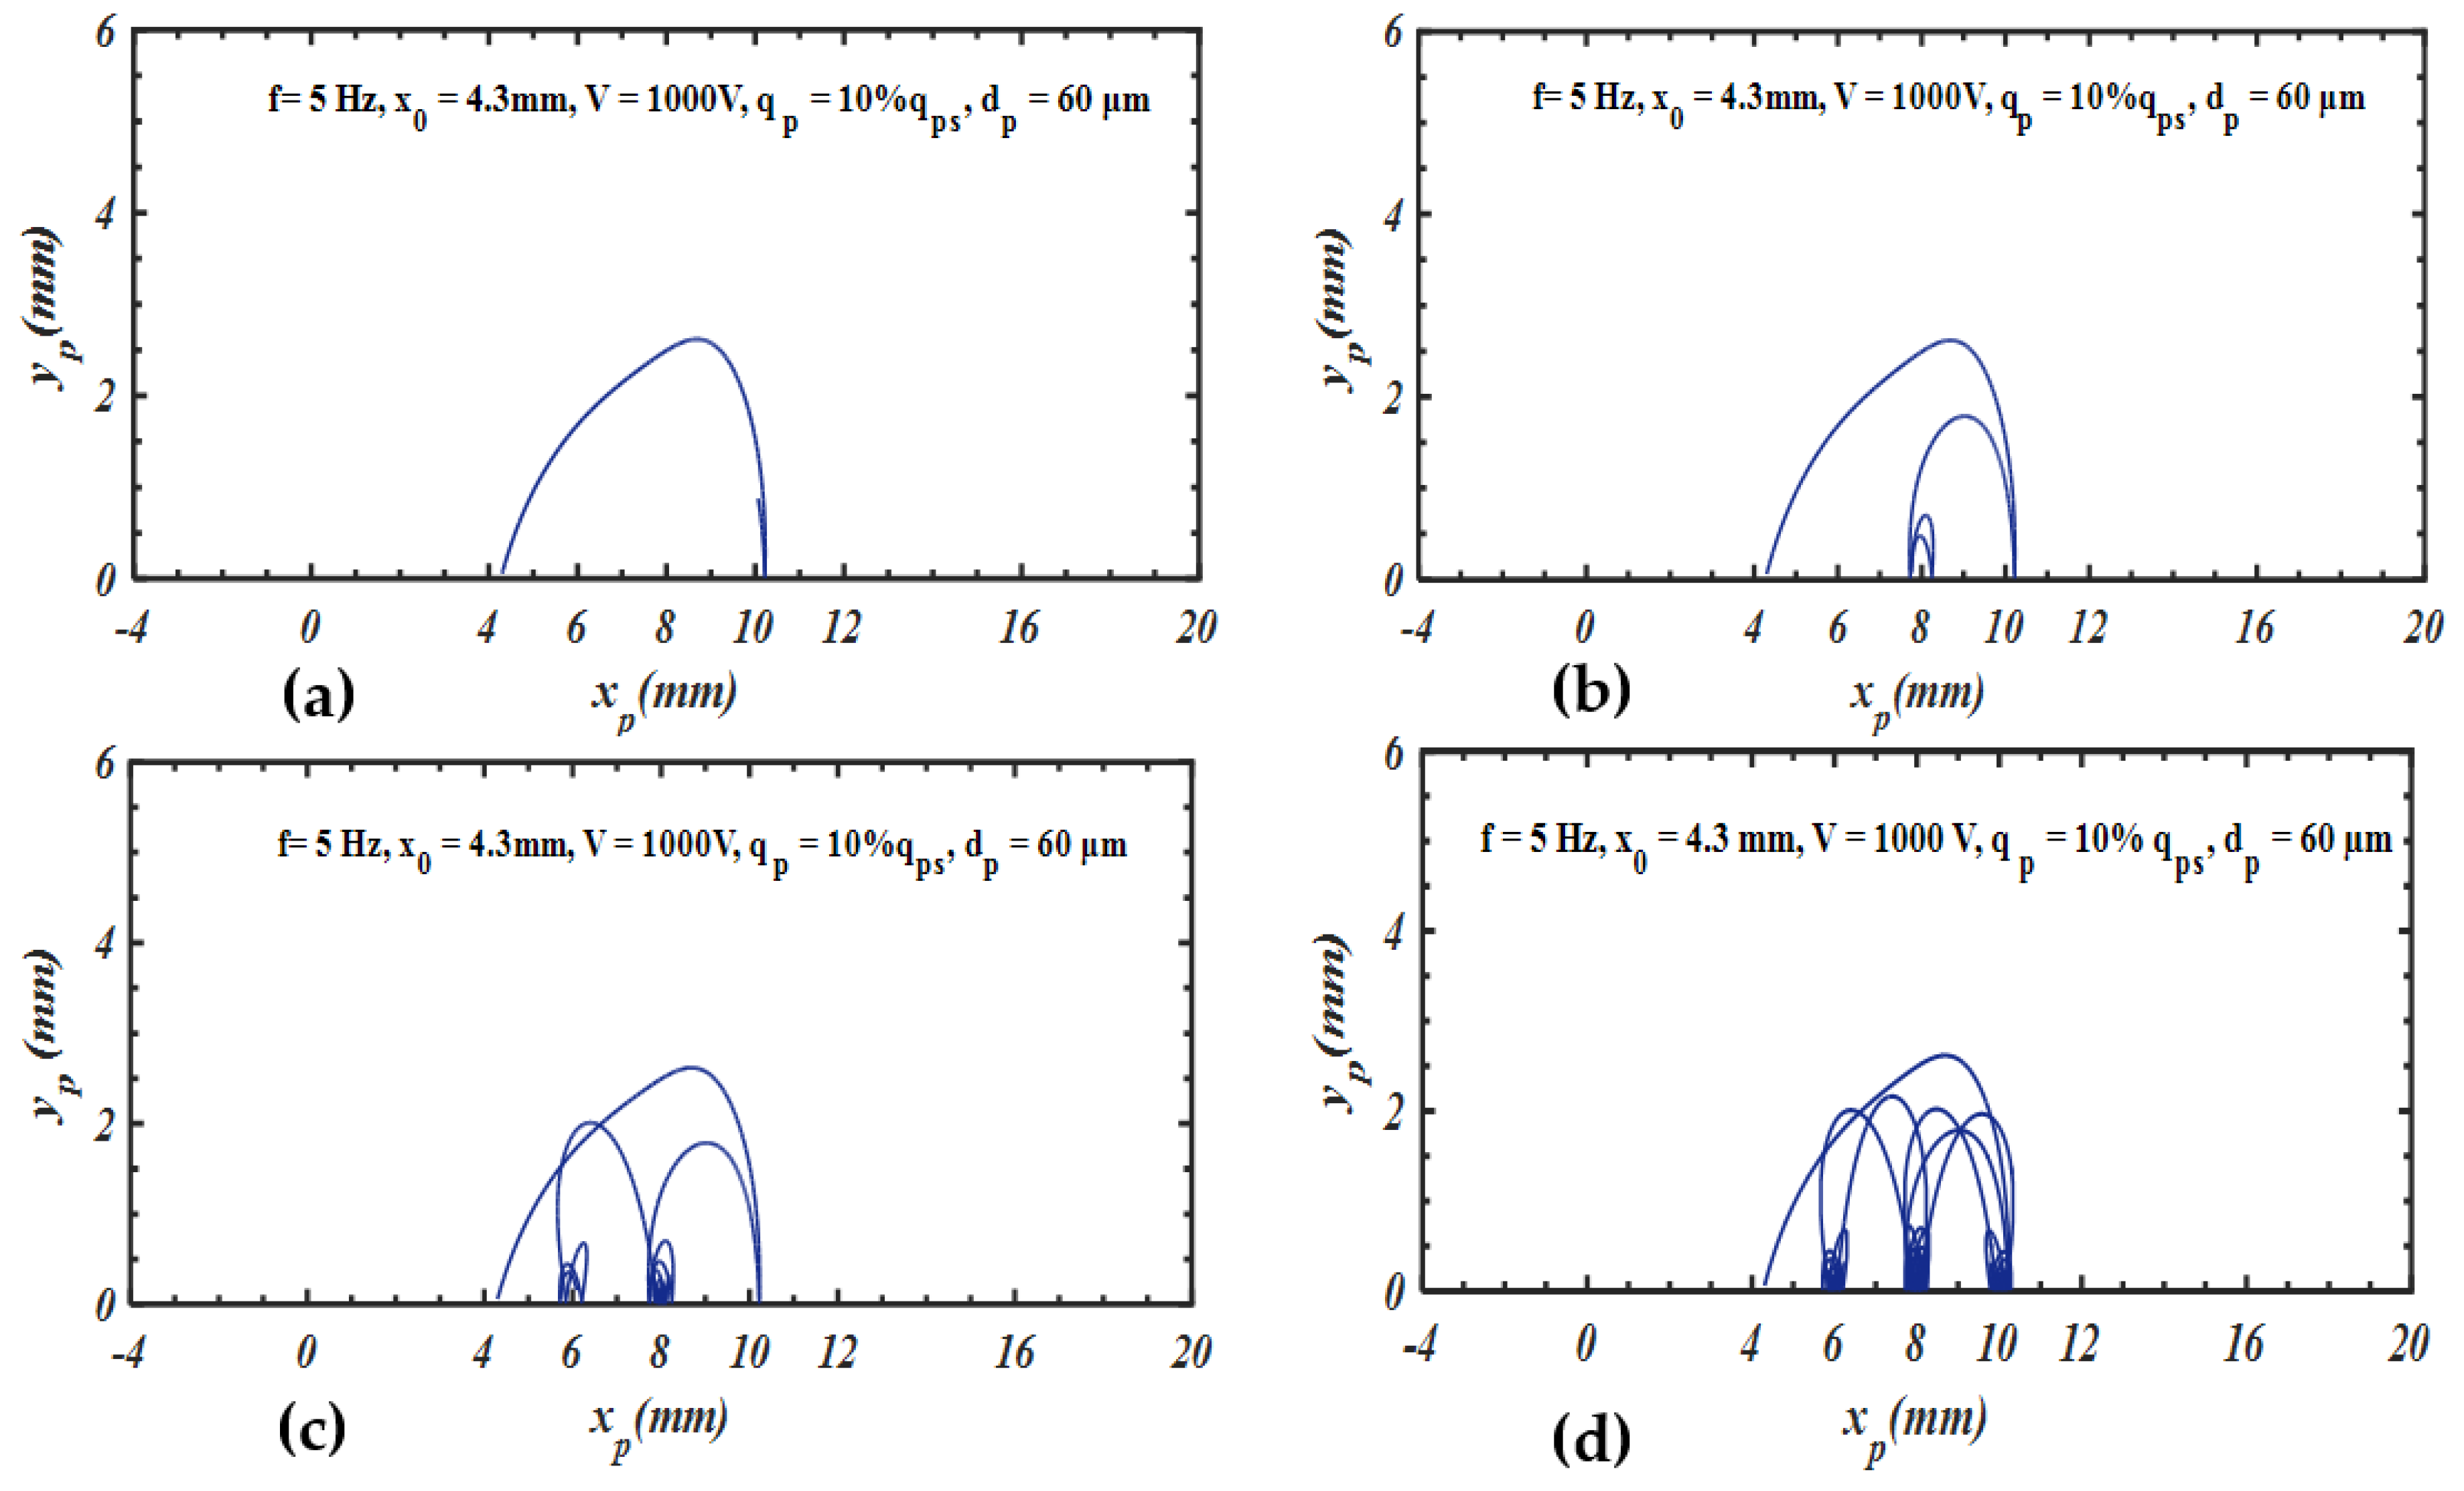
Figure 4 illustrates the trajectory of one single particle at different instants: 50 ms, 100 ms, 200 ms, and 500 ms. This simulation was carried out under specific conditions: a low frequency fixed at 5 Hz and an applied voltage of 1000 V. The particle has a diameter d p of 60 µm and a positive charge of 10% of the saturation charge q p s . In the beginning ( t = 0 s), the particle is located on an electrode at x 0 = 4.3 mm. As soon as the positive voltage is applied, the particle, with positive charge, jumps out and bounces back and forth along the curtain. The Coulomb force pushes it to take off from its initial position and to transport forward to the tenth electrode at t = 50 ms. At 100 ms, the particle is pushed back with a small jump to reach the eighth electrode, and then, to the sixth electrode at t = 200 ms. Finally, at 500 ms, it returns to the eighth, and then, the tenth electrode. In this case, the particle movement encompasses three distinct phases. The first is a levitation phase in which the particle is projected a few millimeters from the surface as soon as the voltage is applied. Because of gravity, the levitation phase is followed by a particle-fall phase. The final phase corresponds to the particle oscillation and forward and backward movements.
Figure 5 shows the variation of the particle’s position and the horizontal component of the instantaneous velocity under the same conditions. It should be noted that the synchronism velocity corresponds to the speed of the electric wave. The analysis of Figure 5 shows that during about the first 50 ms, the particle moves in hyper-synchronous motion. Hyper-synchronism appears at low frequencies during the particle’s transient state of movement. The reason is that the particle is moved by the Coulomb force over long distances at high velocities. Because of the observed hyper-synchronism at the beginning of the movement, low frequencies are more suitable for velocity control and for achieving better displacement efficiency. More details about the modes of movement and the effect of frequency on the trajectory, maximum levitation height, distance crossed, and the velocity of particles are shown and discussed in the next section.
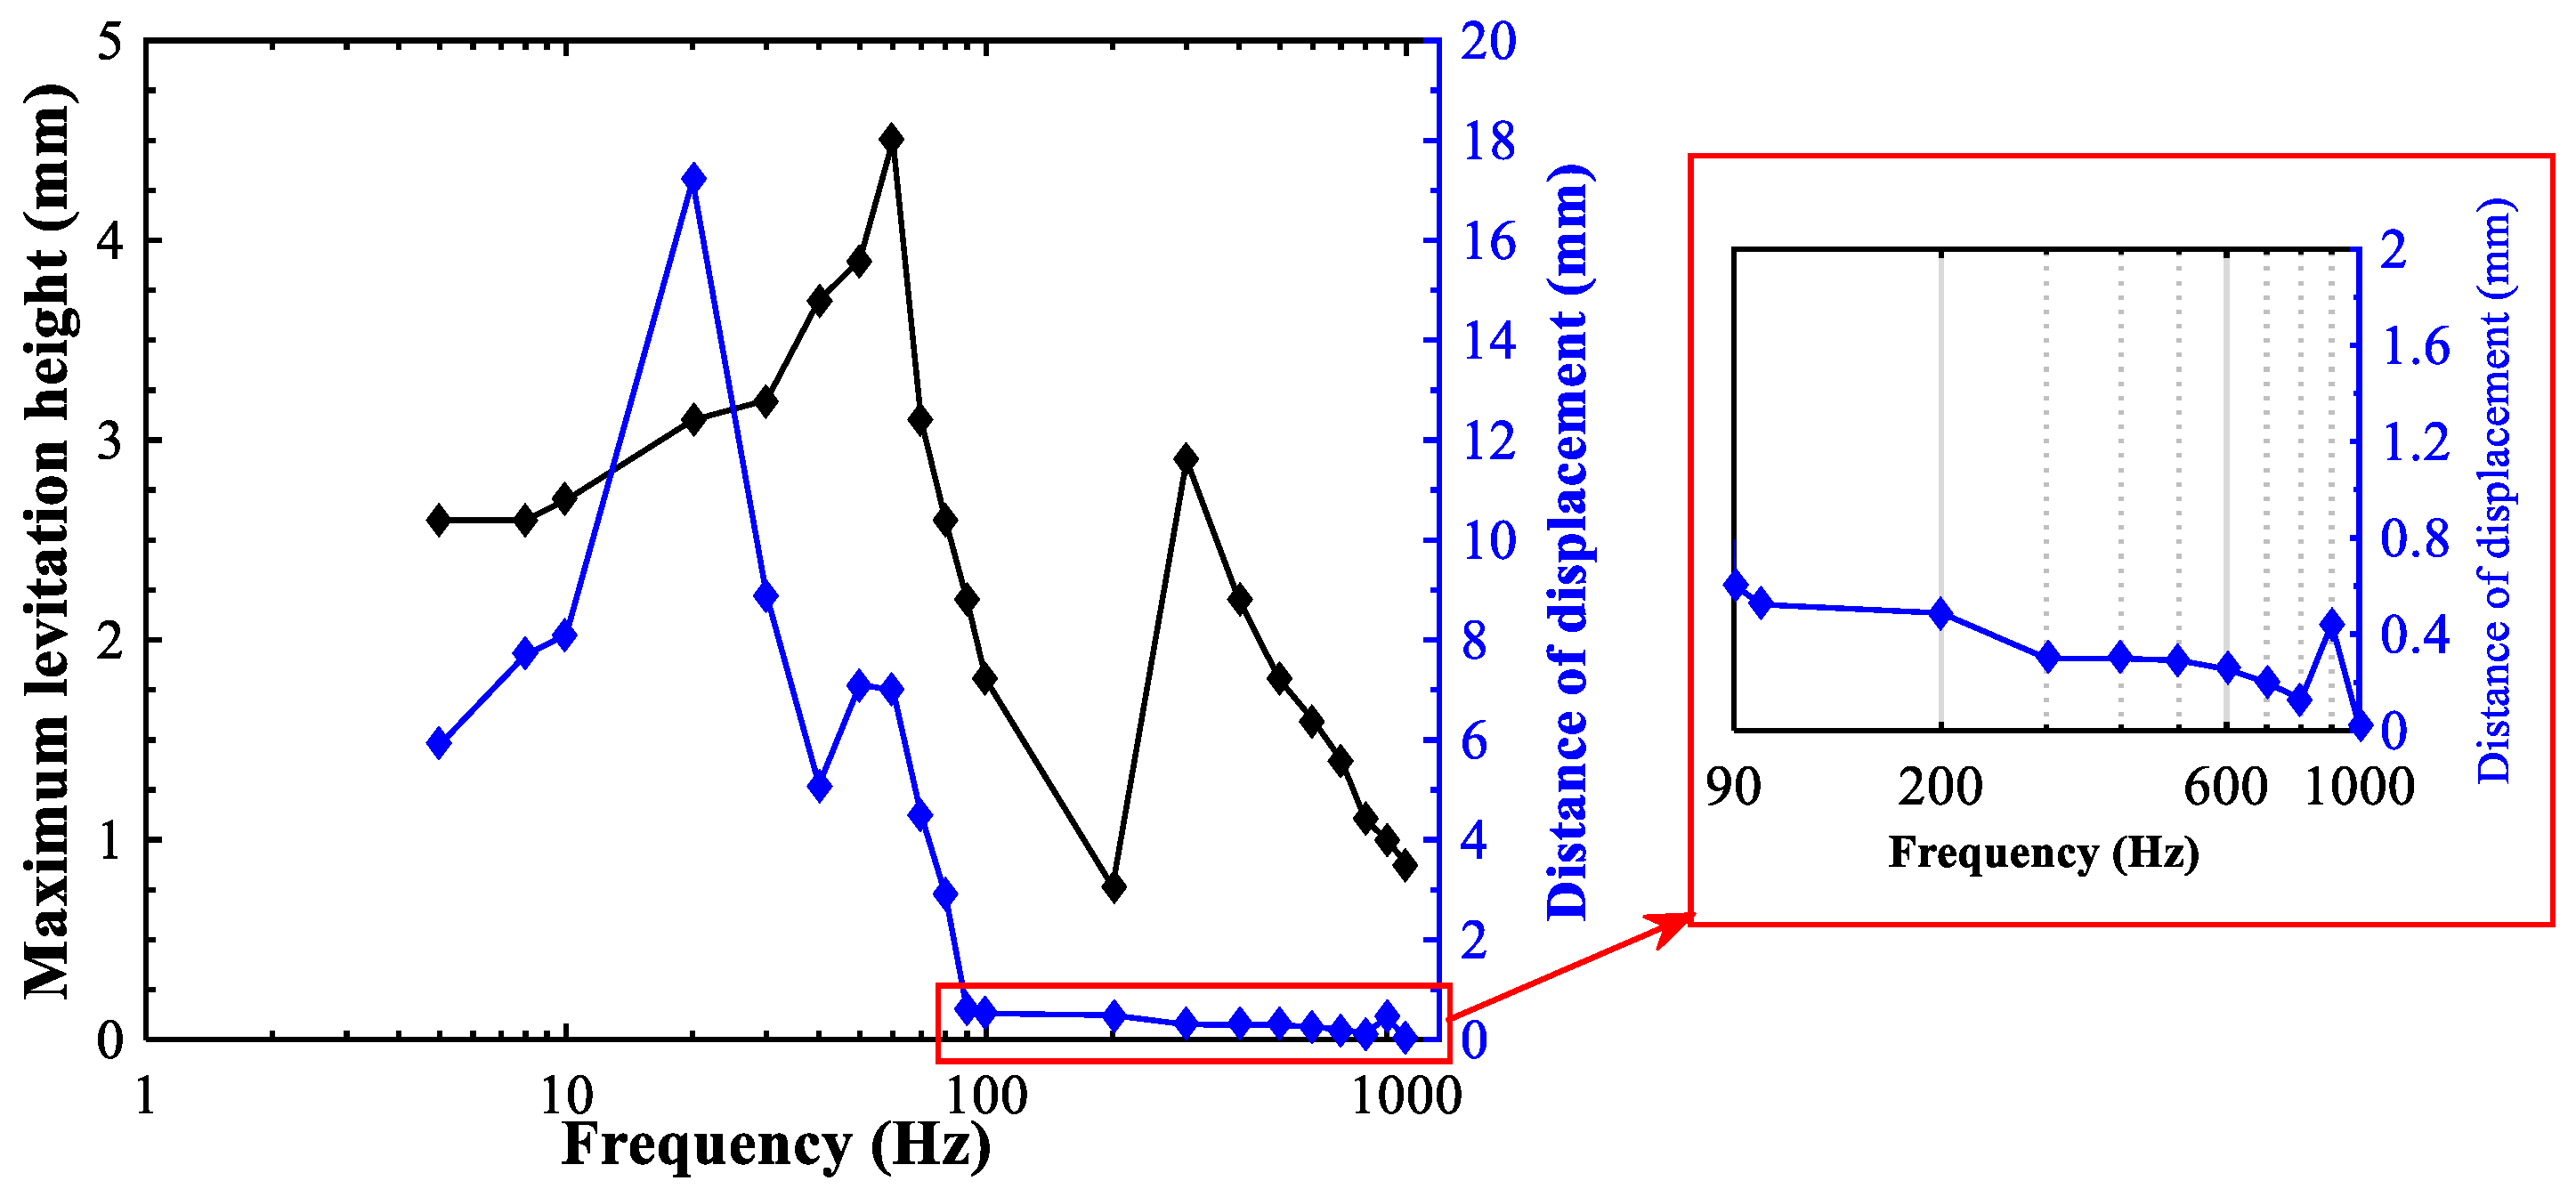
Figure 6 illustrates the variation of the maximum levitation height of the particle ( y m a x ) and the displacement distance d as a function of the frequency in specific conditions; the applied voltage is fixed at 1000 V; the dielectric particle has a size of 60 μm ( ε r = 3.4) and a positive charge of 10% q p s . The results show that the two curves reach a maximum value. The maximum levitation height increases with the frequency until it reaches the maximum value of about 4.6 mm at 60 Hz frequency. Beyond this maximum value, the levitation decreases for frequencies in the range of 60 to 200 Hz, before a sudden jump between 200 and 300 Hz; then, it decreases for higher frequencies. The displacement distance shows a similar evolution. The displacement of 17 mm is recorded at 20 Hz. The particle’s distance crossed decreases between 20 and 40 Hz. Above 50–60 Hz, the values rise slightly before falling back to very low values at higher frequencies. There are no negative values detected, showing that the particles are moving in one direction.
Figure 7 illustrates the variation of the average velocity of particles V x a v g at a steady state, as well as the maximum speed V x m a x as a function of the frequency. The blue line curve represents the synchronism velocity, which is calculated by multiplying the frequency by the geometric period. There are two types of movements that can be observed: hyper-synchronous and hypo-synchronous. When the frequency is less than or equal to 20 Hz, the particle moves horizontally with an average velocity, which is nearly equal to the synchronism value. Above 20 Hz, the particle keeps a very low velocity and forward motion. The maximum instantaneous velocity curve (green line) shows that for frequencies less than or equal to 80 Hz, the particle can reach much higher instantaneous velocities than the synchronism velocity. For example, at approximately 10 Hz, the particle’s velocity can exceed 0.6 m/s, while the synchronism velocity is limited to 0.01 m/s. For frequencies above 60 Hz, a hyper-synchronous motion does not exist because the maximum instantaneous velocity is less than the synchronism value.
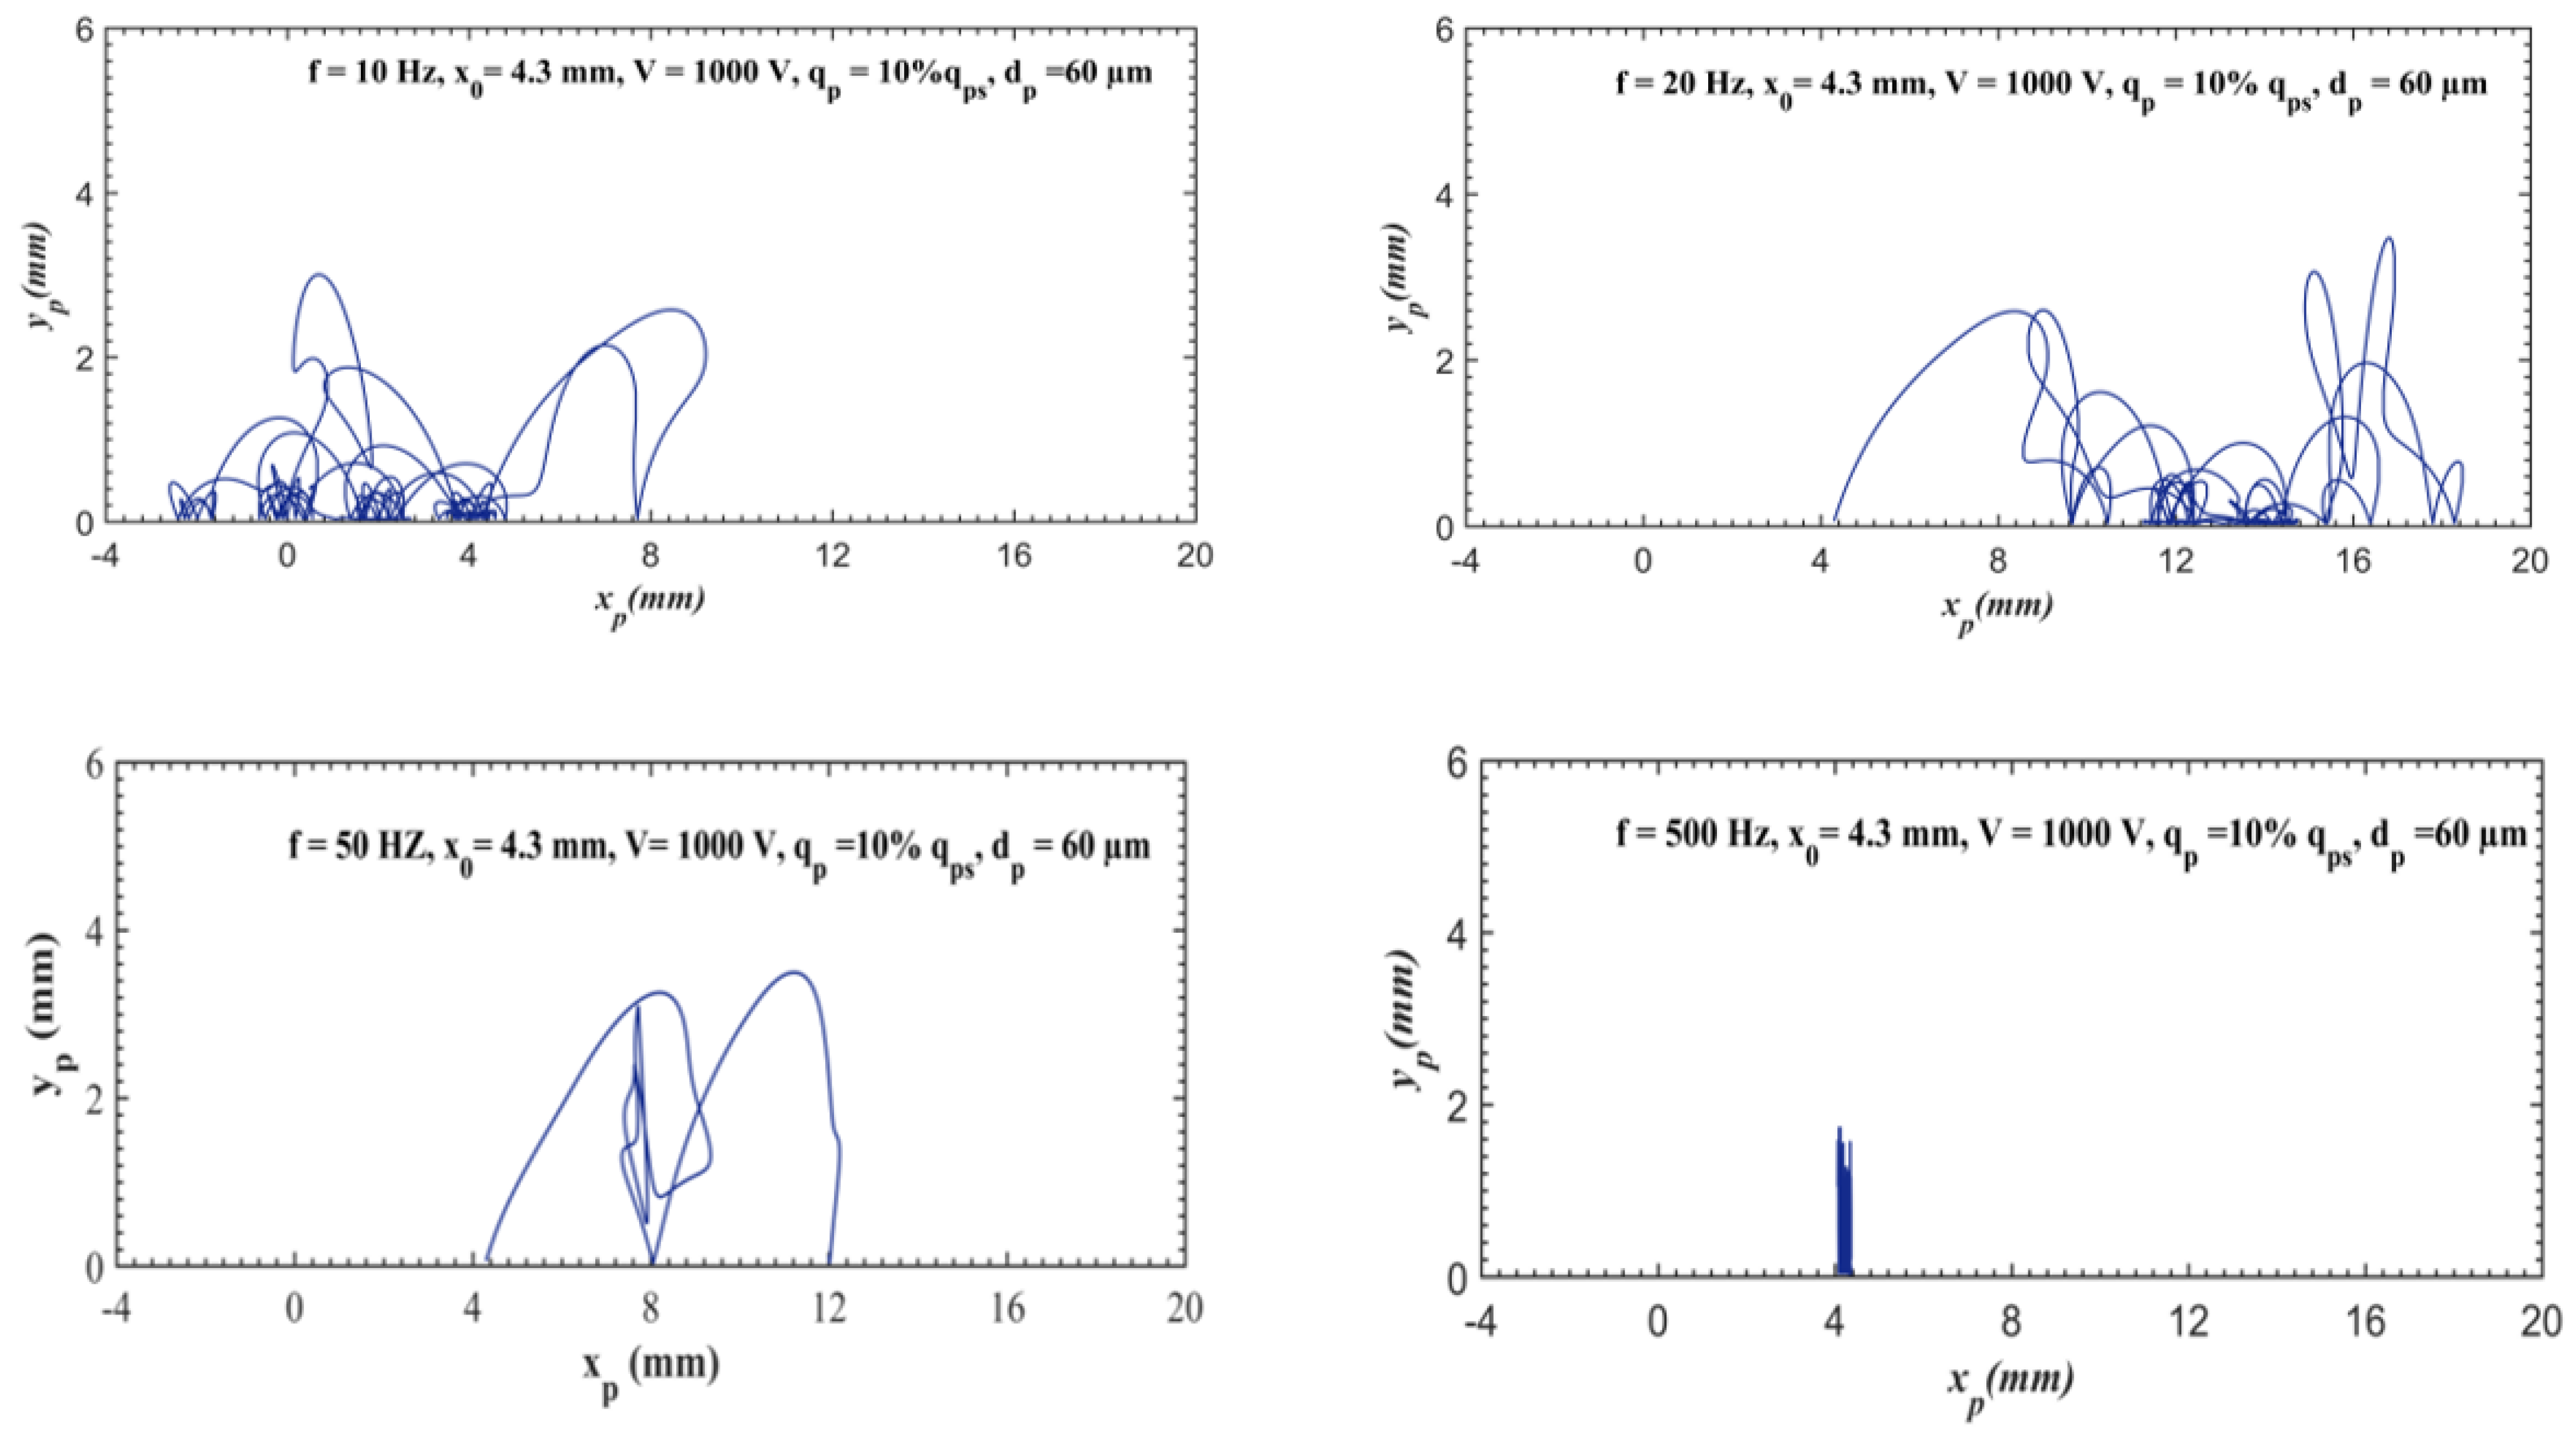
Figure 8 represents the particle trajectories for different frequency values (10 Hz, 20 Hz, 50 Hz, and 500 Hz). The conditions of the simulation are: V = 1000 V, d p = 60 µm, q p  = 10% q p s , and x 0 = 4.3 mm. A hyper-synchronous motion appears at low frequencies during the particle’s transient state of movement. The particle quickly makes the transition to a hopping synchronous mode. At 10 Hz, the particle moves backward, while at 20 Hz, it moves forward by jumping above the surface. The particle moves in a hopping synchronous mode at 50 Hz, but with bigger jumps. A movement over a very short distance can be observed at 500 Hz. However, because the horizontal movement comes to an end quickly and the particle only makes small jumps and vibrations without significant displacement, this movement can be considered a separate mode called the vibratory mode.

4. Conclusions

This investigation aims to gain a deeper understanding of the mechanics governing particle motion in a standing-wave curtain. The drag force, gravitational force, Coulomb force, dielectrophoretic force, image force, and van der Waals adhesion force were all taken into account when creating a numerical MATLAB code.
The results of this study, which concentrated on the frequency’s influence, demonstrate that the trajectories are very sensitive to the frequency.
In terms of time-dependent particle motion, there are two states: a transient state with two phases and a stable state. Depending on the frequency, two types of movement can be observed: the hopping synchronous mode at low frequencies and the vibratory mode at high frequencies. These findings suggest that low frequencies are better suited for controlling particle velocity and obtaining longer displacement lengths. An optimal frequency value can be chosen corresponding to the maximum of the particle velocity and displacement distance. This study pointed out that 60 Hz frequency can achieve the maximum levitation height, about 4.6 mm. As for maximum displacement distances, lower frequencies, between 20 and 40 Hz, are the best values.
Future research is required to better understand a number of topics, such as the impact of particle size, initial position, charge, and environmental factors. The exchange of charges prior to and following the collision could be taken into account to enhance the numerical model. A three-dimensional analysis of the particle movement would be interesting.

Author Contributions

Conceptualization, M.K. and N.Z.; methodology, M.K. and N.Z.; software, H.B.; validation, M.K. and N.Z.; formal analysis, H.B., M.K. and N.Z.; investigation, H.B.; resources, H.B.; data curation, H.B., M.K. and N.Z.; writing—original draft preparation, H.B.; writing—review and editing, H.B., M.K. and N.Z.; visualization, H.B.; supervision, M.K. and N.Z.; project administration, M.K. and N.Z. All authors have read and agreed to the published version of the manuscript.

Funding

This research received no external funding.

Institutional Review Board Statement

Not applicable.

Informed Consent Statement

Not applicable.

Data Availability Statement

Not applicable.

Conflicts of Interest

The authors declare no conflict of interest.

References

  1. Sarver, T.; Al-Qaraghuli, A.; Kazmerski, L.L. A comprehensive review of the impact of dust on the use of solar energy: History, investigations, results, literature, and mitigation approaches. Renew. Sustain. Energy Rev. 2013, 22, 698–733. [Google Scholar] [CrossRef]
  2. Deb, D.; Brahmbhatt, N.L. Review of yield increase of solar panels through soiling prevention, and a proposed water-free automated cleaning solution. Renew. Sustain. Energy Rev. 2018, 82, 3306–3313. [Google Scholar] [CrossRef]
  3. Kawamoto, H.; Shibata, T. Electrostatic cleaning system for removal of sand from solar panels. J. Electrost. 2014, 73, 65–70. [Google Scholar] [CrossRef]
  4. Yu, Y.; Cilliers, J. A review of particle transport and separation by electrostatic traveling wave methods. J. Electrost. 2022, 119, 103735. [Google Scholar] [CrossRef]
  5. Chang, J.-S.; Kelly, A.J.; Crowley, J.M. Handbook of Electrostatic Processes; M. Dekker: New York, NY, USA, 1995. [Google Scholar]
  6. Masuda, S.; Fujibayashi, K.; Ishida, K.; Inaba, H. Confinement and transportation of charged aerosol clouds via electric curtain. Electr. Eng. Jpn. 1972, 92, 43–52. [Google Scholar] [CrossRef]
  7. Masuda, S.; Matsumoto, Y. Theoretical characteristics of standing-wave electric curtains. Electr. Eng. Jpn. 1973, 93, 71–77. [Google Scholar] [CrossRef]
  8. Masuda, S.; Matsumoto, Y.; Akutsu, K. Characteristics of standing-wave, ring-type electric curtain. experimental study. Electr. Eng. Jpn. 1973, 93, 48–53. [Google Scholar] [CrossRef]
  9. Adams, J.G.; Cline, B.L.; Contaxes, N.A.; Johnson, R.D.; Seaman, H.; Srepel, V.; Tatom, F.B. Lunar Dust Degradation Effects and Removal/Prevention Concepts; Volume 2—Detailed Results Final Report; Northrop Space Laboratories: Huntsville, AL, USA, 1967. [Google Scholar]
  10. Masuda, S.; Washizu, M.; Iwadare, M. Separation of small particles suspended in liquid by nonuniform traveling field. IEEE Trans. Ind. Appl. 1987, IA-23, 474–480. [Google Scholar] [CrossRef]
  11. Masuda, S.; Fujibayashi, K.; Ishida, K. Electrodynamical behavior of charged aerosol particles in non-uniform alternating fields and its application in dust control. Staub-Reinhaltungs Luft 1970, 30, 449–456. [Google Scholar]
  12. Melcher, J.R.; Warren, E.P.; Kotwal, R.H. Theory for pure-traveling-wave boundary guided transport of tribo-electrified particles. Part. Sci. Technol. 1989, 7, 1–21. [Google Scholar] [CrossRef]
  13. Melcher, J.R.; Warren, E.P. Theory for finite-phase traveling-wave boundary-guided transport of triboelectrified particles. IEEE Trans. Ind. Appl. 1989, 25, 949–955. [Google Scholar] [CrossRef]
  14. Schmidlin, F.W. Modes of traveling wave particle transport and their applications. J. Electrost. 1995, 34, 225–244. [Google Scholar] [CrossRef]
  15. Kawamoto, H.; Hasegawa, N.; Seki, K. Traveling wave transport of particles and particle size classification. Trans. Jpn. Soc. Mech. Eng. Ser. 2003, C 69, 1216–1221. [Google Scholar] [CrossRef] [Green Version]
  16. Kawamoto, H.; Seki, K.; Kuromiya, N. Mechanism of travelling-wave transport of particles. J. Phys. D Appl. Phys. 2006, 39, 1249–1256. [Google Scholar] [CrossRef]
  17. Kawamoto, H. Electrostatic transport and manipulation of lunar soil and dust. AIP Conf. Proc. 2008, 969, 203–212. [Google Scholar]
  18. Horenstein, M.N.; Mazumder, M.K.; Sumner, R.C.; Stark, J.; Abuhamed, T.; Boxman, R. Modeling of trajectories in an electrodynamic screen for obtaining maximum particle removal efficiency. IEEE Trans. Ind. Appl. 2013, 49, 707–713. [Google Scholar] [CrossRef]
  19. Zhang, S.; Wang, Y.; Onck, P.; Toonder, J.D. A concise review of microfluidic particle manipulation methods. Microfluid. Nanofluid. 2020, 24, 24. [Google Scholar] [CrossRef] [Green Version]
  20. Gu, J.; Zhang, G.; Wang, Q.; Wang, C.; Liu, Y.; Yao, W.; Lyu, J. Experimental study on particles directed transport by an alternating travelling-wave electrostatic field. Powder Technol. 2022, 397, 117107. [Google Scholar] [CrossRef]
  21. Zouaghi, A.; Zouzou, N. Impact of spatial harmonic waves on dielectric particles displacement in standing and traveling wave electric fields. J. Electrost. 2019, 98, 25–33. [Google Scholar] [CrossRef]
  22. Zouaghi, A.; Zouzou, N.; Dascalescu, L. Assessment of forces acting on fine particles on a traveling-wave electric field conveyor: Application to powder manipulation. Powder Technol. 2019, 343, 375–382. [Google Scholar] [CrossRef]
  23. Chesnutt, J.K.; Marshall, J.S. Simulation of particle separation on an inclined electric curtain. IEEE Trans. Ind. Appl. 2013, 49, 1104–1112. [Google Scholar] [CrossRef]
  24. Hemstreet, J.M. Velocity distribution on the Masuda panel. J. Electrost. 1985, 17, 245. [Google Scholar] [CrossRef]
  25. Sims, R.A.; Biris, A.S.; Wilson, J.D.; Yurteri, C.U.; Mazumder, M.K.; Calle, C.I.; Buhler, C.R. Development of a transparent self-cleaning dust shield for solar panels. In Proceedings of the ESA-IEEE Joint Meeting on Electrostatics, Little Rock, AR, USA, 24–27 June 2003. [Google Scholar]
  26. Atten, P.; Pang, H.L.; Reboud, J.L. Study of dust removal by standing wave electric curtain for application to solar cells on Mars. IEEE Trans. Ind. Appl. 2009, 45, 75–86. [Google Scholar] [CrossRef]
  27. Kawamoto, H. Electrostatic cleaning equipment for dust removal from soiled solar panels. J. Electrostat. 2019, 98, 11–16. [Google Scholar] [CrossRef]
  28. Kawamoto, H.; Guo, B. Improvement of an electrostatic cleaning system for removal of dust from solar panels. J. Electrost. 2018, 91, 28–33. [Google Scholar] [CrossRef]
  29. Altıntaş, M.; Arslan, S. The study of dust removal using electrostatic cleaning system for solar panels. Sustainability 2021, 13, 9454. [Google Scholar] [CrossRef]
  30. Sun, Q.; Yang, N.; Cai, X.; Hu, G. Mechanism of dust removal by a standing wave electric curtain. Sci. China: Phys. Mech. Astron. 2012, 55, 1018–1025. [Google Scholar] [CrossRef]
  31. Pauthenier, M.; Moreau-Hanot, M. La charge des particules sphériques dans un champ ionisé. J. Phys. Radium 1932, 3, 590–613. [Google Scholar] [CrossRef]
  32. Duff, J.D. Dielectrophoretic Precipitation of Airborne Particles. Master’s Thesis, University of Louisville, Louisville, KY, USA, 2013. [Google Scholar]
  33. Taylor, D.M.; Secker, P.E. Industrial Electrostatics: Fundamentals and Measurements; Research Studies Press: Boston, MA, USA, 1994. [Google Scholar]
  34. Zouaghi, A.; Zouzou, N. Numerical modeling of particle motion in traveling wave solar panels cleaning device. J. Electrost. 2021, 110, 103552. [Google Scholar] [CrossRef]
  35. Rabinovich, Y.I.; Adler, J.J.; Ata, A.; Singh, R.K.; Moudgil, B.M. Adhesion between nanoscale rough surfaces: II. Measurement and comparison with theory. J. Colloid Interface Sci. 2000, 232, 17–24. [Google Scholar] [CrossRef]
  36. Zouaghi, A. Manipulation de Particules Diélectriques Micrométriques par Ondes Electrostatiques Progressives et Stationnaires. Études Théorique, Expérimentale et Numérique. Ph.D. Thesis, Poitiers University, Poitiers, France, 2019. [Google Scholar]
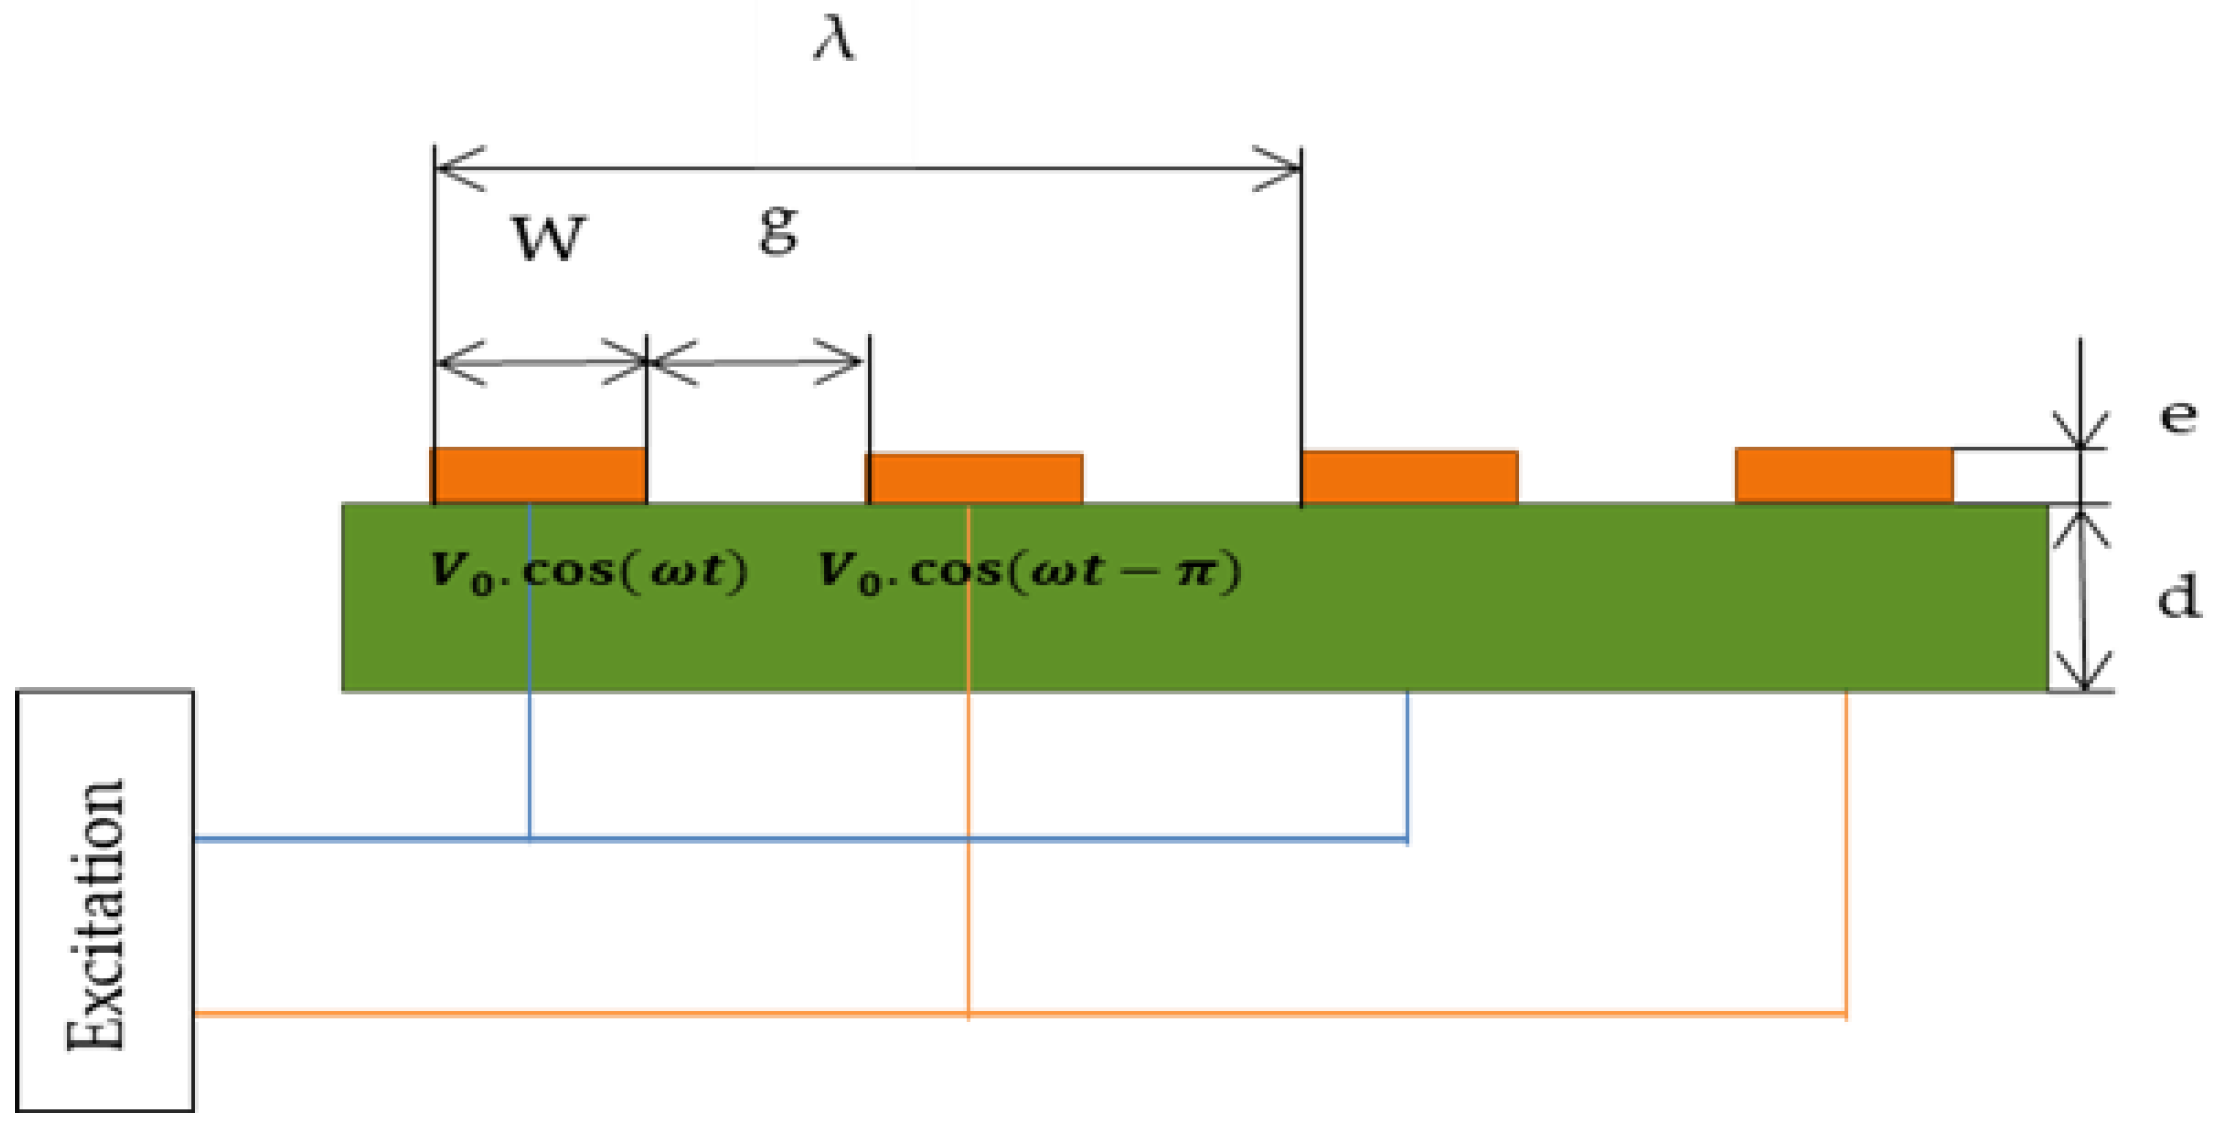
Figure 1. Illustration of the studied 2-phase standing-wave configuration ( w = g = 1 mm, e = 35 µm, d = 1.25 mm, λ = 4 mm).
Atmosphere 14 00681 g001
Figure 2. Distribution of electric potential (a) and electric field (b) obtained by numerical simulation at t = 0 s. Conditions: V = 1000 V, f = 50 Hz, and λ = 4 mm.
Atmosphere 14 00681 g002
Figure 3. Algorithm used for calculating particle trajectory [36].
Atmosphere 14 00681 g003
Figure 4. Trajectories of one single particle at several instants: (a) 50 ms, (b) 100 ms, (c) 200 ms, (d) 500 ms. Conditions: V = 1000 V, f = 5 Hz, d p = 60 µm, q p =10% q p s (positive polarity), x 0 = 4.3 mm.
Atmosphere 14 00681 g004
Figure 5. Evolution of the particle position x p t and its instantaneous displacement velocity v x t as a function of time at 5 Hz. Conditions: V = 1000 V, d p = 60 μm, q p =10%   q p s , x 0 = 4.3 mm, t = 250 ms.
Atmosphere 14 00681 g005
Figure 6. Evolution of the particle’s levitation height and its displacement distance as a function of the frequency. Conditions: V = 1000 V, d p = 60 μm, q p = 10% q p s , x 0 = 4.3 mm, t = 1 s.
Atmosphere 14 00681 g006
Figure 7. Evolution of the particle’s average and maximum velocities as a function of the frequency. Conditions: V = 1000 V, d p = 60 μm, q p   = 10% q p s , x 0 = 4.3 mm, t = 1 s.
Atmosphere 14 00681 g007
Figure 8. Particle trajectories for different frequency values (10 Hz, 20 Hz, 50 Hz, and 500 Hz). Conditions: V = 1000 V, d p = 60 µm, q p = 10% q p s , t = 500 ms.
Atmosphere 14 00681 g008
Table 1. Values of various parameters used during simulation.
ParametersValuesUnits
Amplitude of the applied voltage waveforms, V 0 1000V
Lamda, 𝜆 4   ×   10 3 /
Particle radius, r p 30µm
Particle relative permittivity, ε r p . 3.4/
Permittivity of the vacuum, ε 0 8.85   ×   10 12 /
Dynamic viscosity of the air, η g 1.85 × 10 5 kg . m 1 . s 1
Hamaker constant, A h (in the vacuum)Of the order of 10 19 J
Shortest distance between the particle and the substrate, D Of the order of 10 10 M
Quadratic mean value of the surface roughness, R M S ≈3Nm
Mean distance between the peaks of the asperities, γ ≈20Nm
Disclaimer/Publisher’s Note: The statements, opinions and data contained in all publications are solely those of the individual author(s) and contributor(s) and not of MDPI and/or the editor(s). MDPI and/or the editor(s) disclaim responsibility for any injury to people or property resulting from any ideas, methods, instructions or products referred to in the content.