Article

Ozone Formation at a Suburban Site in the Pearl River Delta Region, China: Role of Biogenic Volatile Organic Compounds

1
State Key Laboratory of Organic Geochemistry, Guangdong Key Laboratory of Environmental Protection and Resources Utilization, Guangzhou Institute of Geochemistry, Chinese Academy of Sciences, Guangzhou 510640, China
2
CAS Center for Excellence in Deep Earth Science, Guangzhou 510640, China
3
University of Chinese Academy of Sciences, Beijing 100049, China
4
Center for Excellence in Regional Atmospheric Environment, Institute of Urban Environment, Chinese Academy of Sciences, Xiamen 361021, China
*
Authors to whom correspondence should be addressed.
Atmosphere 2023, 14(4), 609; https://doi.org/10.3390/atmos14040609
Submission received: 26 February 2023 / Revised: 18 March 2023 / Accepted: 20 March 2023 / Published: 23 March 2023
(This article belongs to the Special Issue Air Pollution in China (2nd Edition))

Abstract

:
Ozone (O3) is becoming an increasingly concerning air quality problem in China, and previous O3 control strategies focused primarily on reducing anthropogenic volatile organic compounds (AVOCs), while neglecting the role of biogenic VOCs (BVOCs) in O3 formation. In this study, a field campaign was conducted at a suburban site in the Pearl River Delta region of China with high BVOC emissions from 29 August to 3 September 2020. An empirical kinetic modelling approach (EKMA) showed that VOC-limited was the dominant feature for O3 formation at the site. The relative incremental reactivity (RIR) values calculated by the box model (AtChem2-MCM) revealed that isoprene, formaldehyde, methylglyoxal and acetaldehyde had the highest RIRs. Simulation results from the box model also showed that isoprene played a substantial role in the formation of secondary carbonyls, especially contributing 32–92% to the formaldehyde production rate. Box model simulations further showed that during the O3 pollution period with high BVOC emissions, only near zero AVOC emissions could prevent O3 if the levels of nitrogen oxides (NOx) remained unchanged. The results suggest that the presence of high BVOC emissions can greatly impact efforts to control O3 by reducing AVOCs, particularly in regions with relatively high NOx levels (up to 51 ppbv in this study). In the long term, it may be essential to control NOx and choose low BVOC-emitting tree species in urban planning to address this issue, particularly as BVOC emissions are projected to become a more significant source of reactive VOCs with enhanced control of AVOCs.

1. Introduction

In the past three decades, severe ozone (O3) pollution events have become more frequent, which has aroused public concern worldwide [1,2,3,4]. As a secondary product, surface O3 is produced by a series of photochemical oxidation reactions between volatile organic compounds (VOCs) and nitrogen oxides (NOx = NO + NO2) in the presence of sunlight [5,6]. Elevated O3 concentrations not only impact vegetation growth, crop yields and climate change [7,8,9,10], but also have severe adverse effects on human health [11,12].
Due to the nonlinear relationship between O3 and its precursors, O3 pollution is becoming an increasingly distinctive air pollution problem, especially in developing countries such as China [13,14,15,16,17,18,19]. O3 formation is mostly in the VOC-limited regime in major urban agglomerations of China [20,21,22,23,24,25] and the transition regime or NOx-limited regime typically occurs in suburban/rural areas [26,27,28]. Alkenes were found to be important O3 precursors in the North China Plain (NCP) and Chengdu-Chongqing region [25,29,30], while aromatics and alkenes dominated O3 formation in the Yangtze River Delta (YRD) region, such as Shanghai and Hangzhou [31,32,33,34]. Studies in the suburban and rural sites of the Pearl River Delta (PRD) region have revealed that aromatics (such as xylenes and toluene) are the key precursors for O3 formation [31,35,36], while both aromatics and alkenes contribute greatly to O3 formation in downtown areas [30,37,38]. Nevertheless, recent studies revealed that biogenic VOCs (BVOCs) were among the more sensitive species to O3 formation in terms of their incremental relative reactivity (RIR) in the PRD region in the tropical/subtropical southern China [39,40,41], or even in other areas of China [42,43]. The early studies in Atlanta, USA, with strong BVOC emissions showed that neglecting the impact of BVOCs on O3 formation might overestimate the effectiveness of O3 abatement strategies based on reducing anthropogenic VOCs, emphasizing that while controlling anthropogenic emissions of VOCs, attention should also be paid to the control of anthropogenic NOx emissions [44,45]. As a matter of fact, BVOC emissions have been on the rise in China since 2010 [46]. Therefore, elucidating the role of BVOCs in O3 formation is crucial for effectively regulating O3 air pollution, especially in regions such as the PRD in south China, with relatively higher BVOC emissions [47].
The PRD region is one of the most developed urban agglomerations in China, where intensive anthropogenic VOC and NOx emissions lead to O3 air pollution, especially in the warm seasons [48,49]. In addition, the PRD region has a subtropical ocean monsoon climate characterized by abundant rainfall, high temperature and wide vegetation coverage. The vegetation type in this region is mainly subtropical evergreen broadleaf forest with high BVOC emission potentials [50,51,52]. BVOC emission inventories have shown that the annual average BVOC emission flux is much higher in the PRD region than in other parts of China [53,54]. Air quality modelling studies in the PRD region have indicated that BVOC emissions greatly impact the surface O3 peak levels in summer and autumn, with a maximum increase of 20.0–34.0 ppbv [55,56,57], yet observation-based studies are needed to verify and deeply understand the effects of BVOCs at varied locations.
In this study, we conducted field measurements of O3 and its precursors (VOCs and NOx), as well as other trace gases, at a suburban site in the PRD region in 2020. The characteristics of BVOCs and their contributions to O3 formation were investigated and compared with those of other VOC species. In addition, based on the box-model with the Master Chemical Mechanism (MCM v3.3.1), we explored to what extent reducing VOCs under the influence of BVOCs can alleviate O3 air pollution.

2. Methodology

2.1. Site Description

The intensive field campaign was conducted from 29 August to 3 September 2020 at a site approximately 17 m above the ground on the roof top of a 6-storey building on the campus of Huadu Vocational and Technical School (23.39° N, 113.23° E; Figure S1), ~25 km away from the urban center in the north of Guangzhou. The vegetation coverage rate in Huadu District is 38.3% (data source: https://www.huadu.gov.cn/gkmlpt/content/8/8023/mpost_8023183.html (accessed on 20 February 2023)), and the plants around the site are eucalyptus, which has a high isoprene emission potential [58,59]. A state-controlled air quality monitoring station is located at this site. There are forest parks, residential buildings, traffic roads and scattered industrial blocks in the neighborhood (Figure S1).

2.2. Sample Collection and Chemical Analysis

Trace gases (i.e., NO-NO2-NOx, CO, SO2 and O3) and meteorological parameters (i.e., pressure, relative humidity (RH), temperature (T), solar radiation, wind speed and wind direction) were determined simultaneously during the campaign. The O3 pollution days were defined as the days with a maximum daily 8-h average (MDA8) O3 concentration exceeding the secondary standard limit of China’s current National Ambient Air Quality Standard (NAAQS) of 160 µg m−3 (equivalent to 75 ppbv). According to the MDA8 O3 levels, the whole observation period could be divided into a heavy O3 pollution period (>95 ppbv; 29 August; P1), a light O3 pollution period (75–85 ppbv; 1 September; P2), a moderate O3 pollution period (85–95 ppbv; 1–2 September; P3) and a non-O3 pollution period (≤75 ppbv; 30–31 August; NP). Trace gases were monitored by online Thermo Scientific Environmental Instruments at the HD site, including the NOx analyzer (Model 42i, Thermo Scientific Inc., Boston, Mass, USA), the gas filter correlation method CO analyzer (Model 48i, Thermo Scientific Inc., Boston, Mass, USA), the pulsed fluorescence SO2 analyzer (Model 43i, Thermo Scientific Inc., Boston, Mass, USA) and the UV photometric O3 analyzer (Model 49i, Thermo Scientific Inc., Boston, Mass, USA). Meteorological parameters were measured by an automatic weather station at the HD site. The solar radiation data were obtained from the monitoring data of the Guangzhou Meteorological Monitoring and Warning Center. The 3-h planetary boundary layer heights (PBLH) for the HD site were obtained from the Global Data Assimilation System (GDAS) (https://ready.arl.noaa.gov/READYamet.php (accessed on 12 November 2022)).
During the sampling period, 2-h average samples were consecutively taken at 6:00–8:00, 8:00–10:00, 10:00–12:00, 12:00–14:00, 14:00–16:00, 16:00–18:00, 18:00–20:00 and 20:00–22:00 local time (LT) every day. Cleaned and evacuated stainless-steel canisters were used to collect air samples with a model 910 canister sampler (Xonteck Inc., Fremont, CA, USA) to allow each canister to be filled within 120 min at a constant flow of 33.4 mL/min [41]. Ambient carbonyls were sampled simultaneously by drawing ambient air through 2,4-dinitrophenylhydrazine (DNPH)-coated sorbent cartridges. The nonmethane hydrocarbons (NMHCs) in the collected air samples were analyzed with an Agilent 5973N gas chromatography-mass selective detector/flame ionization detector (GC-MSD/FID, Agilent Technologies, USA). CH4 in the air samples was also analyzed by a gas chromatography (Agilent 6890 GC, Agilent Technologies, Santa Clara, CA, USA) equipped with an FID (flame ionization detector) and a packed column (5A Molecular Sieve 60/80 mesh, 3 m × 1/8 inch). The detailed chemical analysis, quality control and quality assurance for NMHCs and CH4 were given in our previous studies [60,61,62,63,64]. The carbonyls samples were analyzed by a high-performance liquid chromatography (HPLC) system (HP1200, Agilent Technologies, Santa Clara, CA, USA) and detected with an ultraviolet detector (the detecting wavelengths of monocarbonyl and dicarbonyl were 360 nm and 420 nm, respectively). The detailed laboratory analysis of carbonyls can be found elsewhere [65]. The method detection limits (MDLs) and average concentrations for the measured VOCs are listed in Table S1.

2.3. AtChem2-MCM Model

2.3.1. Model Description and Input

In this study, a zero-dimensional chemical box model coupled with Master Chemical Mechanism (version 3.3.1; http://mcm.leeds.ac.uk (accessed on 3 November 2022)) (AtChem2-MCM) was applied to investigate the relationships between O3 and its precursors. This model provides near explicit gas-phase chemistry involving 6700 chemical species and 17,000 reactions [66,67,68]. The deposition processes of inorganic gases, oxygenated VOCs, PANs, peroxides and organic acids within the boundary layer were also considered in the model [31]. However, the model considered neither the heterogeneous reactions nor the transport process. Detailed descriptions about the parameters and model running can be found elsewhere [41,69].
The input data, including the NMHCs (alkanes, alkenes, alkynes, aromatics and BVOCs), carbonyls (formaldehyde, acetaldehyde, acetone, propionaldehyde, 2-butanone, benzaldehyde, glyoxal and methylglyoxal), CH4, NO, NO2, O3, CO, SO2 and meteorological parameters (temperature, pressure, relative humidity, boundary layer height and j(NO2)) were averaged or interpolated with a time resolution of 1 h as the constraints of the model. The model was run at 00:00 local time (LT) as the initial time.

2.3.2. Model Performance

The index of agreement (IOA) with a value between 0 and 1, calculated by Equation (1) [70], is used to indicate the model performance. A higher value represents a better agreement between observation and simulation.
IOA = 1 i = 1   n O i   - S i 2 i = 1 n O i   O - + S i   O - 2
where Oi and Si represent the observed and simulated values, respectively;  O -  represents the average of observations; and n is the number of samples. Figure S2 presents the comparison between the simulated model and the observed O3 during the campaign, with an IOA value of 0.6. It is worth noting that during the study period, the daytime O3 peak (15:00–18:00) appeared later than the solar radiation peak (12:00–13:00), and a small O3 peak was also observed at night (up to 75.6 ppbv), indicating significant regional transport of O3 at the HD site. This is the main reason affecting the performance of the box model considering only local production.

2.3.3. Relative Incremental Reactivity (RIR)

Relative incremental reactivity (RIR), which is defined as the ratio of the decrease in the O3 production rate to the decrease in precursor concentrations without detailed knowledge of these emissions [71], has been widely applied in previous studies to indicate the sensitivity of O3 formation to precursors [30,36,38,40,72,73]. With the AtChem2-MCM model, the RIR for a specific precursor X at site “S” is given by:
RIR S X = P O 3 - NO S X P O 3 - NO S X X   /   P O 3 - NO S ( X ) S ( X )   /   S ( X )
P O 3 N O = k H O 2 + N O HO 2 NO + k R O 2 + N O RO 2 NO k O 1 D + H 2 O O 1 D H 2 O k O 3 + a l k e n e s O 3 alkenes k O 3 + O H O 3 OH k O 3 + H O 2 O 3 HO 2 k N O 2 + O H [ NO 2 ] [ OH ]
where X represents the relevant precursor (VOC species, CO or NO); S(X) is the observed concentrations of species X, which represents the combined flux of regional transport and the amounts emitted at the site; ∆X is the change in the concentration of X caused by a hypothetical change in S(X) (20% S(X) in this study); and  P O 3 - NO S  is defined as the O3 formation potential from 07:00 to 19:00, which is the net amount of O3 production and NO consumed (Equation (3)).

2.3.4. Empirical Kinetic Modelling Approach (EKMA)

The empirical kinetic modelling approach (EKMA) refers to a series of O3 isopleths made by the photochemical reaction model, reflecting the nonlinear relationship between O3 and its precursors to improve reduction strategies, as shown in Equation (4) [28,74]. EKMA judges its effect on the peak O3 concentration by changing the initial concentration of O3 precursors VOCs and NOx to identify the response relationship between O3 and its precursors. Generally, from the perspective of the feasibility of implementing control measures, only emission reduction control research is conducted on precursors emitted by anthropogenic sources, while VOCs emitted by biogenic sources remain at their original levels. In this study, the EKMA was based on MCM, and the measured 1-h averages of species except NOx and VOCs during the whole campaign were used as the constraint conditions of the box model. The campaign-averaged concentrations of VOCs and NOx from 7:00 to 19:00 were selected as the original concentrations (base case), and the concentrations of VOCs and NOx were scaled under the base case. The daily maximum value of O3 generation was taken as the concentration after the reaction. The simulation period is from 6:00 to 20:00, where outdoor air quality has a greater impact on human activities.
P O 3 = f ( N O x ± N O x , V O C s ± V O C s )

3. Results and Discussion

3.1. Overviews

3.1.1. Levels of Meteorological Parameters and Measured Species

Statistical descriptions about the levels of meteorological parameters and measured species at the HD site during the four periods are provided in Table 1, and their time series are presented in Figure 1. The daily averaged O3 level in NP (50.6 ± 22.6 ppbv) was higher than that in P2 (43.3 ± 25.9 ppbv) or P3 (48.6 ± 35.0 ppbv), but lower than that in P1 (69.2 ± 33.1 ppbv), while the 1-h O3 maximum value in NP (77.5 ppbv) was the lowest among that in P1 (127.0 ppbv), P2 (82.6 ppbv) and P3 (100.0 ppbv). MDA8 O3 concentrations ranged from 63.4 ppbv (NP) to 98.6 ppbv (P1), which was comparable to those reported in polluted NCP and YRD regions [75,76,77]. The average concentrations of SO2 and CO in NP were 1.8 ± 0.5 ppbv and 725.0 ± 96.8 ppbv, respectively, which were lower than those in the other three O3 pollution periods. The levels of SO2 and CO at the HD site were similar to those in some polluted suburban areas in the PRD region [31,40,78].
As for the O3 precursors, the average NOx concentration was approximately 20 ppbv (up to 51 ppbv), which was higher than in some polluted suburban areas and even a few urban areas [38,40,73,79], and lower than most urban areas [41,73,80,81]. Due to the morning peak, the peak of NO usually occurred around 8:00 and could reach up to 22.4 ppbv, while the NO2 concentration level was very high during 21:00–9:00, up to 48.7 ppbv, which might be related to the higher NOx emissions from diesel vehicles at night. The average TVOCs concentration (~37.2 ppbv) was between the values previously reported in the PRD region, ranging from 21.1 to 73.8 ppbv [36,41,49,82,83]. Both NOx and total VOCs (TVOCs) (including 62 NMHCs and 8 carbonyls) showed higher mixing ratios in P1 (23.6 ± 11.6 ppbv and 44.5 ± 16.7 ppbv, respectively) compared with the other three periods (Table 1). A comparison between P3 and NP revealed that TVOCs were comparable in P3 and NP, while NOx was 18% higher in P3 than in NP (Table 1). The average concentrations of NOx and TVOCs in P2 were 15.5 ± 7.7 ppbv and 25.9 ± 14.1 ppbv, respectively, which were not only lower than those in P1 or P3, but even lower than those in NP. However, the proportion of active VOCs (BVOCs and carbonyls) in P2 (51%) was much higher than that in P1 (45%), P3 (45%) or NP (46%), especially the BVOCs concentration, which was up to 5.6 ppbv. The mean temperature (31.2 ± 2.6 °C) and solar radiation (434 ± 293 W m−2) in NP were lower than that in P1 (32.5 ± 2.1 °C, 459 ± 330 W m−2), P2 (31.5 ± 2.7 °C, 544 ± 378 W m−2) and P3 (32.4 ± 2.43 °C, 511 ± 348 W m−2), while the mean relative humidity (67.3 ± 13.7%) was higher than that in P1 (60.7 ± 8.9%), P2 (66.4 ± 11.1%) and P3 (60.1 ± 11.0%). In all four periods, the mean wind speeds were similar (~1 m s−1). The ratio of toluene to benzene (T/B) has been widely used to represent the source contribution of aromatic solvents, with a value greater than 3 indicating the presence of solvent-related sources [84,85,86]. Although T/B ratios averaged 11 in NP, which were over 20% higher than that of 7 in P1, 9 in P2 or 6 in P3 (Figure S3), the adverse meteorological conditions (the weakest solar radiation, the lowest temperature and the highest relative humidity) in NP offset the impact of aromatic solvents on O3 formation. Therefore, meteorological factors might be the main reason affecting whether the MDA8 O3 concentration exceeded the guideline standard (75 ppbv) in this O3 pollution process.

3.1.2. Diurnal Variation

Figure 2 presents the average diurnal variations in meteorological parameters and major trace gases at HD during the four periods. These diurnal variations reflected the interplay of primary emissions, atmospheric photochemical processes, and meteorological conditions. With the gradual increase in solar radiation, the O3 concentration began to increase in the early morning (approximately 06:00). Different from previous studies showing a unimodal O3 diurnal variation (reaching a peak at approximately midday and then decreasing) in some urban areas [21,25,87,88], the O3 concentrations in this study exhibited a broadened peak in the afternoon (12:00–18:00 LT) at the HD site due to the influence of regional transport [89]. Compared with the three O3 pollution periods, the daytime O3 levels in NP were significantly lower, accompanied by a lower temperature, weaker solar radiation and higher humidity. However, at night and in the early morning (0:00–9:00 and 21:00–24:00), the O3 concentrations in NP were higher than that in P2 and P3, which might be due to regional transport (wind speeds up to ~2 m s−1).
Diurnal variations in NO, NO2 and CO all showed peaks in the morning rush hour at approximately 9:00, with the lowest concentrations at approximately 15:00 in the afternoon, and NO2 and CO also showed high concentrations during the evening. The diurnal variations in the VOC groups (including alkanes, alkenes, aromatics, alkynes and carbonyls) showed variations similar to those of CO and NOx, which might be related to significant primary emissions (e.g., vehicle exhaust), photochemical reaction consumption and boundary layer uplift at noon. In comparison, the diurnal variation in BVOCs was different from that of other VOCs, with the maximum value appearing at 12:00–15:00, corresponding to the maximum temperature value, and the maximum value in NP was smaller than in the other three O3 pollution periods. Previous studies have shown that high temperature could promote BVOC emissions [90,91,92]. In addition, the average levels of carbonyls in all periods were higher in the morning and evening and peaked at noon (approximately 12:00), reflecting the combined impact of primary emissions and secondary formation.

3.2. O3-Precursor Relationships

3.2.1. O3–VOCs–NOx Sensitivity

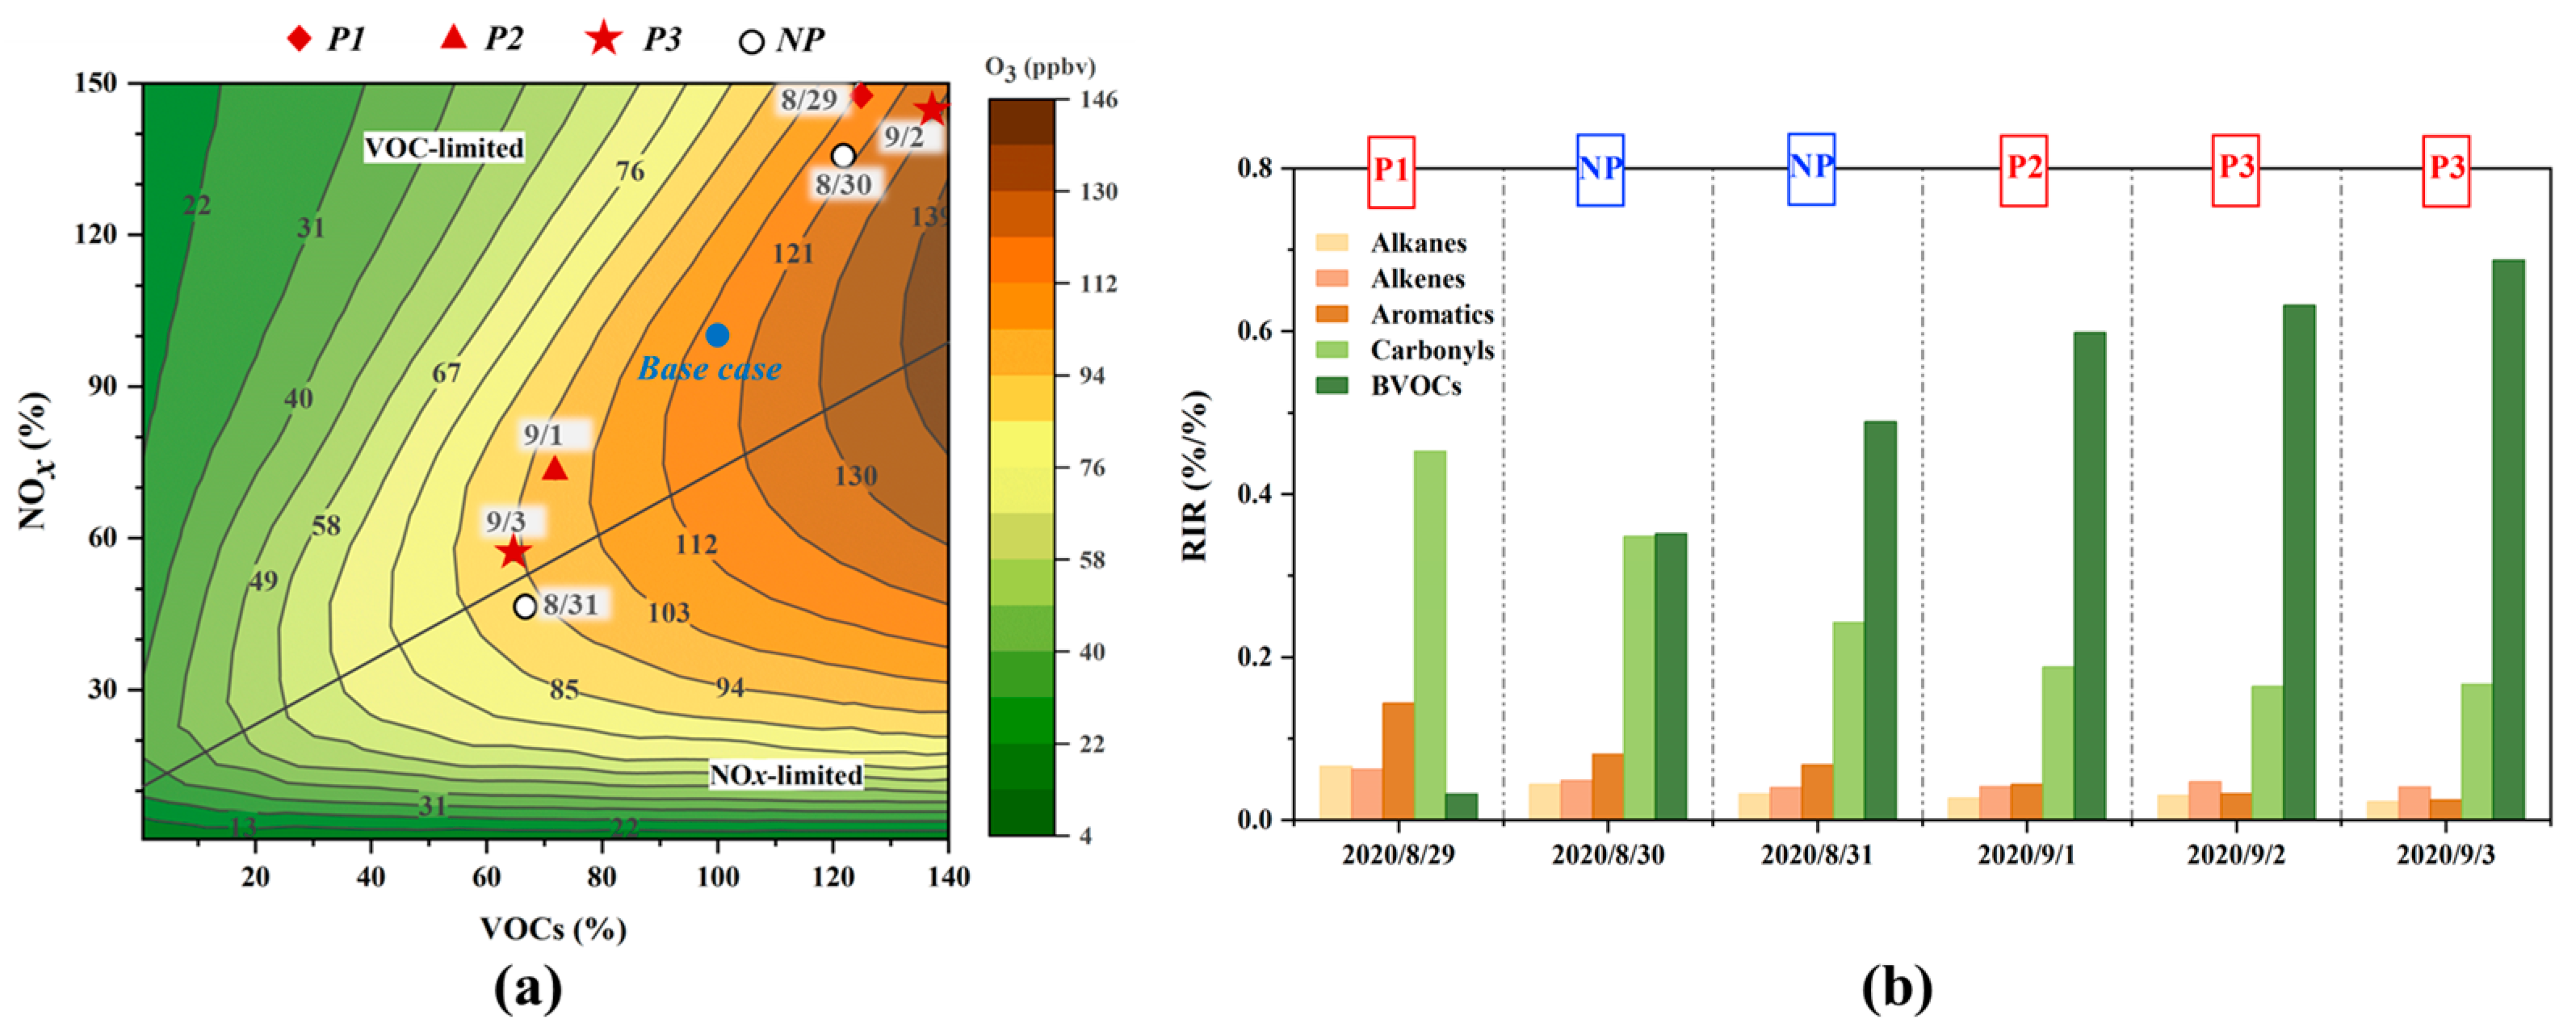
The change of NOx and VOCs will influence the O3 production, and this O3–VOCs–NOx sensitivity can be reflected by the O3 isopleth diagram. The base case model input data can be found in Section 2.3.4. Based on the base case, VOCs and NOx were scaled to obtain 77 model scenarios (11 NOx × 7 VOCs), and the maximum O3 under each scenario was selected to plot the O3 isopleth, as shown in Figure 3a. The grid line divides the diagram into two parts, namely VOC-limited (upper) and NOx-limited (lower) regimes. It was clear that the whole sampling period was above the grid line, except 31 August, which was slightly below the grid line, indicating that VOC-limited was the dominant feature for O3 production at this site. This result was consistent with previous studies in the PRD region [30,83,93,94], indicating that reducing VOCs could depress O3 formation.
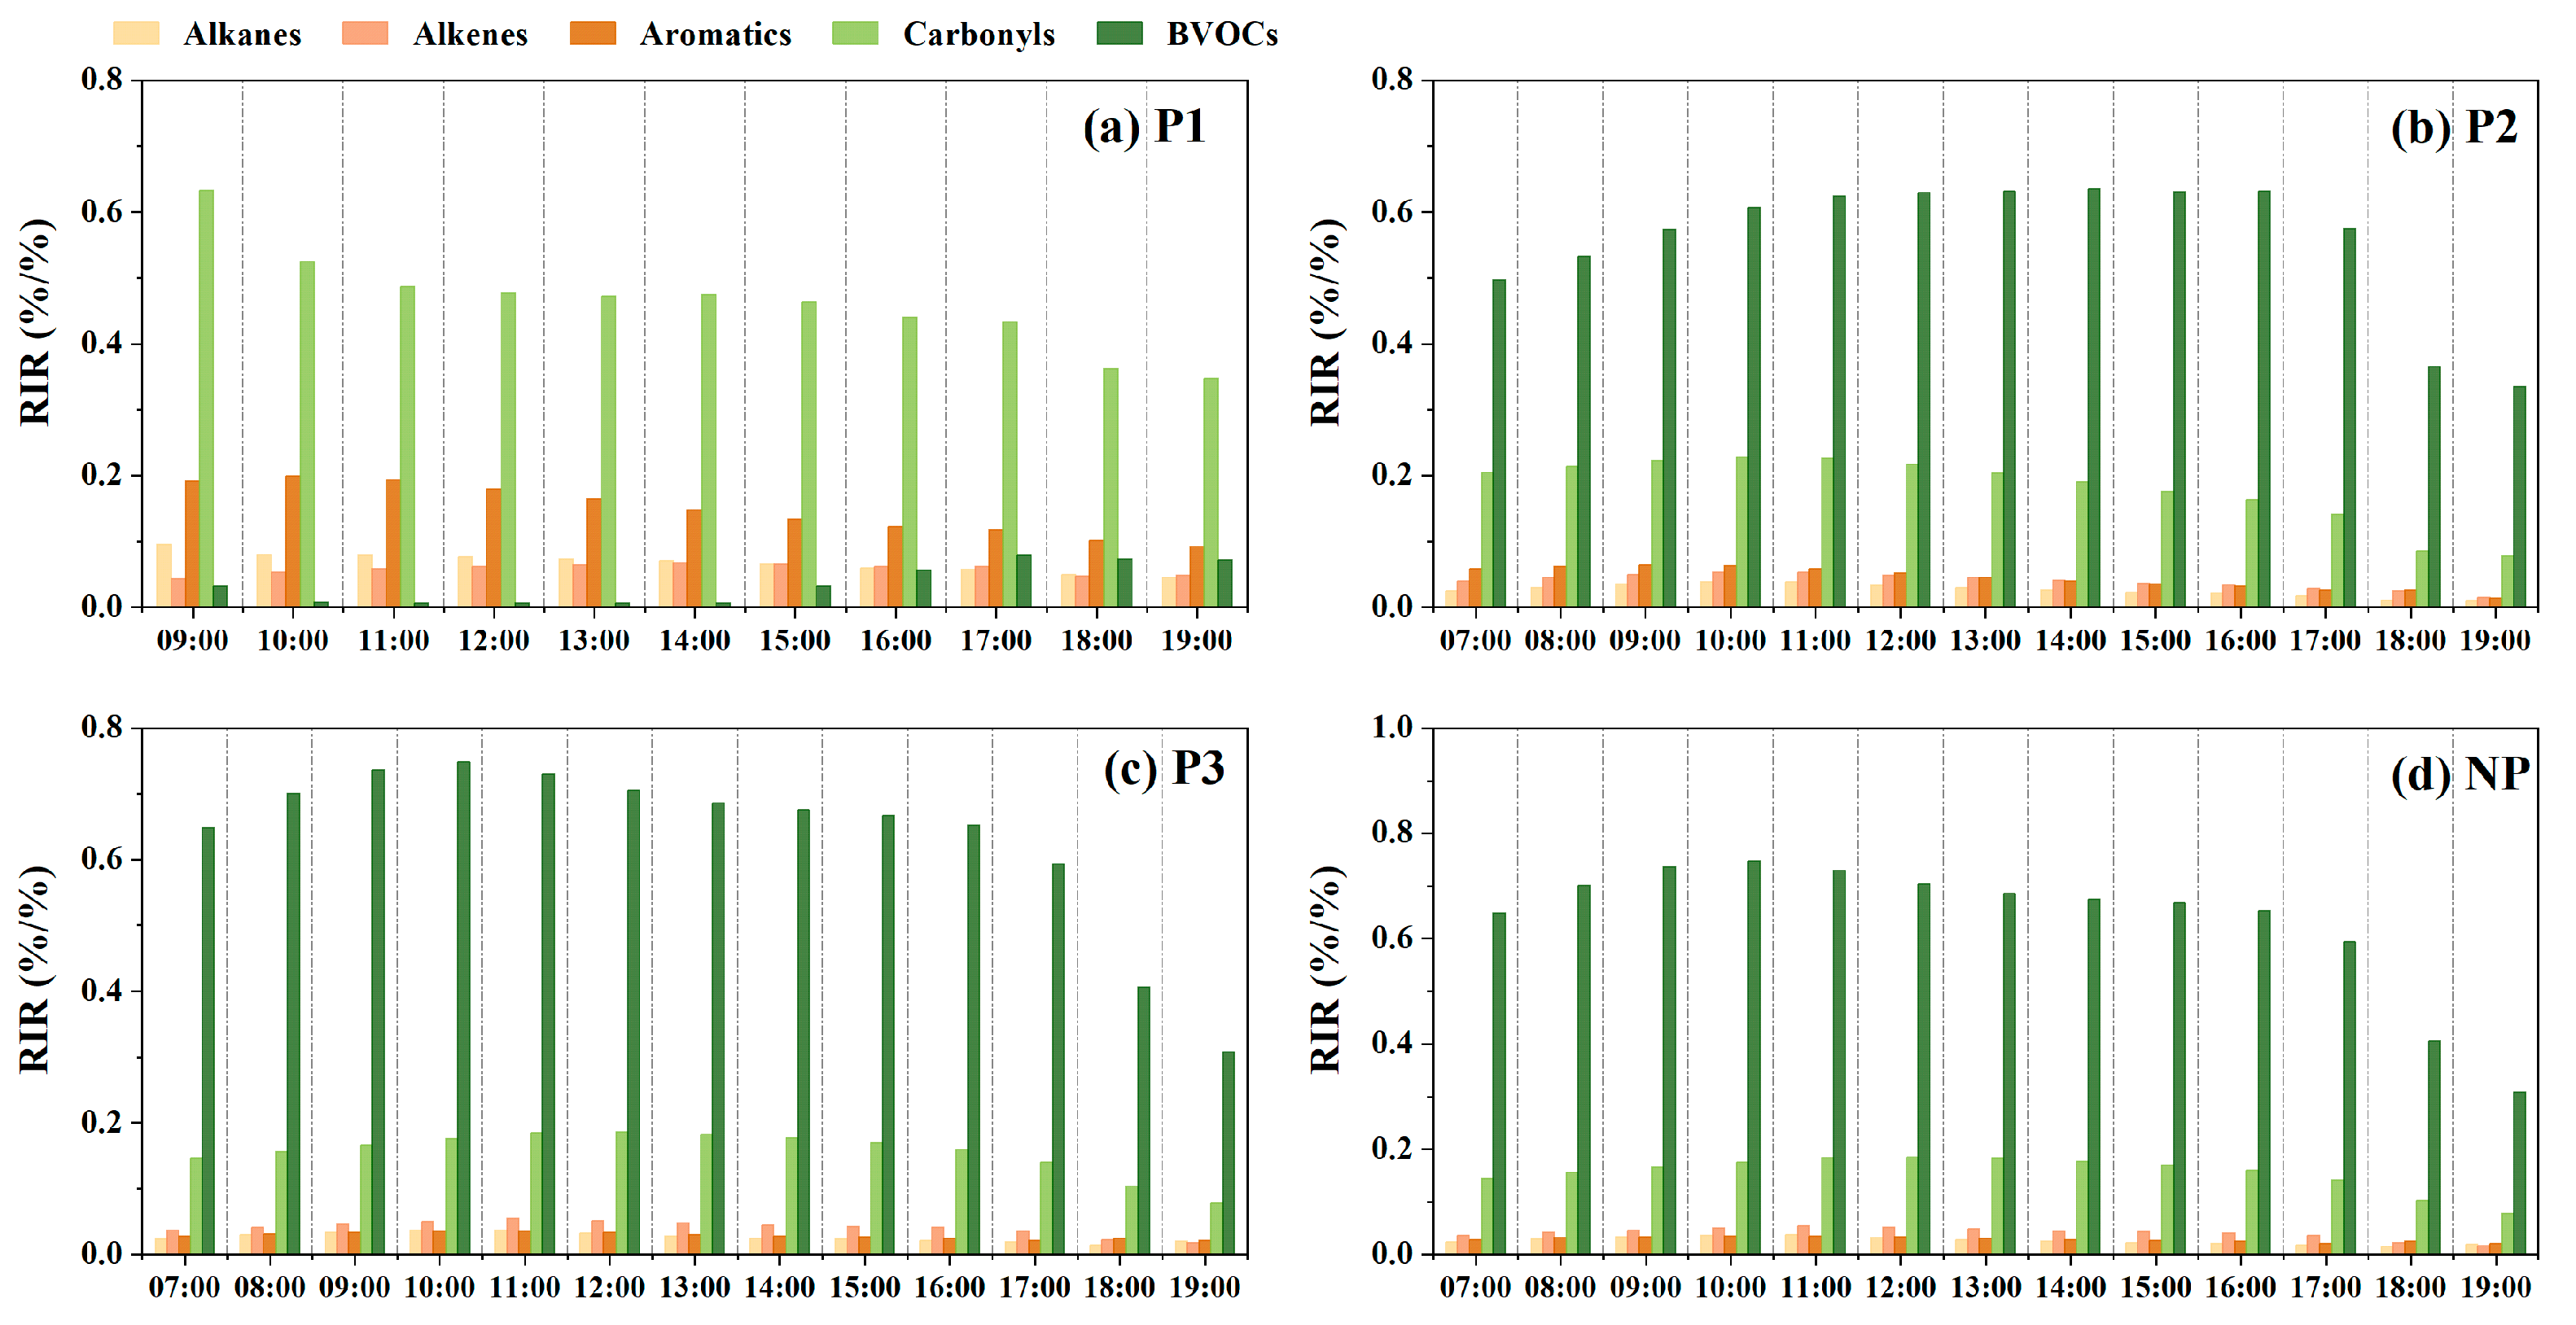
Figure 3b shows the model-calculated RIR values of the VOC groups including alkanes, alkenes, aromatics, carbonyls and BVOCs. In all the VOC groups, except for carbonyls with the highest RIR value in P1, BVOCs had the highest RIRs (0.55 ± 0.13) in the other three periods, which was similar to the results previously reported in urban Guangzhou [41] and suburban Wuhan [95] on O3 episode days. Carbonyls (0.22 ± 0.08) showed a lower RIR value than BVOCs, but the level was also much higher than those of aromatics (0.05 ± 0.02), alkenes (0.04 ± 0.01) and alkanes (0.03 ± 0.01) during P2, P3 and NP. Similarly, it was also found that the pattern of diurnal variations in the RIRs of VOC groups in P1 was completely different from the patterns of the other three periods (Figure 4). In P1, the RIRs of carbonyls were significantly higher than those in the other three periods, with the maximum occurring at approximately 9:00 and the minimum occurring at approximately 18:00, which was similar to the diurnal variations of their concentrations (Figure 2). The RIRs of BVOCs showed a trend of being higher in the morning and evening and lower around noon in P1 due to the lower concentrations of BVOCs in the 9:00–13:00 period (<1 ppbv), contrary to the other three periods. Our results demonstrate that the dominant roles of BVOCs in O3 formation in the suburban area of the PRD region were associated with higher BVOC emissions.

3.2.2. Relative Importance of VOCs in O3 Formation

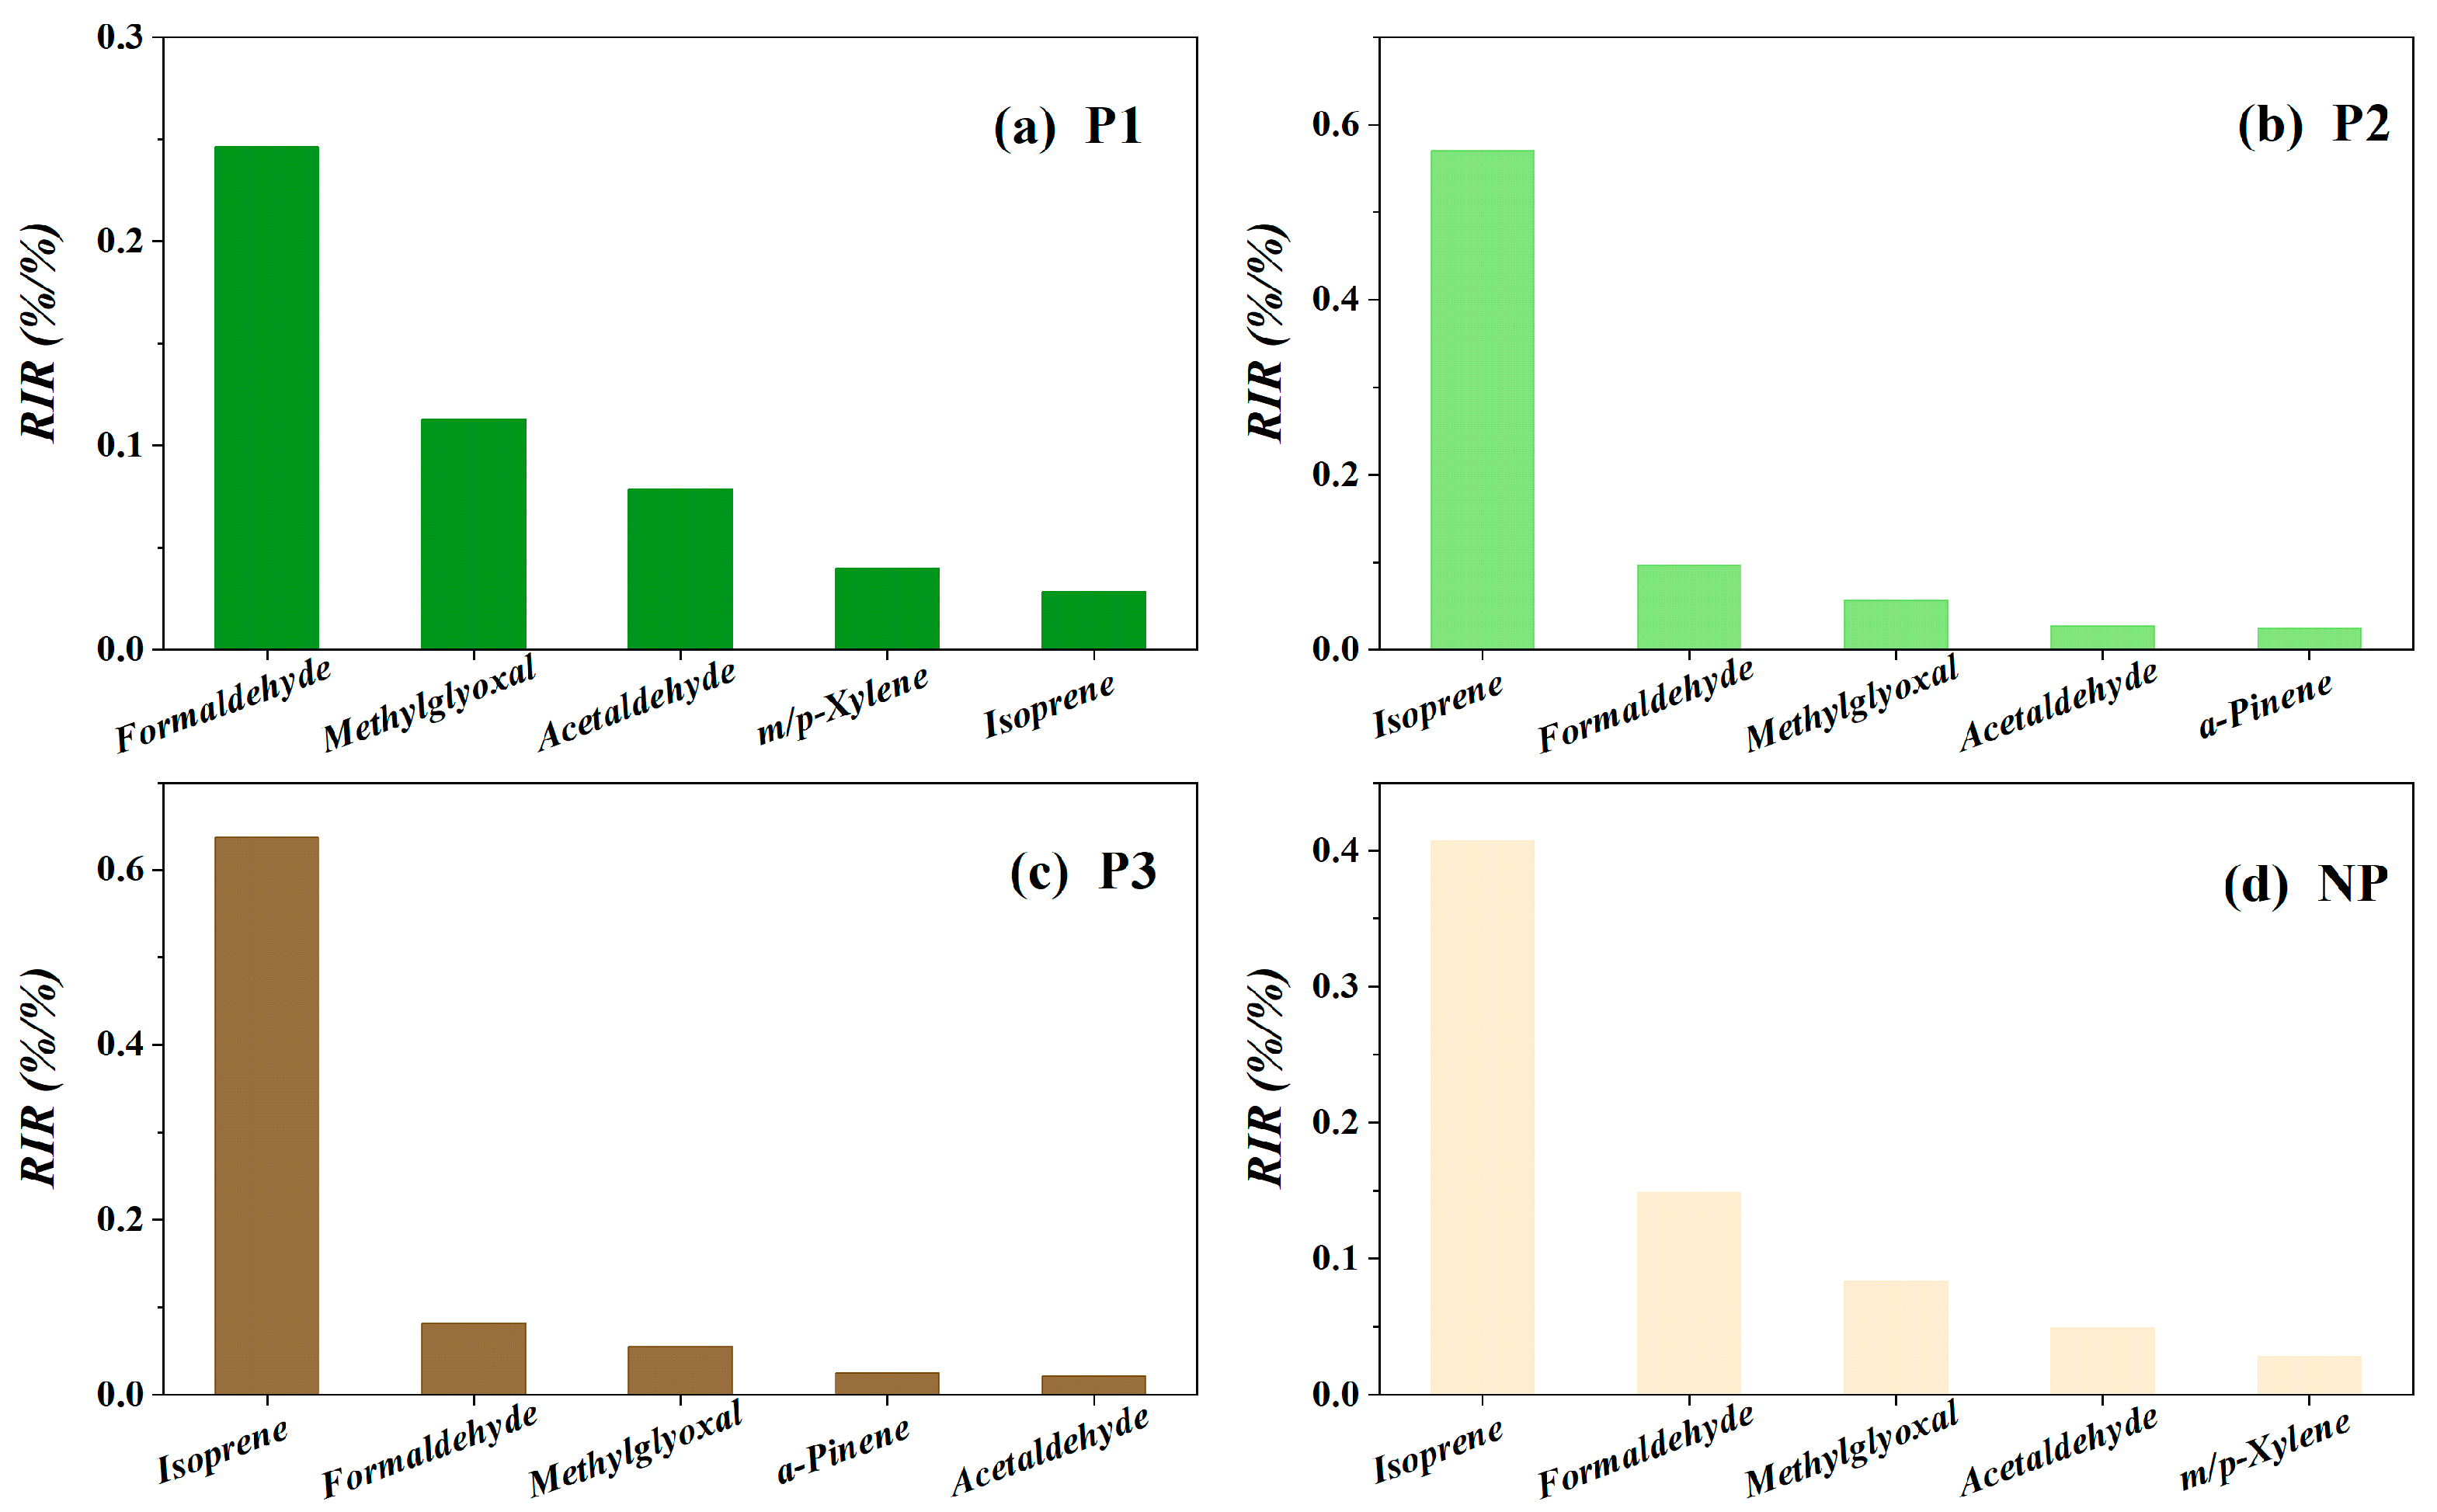
The RIR values of each VOC species were further calculated, and the top 5 VOC species with average RIR values were selected during the four periods, as shown in Figure 5. The daily top 10 VOC species with RIR values can be found in Table S2. It was found that formaldehyde was the most sensitive to O3 formation in P1, while isoprene was the most sensitive to O3 formation in the other three periods. The RIR values of isoprene, formaldehyde, methylglyoxal and acetaldehyde ranked in the top 5 in all four study periods. The difference was that the RIRs of m/p-xylene also ranked in the top 5 in P1 and NP, while those of α-pinene ranked in the top 5 in P2 and P3. It was found that isoprene was also ranked first by RIRs at a suburban site in Hong Kong and a rural site in Zhuhai, Guangdong [40]. Isoprene was also found to be most sensitive to O3 formation in central and southwestern China, which has high forest coverage [42,43].
In this study, isoprene was also an important precursor of carbonyls, especially the contribution to formaldehyde, methylglyoxal and glyoxal, which ranked first (Figure S4), and these carbonyls were more sensitive to O3 formation, which meant that isoprene was the most sensitive species to O3 formation. Figure 6 shows the model-calculated formaldehyde production rate from the degradation of VOC species during the four periods. In P1, P2, P3 and NP, the contribution of isoprene to the total formaldehyde production rate far exceeded that of other VOC species, with contribution rates of 32%, 92%, 92% and 78%, respectively. The contribution of isoprene to the formaldehyde production rate was different in the fourth period, which was mainly related to the isoprene concentration, and the higher the concentration, the greater the contribution. It is worth noting that the factors affecting the difference of BVOC levels in the four periods are different. BVOC concentrations in P1 were very low (<1 ppbv) from 7:00 to 13:00, but more than 1 ppbv after 13:00 (Figure 2). The change of BVOC concentrations in P1 corresponded to the change of wind direction, that is, from easterly wind (7:00–13:00) to northerly wind (14:00–17:00), while in other periods, northerly wind dominated during the day (Figure 1), indicating that the change of wind direction might affect the contribution of emission sources to the VOCs’ concentrations. The contribution of isoprene to the formaldehyde production rate in NP was less than that in P2 and P3, mainly related to the lower temperature in NP (31.2 ± 2.6 °C) than in P2 (31.5 ± 2.7 °C) and P3 (32.4 ± 2.43 °C), and previous studies have shown that a high temperature could promote BVOC emissions [90,91,92]. In addition to isoprene, aromatics (e.g., toluene, xylenes and ethylbenzene) and alkenes (e.g., propene, trans-2-butene and cis-2-butene) were also important precursors of carbonyls. Moreover, in previous studies in some areas of the PRD, aromatics and alkenes were still the most important O3 precursors [35,37,41,81,96]. In the case of difficult control of isoprene, the effectiveness of controlling anthropogenic VOC (AVOC) emissions to alleviate O3 pollution is discussed further below.

3.3. AVOCs Control Strategies under the Influence of High BVOC Levels

From the discussions and results above, it can be seen that the sensitivity of BVOCs to O3 formation is dominant, but the emission of BVOCs is difficult to effectively control in the short-term. Therefore, more attention should be paid to controlling AVOC emissions, especially in areas where O3 formation is VOC-limited but BVOC levels are high. AVOCs are emitted from various sources, among which alkanes mainly come from gasoline-related emission sources (e.g., on-road mobile source and fuel oil storage and transportation), alkenes from combustion sources (e.g., mobile source and biomass combustion), aromatics from industrial-related emission sources, and primary carbonyls mainly come from cooking processes [85,97,98,99,100]. Then, under the existing atmospheric conditions, it is a question of to what extent to control the AVOCs to effectively alleviate O3 pollution.
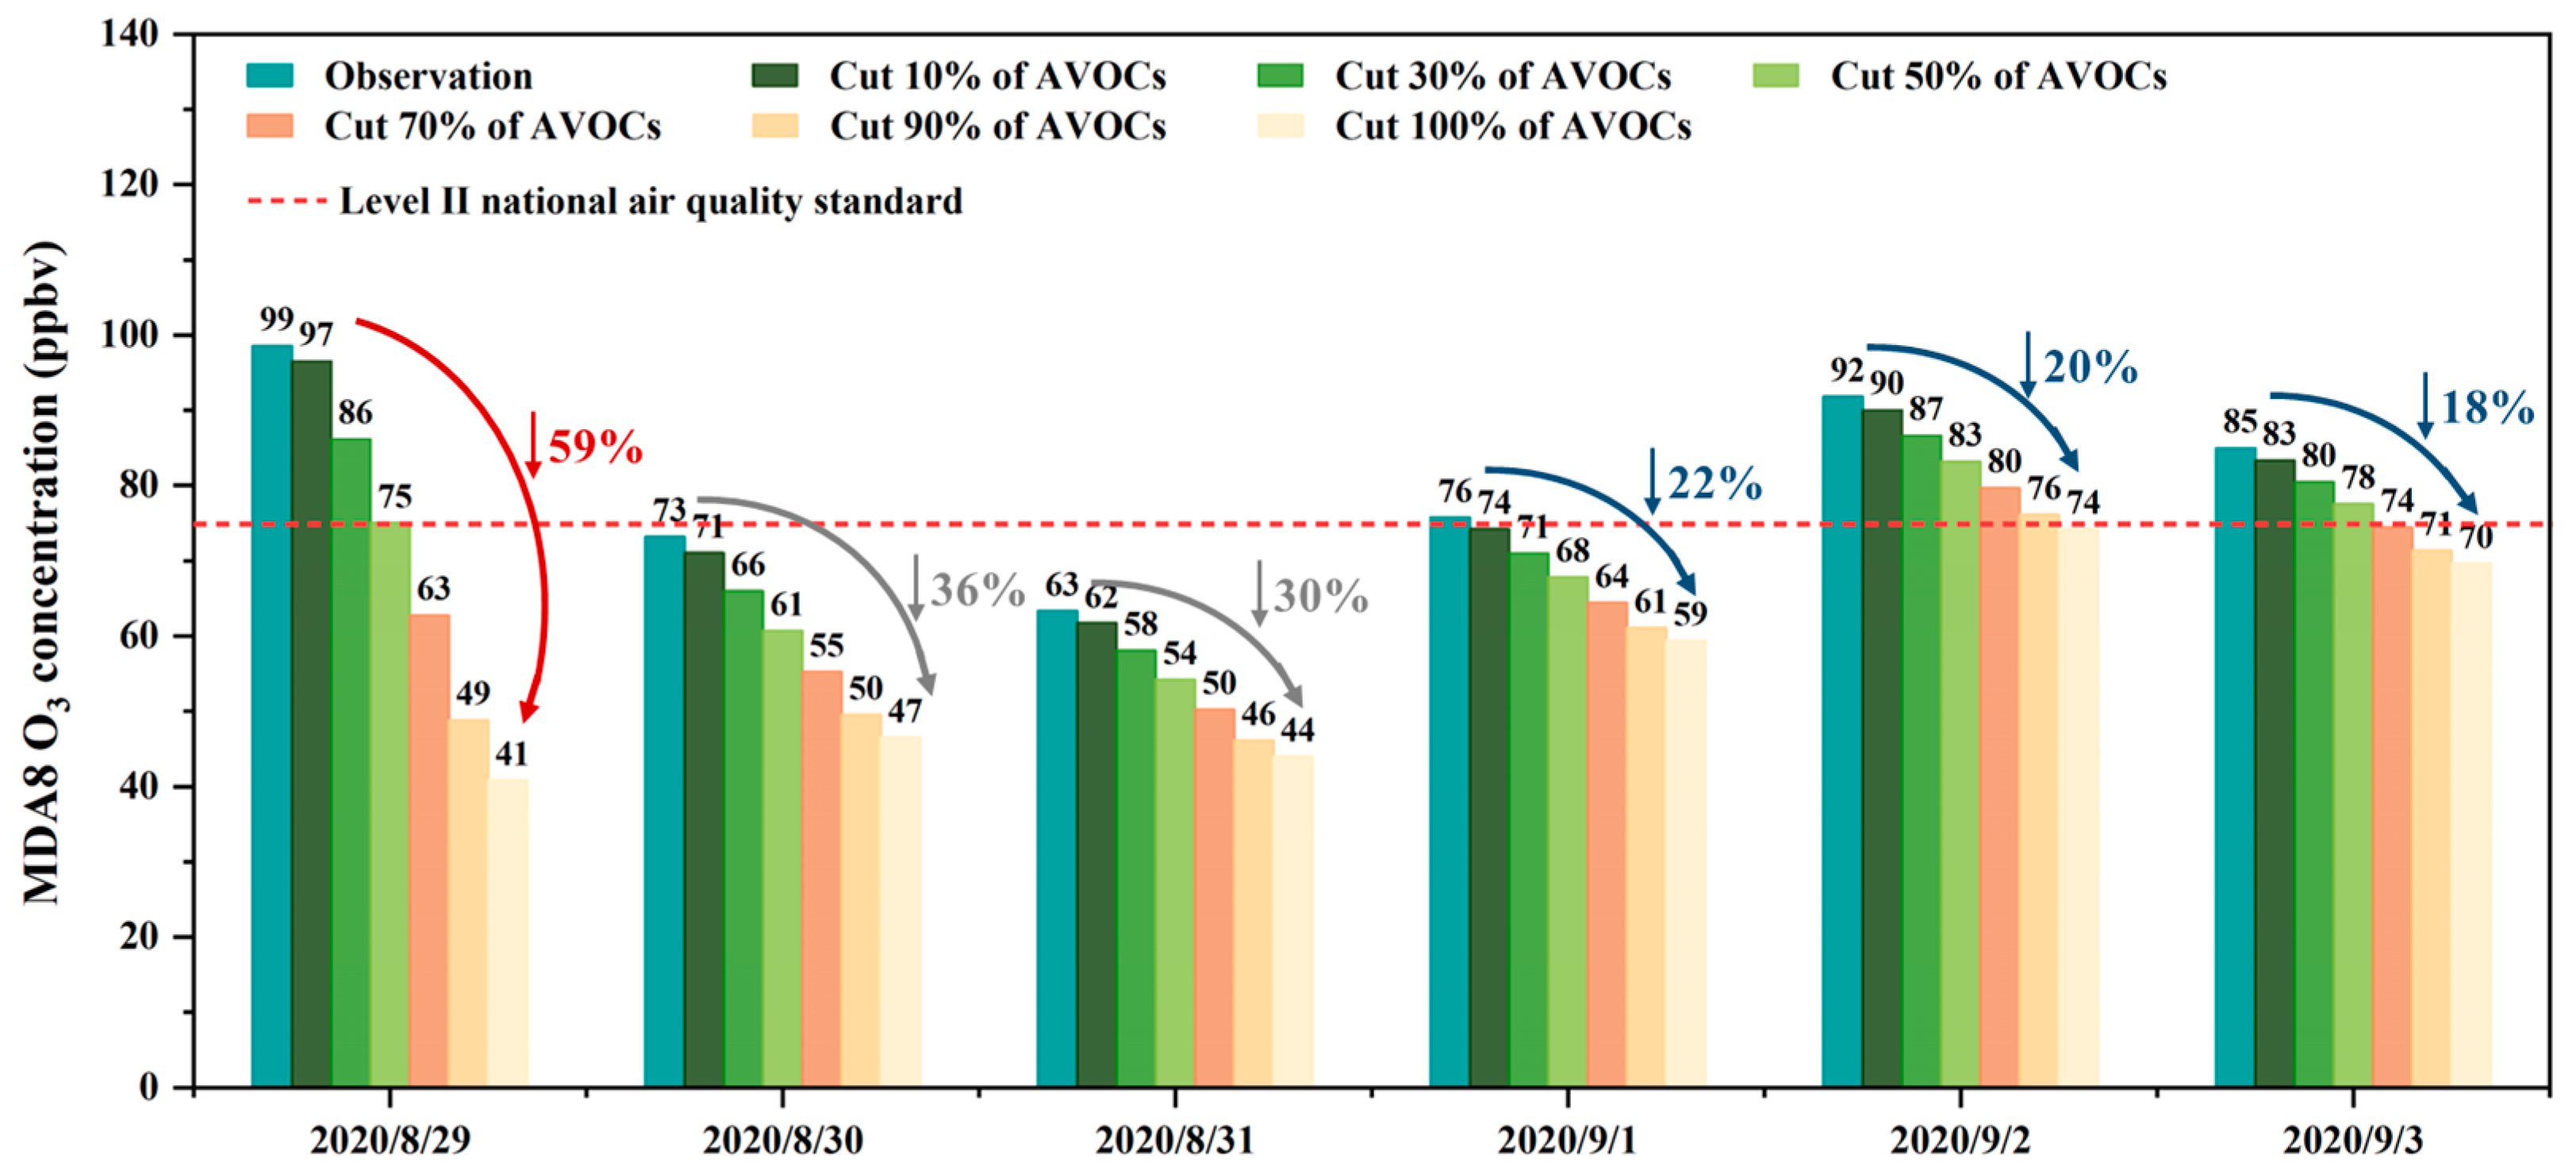
Considering that formaldehyde was the most sensitive to O3 formation among the carbonyls and mainly came from the secondary oxidation process of isoprene, we designed a series of AVOC concentration reduction schemes while keeping the concentrations of NOx, BVOCs and formaldehyde unchanged. The results are shown in Figure 7. There were four O3 pollution days during the whole observation period, August 29 (P1), 1 September (P2) and 2–3 September (P3), with the maximum concentration of MDA8 O3 concentrations on 29 August being approximately 99 ppbv. It was found that with the decreasing percentage of AVOC concentrations gradually increasing from 0 to 100%, the MDA8 O3 concentrations in P1 rapidly decreased from 99 ppbv to 41 ppbv by ~59%. However, when the AVOCs levels were reduced by 100%, the MDA8 O3 concentrations in P2 and P3 decreased by only ~20%, and for each day, the MDA8 O3 concentrations decreased from 76 ppbv to 59 ppbv on 1 September, from 92 ppbv to 74 ppbv on 2 September, and from 85 ppbv to 70 ppbv on 3 September. For P2, when the MDA8 O3 concentration only slightly exceeded the guideline standard (75 ppbv), it only needed to reduce the AVOC levels by 10% to make the MDA8 O3 concentration meet the standard. For P1 and P3 with serious O3 pollution, cutting the AVOC levels by 50% could make the MDA8 O3 concentration meet the standard in P1 with low BVOC emissions, while in P3 with high BVOC emissions, reducing the AVOC concentrations to zero could eliminate the occurrence of O3 pollution in the region, suggesting that the presence of high BVOC emissions can greatly impact efforts to control O3 by reducing AVOCs, particularly in regions with relatively high NOx levels.

4. Conclusions

In this study, O3 and its precursors were measured at a suburban site in South China with large BVOC emissions during four periods, including a heavy O3 pollution period (P1), a light O3 pollution period (P2), a moderate O3 pollution period (P3) and a non-O3 pollution period (NP), and the AtChem2-MCM box model was applied to investigate the O3-precursor relationships. Although the average concentrations of NOx and TVOCs in NP were lower than those in P1 and P3, both were higher than those in P2, and the proportion of active VOCs in NP (46%) was slightly higher than that in P1 (45%) and P3 (45%), but lower than that in P2 (51%). The T/B ratios in NP (~11) were also over 20% higher than that during the O3 pollution period (P1, P2 or P3), but the adverse meteorological conditions (the weakest solar radiation, the lowest temperature and the highest relative humidity) in NP offset the impact of aromatic solvents on O3 formation, demonstrating meteorological factors might be the main reason affecting whether the MDA8 O3 concentration exceeded the guideline standard (75 ppbv).
The box model simulations revealed that VOC-limited was the dominant feature for O3 formation during this whole sampling period, implying that controlling VOCs was more effective than NOx in mitigating O3 formation. BVOCs had the highest relative incremental reactivity (RIR) values in P2, P3 or NP, while carbonyls had the highest RIR value in P1. The pattern of diurnal variations in the RIRs of the VOC groups in P1 was also completely different from the patterns of the other three periods, especially for BVOCs, which was mainly related to their concentration levels. Isoprene, formaldehyde, methylglyoxal and acetaldehyde had the highest RIRs in all four study periods. Isoprene also played a substantial role in the formation of secondary carbonyls, especially contributing 32–92% to the formaldehyde production rate. In addition to isoprene, aromatics and alkenes were also important precursors that dominated the secondary formation of carbonyls, indicating that controlling them was the key to controlling O3 pollution. However, the emission of BVOCs is difficult to control effectively in the short term, and more attention should be paid to controlling AVOC emissions. Box model simulations showed that during the O3 pollution period with high BVOC emissions, only near zero AVOC emissions could prevent O3 if the levels of NOx remained unchanged. The results suggest that the presence of high BVOC emissions can greatly impact efforts to control O3 by reducing AVOCs, particularly in regions with relatively high NOx levels (up to 51 ppbv in this study).

Supplementary Materials

The following supporting information can be downloaded at: https://www.mdpi.com/article/10.3390/atmos14040609/s1, Figure S1: Location of the HD sampling site; Figure S2: Simulated and observed O3 during O3 pollution (O3 episode days) and clean (non-O3 episode days) days; Figure S3: Scatter plots of toluene to benzene during four periods; Figure S4: Average RIR values of the top 10 VOC species for (a) formaldehyde, (b) acetaldehyde, (c) glyoxal and (d) methylglyoxal during the whole campaign; Table S1: The average mixing ratios and 95% confidence intervals (95% C.I.) of TVOCs (pptv) measured during the four periods; Table S2: Top 10 VOC species with RIR values.

Author Contributions

Conceptualization, X.W.; methodology, J.W., Y.Z., S.X. and Z.W.; validation, X.W.; formal analysis, J.W.; investigation, J.W.; data curation, X.W. and Y.Z.; writing—original draft preparation, J.W.; writing—review and editing, X.W. and Y.Z.; supervision, X.W. and Y.Z.; funding acquisition, X.W. and Y.Z. All authors have read and agreed to the published version of the manuscript.

Funding

This research was funded by the National Natural Science Foundation of China (42022023), the Chinese Academy of Sciences (XDA23020301 and XDA23010303), the Youth Innovation Promotion Association of the Chinese Academy of Sciences (Y2021096), the Hong Kong Theme-base project (T24-504/17-N), the Department of Science and Technology of Guangdong Province (2020B1212060053 and 2019B121205006) and the Guangzhou Municipal Science and Technology Bureau (202206010057).

Institutional Review Board Statement

Not applicable.

Informed Consent Statement

Not applicable.

Data Availability Statement

Data are available upon request from the corresponding author ([email protected]).

Acknowledgments

The authors acknowledge the support of the Guangzhou Ecological and Environmental Monitoring Center of Guangdong Province.

Conflicts of Interest

The authors declare no conflict of interest.

References

  1. Oltmans, S.J.; Johnson, B.J.; Harris, J.M.; Thompson, A.M.; Liu, H.Y.; Chan, C.Y.; Vomel, H.; Fujimoto, T.; Brackett, V.G.; Chang, W.L.; et al. Tropospheric ozone over the North Pacific from ozonesonde observations. J. Geophys. Res. Atmos. 2004, 109, D15S01. [Google Scholar] [CrossRef] [Green Version]
  2. Monks, P.S.; Archibald, A.T.; Colette, A.; Cooper, O.; Coyle, M.; Derwent, R.; Fowler, D.; Granier, C.; Law, K.S.; Mills, G.E.; et al. Tropospheric ozone and its precursors from the urban to the global scale from air quality to short-lived climate forcer. Atmos. Chem. Phys. 2015, 15, 8889–8973. [Google Scholar] [CrossRef] [Green Version]
  3. Li, K.; Jacob, D.J.; Liao, H.; Zhu, J.; Shah, V.; Shen, L.; Bates, K.H.; Zhang, Q.; Zhai, S.X. A two-pollutant strategy for improving ozone and particulate air quality in China. Nat. Geosci. 2019, 12, 906–910. [Google Scholar] [CrossRef]
  4. Benish, S.E.; He, H.; Ren, X.R.; Roberts, S.J.; Salawitch, R.J.; Li, Z.Q.; Wang, F.; Wang, Y.Y.; Zhang, F.; Shao, M.; et al. Measurement report: Aircraft observations of ozone, nitrogen oxides, and volatile organic compounds over Hebei Province, China. Atmos. Chem. Phys. 2020, 20, 14523–14545. [Google Scholar] [CrossRef]
  5. Carter, W.P.L.; Pierce, J.A.; Luo, D.M.; Malkina, I.L. Environmental chamber study of maximum incremental reactivities of volatile organic-compounds. Atmos. Environ. 1995, 29, 2499–2511. [Google Scholar] [CrossRef]
  6. Jenkin, M.E.; Clemitshaw, K.C. Ozone and other secondary photochemical pollutants: Chemical processes governing their formation in the planetary boundary layer. Atmos. Environ. 2000, 34, 2499–2527. [Google Scholar] [CrossRef]
  7. Unger, N.; Bond, T.C.; Wang, J.S.; Koch, D.M.; Menon, S.; Shindell, D.T.; Bauer, S. Attribution of climate forcing to economic sectors. Proc. Natl. Acad. Sci. USA 2010, 107, 3382–3387. [Google Scholar] [CrossRef] [Green Version]
  8. Wilkinson, S.; Mills, G.; Illidge, R.; Davies, W.J. How is ozone pollution reducing our food supply? J. Exp. Bot. 2012, 63, 527–536. [Google Scholar] [CrossRef]
  9. Yue, X.; Unger, N.; Harper, K.; Xia, X.G.; Liao, H.; Zhu, T.; Xiao, J.F.; Feng, Z.Z.; Li, J. Ozone and haze pollution weakens net primary productivity in China. Atmos. Chem. Phys. 2017, 17, 6073–6089. [Google Scholar] [CrossRef] [Green Version]
  10. Mills, G.; Sharps, K.; Simpson, D.; Pleijel, H.; Broberg, M.; Uddling, J.; Jaramillo, F.; Davies, W.J.; Dentener, F.; Van den Berg, M.; et al. Ozone pollution will compromise efforts to increase global wheat production. Glob. Chang. Biol. 2018, 24, 3560–3574. [Google Scholar] [CrossRef]
  11. Lelieveld, J.; Evans, J.S.; Fnais, M.; Giannadaki, D.; Pozzer, A. The contribution of outdoor air pollution sources to premature mortality on a global scale. Nature 2015, 525, 367–371. [Google Scholar] [CrossRef] [PubMed]
  12. Malley, C.S.; Henze, D.K.; Kuylenstierna, J.C.I.; Vallack, H.W.; Davila, Y.; Anenberg, S.C.; Turner, M.C.; Ashmore, M.R. Updated global estimates of respiratory mortality in adults ≥30 years of age attributable to long-term ozone exposure. Environ. Health Perspect. 2017, 125, 087021. [Google Scholar] [CrossRef] [Green Version]
  13. Zhang, X.Y.; Wang, Y.Q.; Niu, T.; Zhang, X.C.; Gong, S.L.; Zhang, Y.M.; Sun, J.Y. Atmospheric aerosol compositions in China: Spatial/temporal variability, chemical signature, regional haze distribution and comparisons with global aerosols. Atmos. Chem. Phys. 2012, 12, 779–799. [Google Scholar] [CrossRef] [Green Version]
  14. Guo, S.; Hu, M.; Zamora, M.L.; Peng, J.F.; Shang, D.J.; Zheng, J.; Du, Z.F.; Wu, Z.; Shao, M.; Zeng, L.M.; et al. Elucidating severe urban haze formation in China. Proc. Natl. Acad. Sci. USA 2014, 111, 17373–17378. [Google Scholar] [CrossRef] [Green Version]
  15. Hu, J.L.; Chen, J.J.; Ying, Q.; Zhang, H.L. One-year simulation of ozone and particulate matter in China using WRF/CMAQ modeling system. Atmos. Chem. Phys. 2016, 16, 10333–10350. [Google Scholar] [CrossRef] [Green Version]
  16. Wang, T.; Xue, L.; Brimblecombe, P.; Lam, Y.F.; Li, L.; Zhang, L. Ozone pollution in China: A review of concentrations, meteorological influences, chemical precursors, and effects. Sci. Total Environ. 2017, 575, 1582–1596. [Google Scholar] [CrossRef] [PubMed]
  17. Lu, X.; Hong, J.Y.; Zhang, L.; Cooper, O.R.; Schultz, M.G.; Xu, X.B.; Wang, T.; Gao, M.; Zhao, Y.H.; Zhang, Y.H. Severe surface ozone pollution in China: A global perspective. Environ. Sci. Technol. Lett. 2018, 5, 487–494. [Google Scholar] [CrossRef]
  18. Li, K.; Jacob, D.J.; Liao, H.; Shen, L.; Zhang, Q.; Bates, K.H. Anthropogenic drivers of 2013-2017 trends in summer surface ozone in China. Proc. Natl. Acad. Sci. USA 2019, 116, 422–427. [Google Scholar] [CrossRef] [Green Version]
  19. Li, K.; Jacob, D.J.; Shen, L.; Lu, X.; De Smedt, I.; Liao, H. Increases in surface ozone pollution in China from 2013 to 2019: Anthropogenic and meteorological influences. Atmos. Chem. Phys. 2020, 20, 11423–11433. [Google Scholar] [CrossRef]
  20. Shao, M.; Zhang, Y.H.; Zeng, L.M.; Tang, X.Y.; Zhang, J.; Zhong, L.J.; Wang, B.G. Ground-level ozone in the Pearl River Delta and the roles of VOC and NOx in its production. J. Environ. Manag. 2009, 90, 512–518. [Google Scholar] [CrossRef]
  21. An, J.L.; Zou, J.N.; Wang, J.X.; Lin, X.; Zhu, B. Differences in ozone photochemical characteristics between the megacity Nanjing and its suburban surroundings, Yangtze River Delta, China. Environ. Sci. Pollut. Res. 2015, 22, 19607–19617. [Google Scholar] [CrossRef] [PubMed]
  22. Ou, J.M.; Yuan, Z.B.; Zheng, J.Y.; Huang, Z.J.; Shao, M.; Li, Z.K.; Huang, X.B.; Guo, H.; Louie, P.K.K. Ambient ozone control in a photochemically active region: Short term despiking or long-term attainment? Environ. Sci. Technol. 2016, 50, 5720–5728. [Google Scholar] [CrossRef] [PubMed]
  23. Han, X.; Zhu, L.Y.; Wang, S.L.; Meng, X.Y.; Zhang, M.G.; Hu, J. Modeling study of impacts on surface ozone of regional transport and emissions reductions over North China Plain in summer 2015. Atmos. Chem. Phys. 2018, 18, 12207–12221. [Google Scholar] [CrossRef] [Green Version]
  24. Xing, J.; Ding, D.; Wang, S.X.; Zhao, B.; Jang, C.; Wu, W.J.; Zhang, F.F.; Zhu, Y.; Hao, J.M. Quantification of the enhanced effectiveness of NOx control from simultaneous reductions of VOC and NH3 for reducing air pollution in the Beijing-Tianjin-Hebei region, China. Atmos. Chem. Phys. 2018, 18, 7799–7814. [Google Scholar] [CrossRef] [Green Version]
  25. Tan, Z.F.; Lu, K.D.; Jiang, M.Q.; Su, R.; Dong, H.B.; Zeng, L.M.; Xie, S.D.; Tan, Q.W.; Zhang, Y.H. Exploring ozone pollution in Chengdu, southwestern China: A case study from radical chemistry to O3-VOC-NOx sensitivity. Sci. Total Environ. 2018, 636, 775–786. [Google Scholar] [CrossRef]
  26. Xu, J.; Zhang, Y.; Fu, J.S.; Zheng, S.; Wang, W. Process analysis of typical summertime ozone episodes over the Beijing area. Sci. Total Environ. 2008, 399, 147–157. [Google Scholar] [CrossRef]
  27. Pan, X.; Kanaya, Y.; Tanimoto, H.; Inomata, S.; Wang, Z.; Kudo, S.; Uno, I. Examining the major contributors of ozone pollution in a rural area of the Yangtze River Delta region during harvest season. Atmos. Chem. Phys. 2015, 15, 6101–6111. [Google Scholar] [CrossRef] [Green Version]
  28. Su, R.; Lu, K.; Yu, J.; Tan, Z.; Jiang, M.; Li, J.; Xie, S.; Wu, Y.; Zeng, L.; Zhai, C.; et al. Exploration of the formation mechanism and source attribution of ambient ozone in Chongqing with an observation-based model. Sci. China Earth Sci. 2018, 61, 23–32. [Google Scholar] [CrossRef]
  29. Ran, L.; Zhao, C.S.; Xu, W.Y.; Han, M.; Lu, X.Q.; Han, S.Q.; Lin, W.L.; Xu, X.B.; Gao, W.; Yu, Q.; et al. Ozone production in summer in the megacities of Tianjin and Shanghai, China: A comparative study. Atmos. Chem. Phys. 2012, 12, 7531–7542. [Google Scholar] [CrossRef] [Green Version]
  30. Tan, Z.F.; Lu, K.D.; Jiang, M.Q.; Su, R.; Wang, H.L.; Lou, S.R.; Fu, Q.Y.; Zhai, C.Z.; Tan, Q.W.; Yue, D.L.; et al. Daytime atmospheric oxidation capacity in four Chinese megacities during the photochemically polluted season: A case study based on box model simulation. Atmos. Chem. Phys. 2019, 19, 3493–3513. [Google Scholar] [CrossRef] [Green Version]
  31. Xue, L.K.; Wang, T.; Gao, J.; Ding, A.J.; Zhou, X.H.; Blake, D.R.; Wang, X.F.; Saunders, S.M.; Fan, S.J.; Zuo, H.C.; et al. Ground-level ozone in four Chinese cities: Precursors, regional transport and heterogeneous processes. Atmos. Chem. Phys. 2014, 14, 13175–13188. [Google Scholar] [CrossRef] [Green Version]
  32. Li, K.; Chen, L.H.; Ying, F.; White, S.J.; Jang, C.; Wu, X.C.; Gao, X.; Hong, S.M.; Shen, J.D.; Azzi, M.; et al. Meteorological and chemical impacts on ozone formation: A case study in Hangzhou, China. Atmos. Res. 2017, 196, 40–52. [Google Scholar] [CrossRef]
  33. Lin, H.T.; Wang, M.; Duan, Y.S.; Fu, Q.Y.; Ji, W.H.; Cui, H.X.; Jin, D.; Lin, Y.F.; Hu, K. O3 sensitivity and contributions of different NMHC sources in O3 formation at urban and suburban sites in Shanghai. Atmosphere 2020, 11, 295. [Google Scholar] [CrossRef] [Green Version]
  34. Zhao, Y.; Chen, L.; Li, K.; Han, L.; Zhang, X.; Wu, X.; Gao, X.; Azzi, M.; Cen, K. Atmospheric ozone chemistry and control strategies in Hangzhou, China: Application of a 0-D box model. Atmos. Res. 2020, 246, 105109. [Google Scholar] [CrossRef]
  35. Ling, Z.H.; Guo, H. Contribution of VOC sources to photochemical ozone formation and its control policy implication in Hong Kong. Environ. Sci. Policy 2014, 38, 180–191. [Google Scholar] [CrossRef]
  36. He, Z.R.; Wang, X.M.; Ling, Z.H.; Zhao, J.; Guo, H.; Shao, M.; Wang, Z. Contributions of different anthropogenic volatile organic compound sources to ozone formation at a receptor site in the Pearl River Delta region and its policy implications. Atmos. Chem. Phys. 2019, 19, 8801–8816. [Google Scholar] [CrossRef] [Green Version]
  37. Yu, D.; Tan, Z.F.; Lu, K.D.; Ma, X.F.; Li, X.; Chen, S.Y.; Zhu, B.; Lin, L.L.; Li, Y.T.; Qiu, P.P.; et al. An explicit study of local ozone budget and NOx-VOCs sensitivity in Shenzhen China. Atmos. Environ. 2020, 224, 117304. [Google Scholar] [CrossRef]
  38. Shen, H.Q.; Liu, Y.H.; Zhao, M.; Li, J.; Zhang, Y.N.; Yang, J.; Jiang, Y.; Chen, T.S.; Chen, M.; Huang, X.B.; et al. Significance of carbonyl compounds to photochemical ozone formation in a coastal city (Shantou) in eastern China. Sci. Total Environ. 2021, 764, 144031. [Google Scholar] [CrossRef]
  39. Zou, Y.; Deng, X.J.; Deng, T.; Yin, C.Q.; Li, F. One-year characterization and reactivity of isoprene and its impact on surface ozone formation at a suburban site in Guangzhou, China. Atmosphere 2019, 10, 201. [Google Scholar] [CrossRef] [Green Version]
  40. Liu, X.; Wang, N.; Lyu, X.; Zeren, Y.; Jiang, F.; Wang, X.; Zou, S.; Ling, Z.; Guo, H. Photochemistry of ozone pollution in autumn in Pearl River Estuary, South China. Sci. Total Environ. 2021, 754, 141812. [Google Scholar] [CrossRef]
  41. Wang, J.; Zhang, Y.L.; Wu, Z.F.; Luo, S.L.; Song, W.; Wang, X.M. Ozone episodes during and after the 2018 Chinese National Day holidays in Guangzhou: Implications for the control of precursor VOCs. J. Environ. Sci. 2022, 114, 322–333. [Google Scholar] [CrossRef] [PubMed]
  42. Lei, X.W.; Cheng, H.R.; Peng, J.; Jiang, H.M.; Lyu, X.P.; Zeng, P.; Wang, Z.W.; Guo, H. Impact of long-range atmospheric transport on volatile organic compounds and ozone photochemistry at a regional background site in central China. Atmos. Environ. 2021, 246, 118093. [Google Scholar] [CrossRef]
  43. Xie, Y.T.; Cheng, C.L.; Wang, Z.H.; Wang, K.; Wang, Y.; Zhang, X.C.; Li, X.H.; Ren, L.J.; Liu, M.; Li, M. Exploration of O3-precursor relationship and observation-oriented O3 control strategies in a non-provincial capital city, southwestern China. Sci. Total Environ. 2021, 800, 149422. [Google Scholar] [CrossRef] [PubMed]
  44. Chameides, W.L.; Lindsay, R.W.; Richardson, J.; Kiang, C.S. The role of biogenic hydrocarbons in urban photochemical smog: Atlanta as a case study. Science 1988, 241, 1473–1475. [Google Scholar] [CrossRef]
  45. Ryerson, T.B.; Trainer, M.; Holloway, J.S.; Parrish, D.D.; Huey, L.G.; Sueper, D.T.; Frost, G.J.; Donnelly, S.G.; Schauffler, S.; Atlas, E.L.; et al. Observations of ozone formation in power plant plumes and implications for ozone control strategies. Science 2001, 292, 719–723. [Google Scholar] [CrossRef] [Green Version]
  46. Chen, W.H.; Guenther, A.B.; Wang, X.M.; Chen, Y.H.; Gu, D.S.; Chang, M.; Zhou, S.Z.; Wu, L.L.; Zhang, Y.Q. Regional to global biogenic isoprene emission responses to changes in vegetation from 2000 to 2015. J. Geophys. Res. Atmos. 2018, 123, 3757–3771. [Google Scholar] [CrossRef]
  47. Tie, X.X.; Li, G.H.; Ying, Z.M.; Guenther, A.; Madronich, S. Biogenic emissions of isoprenoids and NO in China and comparison to anthropogenic emissions. Sci. Total Environ. 2006, 371, 238–251. [Google Scholar] [CrossRef] [Green Version]
  48. Chan, C.K.; Yao, X. Air pollution in mega cities in China. Atmos. Environ. 2008, 42, 1–42. [Google Scholar] [CrossRef]
  49. Zou, Y.; Deng, X.J.; Zhu, D.; Gong, D.C.; Wang, H.; Li, F.; Tan, H.B.; Deng, T.; Mai, B.R.; Liu, X.T.; et al. Characteristics of 1 year of observational data of VOCs, NOx and O3 at a suburban site in Guangzhou, China. Atmos. Chem. Phys. 2015, 15, 6625–6636. [Google Scholar] [CrossRef] [Green Version]
  50. Guenther, A.; Zimmerman, P.; Wildermuth, M. Natural volatile organic compound emission rate emissions for U.S. woodland landscapes. Atmos. Environ. 1994, 28, 1197–1210. [Google Scholar] [CrossRef] [Green Version]
  51. Klinger, L.F.; Li, Q.J.; Guenther, A.B.; Greenberg, J.P.; Baker, B.; Bai, J.H. Assessment of volatile organic compound emissions from ecosystems of China. J. Geophys. Res. Atmos. 2002, 107, 4603. [Google Scholar] [CrossRef]
  52. Leung, D.Y.C.; Wong, P.; Cheung, B.K.H.; Guenther, A. Improved land cover and emission factors for modeling biogenic volatile organic compounds emissions from Hong Kong. Atmos. Environ. 2010, 44, 1456–1468. [Google Scholar] [CrossRef] [Green Version]
  53. Zheng, J.; Zheng, Z.; Yu, Y.; Zhong, L. Temporal, spatial characteristics and uncertainty of biogenic VOC emissions in the Pearl River Delta region, China. Atmos. Environ. 2010, 44, 1960–1969. [Google Scholar] [CrossRef]
  54. Wang, X.M.; Situ, S.P.; Guenther, A.; Chen, F.; Wu, Z.Y.; Xia, B.C.; Wang, T.J. Spatiotemporal variability of biogenic terpenoid emissions in Pearl River Delta, China, with high-resolution land-cover and meteorological data. Tellus Ser. B-Chem. Phys. Meteorol. 2011, 63, 241–254. [Google Scholar] [CrossRef] [Green Version]
  55. Situ, S.; Guenther, A.; Wang, X.; Jiang, X.; Turnipseed, A.; Wu, Z.; Bai, J.; Wang, X. Impacts of seasonal and regional variability in biogenic VOC emissions on surface ozone in the Pearl River delta region, China. Atmos. Chem. Phys. 2013, 13, 11803–11817. [Google Scholar] [CrossRef] [Green Version]
  56. Wu, K.; Yang, X.Y.; Chen, D.; Gu, S.; Lu, Y.Q.; Jiang, Q.; Wang, K.; Ou, Y.H.; Qian, Y.; Shao, P.; et al. Estimation of biogenic VOC emissions and their corresponding impact on ozone and secondary organic aerosol formation in China. Atmos. Res. 2020, 231, 104656. [Google Scholar] [CrossRef]
  57. Wang, H.L.; Wu, K.; Liu, Y.M.; Sheng, B.S.; Lu, X.; He, Y.P.; Xie, J.L.; Wang, H.C.; Fan, S.J. Role of heat wave-induced biogenic VOC enhancements in persistent ozone episodes formation in Pearl River Delta. J. Geophys. Res. Atmos. 2021, 126, e2020JD034317. [Google Scholar] [CrossRef]
  58. Li, L.Y.; Chen, Y.; Xie, S.D. Spatio-temporal variation of biogenic volatile organic compounds emissions in China. Environ. Pollut. 2013, 182, 157–168. [Google Scholar] [CrossRef]
  59. Zeng, J.Q.; Song, W.; Zhang, Y.L.; Mu, Z.B.; Pang, W.H.; Zhang, H.N.; Wang, X.M. Emissions of isoprenoids from dominant tree species in subtropical China. Front. For. Glob. Chang. 2022, 5, 1089676. [Google Scholar] [CrossRef]
  60. Zhang, Y.L.; Wang, X.M.; Blake, D.R.; Li, L.F.; Zhang, Z.; Wang, S.Y.; Guo, H.; Lee, F.S.C.; Gao, B.; Chan, L.Y.; et al. Aromatic hydrocarbons as ozone precursors before and after outbreak of the 2008 financial crisis in the Pearl River Delta region, south China. J. Geophys. Res. Atmos. 2012, 117, D15306. [Google Scholar] [CrossRef] [Green Version]
  61. Zhang, Y.L.; Wang, X.M.; Barletta, B.; Simpson, I.J.; Blake, D.R.; Fu, X.X.; Zhang, Z.; He, Q.F.; Liu, T.Y.; Zhao, X.Y.; et al. Source attributions of hazardous aromatic hydrocarbons in urban, suburban and rural areas in the Pearl River Delta (PRD) region. J. Hazard. Mater. 2013, 250, 403–411. [Google Scholar] [CrossRef] [PubMed] [Green Version]
  62. Zhang, Y.L.; Wang, X.M.; Zhang, Z.; Lu, S.J.; Huang, Z.H.; Li, L.F. Sources of C2-C4 alkenes, the most important ozone nonmethane hydrocarbon precursors in the Pearl River Delta region. Sci. Total Environ. 2015, 502, 236–245. [Google Scholar] [CrossRef]
  63. Yang, W.; Zhang, Y.; Wang, X.; Li, S.; Zhu, M.; Yu, Q.; Li, G.; Huang, Z.; Zhang, H.; Wu, Z.; et al. Volatile organic compounds at a rural site in Beijing: Influence of temporary emission control and wintertime heating. Atmos. Chem. Phys. 2018, 18, 12663–12682. [Google Scholar] [CrossRef] [Green Version]
  64. Wu, Z.F.; Zhang, Y.L.; He, J.J.; Chen, H.Z.; Huang, X.L.; Wang, Y.J.; Yu, X.; Yang, W.Q.; Zhang, R.Q.; Zhu, M.; et al. Dramatic increase in reactive volatile organic compound (VOC) emissions from ships at berth after implementing the fuel switch policy in the Pearl River Delta Emission Control Area. Atmos. Chem. Phys. 2020, 20, 1887–1900. [Google Scholar] [CrossRef] [Green Version]
  65. Wu, Z.F.; Zhang, Y.L.; Pei, C.L.; Huang, Z.Z.; Wang, Y.J.; Chen, Y.N.; Yan, J.H.; Huang, X.Q.; Xiao, S.X.; Luo, S.L.; et al. Real-world emissions of carbonyls from vehicles in an urban tunnel in south China. Atmos. Environ. 2021, 258, 118491. [Google Scholar] [CrossRef]
  66. Jenkin, M.E.; Saunders, S.M.; Wagner, V.; Pilling, M.J. Protocol for the development of the Master Chemical Mechanism, MCM v3 (Part B): Tropospheric degradation of aromatic volatile organic compounds. Atmos. Chem. Phys. 2003, 3, 181–193. [Google Scholar] [CrossRef] [Green Version]
  67. Jenkin, M.E.; Young, J.C.; Rickard, A.R. The MCM v3.3.1 degradation scheme for isoprene. Atmos. Chem. Phys. 2015, 15, 11433–11459. [Google Scholar] [CrossRef] [Green Version]
  68. Saunders, S.M.; Jenkin, M.E.; Derwent, R.G.; Pilling, M.J. Protocol for the development of the Master Chemical Mechanism, MCM v3 (Part A): Tropospheric degradation of non-aromatic volatile organic compounds. Atmos. Chem. Phys. 2003, 3, 161–180. [Google Scholar] [CrossRef] [Green Version]
  69. Sommariva, R.; Cox, S.; Martin, C.; Boronska, K.; Young, J.; Jimack, P.K.; Pilling, M.J.; Matthaios, V.N.; Nelson, B.S.; Newland, M.J.; et al. AtChem (version 1), an open-source box model for the Master Chemical Mechanism. Geosci. Model Dev. 2020, 13, 169–183. [Google Scholar] [CrossRef] [Green Version]
  70. Huang, J.P.; Fung, J.C.H.; Lau, A.K.H.; Qin, Y. Numerical simulation and process analysis of typhoon-related ozone episodes in Hong Kong. J. Geophys. Res. Atmos. 2005, 110, D05301. [Google Scholar] [CrossRef]
  71. Cardelino, C.A.; Chameides, W.L. An observation-based model for analyzing ozone precursor relationships in the urban atmosphere. J. Air Waste Manag. Assoc. 1995, 45, 161–180. [Google Scholar] [CrossRef] [PubMed]
  72. Lyu, X.P.; Guo, H.; Simpson, I.J.; Meinardi, S.; Louie, P.K.K.; Ling, Z.H.; Wang, Y.; Liu, M.; Luk, C.W.Y.; Wang, N.; et al. Effectiveness of replacing catalytic converters in LPG-fueled vehicles in Hong Kong. Atmos. Chem. Phys. 2016, 16, 6609–6626. [Google Scholar] [CrossRef] [Green Version]
  73. Huang, W.; Zhao, Q.; Liu, Q.; Chen, F.; He, Z.; Guo, H.; Ling, Z. Assessment of atmospheric photochemical reactivity in the Yangtze River Delta using a photochemical box model. Atmos. Res. 2020, 245, 105088. [Google Scholar] [CrossRef]
  74. Hui, L.R.; Liu, X.G.; Tan, Q.W.; Feng, M.; An, J.L.; Qu, Y.; Zhang, Y.H.; Jiang, M.Q. Characteristics, source apportionment and contribution of VOCs to ozone formation in Wuhan, Central China. Atmos. Environ. 2018, 192, 55–71. [Google Scholar] [CrossRef]
  75. Lu, X.; Zhang, L.; Chen, Y.F.; Zhou, M.; Zheng, B.; Li, K.; Liu, Y.M.; Lin, J.T.; Fu, T.M.; Zhang, Q. Exploring 2016–2017 surface ozone pollution over China: Source contributions and meteorological influences. Atmos. Chem. Phys. 2019, 19, 8339–8361. [Google Scholar] [CrossRef] [Green Version]
  76. Ren, J.; Hao, Y.F.; Simayi, M.; Shi, Y.Q.; Xie, S.D. Spatiotemporal variation of surface ozone and its causes in Beijing, China since 2014. Atmos. Environ. 2021, 260, 118556. [Google Scholar] [CrossRef]
  77. Deng, C.; Tian, S.; Li, Z.; Li, K. Spatiotemporal characteristics of PM2.5 and ozone concentrations in Chinese urban clusters. Chemosphere 2022, 295, 133813. [Google Scholar] [CrossRef]
  78. Yang, Y.D.; Shao, M.; Kessel, S.; Li, Y.; Lu, K.D.; Lu, S.H.; Williams, J.; Zhang, Y.H.; Zeng, L.M.; Noelscher, A.C.; et al. How the OH reactivity affects the ozone production efficiency: Case studies in Beijing and Heshan, China. Atmos. Chem. Phys. 2017, 17, 7127–7142. [Google Scholar] [CrossRef] [Green Version]
  79. Zhu, J.; Wang, S.; Wang, H.; Jing, S.; Lou, S.; Saiz-Lopez, A.; Zhou, B. Observationally constrained modeling of atmospheric oxidation capacity and photochemical reactivity in Shanghai, China. Atmos. Chem. Phys. 2020, 20, 1217–1232. [Google Scholar] [CrossRef] [Green Version]
  80. Yang, Y.C.; Liu, X.G.; Zheng, J.; Tan, Q.W.; Feng, M.; Qu, Y.; An, J.L.; Cheng, N.L. Characteristics of one-year observation of VOCs, NOx, and O3 at an urban site in Wuhan, China. J. Environ. Sci. 2019, 79, 297–310. [Google Scholar] [CrossRef]
  81. Pei, C.L.; Yang, W.Q.; Zhang, Y.L.; Song, W.; Xiao, S.X.; Wang, J.; Zhang, J.P.; Zhang, T.; Chen, D.H.; Wang, Y.J.; et al. Decrease in ambient volatile organic compounds during the COVID-19 lockdown period in the Pearl River Delta region, south China. Sci. Total Environ. 2022, 823, 153720. [Google Scholar] [CrossRef] [PubMed]
  82. Liu, X.; Lyu, X.; Wang, Y.; Jiang, F.; Guo, H. Intercomparison of O3 formation and radical chemistry in the past decade at a suburban site in Hong Kong. Atmos. Chem. Phys. 2019, 19, 5127–5145. [Google Scholar] [CrossRef] [Green Version]
  83. Meng, Y.; Song, J.; Zeng, L.; Zhang, Y.; Zhao, Y.; Liu, X.; Guo, H.; Zhong, L.; Ou, Y.; Zhou, Y.; et al. Ambient volatile organic compounds at a receptor site in the Pearl River Delta region: Variations, source apportionment and effects on ozone formation. J. Environ. Sci. 2022, 111, 104–117. [Google Scholar] [CrossRef] [PubMed]
  84. Barletta, B.; Meinardi, S.; Simpson, I.J.; Zou, S.; Rowland, F.S.; Blake, D.R. Ambient mixing ratios of nonmethane hydrocarbons (NMHCs) in two major urban centers of the Pearl River Delta (PRD) region: Guangzhou and Dongguan. Atmos. Environ. 2008, 42, 4393–4408. [Google Scholar] [CrossRef] [Green Version]
  85. Tang, J.H.; Chu, K.W.; Chan, L.Y.; Chen, Y.J. Non-methane hydrocarbon emission profiles from printing and electronic industrial processes and its implications on the ambient atmosphere in the Pearl River Delta, South China. Atmos. Pollut. Res. 2014, 5, 151–160. [Google Scholar] [CrossRef] [Green Version]
  86. Han, D.M.; Wang, Z.; Cheng, J.P.; Wang, Q.; Chen, X.J.; Wang, H.L. Volatile organic compounds (VOCs) during non-haze and haze days in Shanghai: Characterization and secondary organic aerosol (SOA) formation. Environ. Sci. Pollut. Res. 2017, 24, 18619–18629. [Google Scholar] [CrossRef]
  87. Guo, H.; Jiang, F.; Cheng, H.R.; Simpson, I.J.; Wang, X.M.; Ding, A.J.; Wang, T.J.; Saunders, S.M.; Wang, T.; Lam, S.H.M.; et al. Concurrent observations of air pollutants at two sites in the Pearl River Delta and the implication of regional transport. Atmos. Chem. Phys. 2009, 9, 7343–7360. [Google Scholar] [CrossRef] [Green Version]
  88. Chou, C.C.K.; Tsai, C.Y.; Chang, C.C.; Lin, P.H.; Liu, S.C.; Zhu, T. Photochemical production of ozone in Beijing during the 2008 Olympic Games. Atmos. Chem. Phys. 2011, 11, 9825–9837. [Google Scholar] [CrossRef] [Green Version]
  89. Zong, R.H.; Yang, X.; Wen, L.; Xu, C.H.; Zhu, Y.H.; Chen, T.S.; Yao, L.; Wang, L.W.; Zhang, J.M.; Yang, L.X.; et al. Strong ozone production at a rural site in the North China Plain: Mixed effects of urban plumes and biogenic emissions. J. Environ. Sci. 2018, 71, 261–270. [Google Scholar] [CrossRef]
  90. Fu, T.M.; Zheng, Y.Q.; Paulot, F.; Mao, J.Q.; Yantosca, R.M. Positive but variable sensitivity of August surface ozone to large-scale warming in the southeast United States. Nat. Clim. Chang. 2015, 5, 454–458. [Google Scholar] [CrossRef]
  91. Guidolotti, G.; Pallozzi, E.; Gavrichkova, O.; Scartazza, A.; Mattioni, M.; Loreto, F.; Calfapietra, C. Emission of constitutive isoprene, induced monoterpenes, and other volatiles under high temperatures in Eucalyptus camaldulensis: A C-13 labelling study. Plant Cell Environ. 2019, 42, 1929–1938. [Google Scholar] [CrossRef] [PubMed]
  92. Yanez-Serrano, A.M.; Bourtsoukidis, E.; Alves, E.G.; Bauwens, M.; Stavrakou, T.; Llusia, J.; Filella, I.; Guenther, A.; Williams, J.; Artaxo, P.; et al. Amazonian biogenic volatile organic compounds under global change. Glob. Chang. Biol. 2020, 26, 4722–4751. [Google Scholar] [CrossRef] [PubMed]
  93. Cheng, H.R.; Guo, H.; Wang, X.M.; Saunders, S.M.; Lam, S.H.M.; Jiang, F.; Wang, T.J.; Ding, A.J.; Lee, S.C.; Ho, K.F. On the relationship between ozone and its precursors in the Pearl River Delta: Application of an observation-based model (OBM). Environ. Sci. Pollut. Res. 2010, 17, 547–560. [Google Scholar] [CrossRef] [PubMed]
  94. Wang, Y.; Wang, H.; Guo, H.; Lyu, X.P.; Cheng, H.R.; Ling, Z.H.; Louie, P.K.K.; Simpson, I.J.; Meinardi, S.; Blake, D.R. Long-term O3-precursor relationships in Hong Kong: Field observation and model simulation. Atmos. Chem. Phys. 2017, 17, 10919–10935. [Google Scholar] [CrossRef] [Green Version]
  95. Zhu, J.X.; Cheng, H.R.; Peng, J.; Zeng, P.; Wang, Z.W.; Lyu, X.P.; Guo, H. O3 photochemistry on O3 episode days and non-O3 episode days in Wuhan, Central China. Atmos. Environ. 2020, 223, 117236. [Google Scholar] [CrossRef]
  96. Zhang, T.; Xiao, S.X.; Wang, X.M.; Zhang, Y.L.; Pei, C.L.; Chen, D.H.; Jiang, M.; Liao, T. Volatile organic compounds monitored online at three photochemical assessment monitoring stations in the Pearl River Delta (PRD) region during summer 2016: Sources and emission areas. Atmosphere 2021, 12, 327. [Google Scholar] [CrossRef]
  97. Zheng, J.Y.; Yu, Y.F.; Mo, Z.W.; Zhang, Z.; Wang, X.M.; Yin, S.S.; Peng, K.; Yang, Y.; Feng, X.Q.; Cai, H.H. Industrial sector-based volatile organic compound (VOC) source profiles measured in manufacturing facilities in the Pearl River Delta, China. Sci. Total Environ. 2013, 456, 127–136. [Google Scholar] [CrossRef] [PubMed]
  98. McDonald, B.C.; Goldstein, A.H.; Harley, R.A. Long-term trends in California mobile source emissions and ambient concentrations of black carbon and organic aerosol. Environ. Sci. Technol. 2015, 49, 5178–5188. [Google Scholar] [CrossRef]
  99. Mo, Z.W.; Shao, M.; Lu, S.H. Compilation of a source profile database for hydrocarbon and OVOC emissions in China. Atmos. Environ. 2016, 143, 209–217. [Google Scholar] [CrossRef]
  100. Sha, Q.E.; Zhu, M.N.; Huang, H.W.; Wang, Y.Z.; Huang, Z.J.; Zhang, X.C.; Tang, M.S.; Lu, M.H.; Chen, C.; Shi, B.W.; et al. A newly integrated dataset of volatile organic compounds (VOCs) source profiles and implications for the future development of VOCs profiles in China. Sci. Total Environ. 2021, 793, 148348. [Google Scholar] [CrossRef]
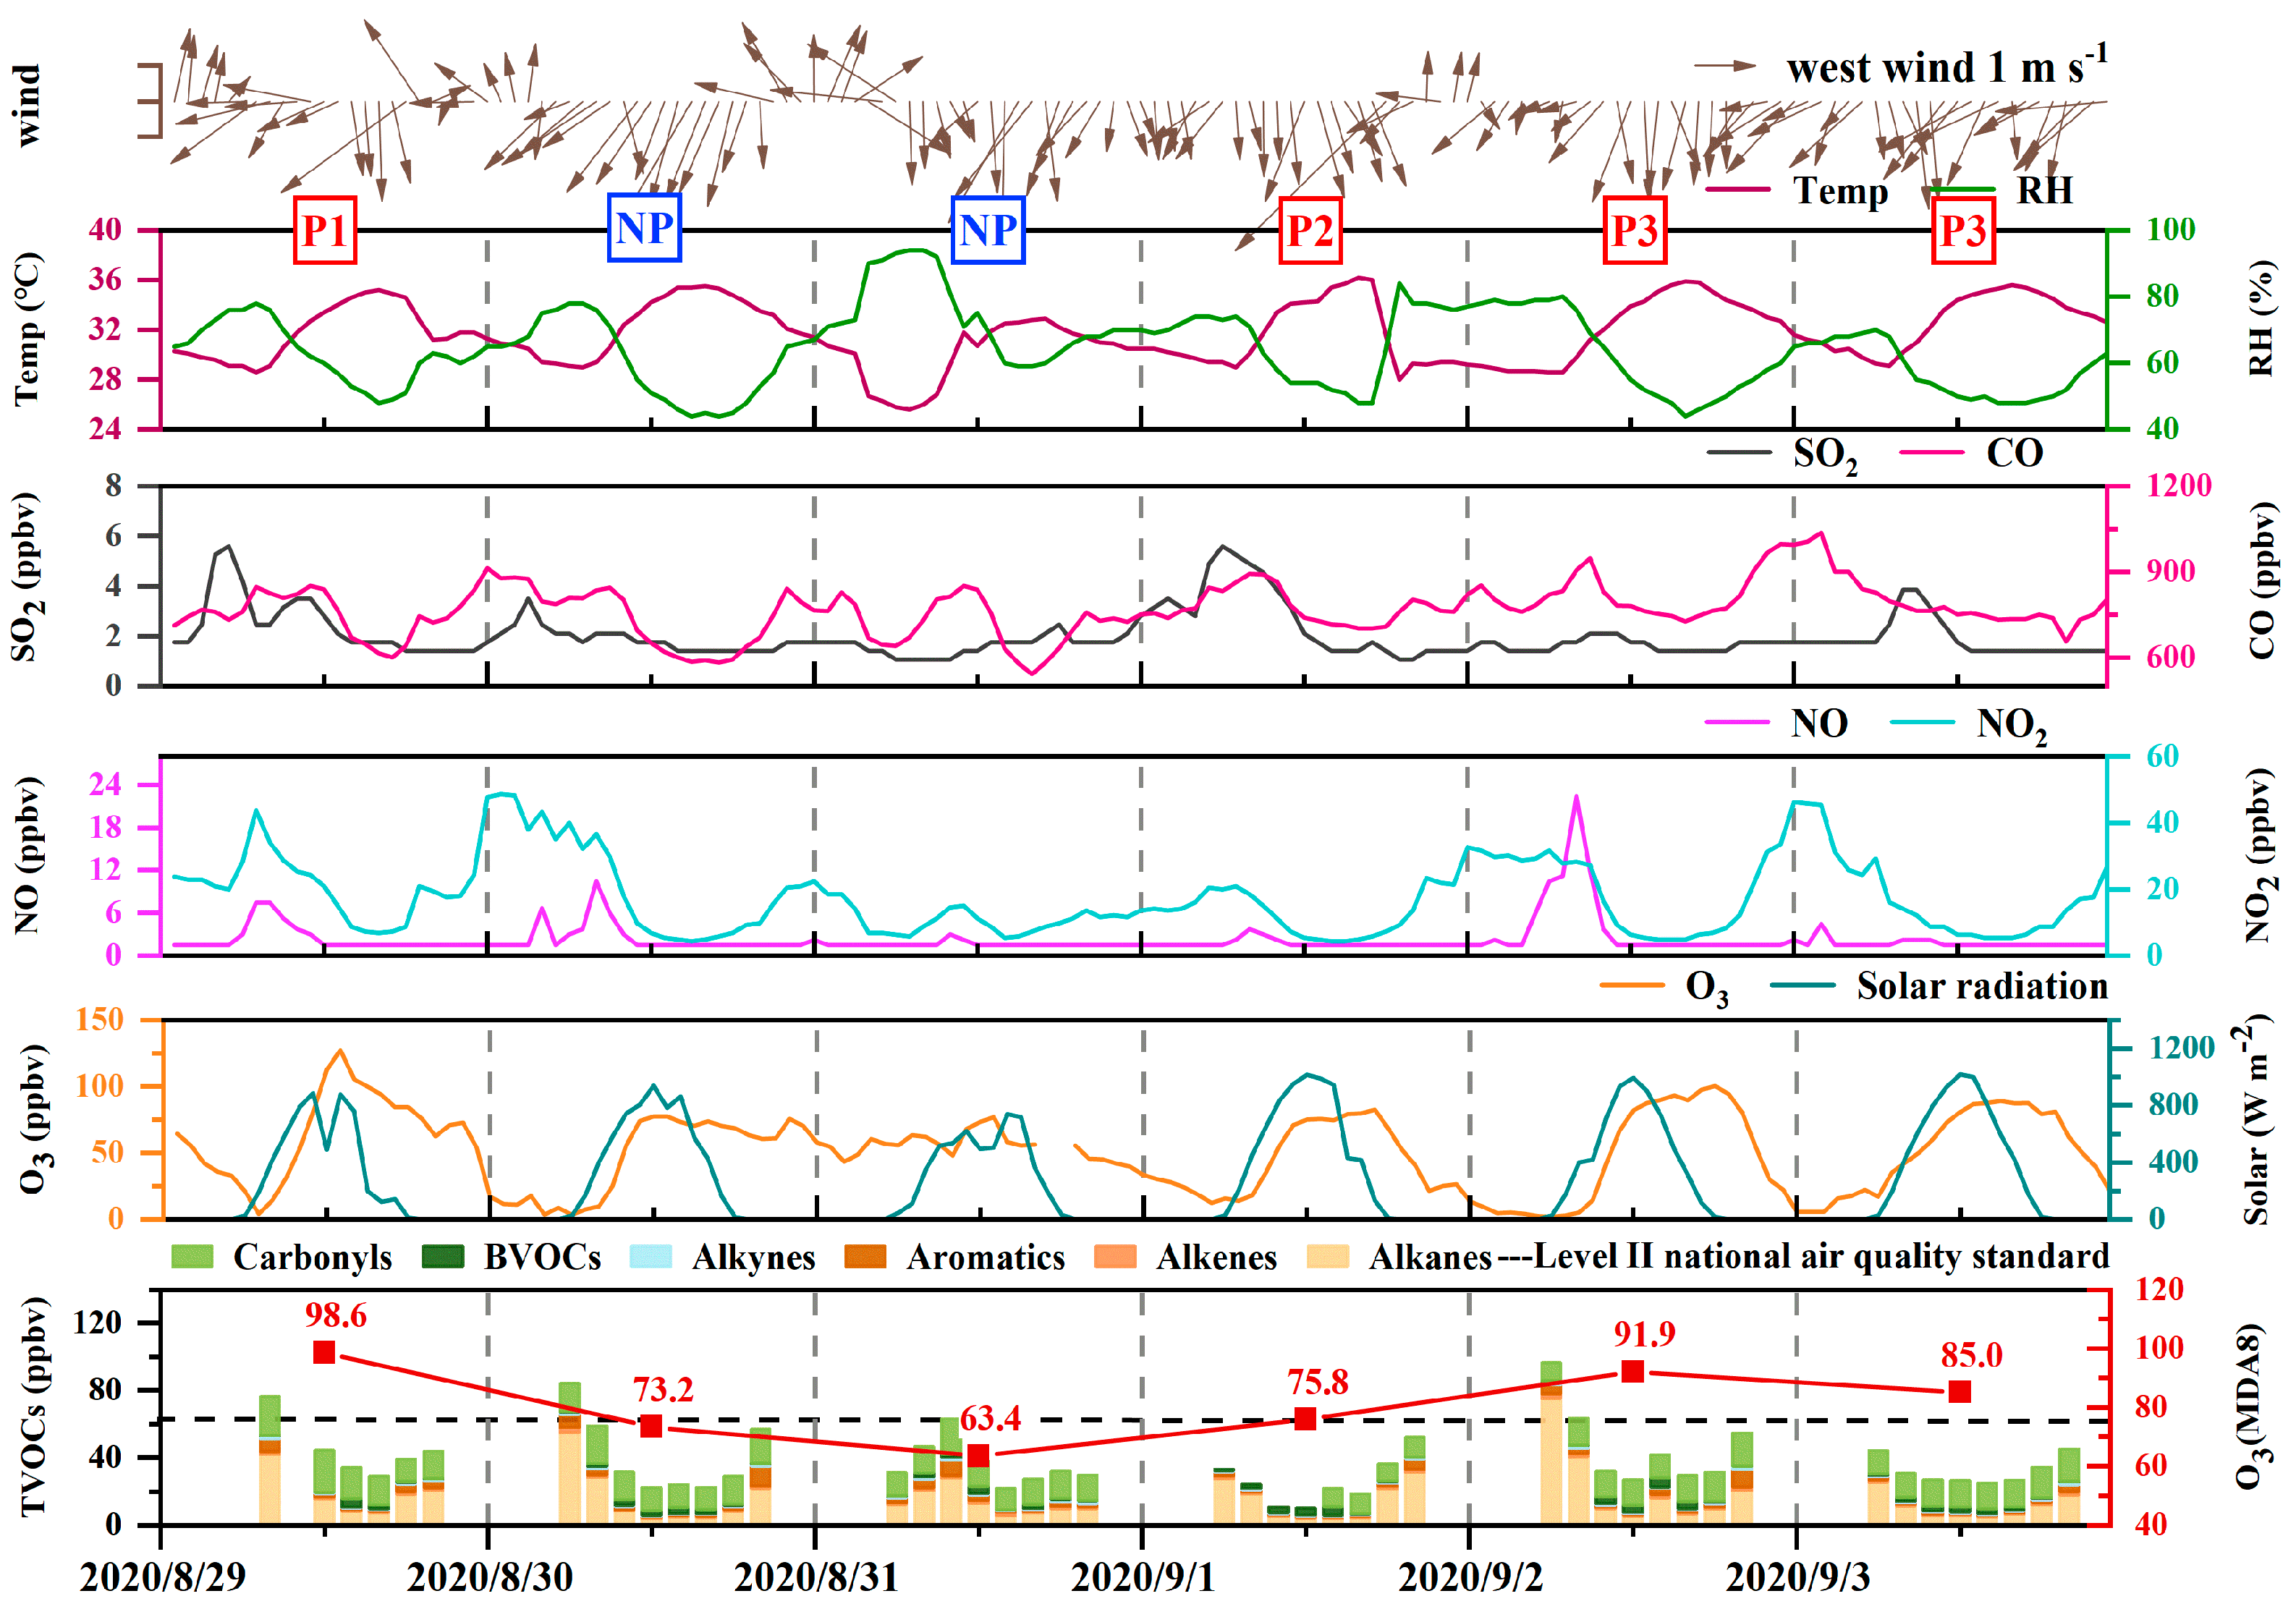
Figure 1. Time series of meteorological parameters and measured species observed at HD during three O3 pollution periods (P1, P2, P3; 29 August and 1–3 September 2020) and one non-O3 pollution period (NP; 30–31 August 2020). Due to instrument failure, the carbonyl data from 6:00–12:00 on 1 September are missing. Other data gaps were mainly due to instrument maintenance and calibration. Temp: temperature; RH: relative humidity; BVOCs: biogenic VOCs; MDA8: maximum daily 8-h average.
Atmosphere 14 00609 g001
Figure 2. Diurnal variations in meteorological parameters and major trace gases during the four periods. It should be noted that only daytime (6:00–20:00 LT) data were measured.
Atmosphere 14 00609 g002
Figure 3. The O3–VOCs–NOx sensitivity study for the HD site. (a) The O3 isopleth diagram versus NOx and VOCs using EKMA (the horizontal and vertical axes represent the percentage of original mixing ratios of VOCs and NOx: the percentage change of VOCs from 0.5% to 140% and the percentage change of NOx from 0.5% to 150%. The isopleths give the peak O3 in the unit of ppbv.); (b) RIR (relative incremental reactivity) values of major VOC groups during the four periods, i.e., alkanes, alkenes, aromatics, carbonyls and BVOCs.
Atmosphere 14 00609 g003
Figure 4. Average diurnal variations of RIR values of VOC groups in (a) P1, (b) P2, (c) P3 and (d) NP.
Atmosphere 14 00609 g004
Figure 5. Average RIR values of the top 5 VOC species for O3 at HD in (a) P1, (b) P2, (c) P3 and (d) NP.
Atmosphere 14 00609 g005
Figure 6. The model-calculated formaldehyde production rate from the degradation of VOC species in (a) P1, (b) P2, (c) P3 and (d) NP.
Atmosphere 14 00609 g006
Figure 7. MDA8 O3 concentrations during the whole campaign and under the condition of reducing different proportions of AVOCs.
Atmosphere 14 00609 g007
Table 1. Statistical descriptions about levels of meteorological parameters and measured species during the four periods (S.D.: standard deviation; BVOCs: biogenic VOCs; TVOCs: total VOCs).
P1P2P3NP
Average ± S.D.MaximumAverage ± S.D.MaximumAverage ± S.D.MaximumAverage ± S.D.Maximum
Temperature (°C)32.5 ± 2.1335.231.5 ± 2.6636.232.4 ± 2.4335.931.2 ± 2.6135.5
Solar radiation
(W m−2)
459 ± 330886544 ± 3781016511 ± 3481018434 ± 293939
Relative humidity (%)60.7 ± 8.9178.066.4 ± 11.184.060.1 ± 11.080.067.3 ± 13.794.0
Wind speed (m s−1)0.928 ± 0.3511.900.900 ± 0.4112.600.898 ± 0.2831.401.01 ± 0.3181.70
O3 (ppbv)69.2 ± 33.112743.3 ± 25.982.648.6 ± 35.010050.6 ± 22.677.5
SO2 (ppbv)2.06 ± 1.215.602.65 ± 1.505.601.76 ± 0.5653.851.75 ± 0.4733.50
CO (ppbv)759 ± 80.5913779 ± 59.9893810 ± 87.01038725 ± 96.8879
NO (ppbv)2.57 ± 1.827.471.71 ± 0.5603.732.84 ± 3.8222.42.05 ± 1.6310.5
NO2 (ppbv)21.1 ± 10.447.713.8 ± 7.5632.618.6 ± 12.346.316.1 ± 12.348.7
Alkanes (ppbv)18.6 ± 12.641.814.5 ± 11.431.217.0 ± 18.175.115.1 ± 13.254.8
Alkenes (ppbv)1.42 ± 0.4411.971.25 ± 0.4741.961.43 ± 0.6242.921.39 ± 0.6053.09
Aromatics (ppbv)3.31 ± 2.487.421.66 ± 1.885.972.45 ± 2.5810.63.45 ± 3.3711.9
Alkynes (ppbv)1.08 ± 0.4751.870.868 ± 0.2281.071.07 ± 0.4801.941.09 ± 0.4441.74
Carbonyls (ppbv)18.8 ± 4.5725.311.0 ± 0.77311.815.6 ± 2.1719.616.0 ± 2.8622.3
BVOCs (ppbv)1.24 ± 1.904.702.11 ± 2.125.552.14 ± 1.765.391.68 ± 1.414.41
TVOCs (ppbv)44.5 ± 16.776.225.9 ± 14.152.039.7 ± 18.896.538.7 ± 17.684.1
Disclaimer/Publisher’s Note: The statements, opinions and data contained in all publications are solely those of the individual author(s) and contributor(s) and not of MDPI and/or the editor(s). MDPI and/or the editor(s) disclaim responsibility for any injury to people or property resulting from any ideas, methods, instructions or products referred to in the content.