


Assessment of Meteorological Drought under the Climate Change in the Kabul River Basin, Afghanistan


Abstract
1. Introduction
2. Study Area and Methodology
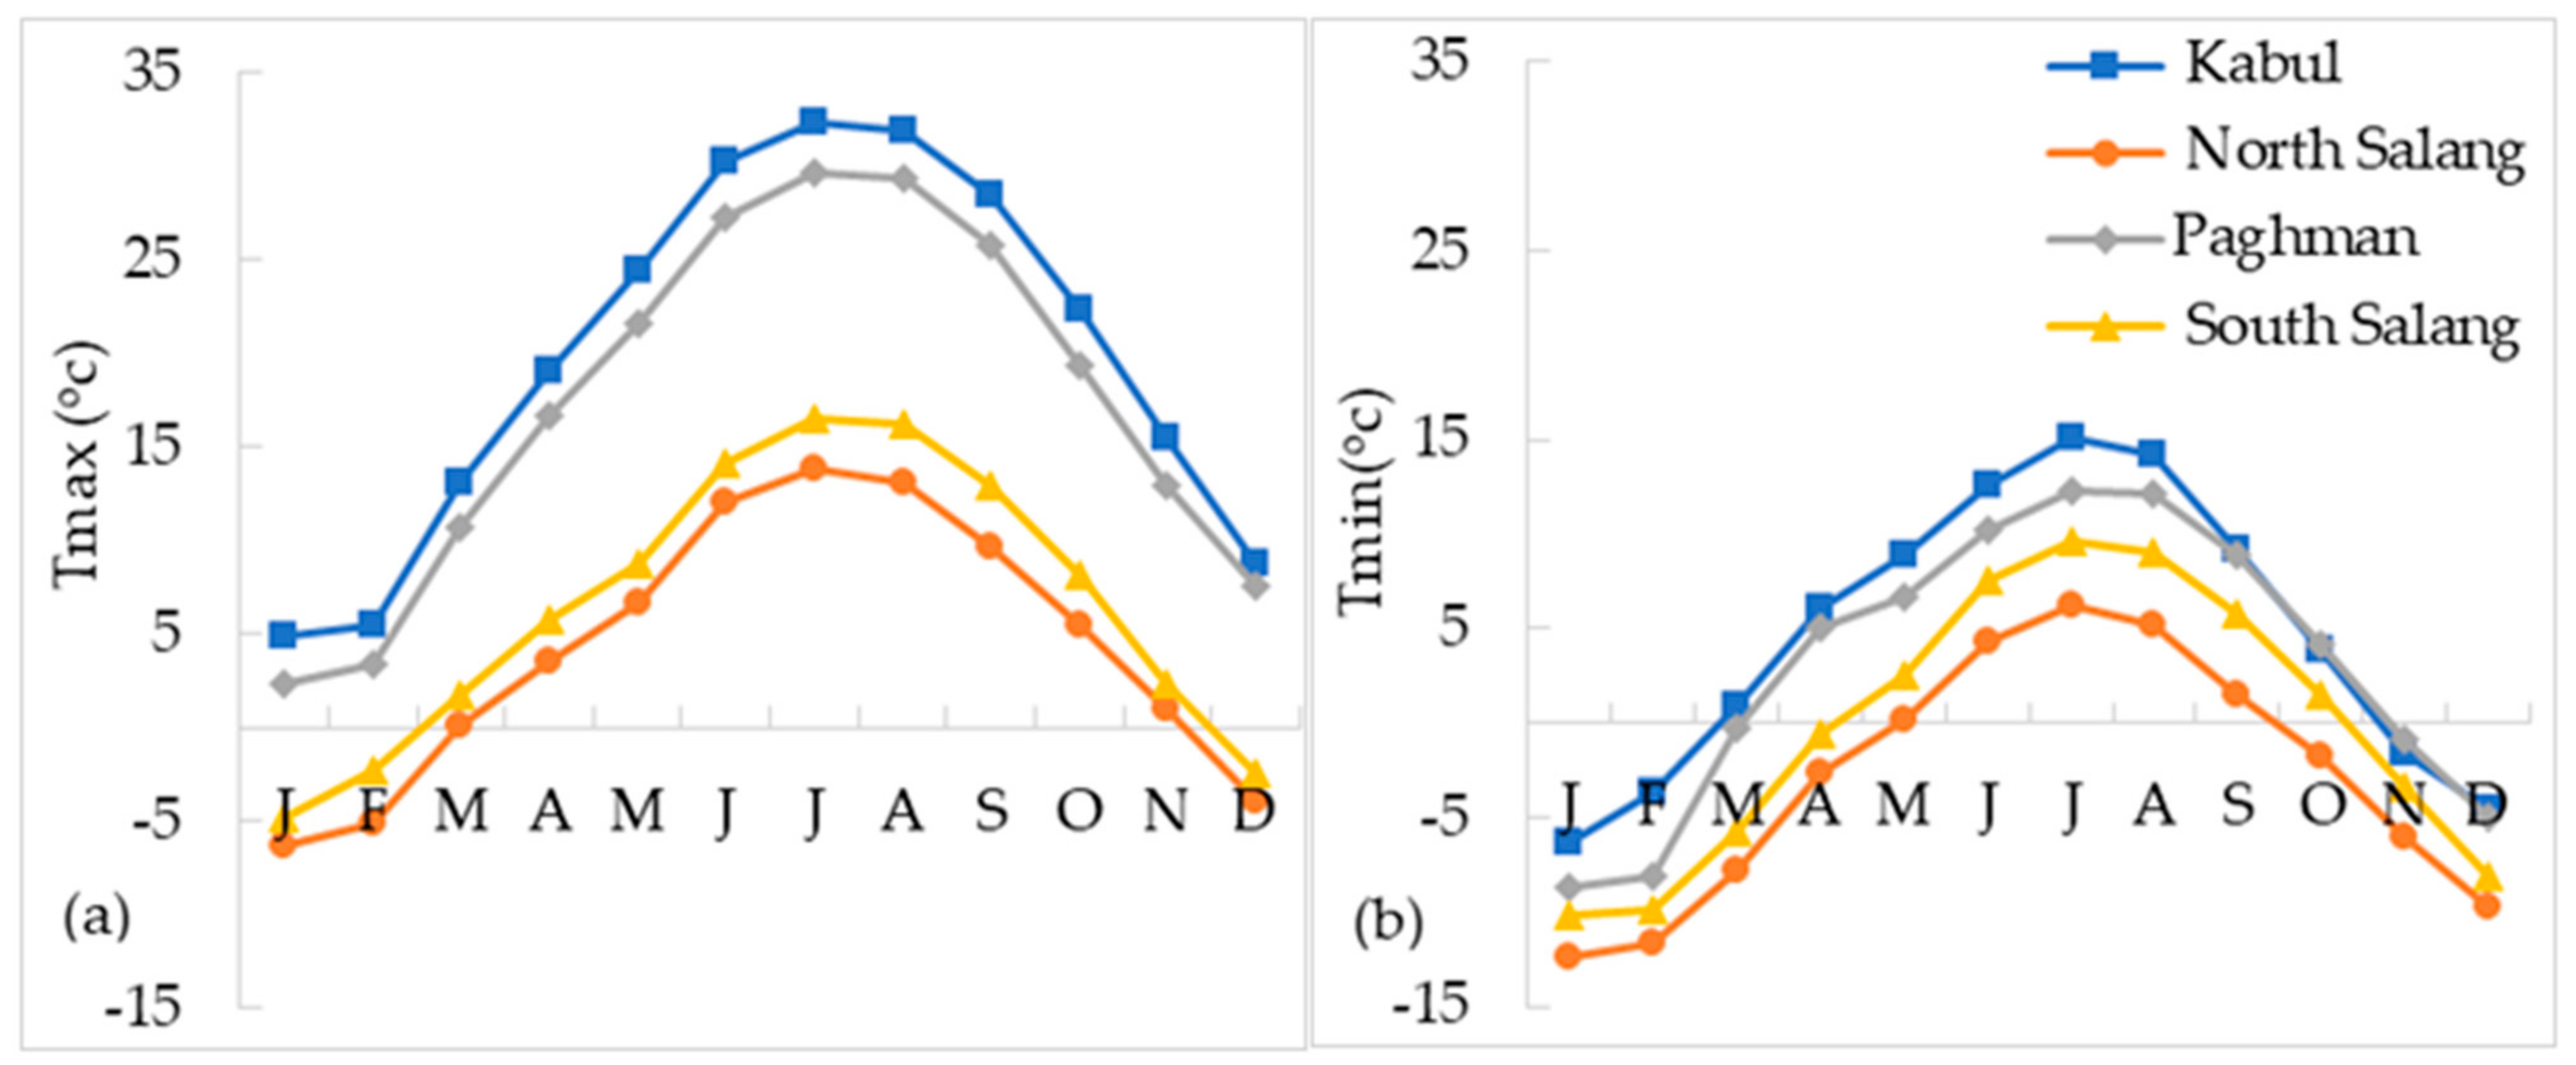
2.1. Study Area
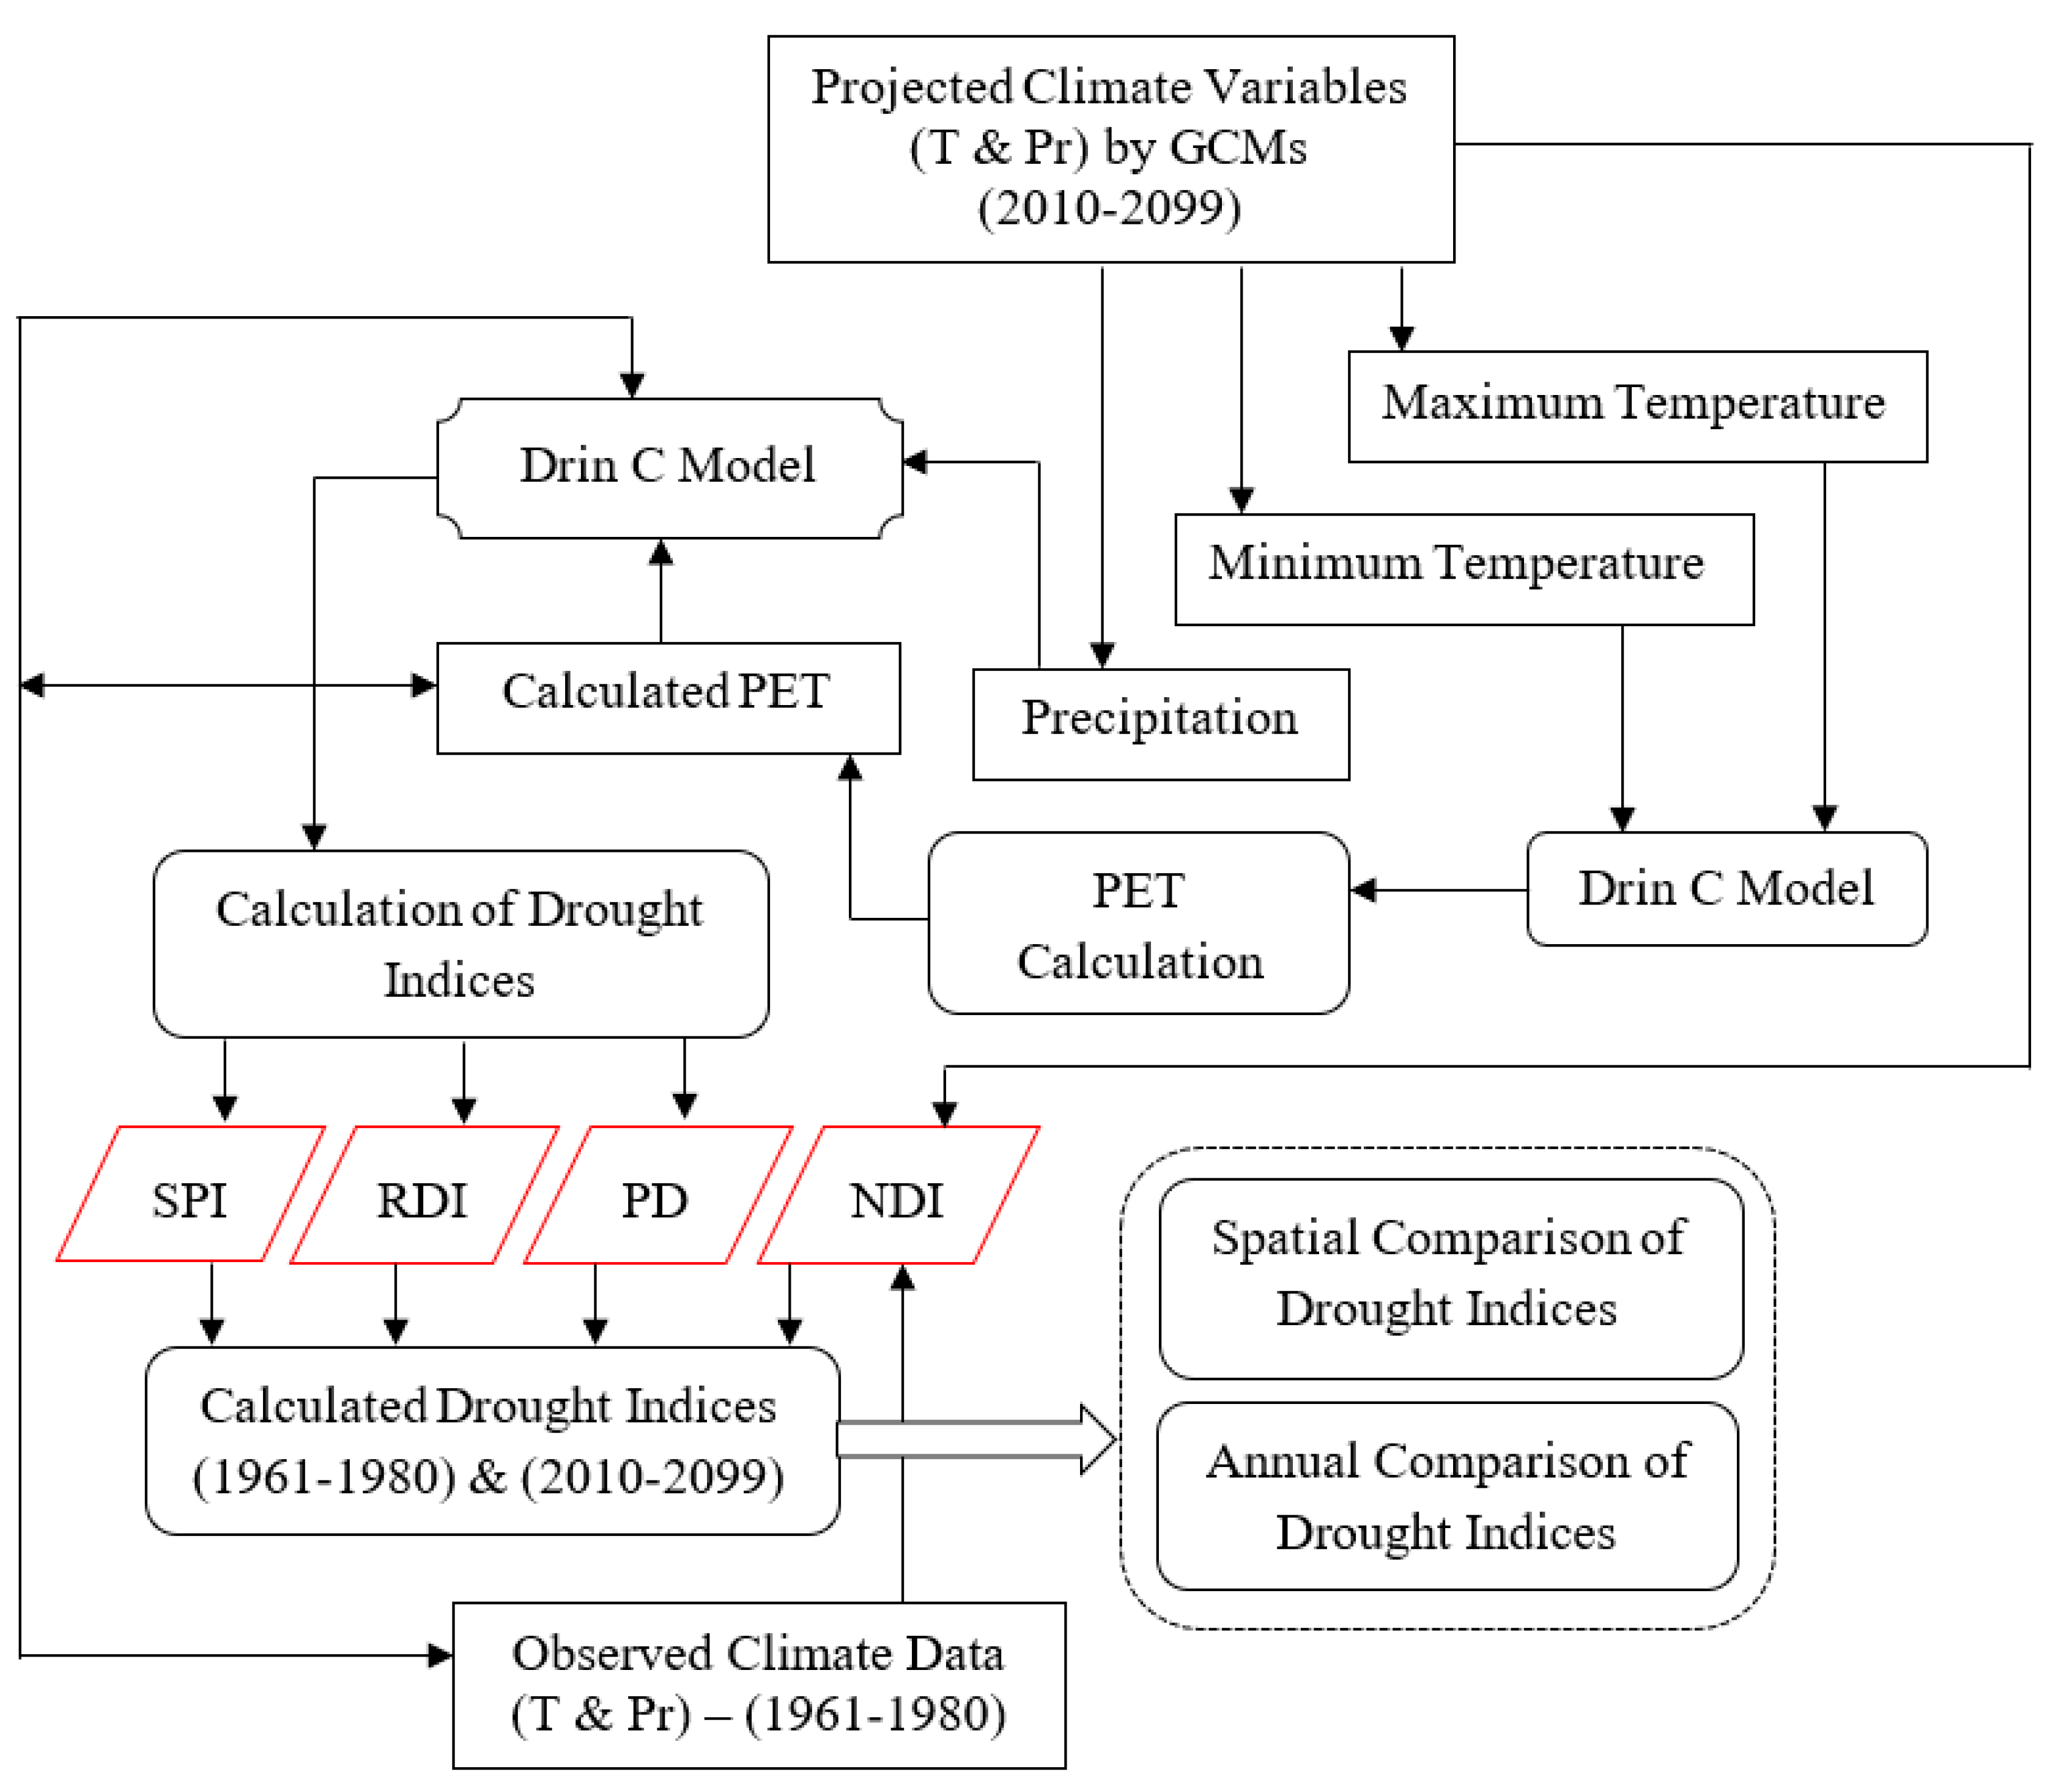
2.2. Methodology
2.2.1. Climate Change Scenario
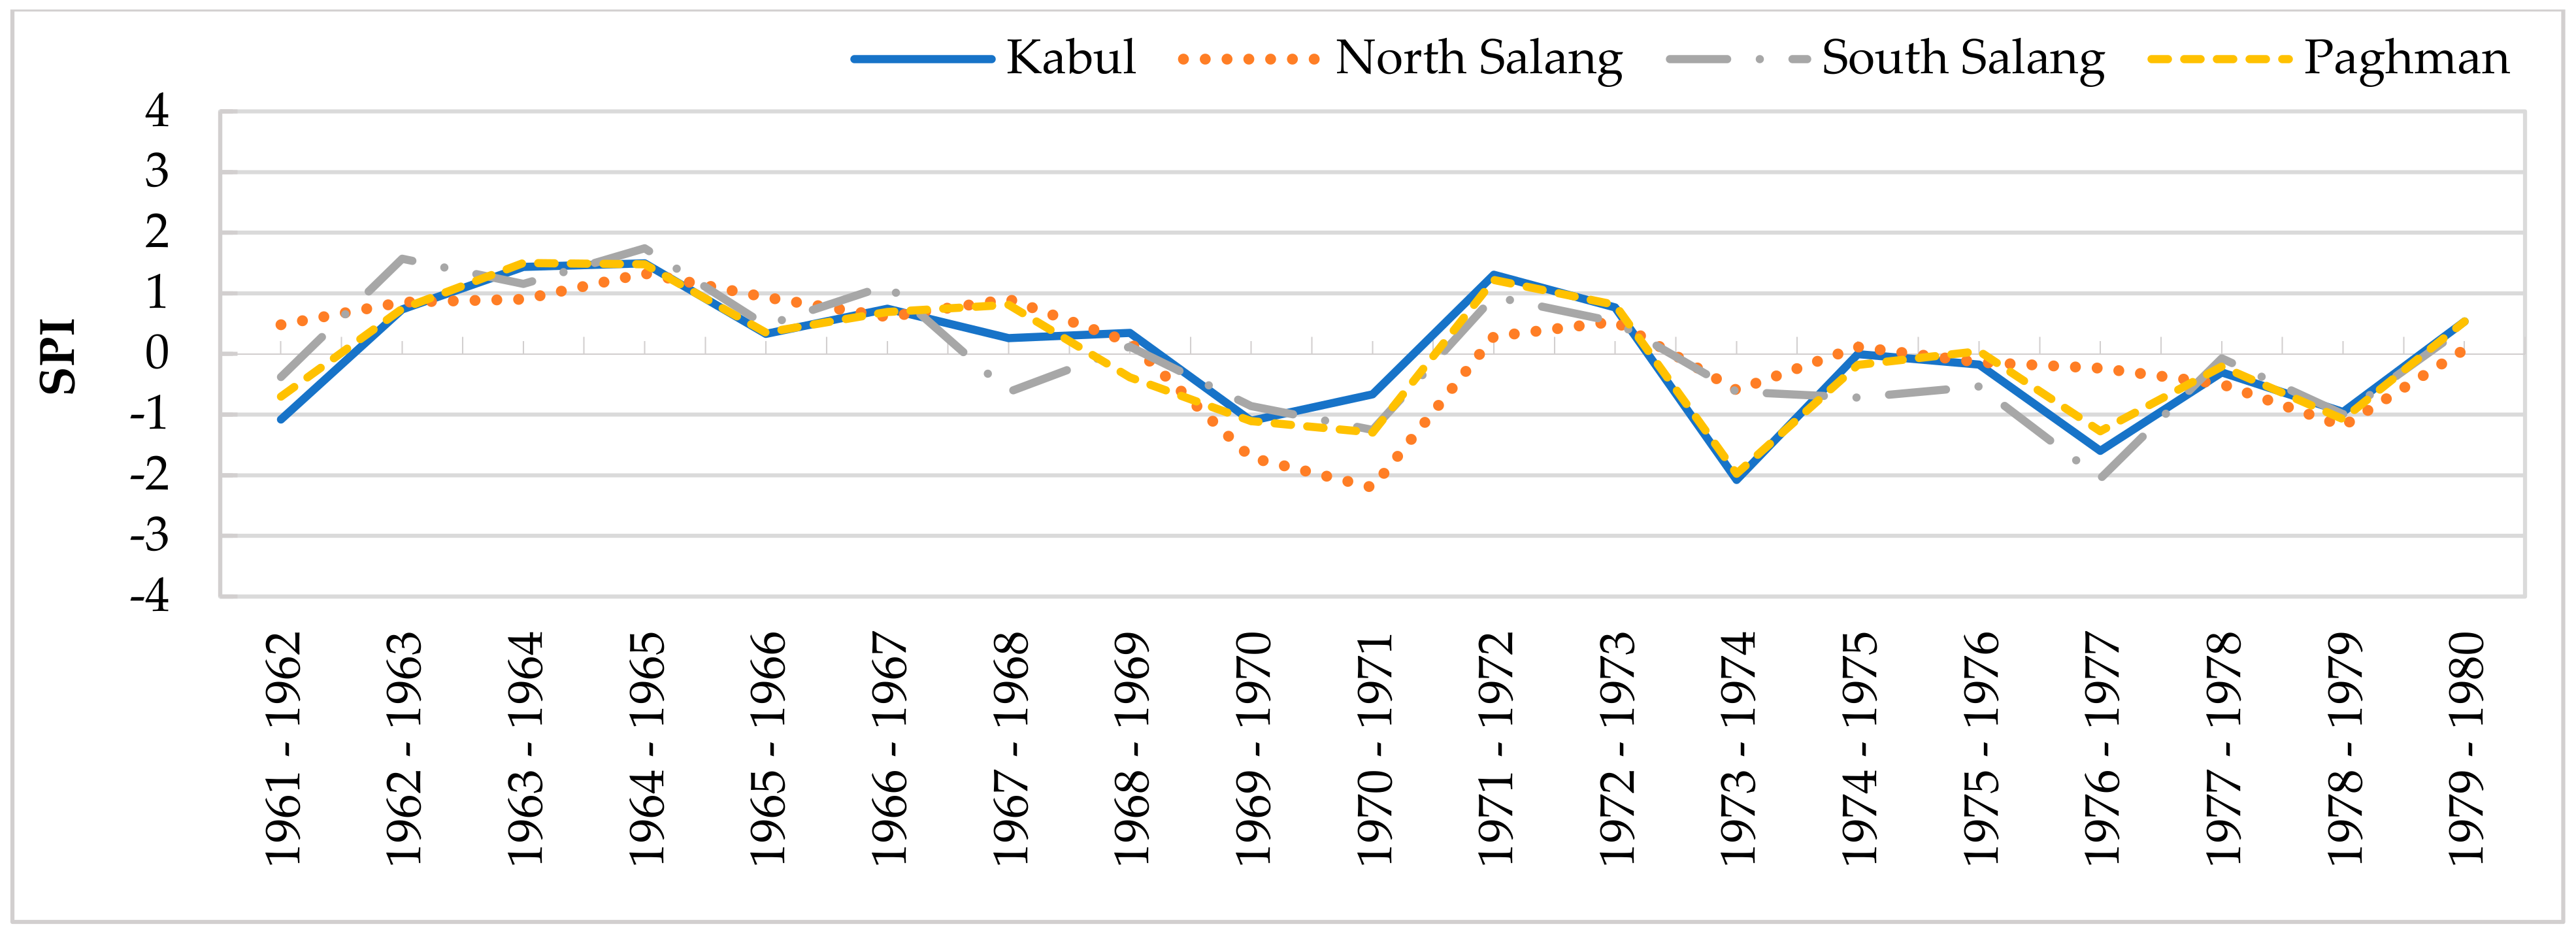
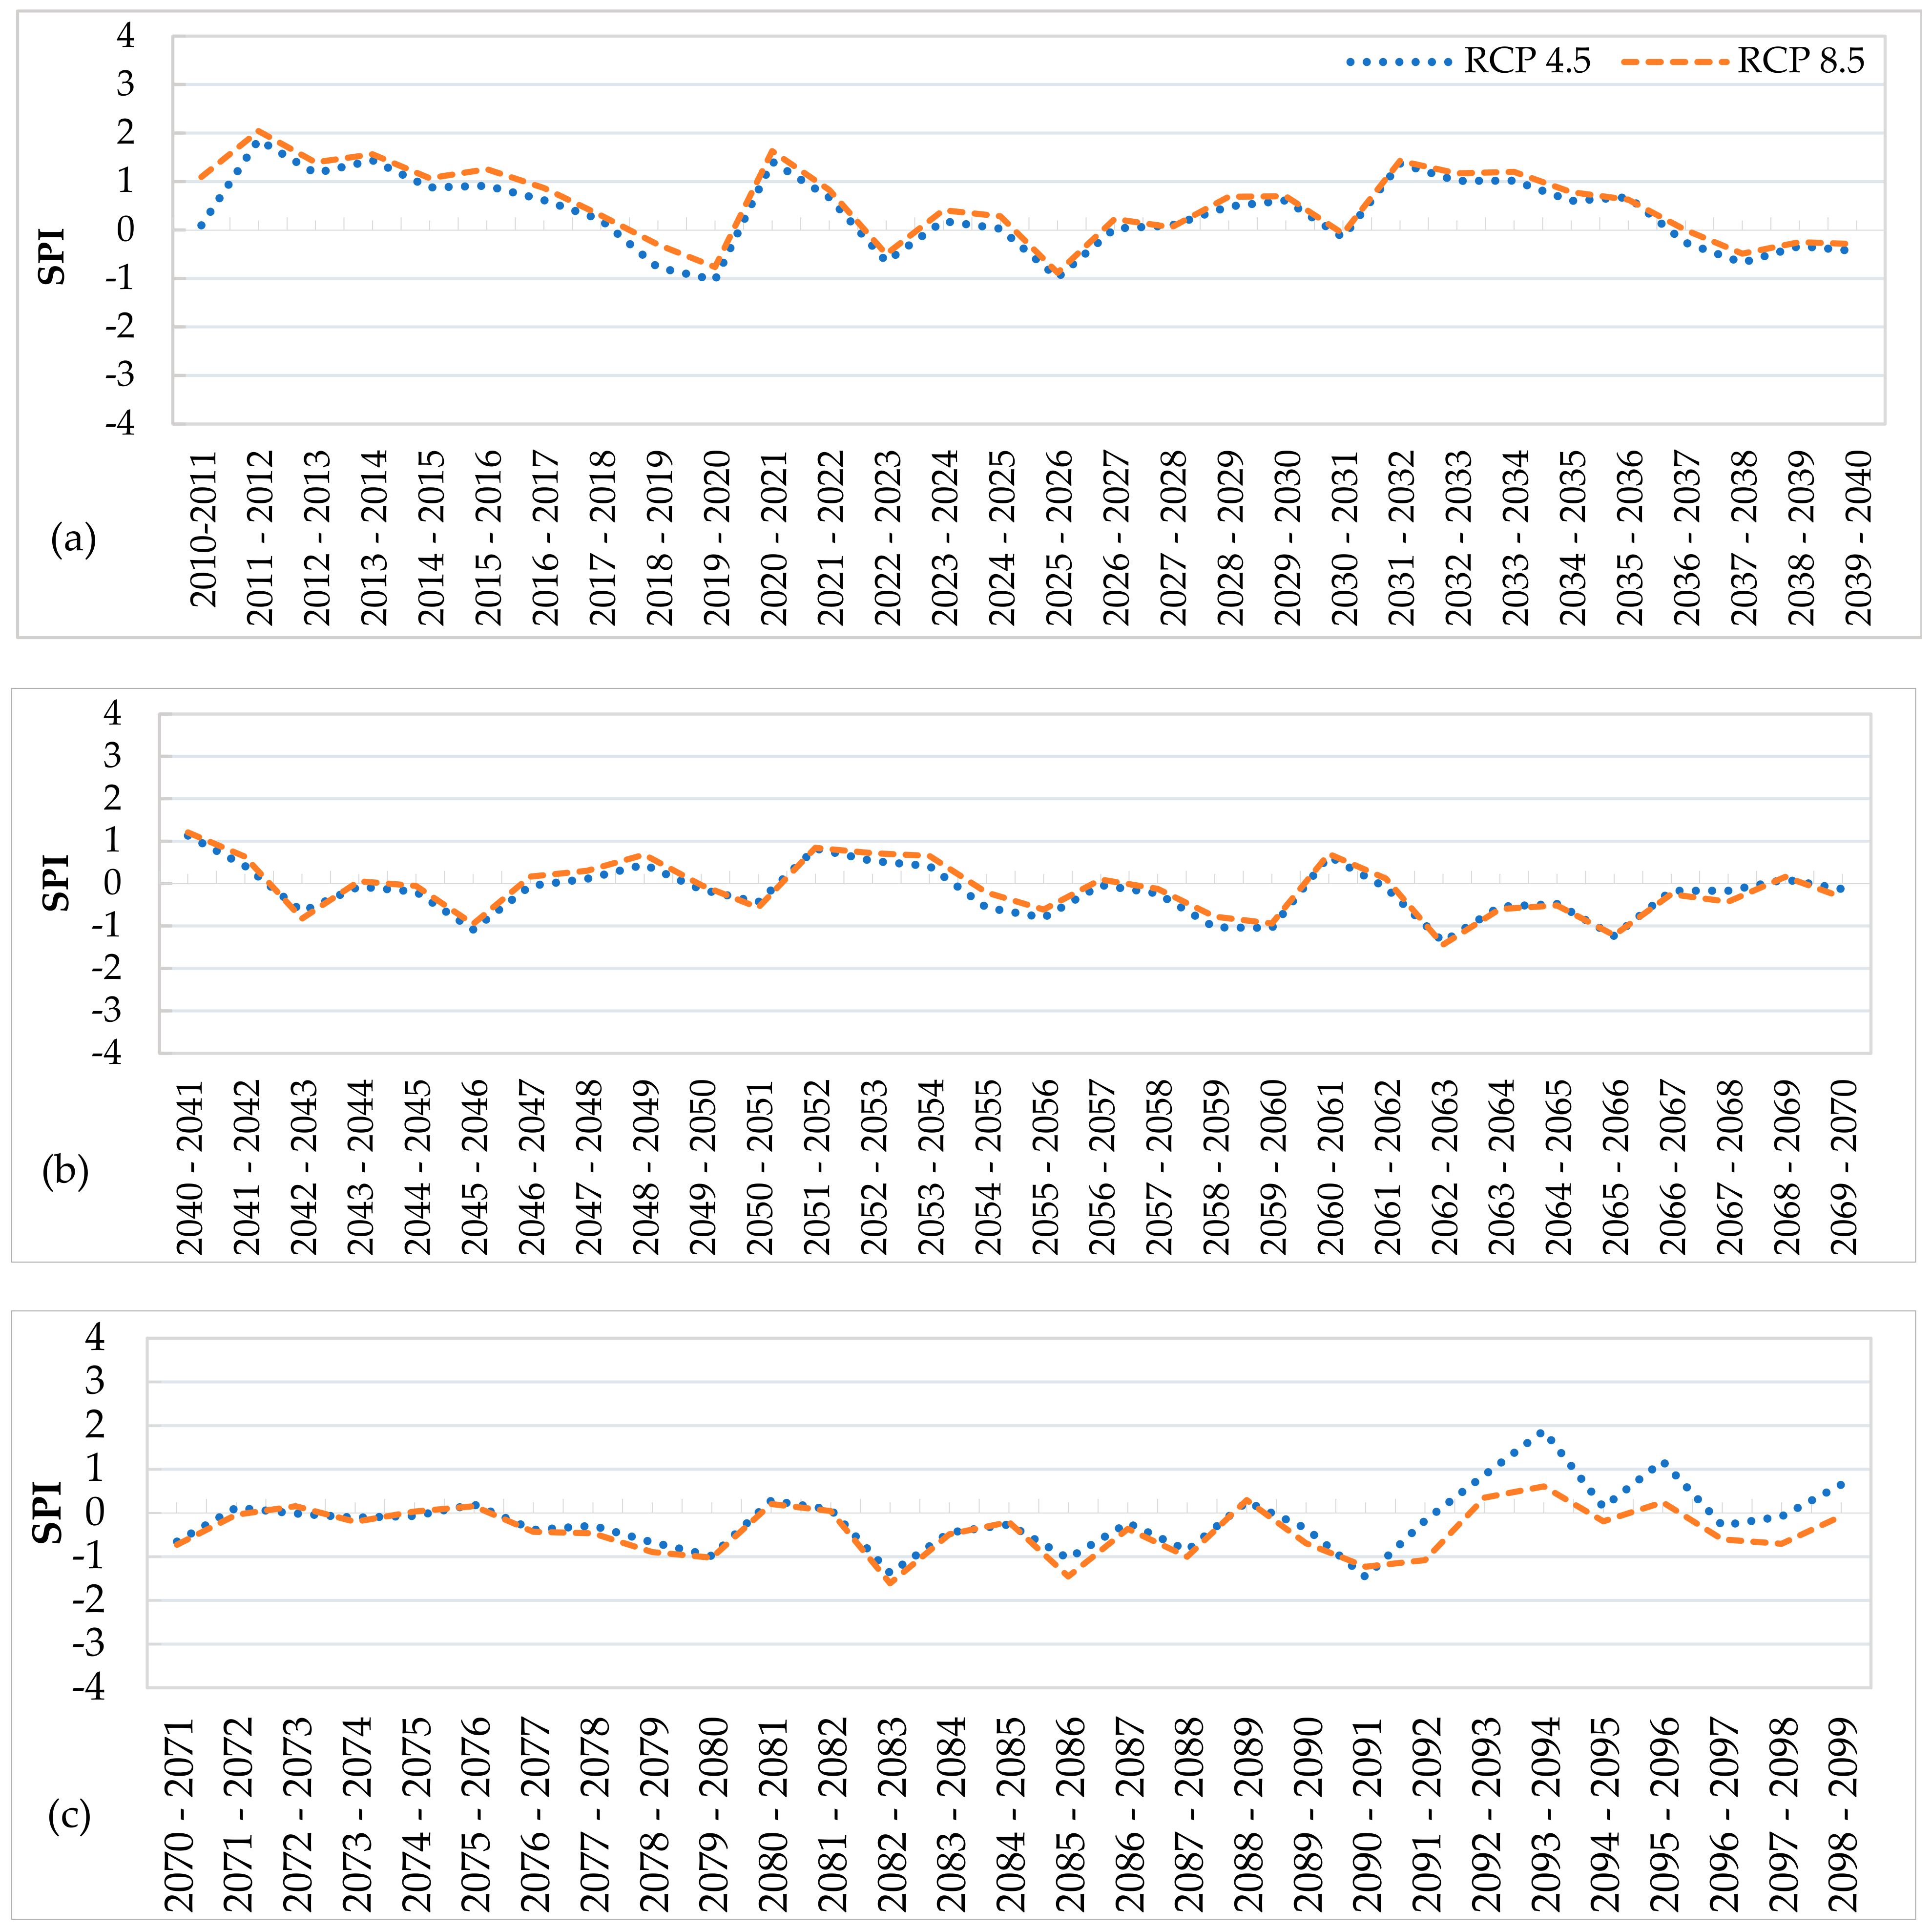
2.2.2. Standardized Precipitation Index (SPI)
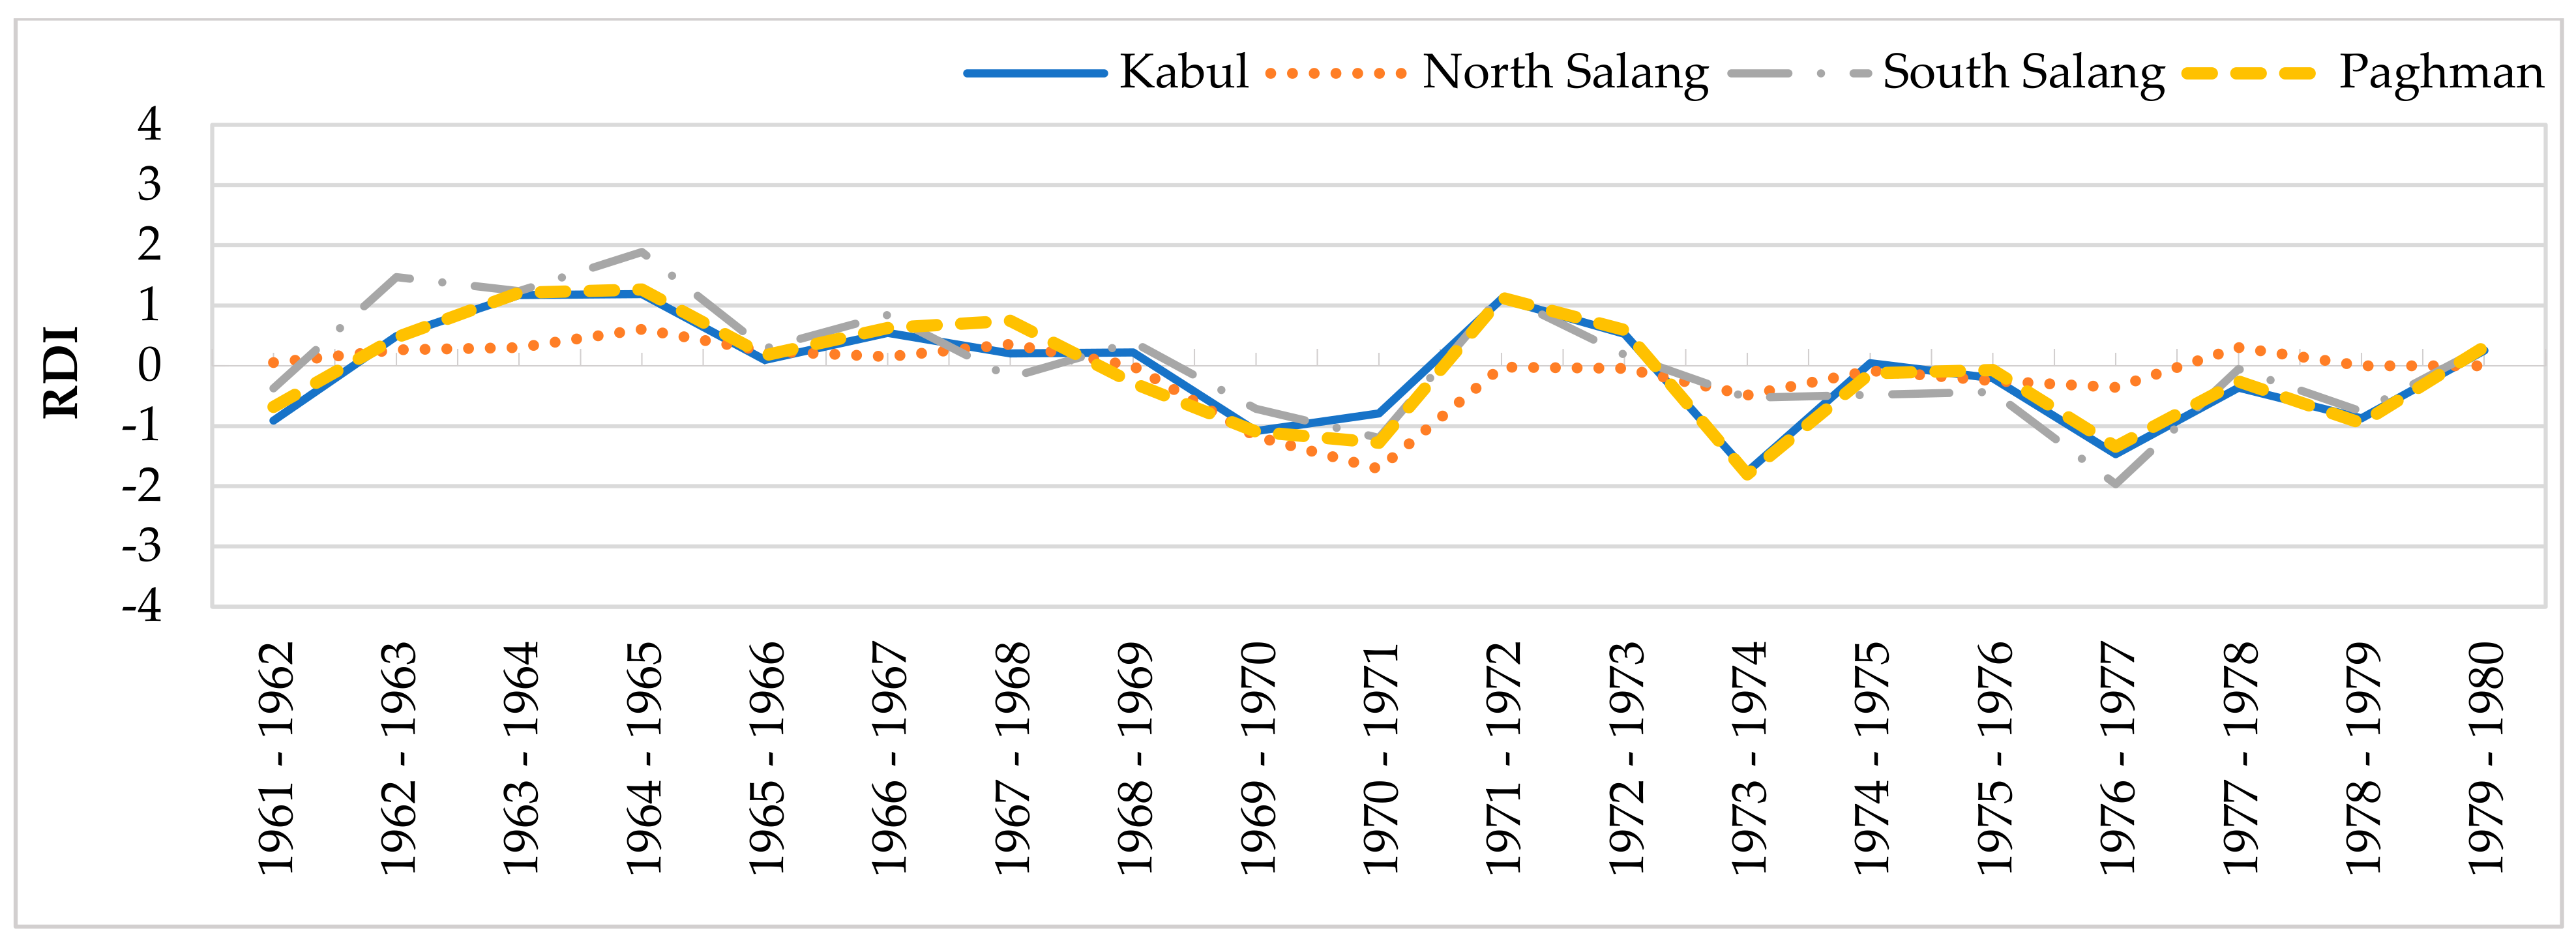
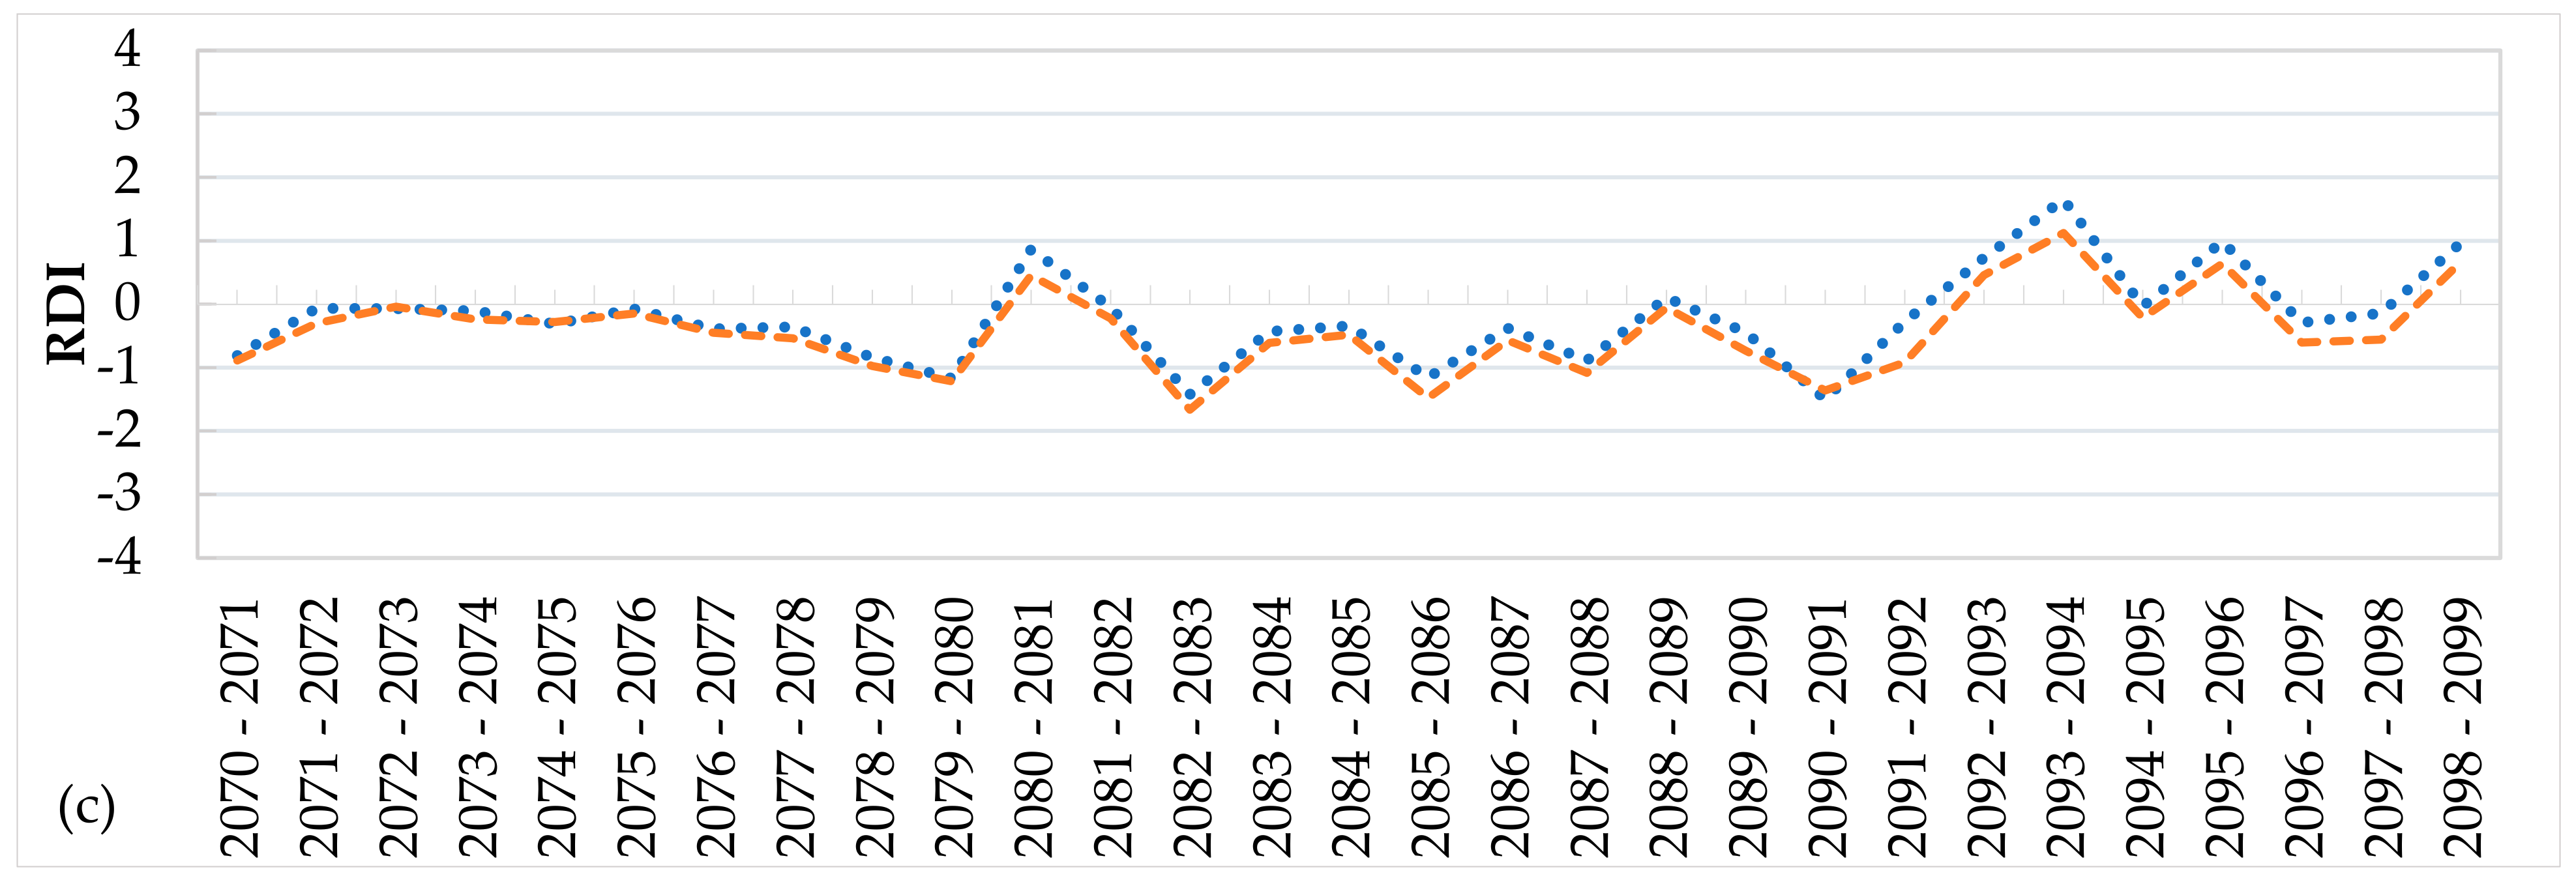
2.2.3. Reclamation Drought Index (RDI)
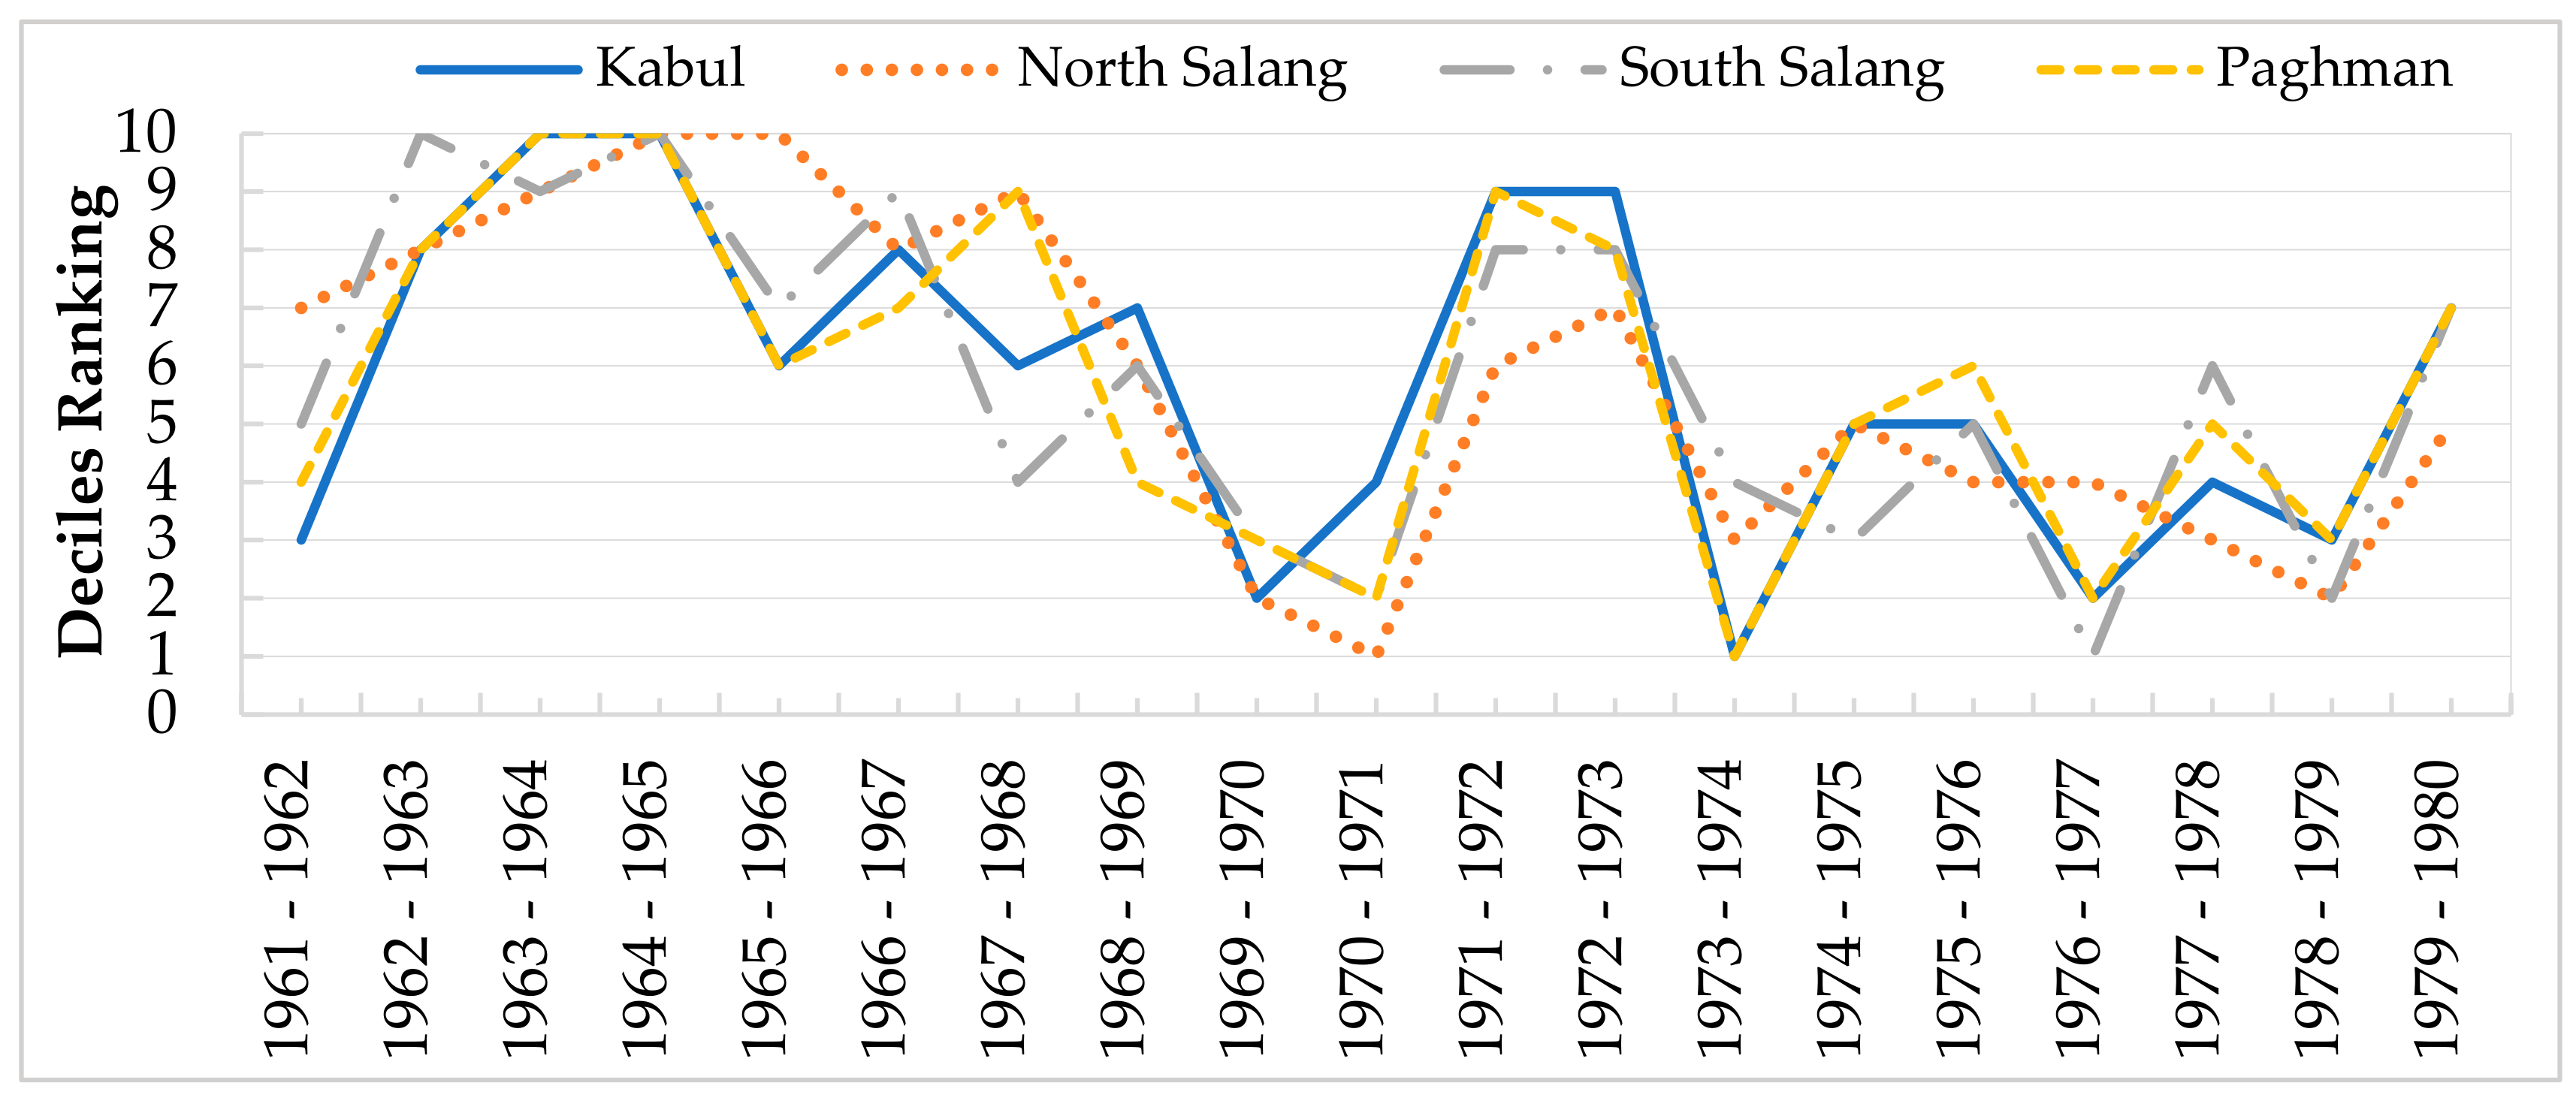
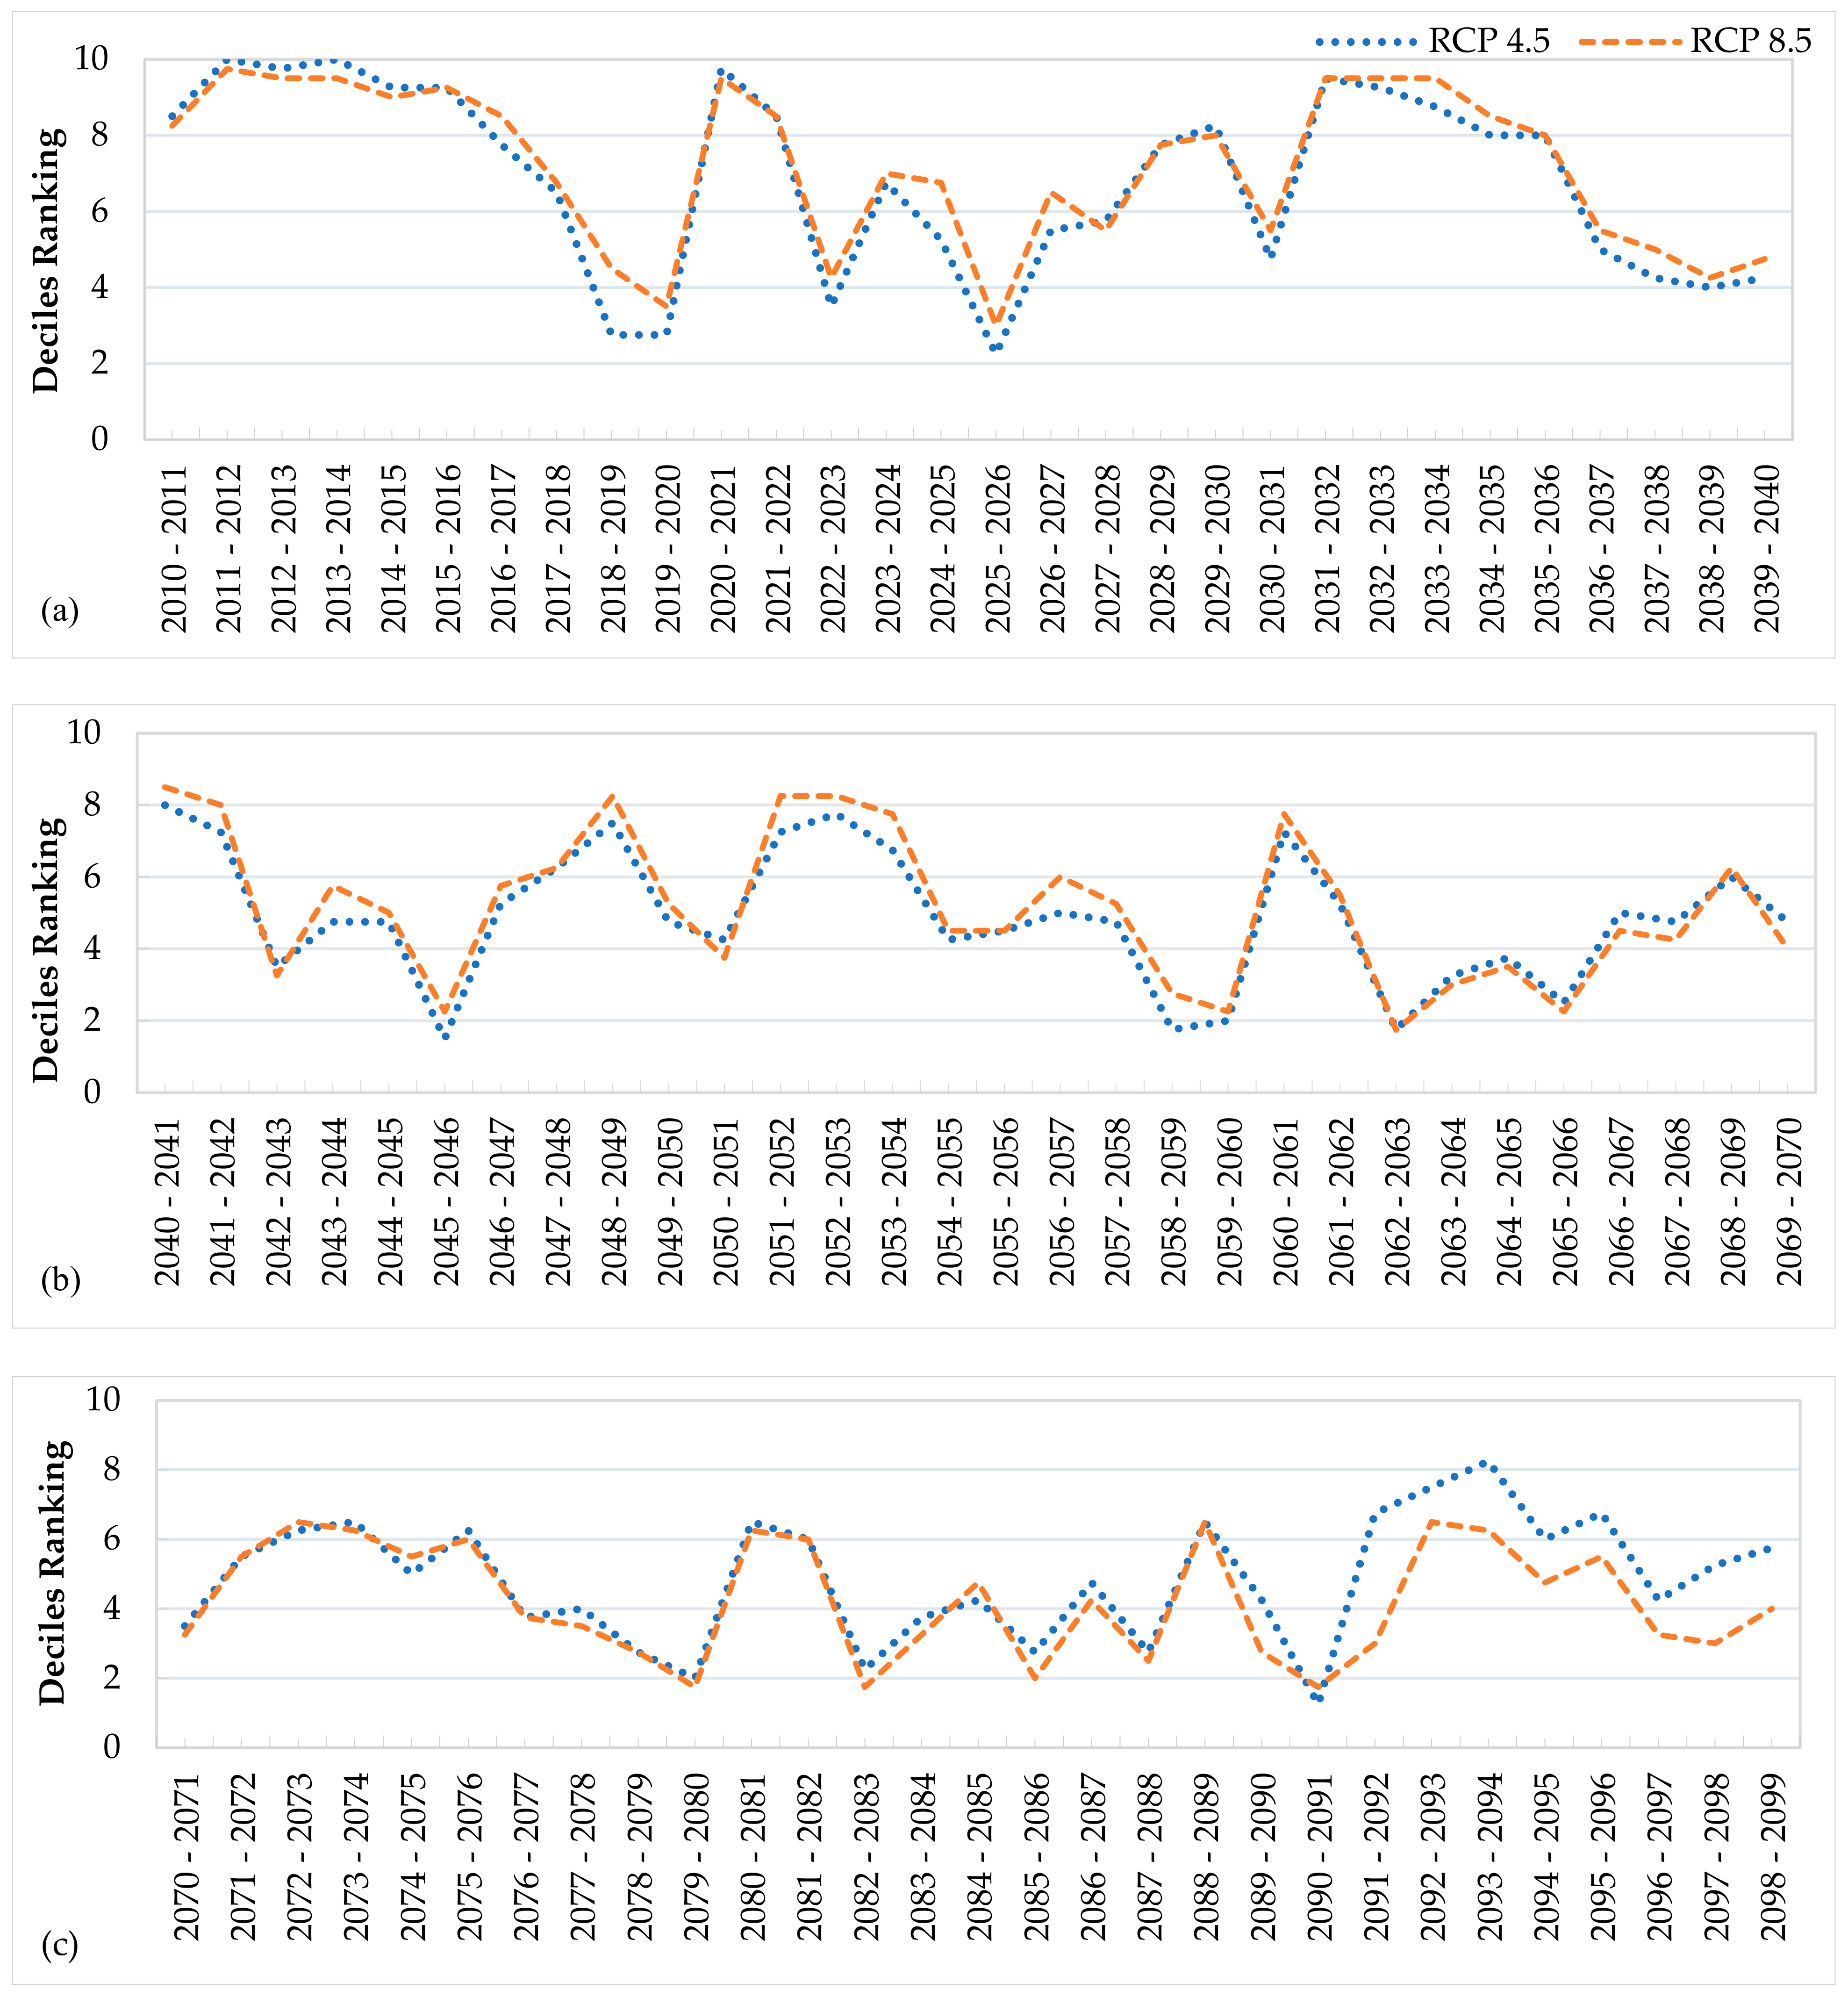
2.2.4. Deciles Index (DI)
- (i)
- Precipitation measured during previous months has placed the total of three months in the fourth decile or higher, or
- (ii)
- Total precipitation in the last three months is in the eighth decile or higher.
2.2.5. Aridity Index (AI)
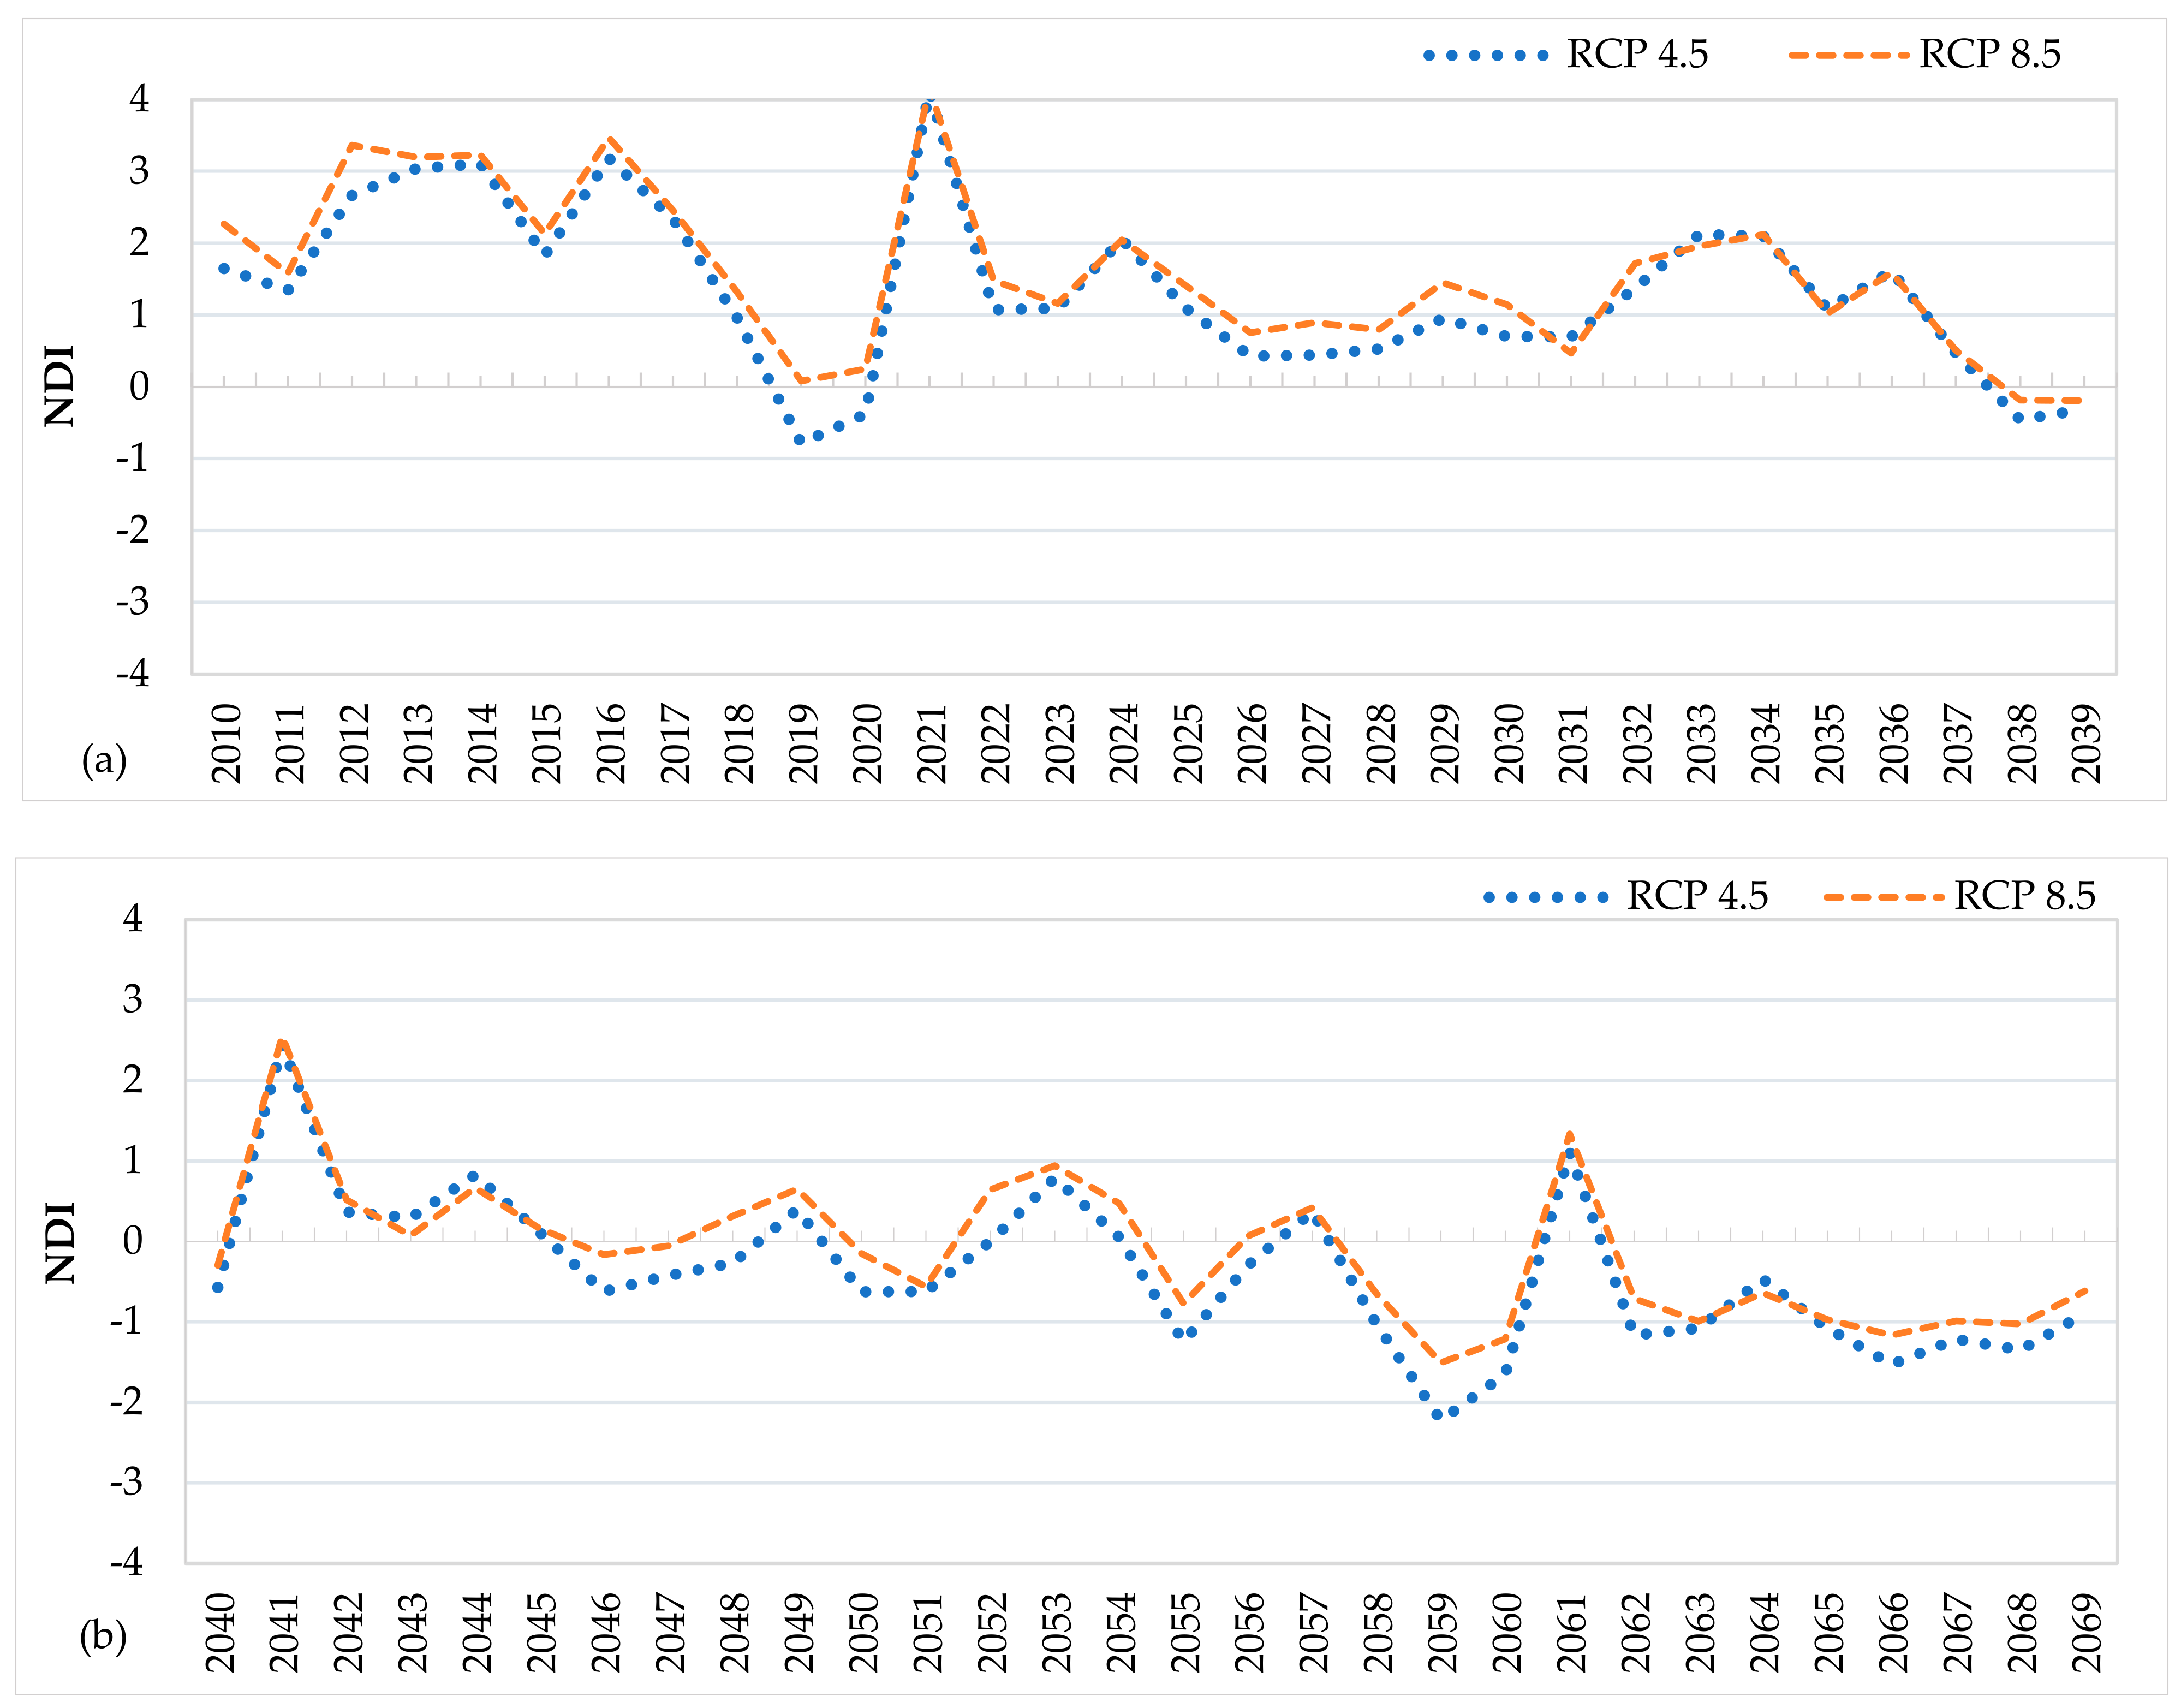
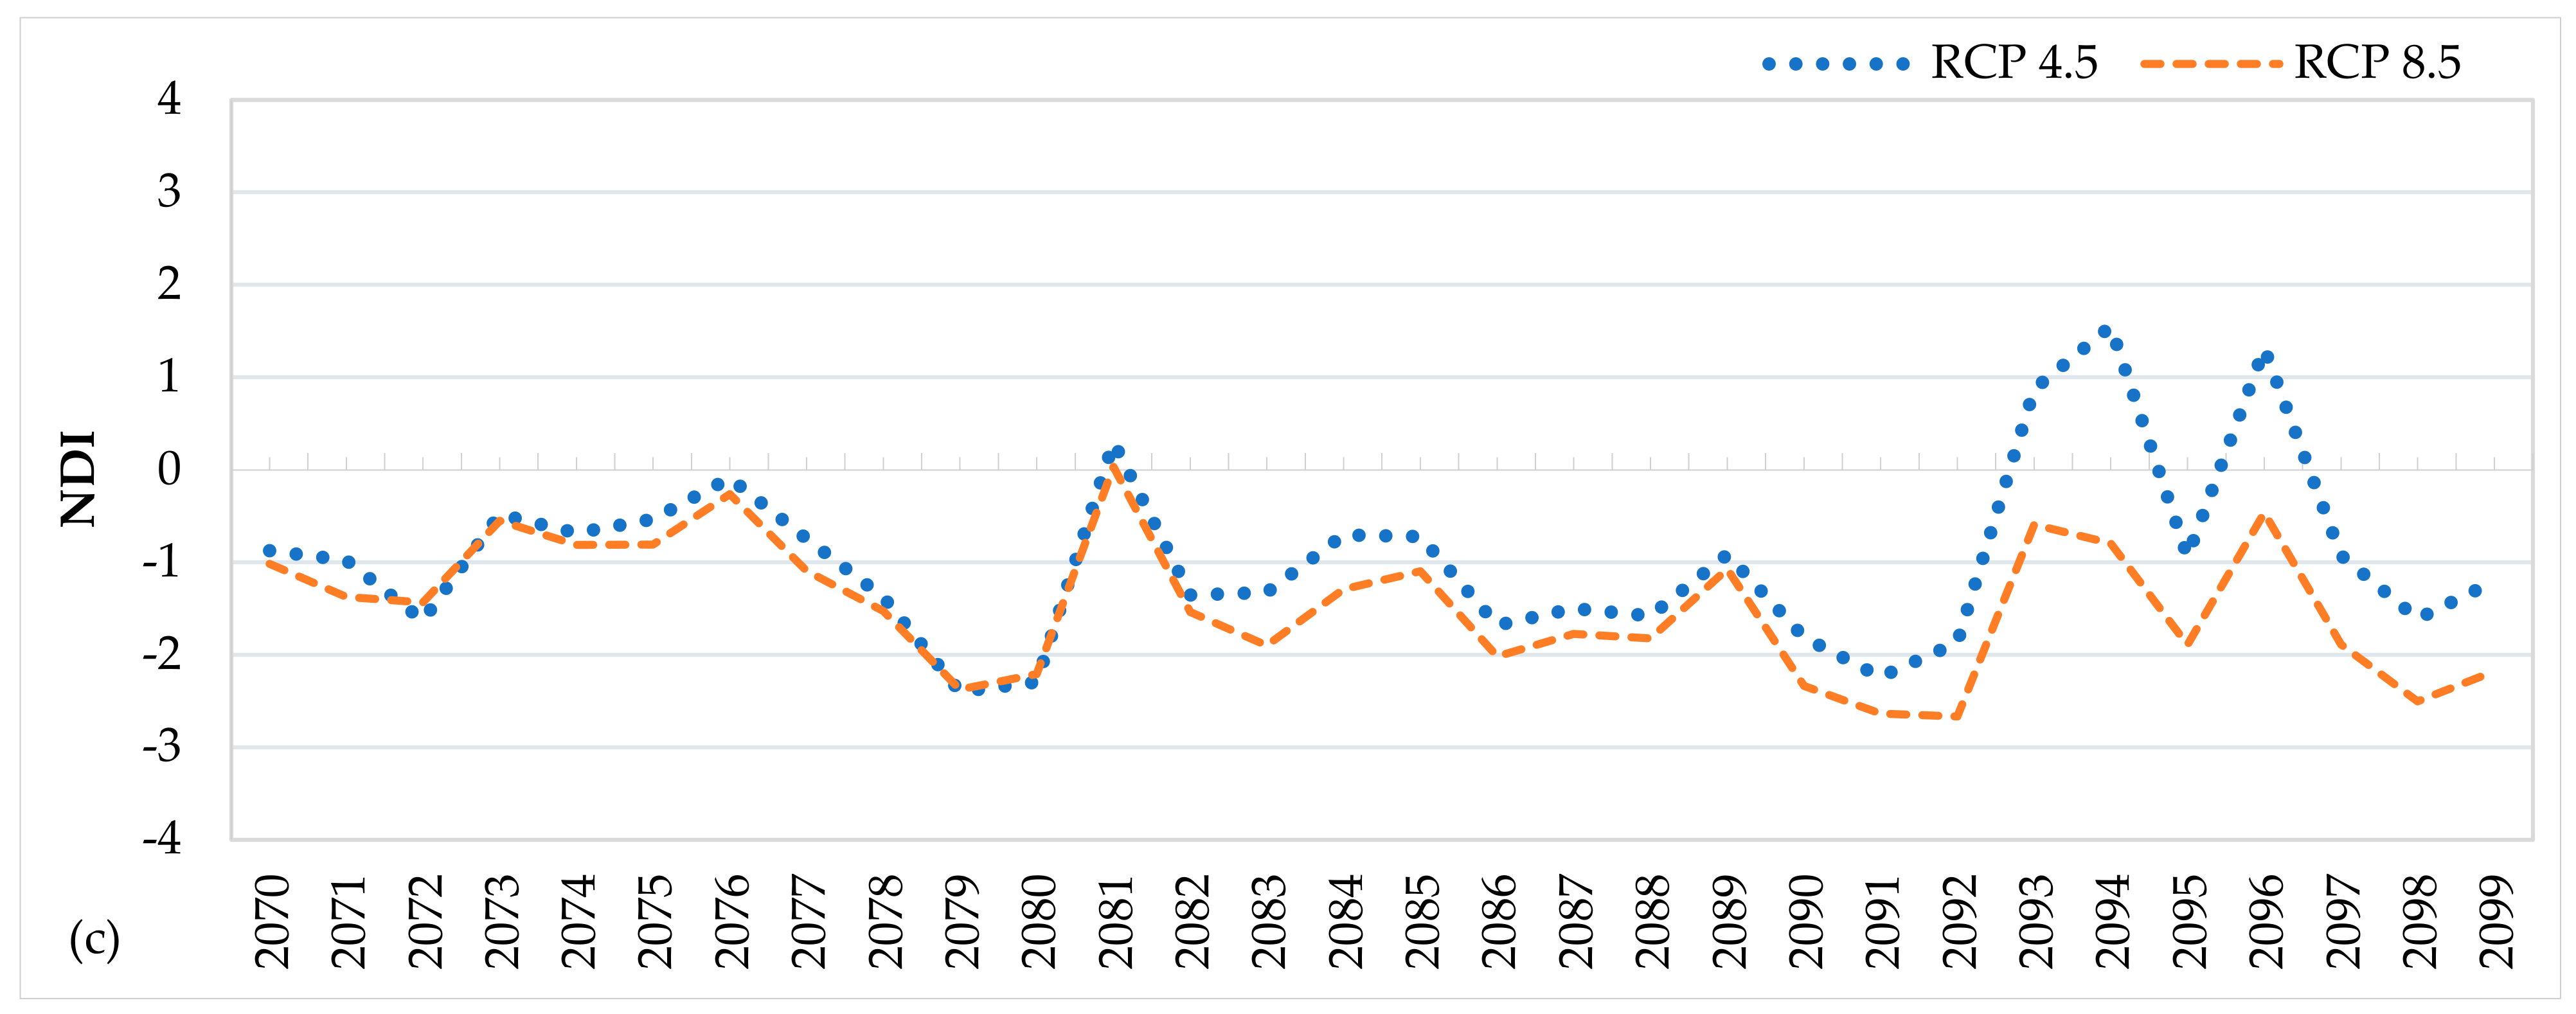
2.2.6. New Drought Index (NDI)
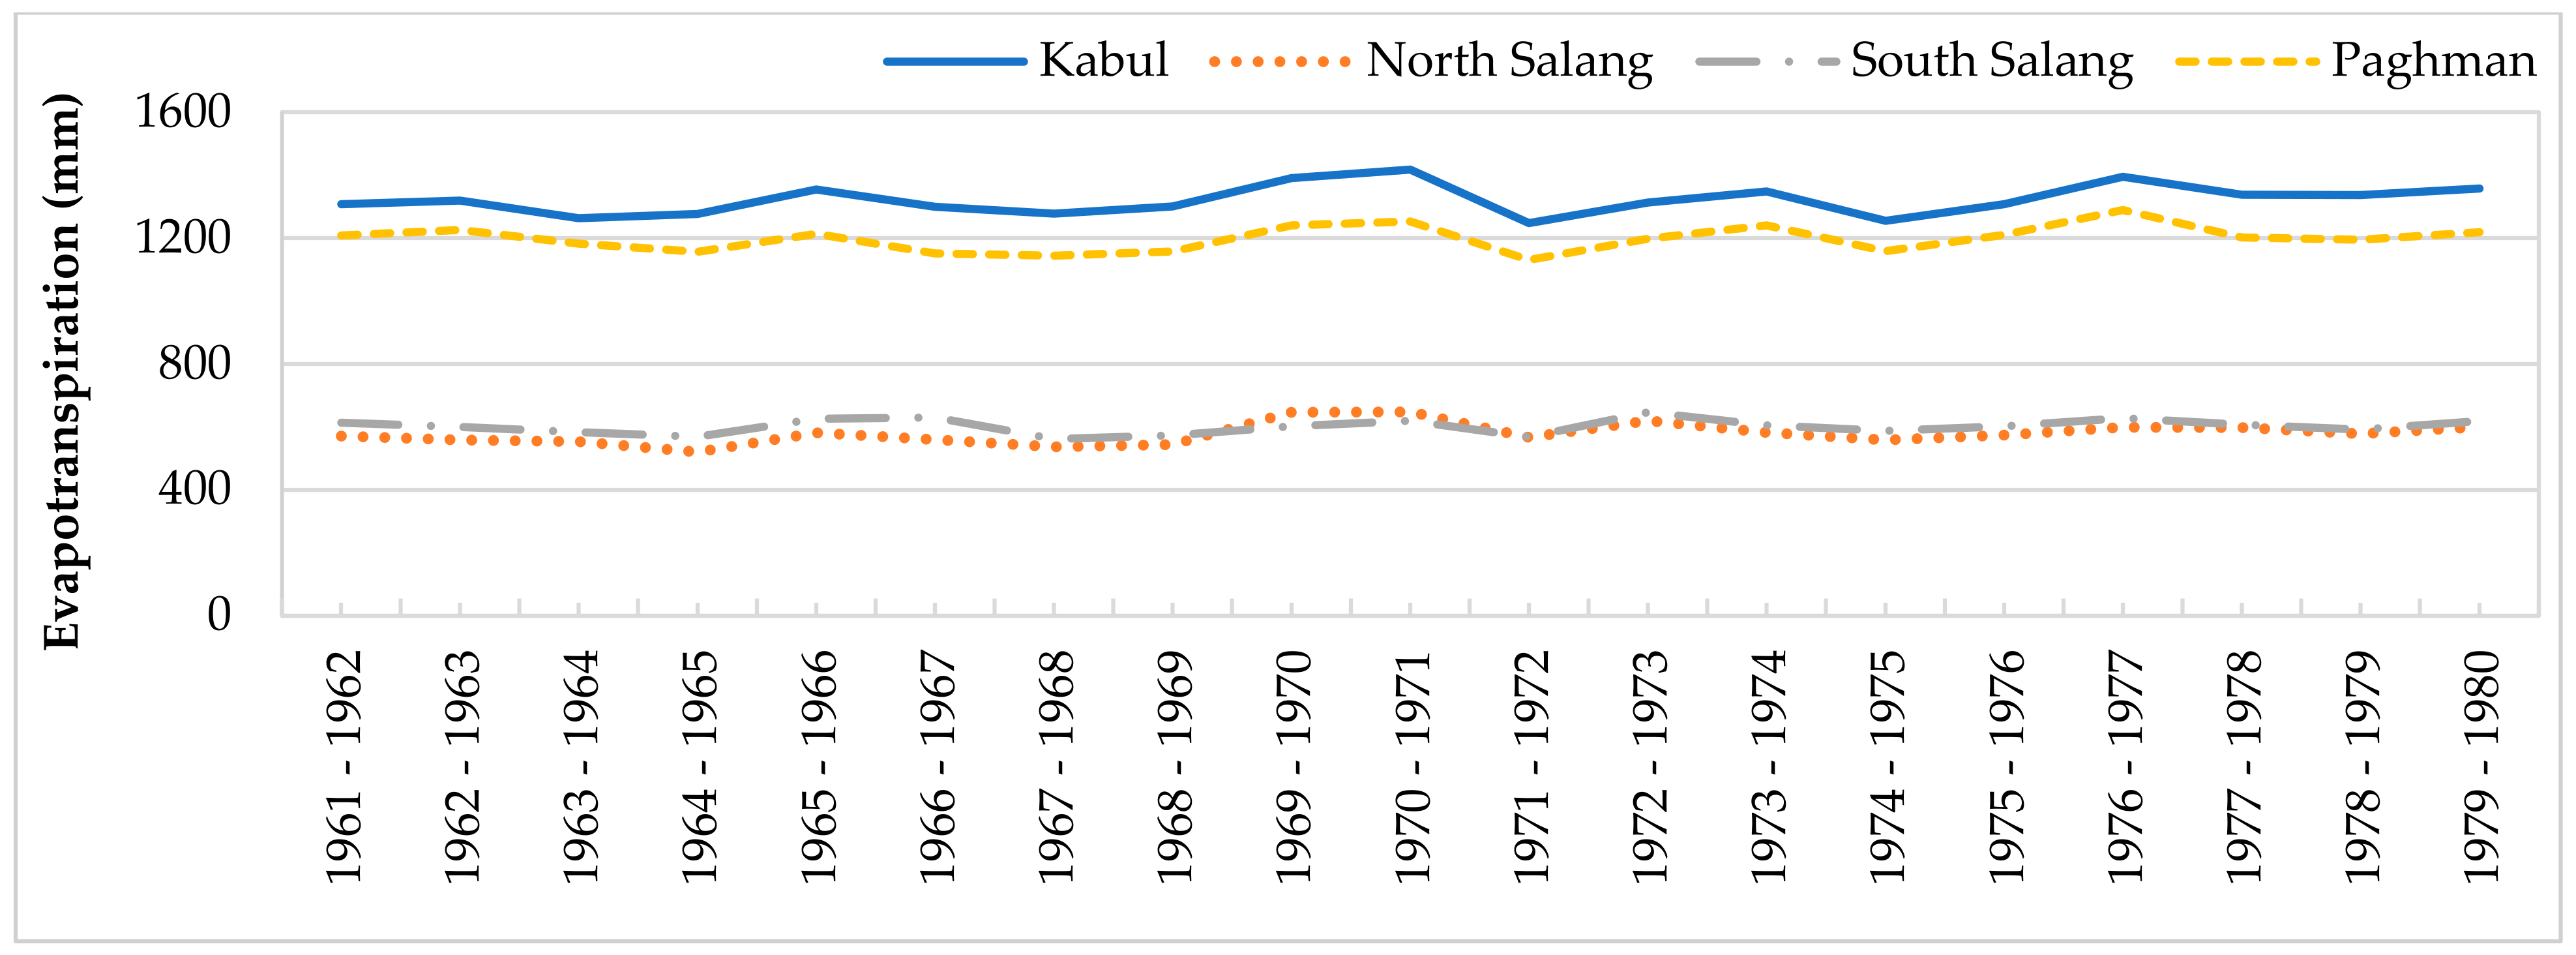
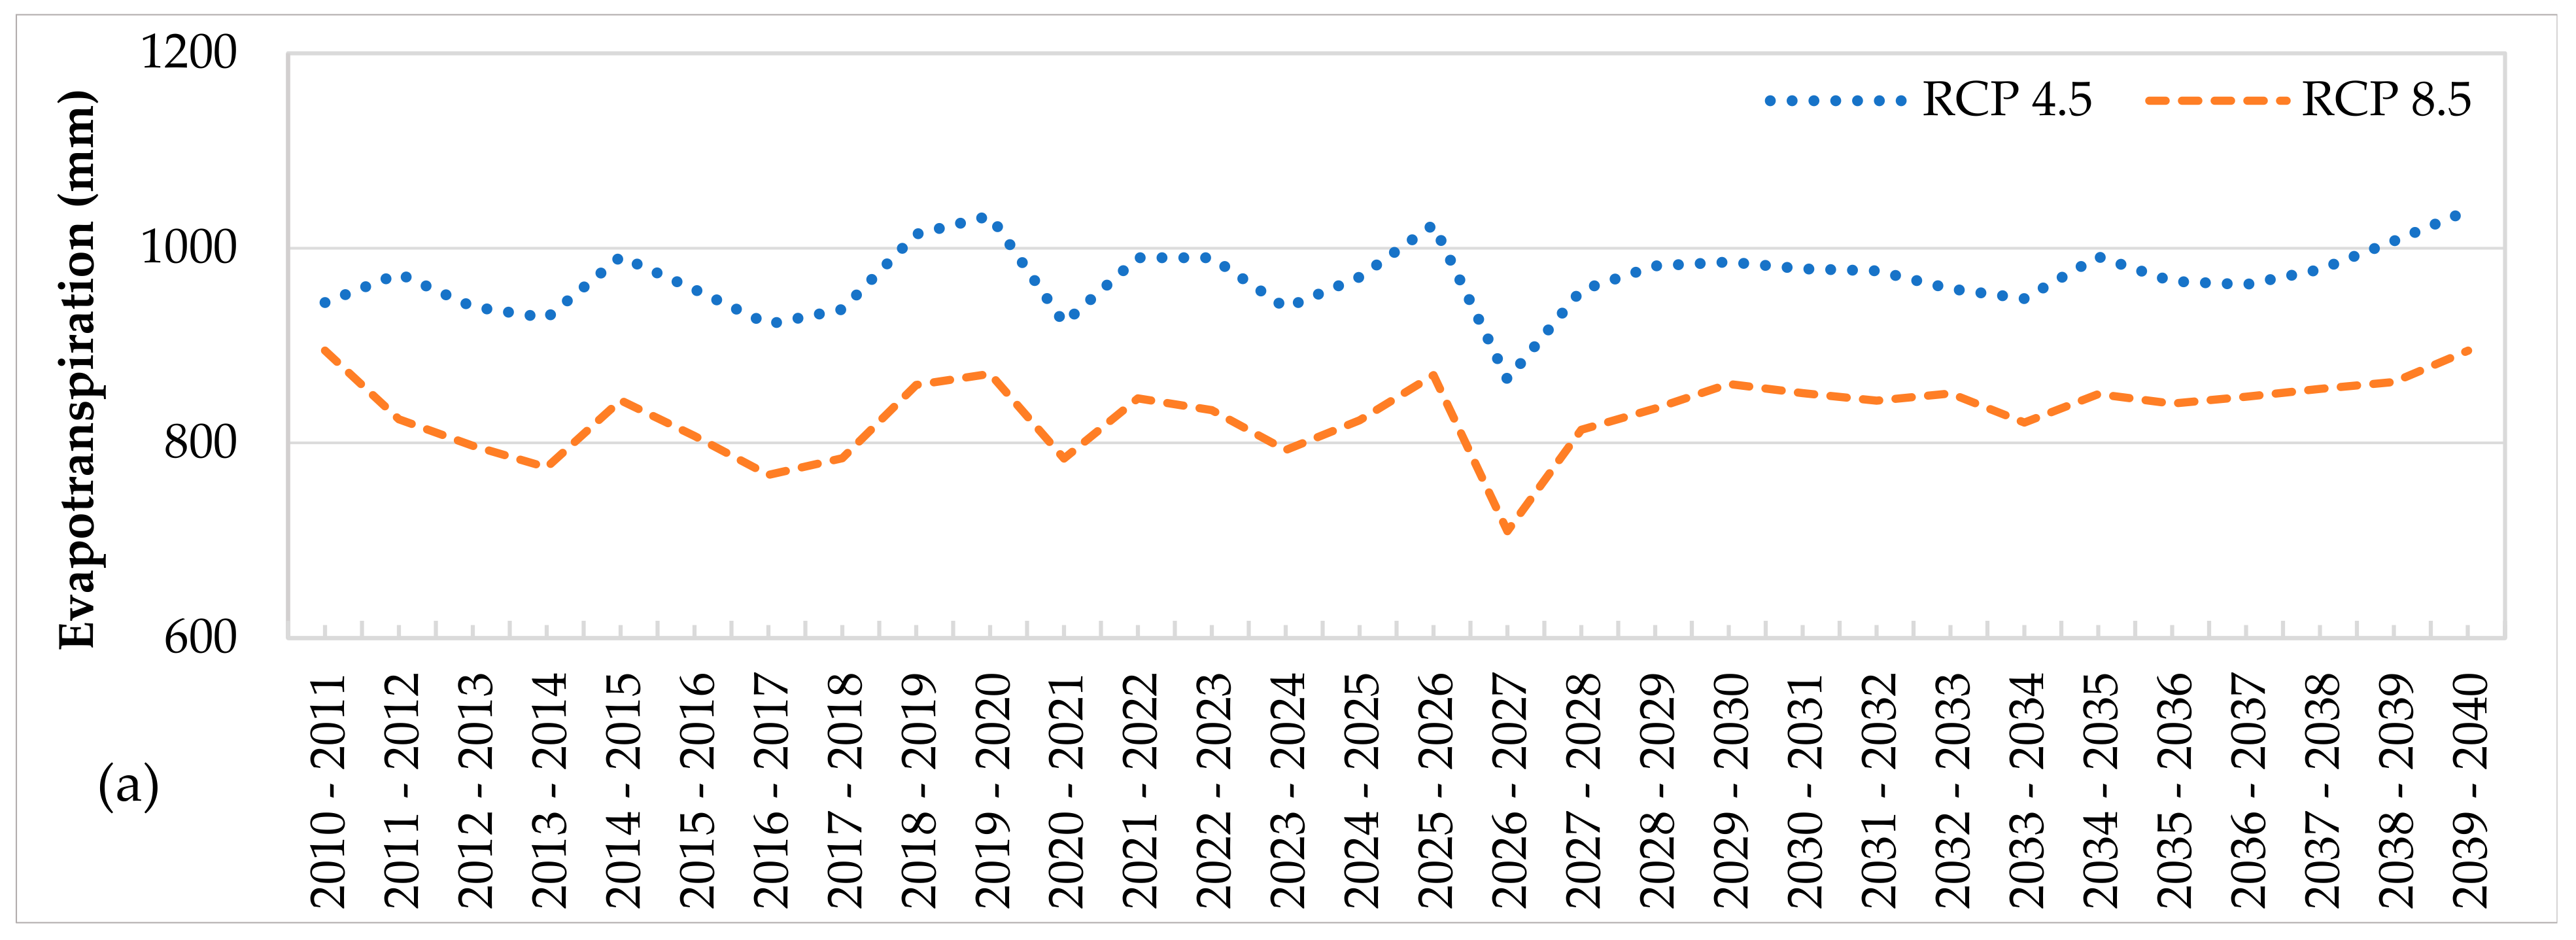
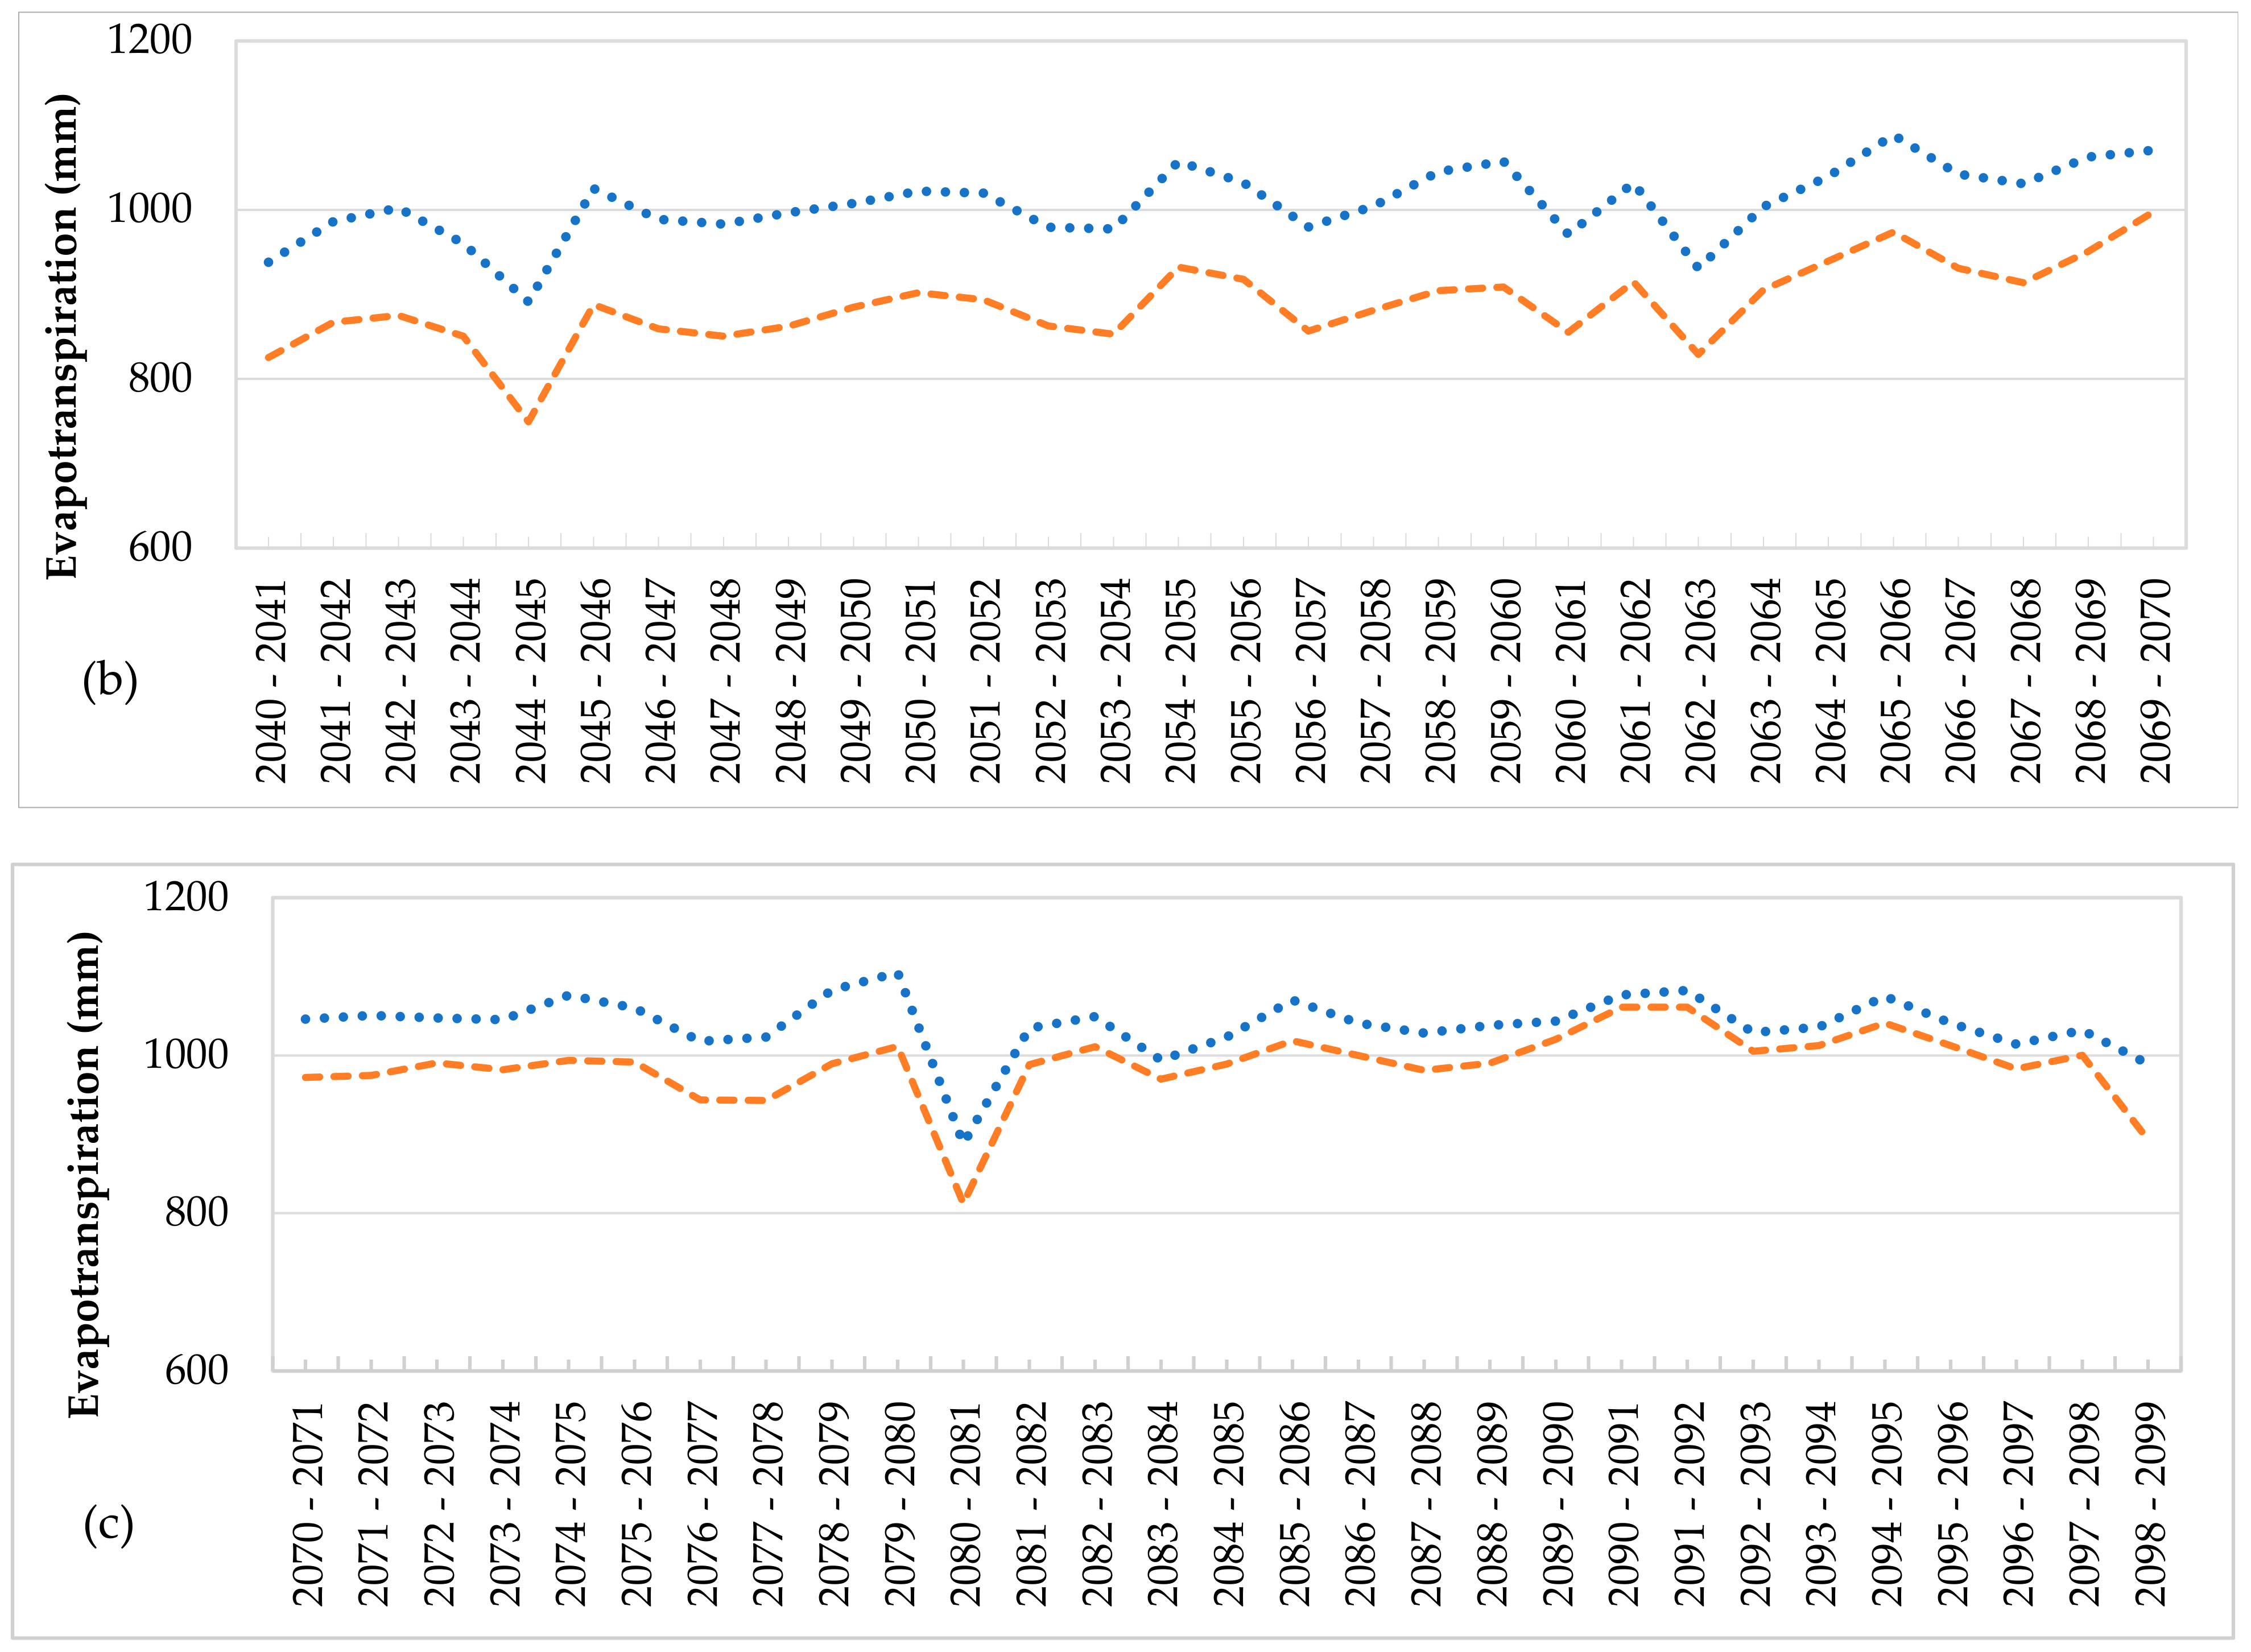
2.2.7. Estimation of PET
2.2.8. Inverse Distance Weighting (IDW)
3. Results
3.1. Assessment of Drought for the Historical Periods
3.2. Bias Correction of Climate Data
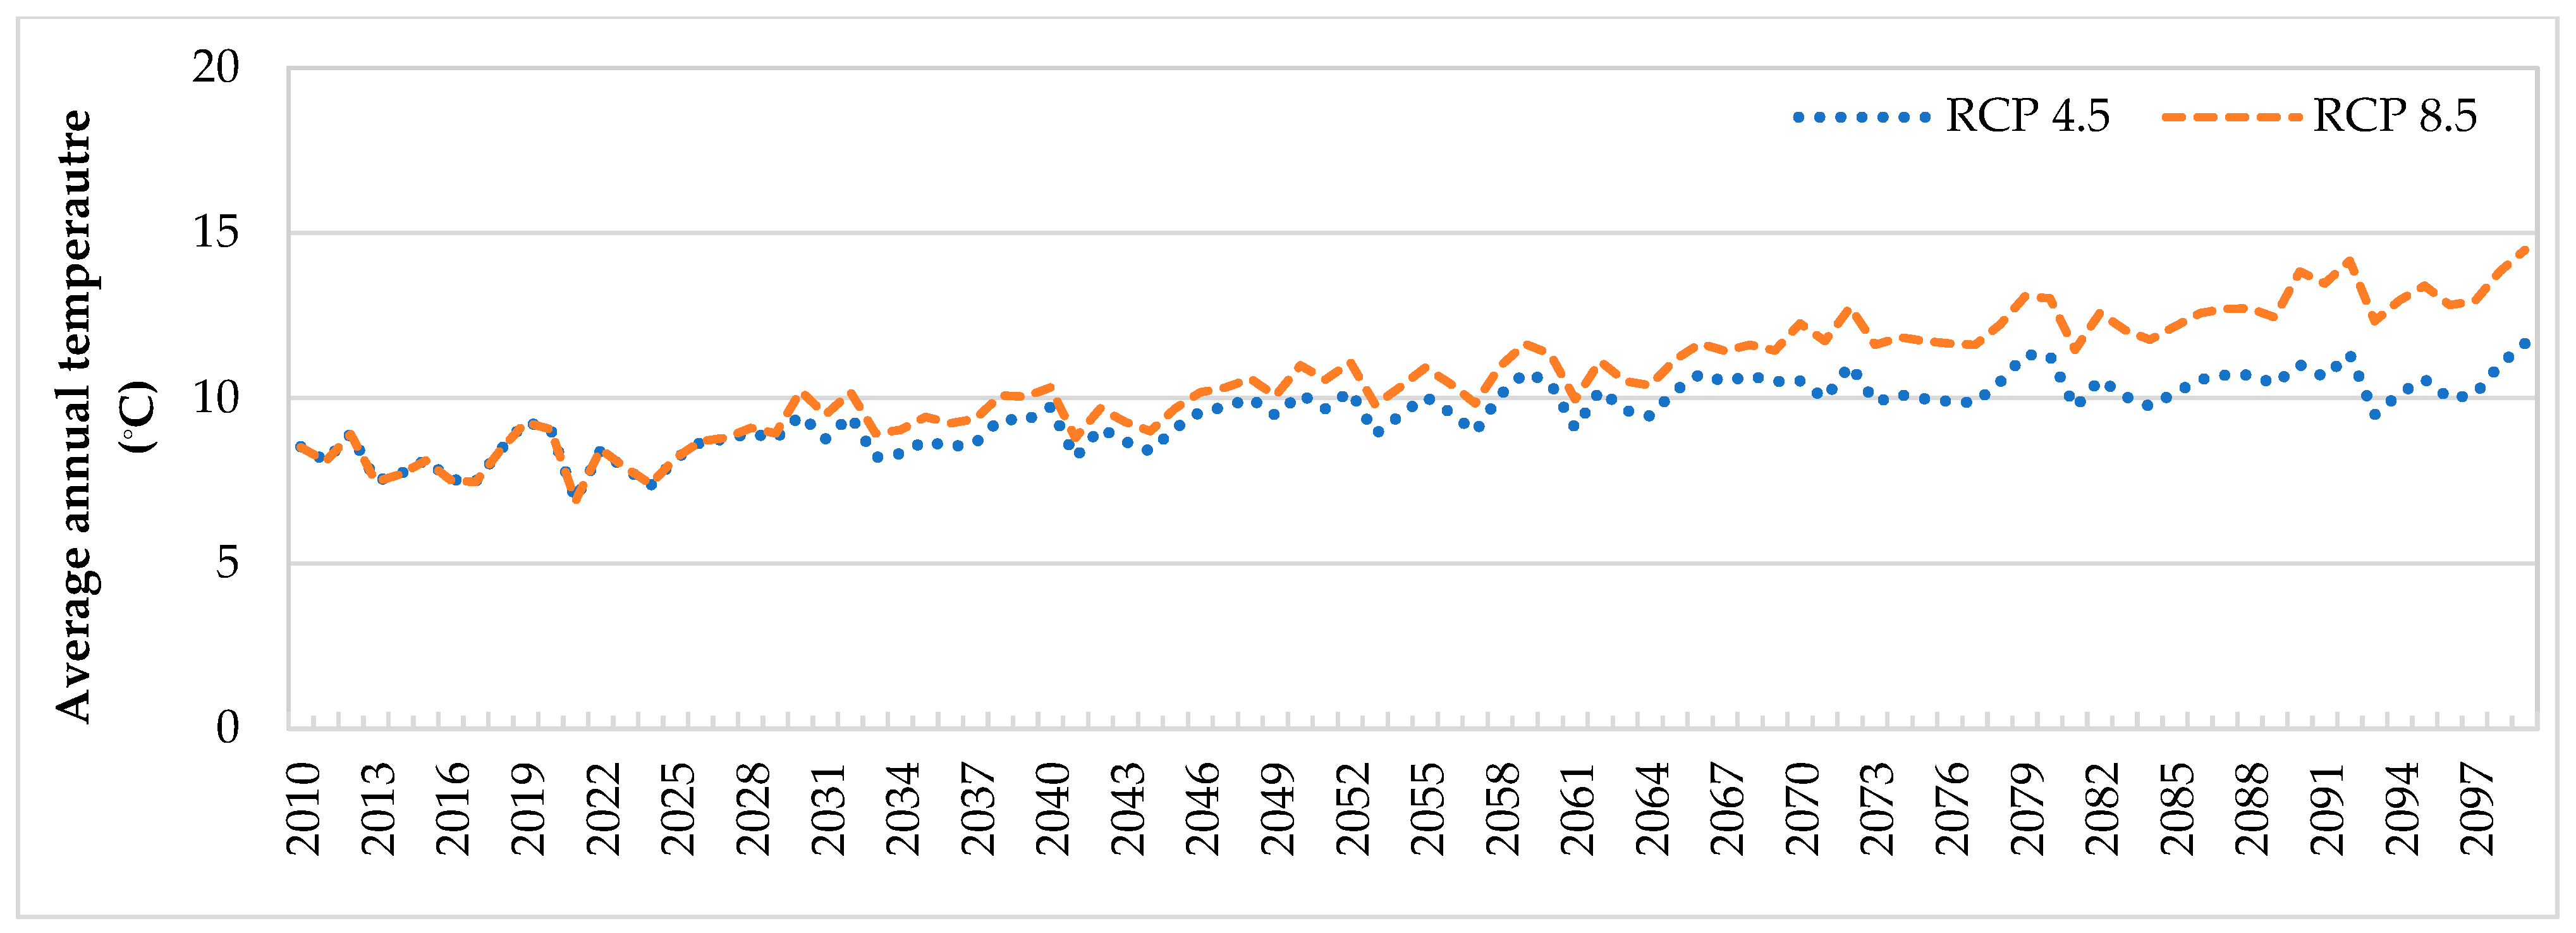
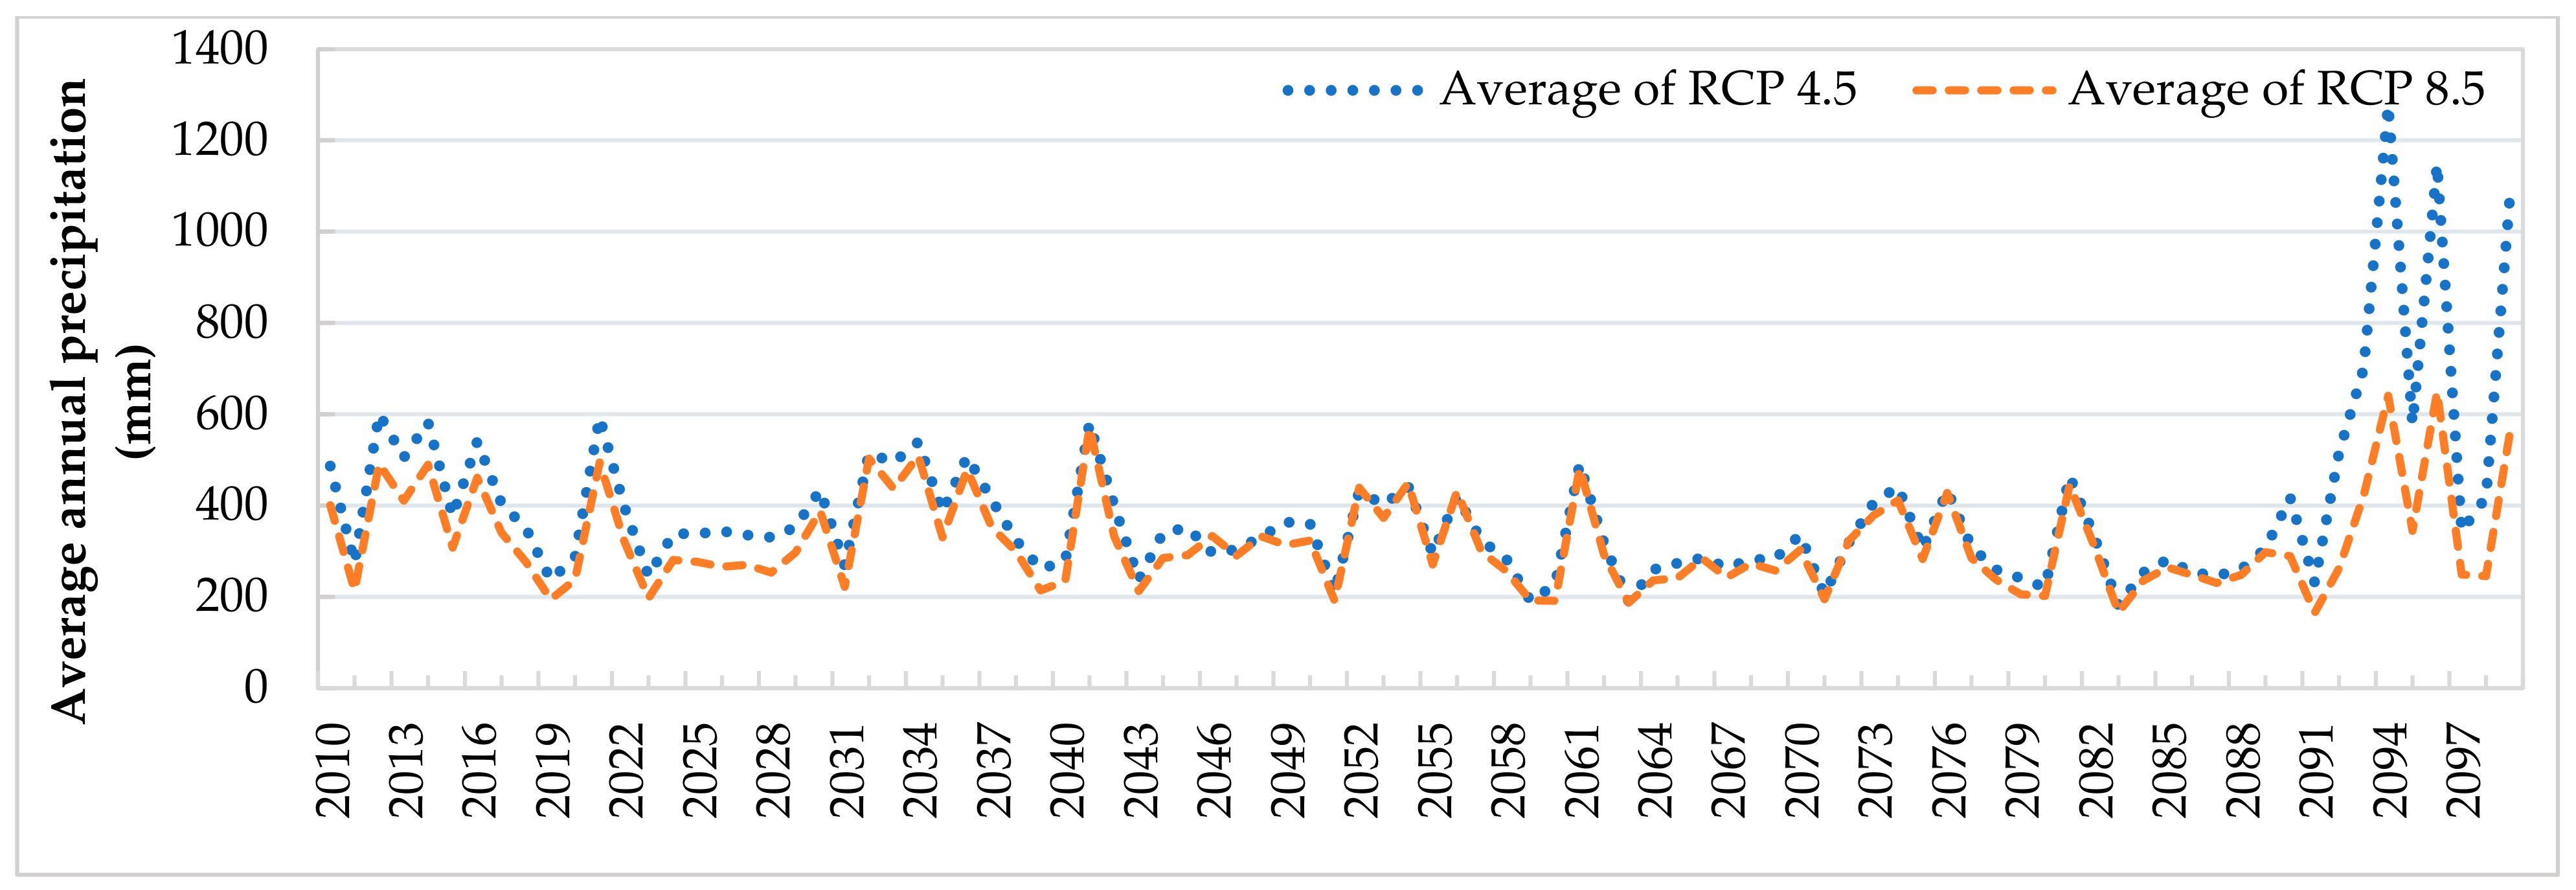
3.3. Projection of Climate Change Scenarios
3.4. Projection of Drought in the Future
3.4.1. Calculation and Analysis of SPI, RDI, DI, and NDI
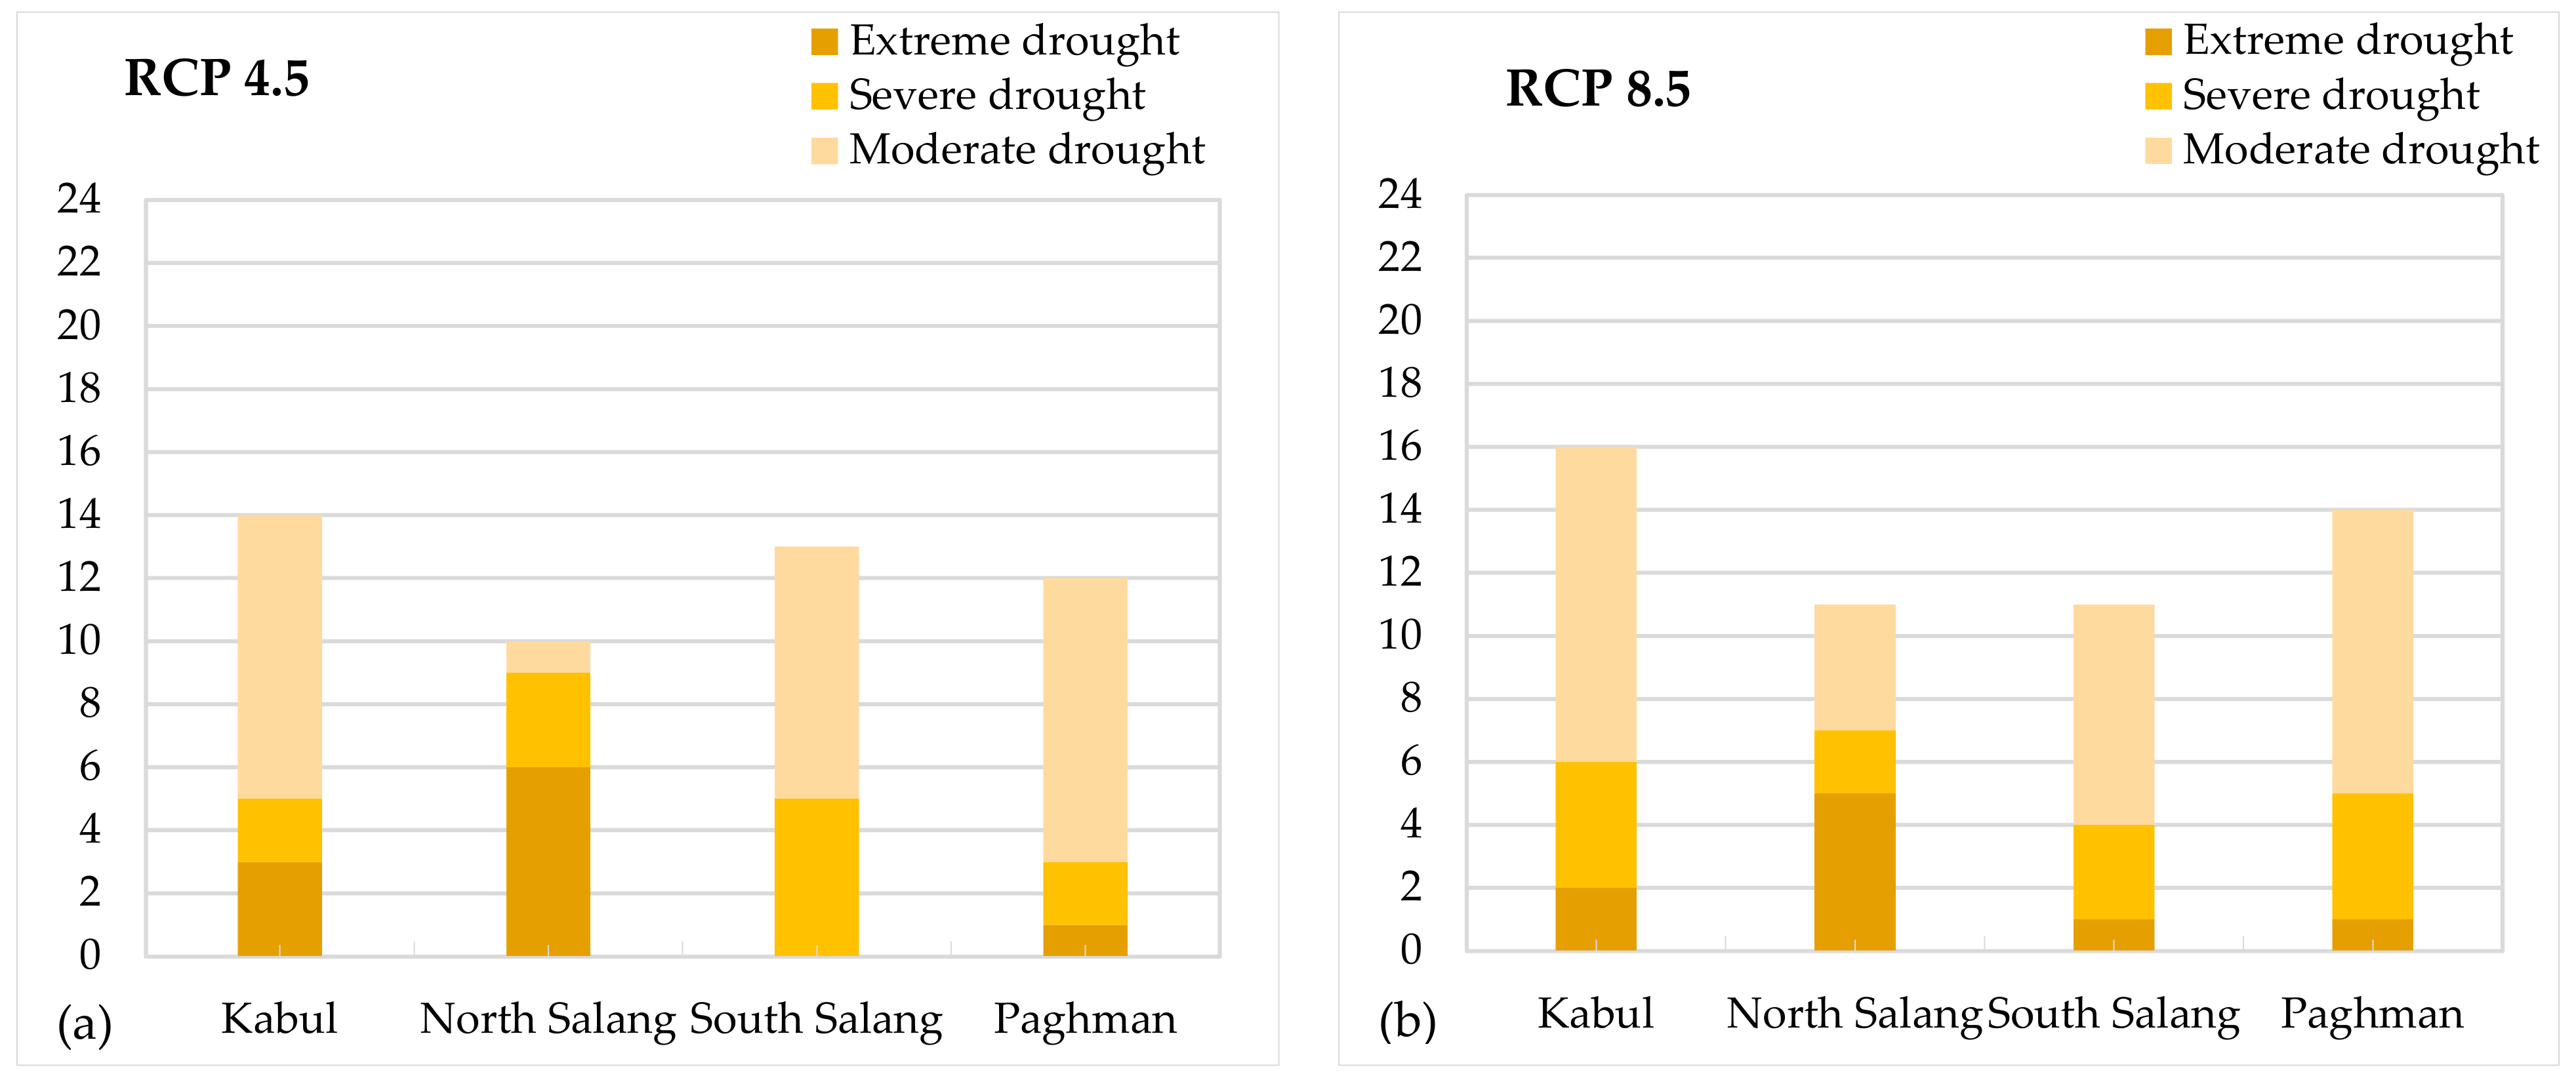
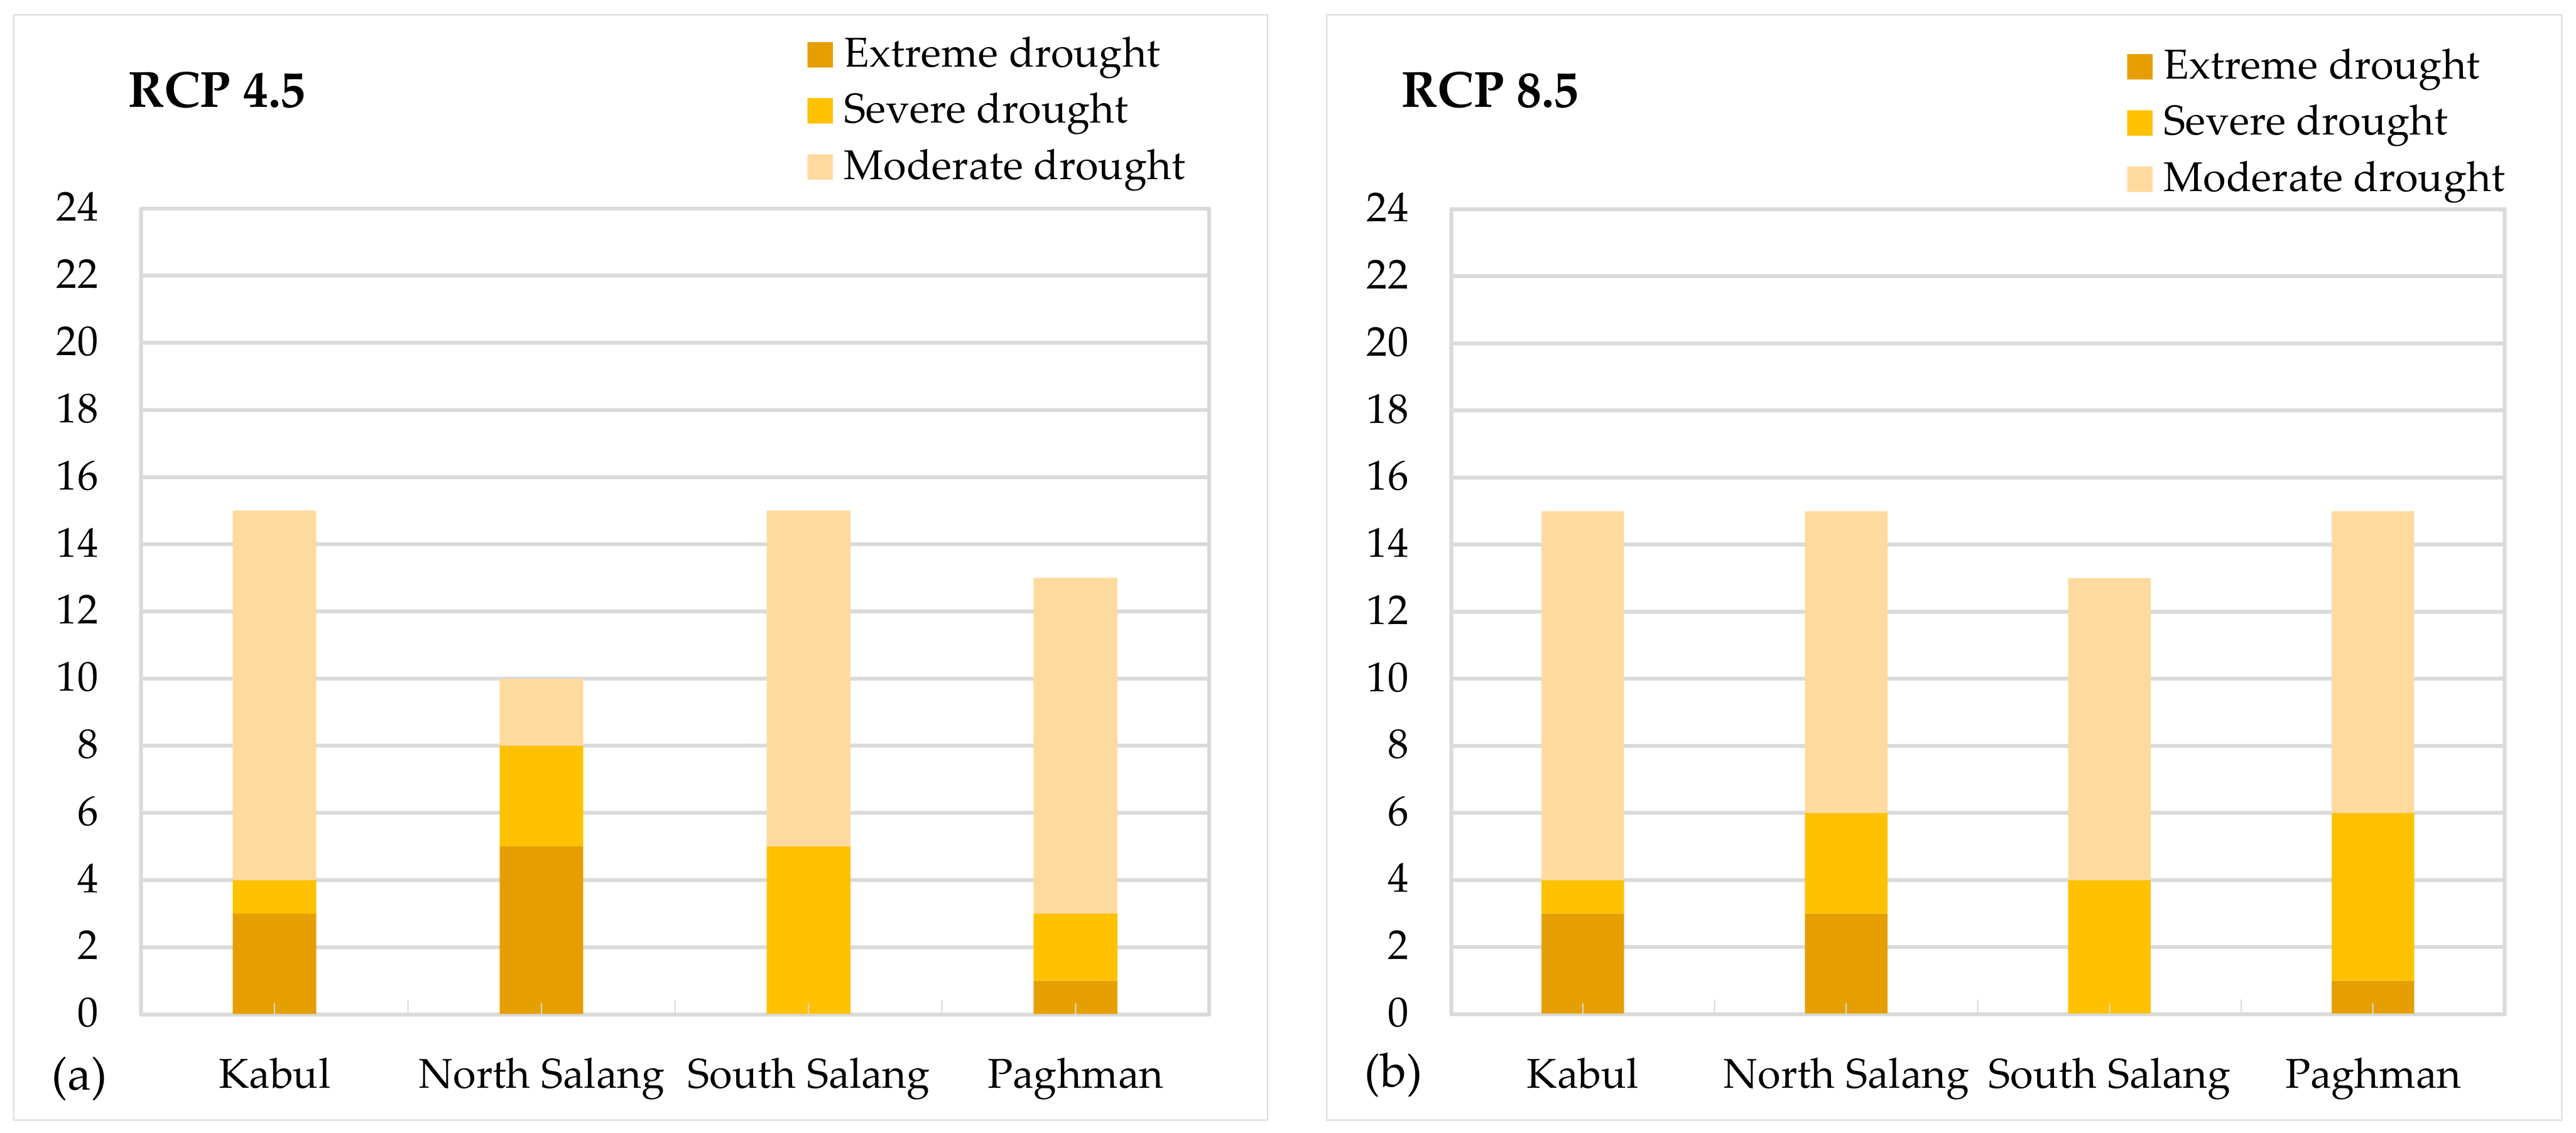
3.4.2. Occurrence of Drought at Each Station by SPI, RDI, and NDI
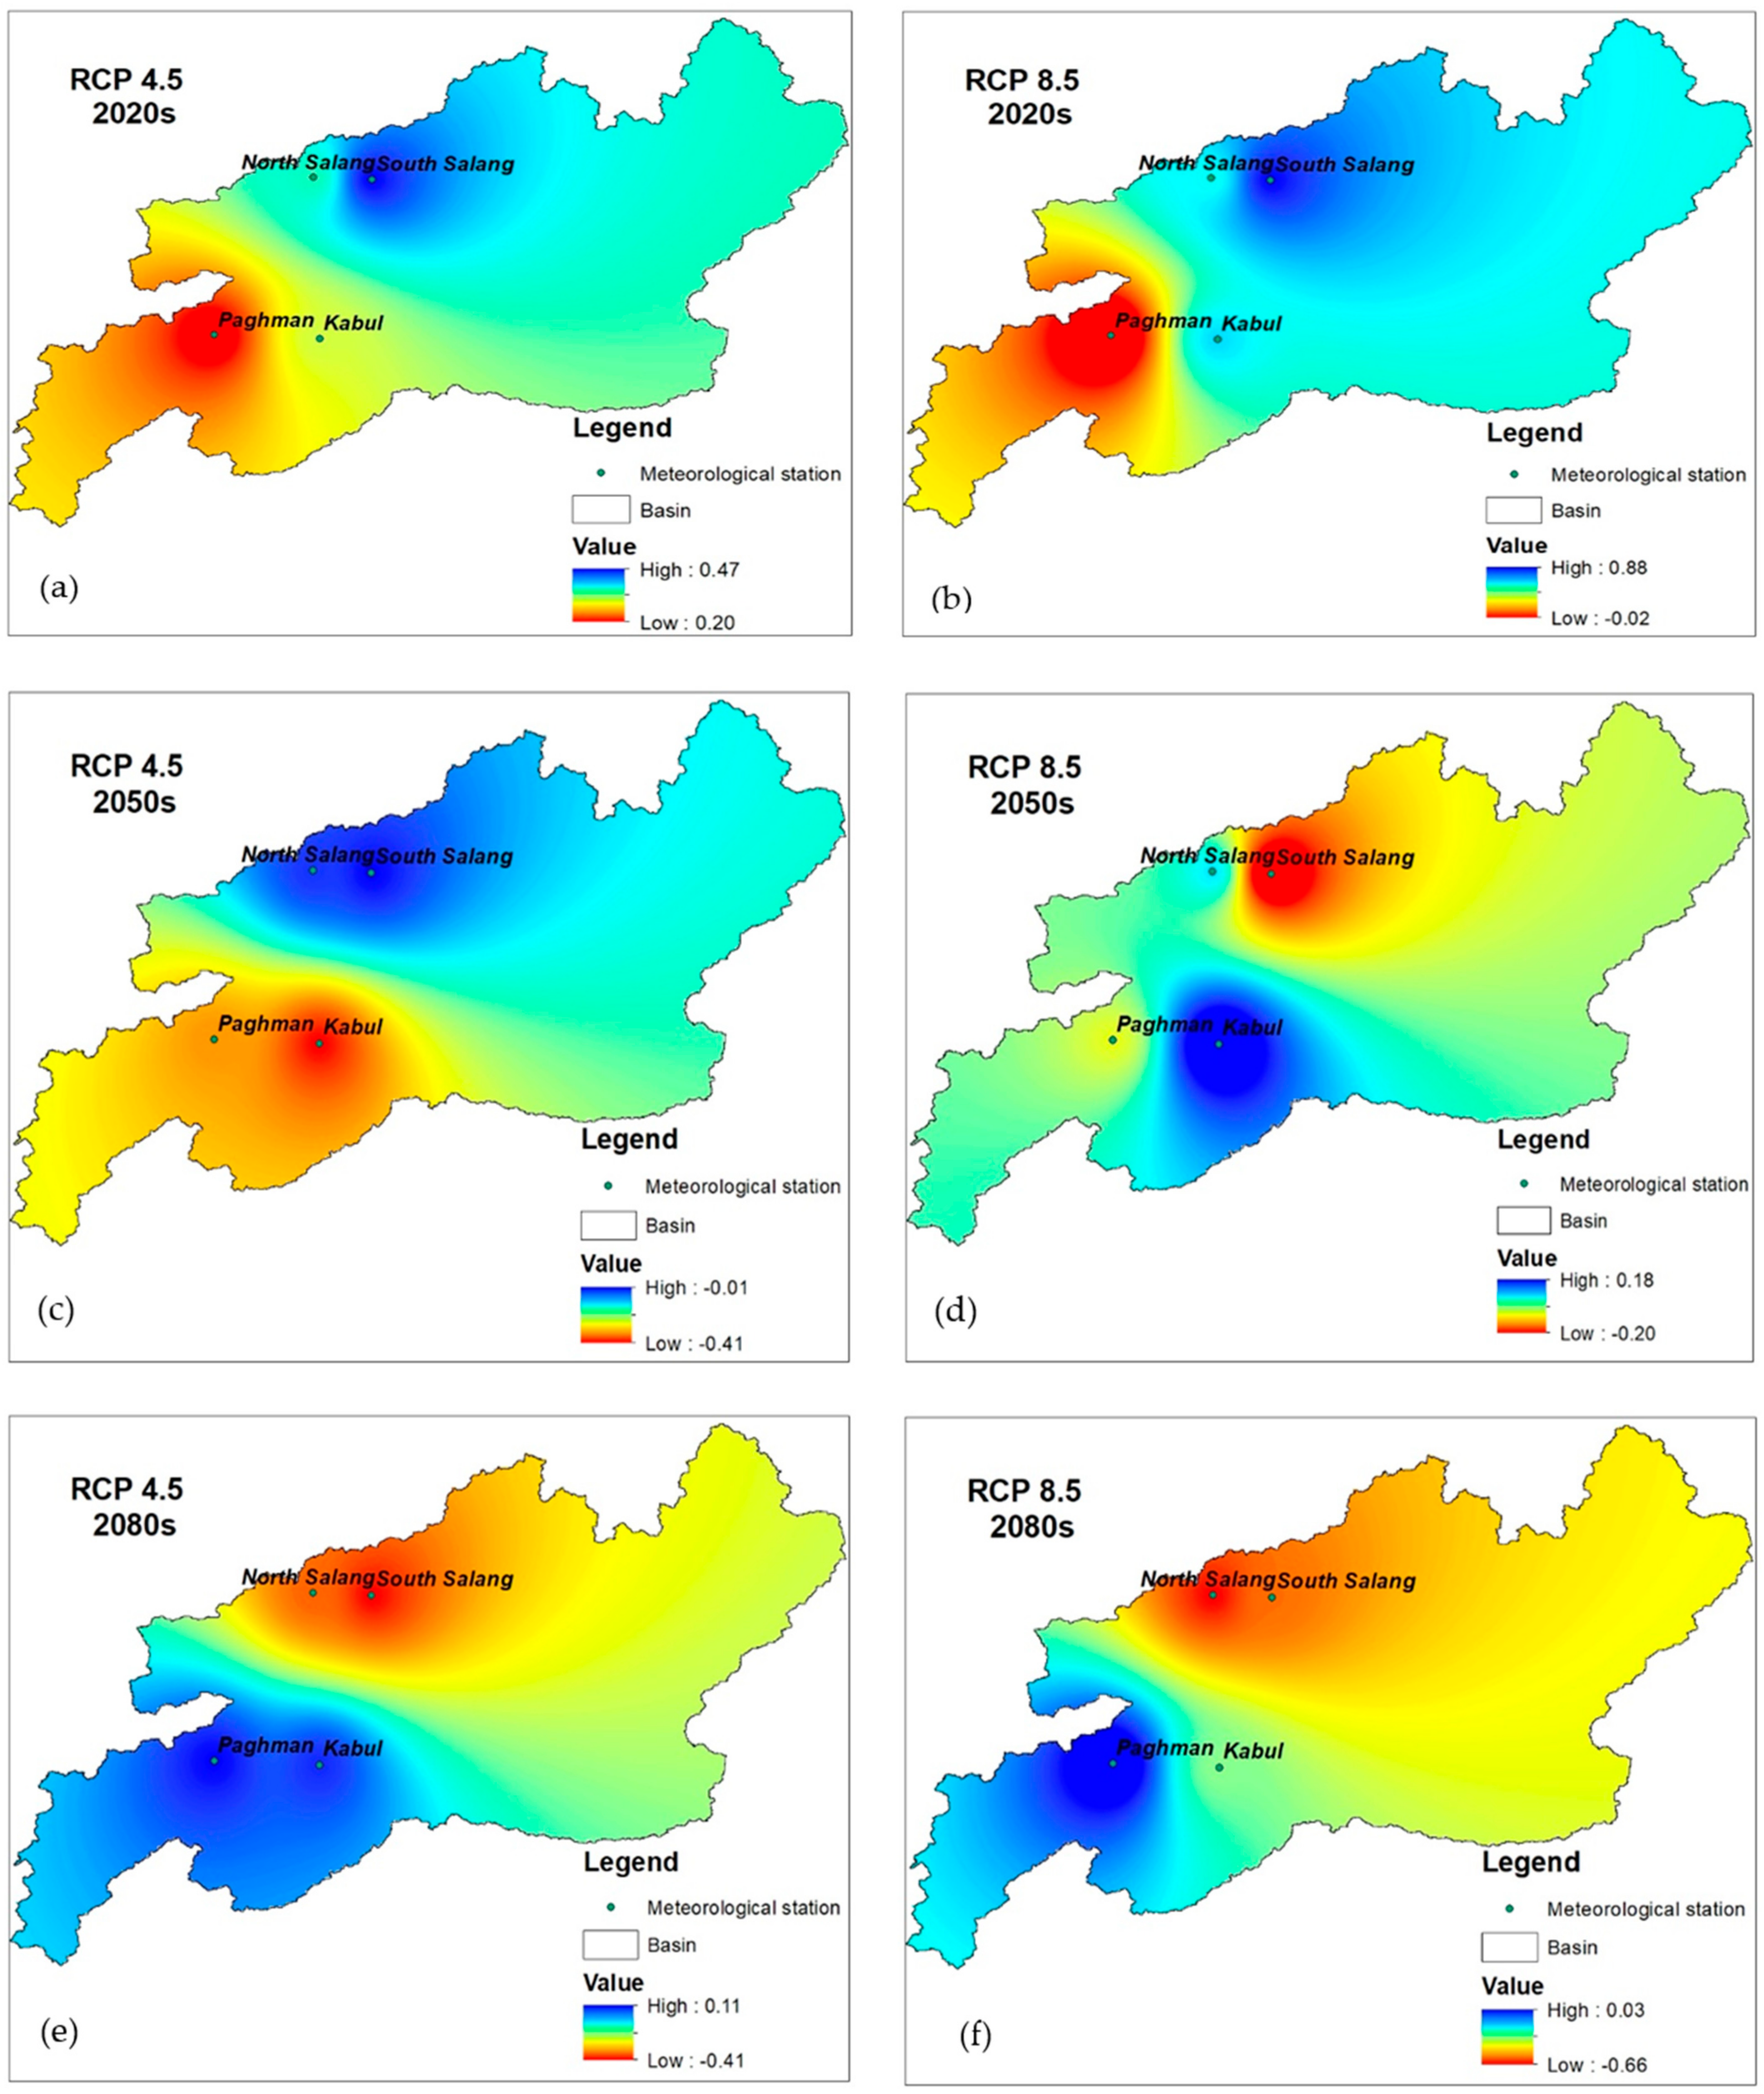
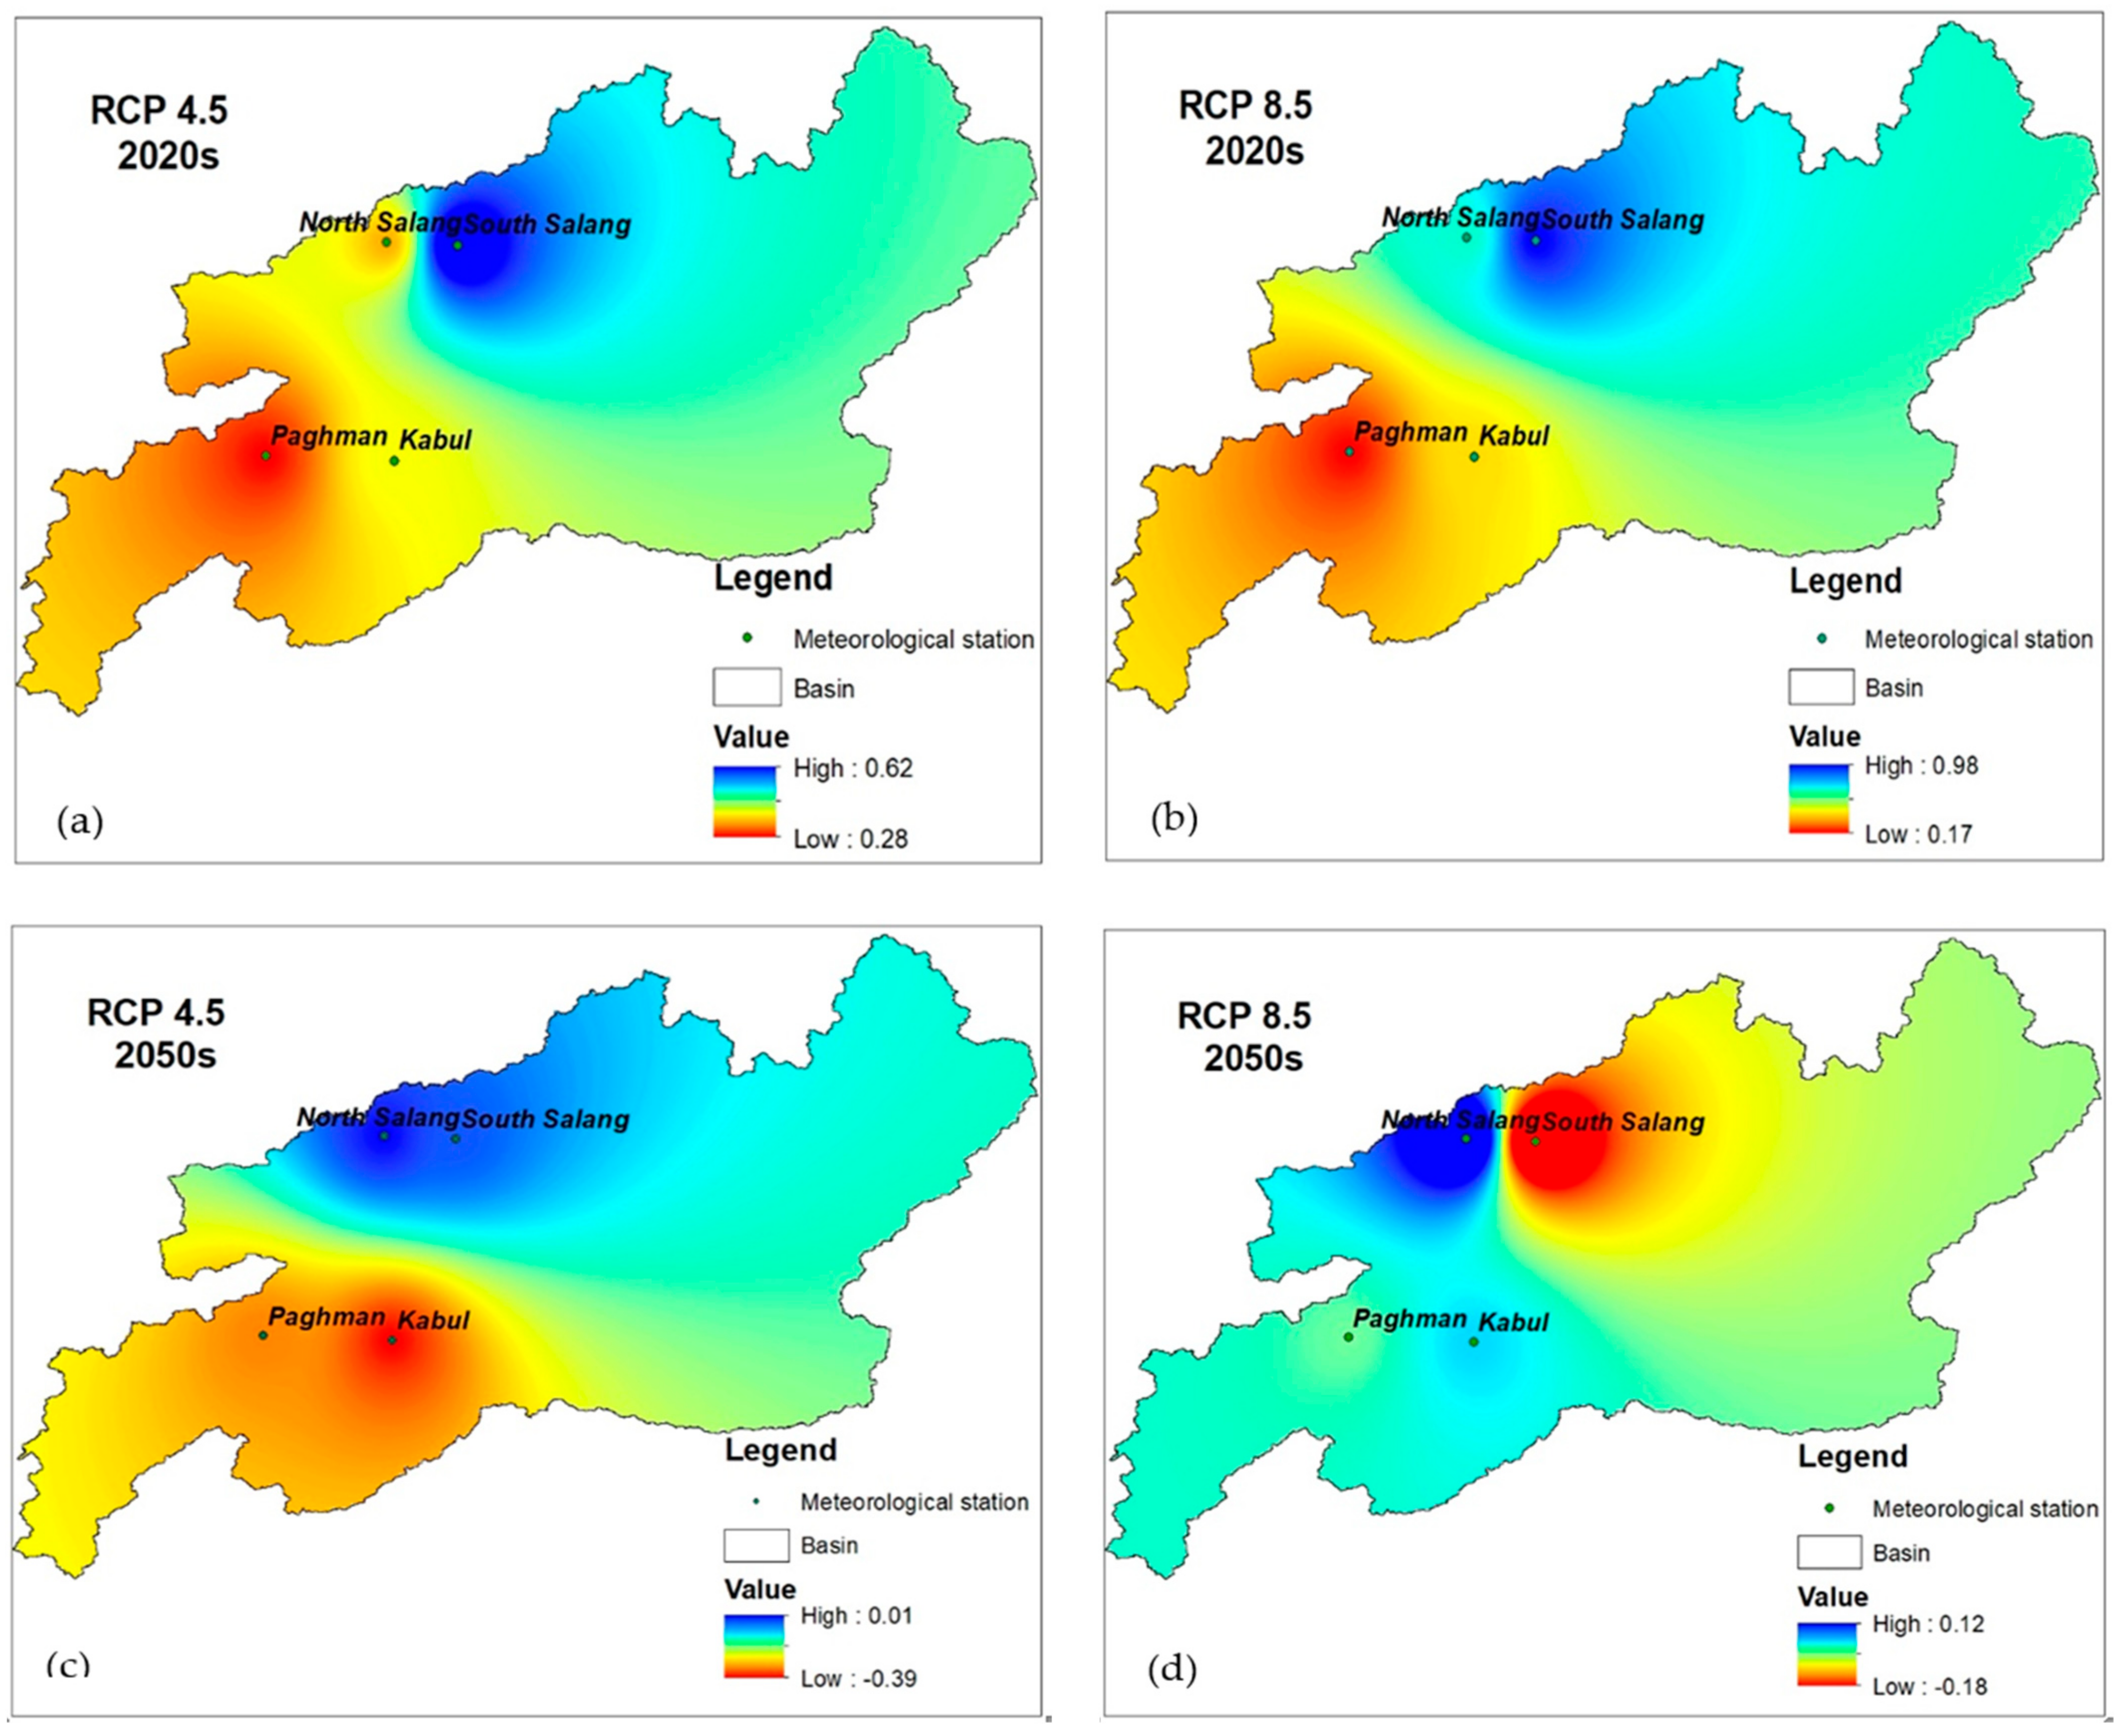
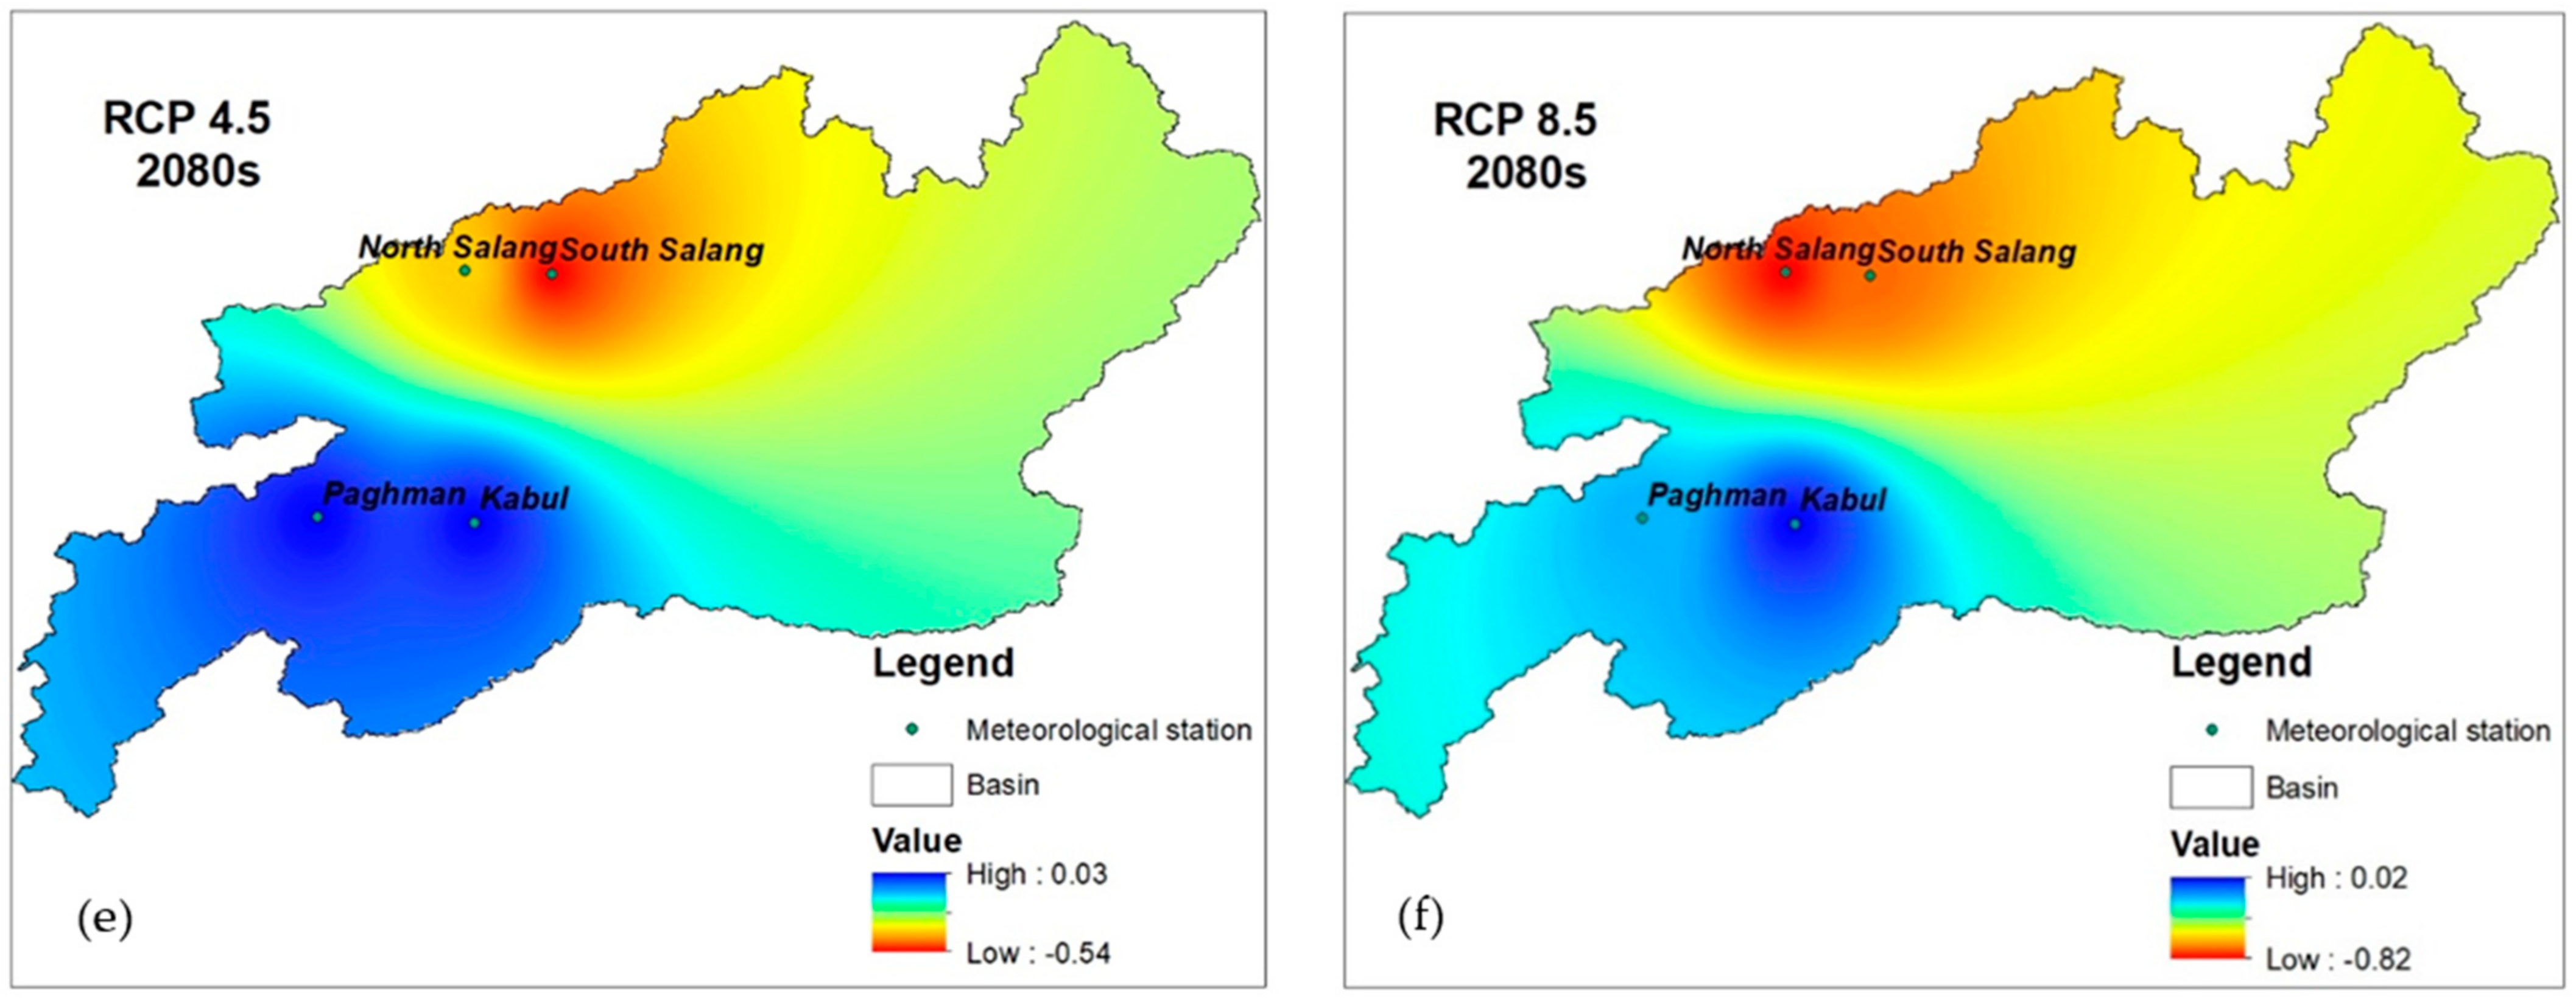
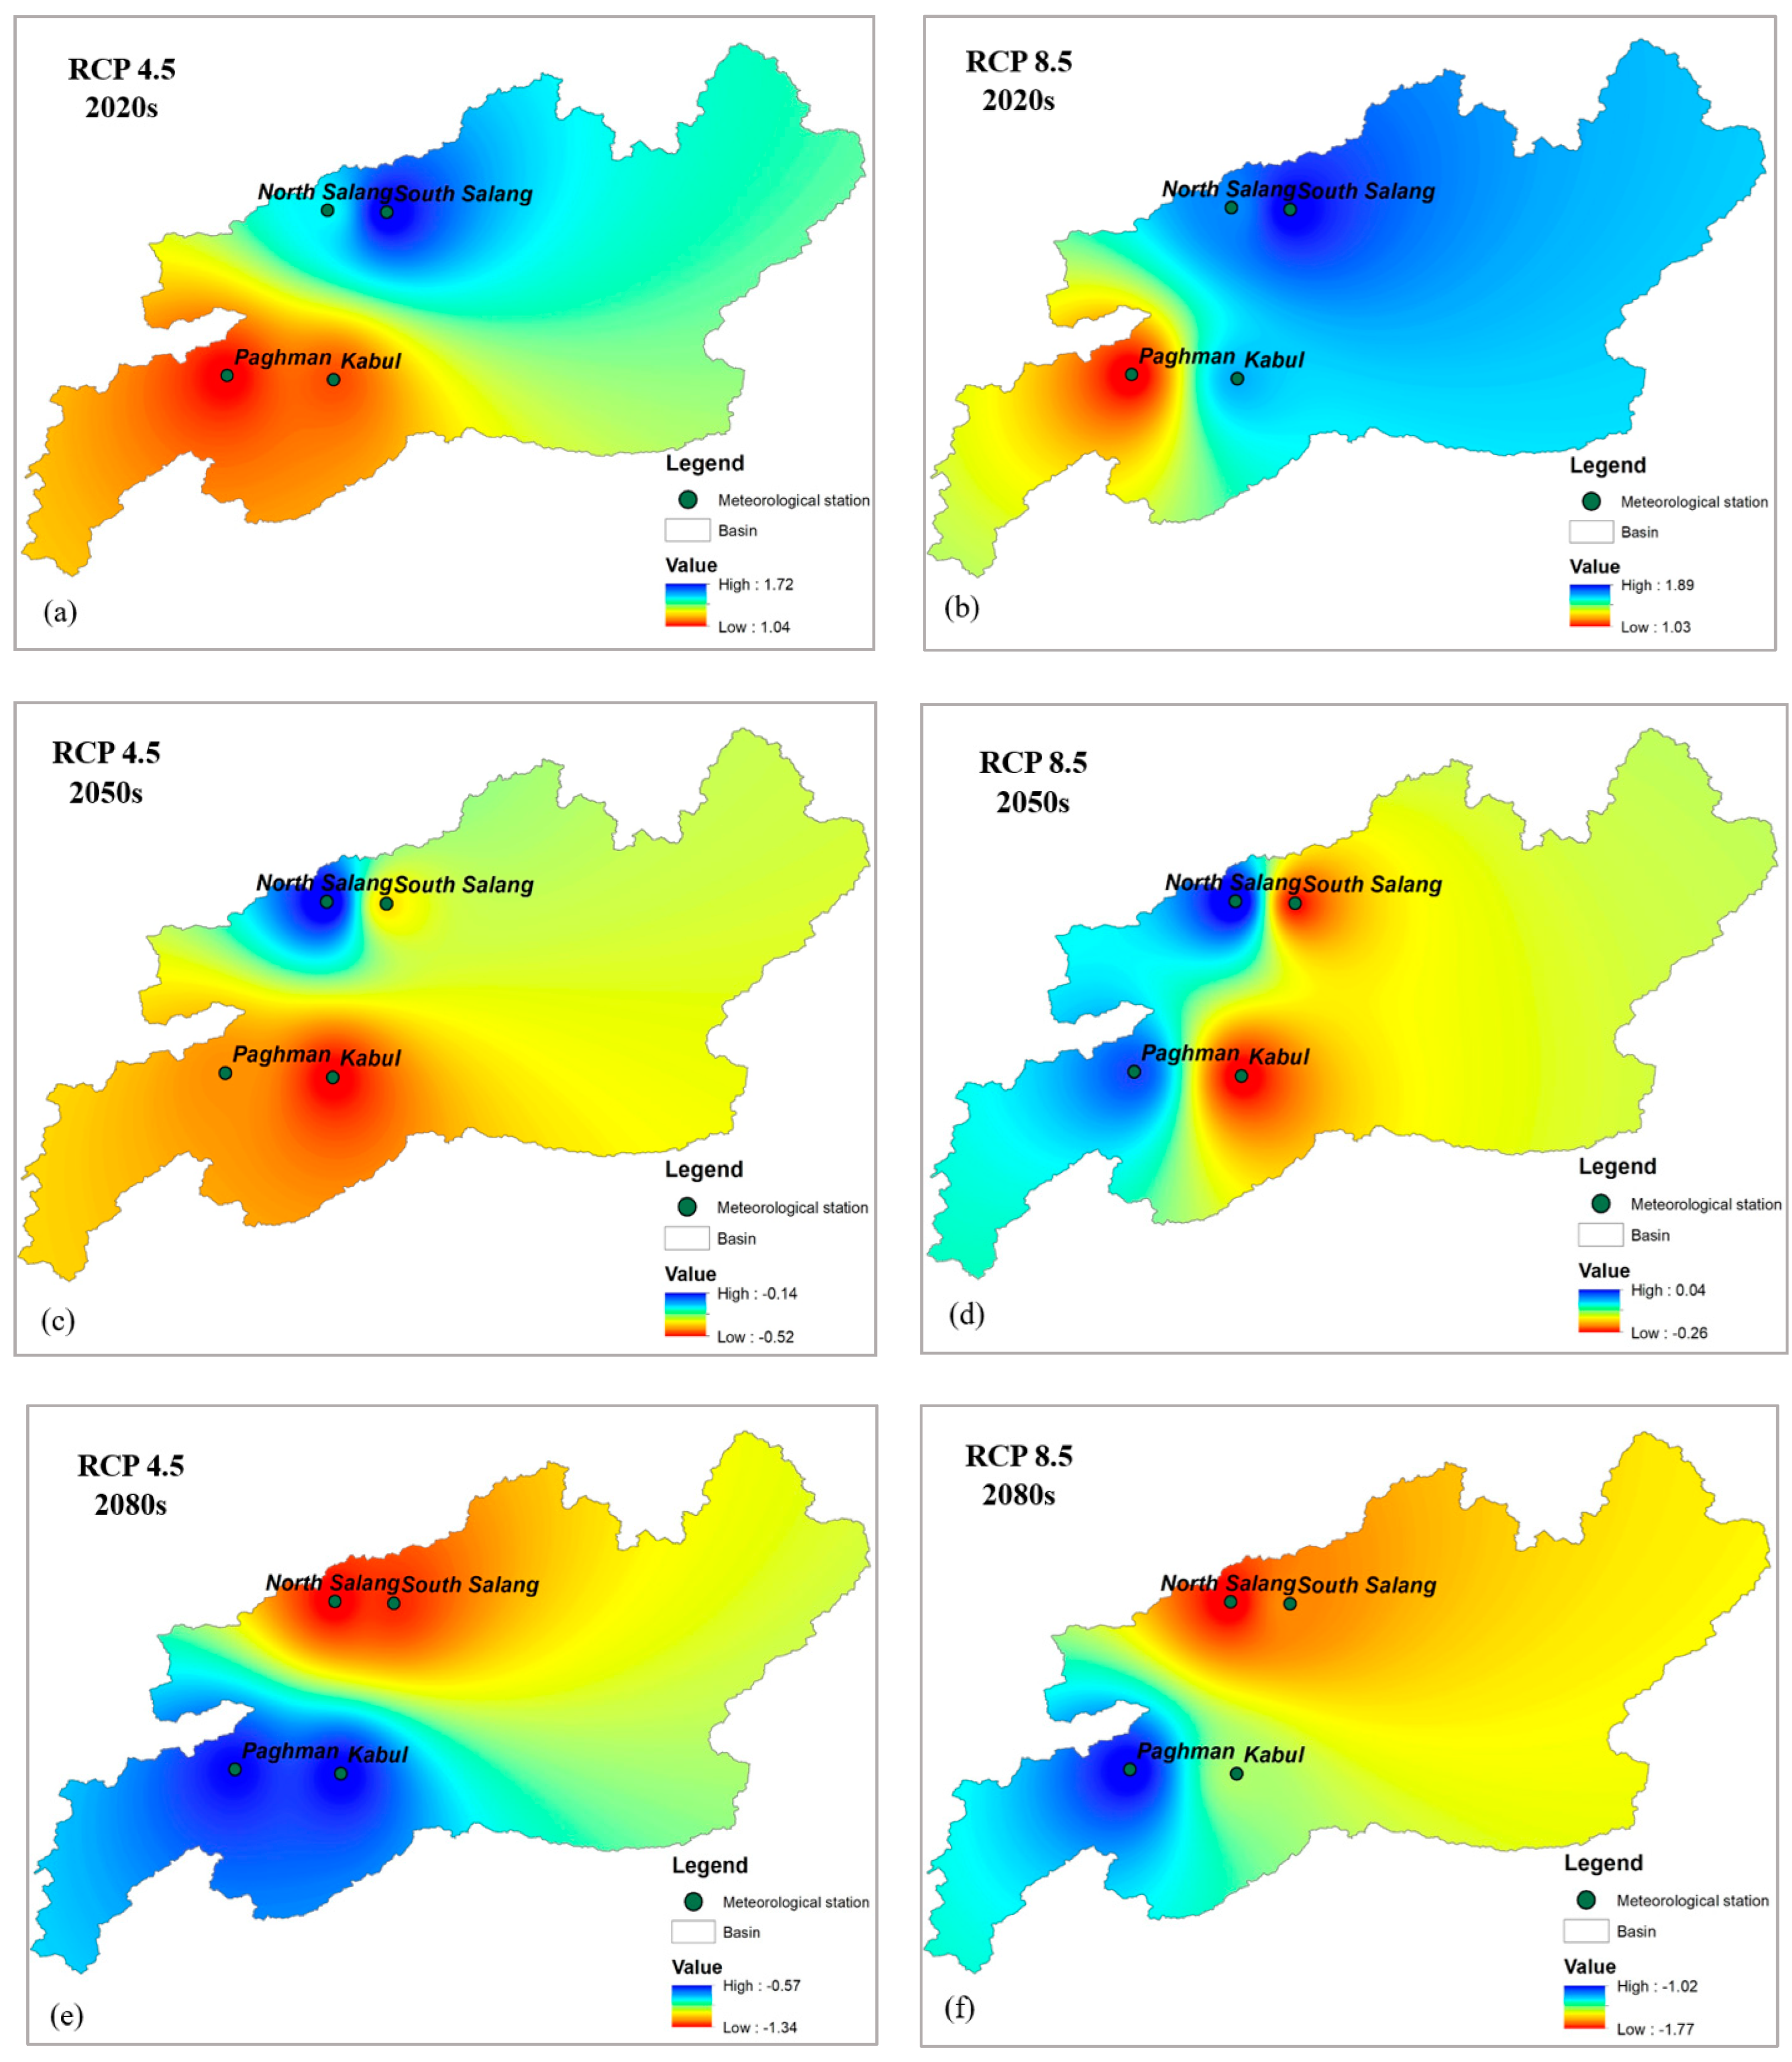
3.5. Distribution Map Droughts by SPI, RDI, and NDI under RCP 4.5 and RCP 8.5 Scenarios
4. Discussion
5. Conclusions
Author Contributions
Funding
Institutional Review Board Statement
Informed Consent Statement
Data Availability Statement
Acknowledgments
Conflicts of Interest
References
- Alami, M.M.; Hayat, E.; Tayfur, G. Proposing a popular method for meteorological drought monitoring in the Kabul River Basin, Afghanistan. Int. J. Adv. Eng. Res. Sci. 2017, 4, 237199. [Google Scholar] [CrossRef]
- Hafez, M.; Abo El-Ezz, S.F.; Popov, A.I.; Rashad, M. Organic amendments combined with plant growth-promoting rhizobacteria (Azospirillum brasilense) as an eco-friendly by-product to remediate and enhance the fertility of saline sodic-soils in Egypt. Commun. Soil Sci. Plant Anal. 2021, 52, 1416–1433. [Google Scholar] [CrossRef]
- Mohammad, A.H.; Jung, H.C.; Odeh, T.; Bhuiyan, C.; Hussein, H. Understanding the impact of droughts in the Yarmouk Basin, Jordan: Monitoring droughts through meteorological and hydrological drought indices. Arab. J. Geosci. 2018, 11, 103. [Google Scholar] [CrossRef]
- Yuan, Z.; Xu, J.; Chen, J.; Huo, J.; Yu, Y.; Locher, P.; Xu, B. Drought assessment and projection under climate change: A case study in the middle and lower Jinsha River Basin. Adv. Meteorol. 2017, 2017, 5757238. [Google Scholar] [CrossRef]
- Wang, J.; Kessner, A.L.; Aegerter, C.; Sharma, A.; Judd, L.; Wardlow, B.; You, J.; Shulski, M.; Irmak, S.; Kilic, A.; et al. A Multi-sensor View of the 2012 Central Plains Drought from Space. Front. Environ. Sci. 2016, 4, 45. [Google Scholar] [CrossRef]
- Rana, S.; Renwick, J.; McGregor, J.; Singh, A. Seasonal prediction of winter precipitation anomalies over Central Southwest Asia: A canonical correlation analysis approach. J. Clim. 2018, 31, 727–741. [Google Scholar] [CrossRef]
- Nakai, J. Food and Agriculture Organization of the United Nations and the sustainable development goals. Sustain. Dev. 2018, 22, 1–450. [Google Scholar]
- Ministry of Energy and Water of Afghanistan. Available online: https://mew.gov.af/en/information-reference-ministry-energy-and-water (accessed on 16 November 2020).
- Baig, M.H.A.; Abid, M.; Khan, M.R.; Jiao, W.; Amin, M.; Adnan, S. Assessing meteorological and agricultural drought in Chitral Kabul river basin using multiple drought indices. Remote Sens. 2020, 12, 1417. [Google Scholar] [CrossRef]
- Jang, Y.K.; Kim, S.D.; Choi, G.W. A Study of Drought Spatio-temporal Characteristics Using SPI-EOF Analysis. J. Korea Water Resour. Assoc. 2006, 39, 691–702. (In Korean) [Google Scholar]
- Vincente, S.M.; Begueria, S.; Lopez-Moreno, J.I. A Multiscalar Drought Index Sensitive to Global Warming: The Standardized Precipitation Evapotranspiration Index. J. Clim. 2010, 23, 1696–1718. [Google Scholar]
- Jang, D. Assessment of meteorological drought indices in Korea using RCP 8.5 scenario. Water 2018, 10, 283. [Google Scholar] [CrossRef]
- Waseem, M.; Ajmal, M.; Ahmad, I.; Khan, N.M.; Azam, M.; Sarwar, M.K. Projected drought pattern under climate change scenario using multivariate analysis. Arab. J. Geosci. 2021, 14, 544. [Google Scholar] [CrossRef]
- Shiru, M.S.; Shahid, S.; Dewan, A.; Chung, E.S.; Alias, N.; Ahmed, K.; Hassan, Q.K. Projection of meteorological droughts in Nigeria during growing seasons under climate change scenarios. Sci. Rep. 2020, 10, 10107. [Google Scholar] [CrossRef]
- Li, H.; Li, Z.; Chen, Y.; Liu, Y.; Hu, Y.; Sun, F.; Kayumba, P.M. Projected meteorological drought over Asian drylands under different CMIP6 Scenarios. Remote Sens. 2021, 13, 4409. [Google Scholar] [CrossRef]
- Bonacci, O.; Bonacci, D.; Roje-Bonacci, T.; Vrsalović, A. Proposal of a new method for drought analysis. J. Hydrol. Hydromech. 2023, 71, 100–110. [Google Scholar] [CrossRef]
- Abbas, S.; Kousar, S. Spatial analysis of drought severity and magnitude using the standardized precipitation index and streamflow drought index over the Upper Indus Basin, Pakistan. Environ. Dev. Sustain. 2021, 23, 15314–15340. [Google Scholar] [CrossRef]
- Kokaly, R.F.; King, T.V.; Hoefen, T.M. Surface Mineral Maps of Afghanistan Derived from HyMap Imaging Spectrometer Data, Version 2; US Department of the Interior, US Geological Survey: Denver, CO, USA, 2013.
- Sidiqi, M.; Shrestha, S.; Ninsawat, S. Projection of climate change scenarios in the Kabul River Basin, Afghanistan. Curr. Sci. 2018, 114, 1304–1310. [Google Scholar] [CrossRef]
- Bannayan, M.; Tojo Soler, C.M.; Garcia, Y.; Garcia, A.; Guerra, L.C.; Hoogenboom, G. Interactive effects of elevated [CO 2] and temperature on growth and development of a short-and long-season peanut cultivar. Clim. Change 2009, 93, 389–406. [Google Scholar] [CrossRef]
- Earth System Grid Federation. Available online: https://esgf-data.dkrz.de/projects/esgf-dkrz/ (accessed on 15 May 2022).
- Gent, P.R.; Danabasoglu, G.; Donner, L.J. The community climate system model version 4. J. Clim. 2011, 24, 4973–4991. [Google Scholar] [CrossRef]
- IPCC. Climate Change 2007: The Physical Science Basis. Contribution of Working Group l to the Forth Assessment Report of the Intergovernmental Panel on Climate Change; Cambridge University Press: Cambridge, UK, 2007. [Google Scholar]
- Drought Indices Calculator. Available online: https://drought-software.com/download/ (accessed on 20 June 2022).
- Sharma, R.C.; Duveiller, E.; Ortiz-Ferrara, G. Progress and challenge towards reducing wheat spot blotch threat in the Eastern Gangetic Plains of South Asia: Is climate change already taking its toll? Field Crops Res. 2007, 103, 109–118. [Google Scholar] [CrossRef]
- Enayati, M.; Bozorg-Haddad, O.; Bazrafshan, J.; Hejabi, S.; Chu, X. Bias correction capabilities of quantile mapping methods for rainfall and temperature variables. J. Water Clim. Change 2021, 12, 401–419. [Google Scholar] [CrossRef]
- Holthuijzen, M.; Beckage, B.; Clemins, P.J.; Higdon, D.; Winter, J.M. Robust bias-correction of precipitation extremes using a novel hybrid empirical quantile-mapping method. Theor. Appl. Clim. 2022, 149, 863–882. [Google Scholar] [CrossRef]
- Vélez-Nicolás, M.; García-López, S.; Ruiz-Ortiz, V.; Zazo, S.; Molina, J.L. Precipitation Variability and Drought Assessment Using the SPI: Application to Long-Term Series in the Strait of Gibraltar Area. Water 2022, 14, 884. [Google Scholar] [CrossRef]
- Buttafuoco, G.; Caloiero, T.; Guagliardi, I.; Ricca, N. Drought assessment using the reconnaissance drought index (RDI) in a southern Italy region. In Proceedings of the 6th IMEKO TC19 Symposium on Environmental Instrumentation and Measurements, Reggio Calabria, Italy, 24–25 June 2016. [Google Scholar]
- Tsakiris, G.; Pangalou, D.; Vangelis, H. Regional drought assessment based on the Reconnaissance Drought Index (RDI). Water Resour. Manag. 2007, 21, 821–833. [Google Scholar] [CrossRef]
- Faiz, M.A.; Zhang, Y.; Tian, X.; Tian, J.; Zhang, X.; Ma, N.; Aryal, S. Drought index revisited to assess its response to vegetation in different agro-climatic zones. J. Hydrol. 2022, 614, 128543. [Google Scholar] [CrossRef]
- Kininmonth, I. Identifying Areas of Agricultural Significance; Report 15/2000; Department of Primary Industries and Regional Development: Perth, Australia, 2000.
- Tigkas, D.; Vangelis, H.; Tsakiris, G. DrinC: A software for drought analysis based on drought indices. Earth Sci. Inform. 2015, 8, 697–709. [Google Scholar] [CrossRef]
- Greve, P.; Roderick, M.L.; Ukkola, A.M.; Wada, Y. The aridity index under global warming. Environ. Res. Lett. 2019, 14, 124006. [Google Scholar] [CrossRef]
- Hargreaves, G.H.; Allen, R.G. History and evaluation of Hargreaves evapotranspiration equation. J. Irrig. Drain. Eng. 2003, 129, 53–63. [Google Scholar] [CrossRef]
- Zarch, M.A.A.; Sivakumar, B.; Sharma, A. Droughts in a warming climate: A global assessment of Standardized precipitation index (SPI) and Reconnaissance drought index (RDI). J. Hydrol. 2015, 526, 183–195. [Google Scholar] [CrossRef]
- Antal, A.; Guerreiro, P.M.; Cheval, S. Comparison of spatial interpolation methods for estimating the precipitation distribution in Portugal. Theor. Appl. Climatol. 2021, 145, 1193–1206. [Google Scholar] [CrossRef]
- Ali, M.G.; Younes, K.; Esmaeil, A.; Fatemeh, T. Assessment of geostatistical methods for spatial analysis of SPI and EDI drought indices. World Appl. Sci. J. 2011, 15, 474–482. [Google Scholar]
- Fang, G.H.; Yang, J.; Chen, Y.N.; Zammit, C. Comparing bias correction methods in downscaling meteorological variables for a hydrologic impact study in an arid area in China. Hydrol. Earth Syst. Sci. 2015, 19, 2547–2559. [Google Scholar] [CrossRef]
- Bruinsma, J. World Agriculture: Towards 2015/2030: An FAO Perspective, 1st ed.; Routledge: London, UK, 2017; p. 444. [Google Scholar]


| Model | Resolution (Long by Lat) | Scenarios | Research Institute | References |
|---|---|---|---|---|
| CCSM4 | 1.25° × 0.9° | RCP 2.6 | National Center for Atmospheric Research, USA | [22] |
| RCP 4.5 | ||||
| RCP 6.0 | ||||
| RCP 8.5 | ||||
| BCC-CSM1.1 | 2.8° × 2.8° | RCP 2.6 | Beijing Climate Center, China Meteorological Administration | [23] |
| RCP 4.5 | ||||
| RCP 6.0 | ||||
| RCP 8.5 | ||||
| MIROC5 | 0.40° × 0.40° | RCP 2.6 | Atmosphere and Ocean Research Institute, Japan | [23] |
| RCP 4.5 | ||||
| RCP 6.0 | ||||
| RCP 8.5 |
| SPI and RDI Values | Drought Category |
|---|---|
| ≥2.00 | Extremely wet |
| 1.5 to1.99 | Very wet |
| 1.00 to1.49 | Moderately wet |
| −0.99 to 0.99 | Near normal |
| −1.0 to −1.49 | Moderately dry |
| −1.5 to −1.99 | Severely dry |
| −2 and less | Extremely dry |
| Deciles Values | Drought Category |
|---|---|
| Deciles 1–2: lowest 20% | Much below normal |
| Deciles 3–4: next lowest 20% | Below normal |
| Deciles 5–6: middle 20% | Near normal |
| Deciles 7–8: next highest 20% | Above normal |
| Deciles 9–10: highest 20% | Much above normal |
| Aridity Index | Climate |
|---|---|
| Values | Classification |
| AI < 0.05 | Hyper-arid |
| 0.05 < AI < 0.2 | Arid |
| 0.2 < AI < 0.5 | Semi-arid |
| 0.5 < AI < 0.65 | Dry sub-humid |
| 0.65 < AI > 0.75 | humid |
| AI > 0.75 | Hyper-humid |
| Cold | PET < 400 mm |
| Station Name | Much below Normal | below Normal | near Normal | above Normal | Much above Normal |
|---|---|---|---|---|---|
| Kabul | 174.10–207.00 | 229.20–268.10 | 297.80–315.90 | 340.40–255.60 | 416.40–436.60 |
| North Salang | 527.40–760.10 | 861.00–947.20 | 997.70–1065.4 | 1128.6–1237.7 | 1253.5–1418.1 |
| South Salang | 783.30–855.30 | 894.70–909.10 | 972.40–1065.0 | 1113.9–1221.9 | 1271.0–1403.3 |
| Paghman | 292.70–310.90 | 340.60–393.50 | 415.80–473.40 | 509.00–522.20 | 583.10–621.10 |
| N | Station Name | Extreme | Severe | Moderate | ||||||
|---|---|---|---|---|---|---|---|---|---|---|
| SPI | RDI | NDI | SPI | RDI | NDI | SPI | RDI | NDI | ||
| 1 | Kabul | 1 | - | - | 1 | 1 | 2 | 2 | 2 | 3 |
| 2 | North Salang | 1 | - | 1 | 1 | 1 | 2 | 1 | 1 | 1 |
| 3 | South Salang | 1 | - | - | - | 1 | 2 | 1 | 1 | 3 |
| 4 | Paghman | - | - | 1 | 1 | 1 | 1 | 4 | 4 | 1 |
| Station | Meteorological Data | Before Bias Correction | After Bias Correction | ||
|---|---|---|---|---|---|
| Delta Change | Empirical Quantile Mapping | Quantile Mapping | |||
| North Salang | Precipitation | R2 = 0.07 | R2 = 0.966 | R2 = 0.959 | R2 = 0.963 |
| RMSE = 9.36 mm | RMSE = 6.24 mm | RMSE = 6.948 mm | RMSE = 6.811 mm | ||
| Maximum temperature | R2 = 0.58 | R2 = 0.974 | R2 = 0.976 | R2 = 0.981 | |
| RMSE = 12.3 °C | RMSE = 0.281 °C | RMSE = 0.269 °C | RMSE = 0.239 °C | ||
| Minimum temperature | R2 = 0.58 | R2 = 0.978 | R2 = 0.985 | R2 = 0.98 | |
| RMSE = 8.07 °C | RMSE = 0.26 °C | RMSE = 0.218 °C | RMSE = 0.248 °C | ||
| South Salang | Precipitation | R2 = 0.076 | R2 = 0.98 | R2 = 0.971 | R2 = 0.972 |
| RMSE = 11.03 mm | RMSE = 4.951 mm | RMSE = 5.914 mm | RMSE = 5.812 mm | ||
| Maximum temperature | R2 = 0.66 | R2 = 0.993 | R2 = 0.992 | R2 = 0.995 | |
| RMSE = 9.84 °C | RMSE = 0.22 °C | RMSE = 0.224 °C | RMSE = 0.188 °C | ||
| Minimum temperature | R2 = 0.64 | R2 = 0.484 | R2 = 0.654 | R2 = 0.489 | |
| RMSE = 5.99 °C | RMSE = 0.255 °C | RMSE = 0.201 °C | RMSE = 0.228 °C | ||
| Kabul | Precipitation | R2 = 0.01 | R2 = 0.962 | R2 = 0.955 | R2 = 0.957 |
| RMSE = 4.64 mm | RMSE = 1.979 mm | RMSE = 2.435 mm | RMSE = 2.318 mm | ||
| Maximum temperature | R2 = 0.69 | R2 = 0.998 | R2 = 0.998 | R2 = 0.998 | |
| RMSE = 6.54 °C | RMSE = 0.354 °C | RMSE = 0.371 °C | RMSE = 0.334 °C | ||
| Minimum temperature | R2 = 0.81 | R2 = 0.953 | R2 = 0.955 | R2 = 0.962 | |
| RMSE = 3.7 °C | RMSE = 0.347 °C | RMSE = 0.333 °C | RMSE = 0.311 °C | ||
| Paghman | Precipitation | R2 = 0.11 | R2 = 0.962 | R2 = 0.956 | R2 = 0.958 |
| RMSE = 6.9 mm | RMSE = 2.892 mm | RMSE = 3.24 mm | RMSE = 3.114 mm | ||
| Maximum temperature | R2 = 0.65 | R2 = 0.998 | R2 = 0.998 | R2 = 0.998 | |
| RMSE = 7.54 °C | RMSE = 0.301 °C | RMSE = 0.306 °C | RMSE = 0.264 °C | ||
| Minimum temperature | R2 = 0.69 | R2 = 0.895 | R2 = 0.907 | R2 = 0.918 | |
| RMSE = 5.61 °C | RMSE = 0.375 °C | RMSE = 0.34 °C | RMSE = 0.327 °C | ||
| Datasets | Meteorological Data | Comparison of ERA5 Precipitation | |||
|---|---|---|---|---|---|
| Delta Change | Empirical Quantile Mapping | Quantile Mapping | |||
| ERA5-Land | Precipitation | R2 RMSE | 0.962 0.143 | 0.964 0.141 | 0.967 0.137 |
| WorldClim | Maximum temperature | R2 RMSE | 0.895 0.347 | 0.896 0.301 | 0.896 0.292 |
| WorldClim | Minimum temperature | R2 RMSE | 0.866 0.233 | 0.869 0.232 | 0.866 0.230 |
| N | Station Name | Latitude (D) | Longitude (D) | Altitude (masl) | Aridity Index (UNEP) | Climate | Average Annual PET (mm) | ||
|---|---|---|---|---|---|---|---|---|---|
| RCP 4.5 | RCP 8.5 | RCP 4.5 | RCP 8.5 | ||||||
| 1 | Kabul | 34°.33 | 69°.13 | 1791 | 0.21 | 0.33 | Semi-arid | 1433.14 | 1366.73 |
| 2 | North Salang | 35°.19 | 69°.10 | 3366 | 1.61 | 5.06 | Humid | 603.300 | 645.290 |
| 3 | South Salang | 35°.18 | 69°.40 | 3172 | 1.57 | 1.43 | Humid | 679.200 | 704.100 |
| 4 | Paghman | 34°.35 | 68°.59 | 2114 | 0.35 | 0.29 | Semi-arid | 1306.80 | 1353.70 |
| Station Name | Scenarios | Annual Precipitation Values under RCP 4.5 and RCP 8.5 for the Future Periods of (2010–2099) | ||||
|---|---|---|---|---|---|---|
| Much below Normal | below Normal | near Normal | above Normal | Much above Normal | ||
| Kabul | RCP 4.5 | 165.30–-205.90 | 237.60–-263.90 | 275.10–-302.20 | 340.50–-365.50 | 434.80–-914.20 |
| RCP 8.5 | 158.90–-196.00 | 222.80–-246.50 | 256.90–-283.20 | 312.60–-336.10 | 386.10–-478.20 | |
| North Salang | RCP 4.5 | 518.30–-725.20 | 792.50–-856.60 | 921.20–-966.90 | 1051.3–-1103.4 | 1203.1–-1570.5 |
| RCP 8.5 | 1885.8–-2223.8 | 2476.0–-2743.2 | 3003.7–-3157.0 | 3375.4–-3839.2 | 4358.3–-6430.5 | |
| South Salang | RCP 4.5 | 778.60–-860.60 | 933.90–-980.00 | 1010.4–-1058.1 | 1129.8–-1174.4 | 1339.4–-1981.6 |
| RCP 8.5 | 693.40–-753.10 | 830.90–-888.70 | 936.70–-997.90 | 1062.3–-1148.4 | 1300.7–-2200.2 | |
| Paghman | RCP 4.5 | 276.10–-324.10 | 341.40–-388.50 | 430.90–-462.30 | 507.40–-540.20 | 640.10–-1326.5 |
| RCP 8.5 | 248.40–-285.00 | 316.50–-336.20 | 383.00–-408.90 | 449.60–-484.40 | 521.40–-789.20 | |
Disclaimer/Publisher’s Note: The statements, opinions and data contained in all publications are solely those of the individual author(s) and contributor(s) and not of MDPI and/or the editor(s). MDPI and/or the editor(s) disclaim responsibility for any injury to people or property resulting from any ideas, methods, instructions or products referred to in the content. |
© 2023 by the authors. Licensee MDPI, Basel, Switzerland. This article is an open access article distributed under the terms and conditions of the Creative Commons Attribution (CC BY) license (https://creativecommons.org/licenses/by/4.0/).
Share and Cite
Sidiqi, M.; Kasiviswanathan, K.S.; Scheytt, T.; Devaraj, S. Assessment of Meteorological Drought under the Climate Change in the Kabul River Basin, Afghanistan. Atmosphere 2023, 14, 570. https://doi.org/10.3390/atmos14030570
Sidiqi M, Kasiviswanathan KS, Scheytt T, Devaraj S. Assessment of Meteorological Drought under the Climate Change in the Kabul River Basin, Afghanistan. Atmosphere. 2023; 14(3):570. https://doi.org/10.3390/atmos14030570
Chicago/Turabian StyleSidiqi, Massouda, Kasiapillai S. Kasiviswanathan, Traugott Scheytt, and Suresh Devaraj. 2023. "Assessment of Meteorological Drought under the Climate Change in the Kabul River Basin, Afghanistan" Atmosphere 14, no. 3: 570. https://doi.org/10.3390/atmos14030570
APA StyleSidiqi, M., Kasiviswanathan, K. S., Scheytt, T., & Devaraj, S. (2023). Assessment of Meteorological Drought under the Climate Change in the Kabul River Basin, Afghanistan. Atmosphere, 14(3), 570. https://doi.org/10.3390/atmos14030570