Brief Report

The Effects of Fog on the Atmospheric Electrical Field Close to the Surface

1
School of Sustainability, Reichmann University, Herzliya 4610101, Israel
2
Institute of Earth Sciences, Hebrew University of Jerusalem, Jerusalem 91904, Israel
*
Author to whom correspondence should be addressed.
Atmosphere 2023, 14(3), 549; https://doi.org/10.3390/atmos14030549
Submission received: 5 February 2023 / Revised: 2 March 2023 / Accepted: 9 March 2023 / Published: 13 March 2023

Abstract

:
Ground-based measurements of the atmospheric electric field have been recorded continuously since 2013 at the Wise Observatory, located in the Negev Desert Highland in southern Israel. The data have been used for defining the characteristics of fair weather and to identify the signatures of dust storms, lightning activity, and clouds. We report here on new results from observations of the variability of the electric field (transformed into the potential gradient, PG) during several foggy days, along with meteorological data on wind speed and relative humidity. The results show a substantial increase in the electric field (up to 400–650 V m−1) compared with the mean fair weather values observed at the site (180–190 V m−1). This increase is especially clear during times of high relative humidity values (95%+) and low wind speed (<3 m s−1). This increase is likely a consequence of the reduction in the atmospheric conductivity at low levels, due to the attachment of charge carriers to fog droplets. Based on this discovery, it is suggested that continuously monitoring the electric field may offer an additional operational tool to alert for the onset and termination of fog at specific locations, such as airports and harbors, where this nowcasting capability is required.
Keywords:
fog; electric field

1. Introduction

One of the parameters used for studying the global electrical circuit (GEC) is the vertical electric field E z , which is alternatively defined as the potential gradient ( E z = P G ). The PG has been studied for over a century and was found to be affected on an hourly, daily, seasonal, and annual base by natural and man-made processes. It is a global measure that reflects the state of the global electrical circuit, as manifested in the Carnegie curve [1]. On local scales, the EZ responds to a variety of processes, such as increased pollution and dust concentrations in the atmosphere, overcast conditions and the presence of clouds, a high relative humidity, fog and precipitation, lightning activity, and so forth [2,3,4,5,6,7,8,9,10,11,12,13]. With respect to fog, Ronayne [14] reported in a letter to Benjamin Franklin that fog droplets are charged and thus affect the conductive balls on a wire. Present studies have shown that fog tends to increase the PG, since larger droplets cause a reduction in the mobility of charge carriers (Equation (1)); therefore, with respect to Ohm’s law (Equation (2)), they reduce the conductivity. This decrease in conductivity results in an increase in the electric field and hence, the potential gradient (PG).
The conductivity (σ) represents the atmosphere’s ability to conduct an electric current and depends on the mobility of the ambient ions. Larger and slower ions reduce the conductivity compared with the faster and lighter ones. The conductivity (σ) is therefore related to the mobility (μ) and the concentrations of ions (n), and e is the elementary charge. The total conductivity from the negative and positive ions in the atmosphere is defined by:
σ T = σ + + σ = e μ + n + + μ n
Ohm’s law defines the relationship between the electrical parameters that are discussed above—the vertical electric field (EZ), the total conductivity (σ), and the vertical conduction current density (JZ) are as follows, where z denotes the vertical component:
J z = σ E z
Anisimov [15] reported six cases of fog at the Borok Observatory and showed that the PG values increased during times of fog up to 350 V m−1, and slightly reduced the values of the atmospheric conduction current (JC or JZ). Bennet and Harrison [16] showed an increase of the PG of up to 300–800 V m−1, which depended on the thickness of the fog (droplet size) while the conduction current values remained the same. Harrison [4] reported a doubling of the PG measured in Reading during fog conditions, from a median value of 80.6 V m−1 to 170.6 V m−1, based on 139 h of data. Lucas [17] observed an enhancement in the PG of +150 V m−1 in clear sky conditions at sunrise, when low wind speeds and high relative humidity conditions were measured, which are the ideal meteorological conditions for the generation of radiation fog [18]. Such conditions typically occur during the late summer and early autumn months in Mitzpe Ramon (Figure 1). This paper reports on the ground-based PG measurements obtained during fog conditions at the Wise Observatory in the Negev Desert in southern Israel. We report on the changes observed in the potential gradient at the onset and termination of the fog and suggest that they can utilized for fog monitoring. In Section 2, we review the meteorological consequences of fog in Israel, and particularly in the Negev Highland Desert, while Section 3 focuses on instrumentation, followed by Section 4 presenting the results, and a short discussion in Section 5 that suggests an operational aspect for monitoring fog on a global scale.

2. Meteorological Conditions for Fog in the Negev Desert

Fog in Israel is a rather rare event that appears only on few nights annually. Goldreich [19] reviewed the conditions for and the prevalence of fog in Israel. Based on his chapter 5, fog is most frequent in the coastal plain of Israel, as can be expected from its proximity to the Mediterranean Sea. Based on the synoptic classification offered by Levi [20], there are different scenarios for the appearance of fog. David et al. [21] analyzed 50 years of data on major fog events in the central coastal plain of Israel from 1967–2017 and showed that 44% of the nights with fog occurred under Red Sea Trough conditions, and 41% under Ridge conditions. They showed a decreasing trend in the overall occurrence of fog, with a marked decrease in the number radiation fog events compared with advection fog (note that radiation fog occurs wherever there is radiative cooling of the surface and a stable (inversion) temperature profile in weak wind regimes and sufficient moisture, while advection fog forms when warm, moist air is transported over colder surfaces, a condition prevalent mostly over the Mediterranean coastline of Israel). A recent study by Ronen et al. [22] on an unusual four-day stretch of deep fog in January 2021 showed that Red Sea Trough conditions, with easterly and then westerly axes, prevailed during that period, resulting in extended fog over central and southern Israel.
For the Negev Desert, Kidron [23] conducted observations of fog during the late summer and fall of 1992, in several locations along the 100 mm isohyet and at varying altitudes. Comparing the data from sites in Nizzana (250 m ASL), Sde Boker (500 m ASL), and Har Harif (1000 m ASL) showed a clear dependence of dew and fog amounts on altitude. This topographic enhancement dominates over the distance from the Mediterranean coast, which is the source of humidity for this type of precipitation. Kidron [23] reported an increase of 0.015–0.03 mm of the daily amounts of dew and fog water per 100 m rise in elevation. This topographic effect is manifested in a factor 2–3 enhancement for the 1000 m difference between the Negev Highland and the coastal plain of Israel. In a follow-up paper [24], he analyzed 29 days in the fall seasons of 1987–1989 for fog and dew occurrence at three different habitats (sun–wind exposed, sun-shaded, and wind protected). His results show that clear and low-wind conditions are more conducive to the occurrence of fog, compared with cloudy and windy mornings. He showed that condensation and dew formation continued well after sunrise, an effect that was especially pronounced in the sun-shaded location. This finding supports the well-known attributes of the conditions for radiative fog in many places around the world [25]. The decisive role of topography in the occurrence of fog was further discussed by Hûnová et al. [26] for various sites in Romania, based on observations between 13–2504 m above sea level.

3. Instrumentation, Observation Site, and Data

As shown in many previous works conducted by our group [10,11,27,28,29], the vertical component of the electric field is measured by a CS110 electric field meter from Campbell Scientific Company (http://www.campbellsci.com/cs110-sensor; accessed on 15 September 2022). The electric field (EZ) is measured at a sampling frequency of 1 Hz and the detector is placed 2 m high above the ground. The station is located at Tel Aviv University’s Wise Observatory (WO), near the town of Mitzpe Ramon (30°35′ N, 34°45′ E, altitude 850 m ASL). The Negev Highland Desert area is mostly arid and dry, with an average precipitation of 80 mm/year, which occurs almost entirely from December to February. The continuous measurements of the EZ began in June 2013 and are saved locally, although part of the data have already been uploaded to the GloCAEM database at Reading University [30], and is available for registered users. The Wise Observatory also operates a meteorological weather station, which provides data on temperature, humidity, pressure, and wind speed. The NASA AERONET (AErosol RObotic NETwork) project is a network of ground-based remote sensing aerosol detectors which provides global observations of spectral aerosol optical depth (AOD). We used the data from an AERONET station that is located in Sde Boker (30.855 N, 34.782 E), approximately 20 km to the north of the Wise Observatory.

4. Results

We analyzed five fog case studies to gauge the effects of a high relative humidity and low wind speed that supported fog conditions on the measured electric field. The values of the observed electric field are transformed here into the potential gradient (PG). A summary of the results is presented in Table 1 and includes the range of wind speeds and relative humidity values that were obtained at the Wise Observatory meteorological station.
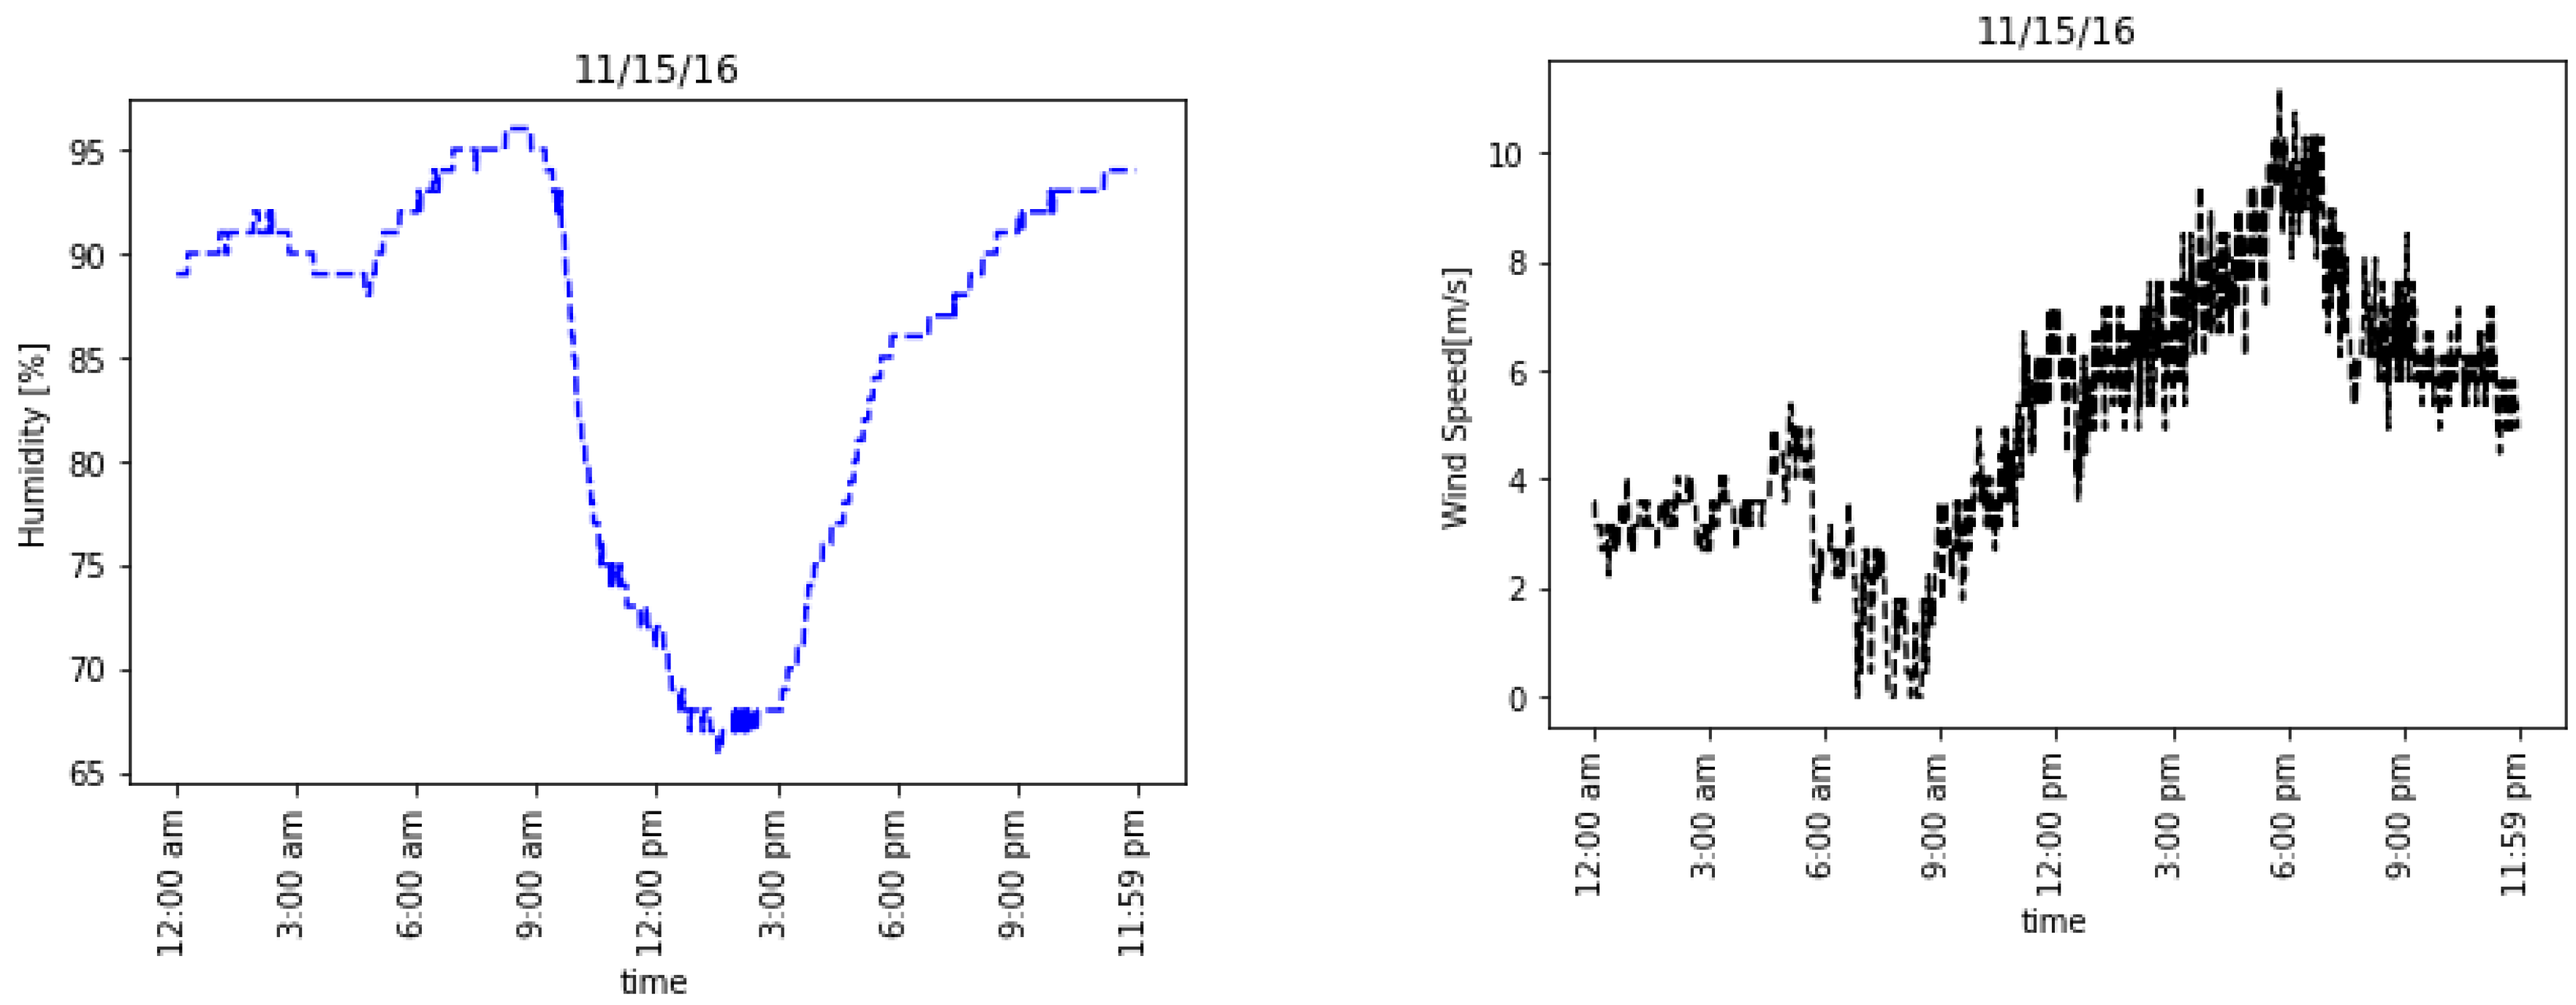
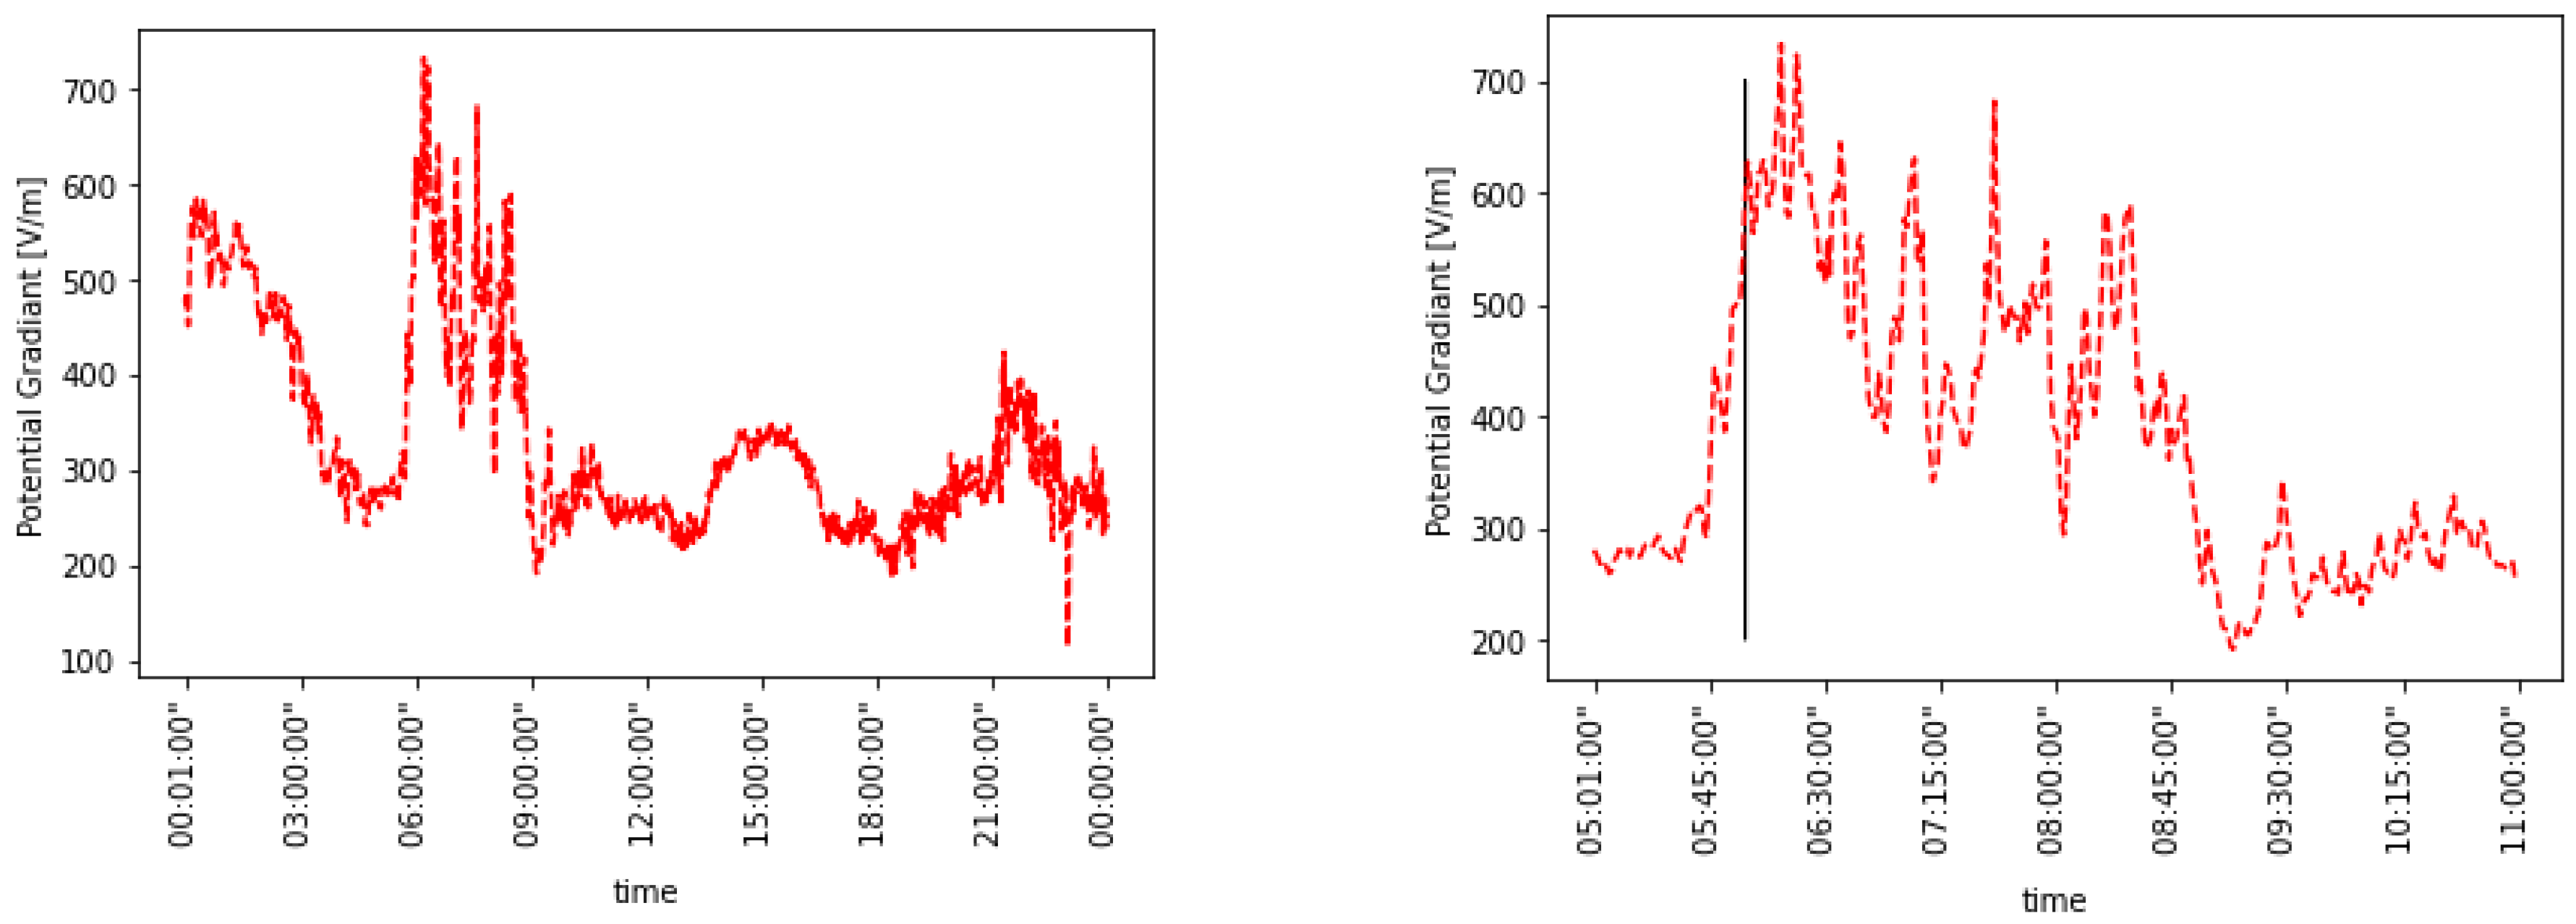
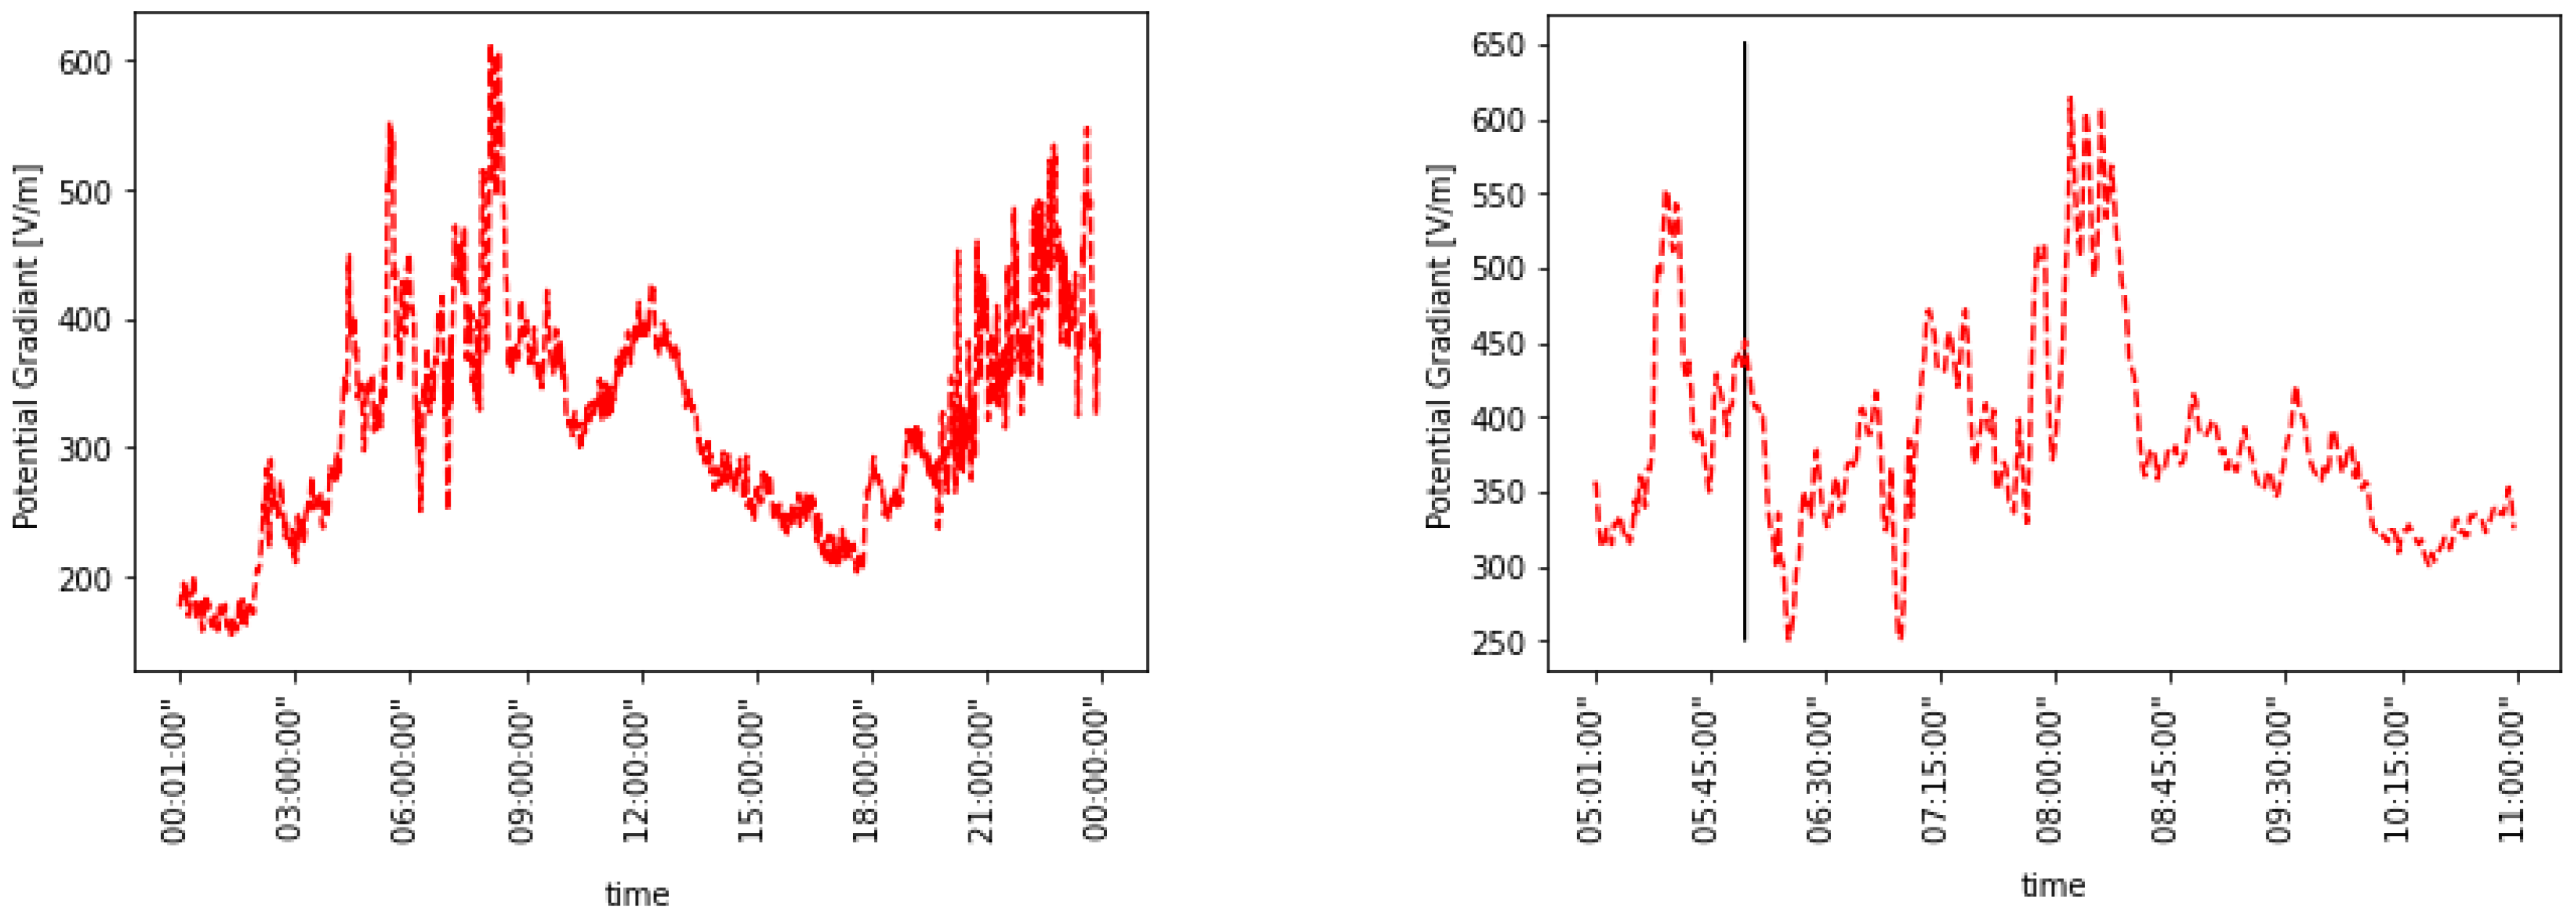
Figure 2 shows a typical fog case study from 15 November 2016. During the early morning hours, just prior to sunrise at 06:07, in the period between 6:00–9:00 local time, there was an observable increase in the relative humidity to a maximum value of 96%, and a decrease in the wind speed below 1 m s−1, which were accompanied by the generation of local fog. A resultant conspicuous increase in the measured PG showed increased values of up to 600–700 V m−1 during the same hours. After 9:00, the fog began to disperse, the relative humidity decreased sharply (to 65% around 12:00), and the wind speed increased to higher values (up to 6–7 m s−1 around 12:00), signaling the arrival of the Mediterranean sea breeze front. The PG returned to a fair weather value of 200+ V m−1, with a peak around 15:00, representing the contribution of the lightning activity over Africa [10]. A close-up of the behavior of the PG is presented in Figure 3, with rapid fluctuations occurring on time scales of ~5 min.
As the relative humidity increased towards the saturation values, a marked continuous increase in the intensity of the electric field (PG) was observed, that reached its peak values in conjunction with the condensation of haze drops, which form the initial phase of fog. The increased concentrations of the droplets decreased the mobility of the charges and decreased the conductivity, thereby leading to the observed increase in PG. These rapid fluctuations can be attributed to the patchy nature of the fog as it drifted past the observatory, alternating between clear and foggy conditions. Evidently, monitoring the RH and PG simultaneously can serve as an indicator for the proximity of fog conditions.
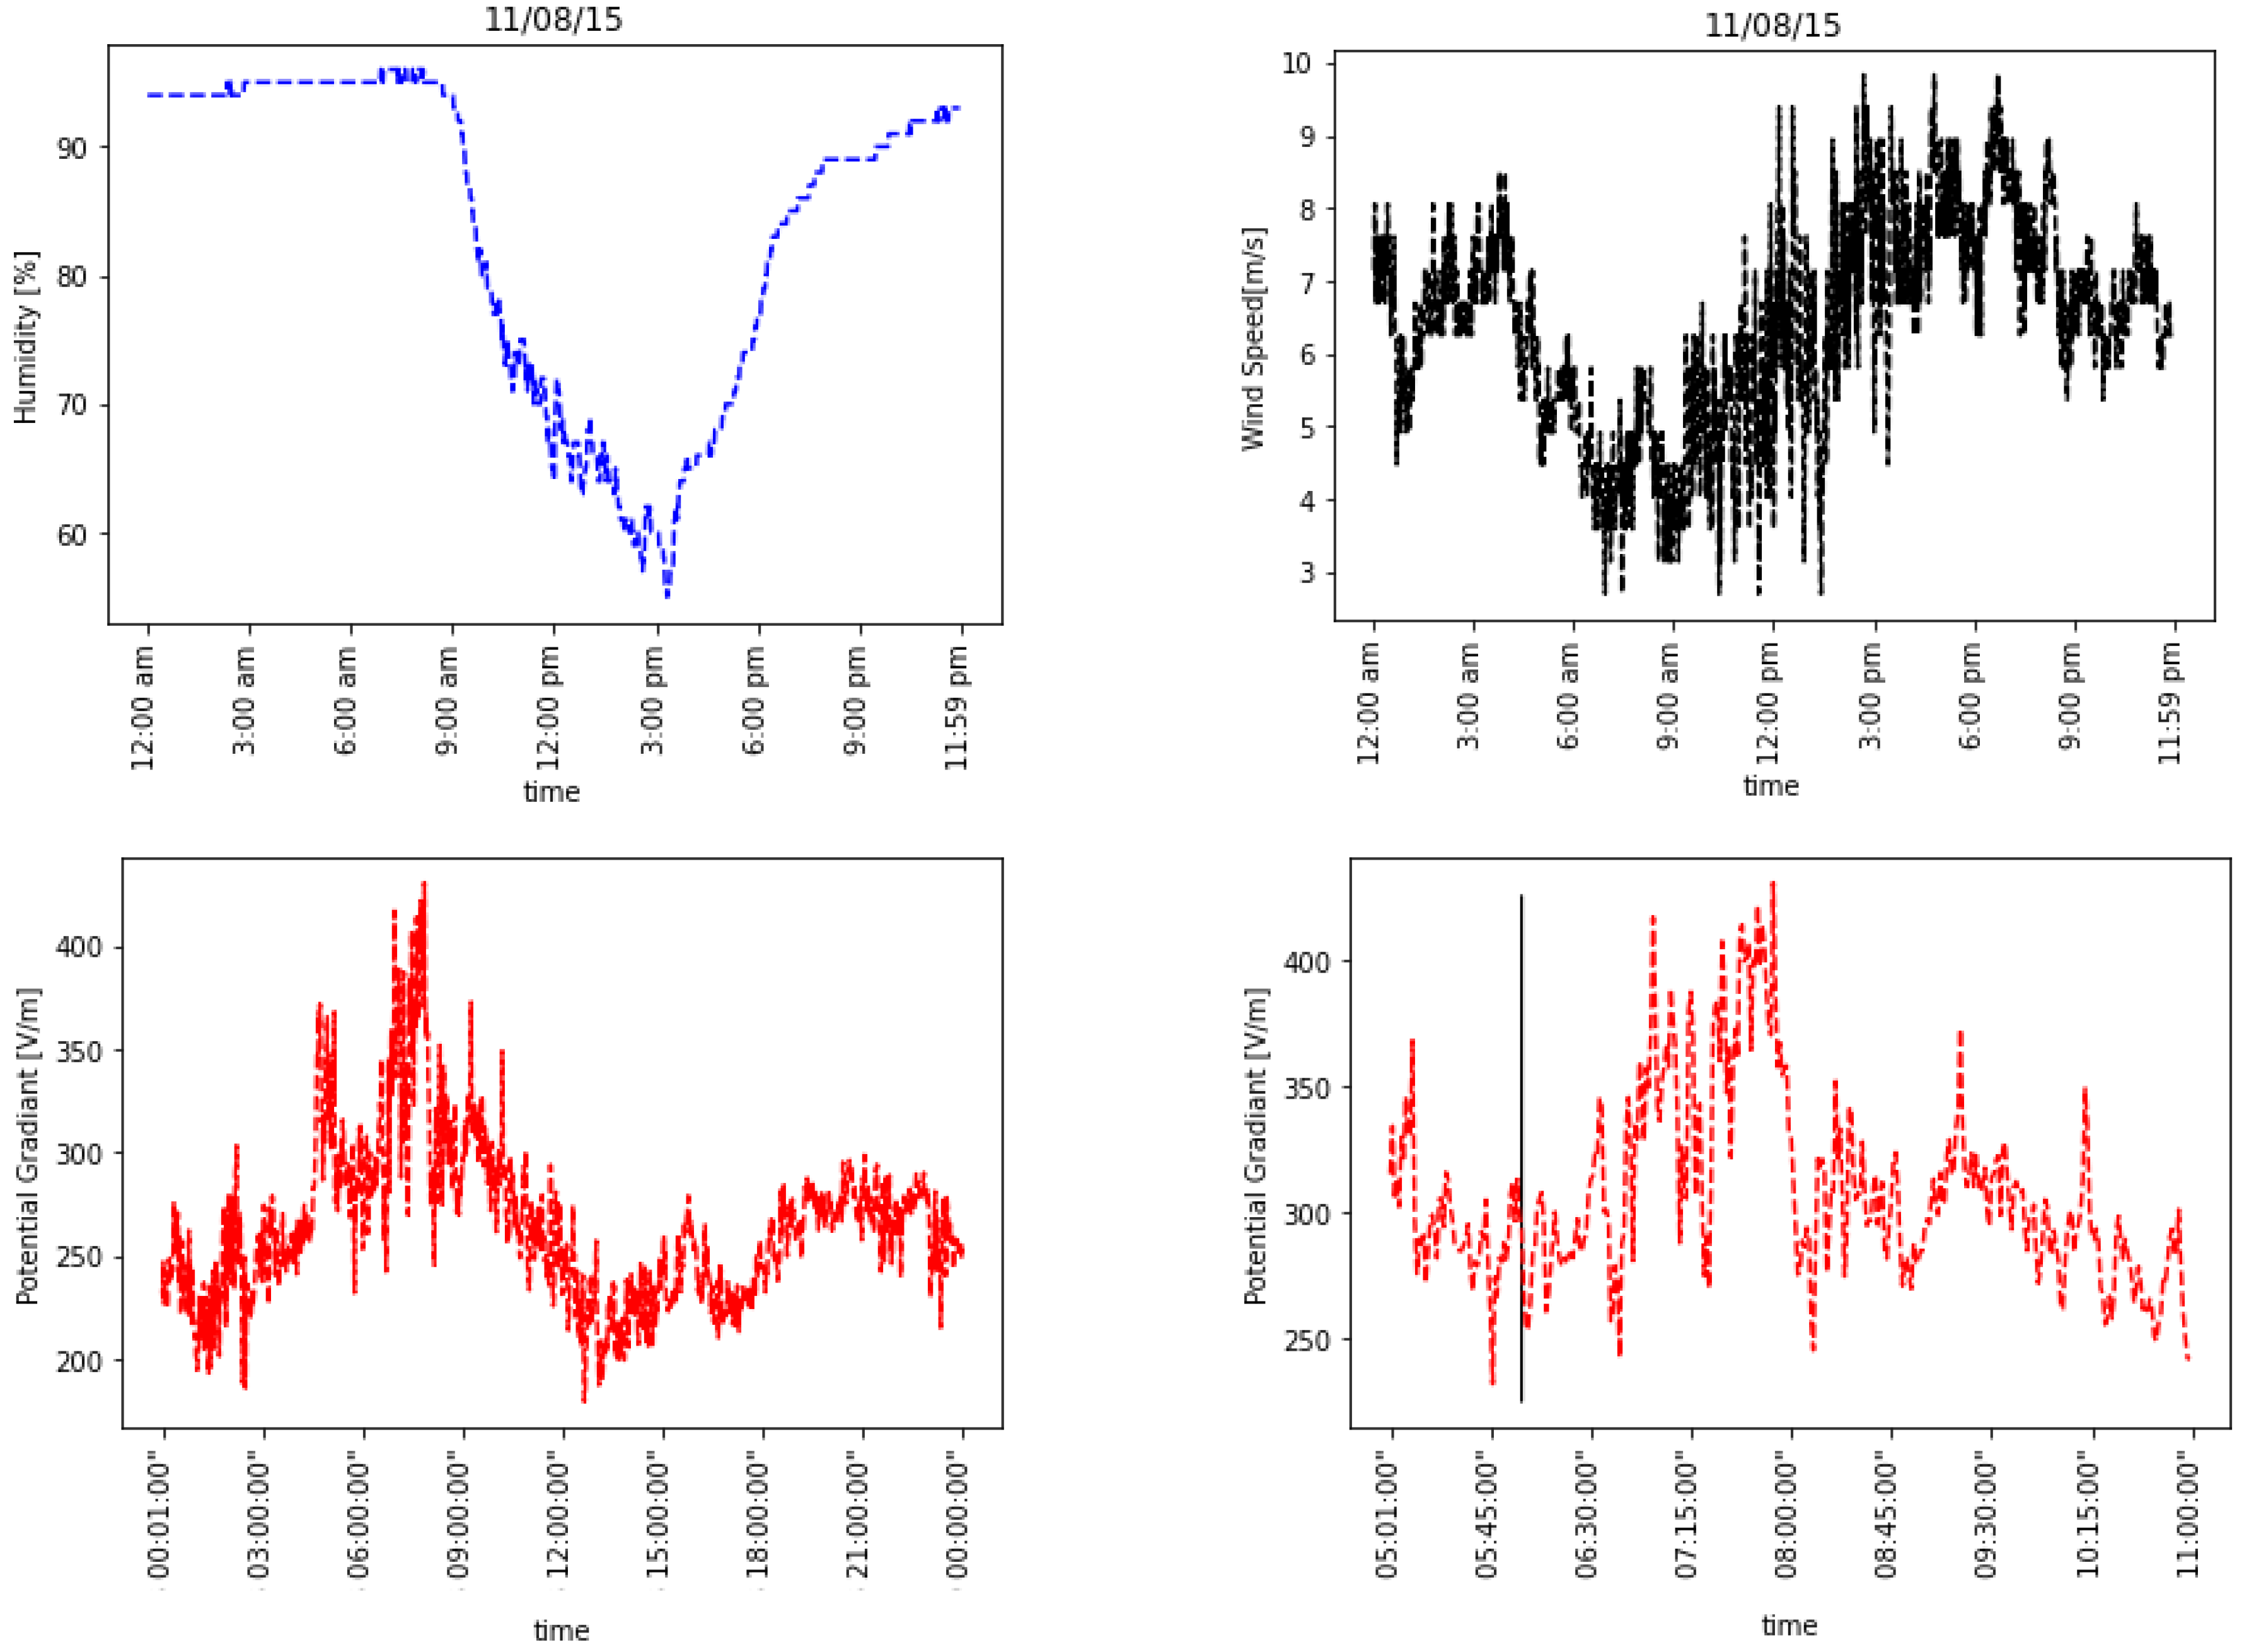
Figure 4 shows a different case study from 8 November 2015. The relative humidity values reached a maximum value of 97% between 6:00 to 9:00 in the morning. The radiation fog was generated during the hours when the wind speed decreased to around 3 m s−1. The PG values during the same hours ranged from 300–450 V m−1. After 09:00, the humidity decreased dramatically to 60–70%, the wind speed increased up to 6–10 m s−1, and the PG went back to the fair weather values of 200–250 V m−1, again with a local peak due to the global lightning activity in the three chimneys.
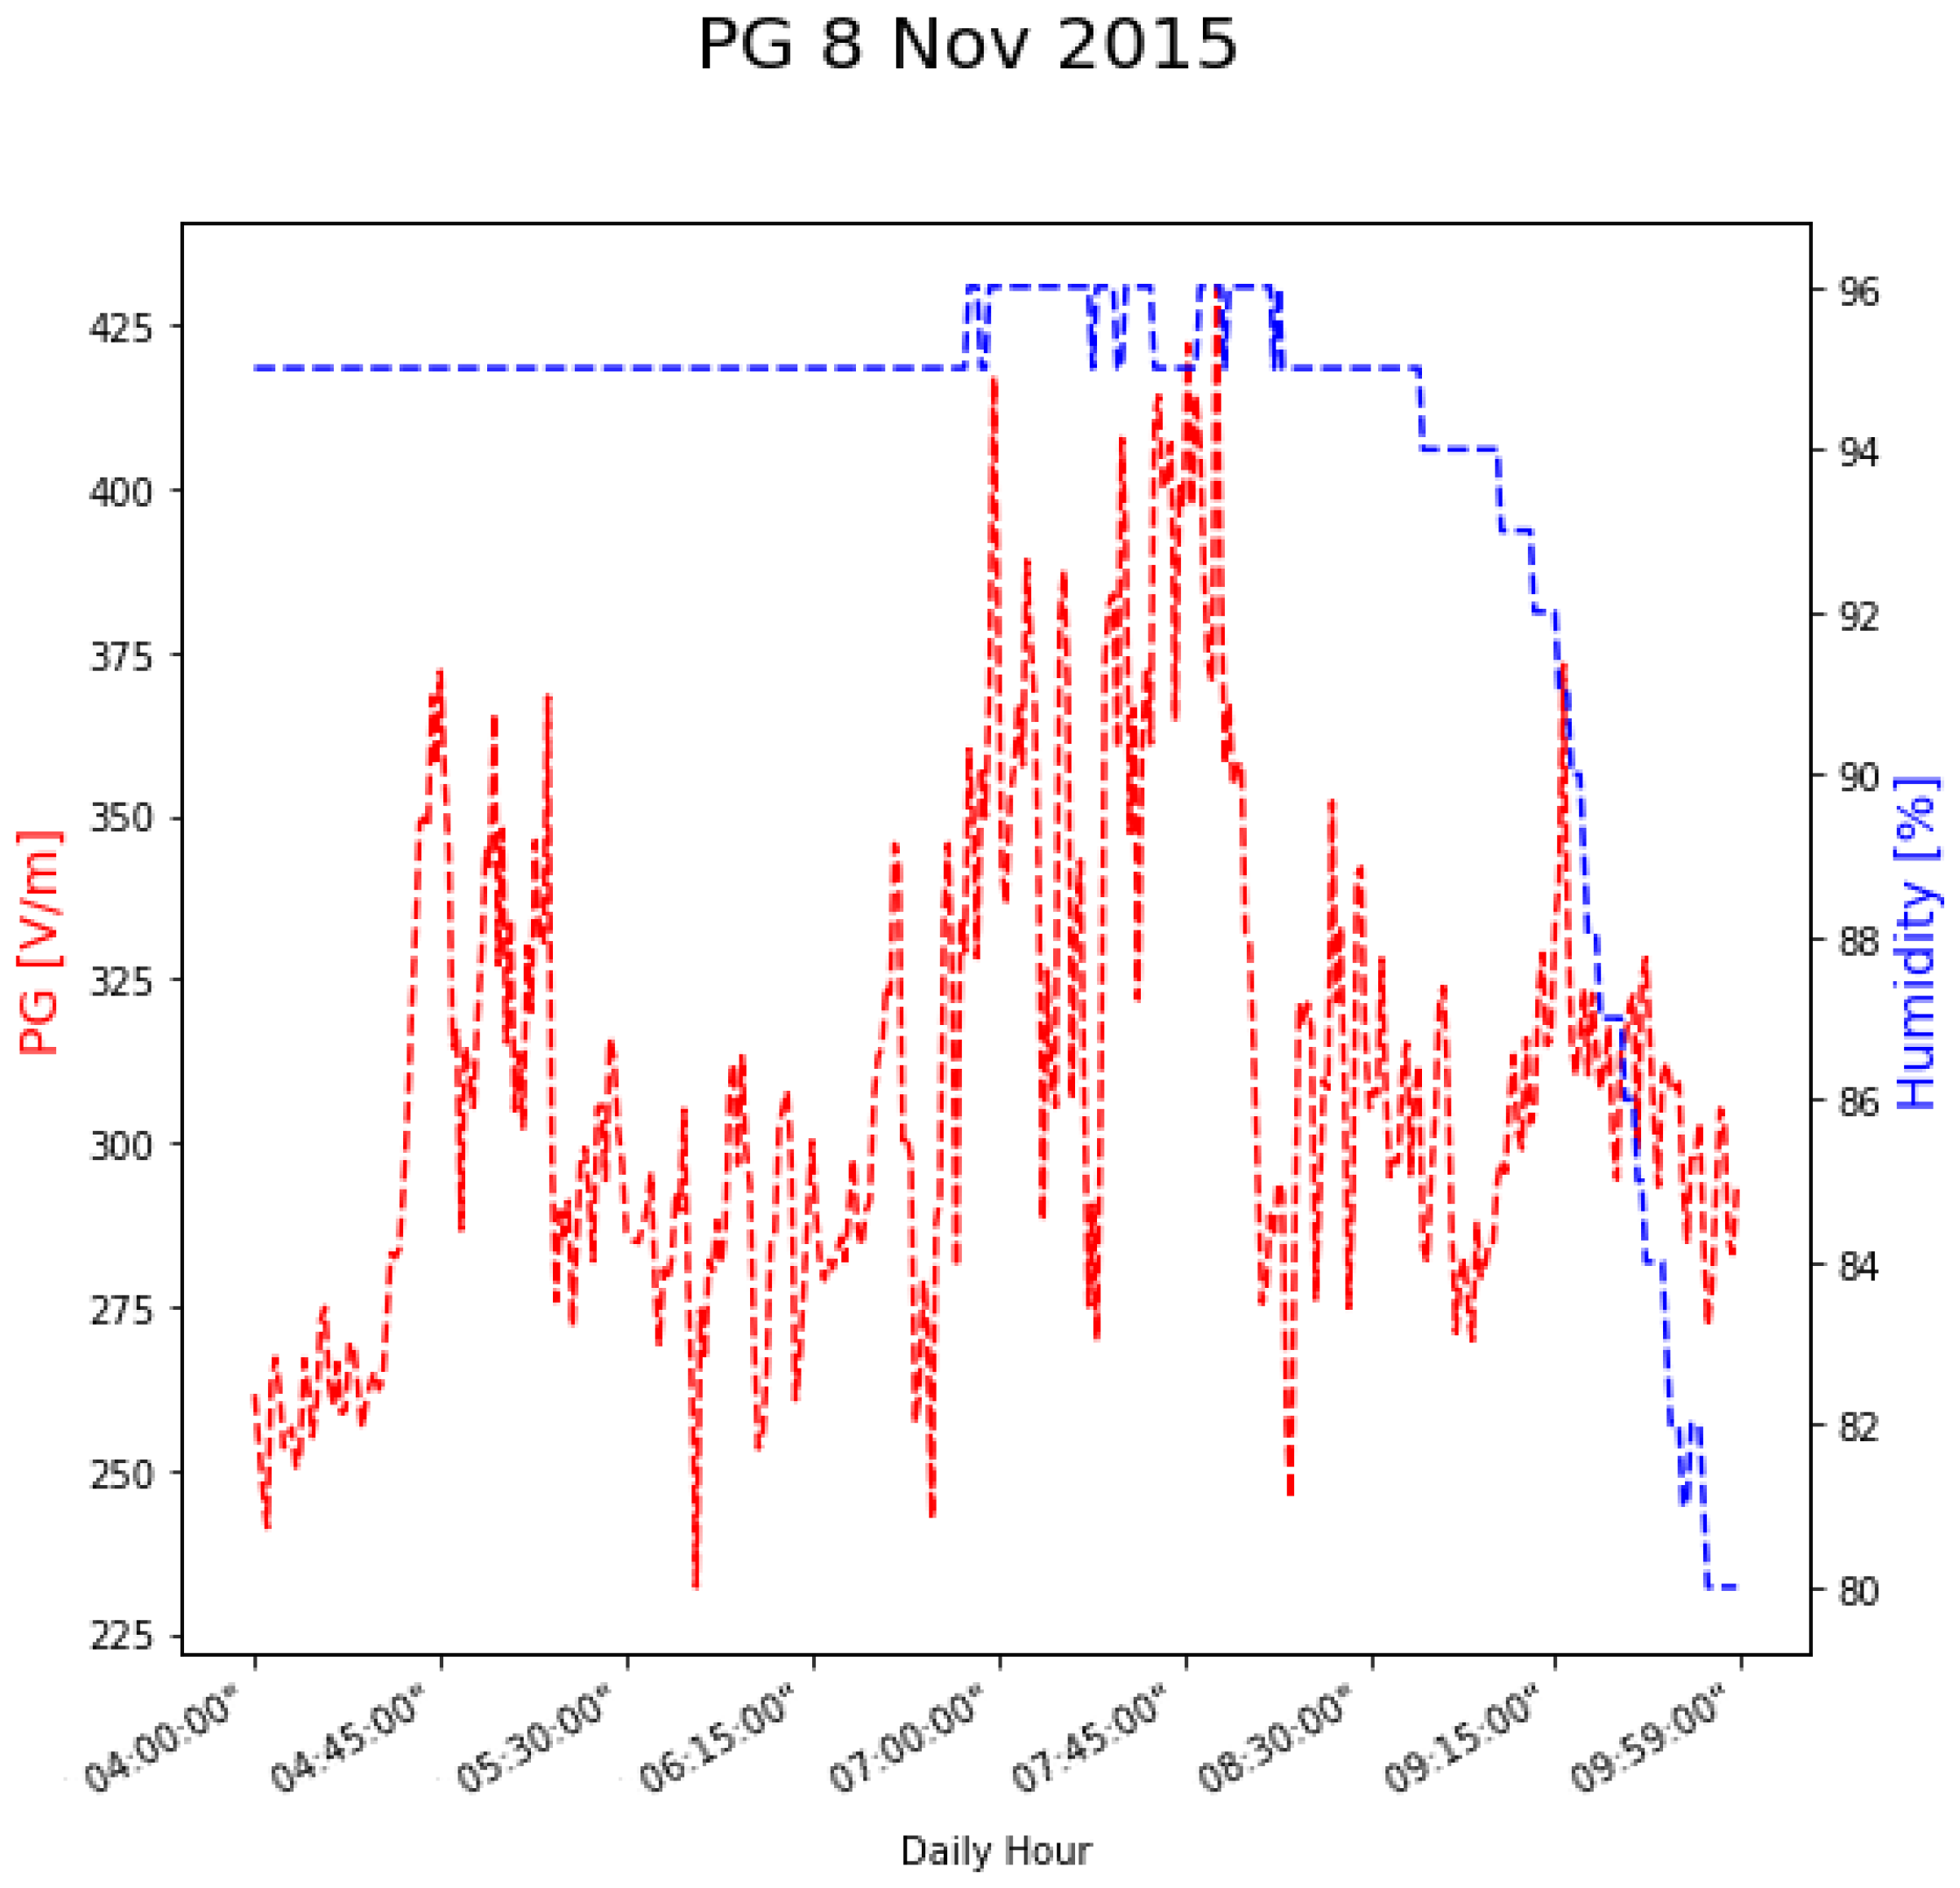
Figure 5 shows a close-up of the temporal behavior of the PG along with the relative humidity for the time period of 04:00–10:00a.m. local time. An increase in the PG from 200 V m−1 to >400 V m−1 coincided with the near saturation conditions (RH > 95%) that are typical of fog conditions, lasting until ~08:10. At that time, a rapid decrease in the relative humidity was followed almost instantly by a steep decrease in the PG. This is a result of a solar warning (sunrise was at 06:00), which led to fog dissipation and a subsequent increase in the conductivity due to the disappearance of the fog droplets. The potential gradient responded on a timescale of 10 min to this change, as the fluctuations continued well into the morning hours. Note that the maximum values of the PG were observed just prior to the beginning of the fog dissipation.
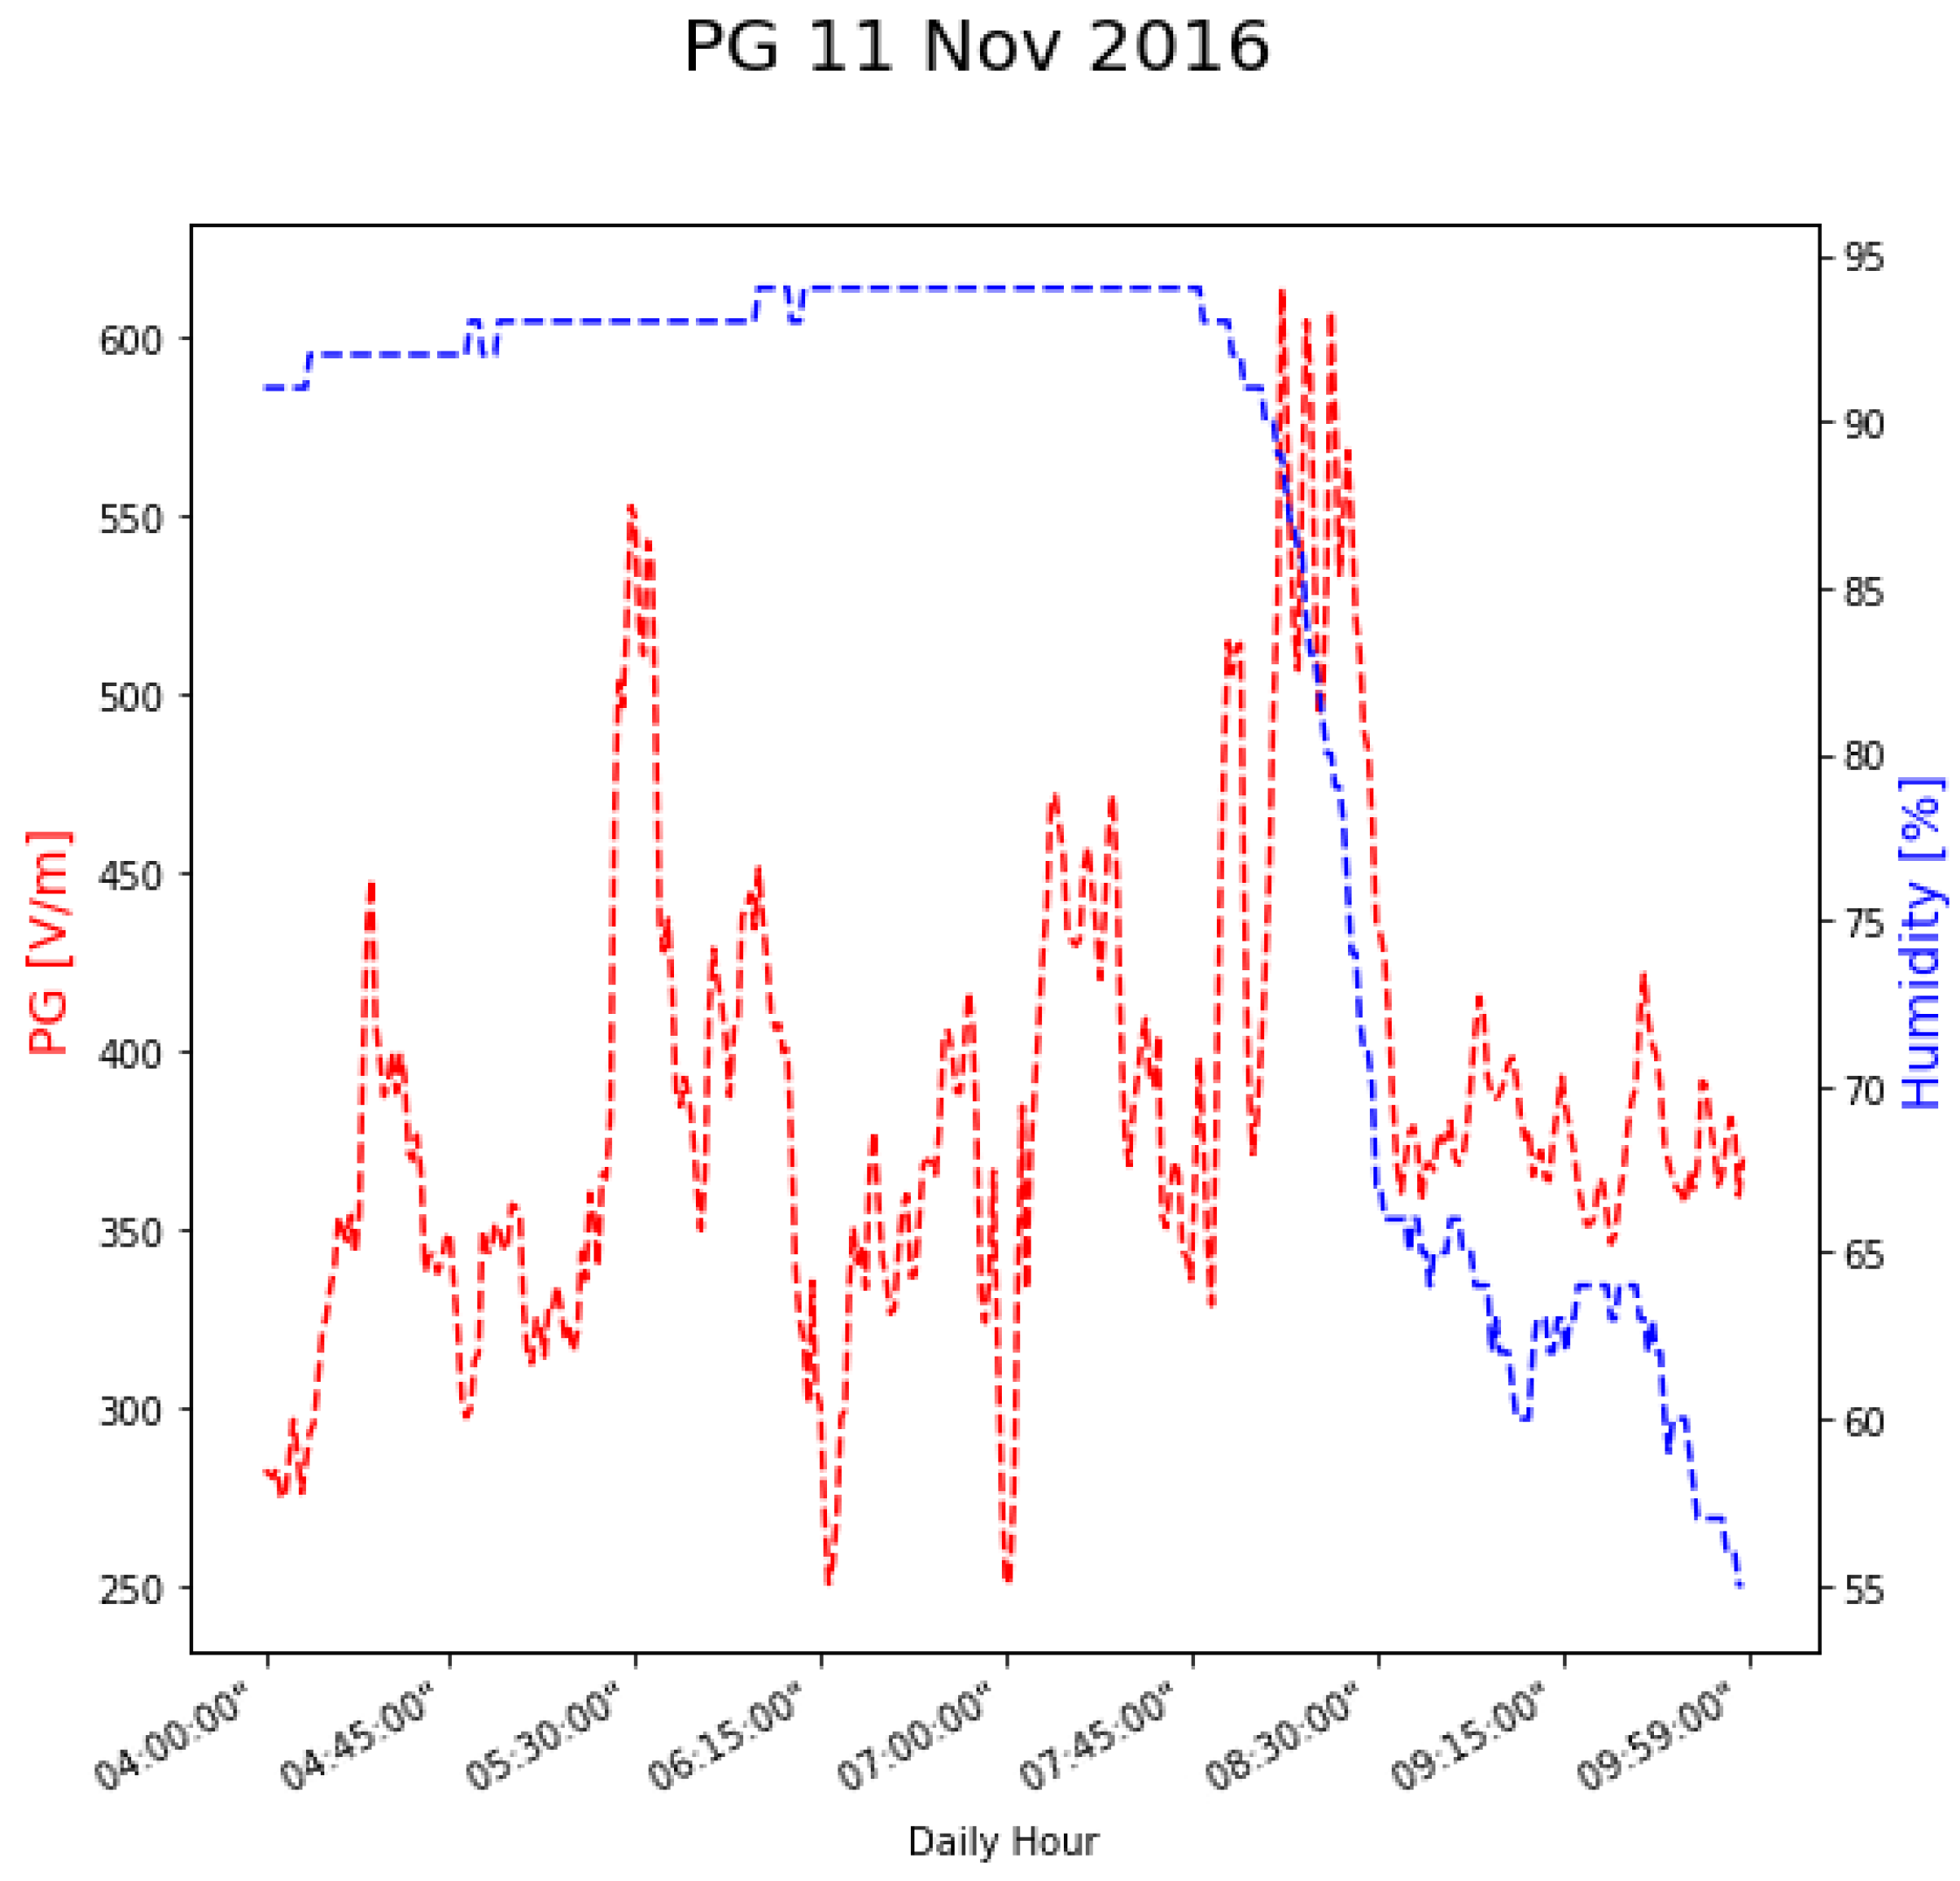
Figure 6 shows the case study from 11 November 2016. The radiation fog appeared when the wind speed decreased to around 2–3 m s−1. The relative humidity values reached a maximum value of 96% between 6:00 to 9:00 in the morning, and the PG during the same hours reached values of up to 600 V m−1. After 9:00, the humidity decreased dramatically to 50–60%, the wind speed increased up to 5–6 m s−1, and the PG decreased to the average fair weather values of 200–250 V m−1. The increase in the relative humidity during late hours (21:00), and the decrease in the wind speed again to values of 1–3 m s−1, resulted in another increase in the PG to values between 500–600 V m−1, which was likely a superposition with South American lightning activity (as per the Carnegie curve [1]), before dropping again to a lower value of the Ramon curve [10].
A close-up (Figure 7) of the parallel pattern of the relative humidity and the potential gradient reveals similar features, as seen in the previous two case studies; however, there are some notable differences. For example, the increase in the PG was followed by instances of decreases to lower values, even though it was clear from the values of the relative humidity that the appearance of fog had already occurred. This can be explained by the patchy nature of the fog, which was interrupted by wind gusts at that time. Additionally, there was an offset of ~10 min between the decrease in the relative humidity (signaling the dissipation of the fog around 07:45 a.m. local time) and the maximum values of the PG (~600 V m−1). In the span of 10 min, the PG decreased sharply to 350 V m−1 and fluctuated around those values for a longer period.
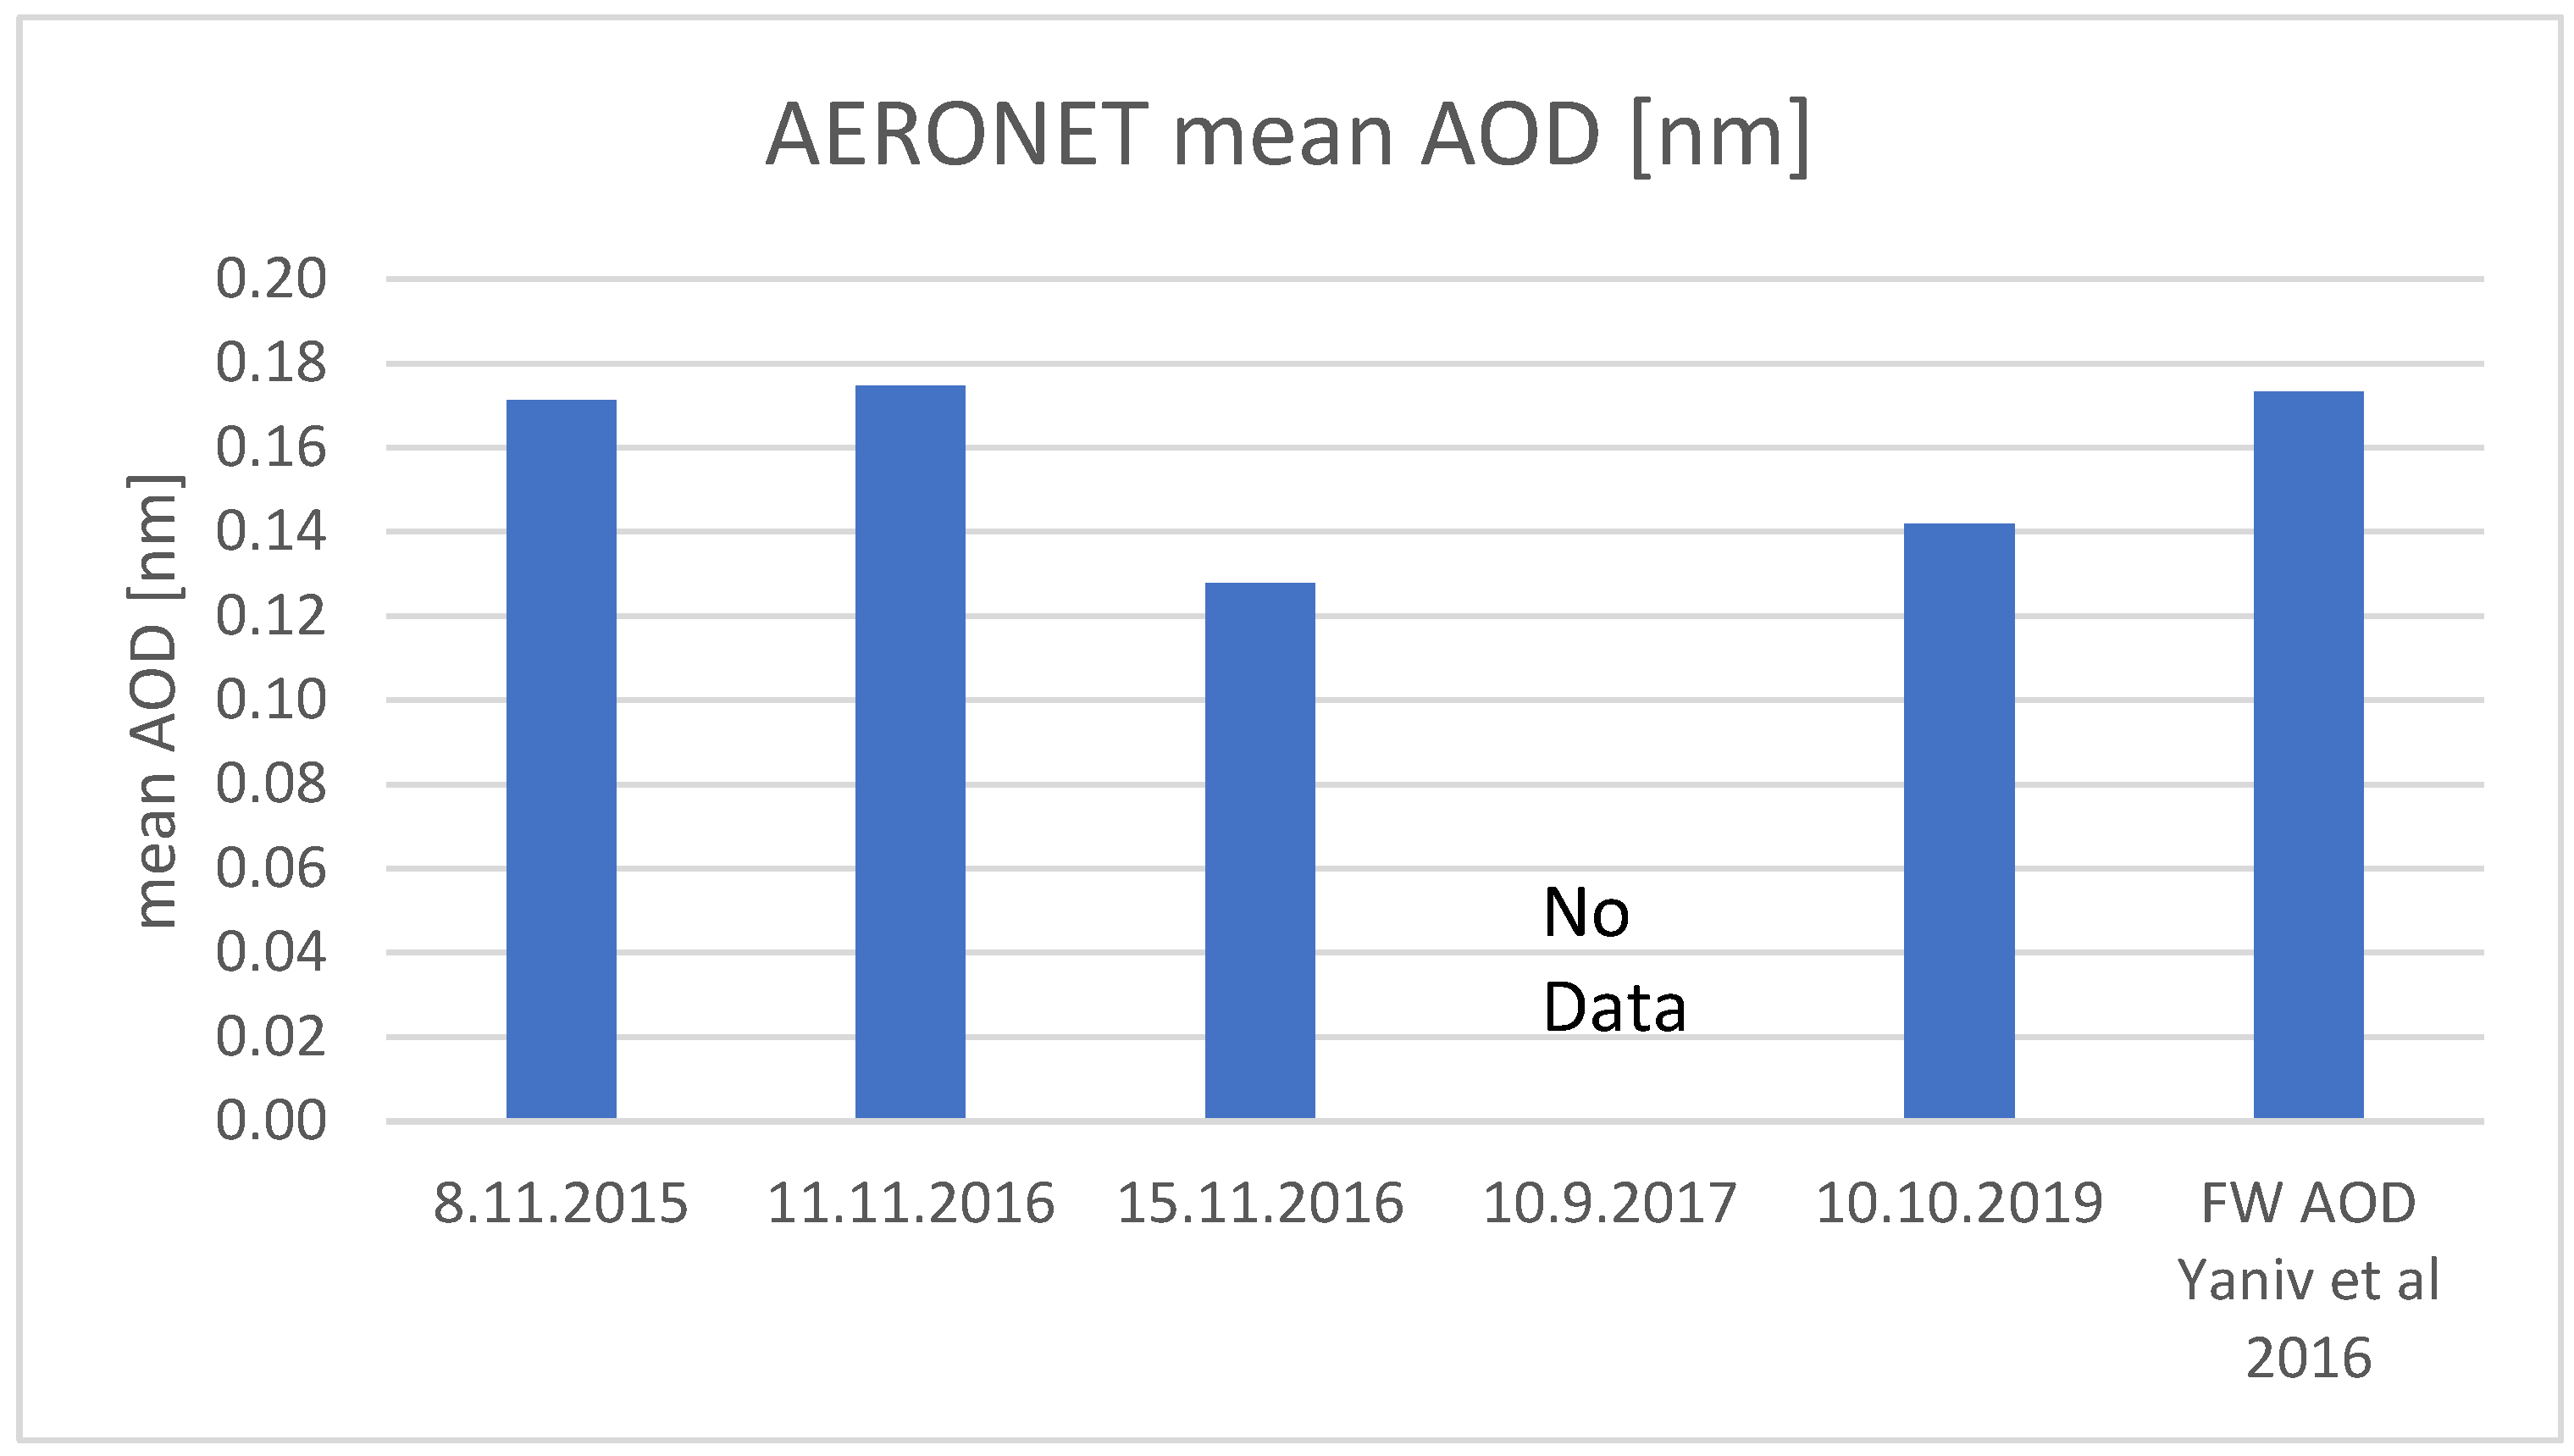
To rule out the impact of external factors on the observations, and to make sure that they complied with the definition of fair weather days, we looked at various possible mechanisms that are known to affect the PG [11]. There was no rain, snow, or other types of precipitation on any of these dates anywhere near the Wise Observatory. The solar activity during the five case studies was also minimal, and to ensure this fact, we checked the values of the Kp index, which is an acceptable proxy for geomagnetic storms. Such geomagnetic activity was shown to affect the PG, especially at high latitudes, through modifications that were induced to the column conductivity and the vertical conduction current flowing in the GEC [31]. The data were taken from the archive of GFZ Potsdam (available through spaceweatherlive.com, accessed on 20 January 2023), which reports 3-hourly average values of the planetary Kp index. We also checked other solar indices and solar images from various space platforms, available through NOAA SWPC (Space Weather Prediction Centre), in order to verify the activity level of the sun. For the 8 November 2015 event, the range of the Kp = 1–2, and the same range was also observed on 11 November 2016 and 15 November 2016. For the 10 September 2017 case study, the Kp = 0. Only during the early hours of 10 October 2019 did the Kp = 2–4, which is still below the level that is defined as a geomagnetic disturbance. Thus, we can rule out any geomagnetic storm effect on the measured PG values. Furthermore, we looked at the type, amounts, and heights of cloudiness in all five case studies, because clouds interfere and affect the flow of the fair weather current in the GEC and affect the observed PG [28]. The sky was completely clear during 15 November 2016, 10 September 2017, and 10 October 2019; on 8 November 2015, there were a few scattered cumulus clouds, and on 11 November 2016, there was insignificant coverage by cirrus clouds. These data rule out any effect by clouds on the local PG. The third and last external factor that may have affected the observed PG was increased aerosol concentrations, potentially due to pollution advection or because of the local lifting of dust via thermal convection, especially several hours after sunrise. We calculated the mean values of the aerosol optical depth (AOD) for each of the case studies. The mean values of the AOD for each case study were compared to the mean fair weather values from Mitzpe Ramon, as previously reported by Yaniv et al. [10], which are presented in Figure 8.
From the four case studies described above, we can deduce that the aerosol concentrations during the fog were similar to the fair weather values; hence, it is reasonable to conclude that the observed increases in the PG were not due to high concentrations of dust aerosols (as was reported in [27]), and can be entirely attributed to the occurrence of fog.

5. Summary

The atmospheric electric field was shown to be a sensitive, observable, atmospheric parameter through its response to local weather phenomena such as rain, snow, clouds (Harrison [4]; Table 2 and Figure 3 there), large-scale disturbances to the global electric circuit due to solar activity [31], and man-made effects related to pollution and radioactivity [32]. Fog is a transient weather phenomenon that possesses significant implications for human safety, because it has the potential of reducing visibility to less than 100 m in a matter of minutes. This is especially crucial for marine and air transportation, but also to road safety, where huge pileup accidents occur due to impaired visibility on highways. Correctly forecasting the occurrence of fog constitutes a crucial meteorological service, and it also has important nowcasting aspects for obvious operational reasons. Numerical weather prediction often fails in correctly predicting sub-grid events such as fog, and requires sophisticated approaches to forecasting the occurrence of such events [33,34,35]. In recent years, the usage of microwave networks’ signal attenuation has advanced significantly and can potentially offer new practical information in real-time [36,37]. Fog can also be an important source of water, especially in desert areas, where fog-harvesting techniques can help to utilize the available condensed humidity for sustaining agriculture and ensure an additional resource for water supply [38,39]. Climate change processes are already affecting the occurrence of fog in specific locations, with implications for water availability in the biosphere [40]. Thus, it is obvious that fog monitoring and fog prediction have substantial importance for short-term and long-term applications.
From the results we presented, it appears that the sensitivity of the ambient atmospheric electric field (PG) to the presence of fog droplets, even at the haze stage before reaching saturation and a relative humidity of 100%, may offer another tool for fog monitoring, in support of, and not as replacement for, additional modern technologies such as lidar [41], satellite imagery in various spectral bands [42,43], and advanced image-analysis algorithms for evaluating visibility [44,45]. Each of the abovementioned technologies has advantages but also limitations, as they require computational resources that are not always available in real-time and rely on satellite overpasses and sensor resolution. As for electric field monitoring, by closely tracking the changes in the intensity and rate of change (time derivative) of the electric field relative to the fair weather values, along with other meteorological parameters at a specific location, the onset and termination times of fog can be precisely monitored. Thus, routine electric field monitoring in fog-prone areas near sensitive infrastructures, such as harbors and airports, or even at sea (where fog is known to be extremely hazardous for marine traffic), may offer an additional, useful parameter, which has, to date, been disregarded from a practical standpoint. Its technical requirements are simpler compared with visibility measuring equipment such as lidar, and quite a few commercial solutions are already available [30]. Long-term measurements of the fair weather field in such locations will be used to consolidate a benchmark pattern of the electric field and its response to local factors, such as urban pollution, and to global ones (e.g., continental-scale lightning activity), upon which the deviations caused by foggy conditions can be easily identified and alerted for.

Author Contributions

Conceptualization, Y.Y.; formal analysis, R.Y.; data curation, R.Y.; writing—original draft, Y.Y.; supervision, Y.Y.; project administration, Y.Y. All authors have read and agreed to the published version of the manuscript.

Funding

This research was funded by the Israeli Science Foundation (ISF) grant 1848/20.

Data Availability Statement

Potential Gradient data is publicly available on the GloCAEM website: https://catalogue.ceda.ac.uk/uuid/6ee6e0a3f57c4ca79e8cbc0daaafe76f (accessed on 1 March 2023); Meteorological data for the Wise Observatory will be made available on request.

Acknowledgments

We wish to thank Sami Ben-Gigi from Tel-Aviv University’s Wise Observatory, for his help in hosting and supporting our instruments.

Conflicts of Interest

The authors declare no conflict of interest.

References

  1. Harrison, R.G. The Carnegie Curve. Surv. Geophys. 2013, 34, 209–232. [Google Scholar] [CrossRef] [Green Version]
  2. Harrison, R.G.; Carslaw, K.S. Ion-aerosol-cloud processes in the lower atmosphere. Rev. Geophys. 2003, 41, 1012. [Google Scholar] [CrossRef]
  3. Harrison, R.G. Urban smoke concentrations at Kew, London, 1898-2004. Atmos. Environ. 2006, 40, 3327–3332. [Google Scholar] [CrossRef]
  4. Harrison, R.G. Fair weather atmospheric electricity. J. Phys. Conf. Ser. 2011, 301, 12001. [Google Scholar] [CrossRef]
  5. Rycroft, M.J.; Harrison, R.G.; Nicoll, K.A.; Mareev, E.A. An overview of Earth’s global electric circuit and atmospheric conductivity. Sp. Sci. Rev. 2008, 137, 83–105. [Google Scholar] [CrossRef]
  6. Rycroft, M.J.; Nicoll, K.A.; Aplin, K.L.; Harrison, R.G. Recent advances in global electric circuit coupling between the space environment and the troposphere. J. Atmos. Solar-Terrestrial Phys. 2012, 90–91, 198–211. [Google Scholar] [CrossRef] [Green Version]
  7. Aplin, K.L. Smoke emissions from industrial western Scotland in 1859 inferred from Lord Kelvin’s atmospheric electricity measurements. Atmos. Environ. 2012, 50, 373–376. [Google Scholar] [CrossRef]
  8. Mach, D.M.; Blakeslee, R.; Bateman, M.G. Global electric circuit implications of combined aircraft storm electric current measurements and satellite-based diurnal lightning statistics. J. Geophys. Res. Atmos. 2011, 116, D05201. [Google Scholar] [CrossRef] [Green Version]
  9. Kourtidis, K.; André, K.S.; Karagioras, A.; Nita, I.A.; Sátori, G.; Bór, J.; Kastelis, N. The influence of circulation weather types on the exposure of the biosphere to atmospheric electric fields. Int. J. Biometeorol. 2021, 65, 93–105. [Google Scholar] [CrossRef]
  10. Yaniv, R.; Yair, Y.; Price, C.; Katz, S. Local and global impacts on the fair-weather electric field in Israel. Atmos. Res. 2016, 172–173, 119–125. [Google Scholar] [CrossRef]
  11. Yaniv, R.; Yair, Y.; Price, C.; Mkrtchyan, H.; Lynn, B.; Reymers, A. Ground-based measurements of the vertical E-field in mountainous regions and the “Austausch” effect. Atmos. Res. 2017, 189, 127–133. [Google Scholar] [CrossRef]
  12. Afreen, S.; Victor, N.J.; Nazir, S.; Siingh, D.; Bashir, G.; Ahmad, N.; Ahmad, S.J.; Singh, R.P. Fair-weather atmospheric electric field measurements at Gulmarg, India. J. Earth Syst. Sci. 2021, 131, 7. [Google Scholar] [CrossRef]
  13. Karagioras, A.; Kourtidis, K. A Study of the Effects of Rain, Snow and Hail on the Atmospheric Electric Field near Ground. Atmosphere 2021, 12, 996. [Google Scholar] [CrossRef]
  14. Ronayne, T. XVIII. A letter from Thomas Ronayne, Esq; to Benjamin Franklin, LL. DFRS inclosing an account of some observations on atmospherical electricity; in regard of fogs, mists &c. with some remarks; communicated by Mr. William Henley. Phil. Tran. Roy. Soc. Lond. 1772, 62, 137–146. [Google Scholar]
  15. Anisimov, S.; Mareev, E.; Shikhova, N.; Sorokin, A.; Dmitriev, E. On the electro–dynamical characteristics of the fog. Atmos. Res. 2005, 76, 16–28. [Google Scholar] [CrossRef]
  16. Bennett, A.; Harrison, R. Evidence for global circuit current flow through water droplet layers. J. Atmos. Sol. Terr. Phys. 2009, 71, 1219–1221. [Google Scholar] [CrossRef]
  17. Lucas, G.M.; Thayer, J.P.; Deierling, W. Statistical analysis of spatial and temporal variations in atmospheric electric fields from a regional array of field mills. J. Geophys. Res. Atmos. 2017, 122, 1158–1174. [Google Scholar] [CrossRef]
  18. Price, J. Radiation Fog. Part I: Observations of Stability and Drop Size Distributions. Boundary-Layer Meteorol. 2011, 139, 167–191. [Google Scholar] [CrossRef]
  19. Goldreich, Y. The Climate of Israel: Observation, Research and Application; Springer: New York, NY, USA, 2003; 270p. [Google Scholar]
  20. Levi, W.M. Fog in Israel. Isr. J. Earth Sci. 1967, 16, 7–21. [Google Scholar]
  21. David, N.; Rayitsfeld, A.; Gao, H.O. Analyzing 50 years of major fog events across the central coastal plain of Israel. arXiv 2021, arXiv:2009.05113. [Google Scholar] [CrossRef]
  22. Ronen, A.; Tzadok, T.; Rostkier-Edelstein, D.; Agassi, E. Fog Measurements with IR Whole Sky Imager and Doppler Lidar, Combined with In Situ Instruments. Remote. Sens. 2021, 13, 3320. [Google Scholar] [CrossRef]
  23. Kidron, G.J. Altitude dependent dew and fog in the Negev Desert, Israel. Agric. For. Meteorol. 1999, 96, 1–8. [Google Scholar] [CrossRef]
  24. Kidron, G.J. Analysis of dew precipitation in three habitats within a small arid drainage basin, Negev Highlands, Israel. Atmos. Res. 2000, 55, 257–270. [Google Scholar] [CrossRef]
  25. Roach, W.T.; Brown, R.; Caughey, S.J.; Garland, J.A.; Readings, C.J. The physics of radiation fog: I—A field study. Q. J. R. Meteorol. Soc. 1976, 102, 313–333. [Google Scholar] [CrossRef]
  26. Hůnová, I.; Brabec, M.; Malý, M.; Dumitrescu, A.; Geletič, J. Terrain and its effects on fog occurrence. Sci. Total. Environ. 2021, 768, 144359. [Google Scholar] [CrossRef] [PubMed]
  27. Katz, S.; Yair, Y.; Price, C.; Yaniv, R.; Silber, I.; Lynn, B.; Ziv, B. Electrical properties of the 8–12th September, 2015 massive dust outbreak over the Levant. Atmos. Res. 2018, 201, 218–225. [Google Scholar] [CrossRef]
  28. Yaniv, R.; Yair, Y. Electric Field Variations Caused by Low, Middle and High-Altitude Clouds over the Negev Desert, Israel. Atmosphere 2022, 13, 1331. [Google Scholar] [CrossRef]
  29. Yair, Y.; Katz, S.; Yaniv, R.; Ziv, B.; CPrice, C. An electrified dust storm over the Negev desert. Israel. Atmos. Res. 2016, 181, 63–71. [Google Scholar] [CrossRef]
  30. Nicoll, K.; Harrison, R.; Barta, V.; Bor, J.; Brugge, R.; Chillingarian, A.; Chum, J.; Georgoulias, A.; Guha, A.; Kourtidis, K.; et al. A global atmospheric electricity monitoring network for climate and geophysical research. J. Atmos. Sol. Terr. Phys. 2019, 184, 18–29. [Google Scholar] [CrossRef]
  31. Harrison, R.G.; Usoskin, I. Solar modulation in surface atmospheric electricity. J. Atmos. Sol. Terr. Phys. 2020, 72, 176–182. [Google Scholar] [CrossRef] [Green Version]
  32. Harrison, R.G.; Aplin, K. Mid-nineteenth century concentrations of smoke near London. Atmos. Environ. 2002, 36, 4037–4043. [Google Scholar] [CrossRef]
  33. Bartok, J.; Bott, A.; Gera, M. Fog Prediction for Road Traffic Safety in a Coastal Desert Region. Bound. Layer Meteorol. 2012, 145, 485–506. [Google Scholar] [CrossRef]
  34. Jayakumar, A.; Rajagopal, E.N.; Boutle, I.A.; George, J.P.; Mohandas, S.; Webster, S.; Aditi, S. An operational fog prediction system for Delhi using the 330 m Unified Model. Atmos. Sci. Lett. 2018, 19, e796. [Google Scholar] [CrossRef] [Green Version]
  35. Pithani, P.; Ghude, S.D.; Chennu, V.N.; Kulkarni, R.G.; Steeneveld, G.-J.; Sharma, A.; Prabhakaran, T.; Chate, D.M.; Gultepe, I.; Jenamani, R.K.; et al. WRF Model Prediction of a Dense Fog Event Occurred During the Winter Fog Experiment (WIFEX). Pure Appl. Geophys. 2019, 176, 1827–1846. [Google Scholar] [CrossRef]
  36. David, N.; Alpert, P.; Messer, H. Novel method for fog monitoring using cellular networks infrastructures. Atmos. Meas. Tech. Discuss. 2012, 5, 5725–5752. [Google Scholar] [CrossRef]
  37. David, N.; Sendik, O.; Messer, H.; Alpert, P. Cellular Network Infrastructure: The Future of Fog Monitoring? Bull. Am. Meteorol. Soc. 2015, 96, 1687–1698. [Google Scholar] [CrossRef]
  38. Domen, J.K.; Stringfellow, W.T.; Camarillo, M.K.; Gulati, S. Fog water as an alternative and sustainable water resource. Clean Technol. Environ. Policy 2014, 16, 235–249. [Google Scholar] [CrossRef]
  39. Bhushan, B. Design of water harvesting towers and projections for water collection from fog and condensation. Philos. Trans. R. Soc. A 2020, 378, 20190440. [Google Scholar] [CrossRef]
  40. LaDochy, S.; Witiw, M. The Continued Reduction in Dense Fog in the Southern California Region: Possible Causes. Pure Appl. Geophys. 2012, 169, 1157–1163. [Google Scholar] [CrossRef]
  41. Miclea, R.-C.; Dughir, C.; Alexa, F.; Sandru, F.; Silea, I. Laser and LIDAR in A System for Visibility Distance Estimation in Fog Conditions. Sensors 2020, 20, 6322. [Google Scholar] [CrossRef]
  42. Wilcox, E.M. Multi-spectral Remote Sensing of Sea Fog with Simultaneous Passive Infrared and Microwave Sensors. In Marine Fog: Challenges and Advancements in Observations, Modeling, and Forecasting; Koračin, D., Dorman, C., Eds.; Springer Atmospheric Sciences; Springer: Cham, Switzerland, 2017. [Google Scholar] [CrossRef]
  43. Li, T.; Jin, W.; Fu, R.; He, C. Daytime sea fog monitoring using multimodal self-supervised learning with band attention mechanism. Neural Comput. Appl. 2022, 34, 21205–21222. [Google Scholar] [CrossRef]
  44. Liu, Z.; He, Y.; Wang, C.; Song, R. Analysis of the Influence of Foggy Weather Environment on the Detection Effect of Machine Vision Obstacles. Sensors 2020, 20, 349. [Google Scholar] [CrossRef] [Green Version]
  45. Heo, K.-Y.; Park, S.; Ha, K.-J.; Shim, J.-S. Algorithm for sea fog monitoring with the use of information technologies. Meteorol. Appl. 2014, 21, 350–359. [Google Scholar] [CrossRef]
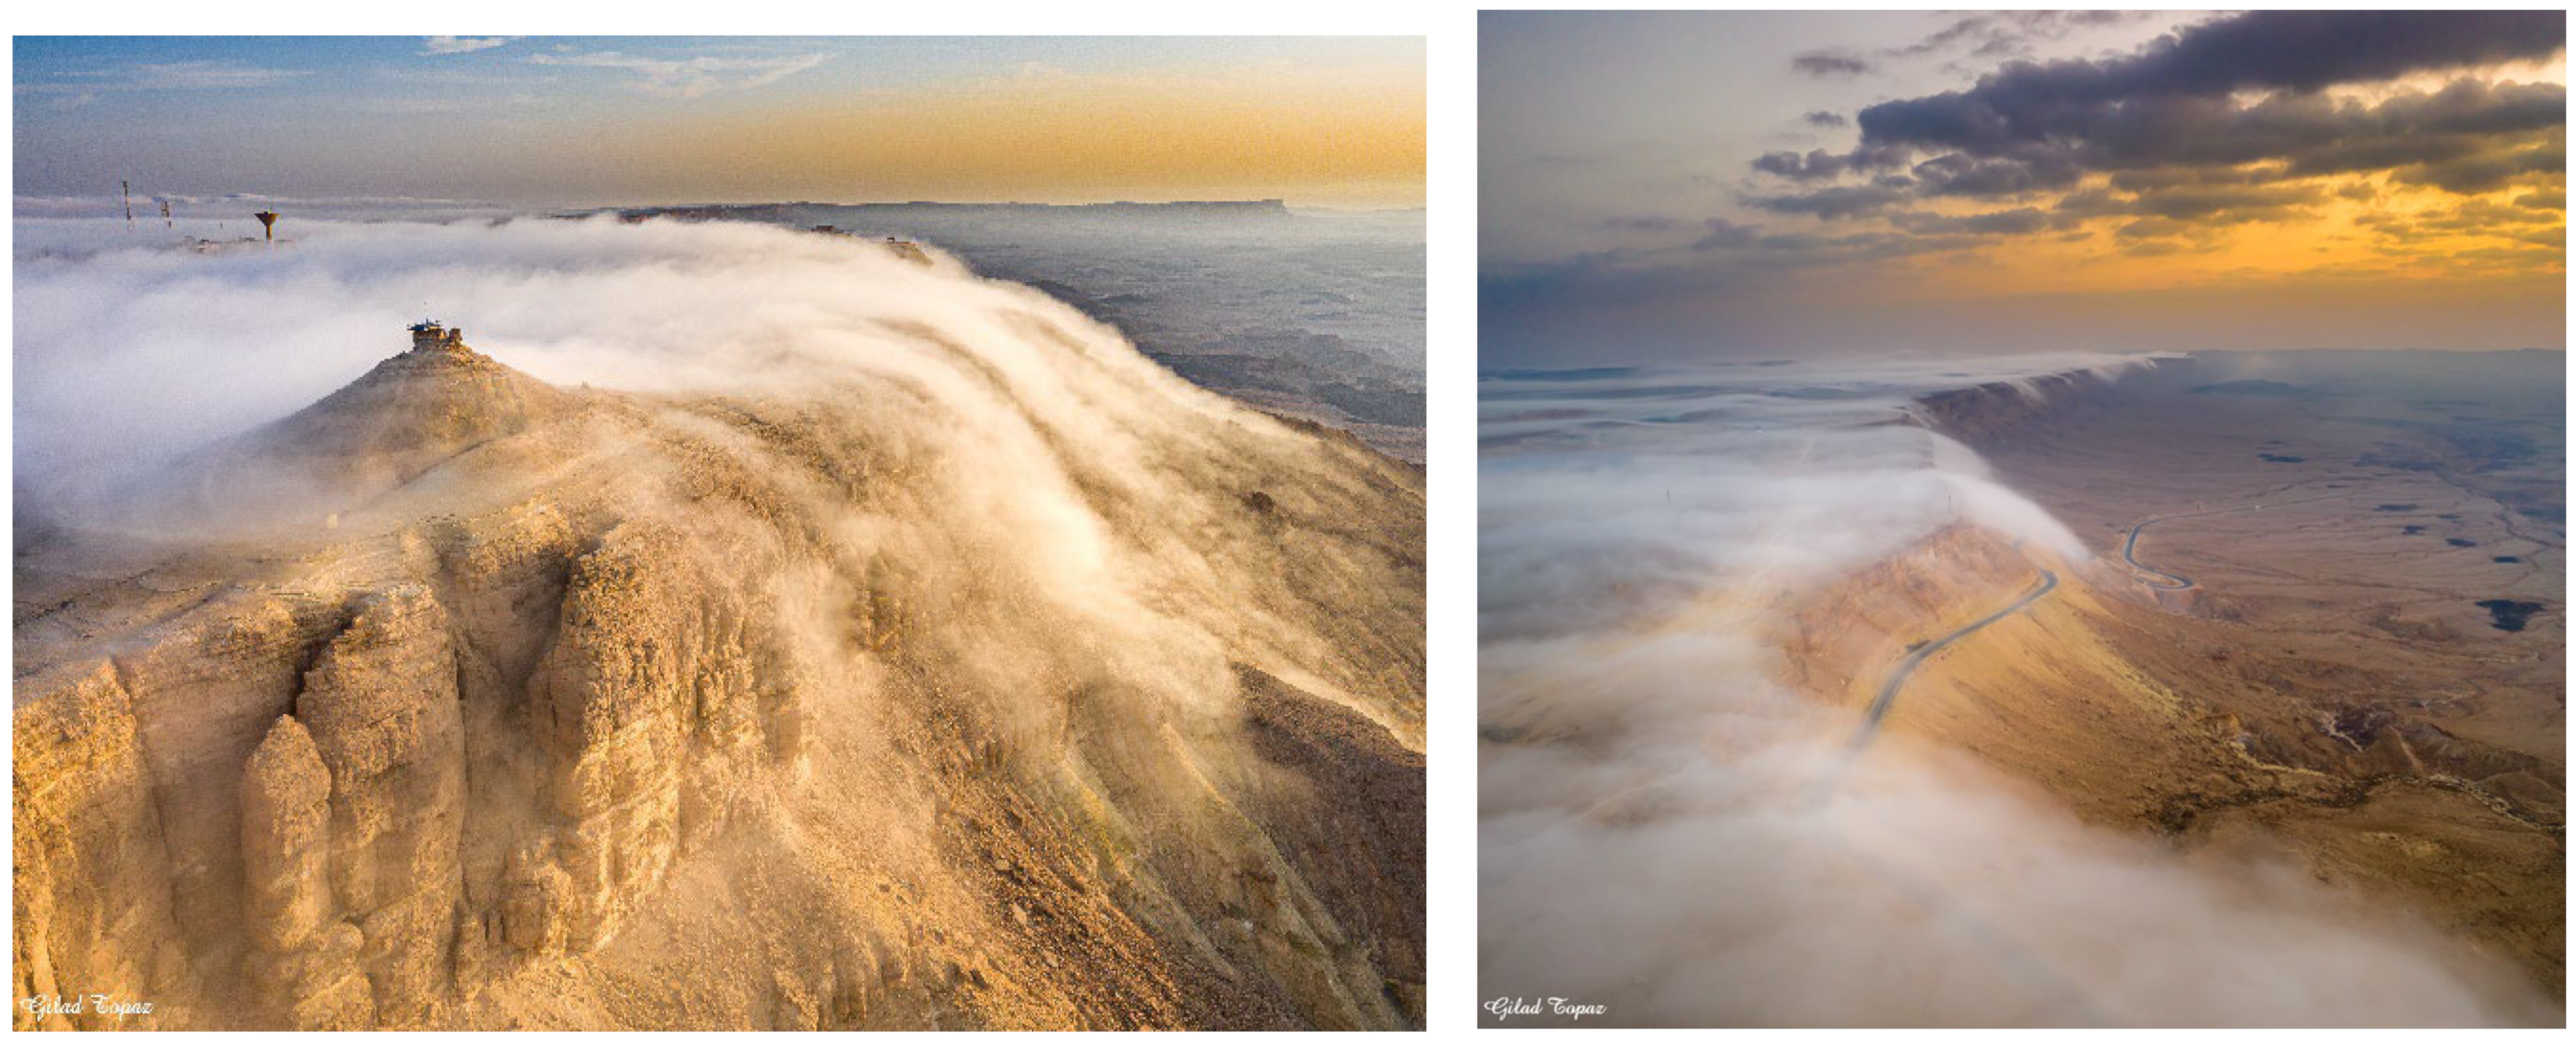
Figure 1. Images of radiation fog near the city Mitzpe Ramon in the Negev Highland Desert, Israel. The fog dissipates as it is carried down the cliffs of the Ramon Crater. Two cases depict the beauty of this phenomenon: (left) 11 October 2019 (right) 20 November 2020. Courtesy of Gilad Topaz (https://www.instagram.com/giladdrone/, accessed on 11 September 2022).
Atmosphere 14 00549 g001
Figure 2. The 15 November 2016 fog case study. Hourly values of humidity (top left), wind speed (top right), full day PG (bottom left), and the hourly values of the PG between 5:00–11:00 local time (bottom right). The vertical black line marks the timing of sunrise at 6:07 LT.
Atmosphere 14 00549 g002aAtmosphere 14 00549 g002b
Figure 3. Time dependence of the potential gradient and the relative humidity for the period 04:00–10:00 local time, on 15 November 2016. Note the decrease in PG that precedes the actual dissipation of fog, manifested by the rapid decrease in relative humidity.
Atmosphere 14 00549 g003
Figure 4. Data for the 8 November 2015 fog case study. Hourly values of relative humidity (top left), wind speed (top right), daily PG (bottom left), and hourly 5:00–11:00 PG (bottom right). The vertical black line is sunrise time 6:00 LT.
Atmosphere 14 00549 g004
Figure 5. Time dependence of the potential gradient (red) and the relative humidity (blue) for the period 04:00–10:00 local time, on 8 November 2015. Note the decrease in PG that precedes the actual dissipation of fog, manifested by the rapid reduction in relative humidity.
Atmosphere 14 00549 g005
Figure 6. Data for the 11 November 2016 fog case study. Hourly values of relative humidity (top left), wind speed (top right), daily PG (bottom left), and hourly 5:00–11:00 PG (bottom right). The vertical black line is the sunrise time 06:03 LT.
Atmosphere 14 00549 g006aAtmosphere 14 00549 g006b
Figure 7. Time dependence of the potential gradient and the relative humidity for the period 04:00–10:00 local time, on 11 November 2016. Note the decrease in PG that precedes the actual dissipation of fog, manifested by the rapid decrease in relative humidity.
Atmosphere 14 00549 g007
Figure 8. The AERONET mean AOD [nm] values for the different fog case studies and fair weather values obtained by Yaniv et al. (2016). FW stands for fair weather.
Atmosphere 14 00549 g008
Table 1. Five case studies on the effect of radiation fog on measured PG during 6:00–9:00. FW stands for fair weather.
DateMax Humidity Value [%]Wind Speed Range (m s−1)Mean Monthly FW PG (V m−1)Maximum Measured PG (V m−1)∆PG from FW Values to Diurnal Mean (V m−1)Aeronet
Value vs. FW
18 November 2015 97 2–5180431251FW
211 November 201696 0.5–3.5180614434FW
315 November 2016 96 0–3180733553FW
410 September 2017970–4190686496N/A
510 October 2019954–6185320135FW
Disclaimer/Publisher’s Note: The statements, opinions and data contained in all publications are solely those of the individual author(s) and contributor(s) and not of MDPI and/or the editor(s). MDPI and/or the editor(s) disclaim responsibility for any injury to people or property resulting from any ideas, methods, instructions or products referred to in the content.