Article

Diurnal Variation in Concentration of Culturable Bacterial and Fungal Bioaerosols in Winter to Spring Season

1
Aerosol and Bioengineering Laboratory, College of Engineering, Konkuk University, 120 Neungdong-ro, Gwangjin-gu, Seoul 05029, Republic of Korea
2
School of Mechanical Engineering, Chonnam National University, 77 Yongbong-ro, Buk-gu, Gwangju 61186, Republic of Korea
*
Author to whom correspondence should be addressed.
Atmosphere 2023, 14(3), 537; https://doi.org/10.3390/atmos14030537
Submission received: 10 January 2023 / Revised: 24 February 2023 / Accepted: 9 March 2023 / Published: 11 March 2023
(This article belongs to the Special Issue Bioaerosol Composition and Measurement)

Abstract

:
Diurnal variations in the concentrations of culturable fungal and bacterial bioaerosols were measured during winter and spring. Significant variations in concentrations of bacterial bioaerosols were observed during the day in this measurement campaign. The bacterial bioaerosol concentration exhibited two peaks during the morning and evening periods in the winter season. Diurnal variation in bacterial bioaerosols was greater in spring than that in winter. However, fungal bioaerosol concentrations were not affected by diurnal and seasonal changes. Environmental properties such as temperature, relative humidity, and ultraviolet irradiation intensity were measured, and their relationship with bioaerosol concentrations was analyzed. The surrounding temperature was suspected as a significant factor. This diurnal variation in culturable bioaerosols can explain various public health phenomena. Variations in the concentrations of non-biological aerosol particles were also analyzed.

1. Introduction

Bioaerosols are particles of biological origin, including bacteria, fungi, viruses, and pollen. Their sources can be plants, animals, soil, water, and waste products of living organisms [1,2]. Bioaerosols can constitute 5–80% of ambient aerosol particles [3]. Exposure to outdoor bioaerosols can cause adverse health effects on humans. Outdoor airborne allergens, such as pollen and fungal spore, have been associated with respiratory allergies and asthma [4,5]. Neas et al. showed that outdoor airborne fungal spores such as Cladosporium and Epicoccum were associated with respiratory symptoms and a peak expiratory flow rates in children [6]. Daels et al. also reported that outdoor aeroallergens are an important cause of severe asthma morbidity by comparing daily asthma hospitalization rates and daily aeroallergen concentration in Canada [7]. Outdoor bacterial bioaerosols are often associated with agriculture because of their deposition on plant leaves and stem surfaces [8,9]. Thus, studies of outdoor bioaerosol concentrations are vital for preventing and controlling respiratory diseases.
The concentration of outdoor bioaerosols also affects that of indoor bioaerosols. Previous studies investigating the relationship between indoor and outdoor bioaerosol concentrations have reported that indoor air quality generally follows outdoor air quality [10,11,12]. Shelton et al. simultaneously investigated both indoor and outdoor fungal bioaerosols in 1717 buildings and reported that the ratio of the concentration of indoor fungal bioaerosols to the concentration of outdoor fungal bioaerosols remained fairly constant in all seasons, supporting the finding that outdoor bioaerosol concentrations have an important effect on indoor bioaerosol concentrations [13].
In addition, outdoor bioaerosols can be transported through thousands of kilometers due to their small size of 0.3 to 100 μm, allowing these particles to remain airborne for several weeks [14]. In Korea, during the Yellow Sand phenomena, the bacterial bioaerosol concentration increased by approximately four times compared to usual concentration, suggesting long-range transmission of bioaerosols [15]. Similar results have been reported for Turkey, Israel, and West Africa [16,17,18].
Despite the demonstrated importance of outdoor bioaerosols, most bioaerosol research has focused on indoor environments. Although bioaerosol research has increased recently, studies on outdoor bioaerosols are still lacking [8].
The concentrations of outdoor bioaerosols are affected by environmental factors such as surrounding vegetation [19], human activity [20], and air pollution [21]. Furthermore, seasonal variations influence the concentrations of bacterial bioaerosols, which are higher in summer and autumn than in winter [22,23,24,25]. However, in East Asia, little attention has been paid to the timing of changes in the concentration of outdoor bioaerosols. Seasonal variations in outdoor bioaerosols have been reported in some cities including Harbin [26], Beijing [27,28], and Seoul [29]. In particular, few studies have been conducted on the changes in concentration of outdoor bioaerosols caused by diurnal variation in East Asia. Verma et al. (2021) reported the diurnal distribution of airborne sucrose (pollen tracer) in Beijing, but this was not a study related to the concentration of outdoor bioaerosols [28]. Fang et al. (2007) investigated the variation patterns of airborne bacteria in Beijing, China [30]; however, they focused only on bacterial bioaerosols and only for a single day. Yang et al. (2021) investigated the diurnal variation in outdoor bioaerosol concentrations during the autumn and winter seasons (seven sampling days in both autumn and winter) but measured only in the morning (08:30) and at night (18:00 and 21:30) [31]. Long-term measurements of the diurnal distribution of bioaerosol concentrations have only been conducted under limited conditions in India [32], Egypt [33] and the USA [34].
In this study, we aim to confirm diurnal effect on variation of culturable bacterial and fungal bioaerosol concentration, which can vary throughout the day from morning to night. We measured and analyzed diurnal variations in culturable bacterial and fungal bioaerosols in ambient air environments in the Seoul metropolitan area, Republic of Korea. To understand the relationship between non-biological particle and bioaerosols, we also measured the concentration of particulate matter (PM).

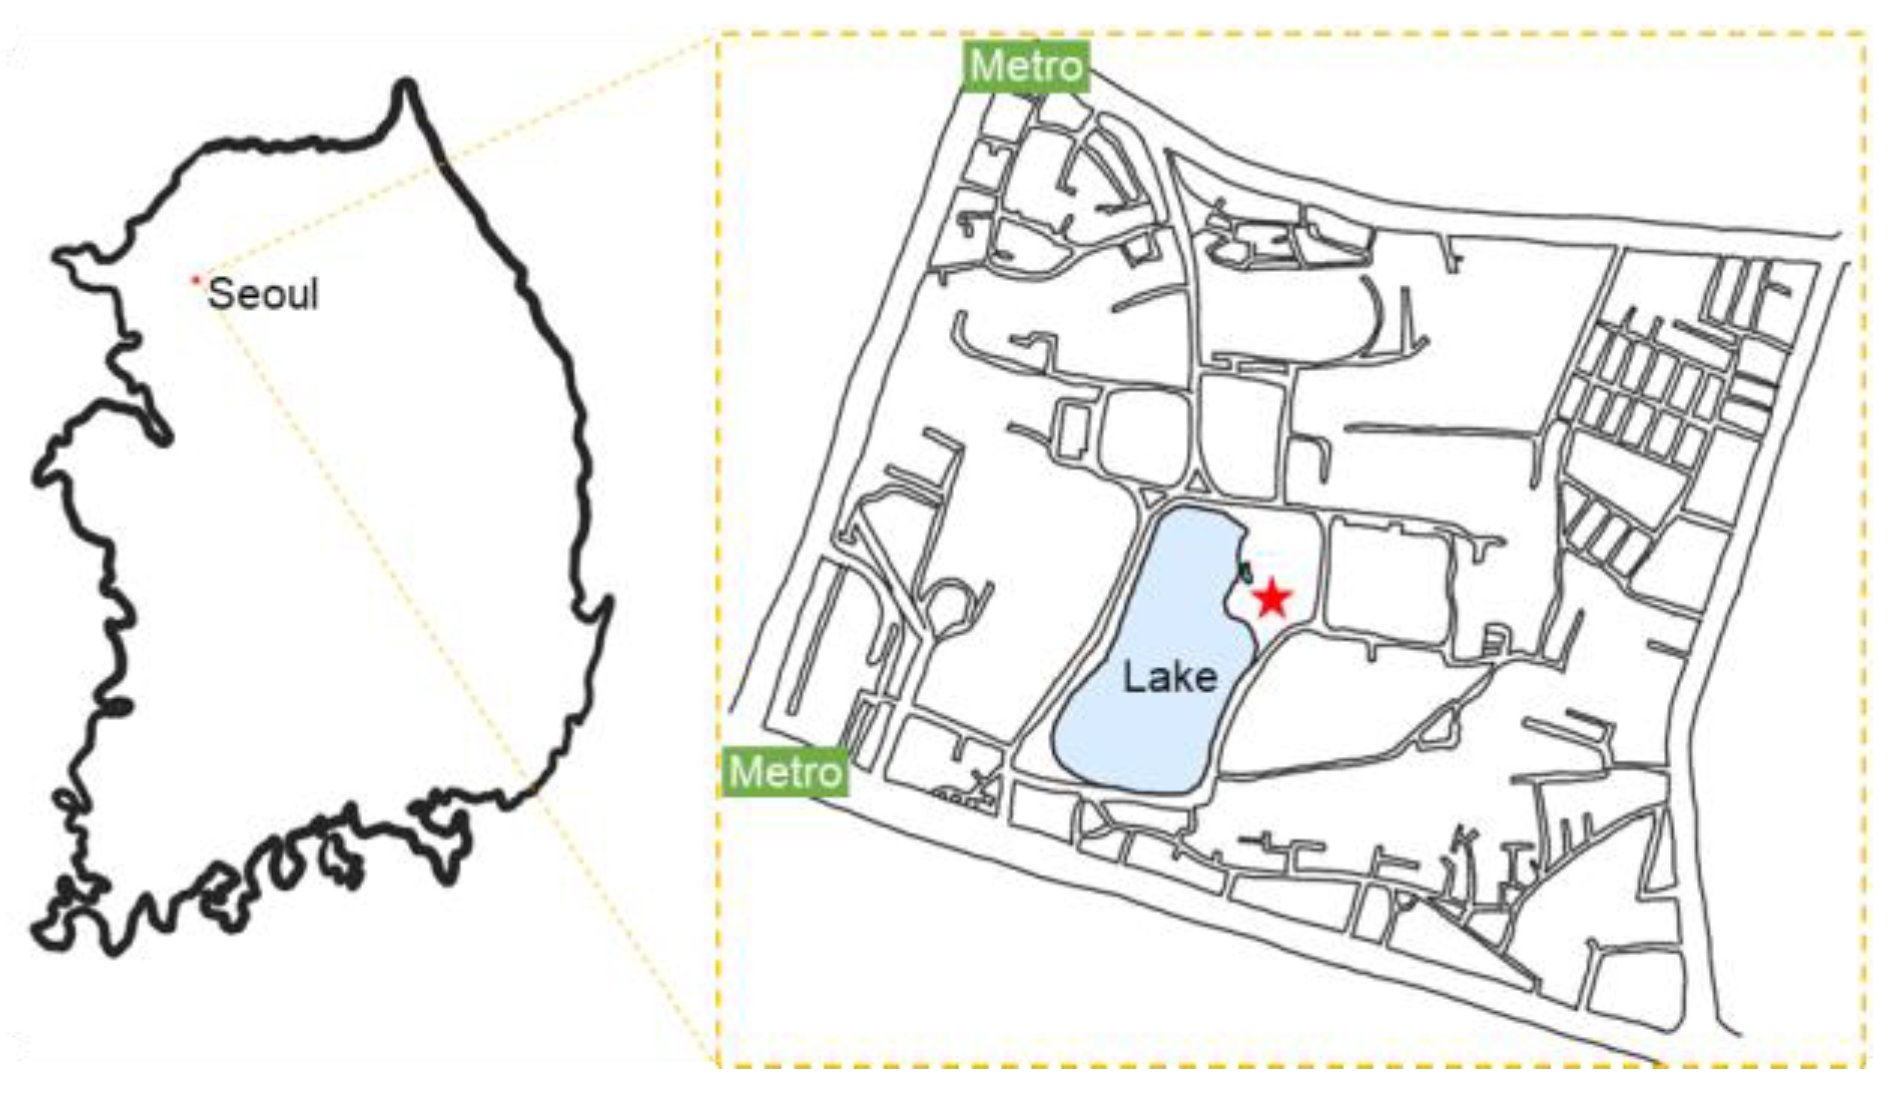
2. Materials and Methods

We measured diurnal variations in culturable bioaerosol concentrations in the Seoul metropolitan area. Figure 1 shows the location of bioaerosol sampling place, which is highly populated and through which more than 10,000 people are estimated to pass each day. Bioaerosol sampling experiments were conducted from January 2016 to May 2016 to observe seasonal transition effects from winter to summer.
In the measurement, a Buck Bio-Culture (Model B30120, A.P. Buck, Inc., Orlando, FL, USA) was used to sample bioaerosols. This multi-jet impactor-type sampler has been used to collect culturable bioaerosols in indoor and outdoor bioaerosol sampling environments [35,36,37,38]. In the Bio-Culture, the sampled air flow is accelerated by passing the air through 400 nozzles, and bacterial and fungal bioaerosols in the sampled air flow were deposited onto petri-culture plates inside the device (via their inertial deviation from the streamline). Airflow was driven by an internal vacuum pump in the device at a flow rate of 100 L/min. The airflow sampling time was adjusted between 1 and 2 min per sample based on the bioaerosol concentration. At least three replicative measurements were conducted for each experiment. The sampling location was 140 cm above the ground surface. Other surrounding environmental parameters, including the temperature, relative humidity, and ultraviolet (UV) radiation intensity, were measured simultaneously at the sampling locations [39].
Nutrient agar (0.3% beef extract, 0.5% peptone, and 15% agar; Difco, Detroit, MI, USA; 50 mL agar per 90 × 15 mm petri dish) plates were used in the Bio-Culture to sample culturable bacterial bioaerosols. These bacterial aerosols were incubated at 37 °C for 24 h. The number of colonies was counted, and the concentration of culturable bacterial bioaerosols was determined.
For fungal bioaerosols, malt extract agar plates (12.75% maltose, 2.75% dextrin, 2.35% glycerol, 0.75% peptone, and 15% agar; Difco; 50 mL agar per 90 × 15 mm petri dish) were used. The sampled fungal bioaerosols were incubated at 25 °C for 48 h before enumeration.
The number of colony-forming units (CFUs) on the agar plates after incubation was converted to the expected number of collecting microorganisms using a positive-hole correction method applied to adjust for the collection of multiple particles through a single hole in the 400-hole impactor. After that, all expected numbers of CFU corrected for coincidence were converted to concentrations of bioaerosols in the volume of air sampled expressed in units of CFU/m3.
Furthermore, the concentration of non-biological PM was measured through a portable particle counter (Model 3905, KANOMAX, Inc., Andover, NJ, USA) by using the optical particle counting method to investigate any relevance of aerosol particles to culturable bioaerosol concentrations.

3. Results and Discussion

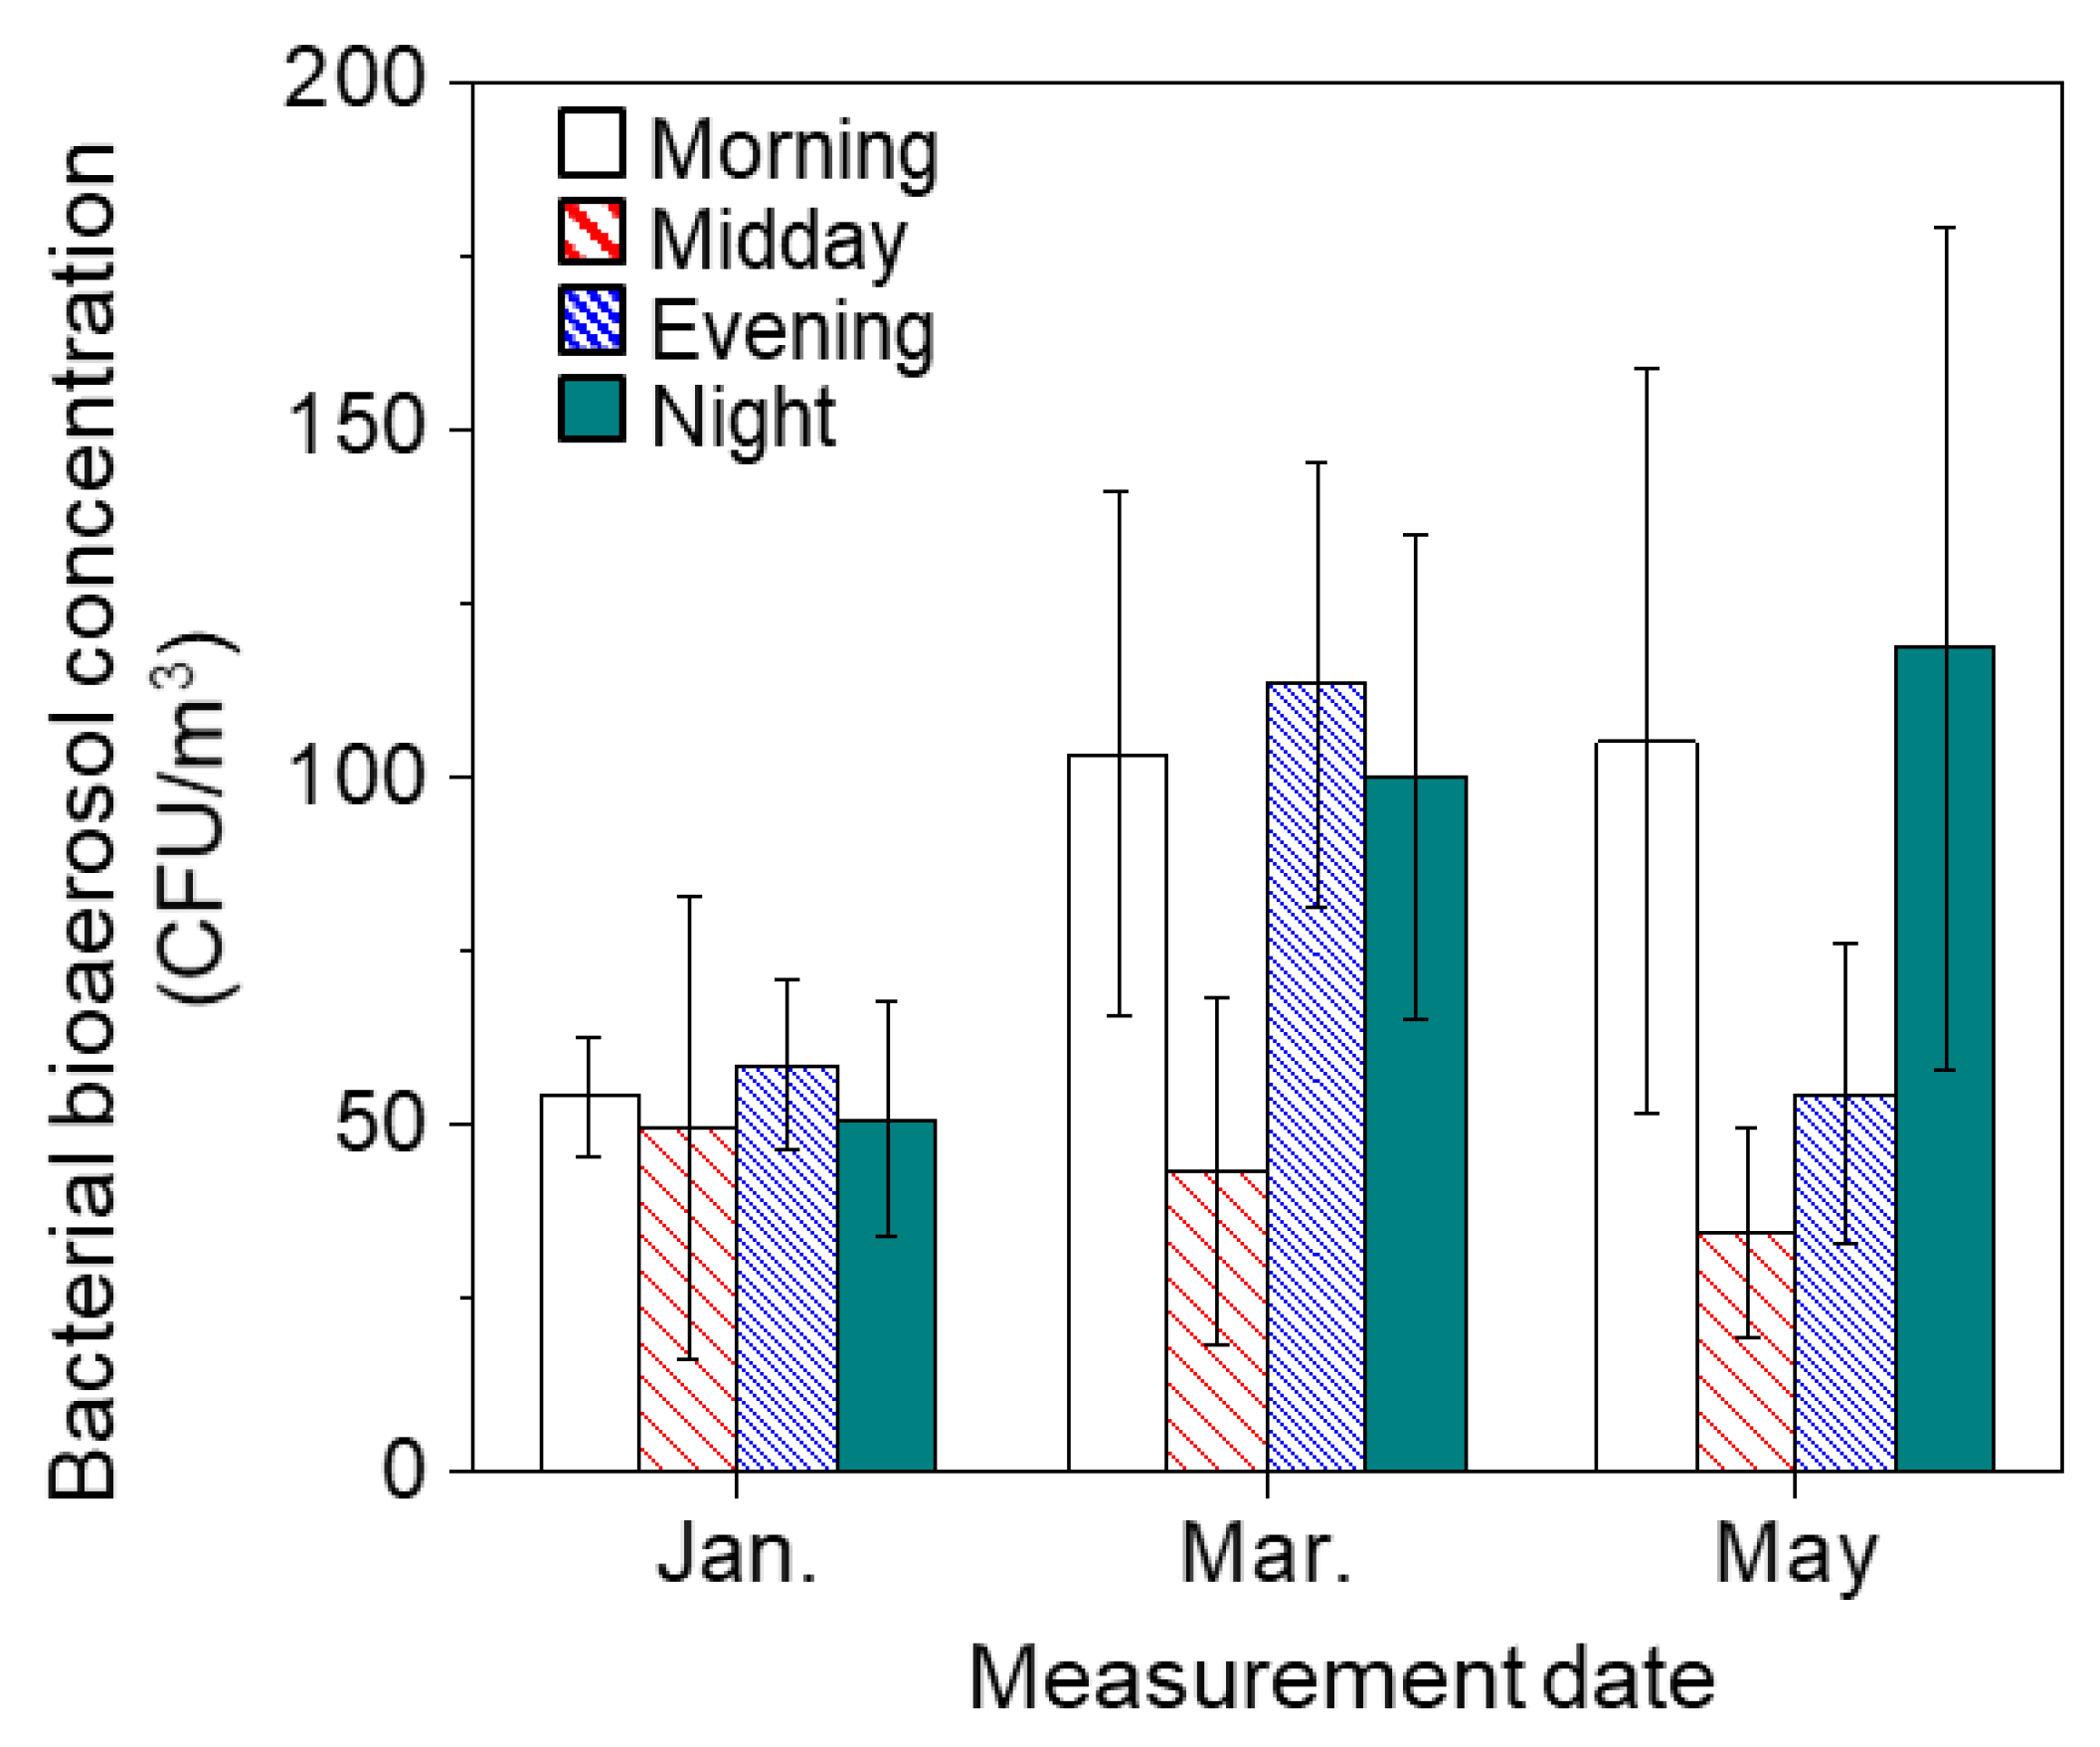
3.1. Diurnal Variation in Culturable Bacterial Bioaerosol Concentrations from Winter to Spring

We measured bacterial bioaerosol concentration from January to May (Table 1). Bacterial bioaerosol concentrations ranged from 20 to 180 CFU/m3. Diurnal variation in bacterial bioaerosols was determined at four time points: (1) morning (09:00), (2) midday (13:00), (3) evening (17:00), and (4) night (21:00).
In addition, except for 16 March and 18 May, the lowest concentration of bacterial bioaerosols was measured at midday. This decrease in the concentration of bioaerosols was consistent with the results of a previous study measuring diurnal distribution of bioaerosols [12]. The decrease in concentration at midday may be attributed to sun irradiation. As shown in Table 2, a higher temperature, more intensive solar radiation, and lower relative humidity occurred simultaneously at midday. These conditions impose potential stresses on the airborne microorganisms. Moreover, the radiation effect at midday was exacerbated by dehydration during the low relative humidity.
The bacterial bioaerosol concentration varied depending on the sampling time points. The average concentration of bacterial bioaerosols was significantly lower at midday (46.1 ± 18 CFU/m3) than at the morning peak (90.8 ± 44 CFU/m3) (p-value < 0.01).
The bacterial bioaerosol concentration increased by 1.9-fold from midday to evening (87.1 ± 57 CFU/m3) (p-value < 0.01). The decrease in temperature and solar radiation with increased human activity was considered as the primary cause of the evening peak. The results in this study are in accordance with the results reported by Fang et al. [30], who observed higher concentrations of airborne bacteria at 09:00 and 17:00 than those at 13:00. In the previous study, the reason for this peak was considered to be high levels of human activity and traffic flow. Another suspected reason for these peaks was that darkness and the increased humidity in the evening helped the physical repair of damaged bioaerosols by photoreactivation [12,40]. During the transition from evening to night, the concentration of bacterial bioaerosols decreased in 7 out of 14 measurements. However, half of the measurements were not decreased. In addition, the differences between evening and night (p-value = 0.28), night and morning (p-value = 0.36), and morning and evening (p-value = 0.18) were not statistically significant.
Figure 2 shows the normalized concentration of bacterial bioaerosols. Four types of patterns were observed: (1) bimodal distribution (morning and evening peaks) with the highest concentration in the morning, (2) bimodal distribution with the highest concentration in the evening, (3) unimodal with an evening peak, (4) unimodal with a night peak. However, a single peak pattern may exhibit a decrease in concentration at dawn and then increase again in the morning. Previous diurnal cycle measurement study has reported that the concentration of bioaerosols may increase in the morning when moisture from surfaces begins to evaporate at sunrise, which induces the evaporation of moisture from surface; the wind speed and temperature concurrently increases, and relative humidity decreases [41]. Thus, to determine the clear diurnal pattern of bacterial bioaerosols, further studies that involve more detailed measurements time between night and morning, including sunrise, are needed.
In January, three of four cases showed the highest bacterial bioaerosol concentration at evening, while May showed the highest concentrations in night in three out of four. Figure 3 shows that bacterial bioaerosol concentrations at night continuously increased from 58.7 ± 12 to 116.5 ± 10 CFU/m3 as the season changed from January to May. These results imply the possibility that the peak concentration shifted from evening to night according to the seasonal change from winter to spring. It may be due to the prolonged daylight hours (from sunrise to sunset) during seasonal transition, from a winter to spring-like climate (Table 3).
The seasonal change from winter to spring influenced the average concentration of bacterial bioaerosols. The concentration of bacterial bioaerosols was 51.1 ± 17, 101 ± 42, and 74.4 ± 52 CFU/m3 in January, March, and May, respectively. This result is consistent with the findings by Heo et al. [20], who showed that the bacterial bioaerosol concentration in Korea significantly increased during the transition from winter to spring. These results agree with those of Fang et al. [30] and Zhong et al. [42], who measured seasonal changes in the concentrations of bacterial bioaerosols in China and reported that the concentration of bacterial bioaerosols slightly increased during the seasonal transition from winter to summer. However, other measurement studies conducted in southern Taiwan show that higher winter concentrations are observed [43], indicating that the seasonal distribution may be attributed by geographic characteristics. It shows that it is necessary to measure and analyze the concentration of bioaerosols according to regional characteristics.

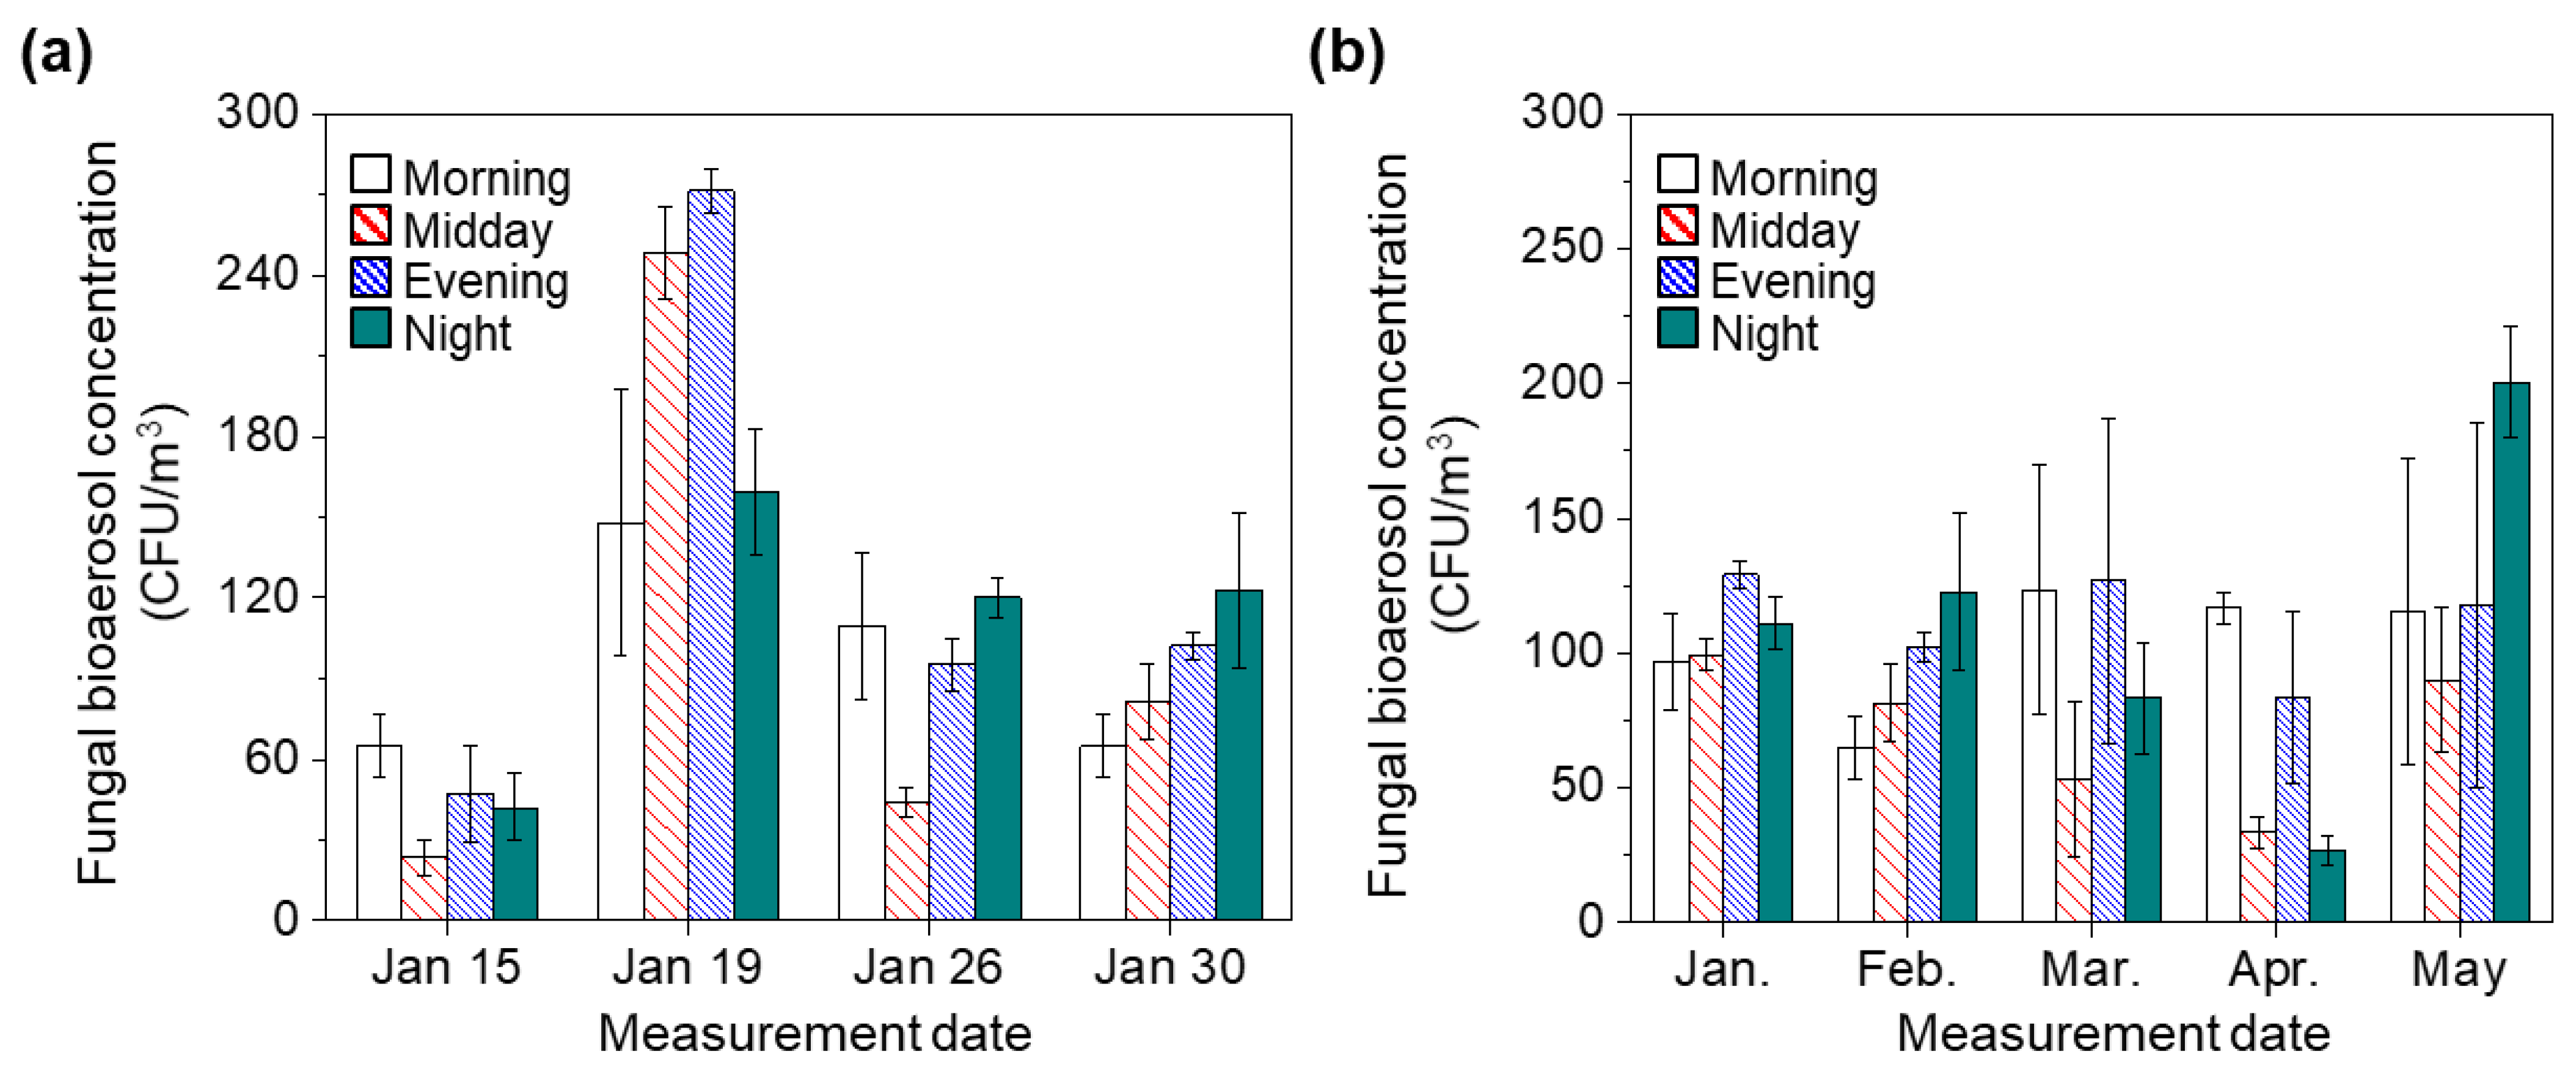
3.2. Diurnal Variations in Culturable Fungal Bioaerosol Concentrations from Winter to Spring

Figure 4a shows the diurnal distribution of concentrations of fungal bioaerosols in January. In January, the concentrations of fungal bioaerosols were higher than those of bacterial bioaerosols. Morning and evening peaks were observed only on 15 January, with an evening peak on 19 January and morning and night peaks on 26 January. No peak was observed on 30 January, as the concentrations continuously increased.
Figure 4b shows the diurnal distributions of fungal bioaerosol concentrations during seasonal changes from winter to spring. These distributions showed no trends during the seasonal change from spring to winter.
In January, the highest concentration was observed in the evening. No peak concentration was observed in February, as the values tended to increase gradually from morning to night. Morning and evening peaks in the concentrations were observed in March and April. At night, the peak concentration with the highest average fungal bioaerosol concentration, 200 ± 20.1 CFU/m3, was observed in May. These results indicate that the concentration of fungal bioaerosols was not influenced by diurnal or seasonal changes from winter to spring. Our findings are consistent with those of our previous study on the measurement of outdoor bioaerosol concentration outside a Seoul subway station showing that seasonal changes from spring to summer did not significantly influence the concentrations of fungal bioaerosols [29]. Although the seasonal change from winter to spring showed no effect on fungal bioaerosol concentrations in this measurement campaign, seasonal changes from summer to autumn or from autumn to winter may influence fungal bioaerosol concentrations. Several previous studies have reported that mean fungal concentration in autumn were higher than those in winter because of nutrient levels, plant growth, and favorable weather for spore production [12,44,45,46]. Therefore, further studies are needed to confirm diurnal and seasonal changes in outdoor fungal bioaerosols during autumn in Korea.

3.3. Meteorological Effects on Culturable Fungal and Bacterial Bioaerosol Concentrations

Figure 5a,b shows the bacterial and fungal bioaerosol concentrations as a function of temperature. The seasonal transition from winter to spring climate generally increased temperature from −15 °C to 39 °C, which appeared to be linked to the concentrations of bacterial bioaerosols. Under low-temperature conditions in winter, bacterial bioaerosol concentrations ranged from 8 to 98 CFU/m3, while bacterial bioaerosol concentrations were high (above 100 CFU/m3) at temperatures between 10 °C and 30 °C in spring. However, under same temperature (0~20 °C), according to seasonal changes from winter to spring, the concentrations of bacterial bioaerosols increased approximately twofold from 50.8 ± 21 CFU/m3 to 100 ± 40 CFU/m3 (t-test p-value < 0.01). In addition, at temperatures > 30 °C in spring, the concentrations of bacterial bioaerosols substantially decreased. These results show that the concentration of bacterial bioaerosols is predominantly affected by seasonal changes from winter to spring rather than the increase in temperature.
The trend in the concentrations of culturable fungal bioaerosols differed from those of culturable bacterial bioaerosols. Despite the fact that the concentration of fungal bioaerosols slightly increased from 75.4 ± 34 CFU/m3 to 85.0 ± 50 CFU/m3, these changes were not statistically different (t-test p-value > 0.05). High concentration peaks (>200 CFU/m3) of fungal bioaerosols were observed around −7 °C and 25 °C because of the characteristics of fungal spores. Fungal bioaerosols can be divided into two groups: Cladosporium species that prefer warm weather and basidiospores and ascospores that prefer cooler conditions [47,48]. These results indicate that bacterial and fungal bioaerosol concentrations are strongly influenced by temperature conditions, and bioaerosol concentrations are increased under conditions suitable for these organisms.
Figure 5c,d shows the bacterial and fungal bioaerosol concentrations as functions of relative humidity values. As the season changed from winter to spring, humidity levels changed from 45.4 ± 15% to 25.2 ± 10%, indicating that the weather conditions changed from damp to dry. High (>100 CFU/m3) and low (<50 CFU/m3) concentrations of bacterial bioaerosols were observed simultaneously at a relative humidity from 20% to 50%. However, the concentrations of bacterial bioaerosols were low (<50 CFU/m3) at a relative humidity > 50%. Under the same humidity conditions, the bacterial bioaerosol concentrations significantly varied depending on the measurement season (t-test p-value < 0.05). For example, within a narrow relative humidity range (35–45%), bacterial bioaerosol concentrations in winter and spring were 58.0 ± 17 CFU/m3 and 113 ± 42 CFU/m3 (t-test p-value < 0.01), respectively, suggesting that these concentrations depend on seasonal changes rather than on relative humidity.
The concentration of fungal bioaerosols widely varied, showing a value of up to 300 CFU/m3. High concentrations were observed at a relative humidity of 20–50%. In contrast to bacterial bioaerosols, seasonal changes did not affect fungal bioaerosol concentrations. These results indicate that humidity influences the concentrations of fungal bioaerosols under adequate humidity conditions for growth.
The effects of UV intensities in the ambient environments were analyzed, as illustrated in Figure 5e,f. The influence of UV radiation on microorganisms is well known [49]. However, in this study, except for the concentration of bacterial bioaerosols in spring, there was no clear correlation between the bioaerosol concentration and UV intensity (t-test p-value > 0.05) (Table 4 and Table 5). It is difficult to consider that the change in the concentration of bacterial bioaerosols in spring is due to UV intensity, given the low coefficient of determination (y = −20x + 120, R2 = 0.2126). Therefore, more extensive long-term measurements are needed to clearly determine the effects of meteorological parameters, including temperature, relative humidity, and UV intensity, on the concentrations of bacterial and fungal bioaerosols. In addition, despite the fact that wind speed and wind direction are one of the important meteorological variables, this research did not cover them, so further studies including variables related to this are also needed.

3.4. Diurnal Variation in Non-Biological Particulate Matter

We measured the diurnal variations in the concentrations of non-biological aerosol particles to evaluate the correlations between bioaerosols and non-biological PM. Figure 6a shows the particle number concentrations in terms of particle size ranges on 15 January. The number concentrations of non-biological PM were 5.25 × 10⁷ and 2.28 × 10³ particles/m3 for particles of 0.3–0.5 and >10.0 μm, respectively, in the morning. High number concentrations of small particles and low number concentrations of large particles were observed at other time points. The total number concentrations of non-biological PM on 15 January were 8.30 × 10⁷, 1.08 × 10⁸, 7.61 × 10⁷, and 7.00 × 10⁷ particles/m3 in the morning, midday, evening, and night measurements, respectively. Therefore, the concentration of non-biological PM exhibited peak concentrations at midday in January. However, PM concentration did not peak during midday in the other months, as shown in Figure 6b–f. Furthermore, the number concentrations of non-biological PM did not vary significantly during diurnal measurements in February and April. The particle number concentrations peaked in the morning in May; high concentrations of non-biological PM were related to traffic-related combustion emissions [50,51,52].

4. Conclusions

This study measured the diurnal distribution of culturable bacterial and fungal bioaerosol concentrations during the seasonal transition from winter to summer in Seoul, Korea. Bacterial bioaerosols showed diurnal variations during seasonal transitions from winter to spring. Bacterial bioaerosol concentrations showed patterns in diurnal variations. The lowest concentration of bacterial bioaerosols was observed at midday during all measurement campaigns. In winter, the concentration of bacterial bioaerosols showed a bimodal distribution with morning and evening peaks. According to the seasonal changes from winter to spring, the peak tended to shift from evening to night. This may be because of seasonal variation in sunset time. The relationship between temperature and the concentration of bacterial bioaerosols suggests that the seasonal warming has a positive effect on bacterial bioaerosol concentrations. As the UV intensity increased in spring, the bacterial bioaerosols decreased slightly, but no statistical significance was detected. The concentration of fungal bioaerosols was affected by temperature and humidity, whereas the diurnal patterns were not observed. In addition, we observed no significant diurnal change in non-biological PM concentration.
However, the current experimental results have several limitations. The measurement campaigns were conducted at only one site in Seoul, and only culturable bioaerosols were analyzed using one type of culture medium. Bioaerosol sampling was conducted using only one type of sampler. Sampling multiple areas assessing non-culturable bioaerosols cannot be covered in this study. In addition, the measurement campaigns were conducted only four times per day, and the measurement time excluded late night to morning, missing sunset time. These findings of diurnal variations in bioaerosol concentrations with seasonal transitions will be helpful guidelines for public health policies and air quality studies.

Author Contributions

Conceptualization, B.U.L.; methodology, K.J.H., S.B.J., C.E.L. and G.W.L.; validation, K.J.H. and B.U.L.; investigation, K.J.H., S.B.J., C.E.L., G.W.L. and B.U.L.; resources, B.U.L.; writing—original draft preparations, K.J.H. and B.U.L.; visualization, K.J.H. and S.B.J.; supervision, B.U.L. All authors have read and agreed to the published version of the manuscript.

Funding

This research received no external funding.

Institutional Review Board Statement

Not applicable.

Informed Consent Statement

Not applicable.

Data Availability Statement

Not applicable.

Conflicts of Interest

The authors declare no conflict of interest.

References

  1. Hinds, W.C. Aerosol Technology: Properties, Behavior, and Measurement of Airborne Particles; John Wiley & Sons: New York, NY, USA, 2012. [Google Scholar]
  2. Lee, B.U. Life comes from the air: A short review on bioaerosol control. Aerosol Air Qual. Res. 2011, 11, 921–927. [Google Scholar] [CrossRef] [Green Version]
  3. Jaenicke, R. Abundance of cellular material and proteins in the atmosphere. Science 2005, 308, 73. [Google Scholar] [CrossRef]
  4. Frankland, A.W.; Gregory, P.H. Allergenic and agricultural implications of airborne ascospore concentrations from a fungus, Didymella exitialis. Nature 1973, 245, 336–337. [Google Scholar] [CrossRef] [PubMed]
  5. D’amato, G.; Spieksma, F.T.M.; Liccardi, G.; Jäger, S.; Russo, M.; Kontou-Fili, K.; Nikkels, H.; Wüthrich, B.; Bonini, S. Pollen-related allergy in Europe. Allergy 1998, 53, 567–578. [Google Scholar] [CrossRef]
  6. Neas, L.M.; Dockery, D.W.; Burge, H.; Koutrakis, P.; Speizer, F.E. Fungus spores, air pollutants, and other determinants of peak expiratory flow rate in children. Am. J. Epidemiol. 1996, 143, 797–807. [Google Scholar] [CrossRef]
  7. Dales, R.E.; Cakmak, S.; Judek, S.; Dann, T.; Coates, F.; Brook, J.R.; Burnett, R.T. Influence of outdoor aeroallergens on hospitalization for asthma in Canada. J. Allergy Clin. Immunol. 2004, 113, 303–306. [Google Scholar] [CrossRef] [PubMed]
  8. Ruiz-Gil, T.; Acuña, J.J.; Fujiyoshi, S.; Tanaka, D.; Noda, J.; Maruyama, F.; Jorquera, M.A. Airborne bacterial communities of outdoor environments and their associated influencing factors. Environ. Int. 2020, 145, 106156. [Google Scholar] [CrossRef]
  9. Monteil, C.L.; Bardin, M.; Morris, C.E. Features of air masses associated with the deposition of Pseudomonas syringae and Botrytis cinerea by rain and snowfall. ISME J. 2014, 8, 2290–2304. [Google Scholar] [CrossRef] [PubMed] [Green Version]
  10. Kulmala, M.; Asmi, A.; Pirjola, L. Indoor air aerosol model: The effect of outdoor air, filtration and ventilation on indoor concentrations. Atmos. Environ. 1999, 33, 2133–2144. [Google Scholar] [CrossRef]
  11. Lee, T.; Grinshpun, S.A.; Martuzevicius, D.; Adhikari, A.; Crawford, C.M.; Luo, J.; Reponen, T. Relationship between indoor and outdoor bioaerosols collected with a button inhalable aerosol sampler in urban homes. Indoor Air 2006, 16, 37. [Google Scholar] [CrossRef] [Green Version]
  12. Jones, N.C.; Thornton, C.A.; Mark, D.; Harrison, R.M. Indoor/outdoor relationships of particulate matter in domestic homes with roadside, urban and rural locations. Atmos. Environ. 2000, 34, 2603–2612. [Google Scholar] [CrossRef]
  13. Shelton, B.G.; Kirkland, K.H.; Flanders, W.D.; Morris, G.K. Profiles of airborne fungi in buildings and outdoor environments in the United States. Appl. Environ. Microb. 2002, 68, 1743–1753. [Google Scholar] [CrossRef] [Green Version]
  14. Burrows, S.; Butler, T.; Jöckel, P.; Tost, H.; Kerkweg, A.; Pöschl, U.; Lawrence, M. Bacteria in the global atmosphere–Part 2: Modeling of emissions and transport between different ecosystems. Atmos. Chem. Phys. 2009, 9, 9281–9297. [Google Scholar] [CrossRef] [Green Version]
  15. Choi, D.S.; Park, Y.K.; Oh, S.K.; Yoon, H.J.; Kim, J.C.; Seo, W.J.; Cha, S.H. Distribution of airborne microorganisms in yellow sands of Korea. J. Microbiol. 1997, 35, 1–9. [Google Scholar]
  16. Kellogg, C.A.; Griffin, D.W.; Garrison, V.H.; Peak, K.K.; Royall, N.; Smith, R.R.; Shinn, E.A. Characterization of aerosolized bacteria and fungi from desert dust events in Mali, West Africa. Aerobiologia 2004, 20, 99–110. [Google Scholar] [CrossRef]
  17. Griffin, D.W.; Kubilay, N.; Koçak, M.; Gray, M.A.; Borden, T.C.; Shinn, E.A. Airborne desert dust and aeromicrobiology over the Turkish Mediterranean coastline. Atmos. Environ. 2007, 41, 4050–4062. [Google Scholar] [CrossRef]
  18. Schlesinger, P.; Mamane, Y.; Grishkan, I. Transport of microorganisms to Israel during Saharan dust events. Aerobiologia 2006, 22, 259–273. [Google Scholar] [CrossRef]
  19. Pepeljnjak, S.; Šegvić, M. Occurrence of fungi in air and on plants in vegetation of different climatic regions in Croatia. Aerobiologia 2003, 19, 11–19. [Google Scholar] [CrossRef]
  20. Heo, K.J.; Lim, C.E.; Kim, H.B.; Lee, B.U. Effects of human activities on concentrations of culturable bioaerosols in indoor air environments. J. Aerosol Sci. 2017, 104, 58–65. [Google Scholar] [CrossRef]
  21. Lin, W.H.; Li, C.S. Associations of fungal aerosols, air pollutants, and meteorological factors. Aerosol Sci. Technol. 2000, 32, 359–368. [Google Scholar] [CrossRef]
  22. Després, V.R.; Huffman, J.A.; Burrows, S.M.; Hoose, C.; Safatov, A.S.; Buryak, G.; Fröhlich-Nowoisky, J.; Elbert, W.; Andreae, M.O.; Pöschl, U. Primary biological aerosol particles in the atmosphere: A review. Tellus B 2012, 64, 15598. [Google Scholar] [CrossRef] [Green Version]
  23. Borodulin, A.I.; Safatov, A.S.; Shabanov, A.N.; Yarygin, A.A.; Khutorova, O.G.; Belan, B.D.; Panchenko, M.V. Physical characteristics of concentration fields of tropospheric bioaerosols in the South of Western Siberia. J. Aerosol Sci. 2005, 36, 785–800. [Google Scholar] [CrossRef]
  24. Kaarakainen, P.; Meklin, T.; Rintala, H.; Hyvärinen, A.; Kärkkäinen, P.; Vepsäläinen, A.; Hirvonen, M.R.; Nevalainen, A. Seasonal variation in airborne microbial concentrations and diversity at landfill, urban and rural sites. CLEAN–Soil Air Water 2008, 36, 556–563. [Google Scholar] [CrossRef]
  25. Lee, B.U.; Lee, G.; Heo, K.J. Concentration of culturable bioaerosols during winter. J. Aerosol Sci. 2016, 94, 1–8. [Google Scholar] [CrossRef]
  26. Ma, L.; Yabo, S.D.; Lu, L.; Jiang, J.; Meng, F.; Qi, H. Seasonal variation characteristics of inhalable bacteria in bioaerosols and antibiotic resistance genes in Harbin. J. Hazard. Mater. 2023, 446, 130597. [Google Scholar] [CrossRef]
  27. Gao, M.; Jia, R.; Qiu, T.; Han, M.; Song, Y.; Wang, X. Seasonal size distribution of airborne culturable bacteria and fungi and preliminary estimation of their deposition in human lungs during non-haze and haze days. Atmos. Environ. 2015, 118, 203–210. [Google Scholar] [CrossRef]
  28. Verma, S.K.; Kawamura, K.; Yang, F.; Fu, P.; Kanaya, Y.; Wang, Z. Measurement report: Diurnal and temporal variations of sugar compounds in suburban aerosols from the northern vicinity of Beijing, China–an influence of biogenic and anthropogenic sources. Atmos. Chem. Phys. 2021, 21, 4959–4978. [Google Scholar] [CrossRef]
  29. Heo, K.J.; Lee, B.U. Seasonal variation in the concentrations of culturable bacterial and fungal aerosols in underground subway systems. J. Aerosol Sci. 2016, 92, 122–129. [Google Scholar] [CrossRef]
  30. Fang, Z.; Ouyang, Z.; Zheng, H.; Wang, X.; Hu, L. Culturable airborne bacteria in outdoor environments in Beijing, China. Microb. Ecol. 2007, 54, 487–496. [Google Scholar] [CrossRef]
  31. Yang, L.; Shen, Z.; Wang, D.; Wei, J.; Wang, X.; Sun, J.; Xu, H.; Cao, J. Diurnal Variations of Size-Resolved Bioaerosols During Autumn and Winter Over a Semi-Arid Megacity in Northwest China. GeoHealth 2021, 5, e2021GH000411. [Google Scholar] [CrossRef] [PubMed]
  32. Yadav, J.; Kumar, A.; Mahor, P.; Goel, A.K.; Chaudhary, H.S.; Yadava, P.K.; Yada, H.; Kumar, P. Distribution of airborne microbes and antibiotic susceptibility pattern of bacteria during Gwalior trade fair, Central India. J. Formos. Med. Assoc. 2015, 114, 639–646. [Google Scholar] [CrossRef] [PubMed] [Green Version]
  33. Hameed, A.A.; Khoder, M.; Yuosra, S.; Osman, A.; Ghanem, S. Diurnal distribution of airborne bacteria and fungi in the atmosphere of Helwan area, Egypt. Sci. Total Environ. 2009, 407, 6217–6222. [Google Scholar] [CrossRef]
  34. LeBouf, R.; Yesse, L.; Rossner, A. Seasonal and diurnal variability in airborne mold from an indoor residential environment in northern New York. J. Air Waste Manag. Assoc. 2008, 58, 684–692. [Google Scholar] [CrossRef]
  35. Ghosh, B.; Lal, H.; Kushwaha, R.; Hazarika, N.; Srivastava, A.; Jain, V. Estimation of bioaerosol in indoor environment in the university library of Delhi. Sustain. Environ. Res. 2013, 23, 199–207. [Google Scholar]
  36. Goung, S.J.N.; Yang, J.; Kim, Y.S.; Lee, C.M. A pilot study of indoor air quality in screen golf courses. Environ. Sci. Pollut. Res. 2015, 22, 7176–7182. [Google Scholar] [CrossRef]
  37. Hallier, C.; Williams, D.W.; Potts, A.J.C.; Lewis, M.A.O. A pilot study of bioaerosol reduction using an air cleaning system during dental procedures. Br. Dent. J. 2010, 209, E14. [Google Scholar] [CrossRef]
  38. Kim, K.Y.; Ko, H.J.; Kim, D. Assessment of airborne microorganisms in a swine wastewater treatment plant. Environ. Eng. Res. 2012, 17, 211–216. [Google Scholar] [CrossRef]
  39. Hwang, G.B.; Jung, J.H.; Jeong, T.G.; Lee, B.U. Effect of hybrid UV-thermal energy stimuli on inactivation of S. epidermidis and B. subtilis bacterial bioaerosols. Sci. Total Environ. 2010, 408, 5903–5909. [Google Scholar] [CrossRef] [PubMed]
  40. Peccia, J.; Hernandez, M. Photoreactivation in airborne Mycobacterium parafortuitum. Appl. Environ. Microbiol. 2001, 67, 4225–4232. [Google Scholar] [CrossRef] [Green Version]
  41. Lighthart, B.; Shaffer, B.T. Airborne bacteria in the atmospheric surface layer: Temporal distribution above a grass seed field. Appl. Environ. Microbiol. 1995, 61, 1492–1496. [Google Scholar] [CrossRef] [PubMed] [Green Version]
  42. Zhong, X.; Qi, J.; Li, H.; Dong, L.; Gao, D. Seasonal distribution of microbial activity in bioaerosols in the outdoor environment of the Qingdao coastal region. Atmos. Environ. 2016, 140, 506–551. [Google Scholar] [CrossRef]
  43. Huang, C.Y.; Lee, C.C.; Li, F.C.; Ma, Y.P.; Su, H.J.J. The seasonal distribution of bioaerosols in municipal landfill sites: A 3-yr study. Atmos. Environ. 2002, 36, 4385–4395. [Google Scholar] [CrossRef]
  44. Tellier, R. Aerosol transmission of influenza A virus: A review of new studies. J. R. Soc. Interface 2009, 6, S783–S790. [Google Scholar] [CrossRef] [PubMed] [Green Version]
  45. Haas, D.; Galler, H.; Luxner, J.; Zarfel, G.; Buzina, W.; Friedl, H.; Marh, E.; Habib, J.; Reinthaler, F.F. The concentrations of culturable microorganisms in relation to particulate matter in urban air. Atmos. Environ. 2013, 65, 215–222. [Google Scholar] [CrossRef]
  46. Gao, M.; Yan, X.; Qiu, T.; Han, M.; Wang, X. Variation of correlations between factors and culturable airborne bacteria and fungi. Atmos. Environ. 2016, 128, 10–19. [Google Scholar] [CrossRef]
  47. De Groot, R.C. Diurnal cycles of air-borne spores produced by forest fungi. Phytopathology 1968, 58, 1223–1229. [Google Scholar]
  48. Schumacher, C.J.; Pöhlker, C.; Aalto, P.; Hiltunen, V.; Petäjä, T.; Kulmala, M.; Pöschl, U.; Huffman, J.A. Seasonal cycles of fluorescent biological aerosol particles in boreal and semi-arid forests of Finland and Colorado. Atmos. Chem. Phys. 2013, 13, 11987–12001. [Google Scholar] [CrossRef] [Green Version]
  49. Clauß, M.; Linke, S.; Tautz, C.; Bromann, S. Development of a Novel Bioaerosol Chamber to Determine Survival Rates of Airborne Staphylococci. Atmosphere 2022, 13, 869. [Google Scholar] [CrossRef]
  50. Zhao, X.; Zhang, X.; Xu, X.; Xu, J.; Meng, W.; Pu, W. Seasonal and diurnal variations of ambient PM2.5 concentration in urban and rural environments in Beijing. Atmos. Environ. 2009, 43, 2893–2900. [Google Scholar] [CrossRef]
  51. Liu, Z.; Hu, B.; Wang, L.; Wu, F.; Gao, W.; Wang, Y. Seasonal and diurnal variation in particulate matter (PM10 and PM2.5) at an urban site of Beijing: Analyses from a 9-year study. Environ. Sci. Pollut. Res. 2015, 22, 627–642. [Google Scholar] [CrossRef]
  52. Saari, S.; Niemi, J.; Rönkkö, T.; Kuuluvainen, H.; Järvinen, A.; Pirjola, L.; Aurela, M.; Hillamo, R.; Keskinen, J. Seasonal and diurnal variations of fluorescent bioaerosol concentration and size distribution in the urban environment. Aerosol Air Qual. Res. 2015, 15, 572–581. [Google Scholar] [CrossRef] [Green Version]
Figure 1. Location of measurement campaign (Korea Peninsula). A red asterisk indicates the sampling point.
Atmosphere 14 00537 g001
Figure 2. Diurnal pattern of bacterial bioaerosols. Normalized concentration of bacterial bioaerosols when (a,b) evening, (c) morning, and (d) night are at their highest concentrations. Max means the highest concentrations. Error bars mean the standard deviation.
Atmosphere 14 00537 g002
Figure 3. Diurnal variation of bacterial bioaerosol concentration with seasonal change. Error bars mean the standard deviation.
Atmosphere 14 00537 g003
Figure 4. (a) Diurnal variation of fungal bioaerosol concentration in January, Seoul, Korea. (b) Diurnal variation of fungal bioaerosol concentration with seasonal change. Error bars mean the standard deviation.
Atmosphere 14 00537 g004
Figure 5. Effects of meteorological factors on concentration of bioaerosols with seasonal changes from winter (January to February) to spring (March to May). For bacterial bioaerosols, the following parameters are shown: (a) temperature, (c) relative humidity, and (e) UV irradiation intensity. Brown and dark green dash line indicate linear regression between bacterial bioaerosol concentration and UV intensity in winter (R2 = 0.2126) and spring (R2 = 0.0348), respectively. For fungal bioaerosols, the following parameters are shown: (b) temperature, (d) relative humidity, and (f) UV intensity.
Atmosphere 14 00537 g005
Figure 6. Diurnal variations in particle number concentration on (a) 15 January, (b) 9 February, (c) 9 March, (d) 1 April, and (e) 18 May. (f) Seasonal changes in diurnal variations in total particle number concentrations. Error bars mean the standard deviation.
Atmosphere 14 00537 g006
Table 1. Diurnal bacterial bioaerosol concentration from January to May in Seoul, Korea.
Concentrations of Bacterial Bioaerosol (CFU/m3)
Measurement DayMorningMiddayEveningNight
Winter15 January54.7 ± 1520.1 ± 856.0 ± 1140.0 ± 5
19 January48.0 ± 1045.0 ± 8.568.0 ± 3.565.0 ± 19
26 January66.0 ± 725.3 ± 3.042.7 ± 132.7 ± 15
30 January58.3 ± 551.0 ± 388.5 ± 755.7 ± 4
9 February64.2 ± 1350.0 ± 10 80.0 ± 985.8 ± 9
Spring9 March160 ± 2683.0 ± 23133 ± 49187 ± 38
16 March60 ± 1760.0 ± 1060.0 ± 1083.0 ± 12
18 March150 ± 3057.0 ± 40137 ± 7083.0 ± 25
25 March103 ± 3243.0 ± 25113 ± 32100 ± 35
1 April113 ± 3247.0 ± 12247 ± 85123 ± 21
18 May53.0 ± 2547.0 ± 1237.0 ± 20180 ± 35
20 May 137 ± 1537.0 ± 647.0 ± 12150 ± 36
25 May 47.0 ± 623.0 ± 627.0 ± 1263.0 ± 15
27 May 157 ± 2130.0 ± 283.0 ± 673.0 ± 21
Table 2. Diurnal variations in meteorological factors in January at the measurement locations of Seoul, Korea.
Measurement DayMeasurement TimeTemperature (°C)Humidity (%)UV (mW/cm2)
15 January09:004.3 ± 0.346.3 ± 0.50.9 ± 0.3
13:0013.3 ± 0.520.3 ± 1.51.6 ± 0.0
17:003.1 ± 0.937.9 ± 5.00.4 ± 0.1
21:00−1.6 ± 0.667.6 ± 3.80.0 ± 0.0
19 January09:00−12.4 ± 1.545.4 ± 0.40.4 ± 0.0
13:00−2.9 ± 1.022.6 ± 0.81.0 ± 0.0
17:00−9.3 ± 0.447.7 ± 2.00.0 ± 0.0
21:00−10.8 ± 1.454.4 ± 5.70.0 ± 0.0
26 January09:003.0 ± 0.250.8 ± 2.80.7 ± 0.0
13:003.6 ± 0.466.2 ± 1.50.5 ± 0.1
17:001.8 ± 0.551.9 ± 2.90.1 ± 0.0
21:00−2.7 ± 1.173.0 ± 11.70.0 ± 0.0
30 January09:009.4 ± 0.530.8 ± 4.71.1 ± 0.0
13:009.6 ± 1.633.7 ± 2.41.2 ± 0.1
17:005.7 ± 0.535.4 ± 0.60.2 ± 0.0
21:003.1 ± 0.454.3 ± 3.20.0 ± 0.0
Table 3. Sunrise and sunset times at measurement locations.
JanuaryFebruaryMarchAprilMay
Sunrise time07:4707:2806:5106:0405:19
Sunset time17:3218:0518:3519:0319:39
Table 4. The concentration of bioaerosols in winter with UV intensity.
Type (CFU/m3)UV Intensity (mW/cm2)
0.0 0.0–0.50.5–1.0>1.0
Bacterial 51.2 ± 1858.9 ± 1863.1 ± 2141.0 ± 18
Fungal 120.7 ± 48155.3 ± 84148.1 ± 9456.4 ± 26
Table 5. The concentration of bioaerosols in spring with UV intensity.
Type
(CFU/m3)
UV Intensity (mW/cm2)
0.0 0.0–1.01.0–2.02.0–3.0>3.0
Bacterial 138.3 ± 2295.9 ± 59.7104.6 ± 47.770.0 ± 4446.0 ± 27.2
Fungal 120.0 ± 86.5118.7 ± 70125.5 ± 59.082.5 ± 50113 ± 25.8
Disclaimer/Publisher’s Note: The statements, opinions and data contained in all publications are solely those of the individual author(s) and contributor(s) and not of MDPI and/or the editor(s). MDPI and/or the editor(s) disclaim responsibility for any injury to people or property resulting from any ideas, methods, instructions or products referred to in the content.

