Review

Characterization of Laboratory Particulate Matter (PM) Mass Setups for Brake Emission Measurements

1
European Commission, Joint Research Centre (JRC), 21027 Ispra, Italy
2
Corning GmbH, 65189 Wiesbaden, Germany
3
Brakes India Private Limited, Padi, Chennai 600 050, India
4
AVL List GmbH, 8020 Graz, Austria
5
HORIBA Europe GmbH, 61440 Oberursel, Germany
6
AIP GmbH & Co., KG, D-87490 Haldenwang, Germany
7
Dekati Ltd., Tykkitie 1, FI-36240 Kangasala, Finland
8
Link Engineering Co., 43855 Plymouth Oaks Blvd, Plymouth, MI 48170, USA
*
Author to whom correspondence should be addressed.
Atmosphere 2023, 14(3), 516; https://doi.org/10.3390/atmos14030516
Submission received: 20 February 2023 / Revised: 1 March 2023 / Accepted: 6 March 2023 / Published: 7 March 2023
(This article belongs to the Special Issue Traffic Related Emission)

Abstract

:
Vehicles’ exhaust particulate matter (PM) emissions have significantly decreased over the years. On the other hand, non-exhaust emissions, i.e., particle emissions from brakes and tires, have increased due to the increase in the vehicle fleet, traffic congestion, and the distance traveled. As a result, regulatory bodies are investigating the possibility of mitigating non-exhaust emissions. The Euro 7 proposal introduces specific emission limits for both brakes and tires for the first time in a regulation worldwide. The methodology for brake particle emissions sampling and measurement builds on the work of the Particle Measurement Programme (PMP) informal working group of the United Nations Economic Commission for Europe (UNECE). The recently adopted Global Technical Regulation (GTR) on brakes from light-duty vehicles up to 3.5 t prescribes the technical details. In this paper, we present the technical specifications for the measurements of PM. We also evaluate the penetrations for two cases with two setups for minimum and maximum particle losses. This study, using aerosol engineering calculations, estimates the maximum expected differences between the two setups, both of which are compliant with the GTR. This study also discusses the mass ratios of PM2.5 and PM10 as a function of the mass median diameters.

1. Introduction

Air pollution is Europe’s most considerable environmental health risk, causing significant adverse health effects, particularly in urban areas. Despite the reduction in emissions in the last few decades, most of the European Union’s (EU’s) urban population is still exposed to levels of air pollutants that are damaging to health. According to the European Environmental Agency (EEA), in 2020, 96% of the urban population was exposed to concentrations of fine particulate matter (PM2.5), which is above the 2021 World Health Organization’s (WHO) guideline of 5 µg/m3, leading to at least 238,000 premature deaths [1].
The strict regulations already enacted in the EU for vehicle exhaust emissions have significantly decreased exhaust Particulate Matter (PM) emissions [2]. At the same time, the contribution of non-exhaust emissions (brake wear, tire, and road wear, and even clutch wear [3]) has exceeded the exhaust emissions [4]. Future projections expect that the contribution of non-exhaust traffic related PM emissions will reach 90% of total road transport PM emissions by the end of the current decade [5]. For this reason, regulatory initiatives have already been announced in the EU, whereas other regions worldwide are expected to follow.
Various methodologies are used to determine brake and tire PM emission factors, including direct measurement from the sources (e.g., real world test campaigns, laboratory experiments) and receptor modeling. As an example, receptor models apportion emissions among different sources based on their composition and using chemical substances as key tracers. On the other hand, measurements by field or laboratory tests measure brake and tire PM directly [6,7,8]. In this case, brake and tire PM emissions may be measured in a controlled environment in the laboratory [9,10,11,12] or under uncontrolled conditions on the road [13]. More details about the range of measured emissions and the influencing parameters can be found in relevant reviews [4,6,7]. While for tires, most of the mass resides above 10 μm [7], and for brakes around half of the mass resides below 10 μm [10,14]. The size distributions can be determined with various methods, such as cascade impactors, optical particle counters, and electrical impactors [4,6,14]. The testing procedures are not universal and harmonized, while in many cases the researchers use setups and test cycles tailored to their needs [15]. On the other hand, regulatory methodologies must be robust, repeatable, and reproducible.
In November 2022, the European Commission proposed new Euro 7 standards to reduce vehicle pollutant emissions and improve air quality [16]. The Euro 7 standards will be the first worldwide emission standards to set limits for the particulate emissions of brakes and tire abrasion rates. These rules will apply to all vehicles, including those featuring an electric machine, independent of their electrification grade. The methodology for tire abrasion rates will be based on the work of the Task Force on Tire Abrasion of the United Nations Economic Commission for Europe (UNECE). The methodology for brake emission measurements will rely on the Global Technical Regulation (GTR) on brake emissions, which was developed by the Particle Measurement Programme (PMP) informal working group of the UNECE [17]. The proposed limit for M1 (passenger cars) and N1 (light commercial vehicles) is 7 mg/km/vehicle until 2035, and 3 mg/km/vehicle afterwards. The work is ongoing for the other categories (trucks, buses). The topic is also discussed at the Advisory Group on Vehicle Emission Standards (AGVES) meetings.
This study aims to present the GTR’s technical specification of the PM setup. Assessment of the penetrations of two cases, one with minimum and one with maximum particle losses, will give the maximum expected differences between laboratories. The current work also presents the correlation of mass ratios of PM2.5 and PM10 with the mass median diameter. The companion paper discussed the particle number (PN) setup [18].

2. Materials and Methods

2.1. Setup

The setup and procedure for measuring particulate emissions from brakes in a laboratory are described in the recently adopted GTR [17]. Figure 1 presents the main parts of the setup. The design and the positioning of the different elements in Figure 1 are indicative, and alternative designs (e.g., with one bend downstream of the enclosure and upstream of the sampling tunnel) are allowed.
The brake assembly (5) connects to a brake dynamometer and its automation system (6) that provides the controlled kinetic energy to the brake under test. The automation system (6) controls the rotational speed of the motor and performs the worldwide harmonized light vehicles test procedure (WLTP)-Brake cycle [19]. The brake dynamometer and its automation system are not depicted but only denoted in Figure 1. GTR [17] provides more details for the brake dynamometer. The brake is installed in an enclosure (4), where clean (2) and conditioned air for both temperature and humidity (1) flows around the brake assembly (5). The brake assembly (5) is mounted on an appropriate fixture for minimal flow interruptions of air around the brake. The enclosure ensures that no untreated air enters and contaminates the air around the brake. A sampling tunnel (7) connected to the brake enclosure exit allows the turbulent airflow to stabilize and achieve a fully developed velocity profile at the sampling plane (8). The array of sampling probes allows the isokinetic measurement of the number concentration of particles larger than 10 nm (Solid Particle Number–SPN10 and Total Particle Number–TPN10), the particulate matter mass with an aerodynamic diameter of up to 2.5 μm (PM2.5), and the particulate matter mass up to 10 μm (PM10) (9). The measurement of the tunnel flow takes place downstream of the sampling plane by means of a dedicated flow measurement device (10).
Figure 2 gives a detailed overview of the technical requirements for the PM setup. Details for the PN setup were presented in the companion paper [18]. The main components of each PM setup (2.5 μm or 10 μm) are:
  • A probe to extract the diluted sample. The probe may have up to one bend that does not exceed 90°. The bending radius must be at least four times the probe’s inner diameter (4∙dp).
  • A sampling nozzle fitted to the probe’s end to achieve isokinetic sampling (0.90–1.15). The nozzle(s) must have its axis parallel to the sampling dilution tunnel, ensuring that the aspiration angle does not exceed 15°.
  • A cyclonic separator to remove particles larger than 2.5 μm (PM2.5) or 10 μm (PM10), mounted directly at the sampling probe’s outlet.
  • A sampling line from the cyclonic separator to the PM filter holder. The PM sampling line may have up to one bend. The bending radius must be at least twenty-five times the sampling line’s inner diameter (25∙ds).
  • A flow control device with an accuracy of ±2.5% of the reading or ±1.5% of the full scale—whichever is smaller.
The material of the probe and the nozzle must be stainless steel with an electropolished finish (or equivalent), providing an ultra-clean and ultra-fine surface. The PM sampling line may be stainless steel with an electropolished finish (or equivalent) or antistatic polytetrafluoroethylene (PTFE). The materials must be electrically conductive, avoid (chemical) reactions with the brake particles, and be electrically grounded to prevent electrical/electrostatic effects.
In general, the choice of the nozzle for achieving isokinetic sampling depends on the airflow rates in the sampling tunnel and sampling probes as well as their respective inner diameters (di and dp). The test facility can apply any parameters within the boundary conditions from the GTR to install and use different combinations for tunnel diameters (175–225 mm) and probe diameters (10–18 mm), with nozzle diameters of at least 4 mm, and minimum airflow of 100 m3/h in the tunnel. The position of the probes must be at least six tunnel diameters downstream and two diameters upstream of any flow disturbance (e.g., bends). A bending radius higher than 2 is necessary to minimize losses [20]. Considering the flexibility allowed in the design of the probe (i.e., up to 18 mm), the maximum feasible bending radius of 4 has been defined to comply with the maximum length of the probe (i.e., 1 m). Regarding the cyclonic separators, minimum or maximum separation efficiencies are provided at various sizes, aiming at around 50% efficiency at 2.5 μm and 10 μm. Lastly, the inset of Figure 2 provides the main specifications of the enclosure.
The GTR also provides specifications regarding the filter holders, the filter materials, the filter conditioning, and the weighing procedure. However, the details are out of the scope of this article and can be found in the GTR [17].

2.2. Scenarios

This study considers two scenarios for the theoretical analysis of particle losses, both within limits defined in the GTR:
  • PM setup with minimum particle losses, and thus maximum penetration, abbreviated as “max penetration”.
  • PM setup with all permissible settings or values in the technical requirements maximizing particle losses, abbreviated as “min penetration”.
The two scenarios cover the range of setups allowed in the GTR and are realistic to build and operate. A detailed analysis of how to define the optimum settings can be found elsewhere [21]. In a nutshell, the simulations of that study demonstrated that inertial deposition is the primary particle mass loss mechanism for ducts or tubes with a bend. A combination of low flow rates and large tube diameters is necessary to minimize losses, but only up to the point that losses due to gravitational settling do not become significant. The sampling line to the PM filter holder is the most critical section for these losses; these are less important in the sampling tunnel. The range of 10–30 L/min for PM sampling airflow and 12–16 mm for the inner probe diameter was found to be optimal. Nevertheless, the analysis here considered a wider range of diameters following the flexibilities allowed in the GTR.
Table 1 summarizes the parameters for calculating the penetrations of the various parts of the “min penetration” and “max penetration” PM setups. The evaluations included cyclonic separators with two different upper cut-off sizes (2.5 μm and 10 μm). The analysis assumed negligible electrostatic deposition due to the required use of electrically conductive materials. Equations in [22] were used to determine the anisokinetic, anisoaxial, diffusional, inertial, and gravitational penetrations. The summary equations of [22] are based on well-established expressions that have been validated theoretically and experimentally [23,24,25]. Aerosol calculators are available (with a fee). For example, the Particle Loss Calculator [26] or the LINK PALS2 Microsoft® Excel Macro [27]. A commonly used tool, without fees, is the “AeroCalc” [28].
For the cyclonic separator, the penetrations assumed were close to the limits of the separation efficiencies allowed in the GTR (see values at the inset of Figure 2). Thus, no simulations were run. The “min penetration” efficiencies of the cyclonic separator (Table 1) deviate from the efficiencies expected based on theoretical estimations, which are steeper curves (see equations in [29]) and fit better to the “max penetration” cyclonic separator. Experimental data (that will be presented later) also fit better to the theoretical estimations and “max penetration” cyclonic separator, but the aim of this study was to examine the worst case.
While the losses in the brake enclosure were not part of the simulations, they are discussed in the “Discussion” section.

3. Results

Figure 3a presents the results for the “max penetration” PM setup with the 2.5 μm and 10 μm cyclonic separators (details in Table 1). The sampling is assumed isoaxial and isokinetic; thus, no losses occur at the nozzle. The probe losses are low because there is no bend. Only the gravitational losses contribute, which are low due to the assumed higher flow rate in the probe (15 L/min). The cyclonic separator dominates the combined PM2.5 penetration, reaching 50% penetration at 2.5 μm. The cyclonic separator and the losses in the tubing determine the combined PM10 penetration. The 50% penetration occurs at 8 μm, while at 10 μm, the penetration is calculated to be 34%.
Following the ISO 7708:1995 [30], Figure 3a also plots the thoracic fraction (i.e., the fraction of inhaled particles that penetrate beyond the larynx) and the respirable fraction (i.e., the fraction of inhaled particles that penetrate to the unciliated airways). The PM2.5 and PM10 penetration efficiencies of the “max penetration” scenario are close to the respirable and thoracic fractions. This was expected because the penetrations depend mainly on the cyclonic separators, which for the “max penetration” scenario, were assumed to be close to these fractions. Most market cyclonic separators are expected to follow the curves of ISO 7708:1995. Indeed, a limited number of experimental data from the calibration certificates fit well with the penetration of the cyclonic separator of the “max penetration” scenario (Figure 3a). Thus, this scenario is plausible in future GTR-compliant PM systems used for regular measurements.
Figure 3b presents the results for the “min penetration” PM setup using 2.5 μm and 10 μm cyclonic separators (details in Table 1). The anisoaxial losses are <1% (not shown in the figure), and the anisokinetic losses (for anisokinetic ratio of 1.15) can reach 9% at 10 μm. The inertial and gravitational losses in the probe and PM sampling line can be significant and up to 30% at 10 μm (“Probe” and “Sampling line” curves). The (PM) sampling line losses are only slightly higher than the “max penetration” scenario because it also includes only one bend. The losses in the tunnel are negligible (“Tunnel” curve). The cyclonic separators, chosen to have the minimum penetrations allowed in the GTR, have less than 50% penetration at 2.5 μm and 10 μm. The combined PM2.5 setup curve reaches 50% penetration at 2 μm, determined by the cyclonic separator. The combined PM10 setup has 50% penetration at 6 μm and 19% at 10 μm. Both the cyclonic separator and the other losses contribute to the low penetrations.
Figure 3b also plots the thoracic and respirable fractions based on ISO 7708:1995, as in the case of Figure 3a. For the “min penetration” scenario, the PM2.5 penetration is close to the respirable fraction. On the other hand, the PM10 penetration is lower than the thoracic fraction due to the assumptions with high particle losses and the much lower penetration of the 10 μm cyclonic separator. The 19% penetration for 10 μm particles means that 10 μm particles are underestimated at 60% as the “ideal” penetration would be 50%. In conclusion, it is essential to minimize bends and use commercially available cyclonic separators following the respirable and thoracic curves [17]. By following this approach, the penetrations of both PM setups are close to human exposure to PM2.5 and PM10.

4. Discussion

The previous section presented the penetrations of two setups and how they compare with the respirable and thoracic fractions. This section discusses how these penetrations translate when measuring polydisperse aerosol with various mass size distributions. The ratio of PM2.5 to PM10 is also presented. The results are also compared with the respirable and thoracic fractions. Based on the size distributions reported in the literature, reasonable or expected penetrations and ratios are given. The discussion closes with a comparison of the two setups as an indication of the maximum differences that could be seen in the field.

4.1. Penetration for Various Size Distributions

The penetrations provided in the previous section refer to monodisperse number concentrations for various sizes. For a specific size distribution, the mass median diameter (MMD) can be calculated by the count median diameter (CMD) and the geometric standard deviation [23]. Our analysis assumes a geometric standard deviation of two. This value is based on the logarithmic fittings of plotted size distributions in the literature (e.g., [31,32]). Only mono-modal distributions were assumed. Although it is not always valid, the scaling of mass with the diameter to the third power (to represent volumetric properties) makes the large mode in the micron region the dominant one. It is also assumed that the density remains constant over the different sizes.
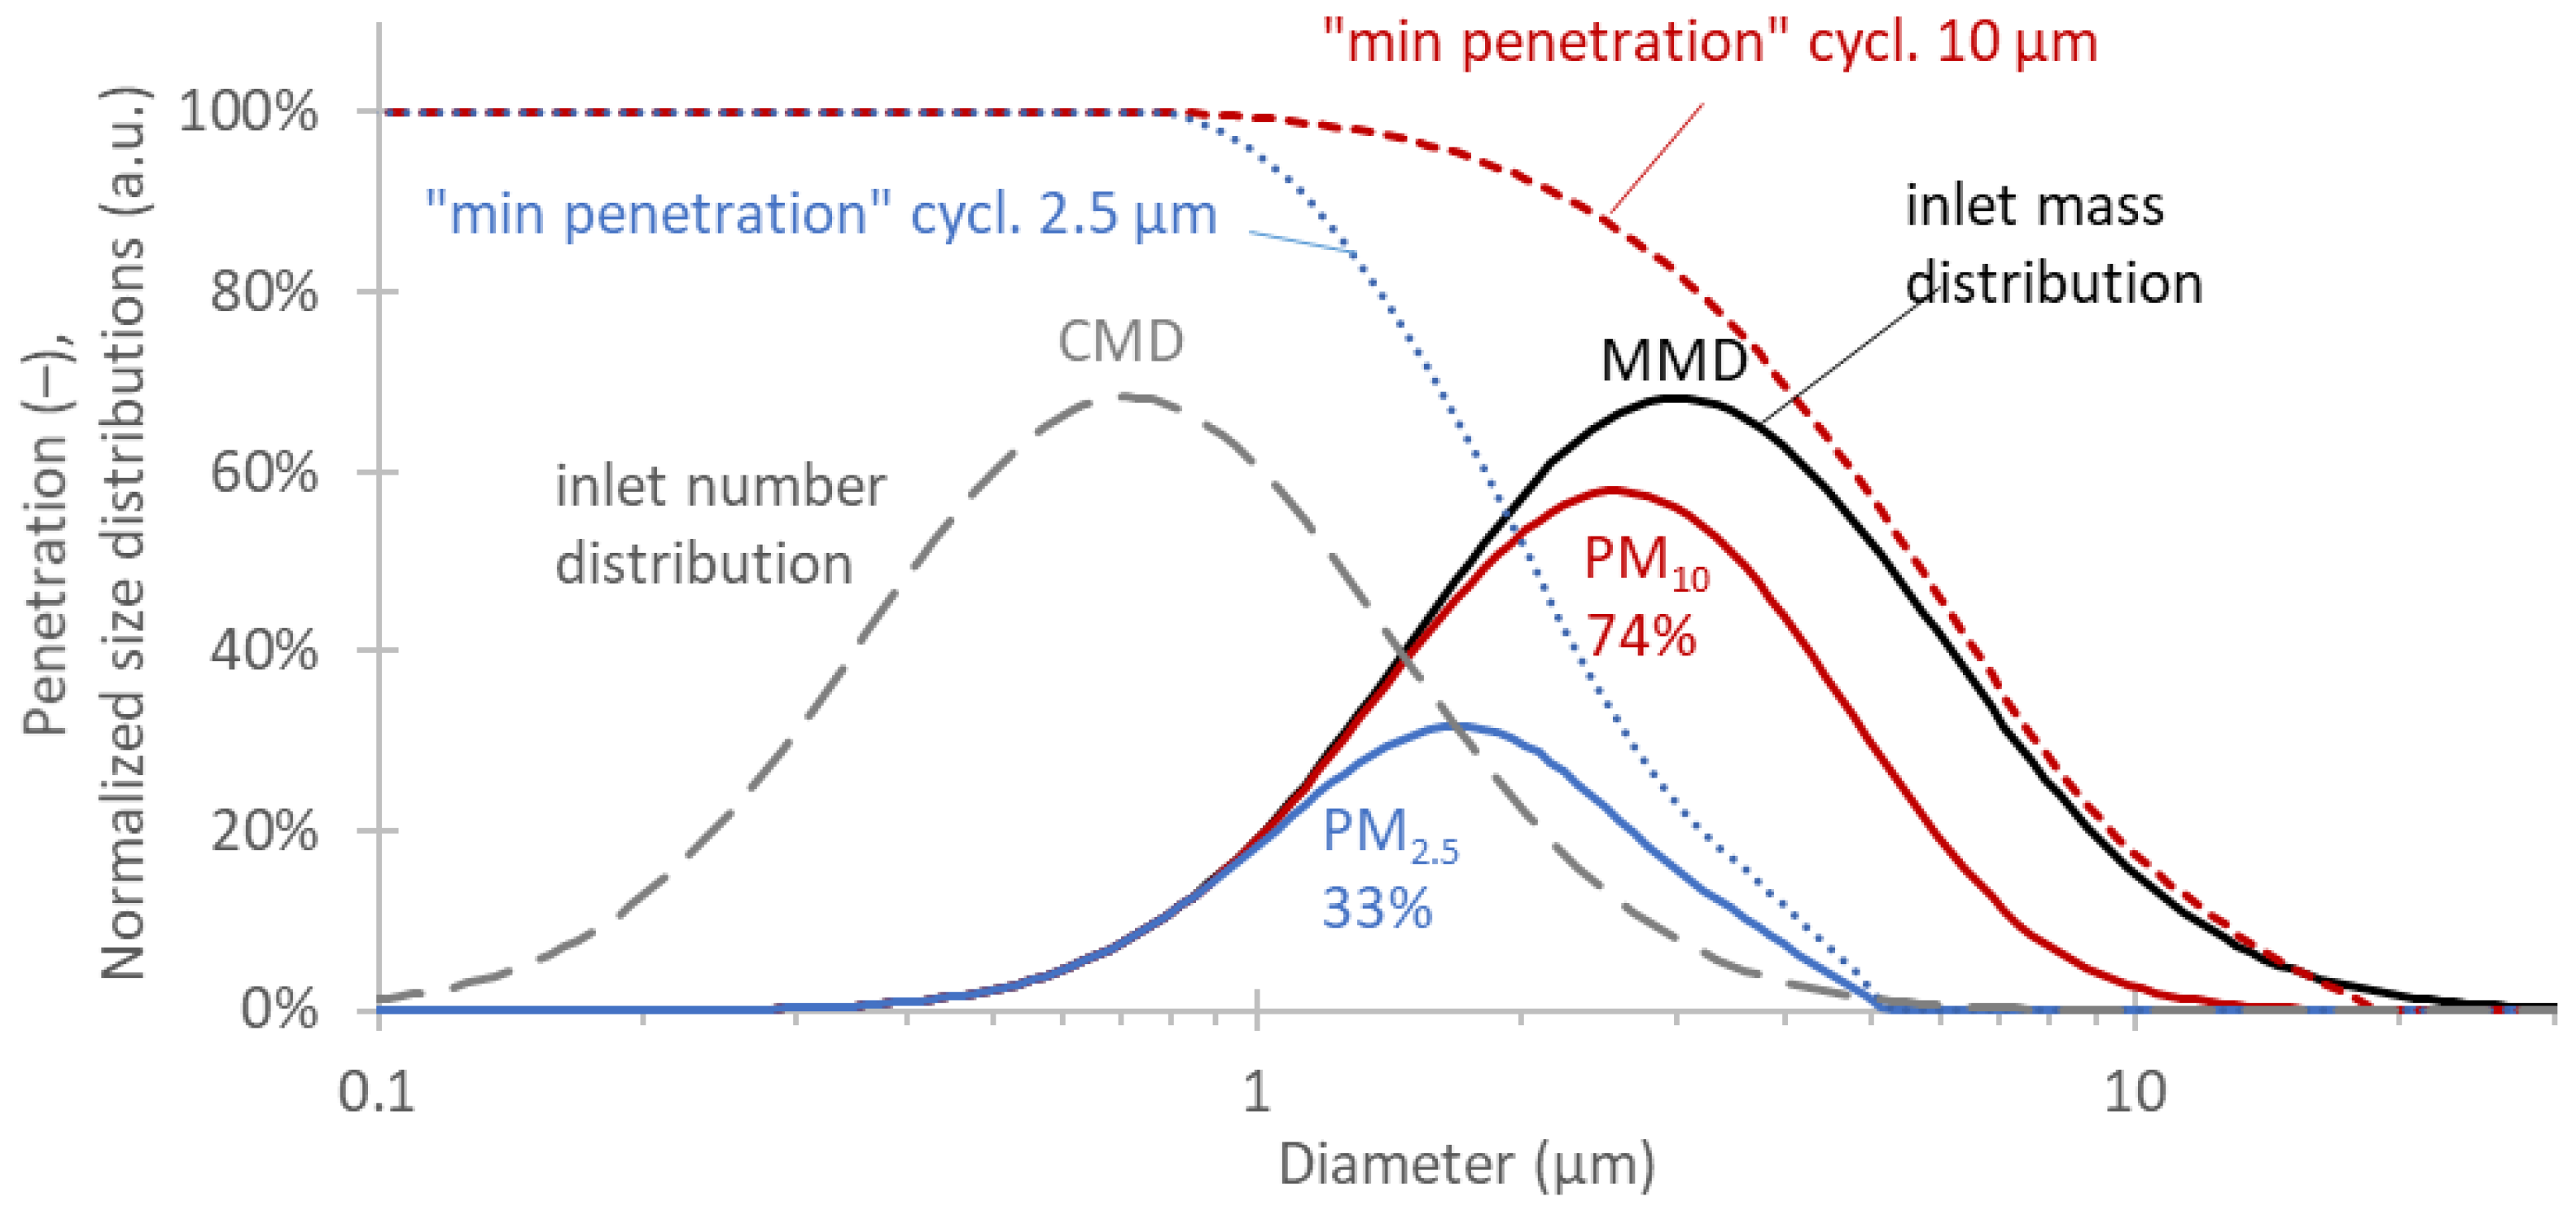
For example, for a logarithmic size distribution with CMD 0.7 μm, the MMD is 3.0 μm, meaning that the mass size distribution peaks at 3.0 μm (Figure 4). For the specific size distribution, the “min penetration” setup with the 10 μm cyclonic separator has 98% penetration in number but 74% penetration in mass. This 74% also represents the ratio of PM10 to total brake loss (wear) mass. However, this theoretical calculation does not take into account the existence of separate coarse particles, which are found sometimes as large chunks of debris on enclosures. The mass ratio of PM2.5 to PM10 is 45% (33% to 74%).
Table 2 summarizes the penetrations in number and mass for different polydisperse size distributions for the two scenarios.
As expected, with the 2.5 μm cyclonic separator, the 50% mass penetration is achieved for size distributions with MMD around 2 μm. However, with the 10 μm cyclonic separator, the 50% mass penetration is achieved for size distributions with MMD around 5 μm (“min penetration”) to 7 μm (“max penetration”). This value also means that when the ratio of PM10 to total brake wear (or total brake abrasion) is 50%, the MMD is around 5–7 μm, which is typical (and slightly higher) for most brakes in the market (see reviews [6,7], but it will be discussed in detail in Section 4.3). As mentioned previously, if coarse particles >>10 μm exist, the MMD will be lower than in Table 2 for a specific percentage. Or, in other words, for a specific MMD of a measured size distribution <10 μm, the percentage will be lower than in Table 2.
Compared to the PN setup prescribed in the GTR [18], the penetrations are higher for the same cyclonic separator, especially for large particles. The reason for this is that the specifications of the PM setup focused on large particles that contribute most to the mass.
For completeness, Table 3 gives the calculated respirable and thoracic penetrations for various MMDs, which should be the target penetration of 2.5 μm and 10 μm PM setups. It is clear that they are close to the “max penetration” scenario of Table 2.

4.2. Penetrations in the Literature

The previous calculations presented the penetration from the tunnel (included) without the brake enclosure. Other studies have confirmed the high (>93%) penetration of small particles both theoretically (50–1000 nm) [33] and experimentally (65 nm) in ducts and tubes [31]. For large particles, e.g., 10 μm, the penetration can be >65% [14,31,33] and reach up to 90% [11] (without a cyclonic separator). Previous studies [21] reported a penetration of 40% for a GTR-compliant system for 10 μm particles (including a 10 μm cyclonic separator). For onboard vehicle systems, several studies reported penetrations at 10 μm in the range of 20–60% [32,34]. In our analysis, the penetration of 10 μm particles was 66% for the best scenario, which included one bend in the sampling line.
Dedicated studies for the brake enclosure are rare [35]. In general, enclosures should avoid stagnant flow regions and allow good mixing of air and brake particles [11,36]. To follow the guidelines from prior research and to provide reproducible test conditions, the GTR foresees a speed uniformity test at nine positions and allows for the use of flow straighteners or diffusion plates at the enclosure’s inlet side. A Computational Fluid Dynamics (CFD) study [36] demonstrated that the optimum design features a smooth transition angle of inlet airflow of 15°, a cylindrical (main) body of the enclosure, and the calliper positioned at 1 o-clock, observing from the wheel side. The results in general also depend on the sampling tunnel flow rate. In the GTR, the transition angle of inlet airflow has been set to 15° ≤ a ≤ 30° to avoid sudden changes in cross-section shape or size, the body of the enclosure has been defined to be cylindrical to minimize dead points, and the calliper is positioned at 12 o-clock, observing from the wheel side. Flow straighteners or diffusion plates at the inlet’s side help minimize the stagnant zones. Experiments [37,38] and simulations [32] found 6–14% losses for 10 μm for other enclosures (non GTR compliant). Another study, with a similar enclosure as the one prescribed in the GTR, found experimentally measured 11% of the total wear mass (including coarse particles above 10 μm) deposited in the enclosure [31].

4.3. Literature PM Ratios

The reported PM10 to total mass loss values in the literature range from 35% [10,39] to 50–70% [10,14] and largely depend upon the brake (type, material, etc.). A recent interlaboratory study reported values between 35% and 48% for various disc brakes tested under different configurations, but a reduced 21% for a drum brake due to its enclosed nature [40]. The reported values in the literature are affected by particle losses because no loss corrections are usually applied. For example, for the two scenarios and an MMD of 8.5 μm, the ratio could range from 32% (“min penetration”) to 45% (“max penetration”). Furthermore, the values in Table 2 do not consider cases that a separate coarse mode would exist.
Regarding PM2.5/PM10 ratios, other researchers reported values as low as 13% [7,14]. Recent studies have shown that approximately one-third of PM10 falls in the fine-size fraction, indicating that the above studies might have underestimated the PM2.5 fraction. A recent interlaboratory study found PM2.5/PM10 ratios of 38–46% for disc brakes tested under different configurations and 61% for a drum brake applied in the rear axle of a typical compact passenger car [40]. Based on Table 2, the mass ratio PM2.5/PM10 is around 50% for MMDs 2 μm to 2.5 μm and around 32% for 8.5 μm.
From aerodynamic size distributions, calculating the mass distributions does not need an assumption on particle morphology and effective density. Based on review studies [4,6,7], the peak of the supermicron mode was maximum at 2.5 μm aerodynamic diameter [11,32,41]. Most studies found a peak at 1–2 μm [9,14,31,34,42,43,44,45,46,47,48,49,50]. This CMD range (1–2.5 μm) corresponds to an MMD range of 4.2–10.6 μm.
Studies that measured mass distributions with an actual weighing of filters of the different stages of the impactors reported a peak at 2 μm [9], 3 μm [51], 4 μm [14], or 5 μm [43]. An early study reported peaks at sizes >10 μm [39]. Several studies reported similar or slightly higher values using instruments measuring particle number distributions and converting to mass, e.g., 3–6 μm [14,48,49], or real-time mass instruments: 5 μm [52] (a particle density distribution has to be assumed both from electrical mobility diameter to aerodynamical diameter and from the number to mass conversion). Based on review studies [4,6,7], the peaks were at 2–4 μm. MMDs of 4–6 μm would result in a 20–32% PM2.5/PM10 mass ratio and a 45–75% PM10/mass loss ratio.

4.4. Uncertainties and Differences between PM Setups

For a given setup, the previous analysis gives an estimation of the particle losses. It is clear that keeping the flow rates at similar ranges ensures good repeatability but also comparability of different tested brakes for the same setup. However, small variations from the default conditions can affect the results. For example, the test facility altitude above sea level, air relative humidity, air temperature, positive air pressure inside the duct, and vacuum pressure inside the sampling line can all impact up to a few percent the penetrations (for details, see [27]). Furthermore, changes of the flows in the sampling tunnel or the sampling lines and cyclonic separators will have an effect on the penetrations. For example, a 2% change of the flow in the cyclonic separator will change the cut-off size by <2%. This estimation was based on the cyclonic separators’ curves of cut-off sizes in the function of the flow rate (e.g., [53]).
Weighing errors were also not considered. Even for a low emitting brake (1 mg/km), the mass collected on the filter will be >250 μg, even with the “worst” conditions for collecting mass on the filter (high sampling tunnel flow rate and low sampling line flow rate). During the weighing procedure, the reference filters need to be within 5 μg from their moving average. The repeated measurements of a filter have to be within 30 μg. An error of 15 μg translates to a <6% error on the emission levels due to the uncertainty of the filter weighing.
Instead of focusing on such uncertainties, a different approach was followed: it was assumed that different laboratories could have setups that lie between the two scenarios. The differences between the two scenarios give a good estimate of the maximum differences expected for different PM setups.
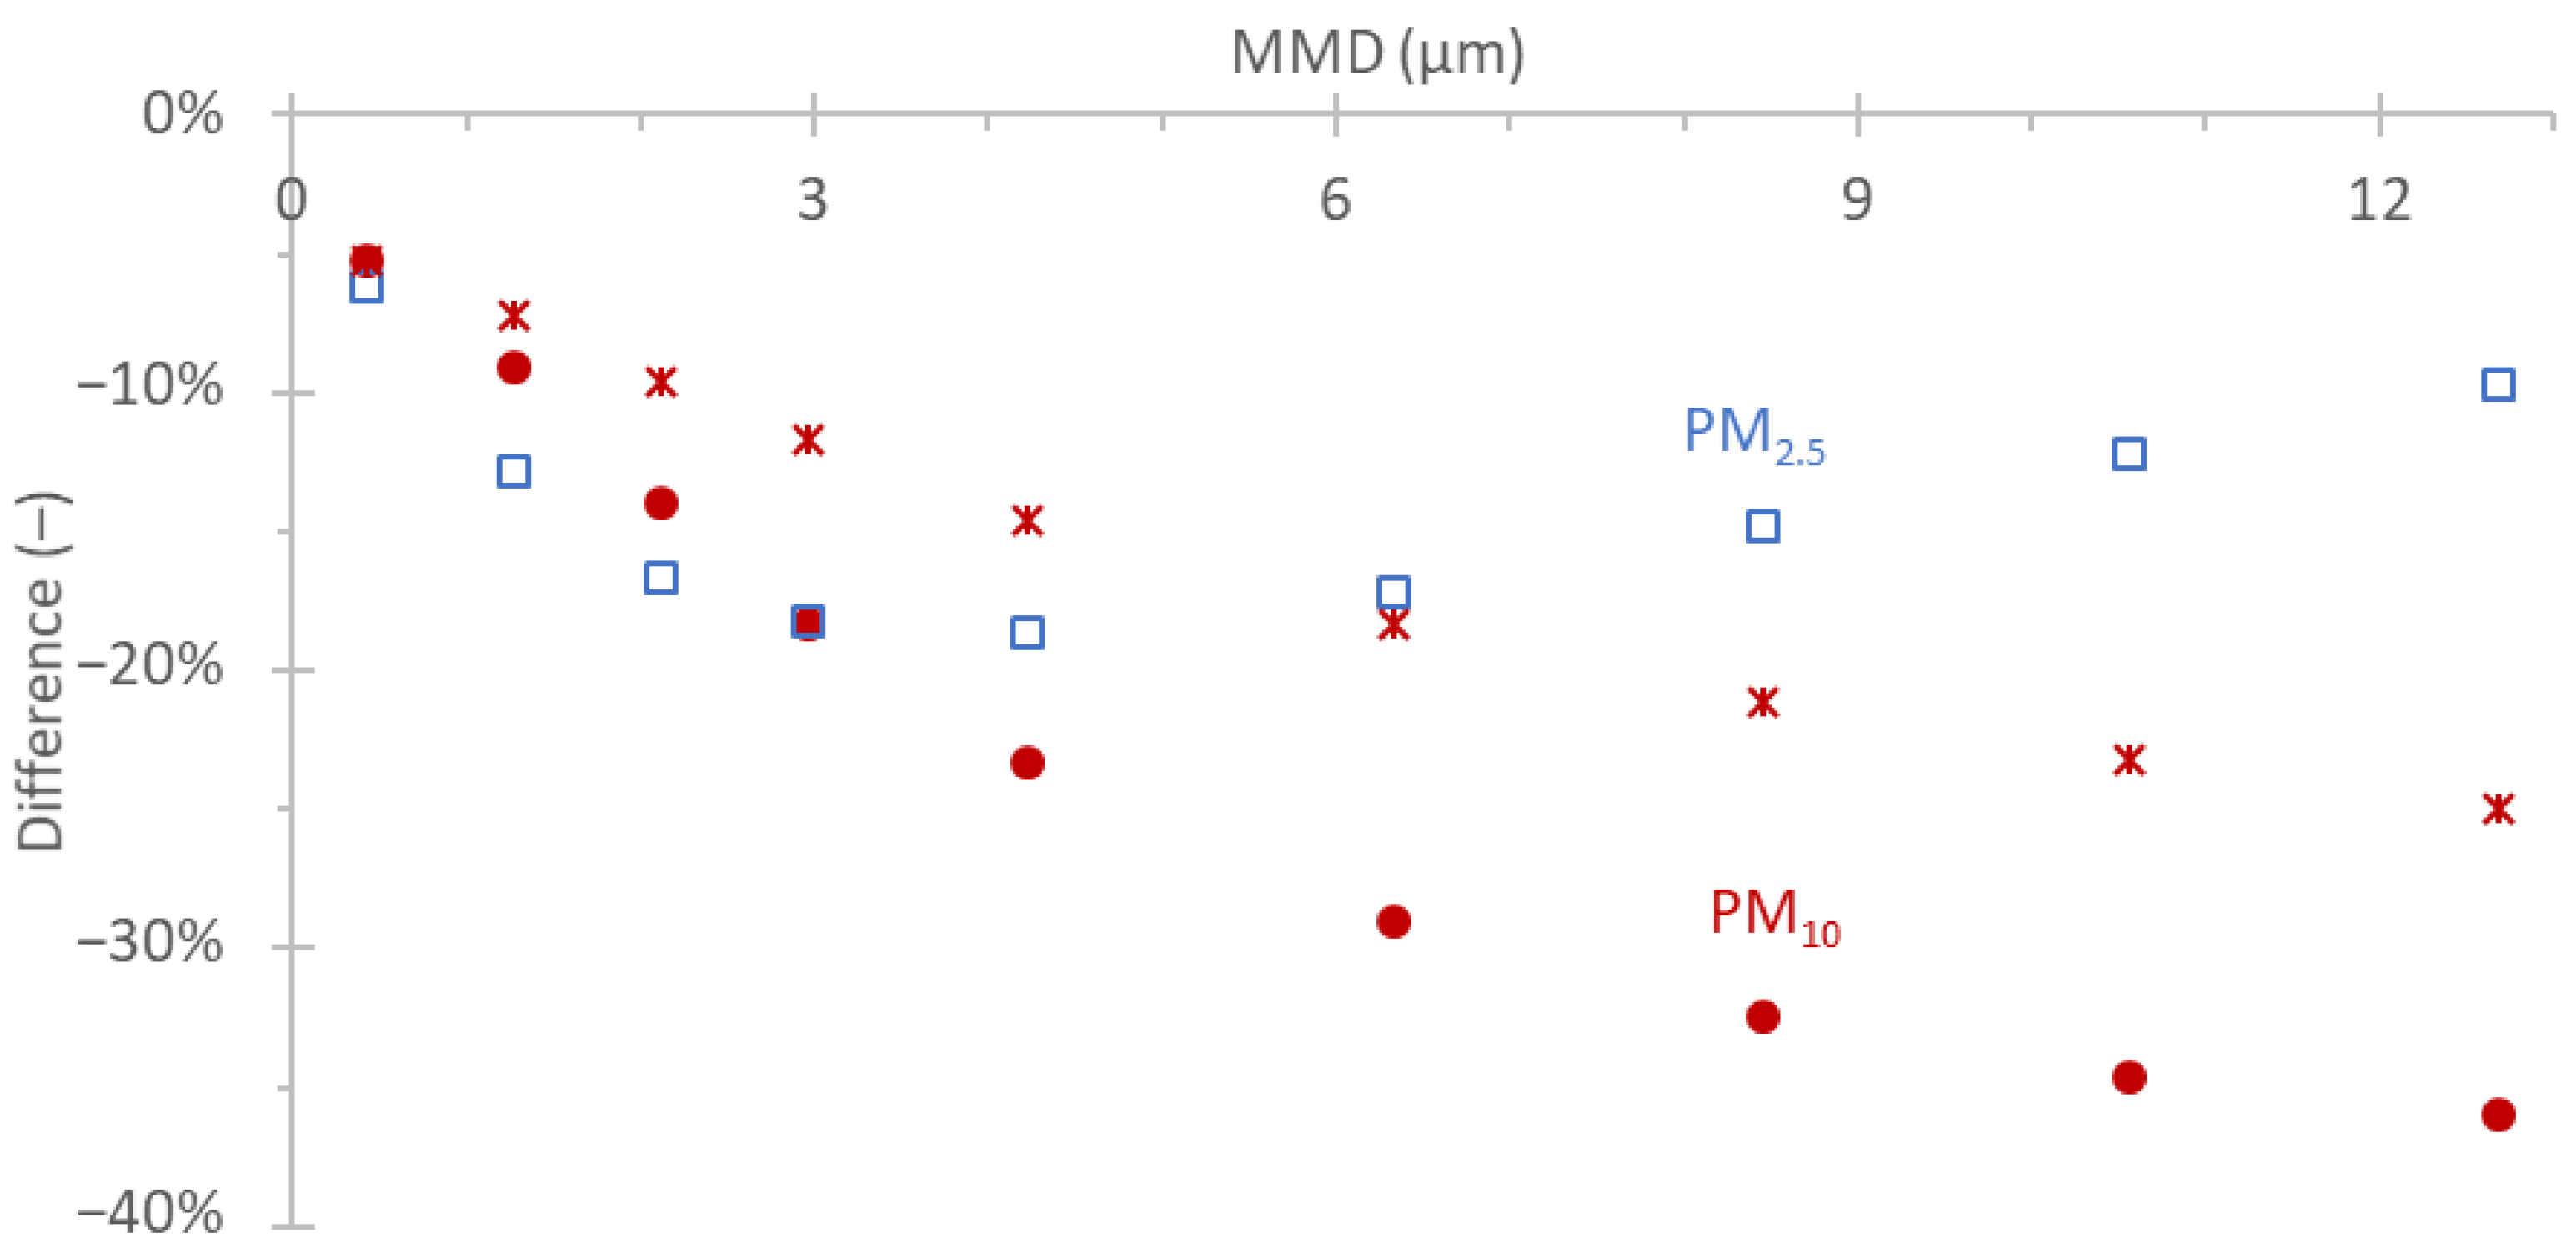
Figure 5 plots the differences between the “max penetration” and “min penetration” setups in the function of the mass median diameter (MMD). The differences were calculated integrating the whole size distributions for both scenarios and comparing the integrated results. Furthermore, particle losses with the “min penetration” enclosure were assumed to be 5% greater than those with the “max penetration” enclosure. The approximation of 5% considers differences in the losses of the enclosures due to different designs and air flow rates (e.g., one enclosure with 4% losses and the other with 9% losses, thus a constant 5% difference for all the sizes). For PM2.5 (open squares), the maximum difference is 19%, while for PM10 (solid circles), the difference is below 25% up to 5 μm. At larger sizes, the difference is below 38%; however, this seems irrelevant for commercial brake systems available in the market, because the MMD is typically around or below 5 μm (see Section 4.3). In practice, commercial systems tend to have smaller differences because commercial cyclonic separators follow curves closer to the “max” penetration curves (see Figure 3a). Using the same penetrations for the 10 μm cyclonic separators for the “min” and “max penetration” scenarios, the PM10 differences (asterisks) would be 14–18% for 4 to 6 μm MMDs, reaching 25% at very large sizes.
During the ILS study [40], the PM2.5/PM10 ratio for disc brakes was 35–48%, corresponding to an MMD of 3.0–4.2 μm (Table 2). This MMD range corresponds to approximately 20% differences, which agrees reasonably with the actual differences found at ILS (after removing outliers).

5. Conclusions

The GTR on the laboratory measurement of brake emissions for light-duty vehicles describes the setup for the determination of the particulate matter (PM) emissions. The brake is installed in an enclosure, where filtered and conditioned air enters and transfers the particles in a sampling tunnel, where the sampling for PM takes place. The sampling path consists of a probe with a nozzle to achieve isokinetic sampling, a cyclonic separator (50% efficiency at 2.5 μm or 10 μm), a sampling line to the PM filter holder, and a flow control device.
Based on the allowed ranges of the technical specifications, two scenarios were formulated: one with high (“max”) penetration and one with low (“min”) penetration of particles. The analysis showed that the penetration curves of the cyclonic separators are crucial in determining the penetrations of the whole setup. For the “min penetration” scenario, particle losses in the sampling line and the probe were significant, resulting in a further decrease in the penetrations. For example, at 10 μm, the penetration was around 20% instead of 50%, which would be the “ideal” penetration mimicking the thoracic penetration at this size.
Further analysis simulating polydisperse size distribution gave estimations of number and mass fractions at different mass median diameters (MMDs). The ratios of PM2.5 to PM10 were also calculated for different MMDs. Based on a literature review, the MMDs typically are around 5 μm, which would mean 20–32% PM2.5/PM10 mass ratio and a 45–75% PM10/mass loss ratio.
Finally, the differences between the two scenarios were taken as possible maximum differences between different setups. The differences were <19% for PM2.5, while for PM10 the differences were <25% up to 5 μm. Having stricter requirements for the cyclonic separators could reduce the PM10 differences to well below 20%.

Author Contributions

Conceptualization, T.G. and B.G.; formal analysis, B.G.; writing—original draft preparation, T.G. and B.G.; writing—review and editing, A.M., R.V., M.A., D.L., C.H., M.M. and C.A. All authors have read and agreed to the published version of the manuscript.

Funding

This research received no external funding.

Institutional Review Board Statement

Not applicable.

Informed Consent Statement

Not applicable.

Data Availability Statement

Not applicable.

Conflicts of Interest

The authors declare no conflict of interest.
Disclaimer: The opinions expressed in this manuscript are those of the authors and should in no way be considered to represent an official opinion of the European Commission, and/or the instrument manufacturers. Mention of trade names or commercial products does not constitute endorsement or recommendation by the European Commission, the instrument manufacturers, and/or the authors.

References

  1. European Environmental Agency (EEA) Air Quality in Europe 2022. Report No. 05/2022. ISBN 978-92-9480-515-7. Available online: https://www.eea.europa.eu/publications/air-quality-in-europe-2022 (accessed on 5 March 2023).
  2. Beloconi, A.; Vounatsou, P. Substantial Reduction in Particulate Matter Air Pollution across Europe during 2006–2019: A Spatiotemporal Modeling Analysis. Environ. Sci. Technol. 2021, 55, 15505–15518. [Google Scholar] [CrossRef] [PubMed]
  3. Hjelm, R.; Wahlström, J.; Yenibayrak, I.; Sabani, D.; Runsten, P.; Lyu, Y. Airborne Wear Particles from Dry Clutches. Atmosphere 2022, 13, 1700. [Google Scholar] [CrossRef]
  4. Piscitello, A.; Bianco, C.; Casasso, A.; Sethi, R. Non-Exhaust Traffic Emissions: Sources, Characterization, and Mitigation Measures. Sci. Total Environ. 2021, 766, 144440. [Google Scholar] [CrossRef] [PubMed]
  5. OECD. Non-Exhaust Particulate Emissions from Road Transport: An Ignored Environmental Policy Challenge; OECD: Paris, France, 2020; ISBN 978-92-64-45244-2. [Google Scholar]
  6. Grigoratos, T.; Martini, G. Brake Wear Particle Emissions: A Review. Environ. Sci. Pollut. Res. 2015, 22, 2491–2504. [Google Scholar] [CrossRef] [PubMed] [Green Version]
  7. Fussell, J.C.; Franklin, M.; Green, D.C.; Gustafsson, M.; Harrison, R.M.; Hicks, W.; Kelly, F.J.; Kishta, F.; Miller, M.R.; Mudway, I.S.; et al. A Review of Road Traffic-Derived Non-Exhaust Particles: Emissions, Physicochemical Characteristics, Health Risks, and Mitigation Measures. Environ. Sci. Technol. 2022, 56, 6813–6835. [Google Scholar] [CrossRef]
  8. Hicks, W.; Beevers, S.; Tremper, A.H.; Stewart, G.; Priestman, M.; Kelly, F.J.; Lanoisellé, M.; Lowry, D.; Green, D.C. Quantification of Non-Exhaust Particulate Matter Traffic Emissions and the Impact of COVID-19 Lockdown at London Marylebone Road. Atmosphere 2021, 12, 190. [Google Scholar] [CrossRef]
  9. Hagino, H.; Oyama, M.; Sasaki, S. Laboratory Testing of Airborne Brake Wear Particle Emissions Using a Dynamometer System under Urban City Driving Cycles. Atmos. Environ. 2016, 131, 269–278. [Google Scholar] [CrossRef] [Green Version]
  10. Perricone, G.; Wahlström, J.; Olofsson, U. Towards a Test Stand for Standardized Measurements of the Brake Emissions. Proc. Inst. Mech. Engineers. Part D J. Automob. Eng. 2016, 230, 1521–1528. [Google Scholar] [CrossRef]
  11. zum Hagen, F.H.F.; Mathissen, M.; Grabiec, T.; Hennicke, T.; Rettig, M.; Grochowicz, J.; Vogt, R.; Benter, T. Study of Brake Wear Particle Emissions: Impact of Braking and Cruising Conditions. Environ. Sci. Technol. 2019, 53, 5143–5150. [Google Scholar] [CrossRef]
  12. Mathissen, M.; Grigoratos, T.; Gramstat, S.; Mamakos, A.; Vedula, R.; Agudelo, C.; Grochowicz, J.; Giechaskiel, B. Interlaboratory Study on Brake Particle Emissions Part II: Particle Number Emissions. Atmosphere 2023, 14, 424. [Google Scholar] [CrossRef]
  13. Kwak, J.; Kim, H.; Lee, J.; Lee, S. Characterization of Non-Exhaust Coarse and Fine Particles from on-Road Driving and Laboratory Measurements. Sci. Total Environ. 2013, 458–460, 273–282. [Google Scholar] [CrossRef]
  14. Sanders, P.G.; Xu, N.; Dalka, T.M.; Maricq, M.M. Airborne Brake Wear Debris: Size Distributions, Composition, and a Comparison of Dynamometer and Vehicle Tests. Environ. Sci. Technol. 2003, 37, 4060–4069. [Google Scholar] [CrossRef] [PubMed]
  15. Perricone, G.; Alemani, M.; Wahlström, J.; Olofsson, U. A Proposed Driving Cycle for Brake Emissions Investigation for Test Stand. Proc. Inst. Mech. Eng. Part D J. Automob. Eng. 2020, 234, 122–135. [Google Scholar] [CrossRef]
  16. European Commission Euro 7 Proposal. 2022. Available online: https://single-market-economy.ec.europa.eu/sectors/automotive-industry/environmental-protection/emissions-automotive-sector_en (accessed on 5 March 2023).
  17. GRPE 87-40e Proposal for a New UN GTR on Laboratory Measurement of Brake Emissions for Light-Duty Vehicles 2023. 87th GRPE session, Geneva Switzerland, 11–13 June 2023. Available online: https://unece.org/transport/documents/2023/01/informal-documents/clean-pmp-proposal-amend-ecetranswp29grpe20234 (accessed on 10 November 2022).
  18. Grigoratos, T.; Mamakos, A.; Arndt, M.; Lugovyy, D.; Anderson, R.; Hafenmayer, C.; Moisio, M.; Vanhanen, J.; Frazee, R.; Agudelo, C.; et al. Characterization of Particle Number Setups for Measuring Brake Particle Emissions and Comparison with Exhaust Setups. Atmosphere 2023, 14, 103. [Google Scholar] [CrossRef]
  19. Mathissen, M.; Grochowicz, J.; Schmidt, C.; Vogt, R.; zum Hagen, F.H.F.; Grabiec, T.; Steven, H.; Grigoratos, T. A Novel Real-World Braking Cycle for Studying Brake Wear Particle Emissions. Wear 2018, 414–415, 219–226. [Google Scholar] [CrossRef]
  20. McFarland, A.R.; Gong, H.; Muyshondt, A.; Wente, W.B.; Anand, N.K. Aerosol Deposition in Bends with Turbulent Flow. Environ. Sci. Technol. 1997, 31, 3371–3377. [Google Scholar] [CrossRef]
  21. Mamakos, A.; Huber, M.P.; Arndt, M.; Reingruber, H.; Steiner, G.; Weidinger, C. Design of a Laboratory Sampling System for Brake Wear Particle Measurements; SAE International: Warrendale, PA, USA, 2022. [Google Scholar]
  22. Giechaskiel, B.; Arndt, M.; Schindler, W.; Bergmann, A.; Silvis, W.; Drossinos, Y. Sampling of Non-Volatile Vehicle Exhaust Particles: A Simplified Guide. SAE Int. J. Engines 2012, 5, 379–399. [Google Scholar] [CrossRef]
  23. Hinds, W.C. Aerosol Technology: Properties, Behavior, and Measurement of Airborne Particles, 2nd ed.; Wiley: New York, NY, USA, 1999; ISBN 978-0-471-19410-1. [Google Scholar]
  24. Aerosol Measurement: Principles, Techniques, and Applications, 3rd ed.; Baron, P.A.; Kulkarni, P.; Willeke, K. (Eds.) Wiley: Hoboken, NJ, USA, 2011; ISBN 978-0-470-38741-2. [Google Scholar]
  25. Vincent, J.H. Aerosol Sampling: Science, Standards, Instrumentation and Applications; John Wiley & Sons: Chichester, UK; Hoboken, NJ, USA, 2007; ISBN 978-0-470-02725-7. [Google Scholar]
  26. Von der Weiden, S.-L.; Drewnick, F.; Borrmann, S. Particle Loss Calculator—A New Software Tool for the Assessment of the Performance of Aerosol Inlet Systems. Atmos. Meas. Tech. 2009, 2, 479–494. [Google Scholar] [CrossRef] [Green Version]
  27. Agudelo, C.; Vedula, R.T.; Odom, T. Estimation of Transport Efficiency for Brake Emissions Using Inertia Dynamometer Testing; SAE International: Warrendale, PA, USA, 2018. [Google Scholar]
  28. Baron, P.A. Description of an Aerosol Calculator. In Proceedings of the Seventh International Aerosol Conference, American Association for Aerosol Research (AAAR), Saint Paul, MN, USA, 10–15 September 2006; p. 555. [Google Scholar]
  29. Dirgo, J.; Leith, D. Cyclone Collection Efficiency: Comparison of Experimental Results with Theoretical Predictions. Aerosol Sci. Technol. 1985, 4, 401–415. [Google Scholar] [CrossRef] [Green Version]
  30. ISO 7708:1995; Air Quality—Particle Size Fraction Definitions for Health-Related Sampling. International Organization for Standardization: Geneva, Switzerland, 1995.
  31. Mamakos, A.; Arndt, M.; Hesse, D.; Augsburg, K. Physical Characterization of Brake-Wear Particles in a PM10 Dilution Tunnel. Atmosphere 2019, 10, 639. [Google Scholar] [CrossRef] [Green Version]
  32. Hesse, D.; Augsburg, K. Real Driving Emissions Measurement of Brake Dust Particles; Springer: Wiesbaden, Germany, 2018. [Google Scholar]
  33. Mamakos, A.; Arndt, M.; Hesse, D.; Hamatschek, C.; Augsburg, K. Comparison of Particulate Matter and Number Emissions from a Floating and a Fixed Caliper Brake System of the Same Lining Formulation; SAE International: Warrendale, PA, USA, 2020. [Google Scholar]
  34. Andersson, J.; Campbell, M.; Marshall, I.; Kramer, L.; Norris, J. Measurement of Emissions from Brake and Tyre Wear; Final Report—Phase 1; Ricardo Energy & Environment: Oxfordshire, UK, 2022. [Google Scholar]
  35. Agudelo, C.; Vedula, R.T.; Capecelatro, J.; Wang, Q. Design of Experiments for Effects and Interactions during Brake Emissions Testing Using High-Fidelity Computational Fluid Dynamics; SAE International: Warrendale, PA, USA, 2019. [Google Scholar]
  36. Zhang, T.; Choi, S.; Ahn, S.; Nam, C.; Lee, G. Enclosure Design for Brake Wear Particle Measurement Using Computational Fluid Dynamics. Energies 2021, 14, 2356. [Google Scholar] [CrossRef]
  37. Augsburg, K.; Hesse, D.; Feißel, T.; Wenzel, F.; Germanow, P. Cfd Based Analysis of Particle-Air Interaction within a Sampling Device for Brake Dust Emissions; FISITA (UK): The Hague, The Netherlands, 2018; ISBN 978-0-9572076-5-3. [Google Scholar]
  38. Hesse, D.; Hamatschek, C.; Feißel, T.; Sachse, H.; Augsburg, K.; Gramstat, S. Investigations on the Deposition Behaviour of Brake Wear Particles on the Wheel Surface; SAE International: Warrendale, PA, USA, 2021. [Google Scholar]
  39. Garg, B.D.; Cadle, S.H.; Mulawa, P.A.; Groblicki, P.J.; Laroo, C.; Parr, G.A. Brake Wear Particulate Matter Emissions. Environ. Sci. Technol. 2000, 34, 4463–4469. [Google Scholar] [CrossRef]
  40. Grigoratos, T.; Mathissen, M.; Vedula, R.; Mamakos, A.; Agudelo, C.; Gramstat, S.; Giechaskiel, B. Interlaboratory Study on Brake Particle Emissions—Part I: Particulate Matter Mass Emissions. Atmosphere 2023, 14, 498. [Google Scholar] [CrossRef]
  41. Beji, A.; Deboudt, K.; Khardi, S.; Muresan, B.; Flament, P.; Fourmentin, M.; Lumière, L. Non-Exhaust Particle Emissions under Various Driving Conditions: Implications for Sustainable Mobility. Transp. Res. Part D Transp. Environ. 2020, 81, 102290. [Google Scholar] [CrossRef]
  42. Chasapidis, L.; Melas, A.D.; Tsakis, A.; Zarvalis, D.; Konstandopoulos, A.A. Sampling and Conditioning Particle System for Solid Particle Measurements down to 10 nm; SAE International: Warrendale, PA, USA, 2019. [Google Scholar]
  43. Kukutschová, J.; Moravec, P.; Tomášek, V.; Matějka, V.; Smolík, J.; Schwarz, J.; Seidlerová, J.; Šafářová, K.; Filip, P. On Airborne Nano/Micro-Sized Wear Particles Released from Low-Metallic Automotive Brakes. Environ. Pollut. 2011, 159, 998–1006. [Google Scholar] [CrossRef]
  44. Perricone, G.; Matĕjka, V.; Alemani, M.; Wahlström, J.; Olofsson, U. A Test Stand Study on the Volatile Emissions of a Passenger Car Brake Assembly. Atmosphere 2019, 10, 263. [Google Scholar] [CrossRef] [Green Version]
  45. Alemani, M.; Nosko, O.; Metinoz, I.; Olofsson, U. A Study on Emission of Airborne Wear Particles from Car Brake Friction Pairs. SAE Int. J. Mater. Manf. 2015, 9, 147–157. [Google Scholar] [CrossRef]
  46. Agudelo, C.; Vedula, R.T.; Collier, S.; Stanard, A. Brake Particulate Matter Emissions Measurements for Six Light-Duty Vehicles Using Inertia Dynamometer Testing; SAE International: Warrendale, PA, USA, 2020. [Google Scholar] [CrossRef]
  47. Matějka, V.; Metinöz, I.; Wahlström, J.; Alemani, M.; Perricone, G. On the Running-in of Brake Pads and Discs for Dyno Bench Tests. Tribol. Int. 2017, 115, 424–431. [Google Scholar] [CrossRef]
  48. Park, J.; Joo, B.; Seo, H.; Song, W.; Lee, J.J.; Lee, W.K.; Jang, H. Analysis of Wear Induced Particle Emissions from Brake Pads during the Worldwide Harmonized Light Vehicles Test Procedure (WLTP). Wear 2021, 466–467, 203539. [Google Scholar] [CrossRef]
  49. Iijima, A.; Sato, K.; Yano, K.; Tago, H.; Kato, M.; Kimura, H.; Furuta, N. Particle Size and Composition Distribution Analysis of Automotive Brake Abrasion Dusts for the Evaluation of Antimony Sources of Airborne Particulate Matter. Atmos. Environ. 2007, 41, 4908–4919. [Google Scholar] [CrossRef]
  50. Alemani, M.; Wahlström, J.; Olofsson, U. On the Influence of Car Brake System Parameters on Particulate Matter Emissions. Wear 2018, 396–397, 67–74. [Google Scholar] [CrossRef]
  51. Harrison, R.M.; Jones, A.M.; Gietl, J.; Yin, J.; Green, D.C. Estimation of the Contributions of Brake Dust, Tire Wear, and Resuspension to Nonexhaust Traffic Particles Derived from Atmospheric Measurements. Environ. Sci. Technol. 2012, 46, 6523–6529. [Google Scholar] [CrossRef] [PubMed]
  52. Oroumiyeh, F.; Zhu, Y. Brake and Tire Particles Measured from On-Road Vehicles: Effects of Vehicle Mass and Braking Intensity. Atmos. Environ. X 2021, 12, 100121. [Google Scholar] [CrossRef]
  53. Azadi, M.; Azadi, M.; Mohebbi, A. A CFD Study of the Effect of Cyclone Size on Its Performance Parameters. J. Hazard. Mater. 2010, 182, 835–841. [Google Scholar] [CrossRef] [PubMed]
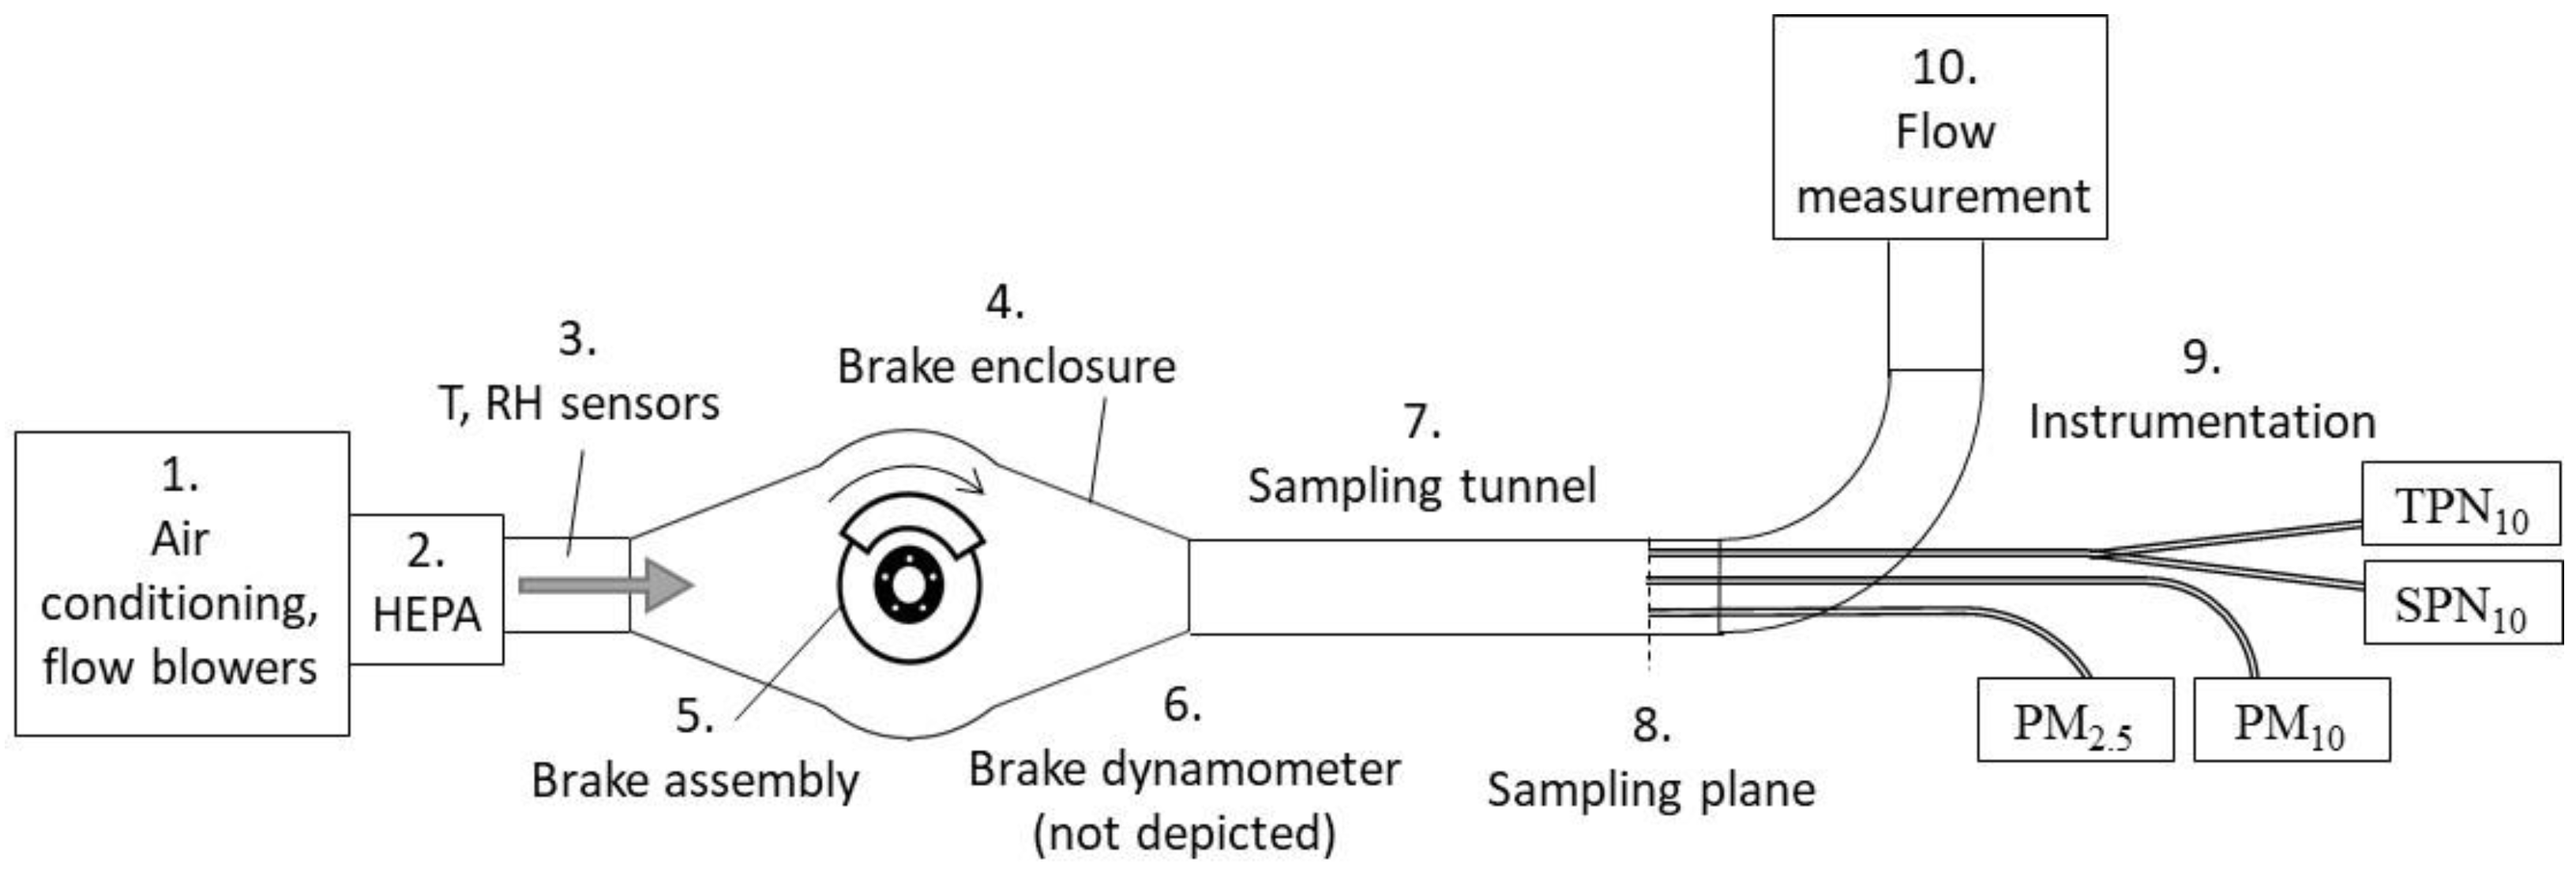
Figure 1. Example of a laboratory setup for the measurement of brake emissions. HEPA = high efficiency particulate air filter; PM = particulate matter; RH = relative humidity; SPN = solid particle number; T = temperature; TPN = total particle number.
Atmosphere 14 00516 g001
Figure 2. Overview of the technical requirements of the particulate matter (PM) setup. d = diameter; HEPA = high efficiency particle air filter; L = length; noz = nozzle; tun = tunnel; R = radius; RT = residence time; SE = sampling efficiency; v = velocity.
Atmosphere 14 00516 g002
Figure 3. Monodisperse particle penetration of the PM setup with 2.5 μm and 10 μm cyclonic separators assuming: (a) minimum losses (“max penetration” setup); (b) maximum losses and flexibilities (“min penetration” setup). Asterisks indicate 50% penetration at 2.5 μm and 10 μm. Open symbols are penetrations from the calibration certificates of cyclonic separators.
Atmosphere 14 00516 g003
Figure 4. Example of an inlet size distribution with count median diameter (CMD) 0.7 μm and geometric standard deviation of 2. This corresponds to mass median diameter (MMD) 3.0 μm. Based on the penetrations of Figure 3a (“min penetration”), the PM2.5 and PM10 fractions are 33% and 74%, respectively. The PM2.5 to PM10 mass ratio is 45%. “a.u.” = arbitrary units.
Atmosphere 14 00516 g004
Figure 5. Differences of PM between “max penetration” and “min penetration” setups with cyclonic separators of 2.5 μm (open squares) and 10 μm (solid circles). Asterisks give the difference of the two scenarios using the same 10 μm cyclonic separators. The mass median diameter (MMD) was calculated from the Count Median Diameter (CMD), assuming a geometric standard deviation of 2 (see main text).
Atmosphere 14 00516 g005
Table 1. Assumed parameters for the estimation of particle losses for the two scenarios.
Part“Max Penetration” Setup“Min Penetration” Setup
NozzleIsoaxial θ = 0°Anisoaxial θ = 15°
Nozzle dnoz = 5 mmdnoz = 16.5 mm
NozzleIsokinetic ratio = 1.0Anisokinetic ratio = 1.15
Gravitational losesTunnel, probe, sampling lineTunnel, probe, sampling line
Inertial lossesTunnel, probe, sampling lineTunnel, probe, sampling line
TunnelQi = 1100 m3/h, di = 175 mm, Li = 1 mQi = 100 m3/h, di = 225 mm, Li = 1.35 m
Tunnel bendNo bend90°, rb,i = 450 mm
ProbeQp = 15 L/min, dp = 10 mm, Lp = 1 mQp = 10 L/min, dp = 18 mm, Lp = 1 m
Probe bendNo bend90°, rb,p = 72 mm
Sampling (PSL)Qs = 15 L/min, ds = 10 mm, Ls = 1 mQs = 10 L/min, ds = 20 mm, Ls = 1 m
PSL bend90°, rb,s = 250 mm180°, rb,s = 500 mm
Cyclone 2.5 μmP1.5μm = 90%, P2μm = 70%, P3μm = 30%, P4μm = 10%P1.5μm = 80%, P2μm = 50%, P3μm = 25%, P4μm = 10%
Cyclone 10 μmP4μm = 94%, P8μm = 66%, P10μm = 50%, P12.5μm = 33%P4μm = 80%, P8μm = 50%, P10μm = 40%, P12.5μm = 27%
d = diameter; L = length; P = penetration; PSL = PM sampling line; Q = flow rate; r = radius.
Table 2. Calculated number/mass (polydisperse) penetrations of two PM setups (with “min penetration” and “max penetration”) using 2.5 μm and 10 μm cyclonic separators for various count median diameters (CMDs) or mass median diameters (MMDs). The PM2.5 to PM10 mass ratio is also given. See Table 1 for details on the different setups.
Scenario“Min Penetration” Setup“Max Penetration” Setup
CMD/MMD 12.5 μm10 μmPM2.5/PM102.5 μm10 μmPM2.5/PM10
0.1 μm/0.4 μm100%/97%100%/100%98%100%/98%100%/100%99%
0.3 μm/1.3 μm99%/72%100%/93%77%100%/78%100%/98%80%
0.5 μm/2.1 μm96%/49%99%/84%58%98%/55%100%/92%60%
0.7 μm/3.0 μm91%/33%98%/74%45%94%/39%99%/86%45%
1.0 μm/4.2 μm82%/20%96%/60%32%87%/23%99%/75%31%
1.5 μm/6.3 μm66%/9%91%/43%21%73%/10%96%/58%18%
2.0 μm/8.5 μm53%/5%85%/32%14%60%/5%93%/45%11%
2.5 μm/10.6 μm42%/2%79%/24%10%49%/3%89%/35%8%
3.0 μm/12.7 μm34%/1%73%/18%8%40%/2%85%/27%6%
1 Assuming a geometric standard deviation of 2 (see main text).
Table 3. Calculated number/mass (polydisperse) penetrations beyond the larynx (thoracic fraction) and to the unciliated airways (respirable fraction), for various count median diameters (CMDs) or mass median diameters (MMDs).
ScenarioISO 7708:1995
CMD/MMD 1Respirable (2.5 μm)Thoracic (10 μm)PM2.5/PM10
0.1 μm/0.4 μm100%/98%100%/99%99%
0.3 μm/1.3 μm99%/76%99%/96%80%
0.5 μm/2.1 μm97%/54%99%/92%59%
0.7 μm/3.0 μm93%/38%98%/87%44%
1.0 μm/4.2 μm85%/23%97%/79%29%
1.5 μm/6.3 μm71%/11%95%/65%16%
2.0 μm/8.5 μm59%/5%92%/53%10%
2.5 μm/10.6 μm48%/3%90%/44%7%
3.0 μm/12.7 μm39%/2%87%/36%5%
1 Assuming a geometric standard deviation of 2.
Disclaimer/Publisher’s Note: The statements, opinions and data contained in all publications are solely those of the individual author(s) and contributor(s) and not of MDPI and/or the editor(s). MDPI and/or the editor(s) disclaim responsibility for any injury to people or property resulting from any ideas, methods, instructions or products referred to in the content.