Article

Faster, Better, Cheaper: Solutions to the Atmospheric Shipping Emission Compliance and Attribution Conundrum

1
Plymouth Marine Laboratory, Prospect Place, Plymouth PL1 3DH, UK
2
exactEarth Europe Limited, Electron House, Fermi Avenue, Harwell Campus, Oxfordshire OX11 0QR, UK
3
TNO STL, Anna van Buerenplein 1, NL-2595 DA Den Haag, The Netherlands
*
Author to whom correspondence should be addressed.
Atmosphere 2023, 14(3), 500; https://doi.org/10.3390/atmos14030500
Submission received: 5 February 2023 / Revised: 27 February 2023 / Accepted: 3 March 2023 / Published: 4 March 2023
(This article belongs to the Special Issue Atmospheric Shipping Emissions and Their Environmental Impacts)

Abstract

:
Global concerns regarding air quality have over the past decade led to the introduction of regulations by the International Maritime Organisation curbing the emissions of sulphur and nitrogen oxides (SOx, NOx). These limits were implemented initially in so-called “emission control areas”, defined where the density of shipping activity combines with large coastal population centres such as northwest Europe or eastern USA. However, any legislation requires a scientifically robust and rigorous monitoring program to ensure compliance and prove attribution to an individual vessel. We argue the case for adherence to the mantra “faster, better, cheaper”, where widespread adoption of independent low-cost solutions of onboard, in-stack sensors, combined with existing, globally ubiquitous satellite-based “automatic identification system” (AIS) data telemetry, provides an excellent solution to the affordable compliance and attribution conundrum for shipping companies and enforcement agencies alike. We present data from three field-campaigns which have significantly advanced the concept of onboard real-time monitoring of atmospheric ship emissions.

1. Introduction

Sulphur dioxide (SO2) is produced by the combustion of materials that contain sulphur such as fossil fuels and constitutes a major air pollutant. SO2 is linked with several adverse effects on the respiratory system [1] and poses a particularly high risk to children, the elderly, and asthmatics [2]. This pollution is not just confined to urban and industrial regions; globally, ship emissions of SO2 are approximately threefold greater than those from road traffic and aviation combined [3]. This is due to the combustion of traditionally low-grade, high-sulphur-content fuels in ship engines. The effects of SO2 pollution are particularly acute within shipping lanes and close to the coast [4,5]. SO2 is also a precursor to atmospheric particulates (aerosols); air quality models estimate that aerosols resulting from ship emissions contribute to tens of thousands of premature deaths near coastlines [6]. As the global population expands and shipping-based trade increases, without regulations, the impact of SO2 pollution is expected to be further exacerbated [7].
In contrast to the marine atmospheric environment, SO2 emissions from land-based combustion sources (e.g., power stations and transport) have been subject to strict regulation since the 1950s. This legislation has significantly reduced the atmospheric sulphur burden over land in North America and Europe [8,9,10]. In contrast, ship exhaust emissions have for a long period been excluded from international environmental agreements.

1.1. Regulatory Background

In January 2015, air quality regulations from the International Maritime Organisation (IMO) came into force. These regulations were aimed at reducing the maximum allowed sulphur emissions by a factor of 10 in emission control areas (ECAs) from 1% (regulation since 2010) to 0.1% of fuel by mass. The English Channel, and the North and Baltic Seas are such designated areas in Europe. The IMO set a further target for open ocean emissions of SO2 to be reduced from the pre-2020 level of 3.5% to 0.5%, which took effect in January 2020. Furthermore, new regulations governing the emissions of nitrogen oxides (NOx) for the European ECA came into force in January 2021.

1.2. The Problem

Any legislation needs to have a robust and rigorous monitoring program to ensure compliance and prove attribution to an individual vessel. Current compliance is measured by inspection of logbooks and fuel samples taken in port. Some remote techniques such as “sniffer” drones [11,12] and bridge-mounted installations [13] have been technologically implemented, but legislative compliance still requires in-port inspections. Additionally, drone and in situ monitoring stations are unlikely to achieve the sheer scale of coverage required to monitor emissions in an ECA or indeed the global open ocean.

1.3. A Potential Solution

In order for universal legislation compliance to be achieved, the density of the monitoring network needs to be upscaled to cover all locations on a continuous timescale (i.e., everywhere, all the time). Nominally this is either prohibitively expensive or, if considering a satellite remote sensing approach [14], still not technically possible (e.g., single overpass a day, problematic cloud coverage, insufficient spatial resolution, or algorithms still in development). An alternative solution to this would be for individual vessels to monitor their own emissions from within the exhaust flow. However, this can also be undesirably expensive for ship owners given that the cost of high precision, multi-species gas analysers (e.g., Fourier-transform infrared spectroscopy—FTIR) is on the order of 100,000 EUR, with ongoing technical maintenance being necessary. Therefore, there is a need, if ubiquitous onboard monitoring is to be practical, to adopt low-cost emission sensors more universally, even if this comes at the expense of high levels of accuracy and precision.
In this paper, we describe and implement a technological concept to address the issue of compliance with the IMO legislation across the European ECA. Our concept builds upon two technologies that are already commercialised and widely available: (a) satellite-based automatic identification system (S-AIS) and (b) compact (portable) gas analysers designed for measuring engine exhausts. Our novel innovation is the integration of these technologies with telemeter real-time emission data from individual ships. Our approach has the potential for 100% coverage, will be scalable to the global ocean, and critically, will be able to attribute emissions to individual ships.
To this end, we describe three technology development field trials:
  • Trial 1 took place in Plymouth (UK) on 2 March 2017. It proved the concept of telemetering live engine emission data, which were measured using an inline FTIR, from the PML Research Vessel (RV) Plymouth Quest and transmitted using a standard AIS VHF.
  • Trial 2, as part of the EU Horizon 2020 project SCIPPER (Shipping Contributions to Inland Pollution Push for the Enforcement of Regulations), similarly used RV Plymouth Quest operating out of Plymouth between May and August 2021, but using a relatively low-cost solution inline sensor package and telemetered data live via satellite AIS (S-AIS) or 4G cellular connection when returned to port.
  • Trial 3 used a measurement package configuration similar to trial 2, but the vessel used was the Ro-Ro/passenger ship Stena Germanica, operating between Gothenburg (SE) and Kiel (DE) for the period 31 August–11 September 2021 (SCIPPER Project Campaign 2).

2. Materials and Methods

Figure 1 shows the emissions reporting system in schematic form, with its four key elements of (1) sampling and gas analysis (Gasmet), (2) further data processing and AIS transmission string encoding (Valmet), (3) terrestrial AIS data transmission (SRT-Marine), and (4) terrestrial AIS data reception and decoding (PML). Table 1 shows the concepts proved in Trial 1.
(1)
An inlet valve was attached to the ship’s exhaust within the engine room so that a filter could be joined to allow direct sampling of the gases emitted. This was connected, via heated lines, to the Gasmet sampling unit, situated a short distance away in the ship’s wet laboratory. This unit also drew in N2 gas from a bottled supply to act as a zero-calibration standard. The sampling unit fed into a Gasmet FTIR gas analyser, which is capable of simultaneously quantifying 16 or more gases using their known spectroscopic responses.
(2)
The gas concentration data were then sent every minute using an RS-232 serial connection to a controlling Laptop PC situated in the ship’s wheelhouse. The data were reduced at this stage to reporting only four channels of IFGC: a diagnostic value for the FTIR, SO2, CO2, and NOx (reported as NO2). The data were then passed via an RS-232 serial connection to the Valmet PC for onward systems control processing. The Valmet PC read the serial input from the Gasmet system every 60 s, stored the value in the DNA Historian database, and converted the data into an AIS Message 8 “binary broadcast message” (BBM—see Appendix A).
(3)
The AIS message was then subsequently sent to the SRT-Marine Apollo AIS transceiver (every 60 s) via RS-422 for onward RF transmission. The data were transmitted by the AIS transceiver and received at both Rame Head (50.317° N, 4.220° W) and PML (50.366° N, 4.148° W).
(4)
Each AIS Message 8 received and attributed to the unique MMSI of the RV Plymouth Quest (235017045) was then merged with the closest in time values of its position, speed and course (AIS Message 1).
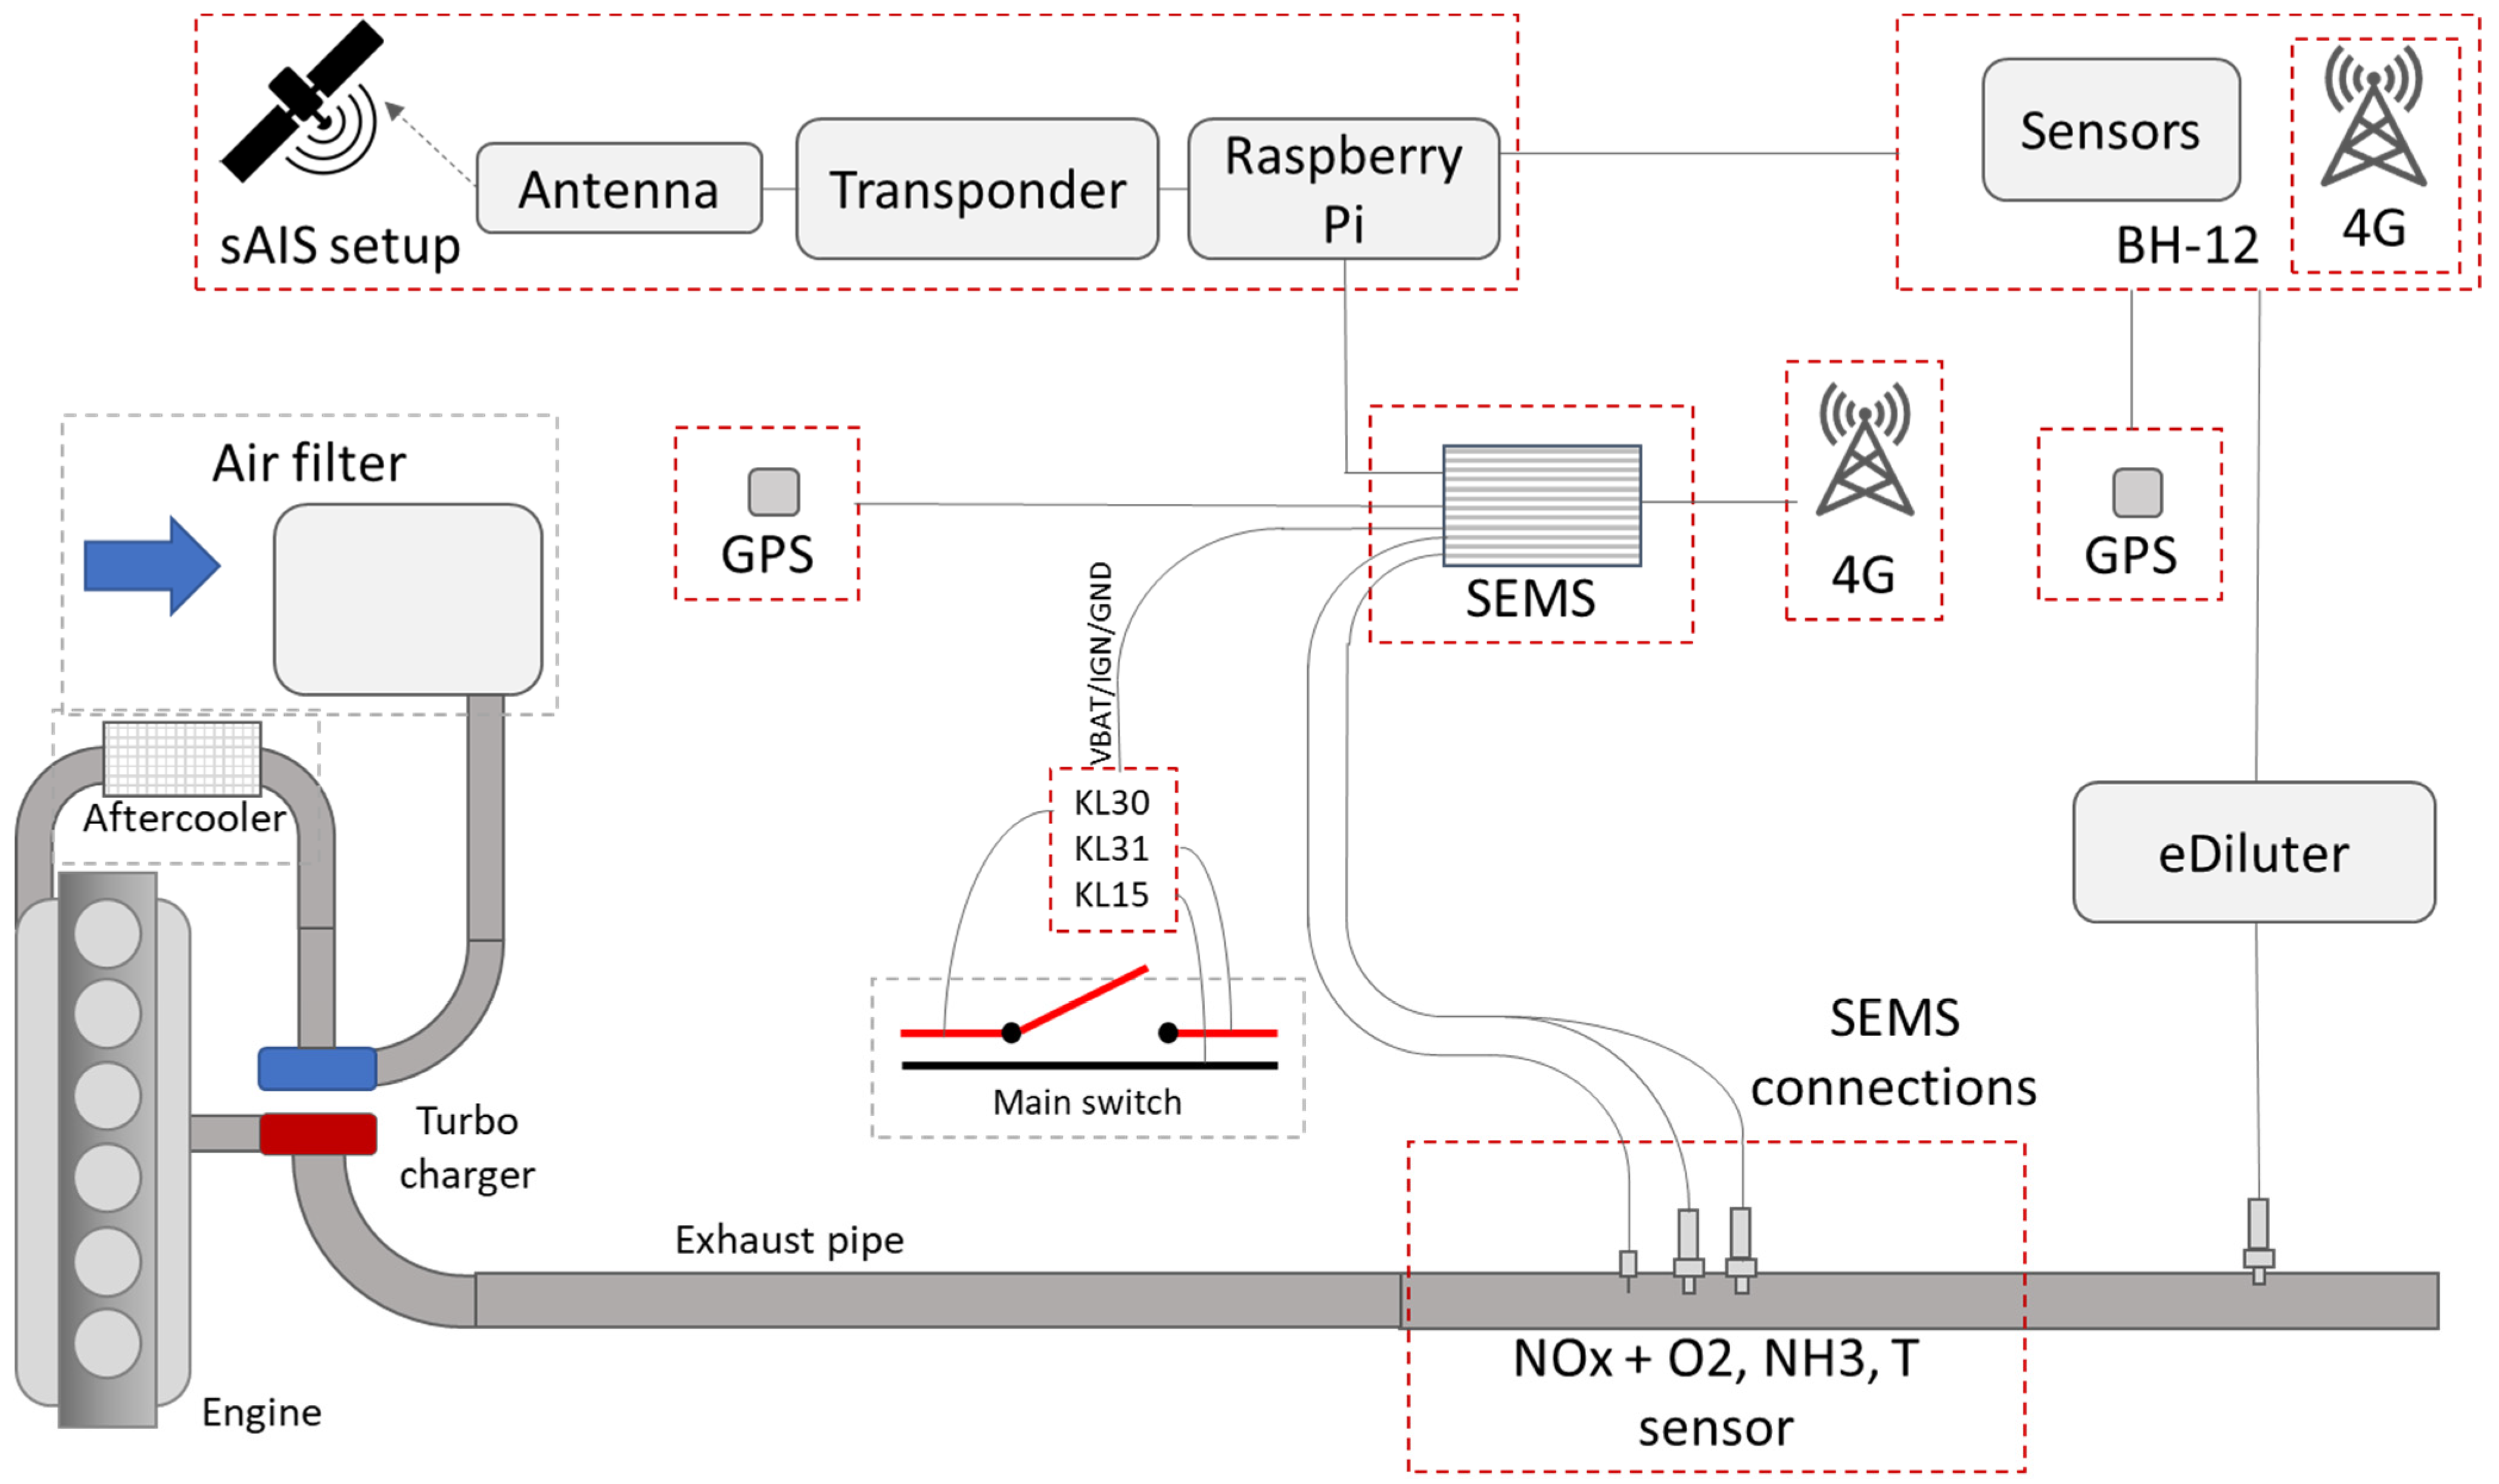
Table 2 shows the concepts proved for Trials 2 and 3: emission measurements were made using the “smart emissions measurement system” (SEMS), which was originally developed by TNO for road vehicle emissions monitoring of NOx, O2/CO2, and NH3. Figure 2 shows the system in schematic form used in both trials, with the same four key elements as with Trial 1; however, this time, S-AIS was used as the transmission medium.
The SEMS uses standard automotive sensors integrated using the CAN bus message-based protocol, supports data transmission to a database, and provides postprocessing tools to present work specific emissions and visualisation. The properties of this sensor system are shown in Table 3.
An ARM-based Raspberry Pi 3B+ computer running Debian Linux was selected as the interface between the S-AIS transmitter unit (AllTek B600 AIS transceiver running “exactSeNS”) and the SEMS. This gave the flexibility of using open-source tools within Python under the Linux environment to carry out the required routine tasks, i.e., polling on a 1 min schedule (via a Linux crontab) the SEMS for data using a serial connection (RS-232/USB), and constructing and encoding a transmittable data payload sentence (using a combination of bash and Python scripts).
ExactSeNS is a real-time satellite maritime VHF service, providing low-latency, low-cost, reliable data retrieval from globally deployed remote maritime assets (Figure 3). ExactSeNS uses the application-specific messaging (ASM) maritime VHF frequency (161.950 MHz), which is part of the family of maritime VHF frequencies related to AIS and its evolution into the VHF data exchange system (VDES).
ExactSeNS supports the regular transmission by ASM transmitters of sensor data in the form of a specially encoded single-slot AIS Message 25 (single slot binary message), or a two-slot AIS Message 26 (multiple slot binary message with communications state) for larger payloads. Transmitted messages are then detected in real time by the exactEarth S-AIS receivers flown on the Iridium NEXT satellite constellation. A simple NMEA (National Marine Electronics Association) protocol is used to pass sensor/payload data via the transmitter’s NMEA0183/RS-422 or USB-Serial ports. The payload data are then automatically encoded into an exactSeNS message and transmitted.
The sequence of events from measurement to message transmission is as follows:
  • Data are polled from the SEMS (every minute) via RS-232/USB by the Raspberry Pi.
  • Data are then converted into a 113-bit binary data payload format (see Appendix B) by the Raspberry Pi.
  • The binary payload data are then encapsulated within a 6 bit ASCII string compliant with the exactSeNS message payload NMEA protocol by the Raspberry Pi.
  • The complete exactSeNS message wrapper is then created on the AllTek AIS transceiver and transmitted for S-AIS detection.
Received data were made available via Amazon Web Services (AWS) in real time (<1 min). As the data were encoded prior to transmission, the payload content in a transmitted message was not visible to third parties, which has obvious security benefits. The message can be retrieved from the AWS by the end-user, and the end-user is then at liberty to retrieve, delete, and database the message. The end-user still needs to decode the message (either prior to or after databasing) in order to determine the emissions data statistics (see Appendix B). Once decoded, the GPS-located ship emission data can be used either as a point measurement in a spreadsheet or be plotted using some form of web service (e.g., Web Feature Service).
Note that, unlike in Trial 1, where the position of the vessel had to be retrieved from the vessel’s standard AIS position report closest in time to a Message 8 BBM, an exactSeNS ASM message includes the latitude/longitude of the vessel at the time of message transmission.

3. Results

3.1. Trial 1: Plymouth (UK), 2 March 2017

Figure 4 shows the spatial variability in emissions from the RV Plymouth Quest during Trial 1. The most striking results are for NOx and CO2. The highest emissions of NOx (>1400 ppm) are encountered at relatively low rpm (<1400 rpm); indeed, there is a clear inverse relationship between rpm and NOx emissions. The reverse is true for CO2, with the highest emissions (6–7%) encountered when the vessel is holding a steady speed with relatively high rpm, and lowest values (2%) when the vessel engine is under less load. For CO2, this is normal behaviour, as, at low load, the air excess ratio (λ) is generally larger which leads to lower CO2 concentrations (6–7% is equivalent to λ ≈ 2). In terms of the derived FSC, the RV Plymouth Quest is well below the IMO regulation of 0.1% when underway.
Figure 5 shows the direct comparison between the gas mixing ratios (SO2, CO2, and NOx) measured on board by the Gasmet FTIR analyser and the values obtained upon reception and decode of the AIS signal at either Rame Head or PML. All gases reported show an excellent agreement between analysed and telemetered data (slopes within 1% of unity, offsets close to zero and R2 = 1). Possible remaining sources of error in the AIS data are rounding errors (i.e., changing a floating-point number to a 16 bit integer and back again) and timing differences (maximum offset possible ~60 s). The 16 bit discretisation for SO2 was 0.0305 ppm, in contrast to 0.00015259% for CO2 and 0.1526 ppm for NOx. The regression offsets shown in Figure 5 broadly mirror the magnitude of these values with offsets for SO2 being +0.0216 ppm, in contrast to −0.0004% for CO2 and −0.129 ppm for NOx. Therefore, we can conclude that some of the differences are due to rounding errors at the digital discretisation stage. The timing differences may be an issue as the timestamps between the different elements of the system (Gasmet analyser; Valmet PC send; SRT-Marine AIS message send; AIS received at base station) may differ. Time averaging of data may also incur errors, particularly when the emissions are highly variable, changing on a sub-minute basis.

3.2. Trial 2: Plymouth (UK), May–August 2021

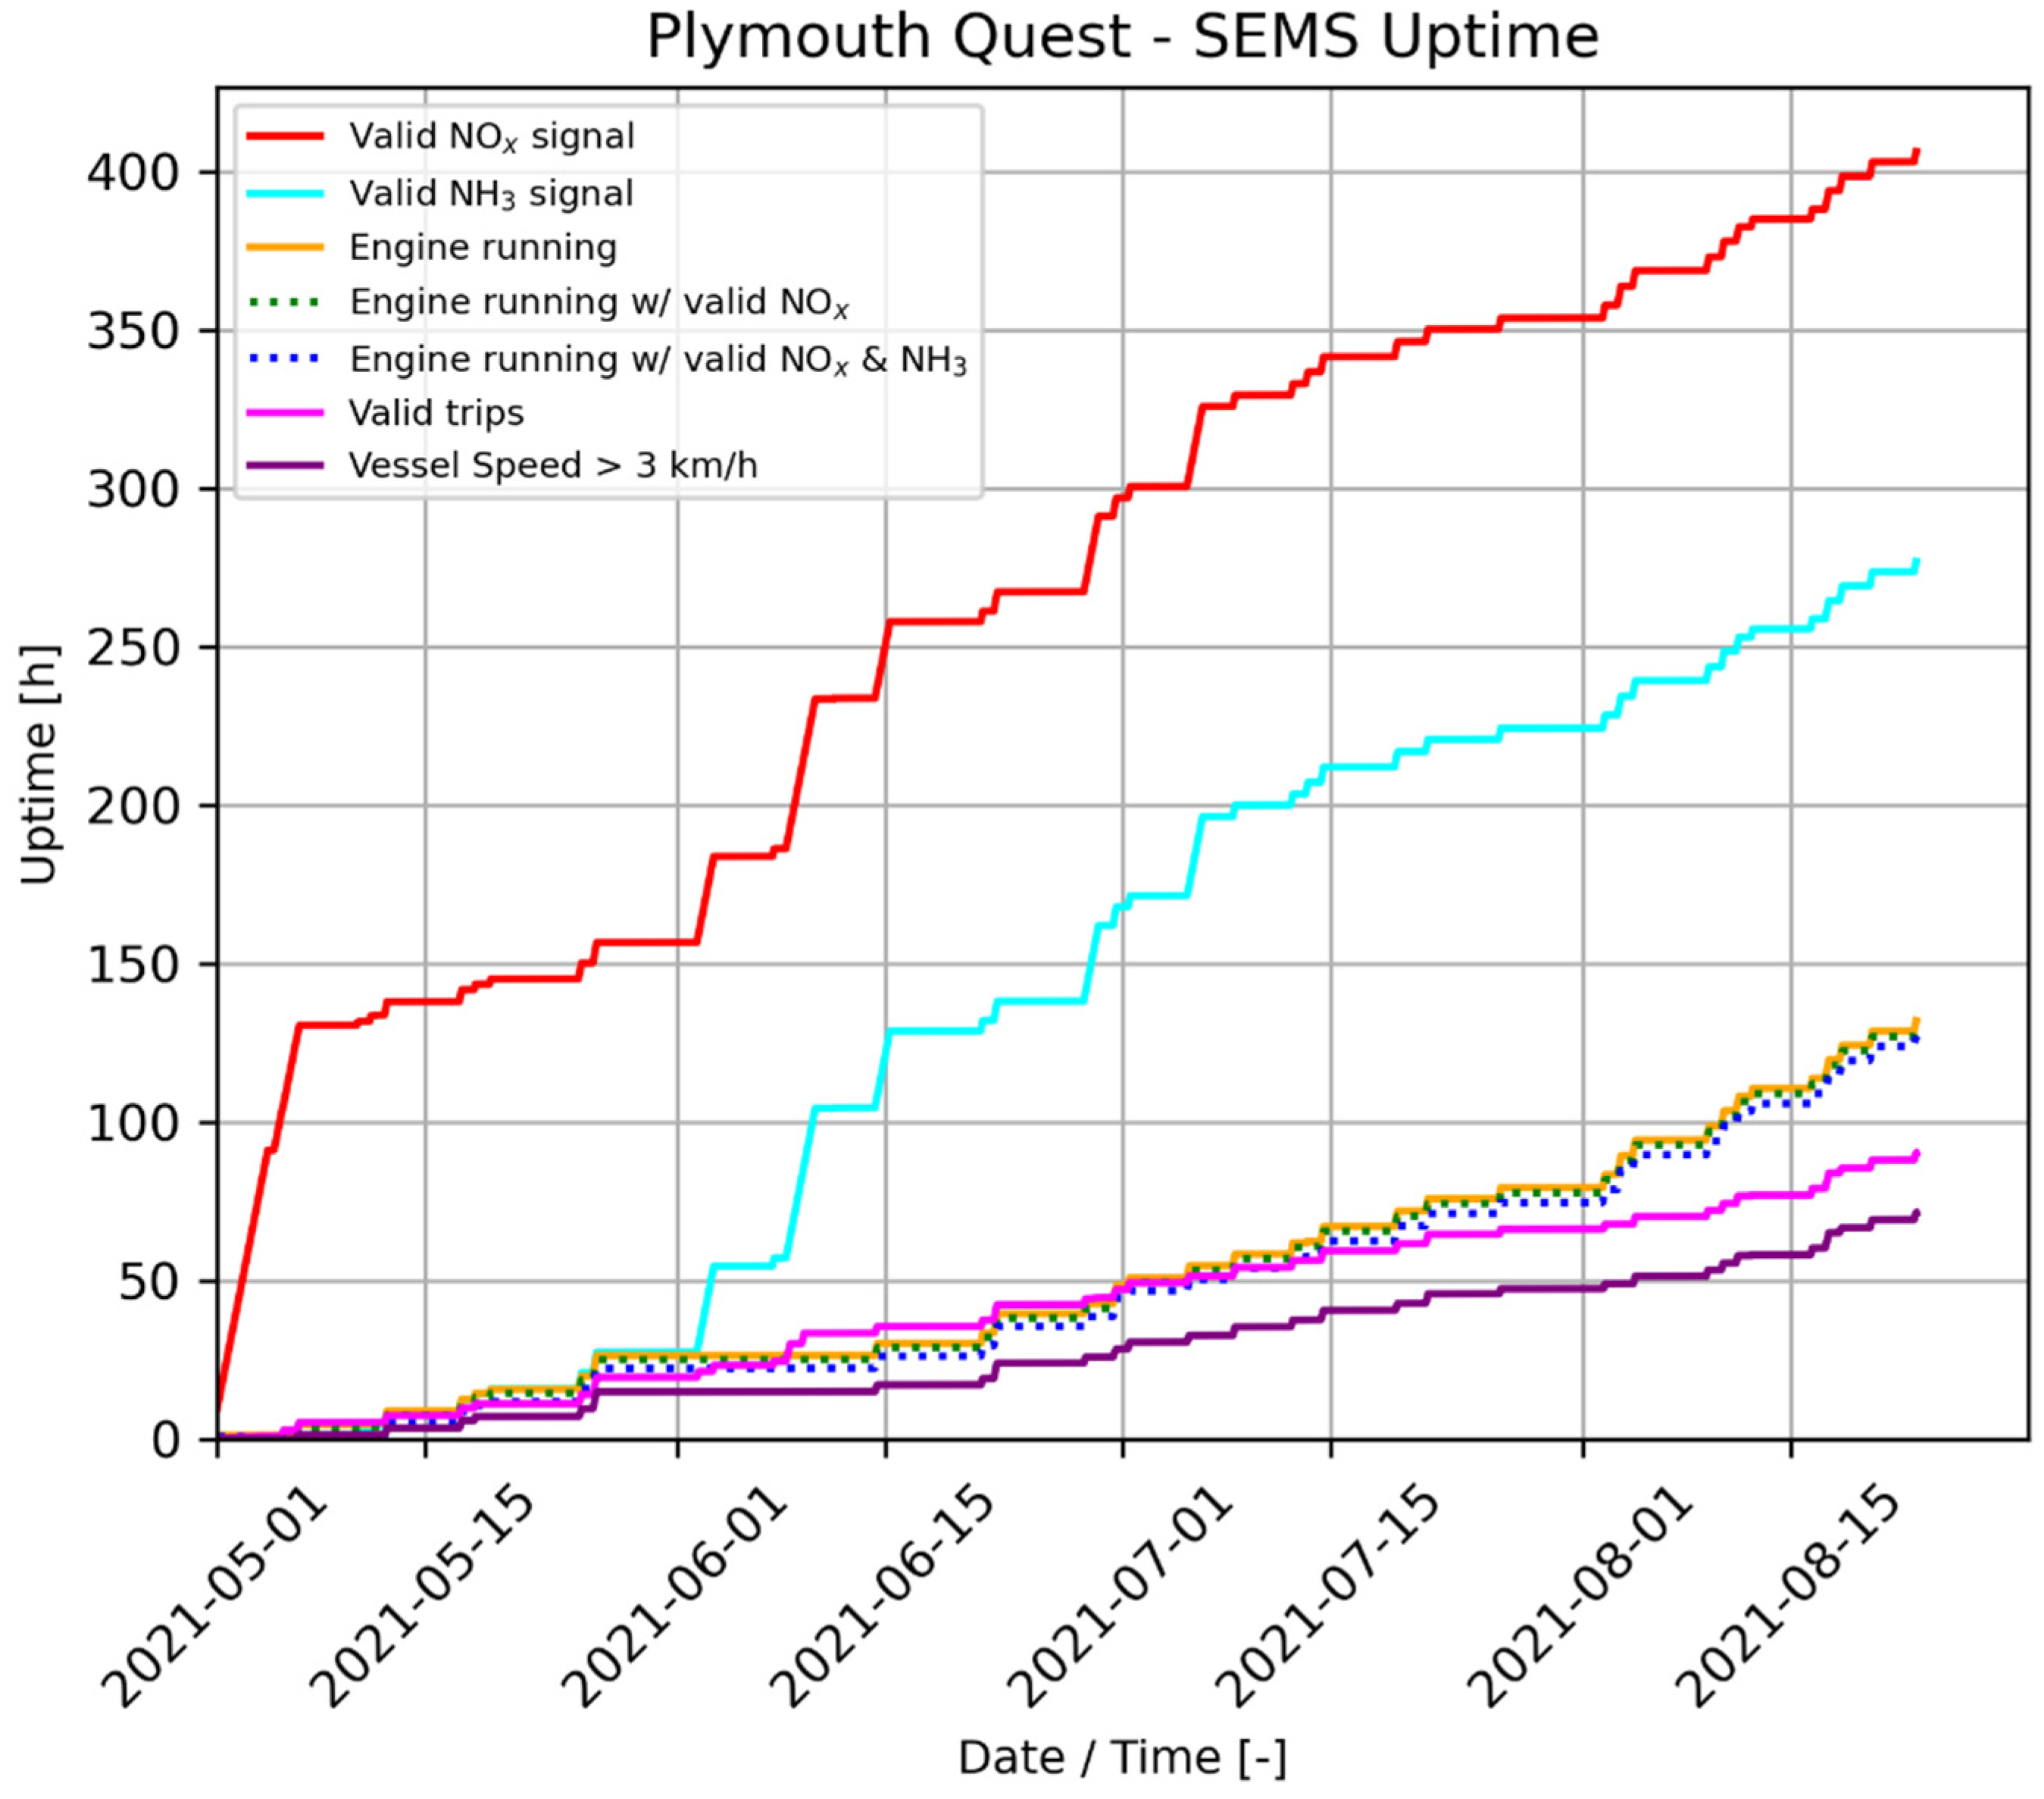
The uptime of the SEMS sensor system and vessel operation are shown in Figure 6. The NOx sensor was operational longer than the NH3 sensor. Between early May and the end of August 2021, the RV Plymouth Quest’s engine was operating (i.e., rotating at a higher speed than 600 rpm, with the minimum idle speed being 650 ± 25 rpm), for approximately 130 h. The blue and green dotted lines depict the engine operation hours during which the NOx sensor or both the NOx and the NH3 sensors were operational. This was the case during almost the total engine uptime. The cumulative sailing time of the RV Plymouth Quest (i.e., the hours the ship was sailing >3 km/h) was around 70 h for the entire measurement campaign.
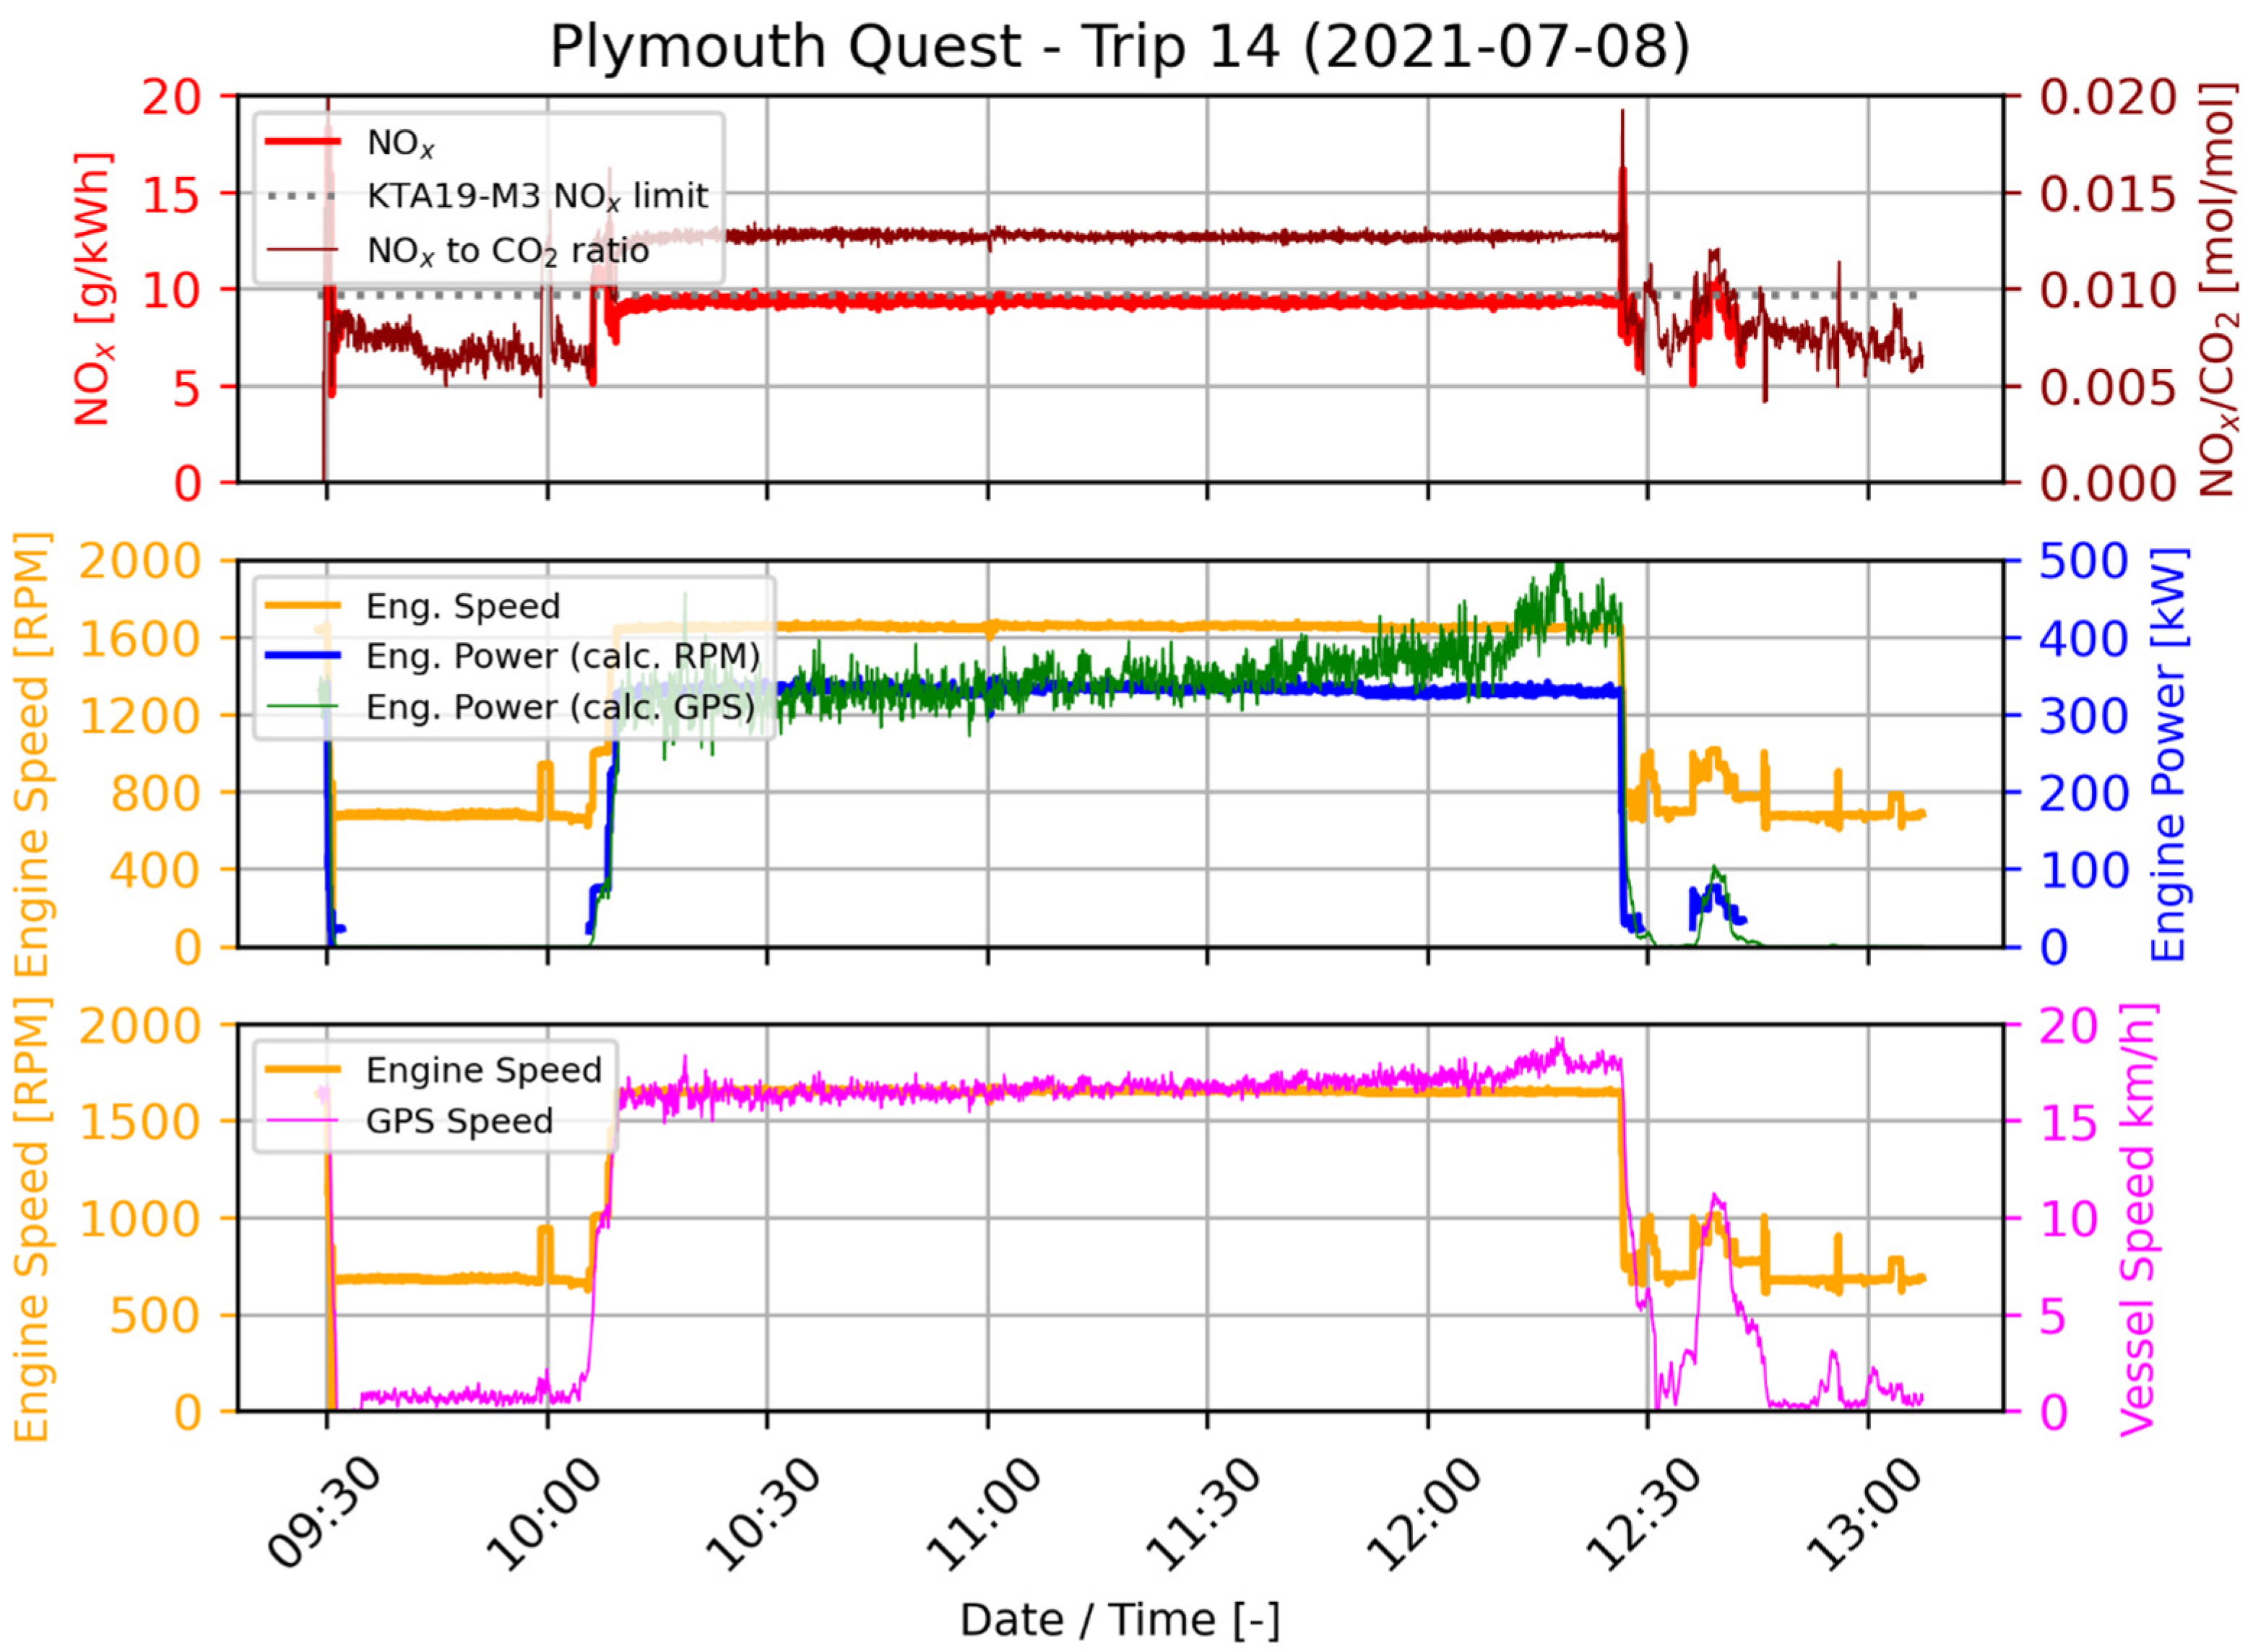
Figure 7 shows a trip (14) of about 3 h with a constant engine speed of just over 1600 rpm during a period of more than 2 h. The corresponding engine power is around 320 kW which results in a calculated NOx emission between 9–10 g/kWh, close to the Tier I approval value of 9.66 g/kWh. The NOx/CO2 molar ratio is around 0.013 during the 1600 rpm period. This ratio drops to about 0.0075 at engine speeds below 800 rpm and consequently very low torque.
Trip 26 in Figure 8 shows somewhat more variation in engine and vessel speed, with two periods of around 50 min duration where the engine speed is just over 1600 rpm. The NOx values are slightly higher (~10 g/kWh) than during trip 14 (Figure 7). In this case, we also see a period with an engine speed just over 800 rpm. The NOx/CO2 ratio is then about 30% lower; however, due to the lower engine efficiency at that power level, the NOx in g/kWh drops only slightly to just below 10 g/kWh.
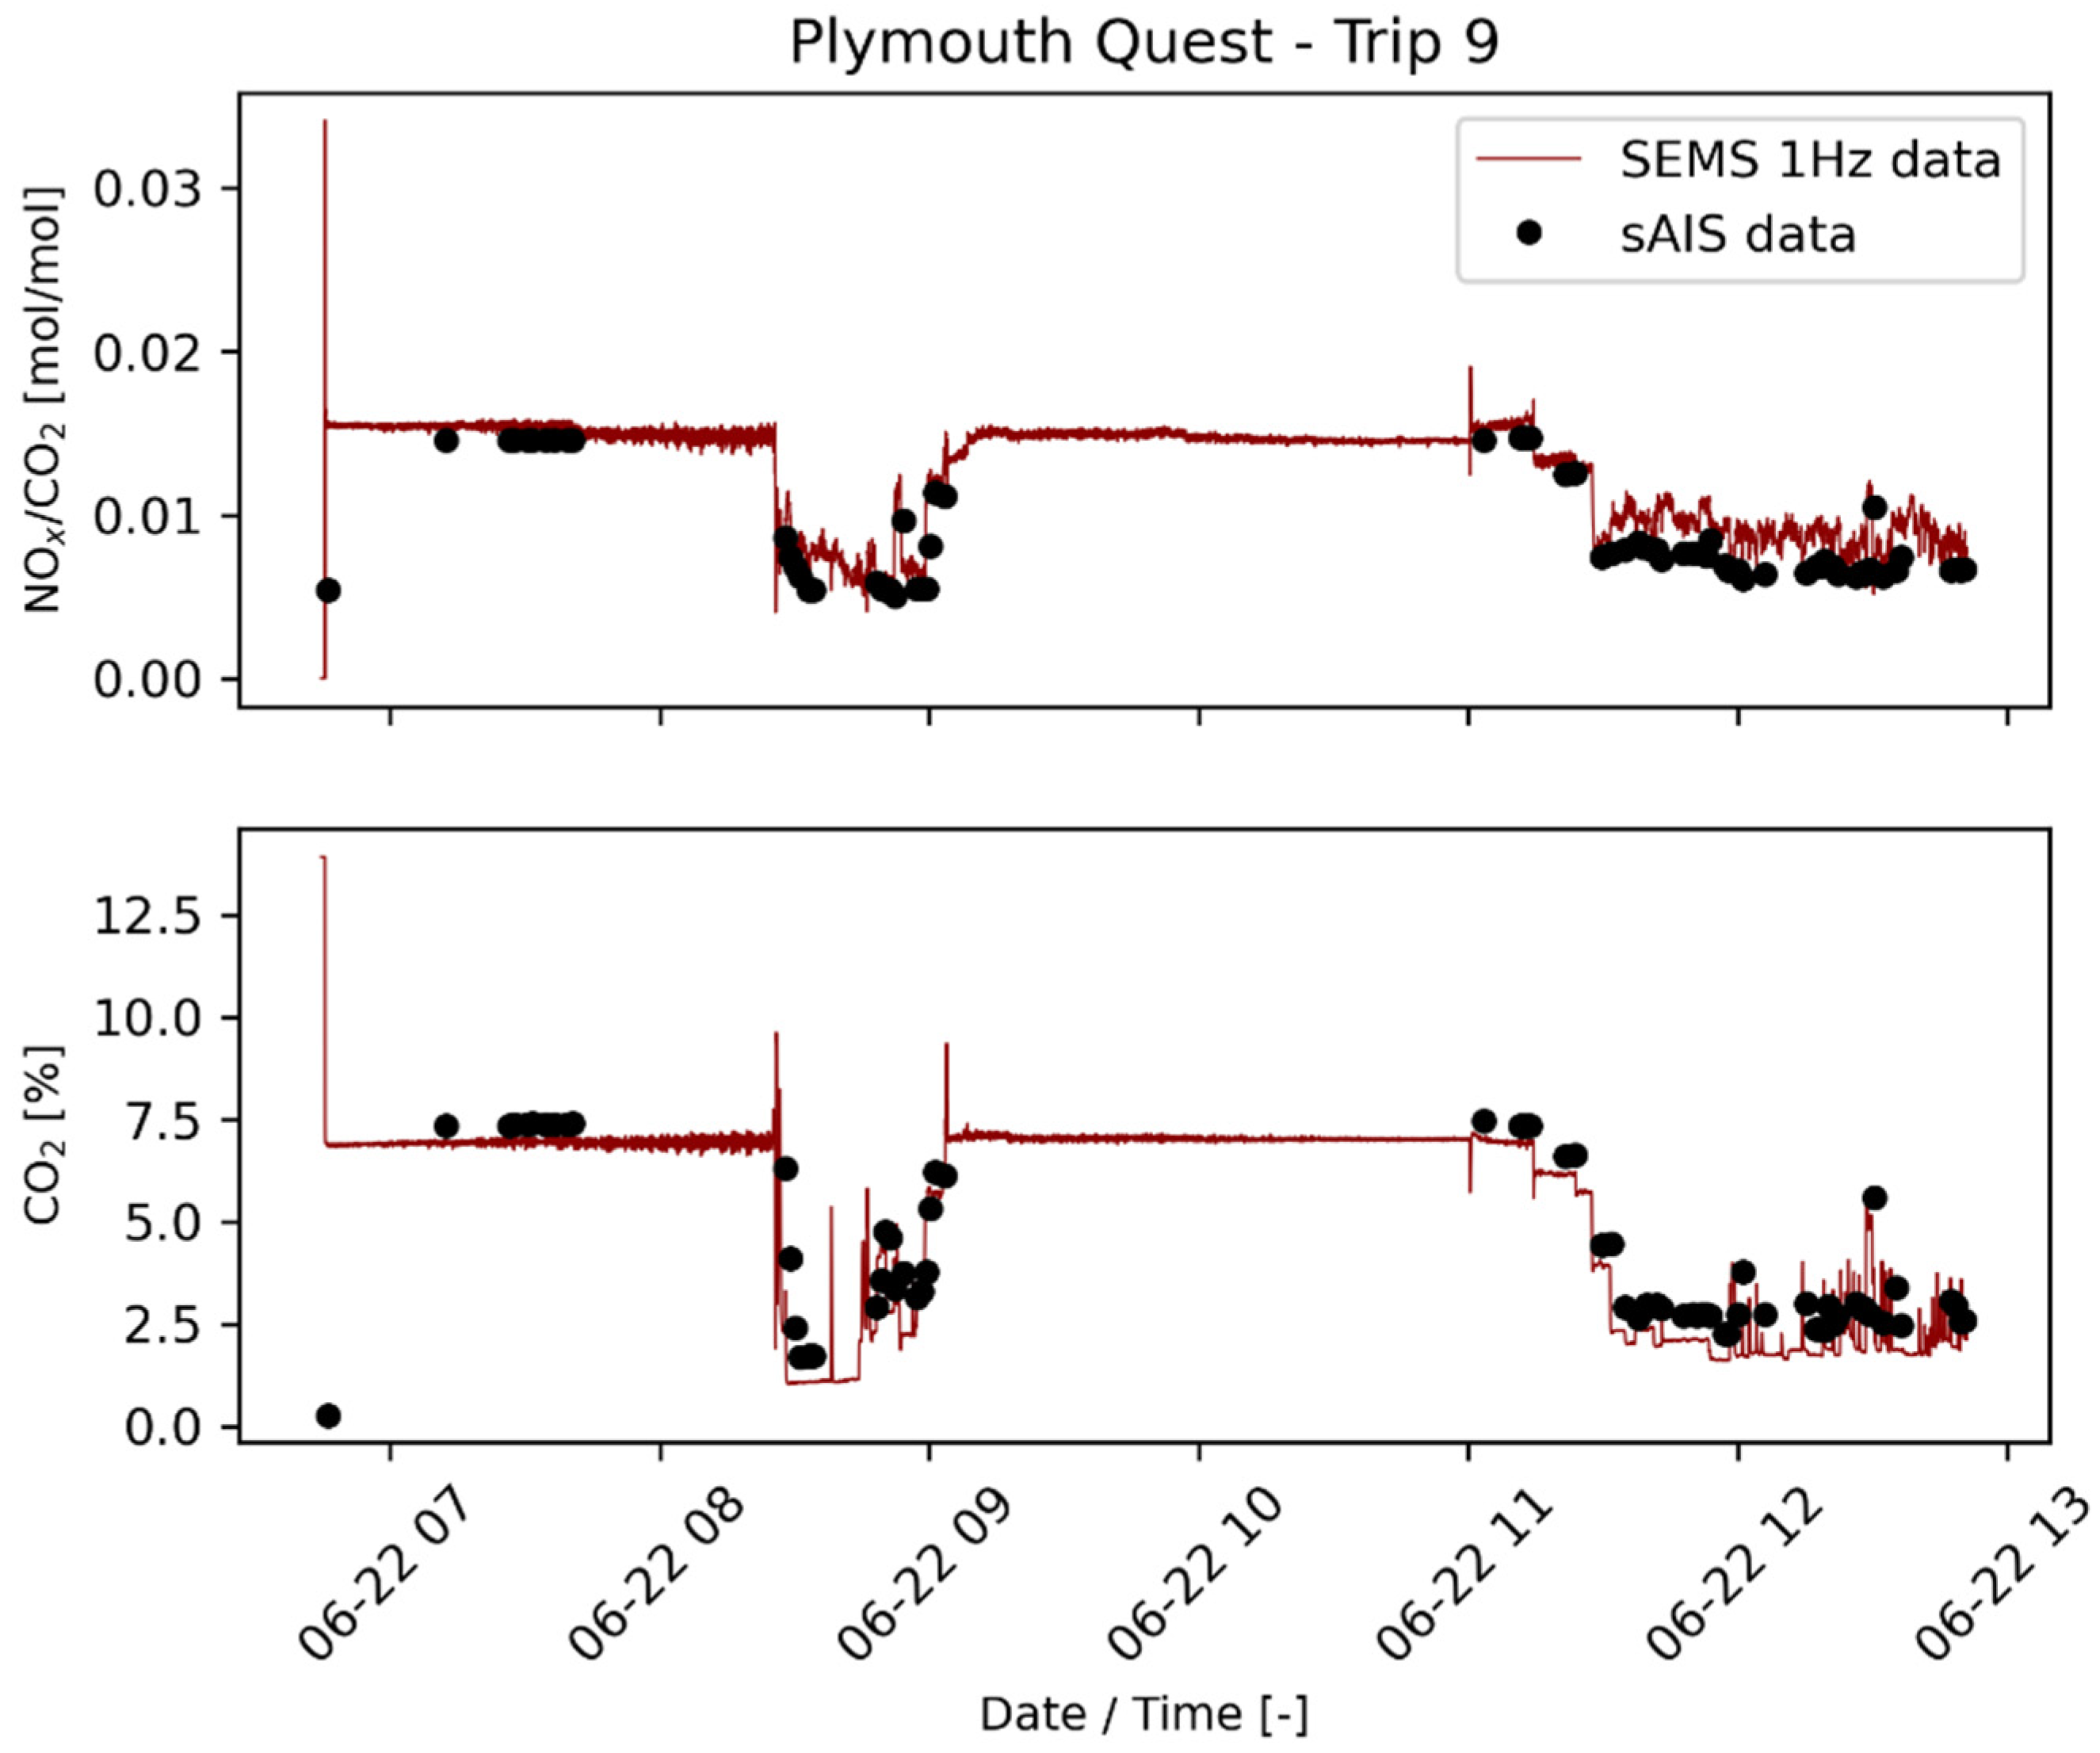
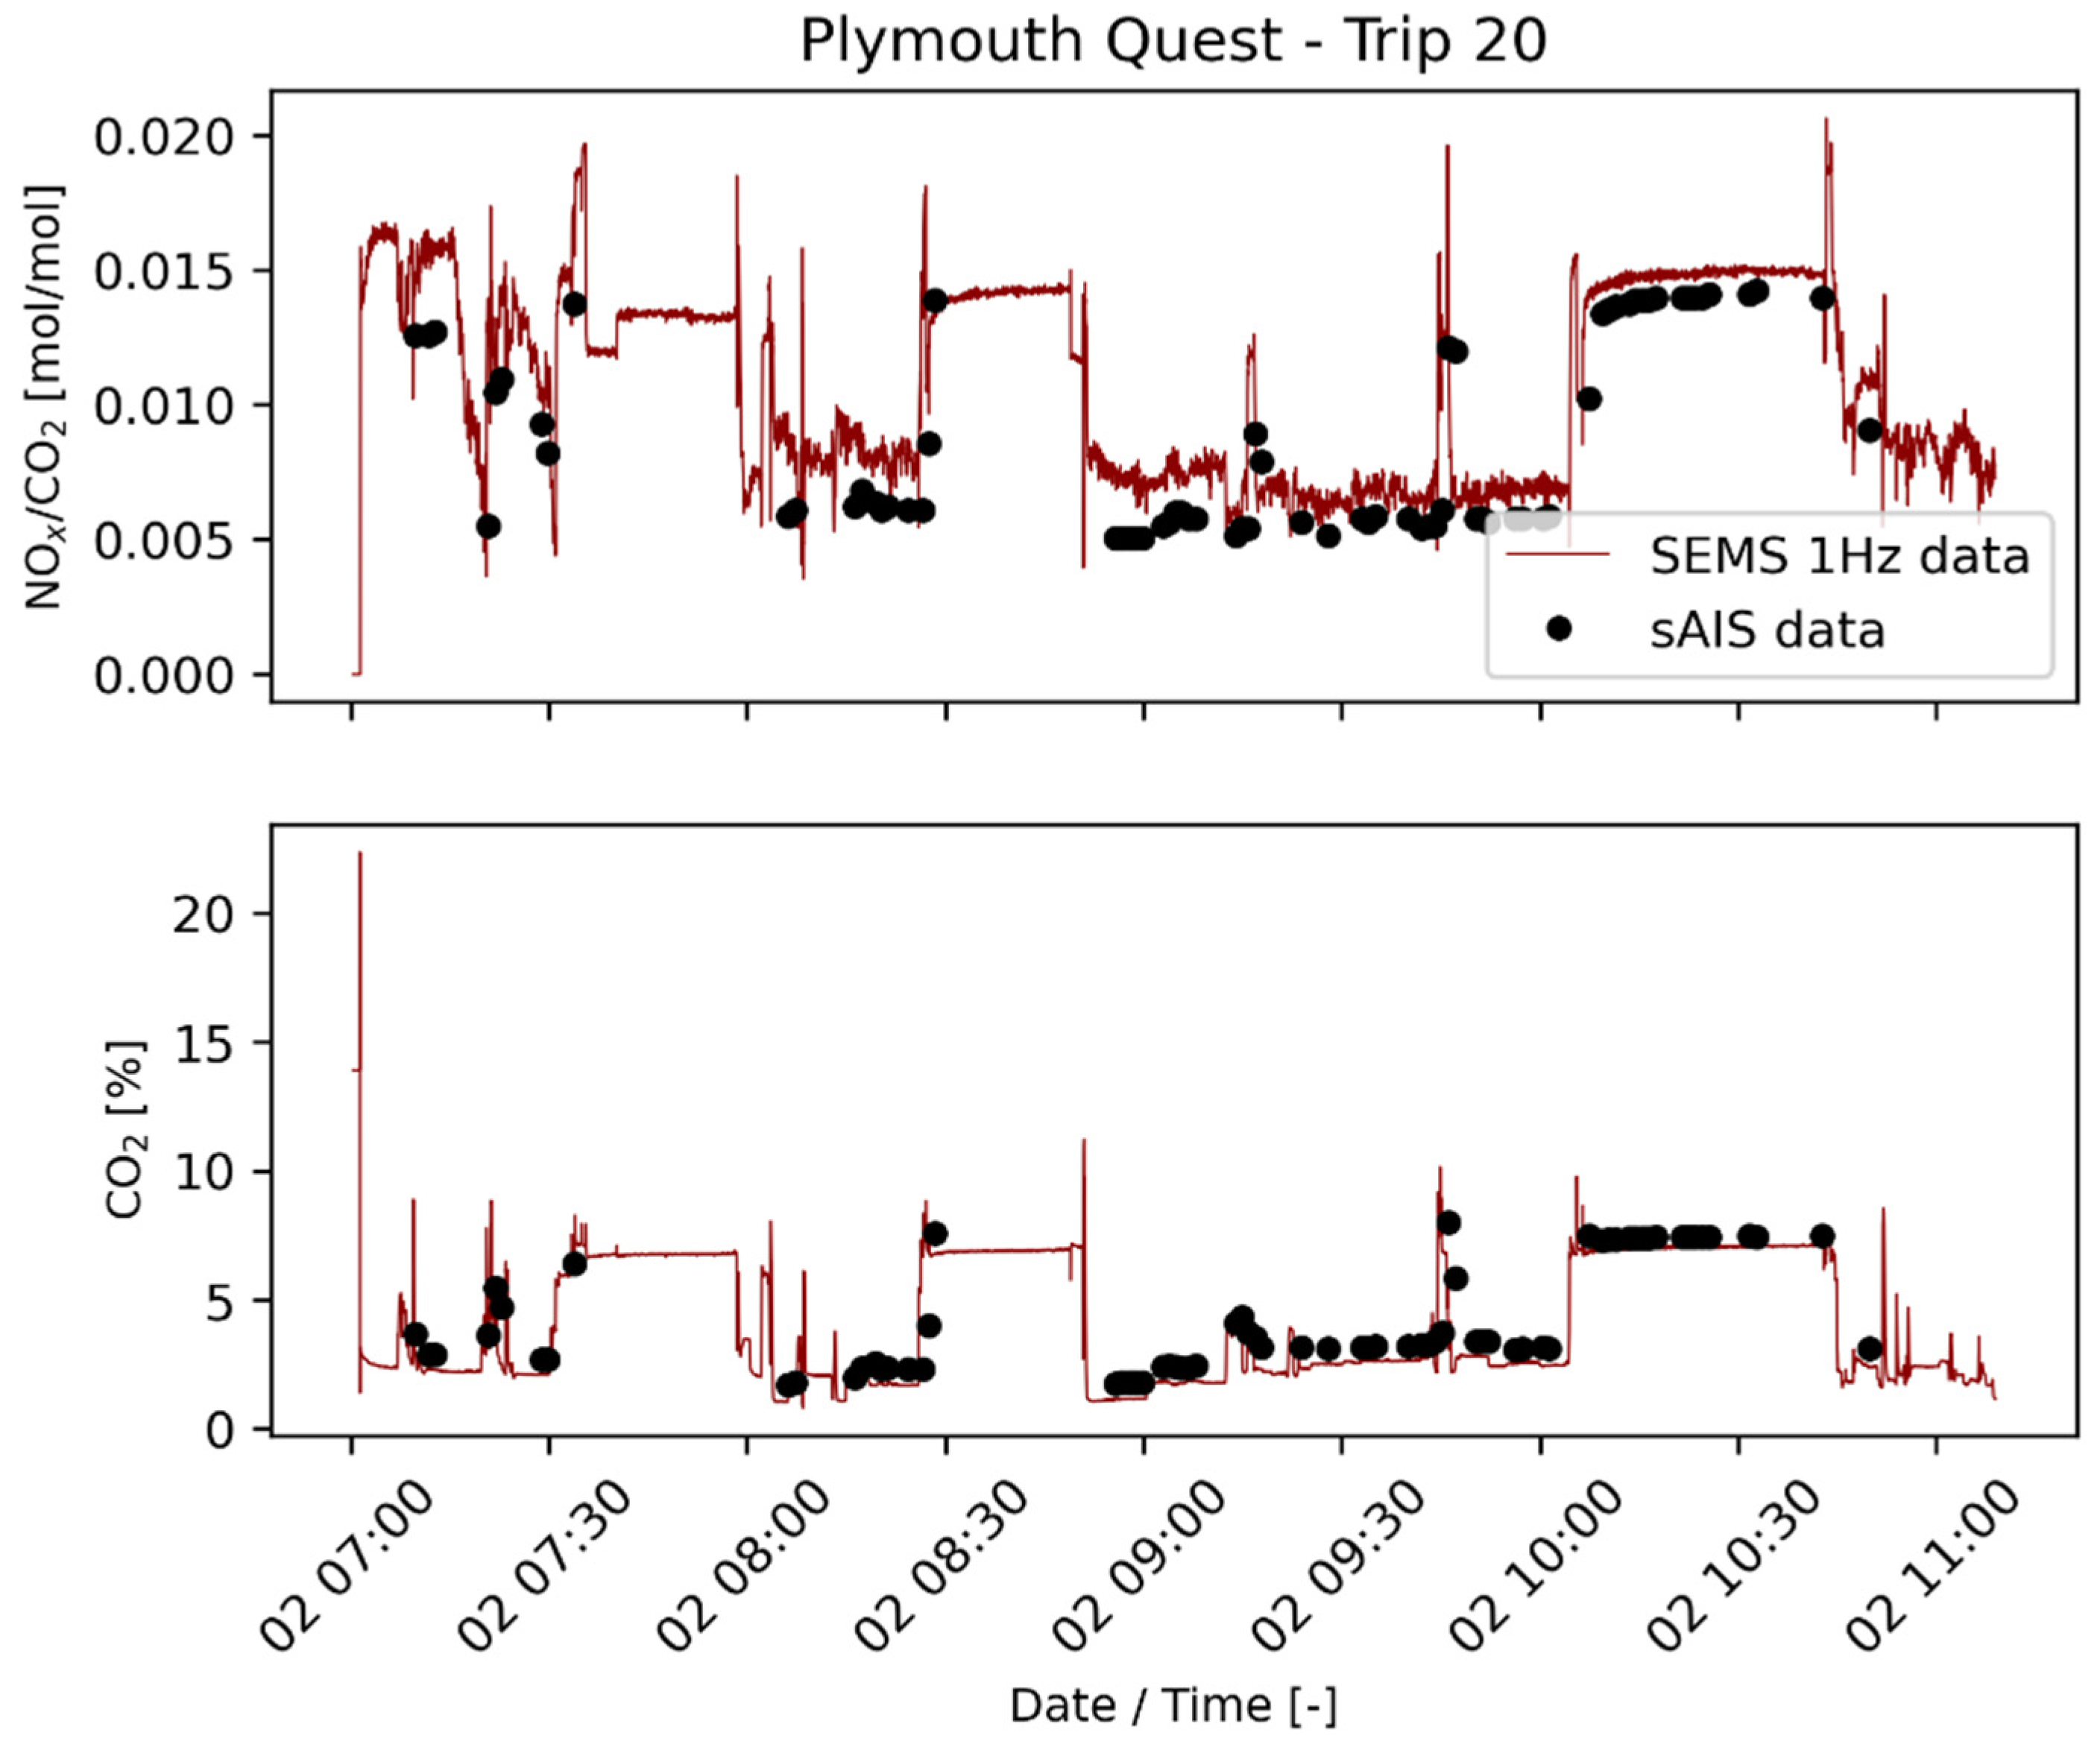
When emission data from the SEMS were transmitted via 4G, the dataset frequency was 1 Hz. When the 4G network was not available, real-time measurements depended on S-AIS transmissions, which consists of instantaneous spot data polled every minute. When both transmission via S-AIS and 4G are successful, a direct comparison can be made. Both Figure 9 and Figure 10 show that NOx/CO2 ratio from S-AIS data replicates the trends in the SEMS 1 Hz data. However, there appears to be a constant offset observed between the 1 Hz data and the transmitted S-AIS data.
This difference may be caused by the different CO2 calculation used in the SEMS data analysis and that derived prior to S-AIS transmission. This is evident from both Figure 9 and Figure 10, where there is a constant offset of around 0.25% in CO2 concentration between the two datasets. Further investigation shows that this offset is caused by the different values used for maximum CO2. In the S-AIS pre-transmission processing, the maximum CO2 concentration is set at a constant value of 14.1% whereas the SEMS data analysis uses 13.6%. The calculated CO2 is based on the NOx sensor measured O2 concentration; O2 used by combustion is converted to CO2. The root cause of this difference comes from the assumption of the chemical composition ratio of the fuel used by the RV Plymouth Quest.

3.3. Trial 3: Kiel (DE)/Gothenburg (SE), 31 August–11 September 2021

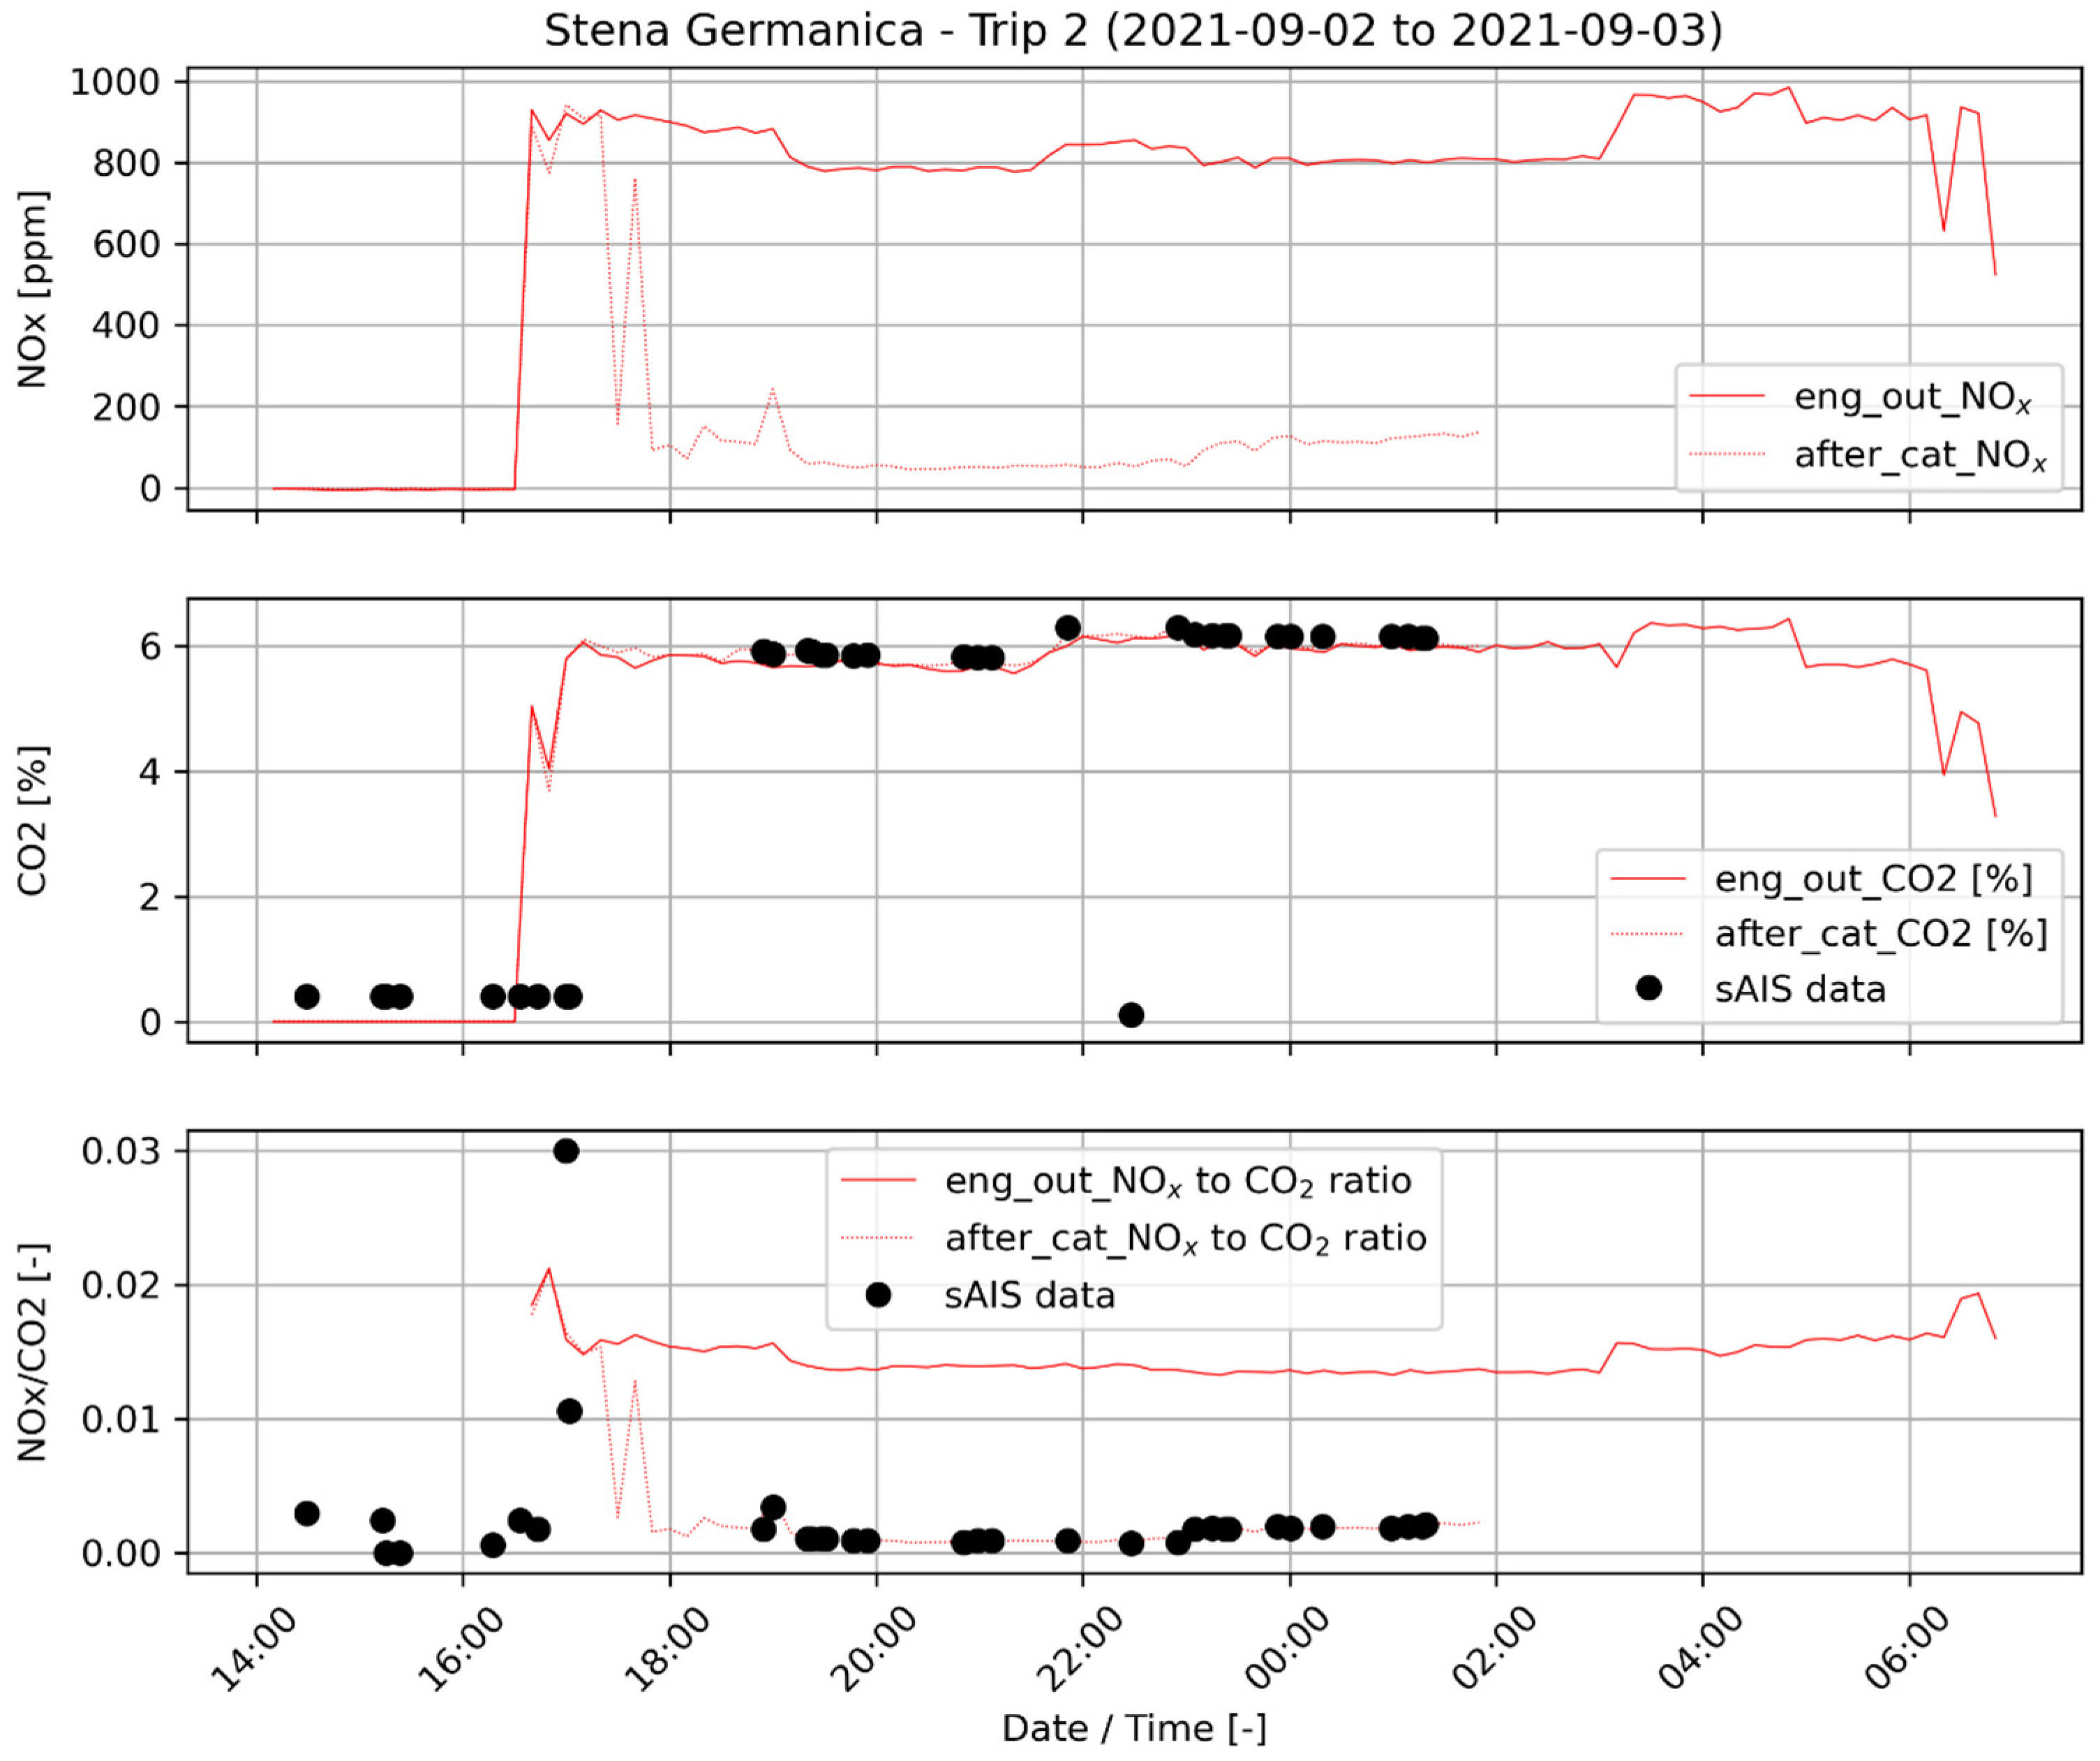
Figure 11 shows that NOx/CO2 ratio from S-AIS data manages to follow the trend of the SEMS 1 Hz data. There are some instances where the NOx/CO2 ratio from S-AIS is larger than the SEMS 1 Hz data. For example, at around 17:00, a very low calculated CO2 value resulted in an abnormally high NOx/CO2 ratio.

3.4. Trials 2 and 3: Message Retrieval Statistics

Both the exactSeNS terminals deployed onboard the RV Plymouth Quest and the Stena Germanica used an external 90 cm omnidirectional VHF antenna deployed on a high point of the vessels’ superstructures; the RV Plymouth Quest terminal used a 5 W transmitter, whereas the Stena Germanica setup used a 12.5 W transmitter. Figure 12 shows the Stena Germanica exactSeNS system’s hourly observed satellite data detection rate between 1 and 15 September 2021.
The maximum reception rate was 60 messages per hour, based on the number of times the SEMS was polled by the Raspberry Pi. The overall hourly mean was 5.8 messages received per hour, but the reporting rate increased to 6.7 per hour when the ship was at sea (blue shaded areas in Figure 12; see 4.7 per hour when in port, i.e., non-shaded areas). The cadence statistics show that the mean reporting interval was 10 min, with poorer cadences corresponding to when the ship is in port (due to additional interference from other VHF sources; less clear view of sky/horizon for the VHF antenna). This cadence rate interval is consistent with a mean detection rate of approximately six messages per hour; this represents around a 10% success rate.
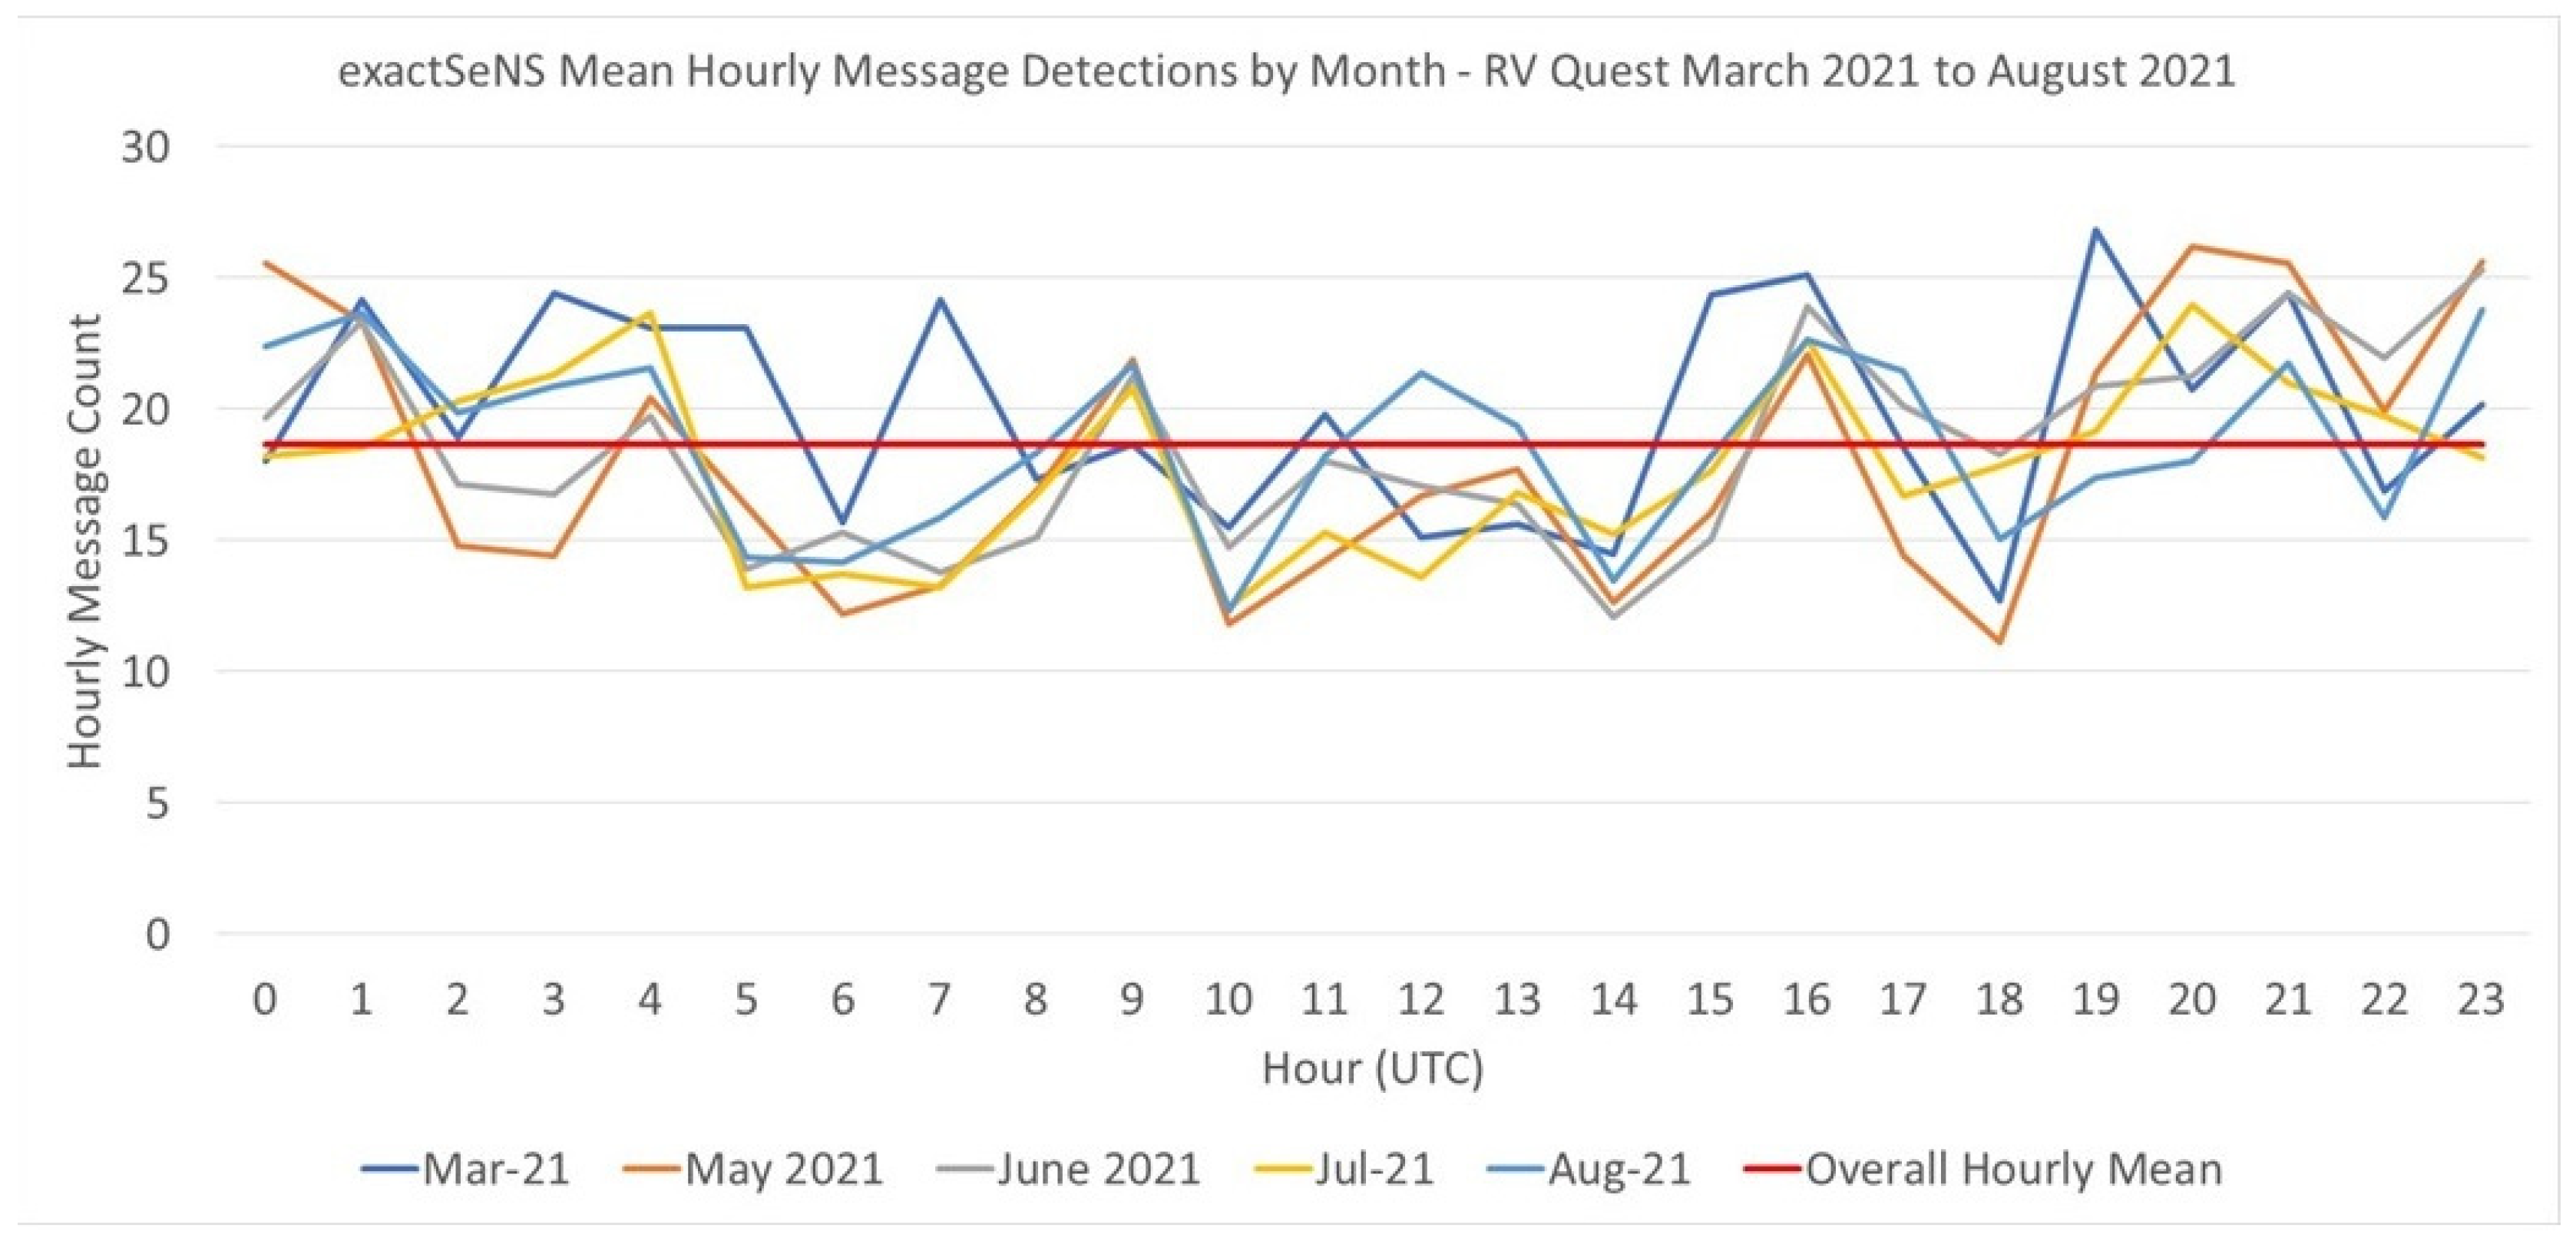
Figure 13 shows the RV Plymouth Quest exactSeNS system’s hourly observed satellite data detection rate between 1 March and 31 August 2021.
The overall hourly mean was 18.7 messages received per hour, with a range of 10–25. The cadence statistics show that the mean reporting interval between March and August was around 4 min, representing a 25% success rate.

4. Discussion

One of the unique selling points of using S-AIS technology is that it enables attribution of emissions characteristics, via the ship’s MMSI number, to individual vessels. The emissions are also unambiguously reported and measured directly from the ship stack, rather than being diluted in the atmosphere as is the case for flying drones close to ship exhausts [12] or monitored from a shore-based sampling system [15].
Users and ship owners familiar with web-based vessel-tracking services such as MarineTraffic.com will be well versed in tracking individual ships and aware that this is made possible using the unique MMSI. The S-AIS/exactSeNS messages we presented here are limited to 113 bits (single slot) but do contain the vessel’s MMSI (unlike Trial 1 where merging between different AIS messages was required); this should simplify operational take-up in the future.
The data pipeline is as secure as the AWS and web services allow. Further password protection for access to the database and access to individual ships data is technically feasible. The data encryption is secure as data encryption before transmission is only available to the project software developers; similarly, data decryption is only available to the web and software developers.
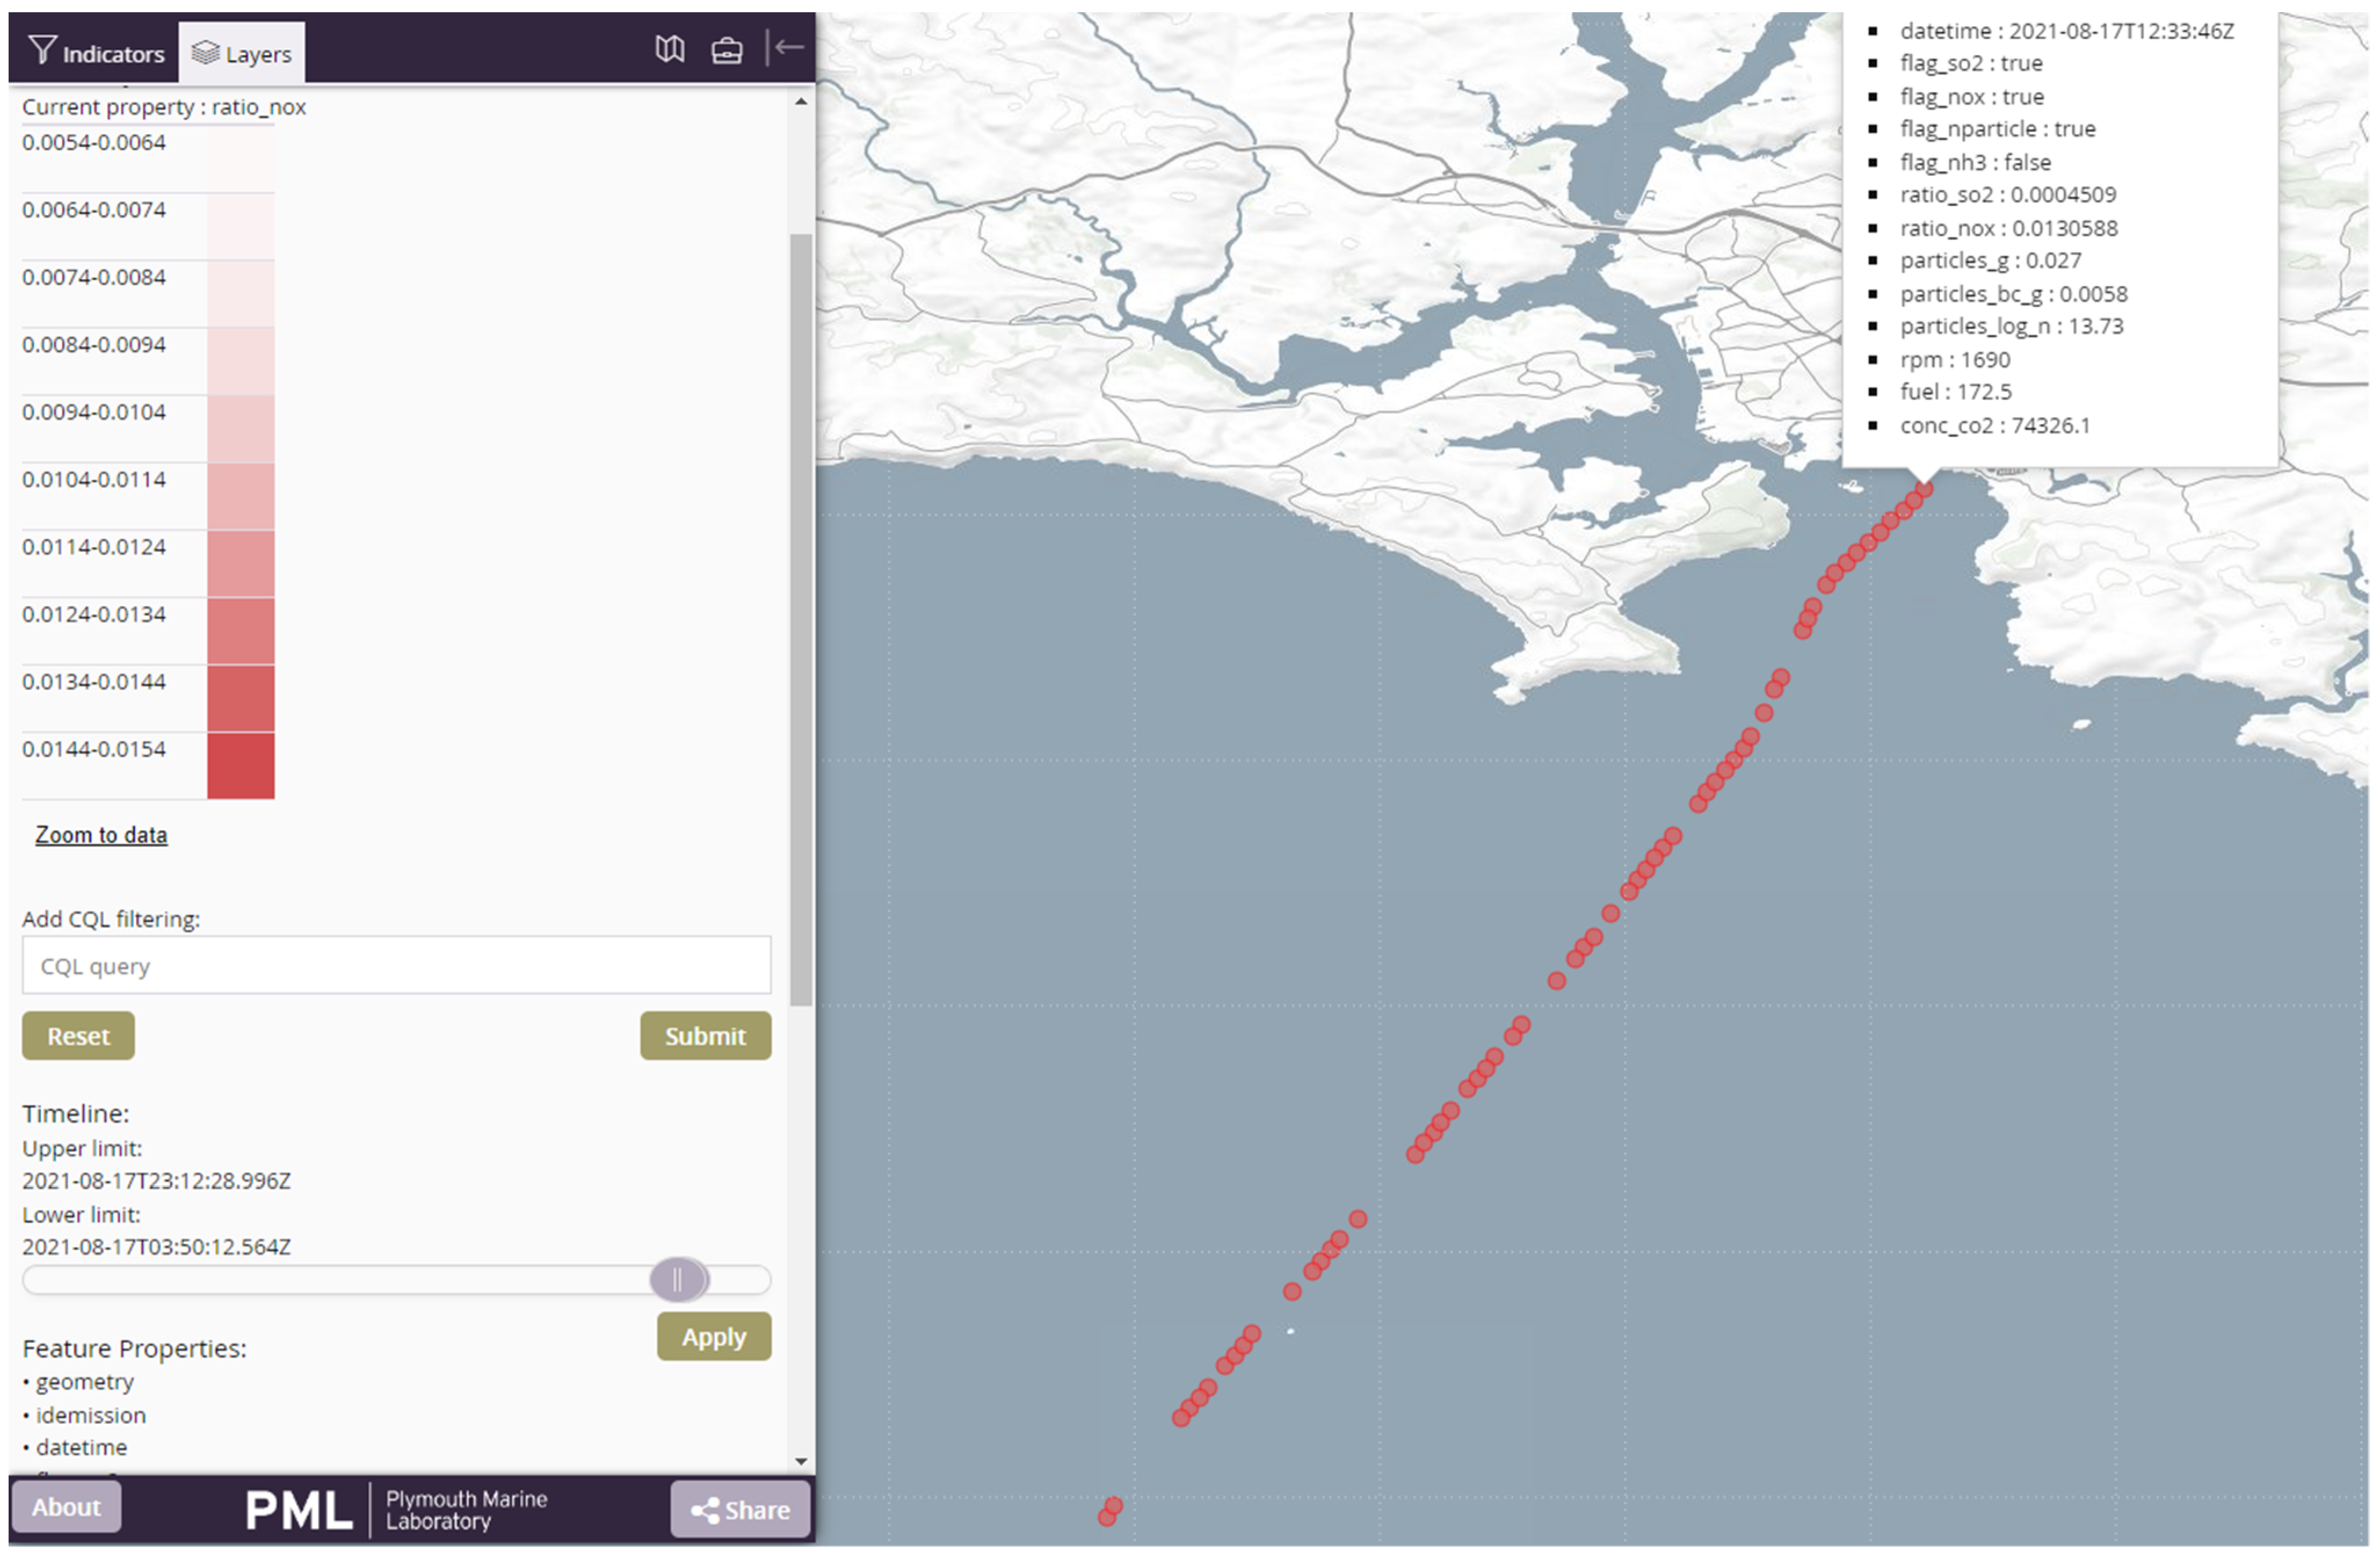
In order for a commercially viable product to be developed, the entire package of sensor integration with the S-AIS/exactSeNS system, as well as the web visualisation, should be viewed as a whole. An example of such an “Environmental Shipping Monitoring Centre” (ESMC) (see Figure 3 schematic for pipeline) is shown in Figure 14.
Each data point in the ESMC is attributable to a single ship (in this case, RV Plymouth Quest) and can be interrogatable for different feature properties (for the case shown with different emission statistics, see Appendix B). If a port authority or regulator had access to such a tool, individual ship emissions could be interrogated before decisions were made on whether an inspection should take place. For (average) environmental performance and comparison with emissions regulations, averaging and aggregation of this data are also desirable.
Cost is an obvious barrier to sensor adoption and reporting. The sensors integrated in this report (SEMS—Trials 2 and 3) are on the order of 5–100 EUR with low maintenance costs (replaceable plug-in-and-play sensors). For vessels with multiple engines, there may need to be multiple systems onboard or at least a system which can sample from each engine in turn and report the results [16]. The WFS component, including a cloud data storage utility such as Amazon Web Services (AWS), could be costed on a license basis, with costs scaled according to usage. The exactSeNS component is already developing a business model based on individual licenses.
Packaging suitable emissions sensors with an exactSeNS transmitter as a “black box” that can easily be installed and does not rely on a vessel’s existing data communications is a concept worth considering. The concept uses only emissions concentrations within the exhaust gas. There is no need to monitor parameters such as engine power and exhaust flow. The SO2/CO2 ratio directly relates to the FSC and is also implemented in regulation. The NOx/CO2 ratio can be directly converted to a g/kg fuel value via the FSC (FSC to a g/kWh value). Such a product would be largely independent of a vessel’s systems and as such offer independence with respect to reporting secure, tamper-free data.

5. Conclusions

By utilising the additional data carrying capacity of S-AIS, we demonstrated all three facets of faster, better, and cheaper for emissions monitoring: faster with the real-time reporting of data, with message rates of 4–10 per hour even in radiofrequency-congested regions such as the Baltic and English Channel; better in that the emissions are measured at source within the stack of a vessel, and that those emissions can be uniquely identifiable by a ship’s MMSI; cheaper in that the emissions sensors, together with the S-AIS telemetry system and costs, are on the order of 100–1000 EUR. We argue that our approach is suitable for solving the atmospheric shipping emission compliance and attribution conundrum.

Author Contributions

Conceptualisation, T.S.; methodology, T.S., A.D., J.P., R.P., R.V., V.V. and P.P.; software, T.S., A.D., and J.P.; validation, T.S., J.P., J.F., T.B. and M.Y.; writing—original draft preparation, T.S. and R.P.; writing—review and editing, T.S., A.D., J.P., D.S., R.P., R.V., V.V., P.P., T.B., J.F. and M.Y.; visualisation, D.S.; project administration, T.S., R.V. and R.P.; funding acquisition, T.S., R.V. and R.P. All authors have read and agreed to the published version of the manuscript.

Funding

This work was part funded by the European Union’s Horizon 2020 research and innovation programme under grant agreement SCIPPER (No. 814893).

Institutional Review Board Statement

Not applicable.

Informed Consent Statement

Not applicable.

Data Availability Statement

All data are available from the authors on request.

Acknowledgments

Trials 1 and 2: The authors thank the crew of RV Plymouth Quest for making both trials possible and SRT-Marine for supplying the Apollo AIS and Coast Station receiving units. Additionally, we thank Valmet and Gasmet for providing the FTIR and sampling unit. Trial 3: We thank the crew of the Stena Germanica and Nikos Kousias for onboard technical support.

Conflicts of Interest

The authors declare no conflict of interest.

Appendix A. Trial 1 AIS Binary Broadcast Message

There are two key aspects of sending an AIS message 8 string as used in Trial 1. These are the encoding of the string prior to it being sent by the AIS transponder onboard a ship, and the decoding of the resultant message once received by a land-based shore station. The two messages are not identically formatted and carry slightly different amounts of data. The send message takes the following form:
!AIBBM,1,1,0,1,8,s—s,x*hh<CR><LF>,
where !AIBBM,1,1,0,1,8, is common to all sent messages and represents: a binary broadcast message (!AIBBM); total number of sentences needed to transfer the message (1); sentence number (1); sequential message identifier (0); preferred AIS channel (1—representing channel A); AIS message ID (8). The part of the message containing data is a 6 bit encoded ASCII string (s–s). This includes requisite information on the designated area code (10 bits in length, set to 235 for the pilot study) and the field identifier (6 bits in length, set to 001).
For Trial 1, four data elements were encoded, each of 16 bits, to ensure an adequate level of precision (65,535 levels). These were, in order, a diagnostic variable (IFGC: range 0–65,535), SO2 concentration (ppm: range 0–2000), CO2 concentration (% volume: range 0–10), and NOx concentration (ppm: range 0–10,000). This gives a total of 80 bits of binary data encapsulated in the message. So that it can be uniquely decoded using 6-bit ASCII, there is a further requirement to pad this message by 4 bits (set to zero—0000); the parameter x is, therefore, set to 4 (although always calculated in the script). Finally, the checksum (hh) is calculated from the entire message content, and the message appended with a carriage return <CR> and line feed <LF>. An example message, prior to the send by the AIS transponder, is as follows:
!AIBBM,1,1,0,1,8,>d49KPTu@Ll2uP,4*7E,
which corresponds to DAC = 235, FI = 001, IFGC = 2414, SO2 = 2365 (72.175 ppm), CO2 = 16,845 (2.41779%), and NOx = 758 (115.66 ppm). The message is then relayed by the AIS transponder with the message type and vessel’s unique MMSI number added to the start of the message.
The shore station received message, using the above example, is
!AIVDM,1,1,,A,83P8CE@rh@Uf2Cluq@;n,0*66,
where !AIVDM,1,1,, is common across all received messages and A (or B) the channel that the AIS message is received on. The binary AIS message is then encapsulated in 6 bit ASCII between the commas and contains the message type (8: 6 bits), MMSI (235017045: 30 bits), DAC (235: 10 bits), FI (001: 6 bits), IFGC diagnostic (16 bits), SO2 concentration (16 bits), CO2 concentration (16 bits), and NOx concentration (16 bits). In order for vessel position, course, and speed to be incorporated into the dataset, the nearest received AIS message 1 which contains this information was merged with the emissions data contained in message 8 upon reception at the PML and Rame Head stations. The largest time offset between receiving these two message types from RV Plymouth Quest was on the order of 5–10 s.

Appendix B. Trial 2 and Trial 3 AIS Single Slot Binary Message

The message encoding for ship emission data needed to work within the constraints of the S-AIS exactSeNS message protocol, i.e., a maximum of 113 bits of data payload. Following several meetings on the SCIPPER project (including a face-to-face meeting in Tampere, Finland—November 2019), the below data format was decided upon. This was a necessary compromise between the number of parameters which could be measured and the desired precision and accuracy.
  • #2 bit Identifier
  • #21 bit Latitude
  • #22 bit Longitude
  • #1 bit Flag SO2/CO2 threshold exceeded
  • #1 bit Flag NOx/CO2 threshold exceeded
  • #1 bit Flag Particles/CO2 threshold exceeded`
  • #1 bit Flag NH3/CO2 threshold exceeded
  • #8 bit SO2 ppm/CO2 ppm (range 0–0.05; precision 0.000196)
  • #8 bit NOx ppm/CO2 ppm (range 0–0.255; precision 0.001)
  • #8 bit Particles/CO2 g/kg (range 0–1; precision 0.0039)
  • #8 bit BC/CO2 g/kg (range 0–0.3; precision 1.176 × 10⁻³)
  • #4 bit Number of particles N/kg (CO2) (range 102–1018; precision—O magnitude)
  • #9 bit engine speed rpm (range 0–2000; precision 3.91)
  • #8 bit Fuel consumption kg/hr (0–2000; precision 7.81)
  • #11 bit log10 CO2 concentration (400–100,000 ppm; precision 1.0 ppm)

References

  1. Chen, R.J.; Huang, W.; Wong, C.M.; Wang, Z.S.; Thach, T.Q.; Chen, B.H.; Kan, H.D.; Grp, C.C. Short-term exposure to sulfur dioxide and daily mortality in 17 Chinese cities: The China air pollution and health effects study (CAPES). Environ. Res. 2012, 118, 101–106. [Google Scholar] [CrossRef] [PubMed]
  2. Sunyer, J.; Atkinson, R.; Ballester, F.; Le Tertre, A.; Ayres, J.G.; Forastiere, F.; Forsberg, B.; Vonk, J.M.; Bisanti, L.; Anderson, R.H.; et al. Respiratory effects of sulphur dioxide: A hierarchical multicity analysis in the APHEA 2 study. Occup. Environ. Med. 2003, 60, e2. [Google Scholar] [CrossRef] [PubMed] [Green Version]
  3. Eyring, V.; Koehler, H.W.; van Aardenne, J.; Lauer, A. Emissions from international shipping: 1. The last 50 years. J. Geophys. Res. 2005, 110, 243–257. [Google Scholar] [CrossRef]
  4. Capaldo, K.; Corbett, J.J.; Kasibhatla, P.; Fischbeck, P.S.; Pandis, S.N. Effects of ship emissions on sulphur cycling and radiative climate forcing over the ocean. Nature 1999, 400, 743–746. [Google Scholar] [CrossRef]
  5. Dalsøren, S.B.; Eide, M.S.; Endresen, Ø.; Mjelde, A.; Gravir, G.; Isaksen, I.S.A. Update on emissions and environmental impacts from the international fleet of ships: The contribution from major ship types and ports. Atmos. Chem. Phys. 2009, 9, 2171–2194. [Google Scholar] [CrossRef] [Green Version]
  6. Corbett, J.J.; Winebrake, J.J.; Green, E.H.; Kasibhatla, P.; Eyring, V.; Lauer, A. Mortality from Ship Emissions: A Global Assessment. Environ. Sci. Technol. 2007, 41, 8512–8518. [Google Scholar] [CrossRef] [PubMed]
  7. Eyring, V.; Köhler, H.W.; Lauer, A.B.L. Emissions from international shipping: 2. Impact of future technologies on scenarios until 2050. J. Geophys. Res. 2005, 110, 1707–1724. [Google Scholar] [CrossRef]
  8. Lynch, J.A.; Bowersox, V.C.; Grimm, J.W. Changes in sulfate deposition in eastern USA following implementation of Phase I of Title IV of the Clean Air Act Amendments of 1990. Atmos. Environ. 2000, 34, 1665–1680. [Google Scholar] [CrossRef]
  9. Malm, W.C.; Schichtel, B.A.; Ames, R.B.; Gebhart, K.A. A 10-year spatial and temporal trend of sulfate across the United States. J. Geophys. Res. 2002, 107, 4627. [Google Scholar] [CrossRef]
  10. Vestreng, V.; Myhre, G.; Fagerli, H.; Reis, S.; Tarrasón, L. Twenty-five years of continuous sulphur dioxide emission reduction in Europe. Atmos. Chem. Phys. 2007, 7, 3663–3681. [Google Scholar] [CrossRef] [Green Version]
  11. Beecken, J.; Mellqvist, J.; Salo, K.; Ekholm, J.; Jalkanen, J.P. Airborne emission measurements of SO2, NOx and particles from individual ships using a sniffer technique. Atmos. Meas. Tech. 2014, 7, 1957–1968. [Google Scholar] [CrossRef]
  12. Berg, N.; Mellqvist, J.; Jalkanen, J.P.; Balzani, J. Ship emissions of SO2 and NO2: DOAS measurements from airborne platforms. Atmos. Meas. Tech. 2012, 5, 1085–1098. [Google Scholar] [CrossRef] [Green Version]
  13. Mellqvist, J.; Beecken, J.; Conde, V.; Ekholm, J. Surveillance of Sulfur Emissions from Ships in Danish Waters; Chalmers University of Technology: Göteborg, Sweden, 2017. [Google Scholar]
  14. Kurchaba, S.; van Vliet, J.; Verbeek, F.J.; Meulman, J.J.; Veenman, C.J. Supervised Segmentation of NO2 Plumes from Individual Ships Using TROPOMI Satellite Data. Remote Sens. 2022, 14, 809. [Google Scholar] [CrossRef]
  15. Yang, M.; Bell, T.G.; Hopkins, F.E.; Smyth, T.J. Attribution of atmospheric sulfur dioxide over the English Channel to dimethyl sulfide and changing ship emissions. Atmos. Chem. Phys. 2016, 16, 4771–4783. [Google Scholar] [CrossRef] [Green Version]
  16. Verbeek, R.; van Dinther, D.; Mamarik, S.; Grigoriadis, A.; Weigelt, A.; van Vliet, J.; Smyth, T.; Deakin, A.; Irjala, M. Cost-effectiveness of Different Approaches for Compliance Monitoring. SCIPPER Project D5.3. EU Horizon 2020 Project No. 814893. Available online: https://www.scipper-project.eu/library/ (accessed on 3 March 2022).
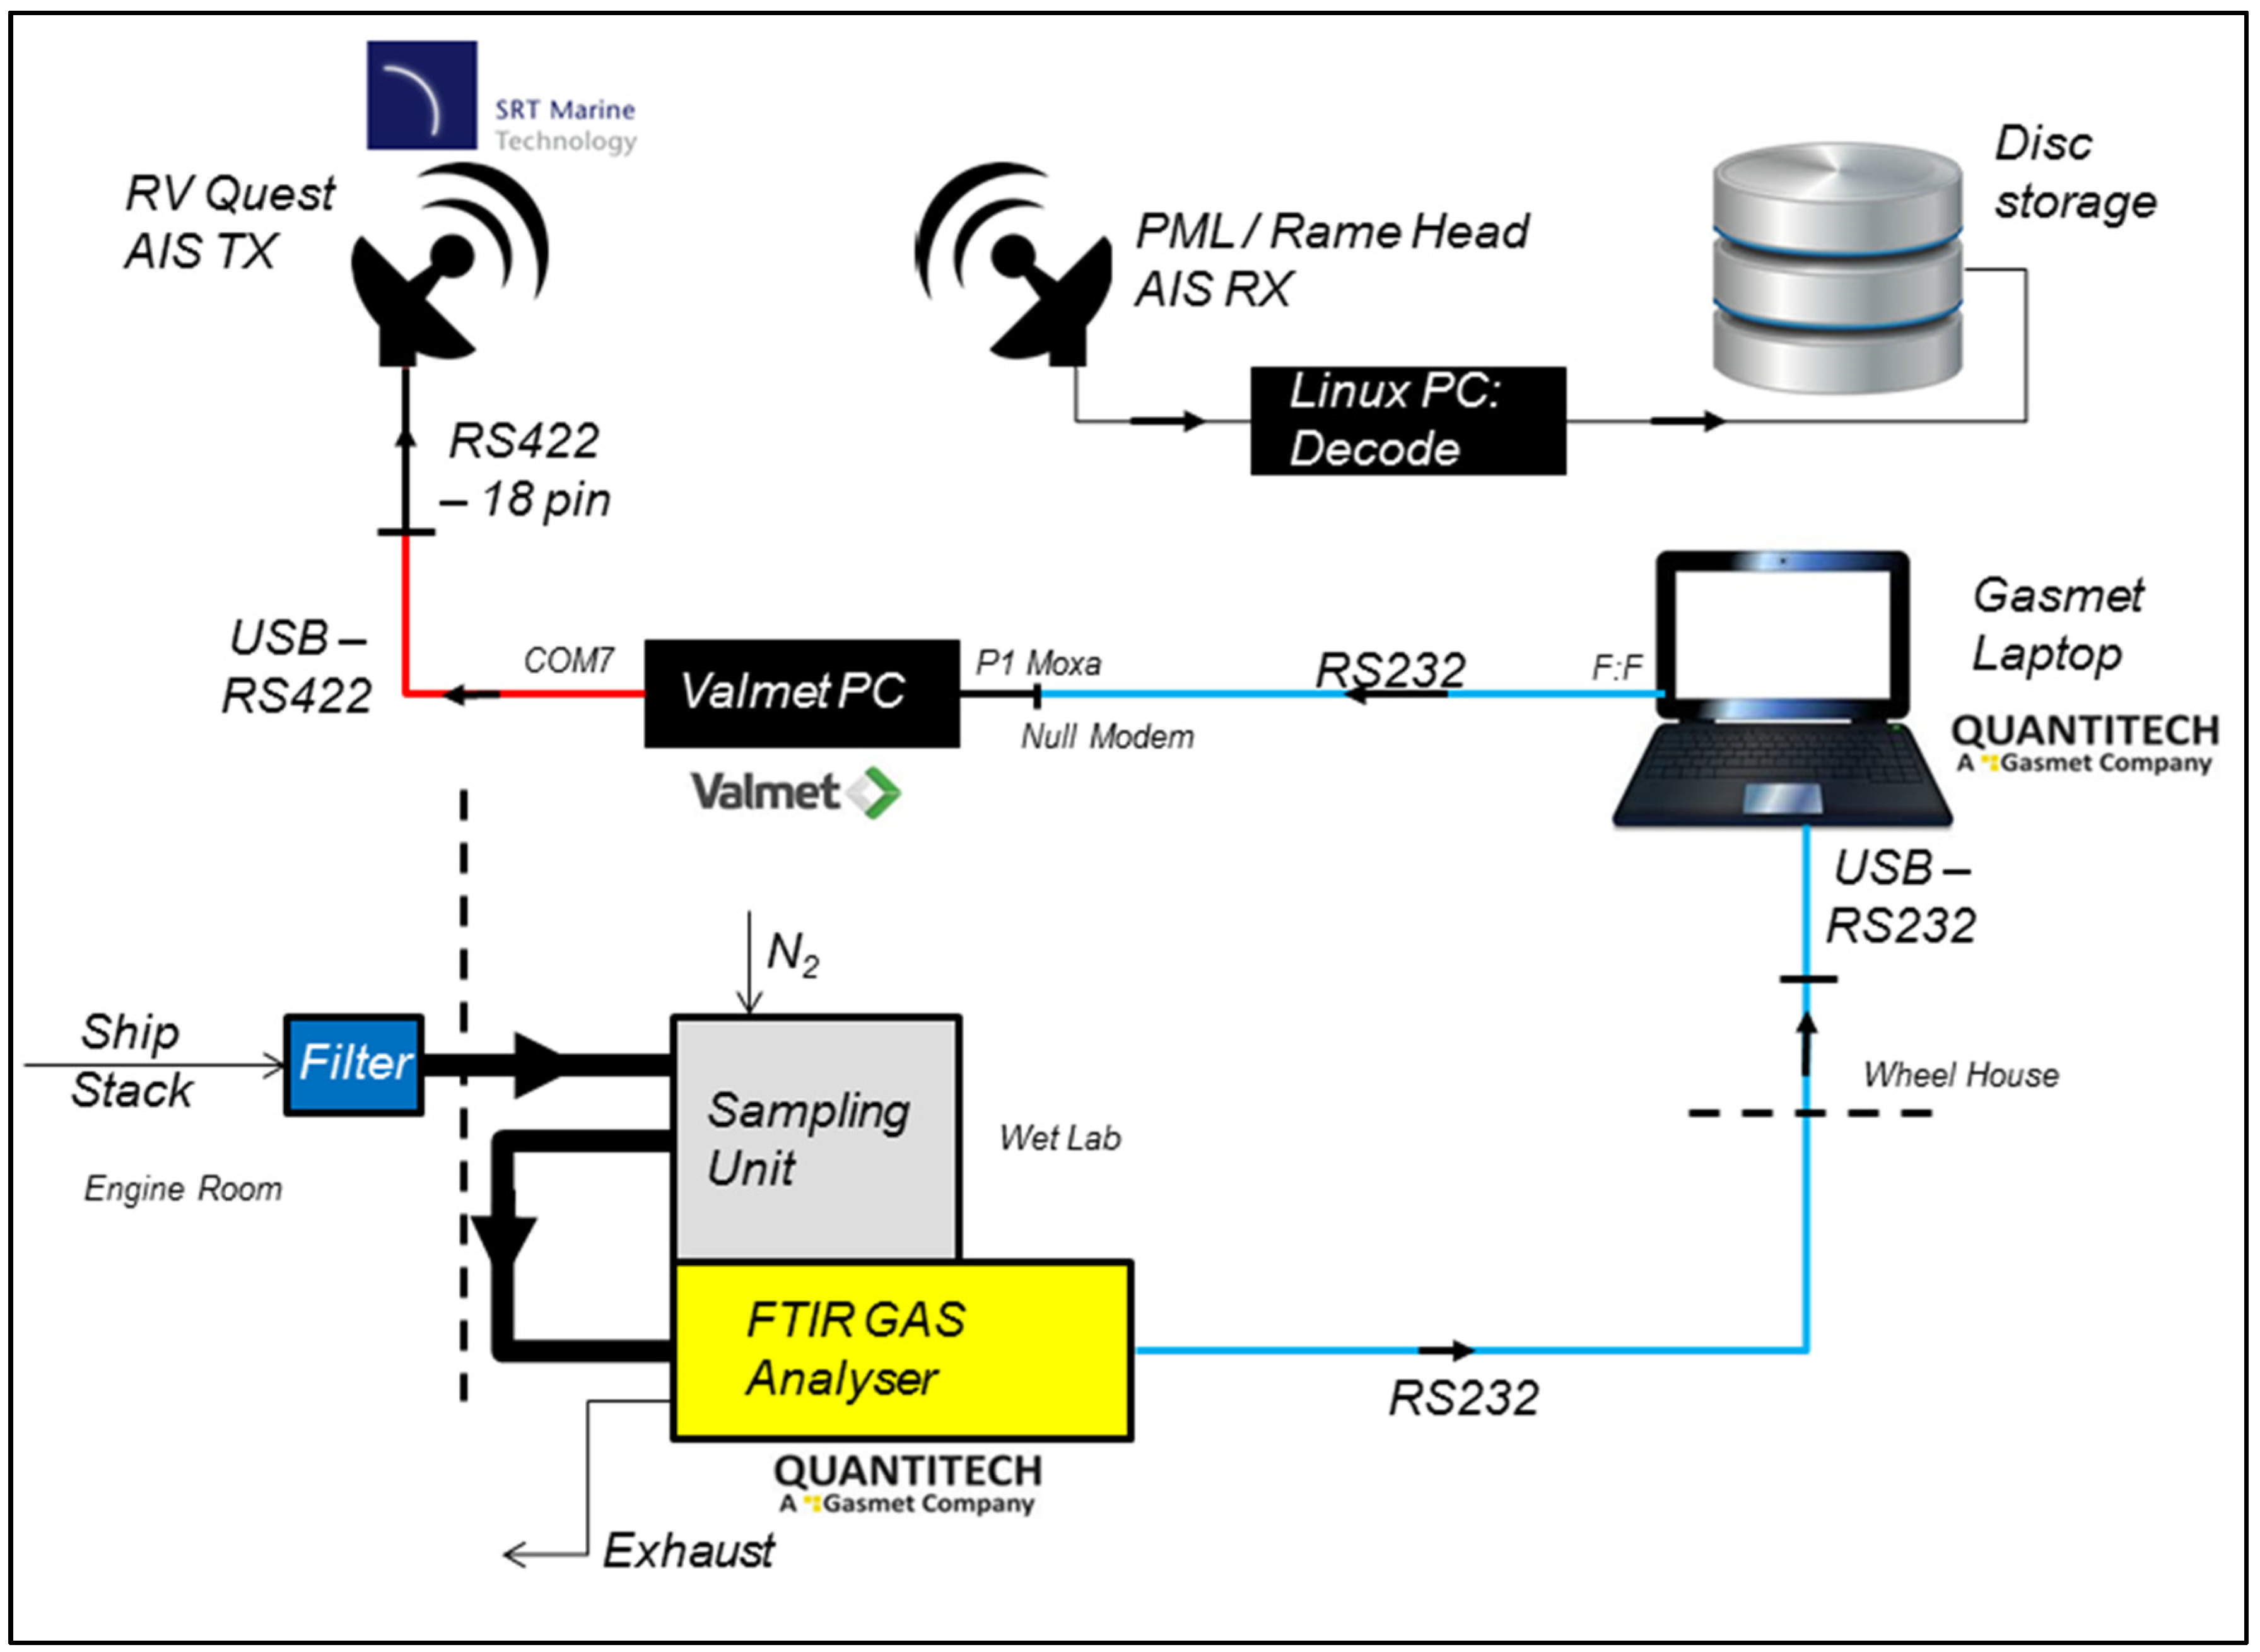
Figure 1. Schematic of the emissions reporting system as setup on the RV Plymouth Quest for Trial 1.
Atmosphere 14 00500 g001
Figure 2. The SEMS system integrated with S-AIS transmission used in Trials 2 and 3. Generalised schematic but based on the setup on the Stena Germanica.
Atmosphere 14 00500 g002
Figure 3. Schematic of the exactSeNS real-time satellite maritime VHF service showing the S-AIS encoding and decoding pipeline coupled to an end-user access service and visualisation.
Atmosphere 14 00500 g003
Figure 4. Trial 1—spatial variability in RV Plymouth Quest emissions of (A) SO2 (ppm), (B) CO2 (% vol), (C) NOx (ppm), and (C) fuel sulphur content (FSC—%). Numbers in (C) show the engine rpm for the different legs of the return journey. Data are presented using Ocean Data View.
Atmosphere 14 00500 g004
Figure 5. Intercomparison between the time-matched FTIR (Gasmet) analysed gas concentrations and those received via (terrestrial) AIS for (A) SO2, (B) NOx, and (C) CO2. For each plot, the linear regression and correlation statistics are shown.
Atmosphere 14 00500 g005
Figure 6. Uptime of several components of the SEMS onboard the RV Plymouth Quest.
Atmosphere 14 00500 g006
Figure 7. Emissions data and ship parameters from RV Plymouth Quest (Trip 14).
Atmosphere 14 00500 g007
Figure 8. Emission data and ship parameters from RV Plymouth Quest (Trip 26).
Atmosphere 14 00500 g008
Figure 9. Comparison of SEMS 1 Hz data and S-AIS data on RV Plymouth Quest (Trip 9).
Atmosphere 14 00500 g009
Figure 10. Comparison of SEMS 1 Hz data and S-AIS data on RV Plymouth Quest (Trip 20).
Atmosphere 14 00500 g010
Figure 11. Comparison of SEMS 1 Hz data and S-AIS data from 2 September to 3 September 2021, where the S-AIS data transmission was successful.
Atmosphere 14 00500 g011
Figure 12. exactSeNS detected hourly message count—Stena Germanica trial 1–15 September 2021.
Atmosphere 14 00500 g012
Figure 13. Summary exactSeNS detected hourly message count by month—RV Plymouth Quest extended trial 1 March–31 August 2021. NB: unit not operational in April 2021.
Atmosphere 14 00500 g013
Figure 14. Red circles show position of successfully received exactSeNS S-AIS messages from a single voyage to 30 km offshore Plymouth by RV Plymouth Quest on 17 August 2021, with shading representing the “ratio_nox” (NOx/CO2).
Atmosphere 14 00500 g014
Table 1. Concepts proved and themes demonstrated on Trial 1.
Trial 1Plymouth (UK), 2 March 2017
Concepts to proveSuccessful transmission of real-time emissions data from ship to shore using AIS
Themes demonstratedFaster, better
Table 2. Concepts proved and themes demonstrated on Trials 2 and 3.
Trial 2 and Trial 3Plymouth (UK), May–August 2021
Kiel (DE)/Gothenburg (SE), 31 August–11 September 2021
Concepts to proveSuccessful transmission of real-time emissions data from a low-cost sensor package (SEMS); attribution of emissions to an individual vessel
Themes demonstratedFaster, better, cheaper
Table 3. Properties of the SEMS system NOx, O2, and NH3 sensors.
Electrochemical NOx Sensor
Measurement range0–1500 ppm
Accuracy±10 ppm (<100 ppm NOx); ±10% (100–500 ppm); ±15% (500–1500 ppm)
Temperature range200–800 °C
Response time NOx1.1–1.2 s
Response time O21 s
Accuracy O2±2500 ppm (0–5% O2), ±5% (5–21%)
Electrochemical NH3 Sensor
Measurement range 0–100 ppm
Accuracy±5 ppm NH3 at 10 ppm NH3
Temperature range 200–450°C (functional), −40 °C to 700 °C (non-functional)
Response timeT60 = 3 s, T90 = 5 s
Disclaimer/Publisher’s Note: The statements, opinions and data contained in all publications are solely those of the individual author(s) and contributor(s) and not of MDPI and/or the editor(s). MDPI and/or the editor(s) disclaim responsibility for any injury to people or property resulting from any ideas, methods, instructions or products referred to in the content.