Abstract
In this study, we simulated the electron density disturbance at night in the bottom of the ionosphere caused by the electrostatic field in a thundercloud. The simulation was conducted using the charge of the thundercloud as the source, by incorporating a more up-to-date conductivity profile, and using the ion chemistry model for the lower ionosphere. The results revealed that a thundercloud charge of 30–100 C can cause a disturbance in the electron density in the lower ionosphere, decreasing to 40% of the original value or increasing to 160% of the original value. The electron density disturbance occurs mainly below an altitude of 80 km, and its peak is located at an altitude of 70 km, with a regional horizontal radius of about 50–75 km. The simulation results of this study improve the theory of Salem et al and extend the original one-dimensional model to three-dimensional space.
1. Introduction
In the past ten years, the effect of the electromagnetic fields produced by thunderstorms on the middle and lower ionosphere has been a popular research topic in the study of thunderstorms. For example, transient luminous events in the lower ionosphere, blue jets, red sprites, elves, and other phenomena are all associated with the strong electromagnetic pulse and quasi-electrostatic field generated by lightning [1]. Although the electrostatic field penetration caused by charged clouds is only infrequently discussed, it also plays an important role in the atmosphere–ionosphere energy transfer because of its long time scale. For example, before lightning occurs, the electrostatic field may continue to heat electrons at altitudes of 70–90 km, change the electrochemical balance of the lower ionosphere, and prepare for the transient luminous events to take place at that location [2]. Park and Helliwell [3] suggested that the electrostatic field of thunderclouds could form field-aligned ionospheric irregularities to serve as a possible source of the whistler ducts in the magnetosphere. Hegai and Kim [4] and Velinov and Tonev [5] proposed that the electrostatic field of thunderclouds at night can penetrate into the ionosphere and produce a void in the electron density in the E- and F-layers of the ionosphere.
Lightning discharges emit a radio atmospheric signal (called sferic) in broadband with the main energy concentrating at the VLF and ELF ranges. Since D-region ionosphere has a quite low electron density, it only interferes with VLF/ELF waves. This makes the sferic a natural “transmitting antenna” for probing the lower ionosphere with a proper Earth–Ionosphere propagation mode. Using this novel method, researchers have observed a series of events in which the reference height of the lower ionosphere changes atop or nearby thunderstorms at night [6,7,8]. These events are characterized by a long duration, generally lasting for several minutes and some even lasting for several hours. It has been observed that some ionospheric reference heights decrease (electron density increases), some ionospheric reference heights increase (electron density decreases), and the range of the reference height changes is about Δh = 1.6–3.3 km.
Salem et al. [9] concluded that this is the result of the electrostatic field effect in the thunderclouds because the duration of the displacement current of the lightning discharge in the D-layer is in the range of tens of milliseconds, while the conduction current generated by the static field can exist for a long time. They improved the ion chemistry model of Liu [1] and introduced the three-body electron attachment coefficient , the values of which depend on the reduced electric field (), and they simulated and obtained the change in the electron profile in the lower ionosphere at night under the action of a small electrostatic field. Their paper reports that the electron density may decrease to 40% of the original value or increase to six times the original value under the action of thundercloud electrostatic fields. Salem et al. derived a self-consistent one-dimensional current continuity equation that takes into account the electric field heating effect and the ion chemistry model [10]. They took the current density flowing into the ionosphere as the source and reported that the conductivity of the lower ionosphere may decrease by one to two orders of magnitude, and the very low frequency (VLF) wave reflection height may vary by 2 km.
Although Salem et al. [9,10] proposed a new mechanism for the disturbance of the electron density in the lower ionosphere caused by penetration of thundercloud electrostatic fields, they only estimated the conduction current above the thundercloud in the bottom of the ionosphere and used it to calculate the change in the electron density at that location based on one-dimensional current continuity equations. However, the source of the thundercloud’s electrostatic field is the thundercloud’s charge, and Salem et al. [9,10] did not provide explanations for such issues as the relationship between the thundercloud’s charge and conduction current, the profile and strengths of the high-altitude electric field caused by the thundercloud’s charge, the distribution of the conduction current in real space, and the size of the area where the electron density of lower ionosphere is disturbed. Discussions of these issues are necessary in order to complete the theory, and researchers must answer these questions through modeling.
In this study, we established a model in which the electric field of a thundercloud’s charge permeates the upper atmosphere and thereby disturbs the electron density in the lower ionosphere at night. The model treats the charge of the thunderstorm cloud as the source, adopts a more realistic atmospheric conductivity, calculates the spatial distribution of the thundercloud’s electric field, and incorporates Salem et al.’s [9] ion chemistry model. This model was used to qualitatively and quantitatively study the intensity and spatial characteristics of the electron disturbance of the lower ionosphere at night caused by the electric field of thunderclouds.
2. Physical Model
2.1. Equation for Electric Field Penetration of Upper Atmosphere by Electric Charge of a Thundercloud
Charged particles are produced in a thundercloud through various mechanisms during the gestation stage of a thunderstorm. These charged particles are separated by the updraft in the cloud and accumulate to form a dipole or multipole distribution. These charging processes last for minutes or longer, and the electric fields can be considered to be electrostatic. Strong lightning can suddenly remove or redistribute the charge in a thundercloud under steady-state conditions. This is equivalent to adding an opposite charge of the same strength where lightning occurs. These disturbances can persist over a relatively long time scale, so they can be regarded as quasi-electrostatic.
In this paper, we adopt a method similar to that of Velinov and Tonev [11] to establish an electric field penetration model of a thunderstorm cloud. The model is used to calculate the high-altitude electrostatic field caused by a single low-altitude thunderstorm cloud’s charge between the conductive neutral atmosphere and the lower ionosphere. Under steady-state conditions, the static equations are as follows:
We adopt a Cartesian coordinate system with the z-axis vertical. For medium and high latitudes, the magnetic lines of force can be set parallel to the z-axis and the magnetic inclination is [12,13]. Then, the conductivity tensor can be expressed in the Cartesian coordinate system as follows:
where is the field-aligned conductivity, is the Pedersen conductivity, and is the Hall conductivity. We further assume that the medium in the calculation area is uniform; that is, . Equations (1)–(4) can be expanded in cylindrical coordinates , and Equation (1) becomes:
From Equations (2)–(4), we can obtain:
Since the electrical conductivity in thunderclouds is close to 0, Equation (6) applies to the thunderstorm cloud region, while Equation (7) applies to the remaining atmospheric regions [11,14].
2.2. Thunderstorm Cloud Charge Model
Here, is the thunderstorm cloud’s charge density. Assuming that the electric charge of the thunderstorm cloud is and the center is located at on the z axis, then the density distribution is an elliptical Gaussian distribution:
where and are the upper and lower boundaries, respectively, of the thunderstorm cloud, is the central position of the thunderstorm’s charge, and and are the horizontal and vertical dispersions, respectively, of the charge at the present time. When , the probability distribution of the charge density in the interval is 95.44%, which can be the thickness of the charge layer (2 km). Similarly, when , the horizontal radius of the charge is 1 km. The normalization coefficient is calculated using Equation (6), and .
2.3. Atmospheric Conductivity Profile
In this paper, the atmospheric conductivity is divided into two parts. For altitudes below 80 km, we adopt the atmospheric conductivity model of McCormick et al. [15], which includes the actually measured night-time atmospheric conductivity of the 18–70 km neutral layer above the thunderstorm [16]. The conductivity model of the ionosphere above 80 km is obtained from theoretical formulas using the following equations [17]:
where is the Earth’s magnetic field. is the -type particle component, and we consider four types of charged particles: , , , and . , , and are the collision frequency, magnetic cyclotron frequency, and density of the charged particle , respectively. The collision frequency can be calculated using the method of Richmond and Roble [18]. The parameter values required to use Equation (10) can be obtained from the empirical models provided by the National Aeronautics and Space Administration (NASA) Community Modeling Center (CCMC) (https://ccmc.gsfc.nasa.gov/models/ (5 October 2022)). Among these, international reference ionospheric model IRI-2016 provides the density and temperature of the charged particles [19]. Neutral atmospheric empirical model NRLMSISE-00 gives the density and temperature of the neutral constituents, and the strengths of the Earth’s magnetic field are given by the international reference geomagnetic model [20,21]. In this paper, the input time and location of the empirical model are set to a location in Changchun (45°12′, 125°23′), and a local time of 23:30 on 20 September 2020.
To solve Equations (6) and (7), the conductivity needs to be expressed in exponential form:
where is the scale height of the field-aligned conductivity, and is the scale height of the Peterson conductivity of the th layer. According to the results of McCormick et al. [13] and based on the ionospheric conductivity profile calculated using the empirical formula parameters, we divide the atmospheric conductivity into seven layers (Figure 1 and Table 1).
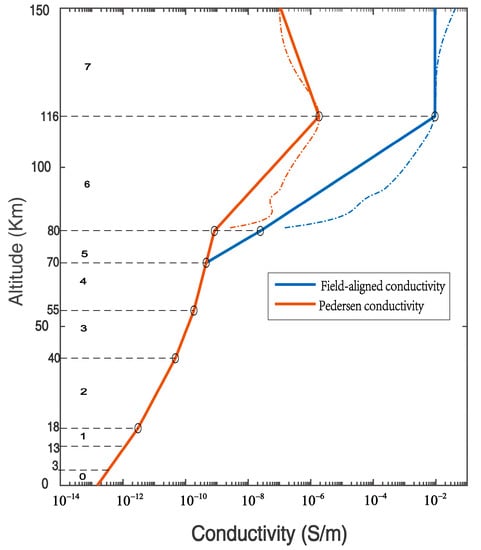
Figure 1.
Conductivity profile in the atmosphere. The dotted line is the ionospheric conductivity calculated using the fluid theory formula.

Table 1.
Conductivity scale height.
Among these, is the isotropic conductivity region. In the isotropic region, the density of charged particles is low, and the effect of the magnetic field is not obvious, . The region is an anisotropic region, in which the density of charged particles is relatively high, and the effect of the magnetic field cannot be ignored, .
2.4. General Solutions of Partial Differential Equations
Equation (6) is a second-order non-homogeneous linear partial differential equation, which is applicable to the thunderstorm cloud area , and the form of its general solution is , where is the general solution of the homogeneous equation, and is a special solution of the equation. The solution can be easily obtained using the separation of variables method [22]:
where and are undetermined coefficients, and is the 0th order Bessel function of the first type. A special solution of non-homogeneous equation can be obtained using the Hankel transformation method [11]:
By combining Equations (12) and (13), the general solution of Equation (6) can be obtained:
The value of the corresponding electric field is obtained from Equation (4):
where and are undetermined coefficients.
By substituting the conductivity profile in Equation (9) into Equation (7), there are two regions due to the physics of the atmosphere. When the conductivity of the atmosphere is isotropic, Equation (7) can be reduced to:
The general solution of this homogeneous partial differential equation is [12]:
The corresponding electric fields are:
where and are undetermined coefficients.
When the conductivity is anisotropic, Equation (7) reduces to:
The general solution of this homogeneous partial differential equation is [12]:
The corresponding electric fields are:
where and are the th order modified Bessel equations of the first and second type, respectively, and are undetermined coefficients, and is the height of the bottom of the segmented area.
2.5. Boundary Conditions of the Electric Field Equation
The region where the solutions for Equations (6) and (7) are sought extends from the surface of the Earth to the ionosphere above an altitude of in the atmosphere. In order to obtain a special solution, we need boundary conditions to determine the undetermined coefficients of the general solution. We divide the solution area into nine regions based on the height of the thunderstorm clouds and the scale height of the different atmospheric conductivity values (Figure 1). The general solutions of each area are different. Among these, the thunderstorm cloud area is , and the formats of the solutions are shown by Equations (14)–(16). The formats of the solutions for the Isotropic layer () are shown by Equations (19)–(21). For the anisotropic layer (), the formats of the solutions are shown by Equations (22)–(24). Assuming that the electric field is continuous everywhere in the region, the boundary between layers is as follows:
At the surface of the Earth, since the electrical conductivity of the Earth (– S/m) is much greater than the conductivity of the atmosphere above the Earth’s surface (– S/m). Thus, the Earth’s surface can be regarded as a good conductor, and the lower boundary condition can be written as:
In the E-layer of the ionosphere, the magnetic force lines are regarded as equipotential lines, and the upper boundary can be set at a height of . At this time, the upper boundary condition can be written as:
and Equations (27)–(29) are the boundary conditions of the model. When substituting the expressions for , , and into the formula, since they are all integral transforms with the Bessel function as the kernel, we can create 18 linear equations to obtain 18 undetermined coefficients: , , , and for a given value of . The electric field profile over a thunderstorm cloud may be obtained by performing numerical integration over the range after determining the set of coefficients for a given value of .
2.6. Ion Chemistry Model of the Lower Ionosphere at Night
In 2015, Salem et al. proposed an improved ion chemistry model for the lower ionosphere [9,23] to explore the influence of the electrostatic field of thunderstorm clouds at night on the electron density in the lower ionosphere. In the model, the charged particles at high-altitudes at night are divided into five categories: electrons , negative light ions (, , , and ), negative cluster ions (, , , and ), positive light ions ( and ), and positive cluster ions (hydrogen clusters ). The neutral particles can also be divided into three categories: neutral molecules ( and ), active neutrals (, , and other excited atomic states), and neutral cluster molecules (, , , and ). The model also includes cosmic ray particles as a stable source of ionization. By grouping the particles in this manner, hundreds of chemical reactions in the lower ionosphere can be summarized into six categories and 20 reactions (Table 2).

Table 2.
The set of chemical reactions that describe the steady-state night-time ion chemistry model of the lower ionosphere (taken from reference [9]).
By treating the charged particles as unknowns, the density of the charged particle in a steady state in the lower ionosphere can be written as:
According to the reaction in Table 2, this is not affected by the transport process of the charged particles. The subscript in the formula denotes the type of charged particle (, , , , and ), is the local source terms for the th charged particles, and represents the local loss terms of the th charged particles, all of which can be obtained from the chemical reaction formulas in Table 2.
The three-body electron attachment reaction in Table 2 is the main atmospheric electron loss mechanism when the electric field is below breakdown (). Salem et al. statistically analyzed the results of previous studies and proposed the following empirical formula for the three-body electron attachment reaction [9].
Generally, under good weather conditions, the value of the three-body electron attachment reaction rate in the atmosphere is:
On a day when a thunderstorm occurs, there is a weak electric field that penetrates from the thundercloud’s charge to a high altitude, and the three-body electron attachment rate in the atmosphere becomes:
where is the average electron energy (). This can be regarded as a function of the reduced electric field and can be calculated using the BOLSIG+ model (http://www.bolsig.laplace.univ-tlse.fr/index.html (accessed on 5 October 2022)) [24].
3. Model Results and Analysis
3.1. Distribution of Thundercloud Electric Field Penetration into the Upper Atmosphere
First, the high-altitude electric field above the thundercloud is analyzed according to thundercloud electric field penetration model proposed above. In this paper, the lower boundary of the thunderstorm cloud is set to and the upper boundary of the thundercloud is set to . The horizontal radius of the cloud charge area is , and the thickness is set to . Without loss of generality, the model calculates the electric field penetration induced by a 1 C charge centered at and a 1 C charge centered at . Because Equation (6) is linear, charge normalization can be used to calculate other magnitudes, and the penetration of the thundercloud electric field by the dipolar charges in 10-5 km can be calculated via superposition of charges at different heights because of the boundary conditions being consistent.
The diagram presented in Figure 2 shows the distribution of the electric field strength over the thunderstorm cloud caused by the monopole unit charge of the thunderclouds. The electric field strength induced by a unit charge at 10 km is stronger than that induced by a unit charge at 5 km, and total field strength decreases as the height increases. At = 13, 20, 40, 70, 80, and 110 km, the ratios of the maximum electric field are 0.2838, 0.4134, 0.5031, 0.5264, 0.5267, 0.5285, and 0.5339, respectively. At an altitude of , the maximum value of the penetration electric field for a charge centered at is located at , and the maximum value of the penetration electric field for a charge centered at is located at . For all other altitudes, the maximum value of the penetration electric field is located at . This is because at , the horizontal electric field component is much greater than the vertical electric field component (the order of magnitude of is , while the order of magnitude of is ).
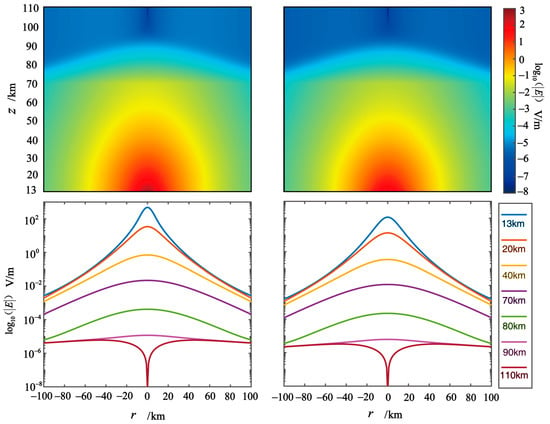
Figure 2.
(Top) On the left is the electric field intensity distribution induced by a thundercloud with a charge of 1 C centered at 10 km. On the right is the distribution of the total electric field intensity induced by a thundercloud with a charge of 1 C centered at 5 km. (Bottom) Plot of electric field intensity versus horizontal distance r at selected altitudes of 13, 20, 40, 70, 80, 90, and 110 km. The center of the left panel is at an altitude of 10 km, and the center of the right panel is at an altitude of 5 km.
Figure 3a shows the behavior of and for the charge centered at , and shows the behavior of and for the charge centered at . Below ~90 km, is greater than and both decrease exponentially with increasing altitude. Above ~90 km, the horizontal component electric field is almost constant, and the vertical component electric field decreases as the height increases. This is because at these altitudes the conductivity is anisotropic and . Under these conditions, the geomagnetic lines can be regarded as equipotential lines, and , which is parallel to the geomagnetic lines, will rapidly decrease to 0, while , which is perpendicular to the geomagnetic lines, can remain constant and can even be projected to the top of the ionosphere along the magnetic field lines. Figure 3b shows the behavior of the horizontal component varying with the horizontal distance at , which is considered in the ionosphere E-layer. In this example, a 1 C charge centered at can produce a penetration electric field with a maximum field strength of at night located at . For , a unit charge can produce a penetration electric field with a maximum field strength of located at .
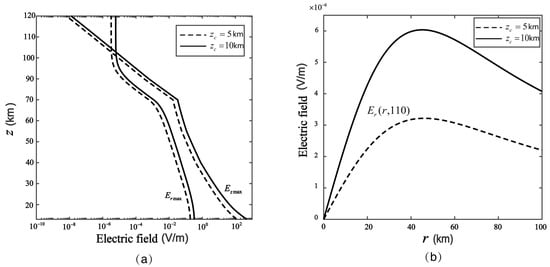
Figure 3.
(a) The vertical distributions of the maximum vertical electric field and the maximum horizontal electric field . For all , is taken to be 0 km; and for charges located at 10 km and 5 km, the horizontal distances are = 44 km and 45 km, respectively. (b) The horizontal electric field intensity in the ionosphere at an altitude of z = 110 km.
The electrostatic field of a thundercloud produces an upward conduction current density at the upper boundary of the cloud. This current can be regarded as the source of the penetration electric field above the cloud layer, and the conduction current above the cloud top can also be seen as the corresponding mirror image of the electric field . In the case of the 1 C charge centered at , the maximum vertical electric field has a field strength of 480 . The corresponding current density is about 0.629 . The maximum vertical electric field generated by the unit charge centered at is about 114 V/m, and the current density is 0.150 . Figure 4 shows the flow direction and intensity contour map of the conduction current density. We found that as the height increases, the contours of the current density gradually expand toward both sides, and the peak value of the current on the central axis continues to decrease. This shows that the current flows upwards and also has components that flow toward both sides. Therefore, the effect of the thundercloud’s charge, which has an original radius of , generates a high-altitude penetration electric field that is larger than that of the original thundercloud’s charge.
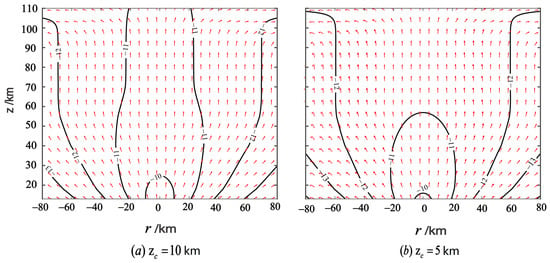
Figure 4.
On the left is a contour map of the conduction current density of a 1 C thundercloud centered at 10 km. On the right is a contour map of the conduction current density over a thundercloud caused by a 1 C thundercloud centered at 5 km. The units of the current density are A/m2.
The linear superposition method can be used to analyze the electric field above the thunderstorm cloud generated by a unit dipolar charge that is positive on top and negative on the bottom. The results are shown in Figure 5. The two-dimensional electric field strength profile and the distribution of the current field are similar to the electric field strength profile and the distribution of the current field produced by a monopolar charge, respectively. The dipolar charge induces a maximum vertical electric field of 365.7 at the upper boundary of the thunderstorm cloud and generates a current of 0.479 . At the height of the E-layer in the ionosphere, the maximum penetration electric field strength is about , and the maximum field strength is located at .
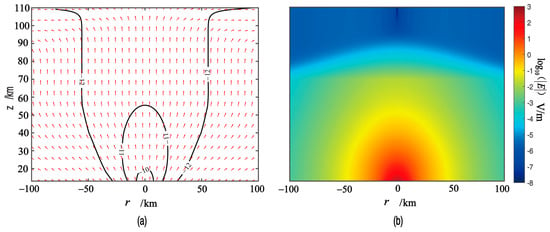
Figure 5.
(a) Contour diagram of the conduction current intensity caused by a 1-C dipolar charge at 5–10 km. The arrow indicates the flow direction of the current, and the units of the current density are . (b) Electric field intensity distribution caused by a dipolar charge at 5–10 km.
3.2. Quantitative Calculation of Electron Density Disturbance in Lower Ionosphere by a Thundercloud’s Electric Field
In this section, we combine the thundercloud charge penetration model and the night-time ion chemistry model to conduct a quantitative investigation of the electron density disturbance in the lower ionosphere at night caused by electric field penetration of a monopolar thundercloud charge at and a dipolar thundercloud charge at 10-5 km. We choose thundercloud charges of 30, 50, and 100 C to represent small, large, and super thunderstorms, respectively. In this paper, we only consider the steady-state results. The density parameter for the neutral particles (Figure 6b) are from the NRLMSISE-00 model, and the time and location of the thunderstorm are consistent with those chosen for calculating the conductivity profile in Section 2.4. Since electron density data are not available from the international reference ionospheric model for altitudes below 80 km, we use the following empirical formula to estimate the background electron density [25]:
where is the reference height in km, is the steepness of the ionosphere layer density, and their night-time values are generally taken to be and [26,27].
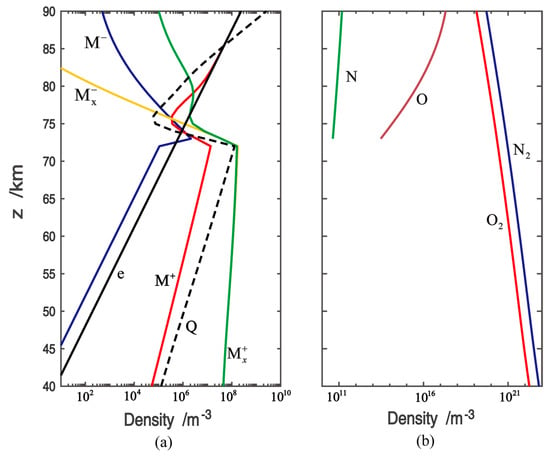
Figure 6.
Background profile of various particles: (a) charged particles and radiation source Q, and (b) neutral particle composition (taken from NRLMSISE-00).
The molecular weight of the neutral particles obtained from the NRLMSISE-00 model and the electron profile value obtained using Equation (33) are substituted into Equation (30), and then, R2 in Table 2 is chosen for the three-body electron attachment coefficient without the influence of an electric field. The set of nonlinear equations is then solved numerically to obtain the undisturbed density of the various charged particles and their corresponding night-time radiation particles Q (Figure 6a). In this study, a confidence zone iteration method [28] is used for calculations by setting the initial values: .
Now, we consider the electric field effect of the thunderstorm. The background and the neutral particle density are substituted into Equation (30), R3 in Table 2 is chosen for the three-body electron attachment coefficient with the influence of an electric field, and, then, Equation (30) is solved again to obtain electron density profiles with the disturbance of an electrostatic field.
The model results are shown in Figure 7. The size of the disturbance zone increases with increasing charge, and the shape of the disturbance zone resembles a nail on a plane. The altitude with the maximum horizontal disturbance appears at the junction between the isotropic conductivity and the anisotropic conductivity (z = 70 km). The affected electron density is almost concentrated below 75 km, and altitudes above 80 km are not affected. Given that the background electron density increases exponentially, the main disturbances of the electron density fluctuations are concentrated at 60–75 km above sea level. At an altitude of 70 km, the disturbance radius for a 30 C monopolar positive charge is and the maximum decrease in the electron density is 42% at . For a 50 C electric charge, the disturbance radius is , and the maximum decrease in the electron density is 42% at . For a 100 C charge, the disturbance radius is , the maximum increase in the electron density is 67% at , and the electron density decreases by 42% at . For dipolar thundercloud charges, the maximum disturbance radius for a 30 C charge is , and the maximum decrease in the electron density is 40% at . For a 50 C dipolar charge, the maximum perturbation radius is , and the maximum decrease in the electron density is 42% at . For a 100 C dipolar charge, the maximum disturbance radius is , and the maximum decrease in the electron density is 42% at .
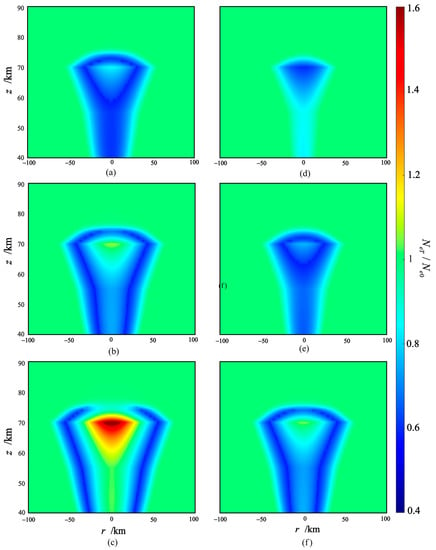
Figure 7.
r-z diagram of the rate of change in the electron density in the lower ionosphere at night caused by the electric field of the thundercloud charge. is the electron density in the lower ionosphere at night under the action of the electric field, and is the background electron density. To the (a–c) is the positive monopolar charge at 10 km, and to the (d–f) is the dipolar charge at 10-5 km. From top to bottom, the curves represent the results for 30, 50, and 100 C.
With the exception of the 100 C monopolar thunderstorm cloud charge, for which electric field penetration leads to a significant increase in the electron density, the main feature of the electric field penetration disturbances of all of the other thundercloud charges is a decrease in the night-time electron density. This is mainly because the three-body electron attachment coefficient (Equation (32)) under the action of an electric field increases linearly with increasing average electron energy in the range 0–0.13. It reaches a peak at , and then decreases exponentially as the average electron energy increases further. At it drops back to the value without the thundercloud electrostatic field effect and continues to decrease. Therefore, serves as a boundary. When the average energy of the electrons is less than , the main electron loss term is larger than usual, the electron density in equilibrium is lower than the background value, and a reduced peak appears at . When the average energy of the electrons is greater than , the main electron loss term is smaller than that on a normal day, and the electron density in equilibrium is higher than the background value. Figure 8 shows the average electron energy interacting with the lower ionosphere at night under the conditions of a severe thunderstorm.
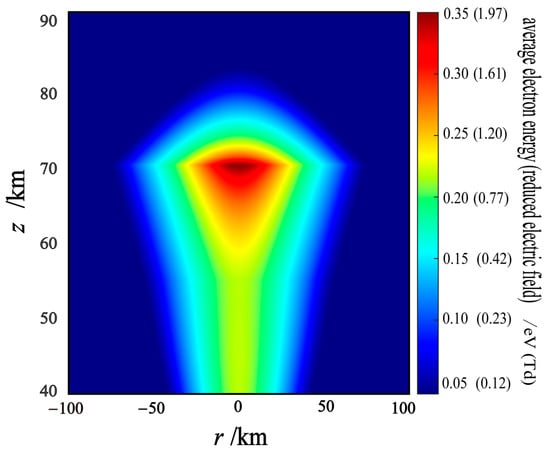
Figure 8.
Electron energy (reduced electric field E/N) in the lower ionosphere under the action of a 100 C monopolar thundercloud electric charge located at 10 km.
4. Discussion and Conclusions
Many researchers have improved the Park and Dejnakarintra [13] model in their analyses of the penetration effect of a thundercloud’s electric field on the ionosphere [6,7,11,12]. However, there are considerable discrepancies in their calculation results, and the reported electric fields in the E-layer of the ionosphere caused by a unit charge vary from to [29,30]. There are two main reasons for these discrepancies. First, the charge altitudes () were set differently. For a given conductivity profile, the higher the charge altitude, the greater the conduction current () generated at the upper boundary of the thundercloud will be, and the greater the electric field intensity above the thundercloud will be. Second, the conductivity profiles over the thundercloud were different. When the conductivity current generated at the thundercloud boundary remains unchanged, the smaller the local conductivity, and the greater the electric field intensity will be at that location. Hence, the greater the conductivity scale height (,) levels, the greater the electric field intensity. In this study, the model was set as a 10-5-km standard dipole instead of the 15-5-km dipole of the Park and Dejnakarintra [13] model, because research revealed that 90% of middle- to high-latitude thunderstorm tops were located at less than ~14 km [31]. The model’s conductivity profile, which was divided into seven layers instead of the two layers that the previous study used [11], is a combination of measured data for the neutral atmosphere above a thundercloud and ionosphere conductivity calculated by the theoretical formula using data from the NASA_CCMC models.
In the investigation of the electronic anomalies in the lower ionosphere using the electric field penetration model of a thundercloud’s charge, the results showed that for a single-cell thunderstorm, the infiltrating electrostatic field can reduce the electron density in the lower ionosphere by about 40% or can increase it by a factor of about 1.6. These results fall within the range estimated by Salem et al. [9,10]; that is, the electron density can decrease by 40% or increase by a factor of 6. The main difference in the calculations is that Salem et al. [9,10] adopted a one-dimensional current model and assumed that the current () generated by the charging current in the thundercloud at the upper boundary of the thundercloud due to the current continuity was conducted to the bottom of the ionosphere without reduction. At 69 km, the electric field strength is (~10 Td). In contrast, in this study, we used a three-dimensional thundercloud charge electric field penetration model. Although a 100 C monopolar thundercloud charge can produce a conduction current with a peak value of at the upper boundary of the thundercloud, at an altitude of 69 km, the peak value of the conduction current density will be attenuated to due to spatial shunting. The corresponding electric field value is about (~1.9 Td), so the result of our model is not as prominent as that predicted by Salem et al. [9]. In this study, we also found that for a thundercloud charge with a radius of 5 km, the radius of the disturbed electron density at 70 km can reach tens of kilometers.
These results do not indicate that the 10 Td electric field penetration strength estimated by Salem et al. can never occur. Depending on the effects of the changes in the atmospheric conditions, the atmospheric conductivity profile curves can vary widely. Hale [32] showed that the conductivity can vary by more than one order of magnitude between 50 and 80 km. Another possibility to consider is the effect of the geomagnetic inclination. Kabirzadeh et al. [33] conducted a simulation study on the penetrating electric field of thunderclouds at low latitudes at altitudes of 70–90 km. They found that the strength of the penetrating electric field at is tens of times greater than our results for . This may be due to the fact that the conduction current flowing upward at the equator () corresponds to the Peterson conductivity change term, and the Peterson conductivity is much smaller than the field-aligned conductivity, so the penetration effect of the thundercloud’s electric field is much more pronounced at low latitudes.
In summary, in this study, we took an elliptical Gaussian distribution cloud charge of a given magnitude as the source, introduced a more realistic conductivity profile, used the chemical reaction model of Salem et al. [9], and established a model of the disturbance caused by the penetration of a thundercloud’s electric field on the electron density of the lower ionosphere at night. The main results of this study are as follows.
- The thundercloud’s electric field perturbs the electron density of the lower ionosphere at night up to a height of 75 km in the vertical direction, but it generally does not exceed 80 km. The disturbance radius in the horizontal direction ranges from 50 to 75 km, and increases with increasing charge. The largest electron density disturbance occurs at an altitude of 70 km.
- Charges of 30, 50, and 100 C in a 10-5-km dipolar charge thundercloud electric field can all cause a 40% decrease in the electron density in the lower ionosphere.
- Monopolar thundercloud charges of 30 and 50 C can cause a 40% decrease in the electron density in the lower ionosphere, while a monopolar thundercloud charge of 100 C can increase the electron density in the lower ionosphere by a factor of 1.6.
- The model results obtained in this study are not as pronounced as those of Salem et al. [9]. The reason for this is that the three-dimensional thundercloud electric field penetration model constructed in this study considers the spatial shunting of the conductive current, so the value of the conductive current penetrating into the D-layer of the ionosphere is smaller than that estimated by Salem et al. [9].
Author Contributions
Conceptualization X.Y. and Y.L. (Yi Liu), Modeling X.Y., Visualization Y.L. (Youzhi Lin), C.Z. and Z.Z. All authors have read and agreed to the published version of the manuscript.
Funding
This research was supported by Hainan Provincial Natural Science Foundation of China (119QN239).
Data Availability Statement
The data underlying this article will be shared on reasonable request to the corresponding author.
Conflicts of Interest
The authors declare no conflict of interest.
References
- Liu, N. Multiple ion species fluid modeling of sprite halos and the role of electron detachment of O− in their dynamics. J. Geophys. Res. Space Phys. 2012, 117, A03308. [Google Scholar] [CrossRef]
- Pasko, V.P.; Inan, U.S.; Bell, T.F. Ionospheric effects due to electrostatic thundercloud fields. J. Atmos. Sol.-Terr. Phys. 1998, 60, 863–870. [Google Scholar] [CrossRef]
- Park, C.; Helliwell, R.A. The formation by electric fields of field-aligned irregularities in the magnetosphere. Radio Sci. 1971, 6, 299–304. [Google Scholar] [CrossRef]
- Hegai, V.; Kim, V.; Illich-Svitych, P. The formation of a cavity in the night-time midlatitude ionospheric E-region above a thundercloud. Planet. Space Sci. 1990, 38, 703–707. [Google Scholar] [CrossRef]
- Vellinov, P.; Tonev, P. Penetration of multipole thundercloud electric fields into the ionosphere. J. Atmos. Terr. Phys. 1994, 56, 349–359. [Google Scholar] [CrossRef]
- Han, F.; Cummer, S.A. Midlatitude nighttime D region ionosphere variability on hourly to monthly time scales. J. Geophys. Res. Space Phys. 2010, 115, A09323. [Google Scholar] [CrossRef]
- Shao, X.-M.; Lay, E.H.; Jacobson, A.R. Reduction of electron density in the night-time lower ionosphere in response to a thunderstorm. Nat. Geosci. 2013, 6, 29–33. [Google Scholar] [CrossRef]
- Lay, E.H.; Shao, X.M.; Jacobson, A.R. D region electron profiles observed with substantial spatial and temporal change near thunderstorms. J. Geophys. Res.: Space Phys. 2014, 119, 4916–4928. [Google Scholar] [CrossRef]
- Salem, M.A.; Liu, N.; Rassoul, H.K. Effects of small thundercloud electrostatic fields on the ionospheric density profile. Geophys. Res. Lett. 2015, 4, 1619–1625. [Google Scholar] [CrossRef]
- Salem, M.A.; Liu, N.; Rassoul, H.K. Modification of the lower ionospheric conductivity by thunderstorm electrostatic fields. Geophys. Res. Lett. 2016, 43, 5–12. [Google Scholar] [CrossRef]
- Velinov, P.I.; Tonev, P.T. Thundercloud electric field modeling for the ionosphere-Earth region: 1. Dependence on cloud charge distribution. J. Geophys. Res. Atmos. 1995, 100, 1477–1485. [Google Scholar] [CrossRef]
- Velinov, P.; Tonev, P. Modelling the penetration of thundercloud electric fields into the ionosphere. J. Atmos. Terr. Phys. 1995, 57, 687–694. [Google Scholar] [CrossRef]
- Park, C.; Dejnakarintra, M. Penetration of thundercloud electric fields into the ionosphere and magnetosphere: 1. Middle and subauroral latitudes. J. Geophys. Res. 1973, 78, 6623–6633. [Google Scholar] [CrossRef]
- Paul, S.; De, S.; Haldar, D.; Guha, G. Transmission of electric fields due to distributed cloud charges in the atmosphere-ionosphere system. Adv. Space Res. 2017, 60, 1891–1897. [Google Scholar] [CrossRef]
- McCormick, R.J.; Rodger, C.J.; Thomson, N.R. Reconsidering the effectiveness of quasi-static thunderstorm electric fields for whistler duct formation. J. Geophys. Res. Space Phys. 2002, 107, SIA 16-1–SIA 16-8. [Google Scholar] [CrossRef]
- Holzworth, R.; Kelley, M.; Siefring, C.; Hale, L.; Mitchell, J. Electrical measurements in the atmosphere and the ionosphere over an active thunderstorm: 2. Direct current electric fields and conductivity. J. Geophys. Res. Space Phys. 1985, 9, 9824–9830. [Google Scholar] [CrossRef]
- Yu, T.; Wan, W.; Liu, L. A theoretical model for ionospheric electric fields at mid-and low-latitudes. Sci. China Ser. G Phys. Mech. Astron. 2003, 46, 23–32. [Google Scholar] [CrossRef]
- Richmond, A.; Matsushita, S.; Tarpley, J. On the production mechanism of electric currents and fields in the ionosphere. J. Geophys. Res. 1976, 81, 547–555. [Google Scholar] [CrossRef]
- Bilitza, D.; Altadill, D.; Truhlik, V.; Shubin, V.; Galkin, I.; Reinisch, B.; Huang, X. International Reference Ionosphere 2016: From ionospheric climate to real-time weather predictions. Space Weather. 2017, 15, 418–429. [Google Scholar] [CrossRef]
- Picone, J.; Hedin, A.; Drob, D.P.; Aikin, A. NRLMSISE-00 empirical model of the atmosphere: Statistical comparisons and scientific issues. J. Geophys. Res. Space Phys. 2002, 107, SIA 15-1–SIA 15-16. [Google Scholar] [CrossRef]
- Macmillan, S.; Quinn, J. The 2000 revision of the joint UK/US geomagnetic field models and an IGRF 2000 candidate model. Earth Planets Space 2000, 52, 1149–1162. [Google Scholar] [CrossRef]
- Courant, R.; Hilbert, D. Methods of Mathematical Physics: Partial Differential Equations; John Wiley & Sons: Hoboken, NJ, USA, 2008. [Google Scholar]
- Glukhov, V.; Pasko, V.; Inan, U. Relaxation of transient lower ionospheric disturbances caused by lightning-whistler-induced electron precipitation bursts. J. Geophys. Res. Space Phys. 1992, 97, 16971–16979. [Google Scholar] [CrossRef]
- Hagelaar, G.; Pitchford, L.C. Solving the Boltzmann equation to obtain electron transport coefficients and rate coefficients for fluid models. Plasma Sources Sci. Technol. 2005, 14, 722. [Google Scholar] [CrossRef]
- Wait, J.R.; Spies, K.P. Characteristics of the Earth-Ionosphere Waveguide for VLF Radio Waves; US Department of Commerce, National Bureau of Standards: Gaithersburg, MD, USA, 1964; Volume 13. [Google Scholar]
- Bickel, J.; Ferguson, J.; Stanley, G. Experimental observation of magnetic field effects on VLF propagation at night. Radio Sci. 1970, 5, 19–25. [Google Scholar] [CrossRef]
- Cheng, Z.; Cummer, S.A. Broadband VLF measurements of lightning-induced ionospheric perturbations. Geophys. Res. Lett. 2005, 32, L08804. [Google Scholar] [CrossRef]
- Nocedal, J.; Wright, S.J. Numerical Optimization; Springer: Berlin/Heidelberg, Germany, 1999. [Google Scholar]
- Rodger, C.J.; Thomson, N.R.; Dowden, R.L. Are whistler ducts created by thunderstorm electrostatic fields? J. Geophys. Res. Space Phys. 1998, 103, 2163–2169. [Google Scholar] [CrossRef]
- Rodger, C.; Thomson, N.; Dowden, R. Correction to “Are whistler ducts created by thunderstorm electrostatic fields?” by CJ Rodger et al. J. Geophys. Res. Space Phys. 2002, 107, SIA 1-1. [Google Scholar] [CrossRef]
- Ushio, T.; Heckman, S.; Boccippio, D.; Christian, H.; Kawasaki, Z.-I. A survey of thunderstorm flash rates compared to cloud top height using TRMM satellite data. J. Geophys. Res. 2001, 106, 24089–24096. [Google Scholar] [CrossRef]
- Hale, L.C. Middle atmosphere electrical structure, dynamics and coupling. Adv. Space Res. 1984, 4, 175–186. [Google Scholar] [CrossRef]
- Kabirzadeh, R.; Lehtinen, N.; Inan, U. Latitudinal dependence of static mesospheric E fields above thunderstorms. Geophys. Res. Lett. 2015, 42, 4208–4215. [Google Scholar] [CrossRef]
Disclaimer/Publisher’s Note: The statements, opinions and data contained in all publications are solely those of the individual author(s) and contributor(s) and not of MDPI and/or the editor(s). MDPI and/or the editor(s) disclaim responsibility for any injury to people or property resulting from any ideas, methods, instructions or products referred to in the content. |
© 2023 by the authors. Licensee MDPI, Basel, Switzerland. This article is an open access article distributed under the terms and conditions of the Creative Commons Attribution (CC BY) license (https://creativecommons.org/licenses/by/4.0/).