Abstract
Horizontally averaged wind profiles inside the urban canopy are used in many studies and numerical models. The existing analytical models are only applicable to a small range of aspect ratios and mostly neutral atmospheric conditions due to their underlying assumptions. In this study, a surrogate model for predicting horizontally averaged wind profiles in the street canyons of an idealized urban canopy for a wide range of urban morphologies and thermal forcing scenarios is developed with the help of machine learning techniques and computational fluid dynamics (CFD) simulation data. The influence of urban morphological parameters, atmospheric stability and wind conditions on the urban canopy wind flow is modeled using machine learning algorithms applied on CFD simulation results. The numerical model is validated using wind-tunnel data. Steady-state Reynolds averaged Navier–Stokes (RANS) simulations with a standard k- turbulence model for 252 different simulation conditions are performed on an idealized building geometry that consists of a regular array of 4 × 4 cubes. The simulation results are averaged horizontally to obtain the mean velocity and temperature profiles. Surrogate models are developed using the simulation outputs as training examples and the best model is chosen by comparing the performance of different machine learning models. The surrogate artificial neural network (ANN) model of this study outperforms the current state-of-the-art models in the prediction of horizontally averaged mean wind profile inside the urban canopy. The mean error (ME) and root-mean-square error (RMSE) of the discrete point prediction ANN model of this study are 0.016 m/s and 0.060 m/s, respectively, which is significantly lower compared to the best of the legacy models for which the errors are 0.048 m/s and 0.387 m/s, respectively.
1. Introduction
As cities get denser and larger, the urban atmosphere changes significantly. The wind flow in urban areas plays an important role in determining the urban heat island intensity, pollution dispersion characteristics, ventilation characteristics, pedestrian wind and thermal comfort. It is also used in building energy consumption studies and mesoscale numerical weather prediction (NWP) models. More specifically, in NWP models, the surface layer modeling schemes require characterized momentum and scalar fields within the roughness sublayer. The wind flow in the streets near the buildings highly influence the convective heat flux at the walls [1] and plays an important role in the determination of convective heat transfer coefficient in urban canopy models (UCM). Therefore, the knowledge of horizontally averaged wind flow profiles within the roughness sublayer are essential for numerous applications. Despite the immense need, currently available analytical models lack the flexibility and accuracy for realistic and diverse urban neighborhoods. In this study, we propose a machine learning approach and demonstrate its superiority in comparison to the existing methods.
Several studies in the past have tried to determine the mean wind profiles in an urban or vegetative environment based on wind-tunnel experiments, theoretical formulations or CFD simulations. A mathematical model for airflow in a vegetation canopy was developed by Cionco [2] and an exponential wind profile of the form was suggested. The attenuation coefficient a could vary between 0.3 and 3 depending on the nature of the vegetative canopy [3]. Within homogeneous plant canopies, the dominant eddies through the depth of a vegetation canopy are produced from the mixing-layer instability of the shear layer at the top of the canopy [4]. This mixing is observed to lead to an exponential mean wind profile in vegetation canopies according to Finnigan [5] and in canopies of cubical urbanlike roughness elements according to Macdonald [6]. Macdonald modified the simple model for vegetation canopy to 3D arrays of obstacles with a constant mixing length assumption using empirical methods and proposed the use of the same exponential profile inside sparse urban canopies. The averaging was performed on a few points assumed to represent the entire space. The exponential coefficient a was estimated to have a linear relationship with the frontal aspect ratio of the cubes (). There were two main limitations to this model. First, there was an upper limit on the validity of the model () where skimming flow occurred. Second, it was only valid for neutral atmospheric scenarios. Similarly, Coceal and Belcher [7] developed a model for spatially averaged mean winds within and above urban areas assuming neutral atmospheric conditions using a simple mixing-length scheme to represent the dynamical effects of urban areas. The attenuation coefficient of the exponential function was then defined in terms of the mixing-length and the canopy morphology parameters. On the other hand, Harman and Finnigan [8] provided analytical functions of spatially averaged mean RSL wind profiles that were analogical to the standard Monin–Obhukhov similarity theory (MOST) for a wide range of atmospheric stabilities with the help of a mixing-layer flow analogy at the canopy top. An exponential equation of the form was suggested for in-canopy wind flow profiles where is the atmospheric stability parameter as mentioned in Table 1 which can be determined iteratively and is the mixing length which is also dependent on . Despite being a good starting point for the analytical solutions of stability-dependent wind flow profiles, the empirical relations and stability function calculations that were used in the solution procedure made its application limited. However, Kono et al. [9] performed a series of large-eddy simulations (LES) on cube canopies with different plan area densities ranging from 0.05 to 0.33 in neutral conditions and argued that the exponential approximation of the average velocity profile inside the urban canopy was not always valid. The discrepancy between the spatial average of wind velocity and Macdonald’s five-point average was found to be higher for dense canopies. It was also found that the mixing length varied significantly inside the canopy with a height which was contrary to Macdonald’s constant-mixing-length assumption. On the other hand, Yang et al. [10] found that for a wide range of urban morphology values from 0.03 to 0.25, an exponential profile was a very good representation of the mean velocity profile within the RSL with a series of LES studies in neutral conditions. It was found that in the upper 70–80% of the RSL, a generic exponential velocity profile with respect to the wall normal distance provided a very good description of the mean velocity. An iterative procedure was proposed to determine the attenuation coefficient with the help of a geometric sheltering model. Castro [11], through many direct numerical simulation (DNS) and LES studies of staggered and aligned cubic array canopies for a range of from 0.04 to 0.25 in neutral conditions, was not able to reasonably fit an exponential curve to the horizontally averaged mean velocity profiles. It was also found that the mixing length was not constant with height, and the author concluded that the urban canopy profiles might not be exponential in nature over a significant height range. Theeuwes et al. [12] evaluated the performance of MOST based models with roughness correction for modeling the momentum and scalar exchange within the urban RSL using measurement towers’ data from the Basel UrBan Boundary Layer Experiment (BUBBLE). The horizontally averaged velocity and temperature profiles of these models were compared and analyzed for various stability conditions occurring in a real urban environment. Inside the urban canopy, it was observed that the Harman and Finnigan parameterization performed better than the Macdonald’s model when compared against the measurement data. Awol et al. [13] recently developed a new 1D analytical model for in-canopy wind flow in neutral atmospheric conditions using a different drag parameterization relating mean velocity and turbulent stress from first principles assuming a horizontal homogeneity and vertically uniform canopy. The model’s wind profile resulted in a combination of logarithmic and exponential functions making it applicable for various packing densities. At very low , the wind profile tended to be logarithmic and at very high , it tended to be exponential in nature. These legacy models are advantageous in a sense that they are simple in nature and usually easy to implement. However, in practice, their accuracy and flexibility are limited due to underlying assumptions regarding atmospheric stability and the exponential nature of the flow profile.

Table 1.
Nomenclature.
There are many parameters that influence the horizontally averaged mean flow profiles in an urban canopy such as the urban morphology, the urban layout, external atmospheric scenarios, the presence of trees and cars, etc. Many previous urban wind flow studies through CFD simulations point out the most significant parameters. However, only a few of them have used nonisothermal CFD simulations to incorporate temperature boundary condition like in a realistic atmosphere in order to show the effect of surface heating and buoyancy on the horizontally averaged mean wind speed. Kim and Baik [14] investigated flow patterns in an urban street canyon between two buildings with aspect ratios ranging from 0.6 to 3.6 for every 0.2 interval and nine different thermal forcing scenarios. Later, Kim and Baik [15] studied the effects of ground and roof heating in a 3D urban canyon consisting of a 2 × 3 array of cuboid buildings (9.56 m tall) with periodic boundary conditions at the lateral boundaries. Both studies led to a conclusion that the 3D vortex structure varied significantly for different heating scenarios. Dimitrova et al. [16] performed 3D steady-state RANS simulations for a building configuration consisting of two buildings with using k- turbulence models with Boussinesq’s approximation and validated their model against wind-tunnel measurements. They concluded that the solar heating of building walls influenced the flow behavior significantly compared to the isothermal case. Santiago et al. [17] studied the effect of buoyant forcing scenarios in the resulting flow fields in a street cavity formed by two buildings with . Steady-state RANS simulations were performed with a standard k- turbulence model along with a radiation model to obtain temperatures at different walls in order to capture the heating scenarios at various solar positions. For realistic wall-heating scenarios, the flow field showed variation from the neutral case and the highest variation from neutral case was observed when the sun was directly above the walls and ground when the radiation effects were maximum. It was therefore concluded that the horizontally averaged mean flow properties were more dependent on the ratio of buoyant-to-inertial forces and less dependent on the solar position. These studies showed the significance of buoyant effects on the urban wind flow and thereby led to the inclusion of different surface-heating scenarios in the present parametric study.
Another important parameter which also plays a major role in mean wind profile estimation is the canyon aspect ratio , where H is the building height and W is the canyon width. Few studies have investigated the effect of the canyon aspect ratio on the mean wind speed inside the canyon. Kovar-Panskus et al. [18] performed 2D steady-state CFD simulations on a single street cavity formed by two buildings using a standard k- turbulence model and observed that the flow regimes, vortex structures and vortex center positions varied for different canyon aspect ratios. Xie et al. [19] studied wind flow and pollutant transfer for the same 2D canyon for different wall-heating scenarios and a series of aspect ratios (between 0.1 and 2) covering various flow regimes. It was concluded that the mean flow behavior inside the canyon was highly dependent on the aspect ratio and stability condition. Memon et al. [20] simulated diurnal heating scenarios using a 2D RANS simulation with a renormalization group (RNG) k- turbulence model on a row of building cavities. A linear regression model was used to obtain the relationship between air temperature and aspect ratio. To complement these studies, the canyon aspect ratio was also included in the present parametric study.
Even urban layouts are important as suggested by Allegrini et al. [21]. In their study, the influence of urban morphology on the urban microclimate was investigated using 3D steady-state RANS simulations with Boussinesq’s approximation and standard k- turbulence model. These simulations were performed for six different urban morphologies to mainly study the building surface temperatures and outdoor air temperatures. Buildings of dimensions H = 10 m, B = 10 m and L = 10 to 70 m were simulated for two reference wind speeds at a 10 m height (1 m/s and 5.5 m/s) and using a building energy simulation (BES) model to determine the surface temperatures of building walls and ground. The temperatures were found to be significantly lower for an aligned configuration compared to a staggered configuration. Moreover, in general, zones with high temperatures often coincided with low winds which could lead to decreased thermal comfort.
Most previous studies have not considered the effect of the ambient wind direction on the mean wind flow. Kim [22] used 3D CFD simulations with an array of 4 × 4 buildings to study the effect of wind direction on neutral urban flow and dispersion characteristics. Simulations with ten different wind angles ranging from 0 to 45 in intervals of 5 were performed to investigate the vortex structure variations with respect to the wind angle. The flow patterns were classified into three regimes based on incoming air flow direction and it was concluded that the ambient wind angle significantly affected the mean flow behavior inside an urban canyon. Allegrini et al. [21] also suggested to perform more simulations with oblique flow to study the urban microclimate in detail. While all other studies considered wind angles that were perpendicular to the buildings (0) and ignored oblique ones, the present parametric study included the investigation of oblique winds on mean wind profiles.
Some studies have also used LES or vortex dynamics model in order to improve the accuracy of nonisothermal simulation results. Wang and Cui [23] simulated the Uehara’s wind-tunnel experiment conditions using an LES model with an idealized building array geometry mainly to compare the results against the previous RANS simulation studies and suggest improvements. The model geometry consisted of a 10 × 6 array of regular cubes similar to the wind-tunnel model described in Uehara et al. [24] with periodic boundary conditions at the lateral sides to simulate an extension of building rows in the lateral direction. It was concluded that the momentum effects due to buoyancy were overestimated by RANS simulations and therefore LES could be a reasonable choice for accurate simulations of unsteady flows. Chen et al. [25], on the other hand, compared LES and RANS models for nonisothermal applications and argued that the horizontally averaged flow properties were similar. The urban air flow subjected to diurnal variations of atmospheric stability located at five different climatic zones in China was studied for an idealized building array geometry of 6 × 6 buildings with , m, m and . Steady-state RANS simulations with a standard k- model, standard wall functions and Boussinesq’s approximation were used to obtain the mean flow in stratified atmospheric conditions with good accuracy. An alternate approach based on vortex dynamics for neutral atmospheric simulations was given by Furtak-Cole and Ngan [26] which are computationally much cheaper than RANS or LES simulations. As an extension to that study, Wang et al. [27] also used the same approach to evaluate the model’s capability to incorporate geometric and thermal effects. Few canyon types and stratification scenarios were simulated, and reasonably accurate mean profiles were obtained. Although faster than conventional CFD models, their method was based on the numerical resolution of the Poisson partial differential equation and used a very simple canyon configuration and flow properties.
In the last decade, the use of artificial intelligence and machine learning techniques in wind-engineering applications have greatly increased. The study by García-Gutiérrez et al. [28] used an ANN trained with lidar (light detection and ranging) wind profile measurements at low levels (30 m) to estimate the vertical atmospheric boundary layer (ABL) wind profile. It was observed that the ANN model prediction results were better than simple traditional analytical models such as log-law and power law. In a similar study by Türkan et al. [29], machine learning models trained with annual wind-speed measurement data in Kutahya (Turkey) at 10 m were used to predict wind speeds at 30 m. Seven machine learning models were compared and the results showed that the support vector machine (SVM) and multilayer perceptron (MLP) were superior for wind-speed predictions compared to the rest. On the other hand, some studies have successfully used CFD simulation data rather than measurement data for training the models. Ding and Lam [30] successfully developed machine learning models such as gradient boosted nonlinear and multivariate linear regression models that were trained using isothermal CFD simulation data to determine cross-ventilation potential in an urban environment. These studies exhibited the potential of machine learning algorithms and the ability of surrogate models to replace CFD simulations in wind-engineering studies.
The current study aims to develop and validate a comprehensive machine learning scheme to estimate the horizontally averaged velocity and temperature profiles in an idealized urban canopy for a wide range of urban morphologies and thermal forcing scenarios. Multiple steady-state RANS simulations with a standard k- model, standard wall functions and Boussinesq’s approximation for various atmospheric and geometric scenarios were performed. The simulation results were used for training machine learning models which were shown to have great potential to replace the legacy empirical and semiempirical models. Our main focus was to build a state-of-the-art surrogate model that provided an accurate solution for mean profiles inside the urban canopy. The novelty in this research lies in the development of a model that takes into account the combined effect of the most important parameters affecting the average wind flow for specific regions in the urban canopy.
2. CFD Model
The CFD simulations were carried out in OpenFOAM v5 software [31]. A 3D steady-state incompressible RANS simulation with a standard k- turbulence closure model was used in this study following Santiago et al. [17] in which the average flow properties were found to be similar in RANS and LES simulations. The solver was used for the solution of nonisothermal atmospheric conditions using Boussinesq’s approximation. Near-wall modeling was established using wall functions. The SIMPLE (Semi-Implicit Method for Pressure Linked Equations) algorithm was used to solve the pressure and velocity coupling. The field relaxation for hydrostatic pressure () was set as 0.7 and equation relaxations for U, T, k and were set as 0.3, 0.5, 0.7 and 0.7, respectively. The choice of relaxation factors is explained in Section 3.
2.1. Domain and Boundary Conditions
The guidelines by Blocken [32] and Franke et al. [33] were used as a reference to construct the simulation domain. According to them, the inlet boundary of the domain must be at least at a distance of from the first row of buildings to ensure an undisturbed flow at the inlet, where H is the height of the roughness elements. The lateral boundaries must be at least at a distance of from the side walls of buildings. The outlet of the domain must be at least at a distance of after the last row of buildings to ensure a proper development of a wake flow region. The top boundary must be at least at a distance of from the roof of the highest building to avoid artificial acceleration of the flow near the building roofs. The domain patches in the study should therefore be large enough to comply with the guidelines in order to obtain a reliable numerical solution. At the same time, it has to be small enough to minimize the computational complexity and simulation time.
The domain is shown in Figure 1. The inlet velocity profile that was obtained using the reference velocity , reference temperature of air, wind angle and other turbulent properties were specified at the inlet of the domain. Rural wind profiles with neutral stability were specified at the inlet in order to maintain a standard inlet wind profile across all the simulations which were also used in similar studies [15,25,34]. The inlet wind profiles were also verified with the approach profiles of Uehara’s wind-tunnel study [24]. The atmospheric boundary layer class in OpenFOAM was used for simulating neutral and equilibrium ABL profiles with the help of ABL derivations by Yang et al. [35] which are an extension from studies [36,37]. The velocity profile was characterized as a logarithmic curve in the vertical direction at the inlet using a predefined boundary condition in OpenFOAM:
where is the friction velocity, is the von Kármán constant, z is the ground normal distance, d is the zero-plane displacement height and is the aerodynamic roughness length. The rural wind profile with and d obtained from VDI-Guidelines (VDI 3783-Part 12) was used at the inlet, see [38]. So for a moderately rough profile, m and were chosen. The turbulent kinetic energy (k) and turbulent kinetic energy dissipation rate () were characterized by the following expressions.
where and are the empirical model constants. OpenFOAM uses a default value of and , as formulated by [36,37]. In order to provide a starting point to the simulation, an initial guess for the turbulence quantities were required. It was calculated using the reference input values. First, was calculated with the help of the reference velocity as shown below.
After calculating and using default empirical coefficients in Equations (2) and (3), the initial values for k and were obtained as shown below.
At the top boundary, a zero gradient boundary condition for the flow fields was employed under an assumption that the top boundary was not affected by the simulated flow since it was far from buildings (). At the outlet, the boundary condition of OpenFOAM was used, through which the reverse flow could be avoided by setting a zero reverse flow value at the outlet. At the lateral sides, similar to the top boundary, a slip boundary condition was initially used until validation. It was later modified to a periodic boundary condition to incorporate multiple wind angles, which is explained in Section 3. In order to maintain the periodic nature of the flow, the lateral boundaries in Figure 1 were shortened to a distance of from the building boundaries. A no-slip boundary condition for the velocity was used at the walls to enforce zero velocity at the walls. To model nonisothermal simulation conditions, the temperature at the surfaces and that of the ambient air were enforced by using fixed temperature boundary conditions. Appropriate wall functions were chosen based on validation, which are also explained in Section 3.
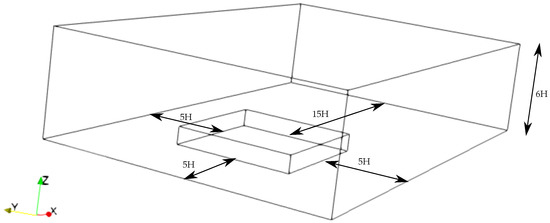
Figure 1.
Initial simulation domain for a city block (validation stage).
2.2. Nondimensional Wall Distance ()
is the nondimensional wall distance that is used to define the law of the wall. The used in OpenFOAM is formulated below in Equation (6).
Hargreaves and Wright [36] mention that the logarithmic law of the wall can be consistently and accurately applied for a standard range of between 30 and 1000. However, in computational wind-engineering applications, the active range of is mostly observed outside the standard range according to Hargreaves and Wright and van Hooff et al. [39]. The behavior of the nondimensional velocity against the nondimensional distance was studied by Schetz and Bowersox [40] and Van Driest [41], in which it was mentioned that the nondimensional velocity could be characterized using a nondimensional distance up to 10,000 using a log law, which was used as a standard in this study.
3. Validation and Simulation Setup
Many wind-tunnel studies have measured wind flow over an urban-like environment considering nonisothermal atmospheric conditions in the past [24,42,43]. In this study, Uehara’s wind-tunnel data were used for the validation since the simulation geometry and conditions were similar. For nonisothermal flows, the flow similarity was established by Reynolds number independence () and Richardson number similarity criteria according to Snyder [44]. The bulk Richardson number () formulation was similar to that in Kim and Baik [14], as shown here:
where g is the gravitational constant, and is the reference height. The reference height is the height at which the known values of flow quantities are present. is the potential temperature of the air at the reference height, is the potential temperature of the surface, and is the mean potential temperature within street canyon. The simulation geometry used for the validation consisted of a regular array of 10 × 6 cubes similar to Uehara’s wind-tunnel model scaled by 100:1. Building dimensions were and the street width was such that the canyon aspect ratio was . The atmospheric stability scenario for was simulated, which corresponded to , , , , and . Since styrofoam was used to represent cubic elements in the wind tunnel, a zero gradient temperature boundary condition was applied at the buildings walls and roof in the CFD simulation. This was in accordance with Wang and Cui [23], who used LES to compare the results with Uehara’s wind-tunnel measurements. The thermal instability was generated with the help of a fixed temperature at the ground. The air temperature was fixed at the top boundary. The inlet temperature was also maintained at the reference air temperature. For the simulations, the Prandtl number , the turbulent Prandtl number , the kinematic viscosity and the volumetric thermal expansion coefficient of air were used. Relaxation factors can determine the stability and the rate of convergence of a simulation. They artificially introduce a diagonal dominance to the matrices and introduce a stability to the solution of coupled equations. Hence, they were adjusted to find the best combinations and the optimal values were found to be 0.7 for pressure () and 0.3, 0.5, 0.7 and 0.7 for U, T, k and , respectively. The effect of wall functions, turbulence closure schemes and layer addition near walls were investigated and the best simulation configuration suitable for multiple simulations was obtained, which is explained in detail in [45]. Moreover, Xie et al. [46] performed 2D steady-state RANS simulations for a finite row of nine identical street canyons with standard, RNG and realizable k- turbulence models to compare the performance against Uehara’s wind-tunnel results. It was concluded that all three turbulence models performed almost the same for unstable atmospheric simulations. Therefore, a standard k- model with standard wall functions was chosen for the final simulations in this study.
The simulation results plotted against Uehara’s wind-tunnel measurements are shown in Figure 2. The RMSE for the velocity was 0.104 m/s and was 0.935. For the temperature, the RMSE was 0.185 and was 0.622. The quantitative results showed that the velocity was modeled reasonably well using simulations but the temperature modeling was not very close to the measurements. This could be due to three reasons. First, the validation simulation was performed in real scale by geometric scaling considering dynamic similarity conditions to ensure its applicability in realistic urban conditions. As a result, the temperature difference between walls and the atmosphere reduced to 9 K in real scale from 40 K in wind-tunnel scale. Second, the trade-off between computational cost and accuracy restricted the use of a very fine mesh for such a large domain where 10 rows of roughness elements were present. Third, the discrepancy could also be explained to some extent by the adiabatic wall constraint of the model, which may be slightly different from the actual wind-tunnel conditions. Moreover, to increase the ease of applicability of wind angles to the simulations, periodic boundary conditions were used. Steady-state results were verified for a 4 × 4 building geometry for wind angles up to 45° thereby enabling the use of periodic boundary conditions at the lateral walls, which is also mentioned in detail in [45].
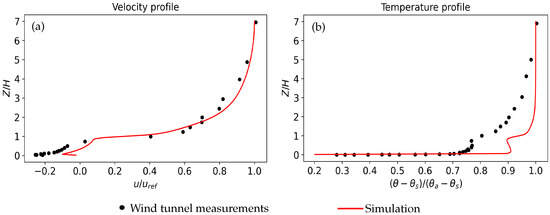
Figure 2.
Validation simulation: wind-tunnel measurement vs. simulation results for velocity (a) and temperature (b).
4. Case Study of an Idealized City Model
Real urban canopies are complex due to random building heights and due to the presence of obstacles such as cars, trees, etc. In every locality, the configuration of urban elements differ.
Therefore, an idealized city model consisting of a regular array of 4 × 4 cubes as shown in Figure 3 was chosen for the parametric study. The choice of simulation geometry is a trade-off between model complexity and detailed averaging region. The model should not be too complex and at the same time, a good region for averaging the flow quantities is required. A 4 × 4 cubic arrangement of buildings also benefited us with a central crossroad area between four corners of the inner-most buildings for this study. Allegrini et al. [1] analyzed the velocity and turbulent kinetic energies inside a scaled model of an urban canyon to study the influence of buoyancy due to heated surfaces on the flow field using wind-tunnel measurements and observed distinct changes in the flow fields for different heating scenarios (isothermal, all surfaces heated, windward wall heated, leeward wall heated and ground heated). The maximum turbulent kinetic energy was found with the all-surface-heating scenario. Santiago et al. [17] concluded that the horizontally averaged mean flow properties were less dependent on the solar position (i.e., differential-wall-heating scenarios). Therefore, in this study, all-surface heating was adopted to create the atmospheric stratification. The choice of mesh for this simulation affected the accuracy of the results. Therefore, the mesh independence was verified with the grid convergence index (GCI) procedure as explained by Roache et al. [47] for three different grid spacing values inside the city boundary ( and ). The GCI results showed an average deviation of 8.33% within the canopy and 0.4% above the canopy for horizontally averaged wind profiles. The mesh independent study is explained in detail in [45]. As a result, a grid spacing was chosen as an optimal trade-off between accuracy and simulation time. The highest values among all the cases in this parametric study were also verified to be within 10,000. At the building walls, the value was 6412 and at the ground, the value was 5395.

Figure 3.
Idealized city model with 4 × 4 cubes.
4.1. Basel Annual Climate Data
The atmospheric flow variables are directly affected by microclimatic conditions and diurnal temperature variations. There exists a range of stability conditions within a day and within a year in an urban neighborhood. As a part of BUBBLE conducted in Basel (Switzerland), the urban boundary layer was investigated in detail by Rotach et al. [48]. One of the experimental sites which was located at Basel Sperrstrasse (city center) was used in that study. A tall tower equipped with anemometers and thermometers at six height levels was raised at the site to measure wind velocities, wind direction and temperatures.
That experimental site consisted of an urban canyon similar to the geometry of interest. The location at which measurements were taken went up to the top of the tower (around 30 m) which was within the inertial sublayer (ISL). The raw data consisted of measurements for every 10 min for which hourly averaging was performed. The period of analysis was chosen as January 2002 to mid July 2002. This period had a good quality data and was spread among different seasons. The velocity magnitude at a height of 31.7 m was used as the reference velocity. The temperature at a height of 31.2 m was used as the reference temperature. However, surface temperature values were not available with BUBBLE data. Hence, the wall surface temperature results were obtained from the model explained in Afshari and Ramirez [49], which was simulated for Basel conditions.
The atmospheric stability was defined by the bulk Richardson number () and it was calculated for the given period based on the flow variables at every hour using Equation (7). Its frequency distribution is shown in Figure 4, which indicates that extreme bulk Richardson number events occur rarely in a realistic urban environment. The critical value of was taken as zero in this study. If , the atmosphere was considered stable; if , it was considered unstable; and if , it was neutral. In this parametric study, we aimed to simulate atmospheric scenarios that fell within a selected range of so that the simulations were more realistic and probabilistic. However, could not be directly given as input to the simulation. It can be seen from Equation (7) that depends mainly on the reference velocity () and the potential temperature difference between the air at the reference height and the wall (). Therefore, a realistic range of and was needed for which BASEL’s Gaussian kernel density estimation (kde), as shown in Figure 5, was used. The central 90th-percentile data were chosen as an appropriate range and the 5th-percentile data at both extremes were ignored since their occurrence was minimal.
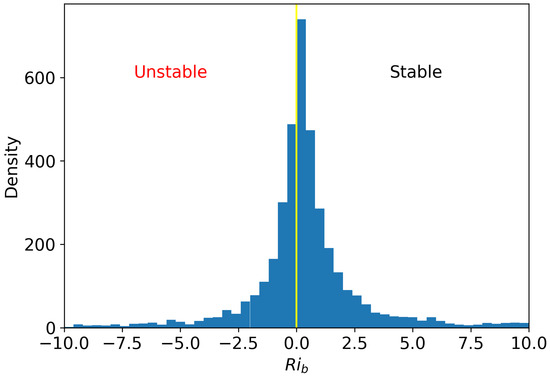
Figure 4.
Distribution of bulk Richardson number in BASEL.
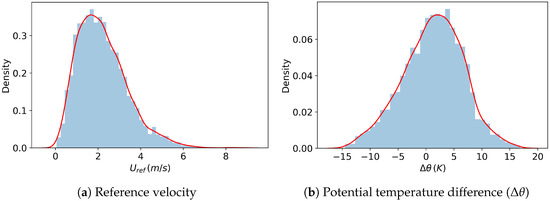
Figure 5.
Distribution of flow variables in Basel.
The selected range of the quantities for and are shown in Table 2; some of them fell slightly outside the 90th percentile range. Values chosen within this range were expected to be more realistic and probabilistic since the data were obtained from a real urban environment in Basel.

Table 2.
Range of and .
4.2. Choice of Simulation Parameters
From a study of the literature, it was concluded that the canyon aspect ratio (), stability condition characterized by the bulk Richardson number () and wind angle () were the significant factors that affected the mean wind profile and the effect of these parameters needed to be investigated in the study.
Wind angle (): Due to symmetries present in the simulation geometry, considering wind angles between 0 and 45 was sufficient to simulate all the wind angles. Longitudinal and lateral symmetry enabled the reproduction of any wind angle above 90° by an equivalent wind angle below 90. Further, the diagonal symmetry enabled the reproduction of any wind angle above 45 by an equivalent wind angle below 45. Therefore, the 4 wind angles 0, 15, 30 and 45 were chosen in this study.
Canyon aspect ratio (): The urban canyon can be generally classified into three categories based on the canyon aspect ratio . A regular canyon ( 1) as shown in Figure 6a, a narrow canyon ( 2) as shown in Figure 6b and a wide canyon ( 0.5) as shown in Figure 6c.

Figure 6.
Urban canyons.
Santiago and Martilli [50] used a range of values for and (0.11 to 0.44) for their study. Flow regimes were classified for symmetric building configurations based on the canyon aspect ratio () such as skimming flow for = 1 or 2 and wake interference flow for = 0.5 [19,51]. affects and similarly, affects . If A for a 0 wind angle, then for wind angle . The values of and for the 12 combinations of wind angles and canyon aspect ratios are shown in Table 3. It can be clearly seen that this covers a maximum range of and . Therefore, the values of 0.5, 1 and 2 were chosen in this parametric study.

Table 3.
Urban morphology parameters.
Bulk Richardson number (): The bulk Richardson number is a function of flow parameters such as and . The term which is the potential temperature difference between the wall and the ambient air at a reference height, is termed as hereafter. A small variation in does not affect the bulk Richardson number significantly and therefore it was kept constant ( K) for this study. Nakamura and Oke [52] measured wind and temperature in a real urban canyon and pointed out that the maximum temperature difference between air and walls lay between 12 C to 14 C. This also served as a starting point for the temperature difference between surface and the ambient air. The wind velocity and temperature difference were chosen in a systematic way from the selected range in Table 2. Allegrini et al. [34] simulated a flow involving a heat transfer in a 2D simulation domain with a single street cavity () for global Richardson numbers ranging from 0.14 to 13.7 in an unstable regime, which was used as a reference range in this study. Basel’s annual distribution of flow shows that and occur in pairs and therefore cannot be chosen independently. Hence, a multivariate probability distribution estimated using a kernel density estimation (kde) as shown in Figure 7 was used to choose the pair of and . These contour levels are the isocurves corresponding to the mass probability. The white region in the plot represents the bottom 5% of the probability mass. The remaining 95% of the probability mass is represented by the colored isolevels. The contours represent the mass probability within 5%, 25%, 50%, 75%, 90% and 100 % of the total mass. Twenty one combinations of and were sampled within the selected range in such a way that they were well distributed and covered all kinds of scenarios. This was also limited, keeping the computational cost in mind. It comprised ten unstable atmospheric scenarios, ten stable atmospheric scenarios and one neutral atmospheric scenario. The combinations and the probability of occurrence of these combinations within a year are tabulated in Table 4 and are also plotted in Figure 7. A full factorial sampling method was used to generate the design of experiments which resulted in a total of 252 simulations ().
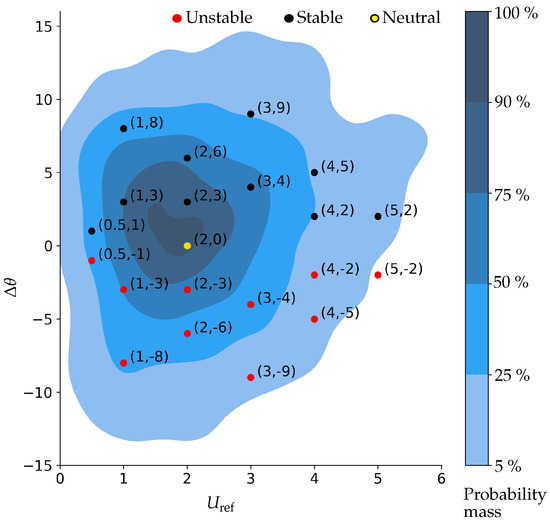
Figure 7.
Multivariate distribution of and .

Table 4.
Bulk Richardson number combinations.
4.3. Simulation Workflow and Postprocessing Automation
In order to avoid human errors while performing repetitive simulations, an automation approach was used. The whole simulation workflow was automated using the pyfoam utility to make the process simple, efficient and error-free. For each simulation, the flow fields were spatially averaged to obtain a horizontally averaged wind profile along the ground normal direction. Traditionally, OpenFOAM simulation postprocessing is done using Paraview software. However, executing a repetitive postprocessing action for 252 simulations can be exhausting. Hence, a python code was developed to automate the Paraview postprocessing operations in an efficient and error-free manner.
4.4. Spatial Averaging
The spatial averaging methodology and the different regions used for averaging in this study are discussed here. The velocity glyphs for one simulation case with a 45° inlet wind angle are shown in Figure 8. It can be seen that the flow near the first row of buildings was slightly different from that of the next rows. To avoid boundary effects that could strongly affect the average wind profile, the middle region of the urban layout was primarily used for averaging. The characteristic wind profiles were obtained with respect to the following regions shown in Figure 9 for this study. The urban in-canopy region was divided into volumes of 1 m from the ground up to a height of 25 m, and the flow fields of the corresponding volumes were averaged. The horizontally averaged velocity was obtained from mean velocity components in the x and y directions given as .
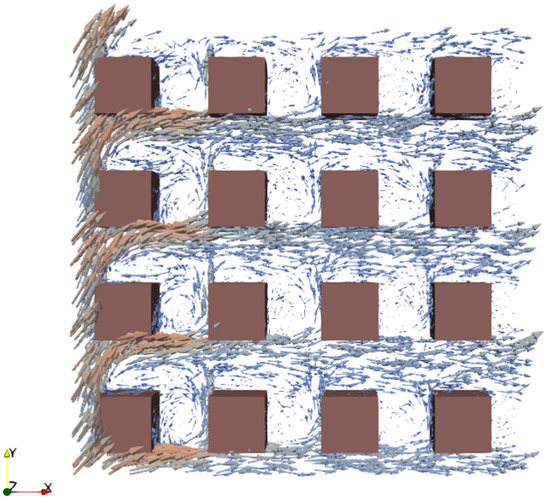
Figure 8.
Flow field for a 45° inlet wind simulation.

Figure 9.
Regions for spatial averaging.
4.5. Curve Fitting of Horizontally Averaged Profiles
As we recall from the literature review, the exponential nature of the in-canopy wind profile has been suggested by many researchers [6,7,8,10,13]. The main disadvantage of most of these models (except Harman and Finnigan’s model) is that they do not take the atmospheric stability into account when calculating the attenuation coefficient (a). We intended to verify these models with the horizontally averaged wind profiles obtained from CFD simulations in this study. For Awol’s model, an additional parameter () was specified which was defined as the aerodynamic roughness length scale in the absence of specific roughness elements. In addition to these models, analytical functions such as exponential, linear polynomial, quadratic polynomial and cubic polynomial functions were used to fit the mean wind profiles using python’s () module to determine which analytical function could be used to accurately characterize the nature of mean wind profiles. It was observed that a linear or a quadratic function could not adequately fit the complex velocity data. This was mainly due to the wide range of atmospheric and geometric simulation conditions used in this study. However, third-order polynomials were found to fit the data reasonably well. For one of the cases (case 13) with inputs and °, the exponential fit and cubic polynomial fit characterized by Equations (8) and (9) along with existing legacy schemes for the crossroad and spanwise regions are shown in Figure 10.
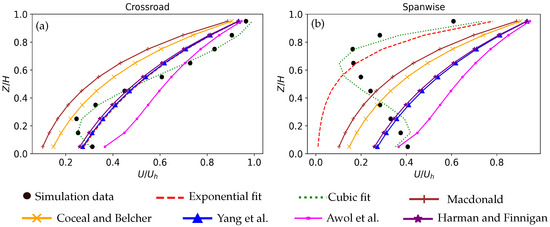
Figure 10.
Comparison of legacy schemes (Macdonald [6], Coceal and Belcher [7], Harman and Finnigan [8], Yang et al. [10], Awol et al. [13]) and curve fitting equations for case 13 in the crossroad (a) and spanwise (b) regions.
It should be noted that the mean wind profiles obtained from the CFD simulations were very different for different averaging regions. Legacy schemes lacked the capability to determine wind profiles for these specific regions, which was achieved in this study. The nature of wind profiles in specific regions of an urban canopy was characterized using surrogate models which was also a novelty in this study. The quantitative comparison for all four regions is tabulated in Table 5. It can be clearly seen that the cubic polynomials fit the flow profiles better than the exponential fit and the analytical models. Therefore, it was concluded that cubic polynomial functions were better approximations for the velocity and temperature profiles compared to exponential functions for specific regions in the urban canopy, a wide range of stability conditions and oblique wind angles. The main idea was to use the polynomial coefficients obtained using curve fitting to train the machine learning model for the given set of inputs. Like velocity, cubic polynomials were also used for temperature.

Table 5.
Velocity results for case 13—curve fitting and legacy schemes.
5. Surrogate Modeling
Machine learning is a field of study in which specialized algorithms are used to develop a data-driven model. The motivation behind building a surrogate model is to eliminate the repetitive CFD simulations in order to reduce computational effort and to make reliable predictions in the future. The main idea is to train machine learning algorithms with the simulation output data and build a reliable surrogate model. The ability of a model to learn the behavior of data depends on the model’s complexity. For a given data set, if the model is very simple, then it can lead to underfitting which is the inability of the model to fit the given data with sufficient accuracy. If the model is too complex, then it does not learn from the data but memorizes them, which leads to overfitting. Both cases are not ideal and should be avoided in order to achieve best performance. The optimum model performance is obtained when the model is not too complex and not too simple. In the current study, supervised machine learning algorithms were used to predict horizontally averaged wind and temperature profiles using reference wind speed (), potential temperature difference between wall and reference air (), wind angle () and canyon aspect ratio () as inputs. Here, two different machine learning models were used—linear regression (LR) and an artificial neural network.
5.1. Linear Regression
A linear regression model is one of the simplest regression models which maps the input variables to target variables using a linear function. In this study, a multioutput multiple linear regression was used. The weights and the bias were calculated by the regression model using the four inputs to predict the three outputs as shown in Figure 11. The main advantage of using a linear regression model is that the linear relationship can be deduced from the weights and bias.
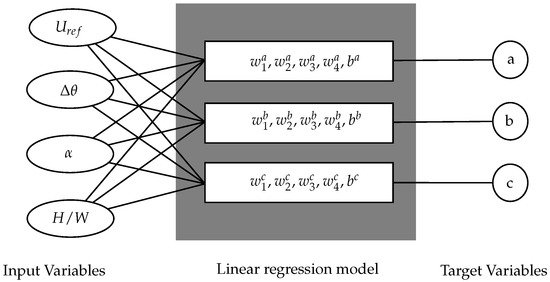
Figure 11.
Linear regression model architecture.
Since the inputs were user-defined, they were not correlated, which was also verified by a correlation heat map. As a general rule of thumb, the number of training examples should be at least 10 times higher than the number of independent variables to avoid overfitting. This criterion was largely satisfied in our study. As a rule of thumb, an 80–20% train–test data split was used, which randomly chose 80% of the whole dataset for training and the remaining 20% for testing. This ratio was also inspired from the Pareto principle. Data normalization was done to the input and target variables to convert them within a range of values between 0 and 1. All four averaging regions contained velocity and temperature data which were trained separately. From the predicted coefficients, the wind profiles could be constructed using the cubic polynomial equation according to Equation (9).
5.2. Artificial Neural Network
An artificial neural network consists of several nodes (or neurons) that are connected to each other. Each neuron takes an input signal, processes it using a nonlinear function (activation function) and delivers a signal to other neurons as an output. The complexity of the neural network depends mainly on the important hyperparameters such as learning rate, batch size, number of layers and number of neurons in the network. Like any other model, a neural network also suffers from overfitting when the network is more complex than necessary. Therefore, optimizing the hyperparameters is an important task when selecting the complexity of the model. This procedure is known as hyperparameter tuning and was performed in this study to find the best neural network design for each case. The number of layers was fixed as 2 based on the available training data, and the number of neurons in each layer was tuned for performance improvement. The search space for the neurons was [12, 16, 20, 24, 28, 32] in each layer which gave a total of 36 combinations. Thus, for each combination, the neural network was trained and the best model was selected based on its generalization performance. The test data needs to be kept unseen by the network and should not be used for early stopping or model selection. Therefore, a further split of the training dataset into 80–20% was done to create a validation dataset. It was used for evaluating the model’s generalization performance during the model selection. The test data were finally used for evaluating the best performance once the model selection was complete.
5.2.1. Cubic Polynomial Profile Prediction
The cubic polynomial parameters obtained from horizontally averaged wind and temperature profiles were used as input data to train a feed-forward ANN model. An illustration of the feed-forward neural network architecture used in this study is shown in Figure 12a. An early stopping regularization technique was used to avoid overfitting. The best model architectures were obtained for different averaging regions for both velocity and temperature using a hyperparameter optimization technique.
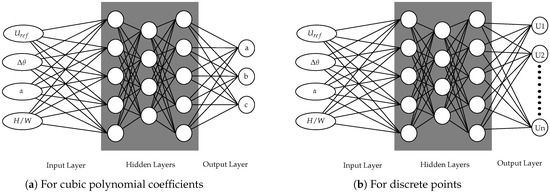
Figure 12.
ANN model architectures.
5.2.2. Discrete Points Profile Prediction
An ANN model was trained with simulation output points to directly predict the flow quantities within the urban canopy for a given input case. The only difference in the ANN training procedure was that the final layer of neurons was 10 simulation output data points instead of 3 cubic polynomial coefficients as shown in Figure 12b. The advantage here was the elimination of a 2-step training process in which there was an existing bias due to curve fitting. On the downside, only 10 points at regular height intervals were obtained as outputs and not a continuous flow profile. The best model architectures were obtained in a similar way to the previously mentioned hyperparameter optimization technique.
6. Results and Discussion
6.1. Linear Regression
For each region, the velocity and temperature model results on the test data are mentioned in Table 6.

Table 6.
Linear regression prediction results for velocity and temperature.
It is observed that the of the model reached a high of 0.73 in the velocity prediction and 0.67 in the temperature prediction. The error used for training and testing machine learning models was the mean absolute error (MAE). The training error for the velocity with linear regression models was 9.18% on an average for the four regions. The test error was also close to the training error at 9.39%. Similarly, for temperature, the training error was 9.46% while the test error was 9.49% on average for the four regions. The generalization error (Gen.) defined as the absolute difference between the training error and the test error was low (<1.4%). This implied that the model could generalize well but the performance was not great. This could be attributed to underfitting. It means that the linear model was incapable of accurately predicting the behavior of the data. The data consisted of a complex target function for which nonlinear models such as neural networks were required.
6.2. Cubic Polynomial Profile Prediction with ANN
The model performance for the velocity and temperature polynomial coefficient predictions with the best neural network architecture after hyperparameter tuning is shown in Table 7.

Table 7.
Cubic polynomial profile prediction with ANN for velocity and temperature.
For the ANN, the test error for the velocity was 5.70% and for the temperature it was 8.43%, which was better compared to those of the linear regression model. The generalization error was higher than that of the linear regression models, due to the model complexity. The average generalization error was 0.83% for the velocity and 2.70% for the temperature, which was within the acceptable range of accuracy. Clearly, neural networks performed better than the linear regression models in this scenario. The value for the ANN was higher and the MAE for the training and validation was lower than those of the linear regression. It was also observed that the hyperparameter tuning greatly improved the efficiency of the neural network. The predicted wind and temperature profiles by the neural networks and linear regression models for three randomly chosen stable and unstable atmospheric cases of a midcity region are shown in Figure 13 and Figure 14. The inputs of these cases are tabulated in Table 8.
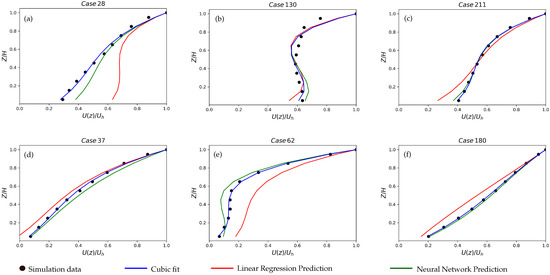
Figure 13.
Cubic polynomial velocity prediction: linear regression vs. ANN for unstable cases (a–c) and stable cases (d–f).
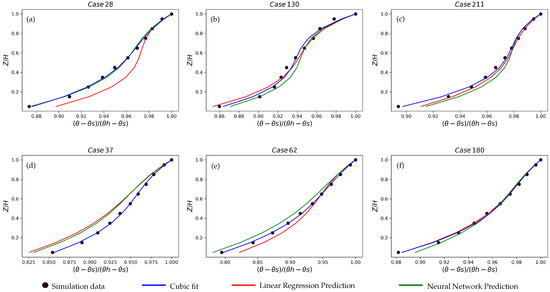
Figure 14.
Cubic polynomial temperature prediction: linear regression vs. ANN for unstable cases (a–c) and stable cases (d–f).

Table 8.
Simulation inputs for sample cases.
The results from the neural networks showed the deviation between the curve fitting polynomial coefficients and the predicted polynomial coefficients. As mentioned previously, it was a two-step learning process and hence the results did not represent the deviation from the actual simulation profile. The accuracy of the polynomial curve fitting significantly affected the learning process. This could be eliminated by using the discrete-point profile prediction.
6.3. Discrete-Point Profile Prediction with ANN
The model performance for velocity and temperature discrete-point predictions with the best neural network architecture after hyperparameter tuning is shown in Table 9. It is observed that the test error for the velocity was 4.75% on an average for the four regions and 6.09% for the temperature.

Table 9.
Velocity discrete points’ prediction with ANN.
The velocity and temperature discrete points’ predicted profiles for the same cases of a midcanyon region are shown in Figure 15 and Figure 16.
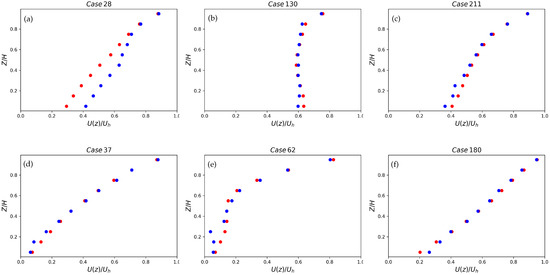
Figure 15.
Velocity discrete points’ prediction: simulation data vs. ANN for unstable cases (a–c) and stable cases (d–f).
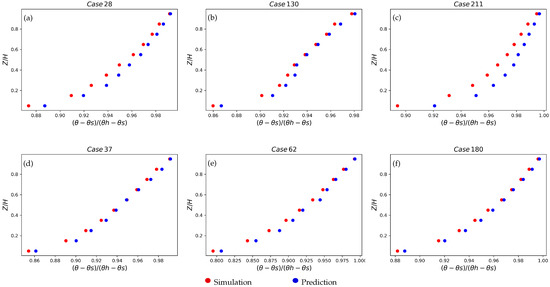
Figure 16.
Temperature discrete points’ prediction: simulation data vs. ANN for unstable cases (a–c) and stable cases (d–f).
6.4. Comparison of ANN Models with Legacy Schemes
The predicted results from ANN models (discrete points and cubic polynomial) were compared against previously discussed legacy models using simulation data. For all the models, the deviation of the model output from simulation data was calculated using the mean error and RMSE error measures for each simulation case. The average of these error measures over all the simulation cases is compared in Figure 17. The average error over all the domains for the discussed models is tabulated in Table 10. The simulation cases were divided based on the aspect ratio for the error analysis since most state-of-the-art schemes did not work well with dense canopies. Among the legacy models, for low-aspect-ratio cases () except for the spanwise region, Macdonald [6], Yang et al. [10] and Harman and Finnigan’s [8] models had a low mean error in comparison to the CFD results. For high-aspect-ratio cases () except for the spanwise region, the legacy schemes had higher errors. For all aspect ratios, among the legacy models, Harman and Finnigan’s [8] model performed best and that of Awol et al. [13] worst in the midcity region, Coceal and Belcher’s [7] model performed best and Macdonald’s [6] model worst in the crossroad region, Macdonald’s [6] model performed best and that of Awol et al. [13] worst in the spanwise region and the model of Yang et al. [10] performed best and Macdonald’s [6] model worst in the streamwise region based on mean error. In general, considering all aspect ratios and averaging regions, the ANN models obtained in this study performed significantly better in approximating the CFD results in comparison to the legacy models, since the mean error and RMSE of both cubic polynomial model and discrete-point model were very low. Furthermore, among the ANN models, the discrete-point prediction ANN model was clearly superior to the cubic polynomial prediction ANN model (the mean error was less than 0.016 m/s and the RMSE was less than 0.060 m/s) and was therefore designated as the best model.
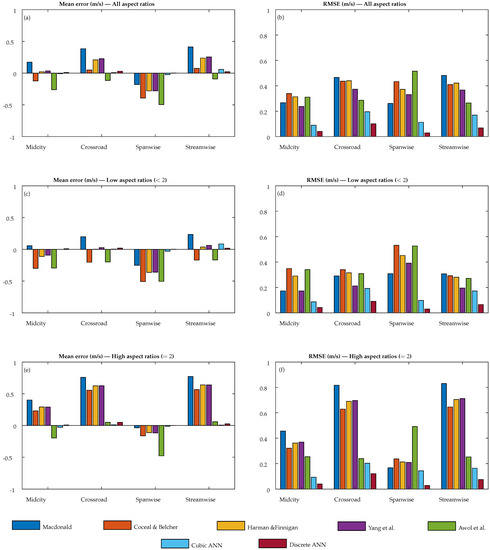
Figure 17.
Comparison of error measures between existing legacy models (Macdonald [6], Coceal and Belcher [7], Harman and Finnigan [8], Yang et al. [10], Awol et al. [13]) and ANN prediction models: Mean error (a,c,e) and RMSE (b,d,f).

Table 10.
Quantitative analysis of legacy models and ANN models from the current study.
7. Conclusions
The main focus of this study was to characterize the horizontally averaged wind and temperature profiles within the urban canopy using a data-driven approach. The fundamental idea was to create a surrogate model using machine learning techniques utilizing data from CFD simulation results.
A steady-state RANS model in OpenFOAM was used for the CFD simulations. The model was validated using Uehara’s wind-tunnel data, which helped to select the best simulation configuration. A standard k- model with standard wall functions was used in this case study. Previous literature studies and experiments showed that wind flow inside an urban canopy was mostly affected by the street canyon’s aspect ratio, wind angle and atmospheric stability. Thus, a case study was conducted for various simulation conditions using an idealized simulation geometry that consisted of a regular array of 4 × 4 cubes. The ranges of velocity and temperature input values for the simulation were obtained from Basel’s BUBBLE experiment data. These data provided the realistic atmospheric conditions of a European city for a period of about half a year. Overall, 252 simulations were carried out for different realistic urban atmospheric conditions. The velocity and temperature field data from the simulations were averaged in the horizontal direction to obtain a horizontally averaged wind profile along the vertical direction. CFD simulations and postprocessing operations were automated in order to increase the efficiency of the process.
The horizontally averaged vertical wind and temperature profiles inside the urban canopy were normalized to make them nondimensional. Several studies have suggested that the wind profile can be approximated by an exponential function. Therefore, fitting the simulation data with an exponential curve was tried at first. The exponential fit was not accurate enough. Hence, polynomial fits were tried, and third-order polynomials were found to be optimal. The wind and temperature profiles were fitted using cubic polynomials and the coefficients were saved for each simulation case. Discrete data points were also saved for each simulation case.
Each simulation had its own set of inputs for the reference wind speed, temperature difference between surface and air, wind angle and aspect ratio. Both cubic polynomial and discrete-point profiles were predicted using machine learning algorithms. Outputs were the three polynomial coefficients for the cubic profiles and the simulation output points for the discrete-point profiles. First, a linear regression model was used. The deviation between the actual and the predicted coefficients were around 9.39% for the velocity and 9.49% for the temperature on an average. Then, artificial neural network models were used with model architectures obtained using a hyperparameter optimization method. The deviation came down to 5.70% for the velocity and 8.43% for the temperature on average. It was observed that for the velocity, the ANN performed better than the linear regression. The complex nonlinear relationships due to the nonlinear activation functions in the ANN helped to build a better surrogate model compared to the linear regression. However, for the temperature data set, the linear regression model performance was comparable to that of the ANN. This might be due to the fact that data samples for training were not enough for the temperature. If more simulations results had been available, a much more accurate model could have been built with the help of the ANN. Then, ANN models trained directly using the simulation output data were used to predict the discrete data points. In this way, the error occurring due to the curve fitting of the profiles was eliminated. The test error for the velocity was 4.75% on average for the four regions and 6.09% for the temperature compared to the actual simulation results. For all the simulation cases, the velocity profiles obtained from the existing models were compared against the ANN models from the current study. It was observed that the ANN models (mainly the discrete-point prediction model) outperformed the legacy schemes. However, the downside was that the profile could be discontinuous, resulting in a nondifferentiable function.
The main conclusions are as follows:
- The horizontally averaged wind and temperature profiles inside the canopy are mainly affected by input parameters such as the street canyon’s aspect ratio, wind angle and atmospheric stability.
- The exponential approximation of the mean velocity profiles given by the legacy schemes provide reasonable results for large averaging regions (such as midcity regions), are based on simplifying assumptions and are mostly applicable for neutral atmospheric conditions except the Harman and Finnigan model [8]. However, cubic polynomials are more versatile and flexible to represent wind profiles at specific regions (midcity, crossroad, spanwise and streamwise regions) in the urban canopy for a wide range of atmospheric stability conditions and oblique wind angles.
- Machine learning models such as ANN and LR can be used for the prediction of horizontally averaged wind and temperature profiles inside the canopy. An ANN proved to be superior to an LR for this dataset and application.
- Cubic polynomial and discrete-point velocity and temperature profiles inside the urban canopy can be predicted for a specified input scenario using surrogate ANN models.
- The discrete-point prediction ANN model of this study outperforms the current state-of-the-art models in the prediction of horizontally averaged mean wind profile inside an urban canopy.
The novelty in this research lies in the study of the combined effect of the most important parameters using multiple CFD simulations and the development of surrogate models that cater the need of velocity and temperature profiles requirements for specific regions in an urban canopy.
This study can be extended further to obtain a data-driven model with a better accuracy. LES can be used instead of a RANS model, but the simulation time has to be taken into consideration. The influence of other factors such as the roughness length of the incoming wind profile, custom temperature inlet profile, different urban layouts (staggered arrangements) and variable building heights (instead of idealized cubes) can be included. Above-canopy profiles (within the RSL) can also be predicted in a similar manner. The effect of evapotranspiration due to the presence of vegetation in an urban canopy can be included in the parametric study to derive humidity profiles. Anthropogenic heat emissions from automobiles, indoor space air conditioning and industries, which also impact the urban microclimate, can be included. As part of future work, the models discussed in this study will be validated against real measurement data and an enhanced version shall be made available to the scientific community.
Author Contributions
Conceptualization, G.C. and A.A.; data curation, G.C.; formal analysis, G.C. and J.V.; funding acquisition, A.A.; investigation, G.C. and A.A.; methodology, G.C., A.A. and J.V.; project administration, A.A.; resources, A.A. and J.V.; software, G.C.; supervision, A.A. and J.V.; validation, G.C. and A.A.; visualization, G.C.; writing—original draft, G.C.; writing—review and editing, G.C., A.A. and J.V. All authors have read and agreed to the published version of the manuscript.
Funding
This research was supported by the Fraunhofer Internal Programs under grant no. Attract 003-695033.
Institutional Review Board Statement
Not applicable.
Informed Consent Statement
Not applicable.
Data Availability Statement
Not applicable.
Acknowledgments
We would also like to acknowledge the Swiss Ministry of Education and Science who funded the BUBBLE research project as well as the University of Basel, the Swiss Federal Institute of Technology (ETH) Zürich, the TU Dresden and the Bulgarian National Institute of Meteorology and Hydrology who all contributed to the BUBBLE data set which was used in this paper. The authors would like to thank Rüdiger Höffer and Cornelia Kalender of Ruhr University Bochum (RUB) for the supervision of the master thesis and taking interest in this research. A special thanks to Amir A. Aliabadi for his assistance and support in this research and Roland Vogt for providing the BUBBLE data for this study.
Conflicts of Interest
The authors declare no conflict of interest. The funders had no role in the design of the study; in the collection, analyses, or interpretation of data; in the writing of the manuscript, or in the decision to publish the results.
Abbreviations
The following abbreviations are used in this manuscript:
| ML | Machine learning |
| LR | Linear regression |
| ANN | Artificial neural network |
| CFD | Computational fluid dynamics |
| DNS | Direct numerical simulation |
| LES | Large-eddy simulations |
| RANS | Reynolds averaged Navier–Stokes |
| GCI | Grid convergence index |
| ISL | Inertial sublayer |
| RSL | Roughness sublayer |
| ABL | Atmospheric boundary layer |
| MOST | Monin–Obhukhov similarity theory |
| ME | Mean error |
| MAE | Mean absolute error |
| RMSE | Root-mean-square error |
| UCM | Urban canopy model |
| NWP | Numerical weather prediction |
| AR | Aspect ratio |
| BES | Building energy simulation |
| BUBBLE | Basel UrBan Boundary Layer Experiment |
| RNG | Renormalization group |
| SIMPLE | Semi-Implicit Method for Pressure Linked Equations |
| SVM | Support vector machines |
| MLP | Multilayer perceptron |
References
- Allegrini, J.; Dorer, V.; Carmeliet, J. Wind tunnel measurements of buoyant flows in street canyons. Build. Environ. 2013, 59, 315–326. [Google Scholar] [CrossRef]
- Cionco, R.M. A mathematical model for air flow in a vegetative canopy. J. Appl. Meteorol. Climatol. 1965, 4, 517–522. [Google Scholar] [CrossRef]
- Cionco, R.M. A wind-profile index for canopy flow. Bound. Layer Meteorol. 1972, 3, 255–263. [Google Scholar] [CrossRef]
- Raupach, M.R.; Finnigan, J.J.; Brunet, Y. Coherent eddies and turbulence in vegetation canopies: The mixing-layer analogy. In Boundary-Layer Meteorology 25th Anniversary Volume, 1970–1995; Springer: Dordrecht, The Netherlands, 1996; pp. 351–382. [Google Scholar]
- Finnigan, J. Turbulence in plant canopies. Annu. Rev. Fluid Mech. 2000, 32, 519–571. [Google Scholar] [CrossRef]
- Macdonald, R.W. Modelling the Mean Velocity Profile in the Urban Canopy Layer. Bound. Layer Meteorol. 2000, 97, 25–45. [Google Scholar] [CrossRef]
- Coceal, O.; Belcher, S. A canopy model of mean winds through urban areas. Q. J. R. Meteorol. Soc. 2004, 130, 1349–1372. [Google Scholar] [CrossRef]
- Harman, I.N.; Finnigan, J.J. A simple unified theory for flow in the canopy and roughness sublayer. Bound. Layer Meteorol. 2007, 123, 339–363. [Google Scholar] [CrossRef]
- Kono, T.; Tamura, T.; Ashie, Y. Numerical Investigations of Mean Winds within Canopies of Regularly Arrayed Cubical Buildings under Neutral Stability Conditions. Bound. Layer Meteorol. 2010, 134, 131–155. [Google Scholar] [CrossRef]
- Yang, X.I.A.; Sadique, J.; Mittal, R.; Meneveau, C. Exponential roughness layer and analytical model for turbulent boundary layer flow over rectangular-prism roughness elements. J. Fluid Mech. 2016, 789, 127–165. [Google Scholar] [CrossRef]
- Castro, I.P. Are Urban-Canopy Velocity Profiles Exponential? Bound. Layer Meteorol. 2017, 164, 337–351. [Google Scholar] [CrossRef]
- Theeuwes, N.E.; Ronda, R.J.; Harman, I.N.; Christen, A.; Grimmond, C.S.B. Parametrizing horizontally-averaged wind and temperature profiles in the urban roughness sublayer. Bound. Layer Meteorol. 2019, 173, 321–348. [Google Scholar] [CrossRef]
- Awol, A.; Bitsuamlak, G.; Tariku, F. A new analytical model for wind flow in canopies. J. Wind Eng. Ind. Aerodyn. 2022, 225, 105003. [Google Scholar] [CrossRef]
- Kim, J.J.; Baik, J.J. Urban street-canyon flows with bottom heating. Atmos. Environ. 2001, 35, 3395–3404. [Google Scholar] [CrossRef]
- Kim, J.J.; Baik, J.J. Effects of street-bottom and building-roof heating on flow in three-dimensional street canyons. Adv. Atmos. Sci. 2010, 27, 513–527. [Google Scholar] [CrossRef]
- Dimitrova, R.; Sini, J.F.; Richards, K.; Schatzmann, M.; Weeks, M.; García, E.P.; Borrego, C. Influence of Thermal Effects on the Wind Field within the Urban Environment. Bound. Layer Meteorol. 2009, 131, 223–243. [Google Scholar] [CrossRef]
- Santiago, J.L.; Krayenhoff, E.S.; Martilli, A. Flow simulations for simplified urban configurations with microscale distributions of surface thermal forcing. Urban Clim. 2014, 9, 115–133. [Google Scholar] [CrossRef]
- Kovar-Panskus, A.; Louka, P.; Sini, J.F.; Savory, E.; Czech, M.; Abdelqari, A.; Mestayer, P.; Toy, N. Influence of geometry on the mean flow within urban street canyons—A comparison of wind tunnel experiments and numerical simulations. Water Air Soil Pollut. Focus 2002, 2, 365–380. [Google Scholar] [CrossRef]
- Xie, X.; Liu, C.H.; Leung, D.Y. Impact of building facades and ground heating on wind flow and pollutant transport in street canyons. Atmos. Environ. 2007, 41, 9030–9049. [Google Scholar] [CrossRef]
- Memon, R.A.; Leung, D.Y.; Liu, C.H. Effects of building aspect ratio and wind speed on air temperatures in urban-like street canyons. Build. Environ. 2010, 45, 176–188. [Google Scholar] [CrossRef]
- Allegrini, J.; Dorer, V.; Carmeliet, J. Influence of morphologies on the microclimate in urban neighbourhoods. J. Wind Eng. Ind. Aerodyn. 2015, 144, 108–117. [Google Scholar] [CrossRef]
- Kim, J. A numerical study of the effects of ambient wind direction on flow and dispersion in urban street canyons using the RNG k ϵ turbulence model. Atmos. Environ. 2004, 38, 3039–3048. [Google Scholar] [CrossRef]
- Wang, B.; Cui, G. Large Eddy Simulation of Unstably Stratified Turbulent Flow over Urban-like Building Arrays. J. Appl. Math. 2013, 2013, 783187. [Google Scholar] [CrossRef]
- Uehara, K.; Murakami, S.; Oikawa, S.; Wakamatsu, S. Wind tunnel experiments on how thermal stratification affects flow in and above urban street canyons. Atmos. Environ. 2000, 34, 1553–1562. [Google Scholar] [CrossRef]
- Chen, G.; Rong, L.; Zhang, G. Numerical simulations on atmospheric stability conditions and urban airflow at five climate zones in China. Energy Built Environ. 2021, 2, 188–203. [Google Scholar] [CrossRef]
- Furtak-Cole, E.; Ngan, K. Predicting mean velocity profiles inside urban canyons. J. Wind Eng. Ind. Aerodyn. 2020, 207, 104280. [Google Scholar] [CrossRef]
- Wang, H.; Furtak-Cole, E.; Ngan, K. Estimating Mean Wind Profiles Inside Realistic Urban Canopies. Atmosphere 2022, 14, 50. [Google Scholar] [CrossRef]
- García-Gutiérrez, A.; Domínguez, D.; López, D.; Gonzalo, J. Atmospheric boundary layer wind profile estimation using neural networks applied to lidar measurements. Sensors 2021, 21, 3659. [Google Scholar] [CrossRef]
- Türkan, Y.S.; Aydoğmuş, H.Y.; Erdal, H. The prediction of the wind speed at different heights by machine learning methods. Int. J. Optim. Control Theor. Appl. IJOCTA 2016, 6, 179–187. [Google Scholar] [CrossRef]
- Ding, C.; Lam, K.P. Data-driven model for cross ventilation potential in high-density cities based on coupled CFD simulation and machine learning. Build. Environ. 2019, 165, 106394. [Google Scholar] [CrossRef]
- Weller, H.G.; Tabor, G.; Jasak, H.; Fureby, C. A tensorial approach to computational continuum mechanics using object-oriented techniques. Comput. Phys. 1998, 12, 620–631. [Google Scholar] [CrossRef]
- Blocken, B. Computational Fluid Dynamics for urban physics: Importance, scales, possibilities, limitations and ten tips and tricks towards accurate and reliable simulations. Build. Environ. 2015, 91, 219–245. [Google Scholar] [CrossRef]
- Franke, J.; Hellsten, A.; Schlünzen, K.; Carissimo, B. Best practice guideline for the CFD simulation of flows in the urban environment-a summary. In Proceedings of the 11th Conference on Harmonisation within Atmospheric Dispersion Modelling for Regulatory Purposes, Cambridge, UK, 2–5 July 2007; Cambridge Environmental Research Consultants: Cambridge, UK, 2007. [Google Scholar]
- Allegrini, J.; Dorer, V.; Defraeye, T.; Carmeliet, J. An adaptive temperature wall function for mixed convective flows at exterior surfaces of buildings in street canyons. Build. Environ. 2012, 49, 55–66. [Google Scholar] [CrossRef]
- Yang, Y.; Gu, M.; Chen, S.; Jin, X. New inflow boundary conditions for modelling the neutral equilibrium atmospheric boundary layer in computational wind engineering. J. Wind Eng. Ind. Aerodyn. 2009, 97, 88–95. [Google Scholar] [CrossRef]
- Hargreaves, D.M.; Wright, N.G. On the use of the k-ϵ model in commercial CFD software to model the neutral atmospheric boundary layer. J. Wind Eng. Ind. Aerodyn. 2007, 95, 355–369. [Google Scholar] [CrossRef]
- Richards, P.J.; Hoxey, R.P. Appropriate boundary conditions for computational wind engineering models using the k-ϵ turbulence model. In Computational Wind Engineering 1; Elsevier: Amsterdam, The Netherlands, 1993; pp. 145–153. [Google Scholar] [CrossRef]
- VDI 3783; Umweltmeteorologie—Physical Modelling of Flow and Dispersion Processes in the Atmospheric Boundary Layer Application of Wind Tunnels. VDI Verein Deutcher Ingenieure: Düsseldorf, Germany, 2000.
- van Hooff, T.; Blocken, B.; van Harten, M. 3D CFD simulations of wind flow and wind-driven rain shelter in sports stadia: Influence of stadium geometry. Build. Environ. 2011, 46, 22–37. [Google Scholar] [CrossRef]
- Schetz, J.A.; Bowersox, R.D. Boundary Layer Analysis; American Institute of Aeronautics and Astronautics: Reston, VA, USA, 2011. [Google Scholar]
- Van Driest, E.R. On turbulent flow near a wall. J. Aeronaut. Sci. 1956, 23, 1007–1011. [Google Scholar] [CrossRef]
- Richards, K.; Schatzmann, M.; Leitl, B. Wind tunnel experiments modelling the thermal effects within the vicinity of a single block building with leeward wall heating. J. Wind Eng. Ind. Aerodyn. 2006, 94, 621–636. [Google Scholar] [CrossRef]
- Kovar-Panskus, A.; Moulinneuf, L.; Savory, E.; Abdelqari, A.; Sini, J.F.; Rosant, J.M.; Robins, A.; Toy, N. A wind tunnel investigation of the influence of solar-induced wall-heating on the flow regime within a simulated urban street canyon. Water Air Soil Pollut. Focus 2002, 2, 555–571. [Google Scholar] [CrossRef]
- Snyder, W.H. Similarity criteria for the application of fluid models to the study of air pollution meteorology. Bound. Layer Meteorol. 1972, 3, 113–134. [Google Scholar] [CrossRef]
- Chockalingam, G.; Afshari, A.; Vogel, J. Characterization of In-Canopy Wind Profile Using CFD Simulations—A Data-Driven Approach. Master’s Thesis, Ruhr University Bochum, Bochum, Germany, 2022. (Available upon request). [Google Scholar]
- Xie, X.; Liu, C.H.; Leung, D.Y.; Leung, M.K. Characteristics of air exchange in a street canyon with ground heating. Atmos. Environ. 2006, 40, 6396–6409. [Google Scholar] [CrossRef]
- Roache, P.J. Quantification of uncertainty in computational fluid dynamics. Annu. Rev. Fluid Mech. 1997, 29, 123–160. [Google Scholar] [CrossRef]
- Rotach, M.; Vogt, R.; Bernhofer, C.; Batchvarova, E.; Christen, A.; Clappier, A.; Feddersen, B.; Gryning, S.E.; Martucci, G.; Mayer, H.; et al. BUBBLE—An urban boundary layer meteorology project. Theor. Appl. Climatol. 2005, 81, 231–261. [Google Scholar] [CrossRef]
- Afshari, A.; Ramirez, N. Improving the accuracy of simplified urban canopy models for arid regions using site-specific prior information. Urban Clim. 2021, 35, 100722. [Google Scholar] [CrossRef]
- Santiago, J.; Martilli, A. A dynamic urban canopy parameterization for mesoscale models based on computational fluid dynamics Reynolds-averaged Navier–Stokes microscale simulations. Bound. Layer Meteorol. 2010, 137, 417–439. [Google Scholar] [CrossRef]
- Sini, J.F.; Anquetin, S.; Mestayer, P.G. Pollutant dispersion and thermal effects in urban street canyons. Atmos. Environ. 1996, 30, 2659–2677. [Google Scholar] [CrossRef]
- Nakamura, Y.; Oke, T. Wind, temperature and stability conditions in an east-west oriented urban canyon. Atmos. Environ. 1988, 22, 2691–2700. [Google Scholar] [CrossRef]
Disclaimer/Publisher’s Note: The statements, opinions and data contained in all publications are solely those of the individual author(s) and contributor(s) and not of MDPI and/or the editor(s). MDPI and/or the editor(s) disclaim responsibility for any injury to people or property resulting from any ideas, methods, instructions or products referred to in the content. |
© 2023 by the authors. Licensee MDPI, Basel, Switzerland. This article is an open access article distributed under the terms and conditions of the Creative Commons Attribution (CC BY) license (https://creativecommons.org/licenses/by/4.0/).