Article

Analysis of the Impact of Meteorological Factors on Ambient Air Quality during the COVID-19 Lockdown in Jilin City in 2022

1
College of New Energy and Environment, Jilin University, Changchun 130012, China
2
Key Laboratory of Groundwater Resources and Environment, Ministry of Education, Jilin University, Changchun 130012, China
3
Jilin Province Key Laboratory of Water Resources and Environment, Jilin University, Changchun 130012, China
4
China Coal Technology & Engineering Group Shenyang Engineering Company, Shenyang 113122, China
*
Author to whom correspondence should be addressed.
Atmosphere 2023, 14(2), 400; https://doi.org/10.3390/atmos14020400
Submission received: 30 January 2023 / Revised: 13 February 2023 / Accepted: 16 February 2023 / Published: 18 February 2023
(This article belongs to the Section Air Quality)

Abstract

:
This paper explored the changes of six significant pollutants (PM2.5, PM10, SO2, NO2, O3, and CO) in Jilin City during the coronavirus disease 2019 (COVID-19) epidemic in 2022, and compared them with the same period of previous years to analyze the impact of anthropogenic emissions on the concentration of pollutants; The Weather Research and Forecasting Community Multiscale Air Quality (WRF–CMAQ) model was used to evaluate the effect of meteorological factors on pollutant concentration. The results showed that except for O3, the concentrations of the other five pollutants decreased significantly, with a range of 21–47%, during the lockdown period caused by the government’s shutdown and travel restrictions. Compared with the same period in 2021, the decrease of PM2.5 was only 25% of PM10. That was because there was still a large amount of PM2.5 produced by coal-fired heating during the blockade period, which made the decrease of PM2.5 more minor. A heavy pollution event caused by adverse meteorological conditions was found during the lockdown period, indicating that only controlling artificial emissions cannot eliminate the occurrence of severe pollution events. The WRF–CMAQ results showed that the lower pollutant concentration in 2022 was not only caused by the reduction of anthropogenic emissions but also related to the influence of favorable meteorological factors (higher planetary boundary layer thickness, higher wind speed, and higher temperature).

1. Introduction

Air pollution has been a global concern for many years due to its negative impacts on human health, the environment, and the economy. In March 2022, novel coronavirus pneumonia suddenly broke out in Jilin City. To curb the spread of the virus, the local government took a series of control measures to stop the spread of the epidemic, including suspension of work, classes, and businesses and restrictions on Residents’ travel [1]. Strict control measures have played a significant role in preventing the further spread of the virus and have presented a unique opportunity to study the impact of control measures on air quality. Still, at the same time, they have also caused a considerable effect on the social economy [2].
During the blocked period, these control measures allowed for observation of air pollutions with minimum anthropogenic emissions background. This allowed for a more accurate assessment of the impact of human activities on air pollution and a better understanding of the sources and mechanisms of air pollution. Additionally, studying air pollution during the epidemic provides valuable insights into the effectiveness of control measures and the potential for reducing air pollution in the future. Therefore, many scholars have studied the change in atmospheric pollutant concentration during the epidemic and found that the concentration of most pollutants showed a downward trend [3,4,5]. For example, Bao et al. [6] looked at the pollutant concentration in 44 cities in northern China from the beginning of 2020 to March 2021. They found that SO2 decreased by 6.76%, PM2.5 decreased by 5.9%, PM10 decreased by 14%, NO2 decreased by 25%, and CO decreased by 4.6% during the study period. Sulaymon et al. [7] pointed out that the concentration of NO2, PM2.5, PM10, and CO in Wuhan city decreased by 51%, 41%, 33%, and 17%, respectively, during the lockdown compared with that before the lockdown of COVID-19 in 2020. Wang et al. [8] found that reducing anthropogenic emissions during the blockade would decrease PM2.5 concentration. However, severe pollution events caused by adverse meteorological conditions still exist. Le et al. [5] pointed out that pollutant emissions decreased by 90% during the epidemic blockade, but adverse meteorological conditions still led to haze pollution in some areas. It is interesting to note that in Rudke et al.’s [9] study on the impact of mobility restriction policies during the 2020 COVID-19 outbreak on regional air quality in Brazil, they found that these restrictions had a significant impact on the concentrations of CO, NO2, PM10, and PM2.5 pollutants, especially during the first 30 days of the restriction implementation.
On the other hand, some scholars also pointed out that meteorological conditions can improve air quality. For example, Matthias et al. [10] pointed out when studying the role of emission reduction and meteorology in improving air quality during the COVID-19 blockade period between China and Europe that NO2 concentration decreased most significantly during the blockade period. That is not only because of the blockade but also because of meteorological conditions. Fu et al. [11] studied the O3 pollution in Guangxi during the epidemic blockade. They found that the emission reduction and meteorological factors caused by the epidemic simultaneously reduced the concentration of pollutants. Danek et al. [12] conducted a study on air pollution migration during COVID-19 lockdown in Krakow, Poland and concluded that the highest concentration of PM10 is associated with high pressure systems, low temperatures, and high humidity, with pressure playing the dominant role. These observations are in the line with Weglisnka et al.’s [13] study about air pollution in the same area. Furthermore, they also arrived at the conclusion that terrain plays a crucial role in the generation and migration of pollutants. Hence, studying different cities and regions globally is highly necessary.
To sum up, we can find that the concentration of pollutants in most regions decreased during the epidemic period, while meteorological factors played different roles in different areas. Despite these findings, there is still a lack of studies on the changes in pollutant concentration in Northeast China during the epidemic period. This makes the study of air quality in Jilin City during the lockdown of the COVID-19 epidemic particularly important. Therefore, this paper took Jilin City as an example to explore the changes in six significant pollutants (PM2.5, PM10, SO2, NO2, O3, CO) during the epidemic. To analyze the impact of pollutant reduction caused by control measures on ambient air quality, we compared them with the concentrations of contaminants in the same period in previous years. At the same time, the WRF–CMAQ model was used to simulate the air quality of Jilin City during the lockdown of the COVID-19 epidemic and explore the impact of changes in meteorological conditions on the ambient air quality. By doing so, this study aims to contribute to the development of effective policies and strategies for improving air quality and protecting public health in Jilin City and other areas facing similar challenges.

2. Data Source and Method

In this study, the workflow involved the following steps: collecting and processing pollutant data, comparing the concentration changes of six pollutants during different years in the same period after dividing the control period, then comparing the daily average concentration changes and hourly variation trends of the six pollutants during different control periods in 2022, followed by evaluating the simulation performance of WRF and CMAQ models, and finally analyzing the impact of meteorological factors on pollutant concentration after obtaining favorable simulation results.

2.1. Overview of the Study Area

Jilin City is located in the northeast of China, between 42°31′ and 44°40′ north latitude and 125°40′ and 127°56′ east longitude, covering an area of 27,120 square kilometers. Jilin, known as the “Chemical City”, was once a critical national industrial base and the birthplace of China’s chemical industry. It has abundant natural resources and a favorable geography. The major industrial activities in Jilin City, such as chemical industry, machinery manufacturing, electronic information, iron and steel metallurgy, and more, have contributed to the city’s economic development, but have also led to significant air pollution. In recent years, the government has implemented various measures to reduce air pollution, including stricter emission controls and increased use of clean energy. By 2021, the city achieved a GDP of 155 billion CNY, of which the added value of the primary sector was 20 billion CNY; the added value of the secondary industry was 57 billion CNY; the added value of the tertiary sector was 78 billion CNY, and the total registered resident population of the city was 4 million [14], which makes Jilin City one of the major cities in Northeast China. The terrain of Jilin City gradually decreases from southeast to northwest. The climate belongs to the continental monsoon climate of the north temperate zone. The four seasons are distinct. The atmosphere is dry in spring, hot and rainy in summer, cool in autumn, and cold and long in winter. Due to the terrain, the temperature in the northwest is slightly higher than in the southeast. The temperature in January is the lowest, with an average temperature of −16 °C. The temperature in July is the highest, with an average temperature of 24 °C. See Figure S1 for a digital terrain map of Jilin City.

2.2. Data Source

This paper collected hourly concentration data of six conventional pollutants (SO2, NO2, PM2.5, PM10, CO, O3) from 1 February to 31 May 2017, to 2022, a total of six years. The data came from the Ministry of Ecology and Environment National Urban Air Quality Real-time Publishing Platform (http://106.37.208.233:20035/ (accessed on 5 July 2022)). The meteorological observation data for 2017 and 2022 were from China Meteorological Data Service Center (http://data.cma.cn (accessed on 5 July 2022)). There are seven automatic atmospheric monitoring stations in Jilin City, namely Hadawan (HDW), Dongjuzi (DJZ), Dianlixueyuan (DLXY), Jiangbei (JB), Jiangnan Park (JNGY), Fengman (FM), and Jiuzhan (JZ). The meteorological station used in this study was Huadian Station. See Table S1 for specific information about each station and Figure S2 for location. The Huadian weather station was selected for meteorological observations and research based on various factors, including geographical location, avoiding interference, data requirements, and equipment maintenance. Although the height difference between the station and the study area may impact weather observations due to changes in atmospheric layer and weather factors with height, the meteorological data from the station still accurately represents the study area as the distance is not far and its monitoring range covers the study area.
To study the pollutants changes in each stage of the epidemic in Jilin City in 2022, we divided the study period into five stages according to the epidemic development stage and the control measures change. On 2 March 2022, the first confirmed case of COVID-19 was found in Jilin City. Through tracing the source of the flow survey, it was found that the transmission chain had been secretly transmitted in the community. Since 4 March, Jilin City has implemented closure management. The control measures include suspension of work and production in all government agencies, enterprises and institutions in the city. Online classes are conducted in kindergartens and schools of all levels. All types of operating venues have temporarily suspended operations. In general, residents in the urban areas are allowed to assign one family member per household per day to go out to purchase daily necessities, while other family members are not allowed to go out except for participation in epidemic prevention and control, medical treatment in case of illness, and urgent work needs. On 14 March, there were 2601 confirmed cases of COVID-19 in Jilin City on a single day. The Jilin provincial government requested to start the first level response of emergency command. To reduce the spillover and spread of the epidemic caused by the cross-restricted and cross-regional flow, Jilin Province issued a notice prohibiting the cross-local and cross-regional flow of personnel in the province. On 8 April, Jilin City achieved the goal of zeroing the social sphere. On 28 April, the production and living order in the urban area of Jilin City was restored orderly. On 12 May, Jilin City was fully unsealed, and the government fully opened all bus lines. Therefore, according to the development degree of the epidemic and the different stages of epidemic prevention and control, we divide the research period into five stages: Level 1 before containment (1 February, 3 March); Lockdown period Level 2 (4 March, 27 April); Orderly recovery period Level 3 (28 April, 11 May); The extended-release period is Level 4 (12 May to 31 May) and the strictest release period is Level 2-intense (14 March to 8 April).

2.3. WRF–CMAQ Model

The WRF–CMAQ is an environmental model that combines weather forecasting and air quality simulation capabilities. The model consists of two main components: the WRF model and the CMAQ model. The WRF model is a highly customizable weather forecasting model that can be used for weather forecasting on a small to large scale and can be combined with other models. The CMAQ model is an air quality simulation model that can be used to evaluate the sources of pollutants in the atmosphere and their transportation, as well as their impact on environmental health and ecosystems. By combining the WRF and CMAQ, the WRF–CMAQ model provides accurate and comprehensive weather and air quality predictions and can be used for a variety of environmental research fields, such as climate change, air quality management, and ecosystem research. Version 5.3.2 of the CMAQ model driven by version v4.1.2 of the WRF model was used in this study.
This study used the Weather Research and Forecasting Model with Chemistry (WRF–Chem) model to simulate meteorological conditions. This model was widely used in mesoscale numerical simulation [15,16]. The initial meteorological boundary conditions of the model were generated from the reanalysis data of the National Environmental Prediction Center of the United States. The resolution of these data was 1° × 1°, and the time resolution was 6 h. The model domain was nested in three layers. Domain1 included three provinces in Northeast China, with a resolution of 27 km × 27 km, Domain2 had Jilin Province, with a resolution of 9 km × 9 km, Domain3 covered Jilin City, with a resolution of 3 km × 3 km, and the model simulation domain is shown in Figure 1.
The emission inventory used the resolution of 0.25° × 0.25° issued by Tsinghua University “China Multiresolution Emission Inventory” [17,18] (MEIC, http://meicmodel.org/ (accessed on 11 March 2022)). The anthropogenic emissions were divided into five types: agricultural sources, residential sources, power sources, transportation sources and industrial sources. Pollutants included SO2, NO2, PM2.5, PM10, VOC, CO and NH3. The emission inventory data was distributed using ISAT.M tools, and the pollution source list obtained was input into the Community Multiscale Air Quality (CMAQ) model for numerical simulation. Comparing the pollutant concentrations under different meteorological fields in 2017 and 2022, we analyzed the impact of meteorological changes on air pollution in Jilin City. CMAQ simulation time was the strictest blockade period, Level 2-intense (14 March–8 April 2022). At the same time, a numerical simulation was carried out for the same period in 2017, and we compared the simulation results of the two. To eliminate the influence of initial conditions, we conducted WRF simulation 5 days in advance.

3. Results and Discussion

3.1. Comparison of Pollutant Concentrations in Different Years at the Same Period

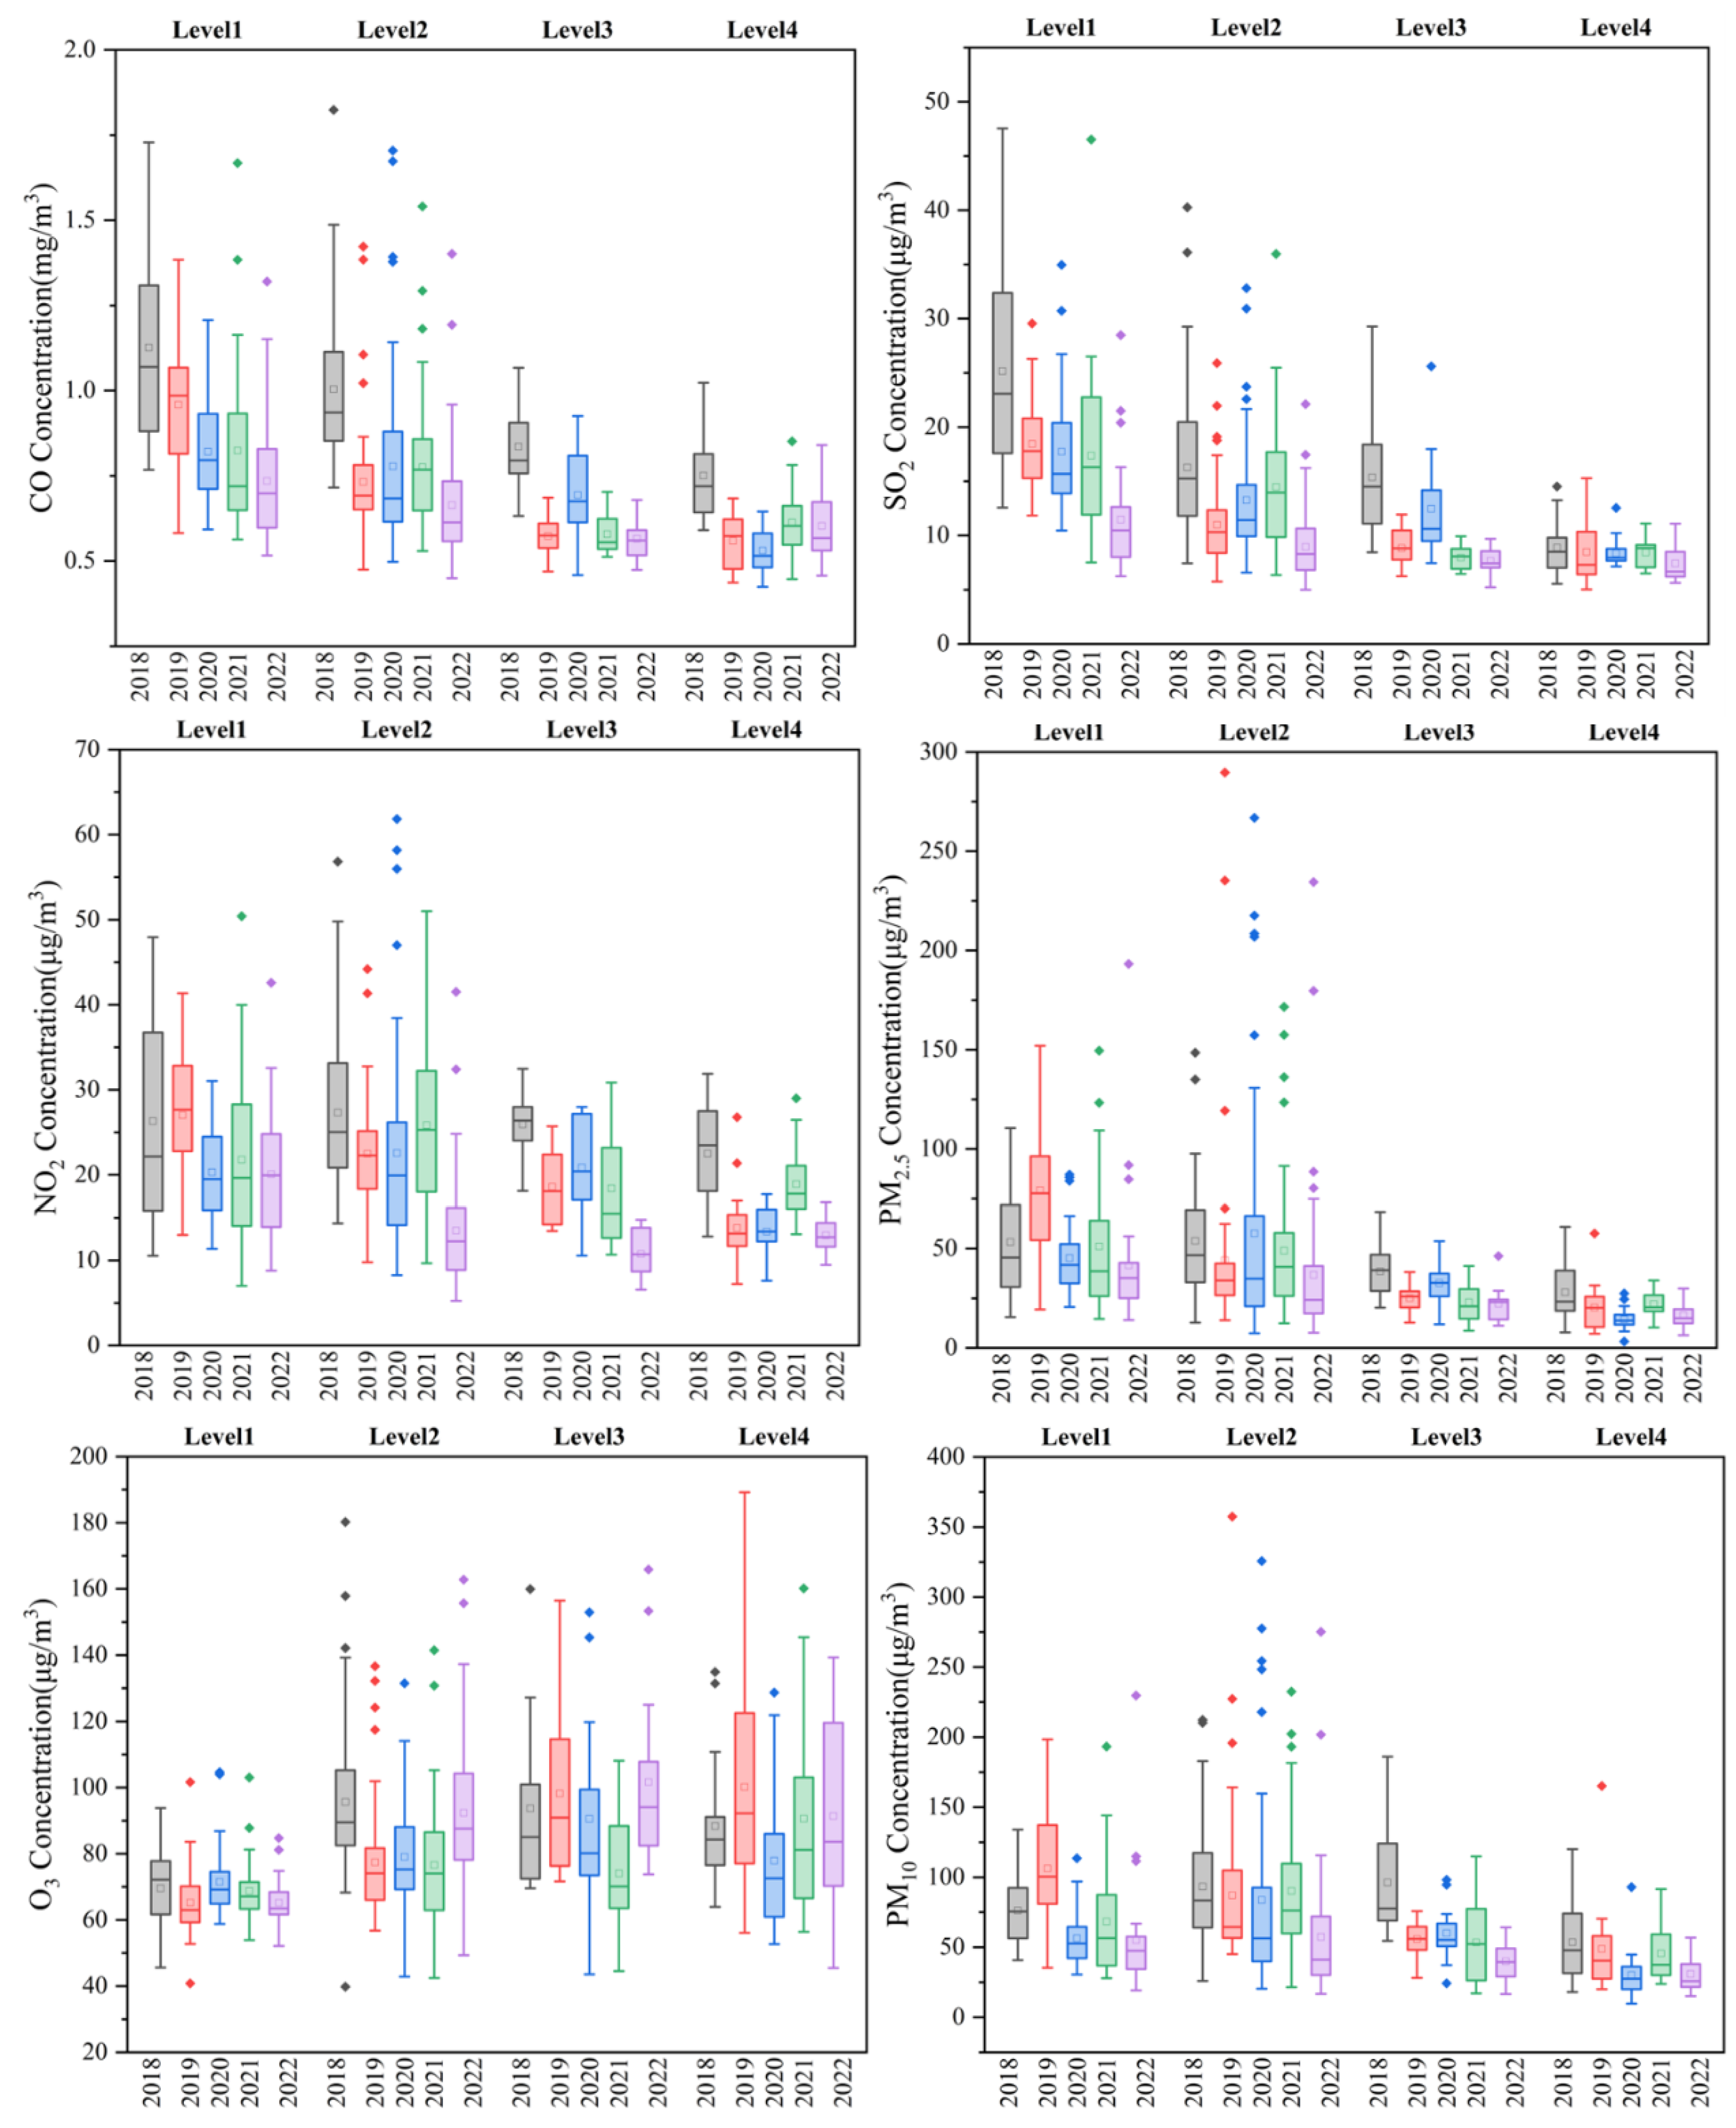
Figure 2 shows the box chart of daily average concentrations of six pollutants in Level 1 (1 February–3 March), Level 2 (4 March–27 April), Level 3 (28 April–11 May) and Level 4 (12 May–31 May) before the closure period from 2018 to 2022. In general, except for O3, the concentrations of the other five pollutants in 2022 reduced to varying degrees compared with the same period in 2021. CO concentration during Level 2 in 2022 decreased by 11% and 10%, respectively, compared with the same period in 2021 and 2020, and decreased by 30.8% compared with the same period in 2018. The concentration of NO2 during Level 2 in 2022 compared to the same period in the previous four years showed a decrease range of 22–44%. The reason for such a massive decline in NO2 was that the blockade directly limited the scope of people’s activities and forbade citizens to drive on the road, reducing automobile exhaust emissions. The vehicle exhaust generated by people’s travel was the primary source of NO2 [19,20], so NO2 concentration decreased significantly during the blockade period. The same situation had occurred with SO2 concentration, as similar to NO2, vehicular exhaust is also one of the main sources of SO2, thus restriction on travel had resulted in a decrease in SO2 concentration.
The concentration of PM10 during Level 2 in 2022 decreased by 27%, 5.1%, 24% and 24%, respectively, compared with the same period in 2021, 2020, 2019 and 2018. In 2021, the output value of the construction industry in Jilin city was 10.71 billion CNY, an increase of 11% over the previous year. A significant source of PM10 in Jilin city was construction dust [21]. It could be seen that the shutdown of the epidemic in 2022 led to a sharp drop in PM10 emissions, but the concentration was not much different from that in 2020. The reason was that there was also a lockdown period of COVID-19 in Jilin City in 2020. During the Level 2 period in 2020, Jilin City was in the period of secondary response and tertiary response, and the government did not fully restore the production order. Therefore, the blockade shutdown due to the epidemic situation has led to the reduction of fugitive dust from construction buildings and the apparent decrease of PM10 concentration. The PM2.5 Level 2 period in 2022 was only 6.6% lower than that in 2021, which was only 25% of the reduction of PM10 in the same period. That was because the research area is in the north of China, and the Level 2 period was still in the central heating period in the north of China. A large amount of PM2.5 emissions was caused by coal combustion, resulting in a PM2.5 decrease not as evident as other pollutants. In contrast to the other five pollutants, the concentration of O3 Level 2 increased by 26%, 23% and 24%, respectively, over the previous years. The consumption of O3 near the ground was mainly completed by titration reaction [22,23]. The blockade period restricted people’s travel, and the reduction of automobile exhaust emissions led to the decline of NO, which weakens the titration reaction. Therefore, O3 had a significant increase in the Level 2 period. To sum up, the epidemic blockade reduced human activities, building dust, and traffic flow, all of which significantly reduced pollutants.

3.2. Daily Average Concentration Change

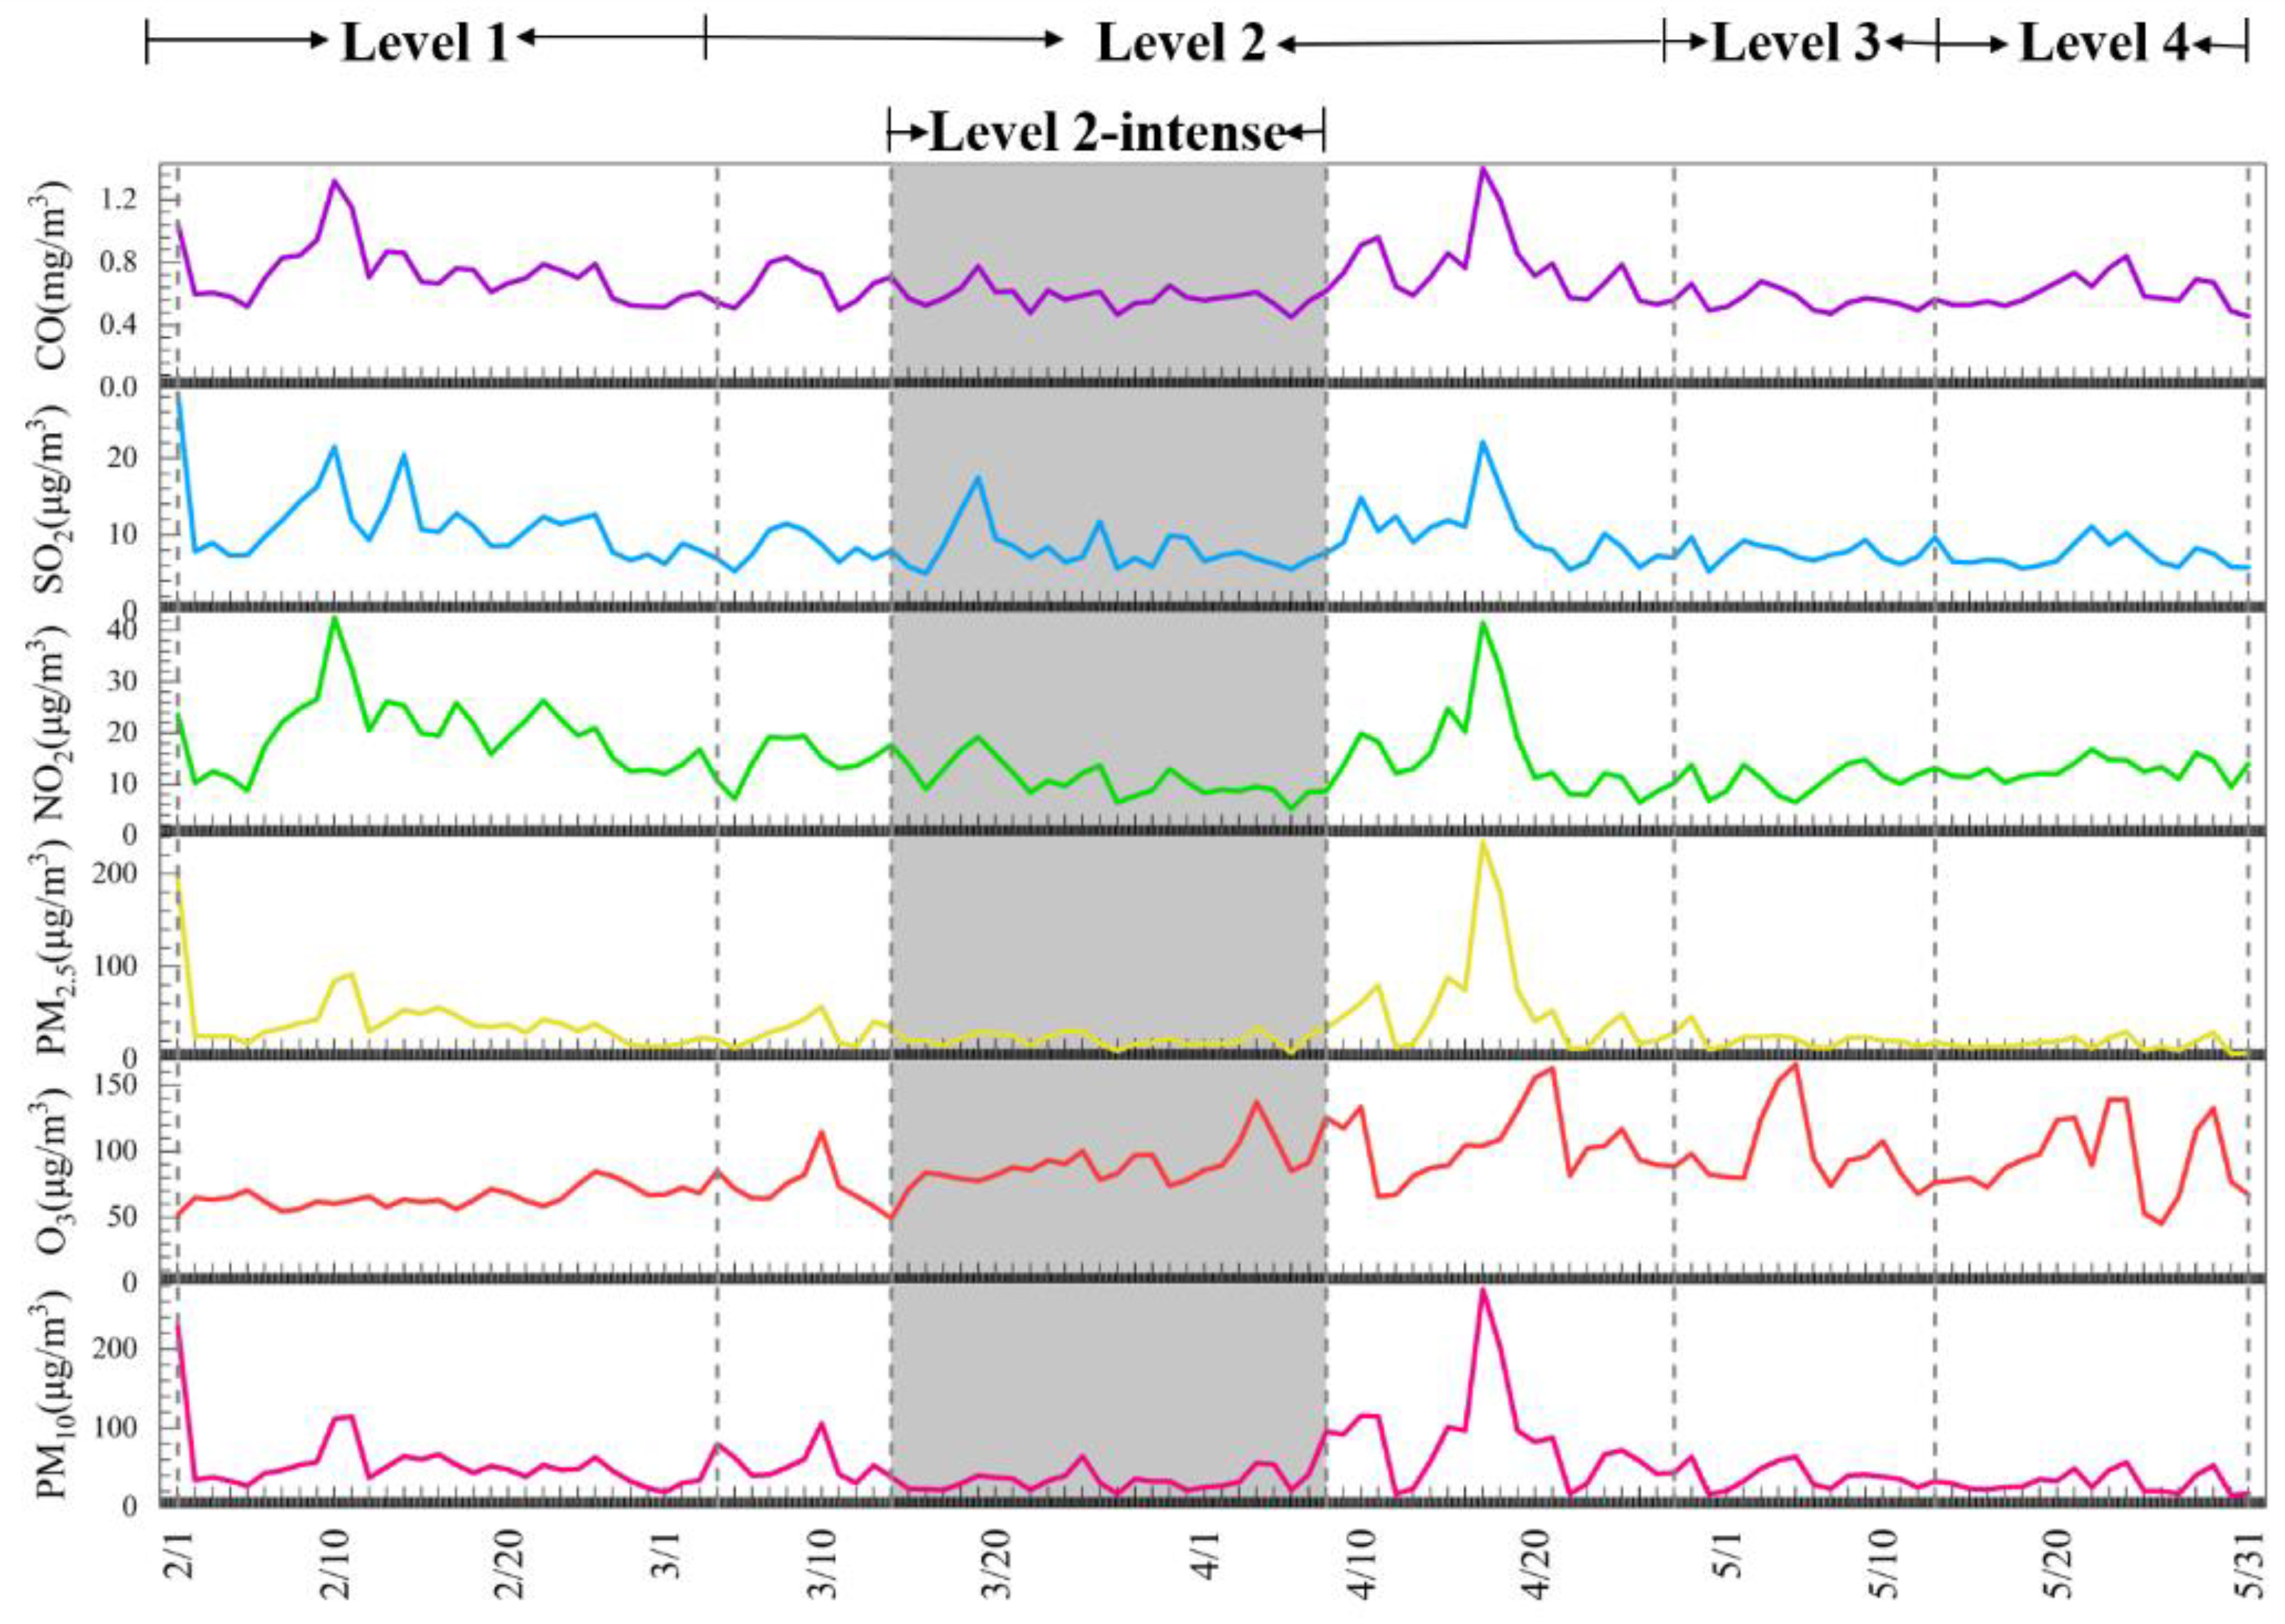
Figure 3 shows six pollutants’ daily average concentration changes in five study periods in 2022. The figure shows that, except for O3, the other five pollutants have decreased in varying degrees during the Level 2-intense period. Among them, the average concentration of NO2 during Level 1 was 20 μg/m3, and the average concentration at drop in vehicle exhaust emissions and a rapid decline in NO2 concentration. The average Level 2-intense was 11 μg/m3, only 55% of the Level 1 period. That was due to the strict restriction on residents’ travel and the prohibition of private cars on the road during the Level 2-intense period, resulting in a sharp concentration of SO2 in the Level 1 period was 11.4 μg/m3, and the average concentration at Level 2-intense was 8.1 μg/m3, decreased by 29%. The average concentration of PM2.5 during Level 1 was 42 μg/m3, and the average concentration at Level 2-intense was 22 μg/m3, which is only 53% of the Level 1 period, with a decrease of nearly half. The average concentration of PM10 during Level 1 was 55 μg/m3; the average concentration at Level 2-intense was 31 μg/m3, which decreased by 44% compared with Level 1. That was due to the restriction of human activities during the Level 2-intense period and the shutdown of factories and construction sites, resulting in reduced particulate matter emissions.
At the same time, we found an interesting phenomenon in the figure. If only artificial emissions were considered, the pollutant concentration in the whole blockade period (Level 2) should be lower than in other periods. However, during Level 2, a heavy pollution event occurred from 16 April to 18 April. We observed the meteorological data from 16 April to 18 April and found that the average air pressure when heavy pollution weather occurred was 1014.8 hPa. The moderate air pressure from 19 April to 21 April was 1004.6 hPa; the average wind speed was 2.5 m/s from 16 April to 18 April and 4.3 m/s from 19 April to 21 April. These observations are in the line with Danek et al.’s [12] study about air pollution migration in Poland. They pointed out that during the cold season high pressure is related to anticyclone circulation of very dry and cold air masses. During the night temperature drops significantly and during the day temperature increase. This situation leads to temperature inversion between cooler ground and warmer atmosphere. When the air pressure is high, and the wind force is small, the atmospheric mass moves downward, causing adverse effects on the dilution of pollutants. Therefore, it was the high air pressure and low wind speed that together caused this heavy pollution event. We can see from this that it is impossible to eliminate serious pollution events only by controlling artificial emissions because the atmosphere has the function of dilution and diffusion of pollutants, and meteorological factors are also crucial factors affecting the concentration of contaminants.

3.3. Hourly Variation Trend of Pollutants in Different Control Periods

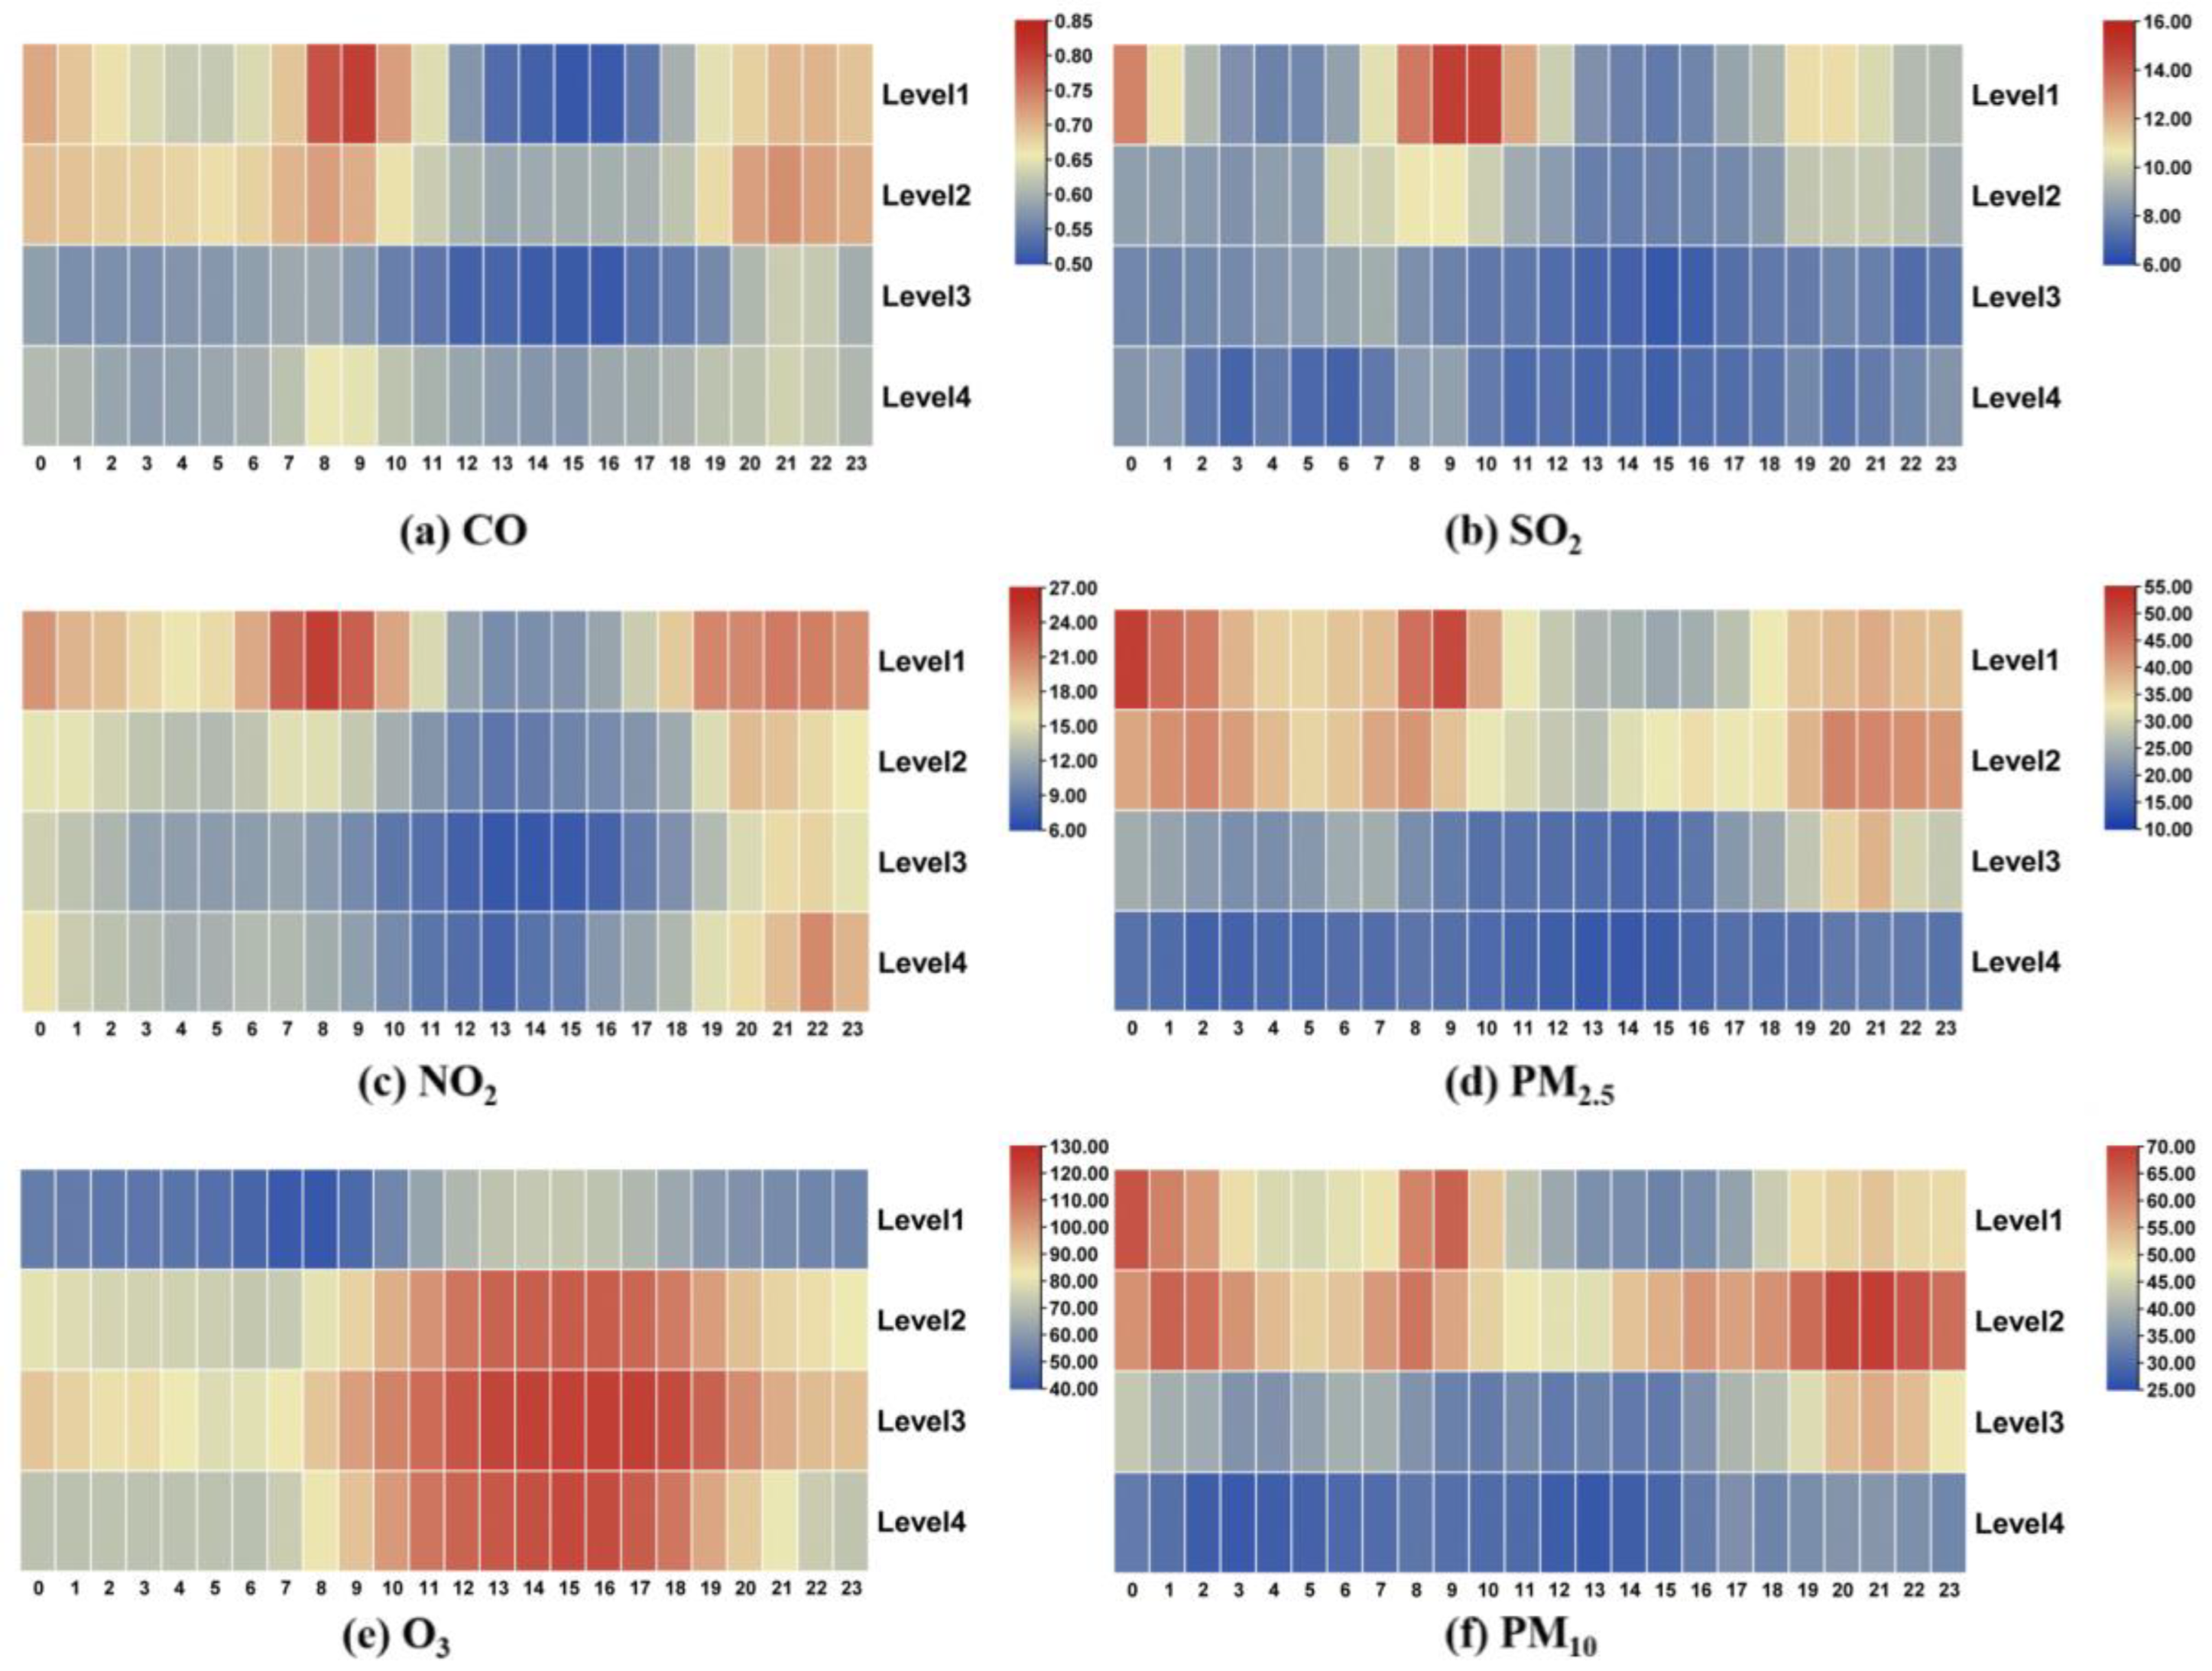
Figure 4 shows the hourly concentration change trend of six pollutants in four control periods. There were two peaks of NO2 in the Level 1 period, 7:00–9:00 and 19:00–21:00, which correspond to the morning and evening peaks. That indicated that motor vehicle exhaust was the primary source of NO2. During the Level 2 period, the government shut down classes, restricted residents’ travel, and the peak of NO2 pollution disappeared. This phenomenon indicated that motor vehicle exhaust was an essential source of NO2, and we can control NO2 pollution by restricting travel or improving motor vehicle fuel standards. The change trends of SO2, PM2.5, and PM10 were similar. The pollution was the lightest in the Level 4 period, and the pollutant concentration from Level 1 to Level 4 decreased gradually. Due to the restriction of human activities in the Level 2 period, SO2 and particulate pollution were partly reduced. However, the Level 2 period was still in the heating period in northern China, with SO2 and particulate pollution from coal combustion, so the reduction of pollutant concentration was not significant. In Level 3 and Level 4, the heating period ended, the temperature rose, the atmospheric turbulence was strengthened, and the meteorological conditions changed to favor the dilution of pollutants. Even if human activities increase in this period, the changes in meteorological conditions also lead to further reduction of pollutant concentrations. The concentration of O3 gradually rises from Level 1 to Level 4, and the peak appears at 13:00–16:00, the highest temperature. That was because the formation of O3 requires a photochemical reaction. With the increase in temperature, the solar radiation was enhanced, and the photochemical reaction was accelerated to increase the concentration of O3.

3.4. WRF Model Simulation Effect Evaluation

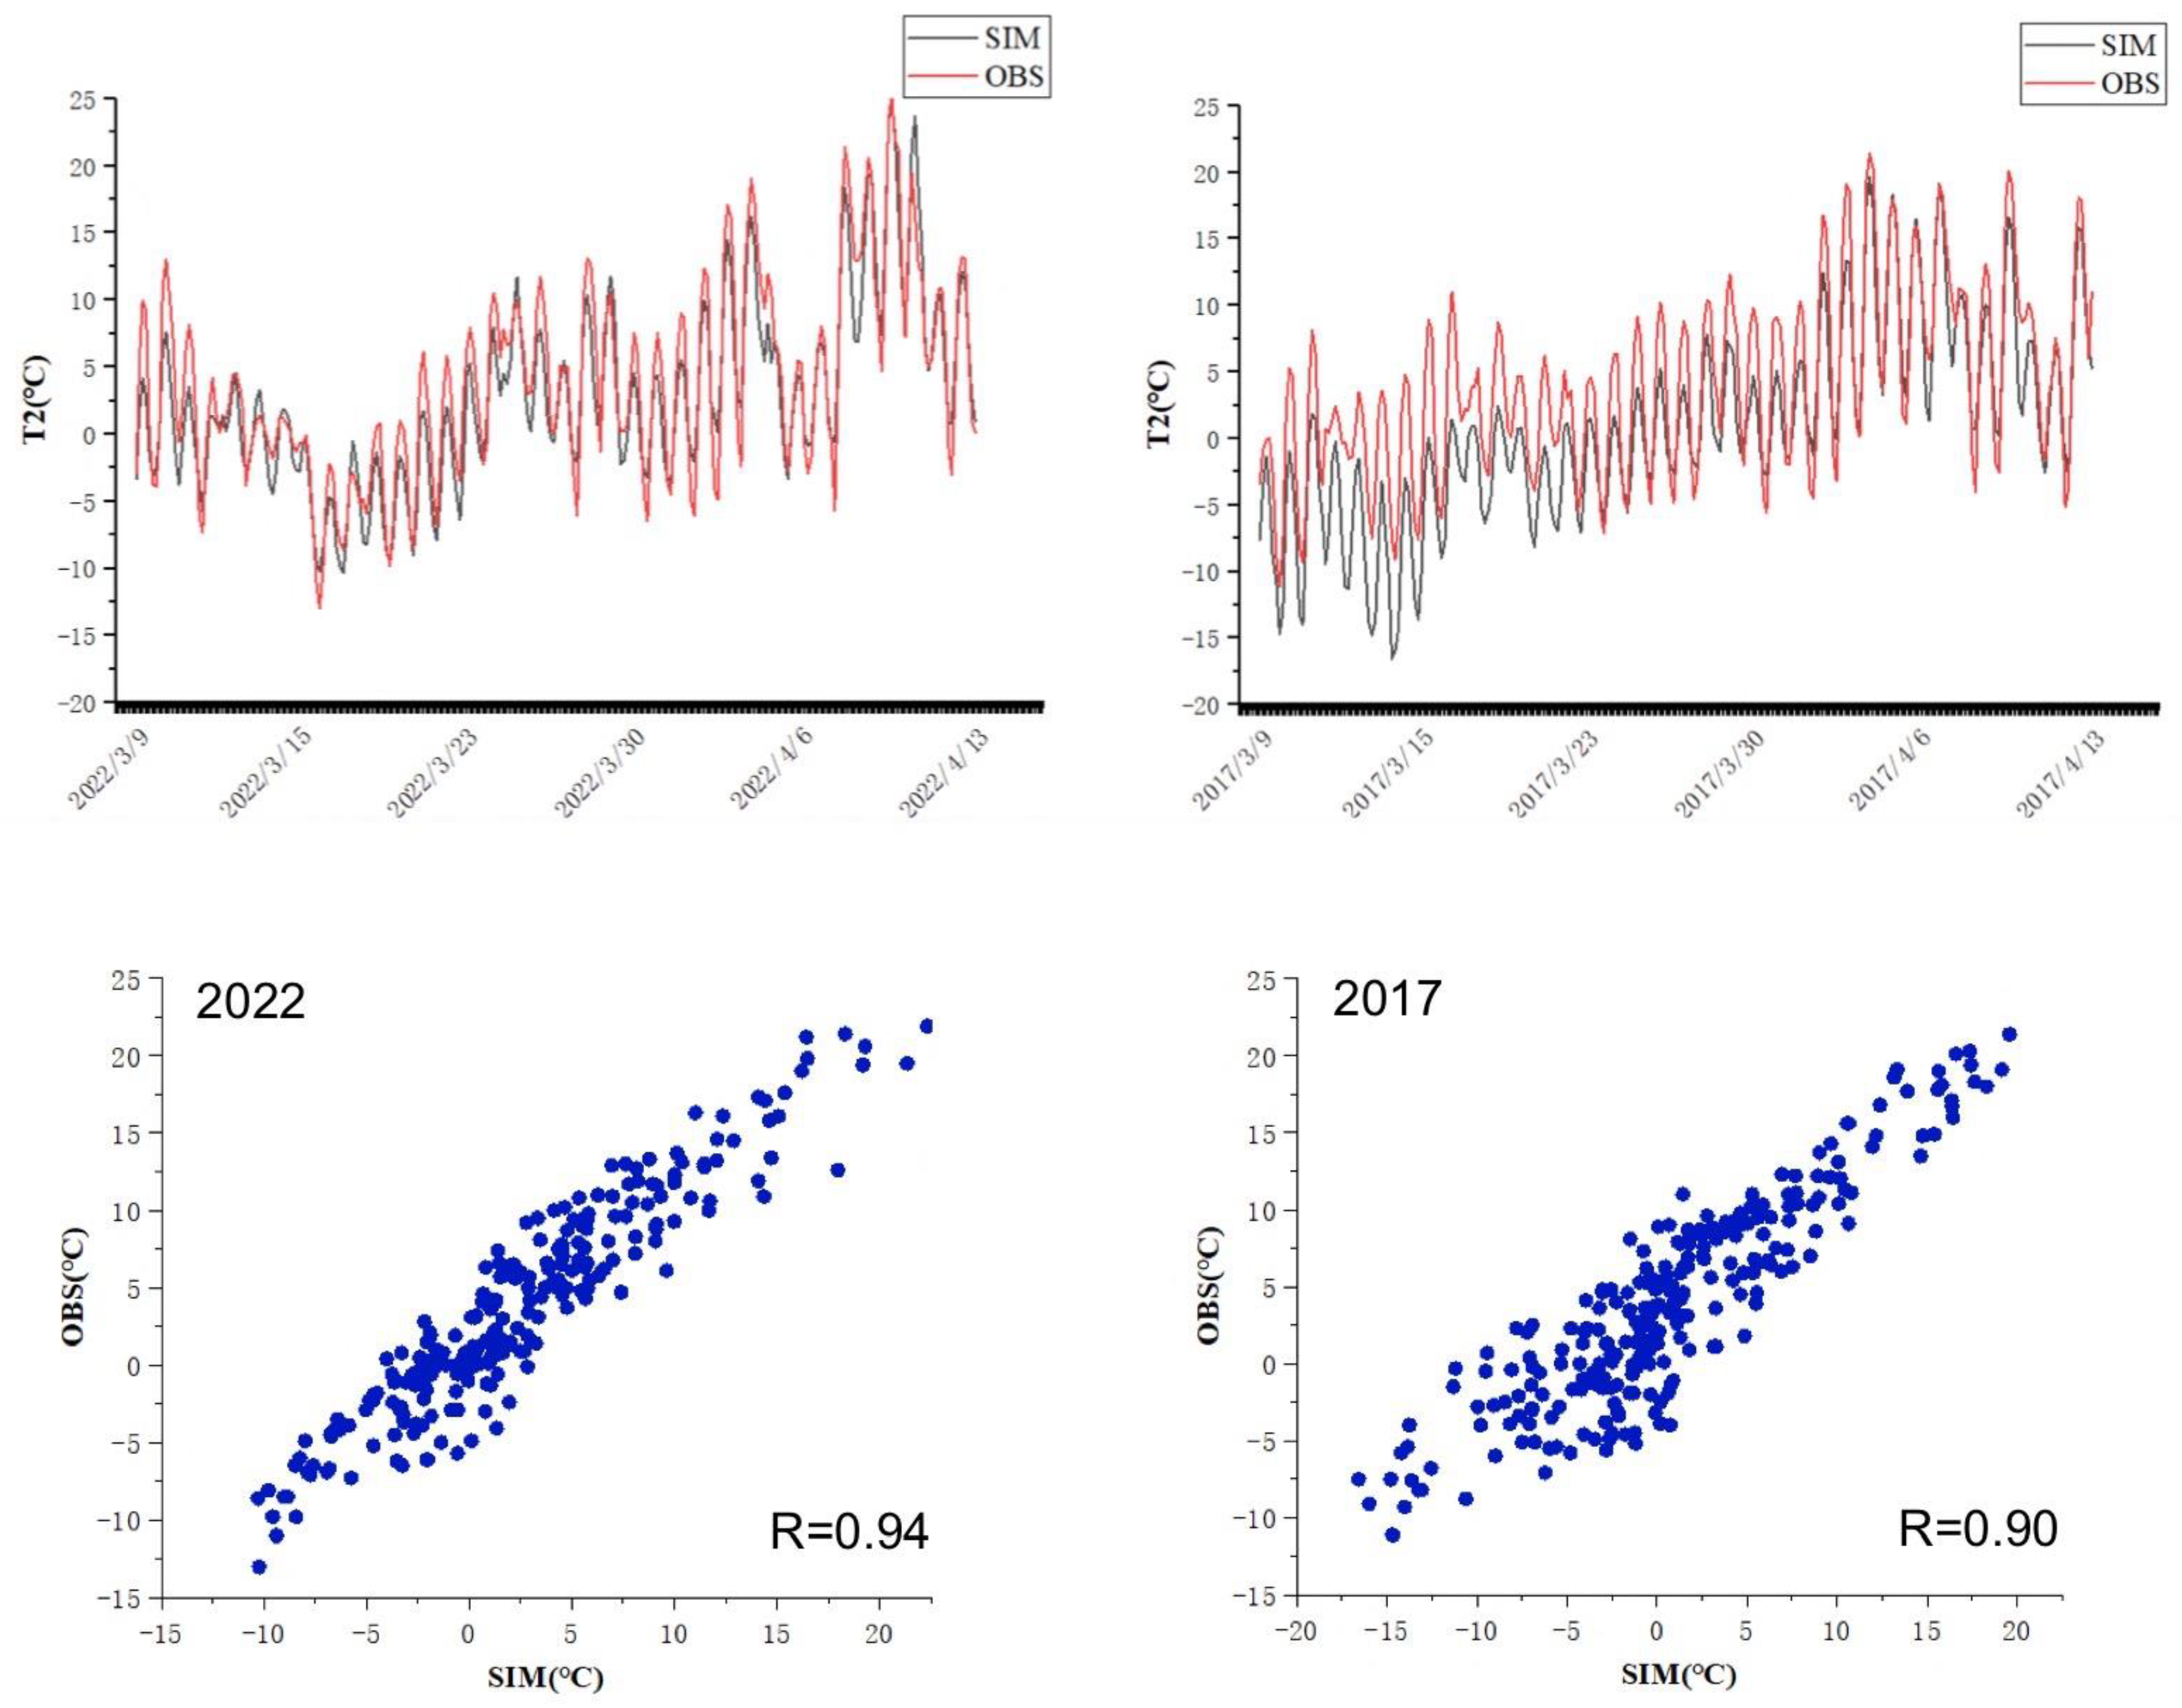
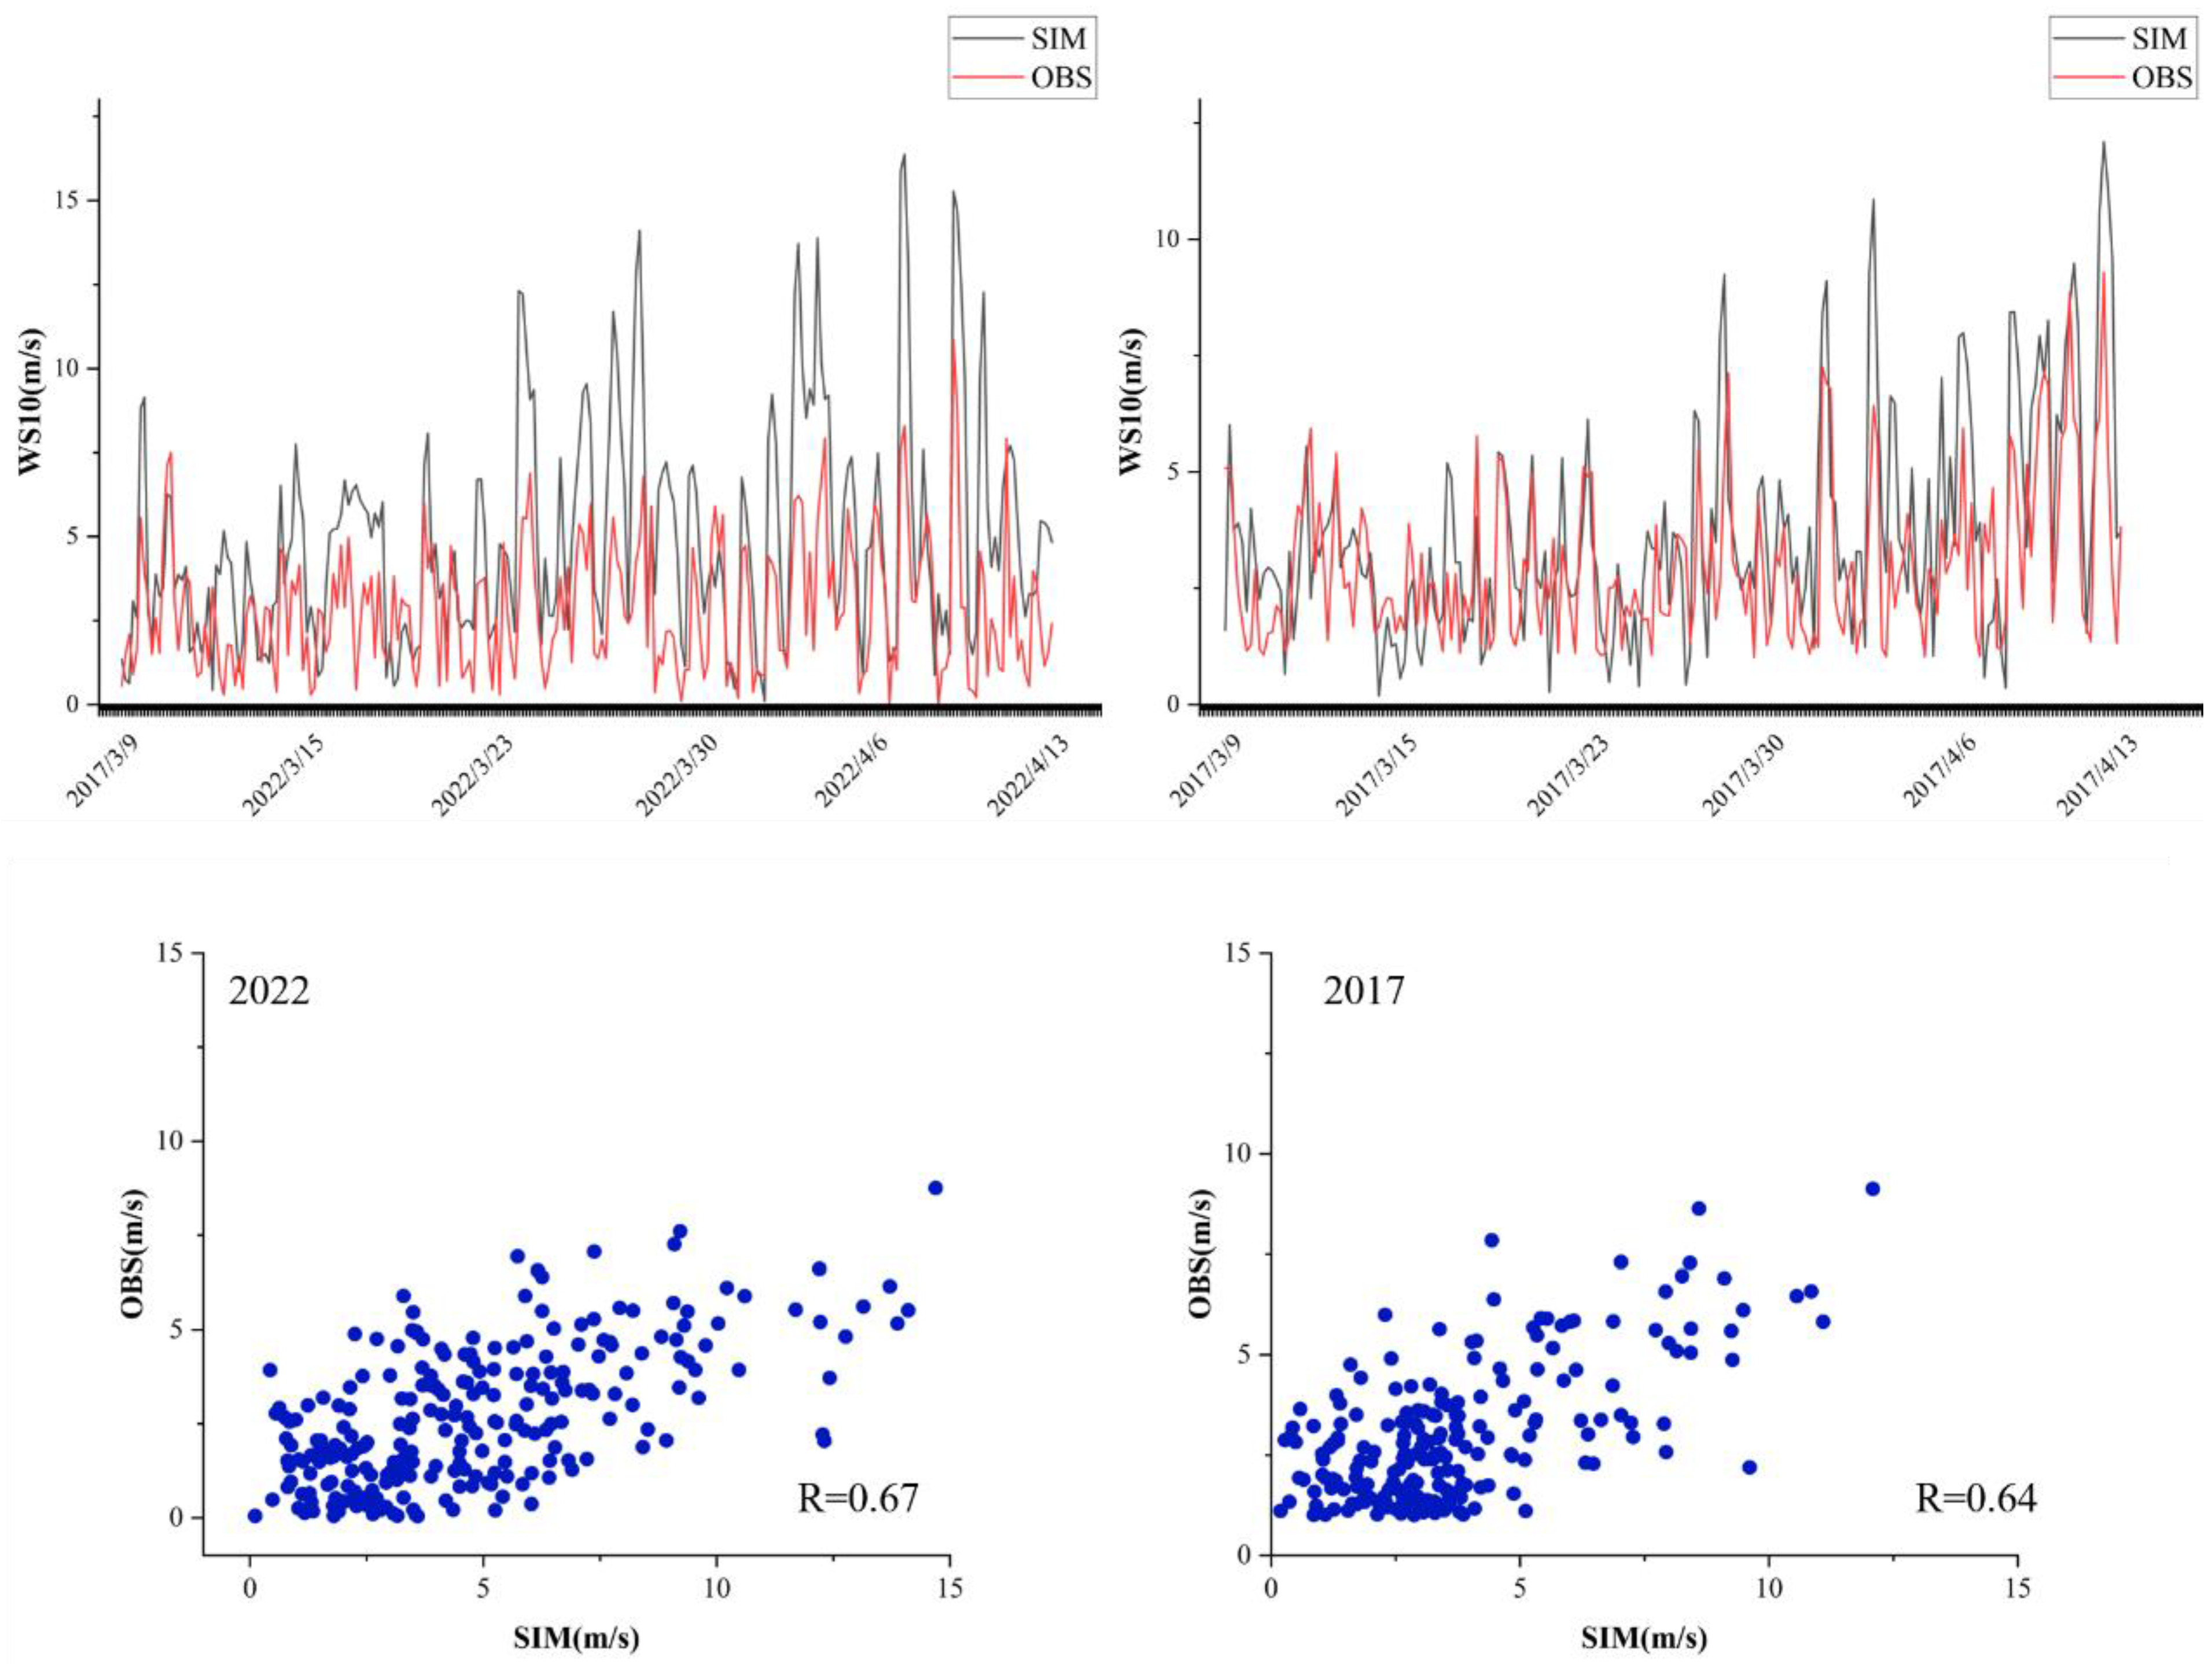
We can see from Section 3.2 that meteorological factors have an important impact on pollutant concentration, and the accuracy of meteorological field simulation will directly affect the uncertainty of CMAQ simulation results. Therefore, we first evaluated the meteorological field simulated by WRF. We used the statistical index correlation coefficient (R) and root means square error (RMSE) to evaluate meteorological elements. We used R to evaluate whether the changing trend of simulation results and monitoring results is consistent. The greater R is, the stronger the consistency between the two is; RMSE evaluated the deviation degree between the analog and monitoring values. The smaller the RMSE is, the smaller the deviation degree is. The meteorological elements are temperature (T2) at 2 m and wind speed (WS10) at 10 m. The comparison between simulation results and monitoring results is shown in Table 1, Figure 5 and Figure 6. We can see that the correlation coefficient between the T2 analog value and monitoring value was 0.90–0.94, indicating that the analog value and monitoring value were highly correlated, and the RMSE was 2.7–4.5 °C. For WS10, the correlation coefficient was 0.64–0.67, and the RMSE was 1.9–3.3 m/s. From the simulation and monitoring time series in Figure 5 and Figure 6, we can see that the simulation results of T2 and WS10 were relatively consistent with the monitoring values, indicating that WRF can well simulate the meteorological elements and provide a more accurate meteorological field for CMAQ simulation.

3.5. CMAQ Model Simulation Effect Evaluation

In this paper, we selected the simulated and observed values of three pollutants (PM2.5, PM10, NO2) in 2017 to evaluate the simulation effect of the CMAQ model. The correlation coefficient (R), mean fractional bias (MFB) and mean fractional error (MFE) was selected as the statistical indicators. MFB and MFE are indicators specially used to evaluate the simulation effect of air quality models [24,25]. When −60% ≤ MFB ≤ 60% and MFE ≤ 75%, it is considered that the simulation effect of the model meets the requirements. When −30% ≤ MFB ≤ 30% and MFE ≤ 50%, it is assumed that the simulation effect of the model is good. Table 2 shows the statistical analysis of the simulation results and monitoring data of PM2.5, PM10, and NO2. The simulation values and monitoring values of the three pollutants were between 0.14–0.29, the MFB of the three pollutants was between −60% and 60%, and the MFE ≤ 75%, meeting the requirements of model simulation accuracy. At the same time, NO2 met the conditions that MFB was −30% to 30% and MFE was ≤50%, indicating that the simulation performance of the model was good. Figure 7 shows the time series diagram of the simulated and monitored values of the three pollutants. We can see that the simulated values of the model of the two heavy pollution events on 29 March–30 March and 5 April–8 April were relatively low. In addition, the change trends of the simulation results and the monitoring results were roughly similar. The differences may be related to the uncertainty of the time distribution coefficient used in the emission list and the estimation of the pollutant source strength. In general, the CMAQ simulation system built in this study met the accuracy requirements and can more accurately present the trend of pollutant concentration changes.

3.6. Impact of Changes in Meteorological Conditions on Changes in Pollutant Concentrations

To study the impact of changes in meteorological conditions on the concentration of pollutants, the CMAQ model is used to simulate the pollutant concentrations from 14 March–8 April 2017, and 14 March–8 April 2022. The MEIC list of 2017 is used for the emission list. The two simulated meteorological fields are different. The impact of the changes in meteorological areas on pollutant concentrations is determined by comparing the changes in pollutant concentrations simulated twice.
Table 3 compares meteorological parameters between 2017 and 2022 during the simulation period. The average WS10 during the simulation period in 2017 and 2022 is 3.7 m/s and 4.9 m/s, respectively. The wind speed in 2022 increased by 33% compared to 2017. The wind speed directly affects the atmosphere’s transport and dilution of pollutants. In 2022, the wind speed was high, and the air mass rushed, resulting in low pollutant concentration; In 2017, when the wind speed was down, the atmospheric stability was good, and the vertical diffusion was weakened, providing a favorable environment for the accumulation of pollutants. The average T2 during the simulation period in 2017 and 2022 is 0.84 °C and 2.7 °C, respectively. The temperature during the simulation period in 2017 is close to 0 °C, which facilitates an increase in the humidity in the air and increases the probability of pollutant adhesion and accumulation; In 2022, the temperature was higher, and the atmospheric turbulence increased, reducing the pollutant concentration. The average planetary boundary layer height (PBLH) during the simulation period in 2017 and 2022 is 538 m and 726 m, respectively. The height of PBLH in 2017 is low, which is not conducive to the vertical diffusion of pollutants. The average values of meteorological indicators during the simulation period in 2017 and 2022 were quite different in Table 3. Therefore, we conducted a t-test of meteorological factors in 2017 and 2022 to determine whether there were significant differences in meteorological factors. The results are shown in Table 4. We can see that the meteorological factors in 2017 and 2022 were significantly different (p < 0.001), which proved that the meteorological factors in 2017 and 2022 were quite varied.
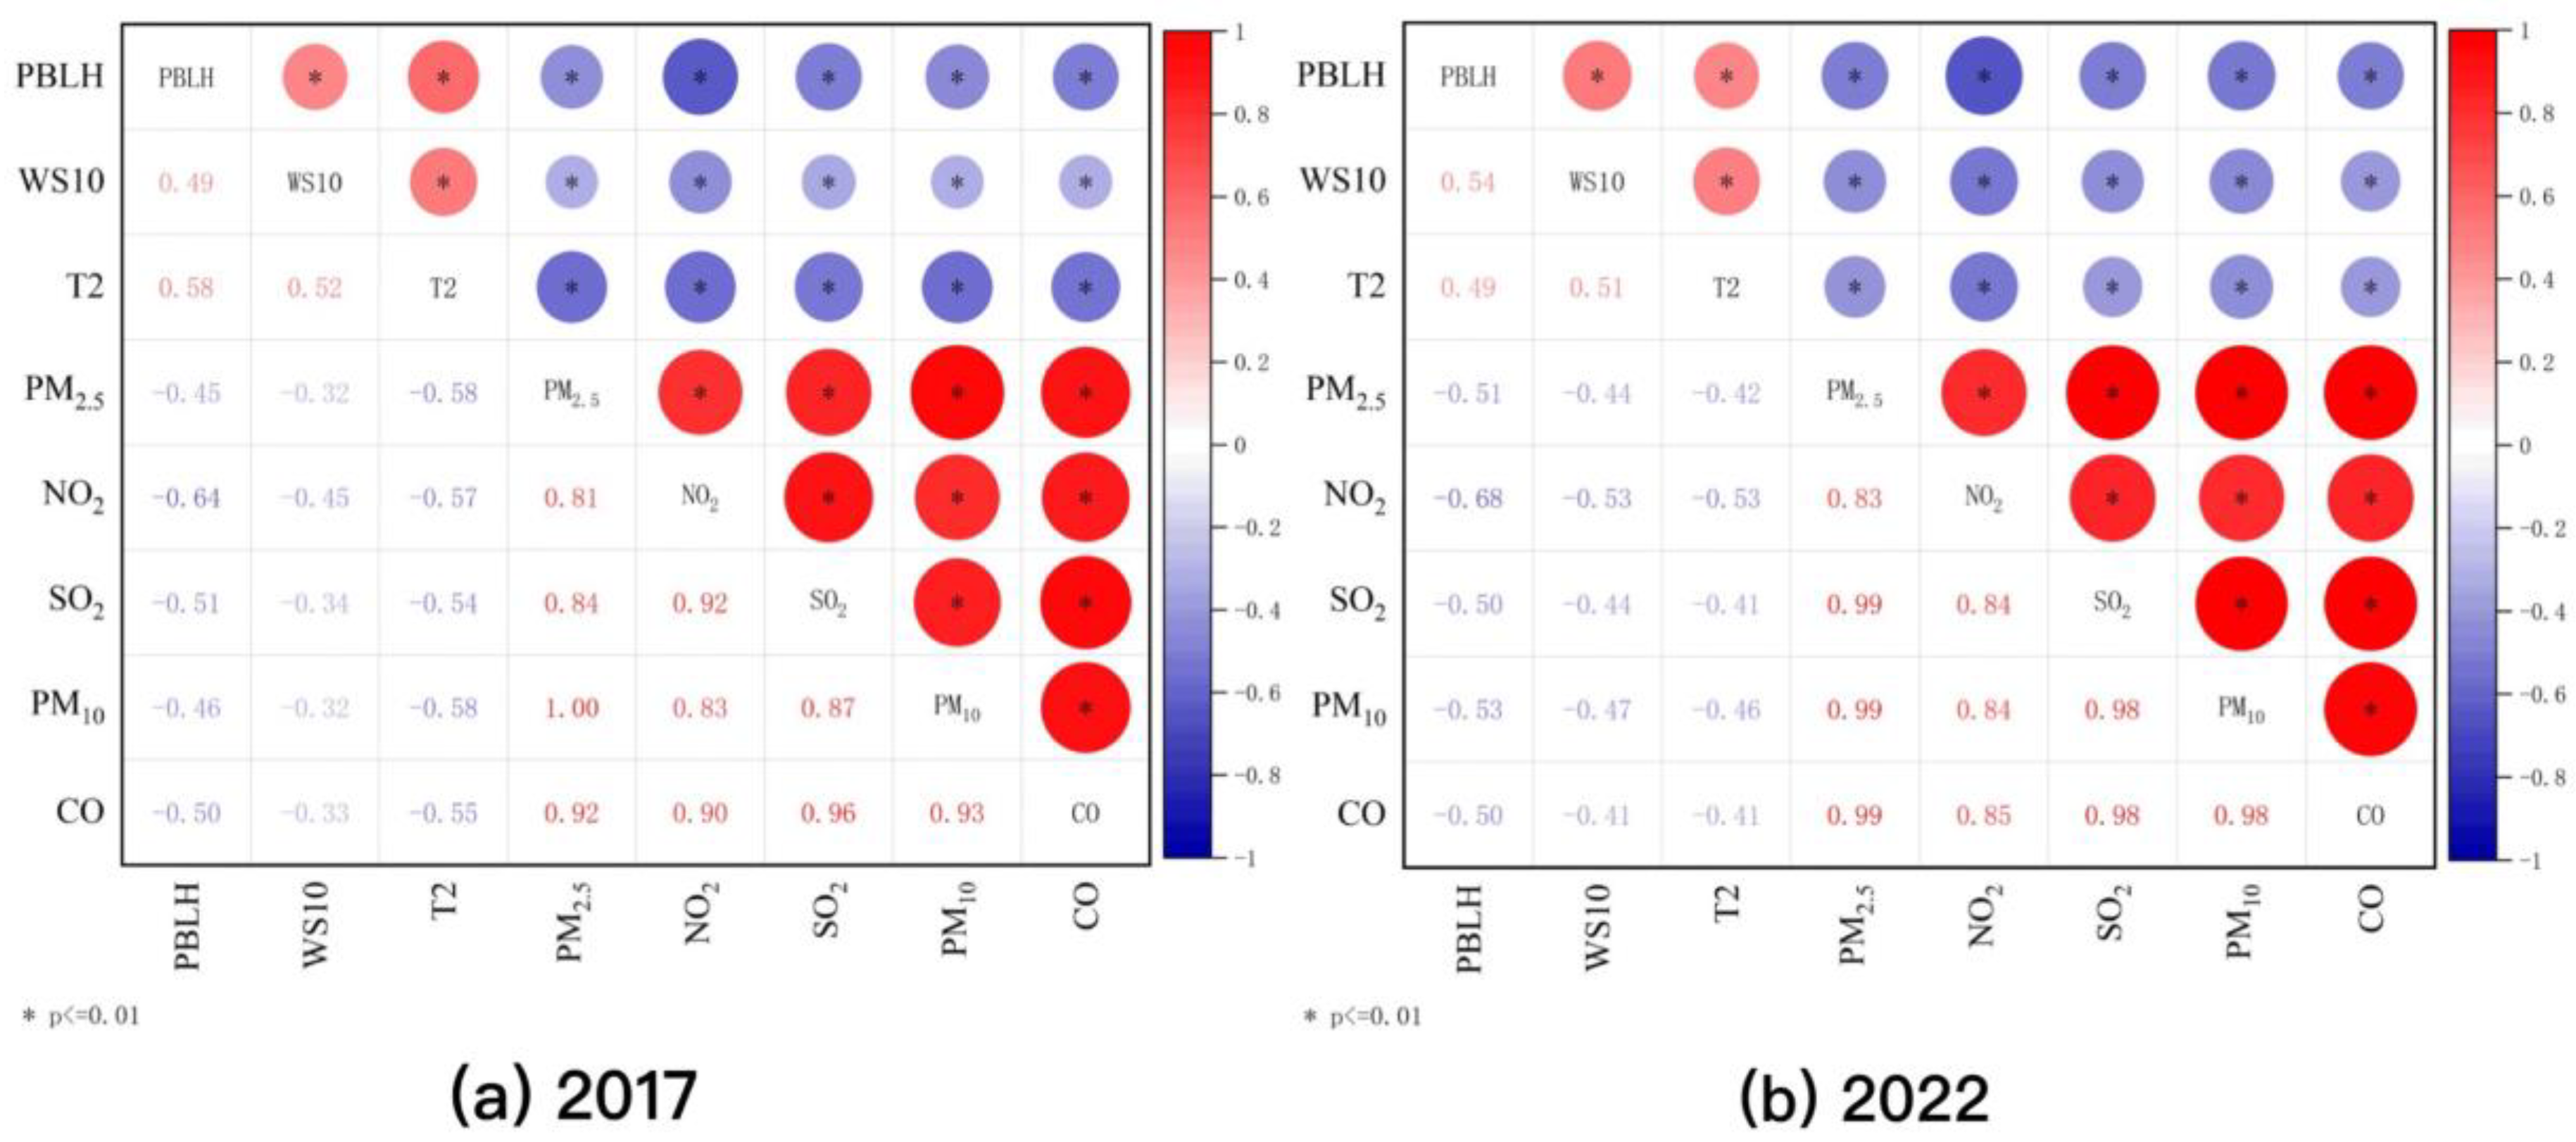
Figure 8 shows the correlation between pollutants and meteorological elements during the 2017 and 2022 simulation periods. We can see that no matter whether in 2017 or 2022, the pollutant concentration was negatively correlated with PBLH, WS10, and T2, which once again verifies the above analysis: the higher the planetary boundary layer height, the greater the wind speed and the higher the temperature, the lower the pollutant concentration during the simulation. Table 5 shows the reduction ratio of the meteorological field changes in 2017 and 2022 to the concentrations of five pollutants at each station in Jilin City. We can see that under the condition that the emission inventory remains unchanged, the change of meteorological conditions has played a massive role in reducing the pollutant concentration, with the decrease of PM2.5 ranging from 29% to 42%; PM10 decreased by 21–32%; NO2 decreased by 26–35%; S02 decreased by 26–45%, and CO decreased by 22–35%. Under the influence of meteorological conditions in 2022, the average reduction range of five pollutants was 38%, 28%, 31%, 35%, and 31%. As mentioned earlier, the more robust wind speed, higher temperature, and higher PBLH in 2022 will enhance the transmission and dilution of pollutants and reduce the concentration of contaminants. As a result, meteorological conditions play a significant role in modulating pollutant concentrations through advection and dispersion processes.

4. Conclusions

This paper analyzed the changes in six pollutant concentrations during the epidemic situation in Jilin City in 2022, compared them with the pollutant concentrations in the same period from 2018 to 2021, and obtained the impact of limiting human emissions on pollutants. To explore the effect of meteorological conditions on pollutant concentration in Jilin City during the epidemic situation, we used the WRF–CMAQ model to simulate the air quality during the Level 2-intensity period in 2017 and 2022 and draw the following conclusions:
First of all, except for O3, the other five pollutants have decreased significantly in the blockade period of Level 2 compared with previous years. Due to the restrictions on residents’ travel during the blockade period, the sudden reduction of vehicle exhaust emissions has led to a significant decrease in the concentration of NO2 and SO2, and the shutdown has led to the decline in the concentration of PM10, indicating that controlling anthropogenic emissions has a significant effect on improving air quality.
It is interesting to note that the PM2.5 Level 2 period in 2022 was just 6.6% lower compared to that in 2021, which was only a quarter of the decrease in PM10 during the same period. This was due to the fact that the study area was still in the midst of the central heating season. As a result, significant amounts of PM2.5 emissions were generated from coal combustion, leading to a less noticeable decrease in PM2.5 levels compared to other pollutants. The concentration of O3 Level 2 displayed a noticeable rise compared to previous years, owing to the decline of nitrogen NO emissions due to reduced human activities, traffic, and building dust during the epidemic blockade period. The titration reaction, which is the main consumption mechanism of O3 near the ground, was weakened, resulting in the increase of O3 concentration.
By analyzing the changing trend of the daily average concentration of six pollutants in Jilin City during the epidemic in 2022, it is found that the concentration of Level 2 concentration was significantly lower than before the blockade, which once again shows that controlling anthropogenic source emissions can improve air quality. At the same time, it was found that there was a severe pollution event during Level 2, which was caused by adverse meteorological conditions. The comparison and analysis of meteorological data revealed that higher atmospheric pressure and lower wind speed have a negative impact on dilution of pollutants, leading to the occurrence of heavy pollution events. Therefore, only controlling artificial sources cannot wholly avoid heavy pollution weather because meteorological conditions are also essential factors that affect the concentration of pollutants.
By comparing the WRF–CMAQ simulation results of Level 2 in 2017 and 2022, we can see that better meteorological conditions (higher wind speed, temperature, planetary boundary layer thickness) in 2022 promoted the dilution of pollutants and significantly reduced the concentration of contaminants. To sum up, meteorological conditions and anthropogenic emissions affect the change of pollutant concentration at the same time.

Supplementary Materials

The following supporting information can be downloaded at: https://www.mdpi.com/article/10.3390/atmos14020400/s1, Figure S1: Digital Terrain Map of Jilin City.; Figure S2: Location of Jilin Automatic Atmospheric Monitoring Station and Meteorological Station.; Table S1: Specific Location of Monitoring Station and Meteorological Station.

Author Contributions

Data curation and methodology, J.W.; conceptualization, original draft writing, review and editing, W.S.; formal analysis, K.X.; conceptualization and investigation, T.W.; supervision and validation, C.F. All authors have read and agreed to the published version of the manuscript.

Funding

Supported by the Graduate Innovation Fund of Jilin University (2022-243), Science and Technology Innovation Project of Shenyang Design & Research Institute Co., LTD., China Coal Science & Industry Group (NKJ006-2022).

Institutional Review Board Statement

Not applicable.

Informed Consent Statement

Not applicable.

Data Availability Statement

Not applicable.

Acknowledgments

The authors would like to thank the group members of Laboratory 537 and 142 of Jilin University.

Conflicts of Interest

The authors declare no conflict of interest.

References

  1. Gao, H.; Wang, J.; Li, T.; Fang, C. Analysis of Air Quality Changes and Influencing Factors in Changchun During the COVID-19 Pandemic in 2020. Aerosol Air Qual. Res. 2021, 21, 210055. [Google Scholar] [CrossRef]
  2. Mofijur, M.; Fattah, I.M.R.; Alam, M.A.; Islam, A.B.M.S.; Ong, H.C.; Rahman, S.M.A.; Najafi, G.; Ahmed, S.F.; Uddin, M.A.; Mahlia, T.M.I. Impact of COVID-19 on the social, economic, environmental and energy domains: Lessons learnt from a global pandemic. Sustain. Prod. Consum. 2021, 26, 343–359. [Google Scholar] [CrossRef] [PubMed]
  3. Zheng, H.; Kong, S.F.; Chen, N.; Yan, Y.; Liu, D.; Zhu, B.; Xu, K.; Cao, W.; Ding, Q.; Lan, B.; et al. Significant changes in the chemical compositions and sources of PM2.5 in Wuhan since the city lockdown as COVID-19. Sci. Total Environ. 2020, 739, 140000. [Google Scholar] [CrossRef] [PubMed]
  4. Yao, L.Q.; Kong, S.F.; Zheng, H.; Chen, N.; Zhu, B.; Xu, K.; Cao, W.; Zhang, Y.; Zheng, M.; Cheng, Y.; et al. Co-benefits of reducing PM2.5 and improving visibility by COVID-19 lockdown in Wuhan. NPJ Clim. Atmos. Sci. 2021, 4, 1–10. [Google Scholar] [CrossRef]
  5. Le, T.; Wang, Y.; Liu, L.; Yang, J.; Yung, Y.L.; Li, G.; Seinfeld, J.H. Unexpected air pollution with marked emission reductions during the COVID-19 outbreak in China. Science 2020, 369, 702–706. [Google Scholar] [CrossRef]
  6. Bao, R.; Zhang, A. Does lockdown reduce air pollution? Evidence from 44 cities in northern China. Sci. Total Environ. 2020, 731, 139052. [Google Scholar] [CrossRef] [PubMed]
  7. Sulaymon, I.D.; Zhang, Y.; Hopke, P.K.; Zhang, Y.; Hua, J.; Mei, X. COVID-19 pandemic in Wuhan: Ambient air quality and the relationships between criteria air pollutants and meteorological variables before, during, and after lockdown. Atmos. Res. 2021, 250, 105362. [Google Scholar] [CrossRef]
  8. Wang, P.; Chen, K.; Zhu, S.; Wang, P.; Zhang, H. Severe air pollution events not avoided by reduced anthropogenic activities during COVID-19 outbreak. Conserv. Recycl. 2020, 158, 104814. [Google Scholar] [CrossRef]
  9. Rudke, A.P.; de Almeida, D.S.; Alves, R.A.; Beal, A.; Martins, L.D.; Martins, J.A.; Hallak, R.; de Almeida Albuquerque, T.T. Impacts of Strategic Mobility Restrictions Policies during 2020 COVID-19 Outbreak on Brazil’s Regional Air Quality. Aerosol Air Qual. Res. 2022, 22, 210351. Available online: https://aaqr.org/articles/aaqr-21-11-covid2-0351 (accessed on 8 February 2023). [CrossRef]
  10. Matthias, V.; Quante, M.; Arndt, J.A.; Badeke, R.; Fink, L.; Petrik, R.; Feldner, J.; Schwarzkopf, D.; Link, E.-M.; Ramacher, M.O.P.; et al. The role of emission reductions and the meteorological situation forair quality improvements during the COVID-19 lockdown period in central Europe. Atmos. Chem. Phys. 2021, 21, 13931–13971. [Google Scholar] [CrossRef]
  11. Fu, S.; Guo, M.; Fan, L.; Deng, Q.; Han, D.; Wei, Y.; Luo, J.; Qin, G.; Cheng, J. Ozone pollution mitigation in Guangxi (south China) driven by meteorology andanthropogenic emissions during the CoVID-19 lockdown. Environ. Pollut. 2021, 272, 115927. [Google Scholar] [CrossRef] [PubMed]
  12. Zaręba, M.; Danek, T. Analysis of Air Pollution Migration during COVID-19 Lockdown in Krakow, Poland. Aerosol Air Qual. Res. 2022, 22, 210275. Available online: https://aaqr.org/articles/aaqr-21-10-covid2-0275 (accessed on 8 February 2023). [CrossRef]
  13. Danek, T.; Weglinska, E.; Zareba, M. The Influence of Meteorological Factors and Terrain on Air Pollution Concentration and Migration: A Geostatistical Case Study from Krakow, Poland. Sci. Rep. 2022, 12, 11050. Available online: https://www.nature.com/articles/s41598-022-15160-3 (accessed on 8 February 2023). [CrossRef] [PubMed]
  14. Statistical Bulletin of National Economic and Social Development of Jilin City in 2021. Available online: http://www.jl.gov.cn/mobile/sj/sjcx/ndbg/tjgb/202206/t20220602_8466592.html (accessed on 1 June 2022).
  15. Sugata, S. Seasonal Simulation of the Air Quality in East Asia Using CMAQ. In Air Pollution Modeling and Its Application XV; Borrego, C., Schayes, G., Eds.; Springer: Boston, MA, USA, 2004. [Google Scholar] [CrossRef]
  16. Appel, W.; Napelenok, S.; Hogrefe, C.; Pouliot, G.; Foley, K.; Roselle, S.; Pleim, J.; Bash, J.; Pye, H.; Heath, N. Overview and Evaluation of the Community Multiscale Air Quality (CMAQ) Modeling System Version 5.2. In Air Pollution Modeling and Its Application XXV. ITM 2016. Springer Proceedings in Complexity; Mensink, C., Kallos, G., Eds.; Springer: Cham, Switzerland, 2018. [Google Scholar] [CrossRef]
  17. Gao, L.; Liu, Z.; Chen, D.; Yan, P.; Zhang, Y.; Hu, H.; Liang, H. GPS-ZTD data assimilation and its impact on wintertime haze prediction over North China Plain using WRF 3DVAR and CMAQ modeling system. Environ. Sci. Pollut. Res. 2021, 28, 68523–68538. [Google Scholar] [CrossRef] [PubMed]
  18. Tan, J.; Zhang, Y.; Ma, W.; Yu, Q.; Wang, Q.; Fu, Q.; Zhou, B.; Chen, J. Evaluation and potential improvements of WRF/CMAQ in simulating multi-levels air pollution in megacity Shanghai, China. Stoch. Environ. Res. Risk Assess. 2017, 31, 2513–2526. [Google Scholar] [CrossRef]
  19. Frid, M.; Haeger-Eugensson, M.; Rayner, D. Alteration of Vehicle Propellant Use and the Impact on CO2 Emissions and NO2 Concentrations in Gothenburg and Mölndal. In Air Pollution Modeling and Its Application XXVII. ITM 2019. Springer Proceedings in Complexity; Mensink, C., Matthias, V., Eds.; Springer: Berlin/Heidelberg, Germany, 2021. [Google Scholar] [CrossRef]
  20. Steinhaus, T.; Thiem, M.; Beidl, C. NO2-immission assessment for an urban hot-spot by modelling the emission–immission interaction. Automot. Engine Technol. 2021, 6, 113–125. [Google Scholar] [CrossRef]
  21. Fang, C.; Xue, K.; Li, J.; Wang, J. Characteristics and Weekend Effect of Air Pollution in Eastern Jilin Province. Atmosphere 2022, 13, 681. [Google Scholar] [CrossRef]
  22. Kommalapati, R.R.; Liang, Z.; Huque, Z. Photochemical model simulations of air quality for Houston–Galveston–Brazoria area and analysis of ozone–NO x –hydrocarbon sensitivity. Int. Environ. Sci. Technol. 2016, 13, 209–220. [Google Scholar] [CrossRef] [Green Version]
  23. Domínguez-López, D.; Adame, J.A.; Hernández-Ceballos, M.A.; Vaca, F.; De la Morena, B.A. Spatial and temporal variation of surface ozone, NO and NO2 at urban, suburban, rural and industrial sites in the southwest of the Iberian Peninsula. Env. Monit Assess 2014, 186, 5337–5351. [Google Scholar] [CrossRef]
  24. Feng, R.; Luo, K.; Fan, J. Decoding Tropospheric Ozone in Hangzhou, China: From Precursors to Sources. Asia-Pac. J Atmos Sci. 2020, 56, 321–331. [Google Scholar] [CrossRef]
  25. Pedruzzi, R.; Baek, B.H.; Henderson, B.H.; Aravanis, N.; Pinto, J.A.; Araujo, I.B.; Nascimento, E.G.S.; Junior, N.C.; Moreira, D.M.; de Almeida Albuquerque, T.T. Performance evaluation of a photochemical model using different boundary conditions over the urban and industrialized metropolitan area of Vitória, Brazil. Environ. Sci. Pollut. Res. 2019, 26, 16125–16144. [Google Scholar] [CrossRef] [PubMed]
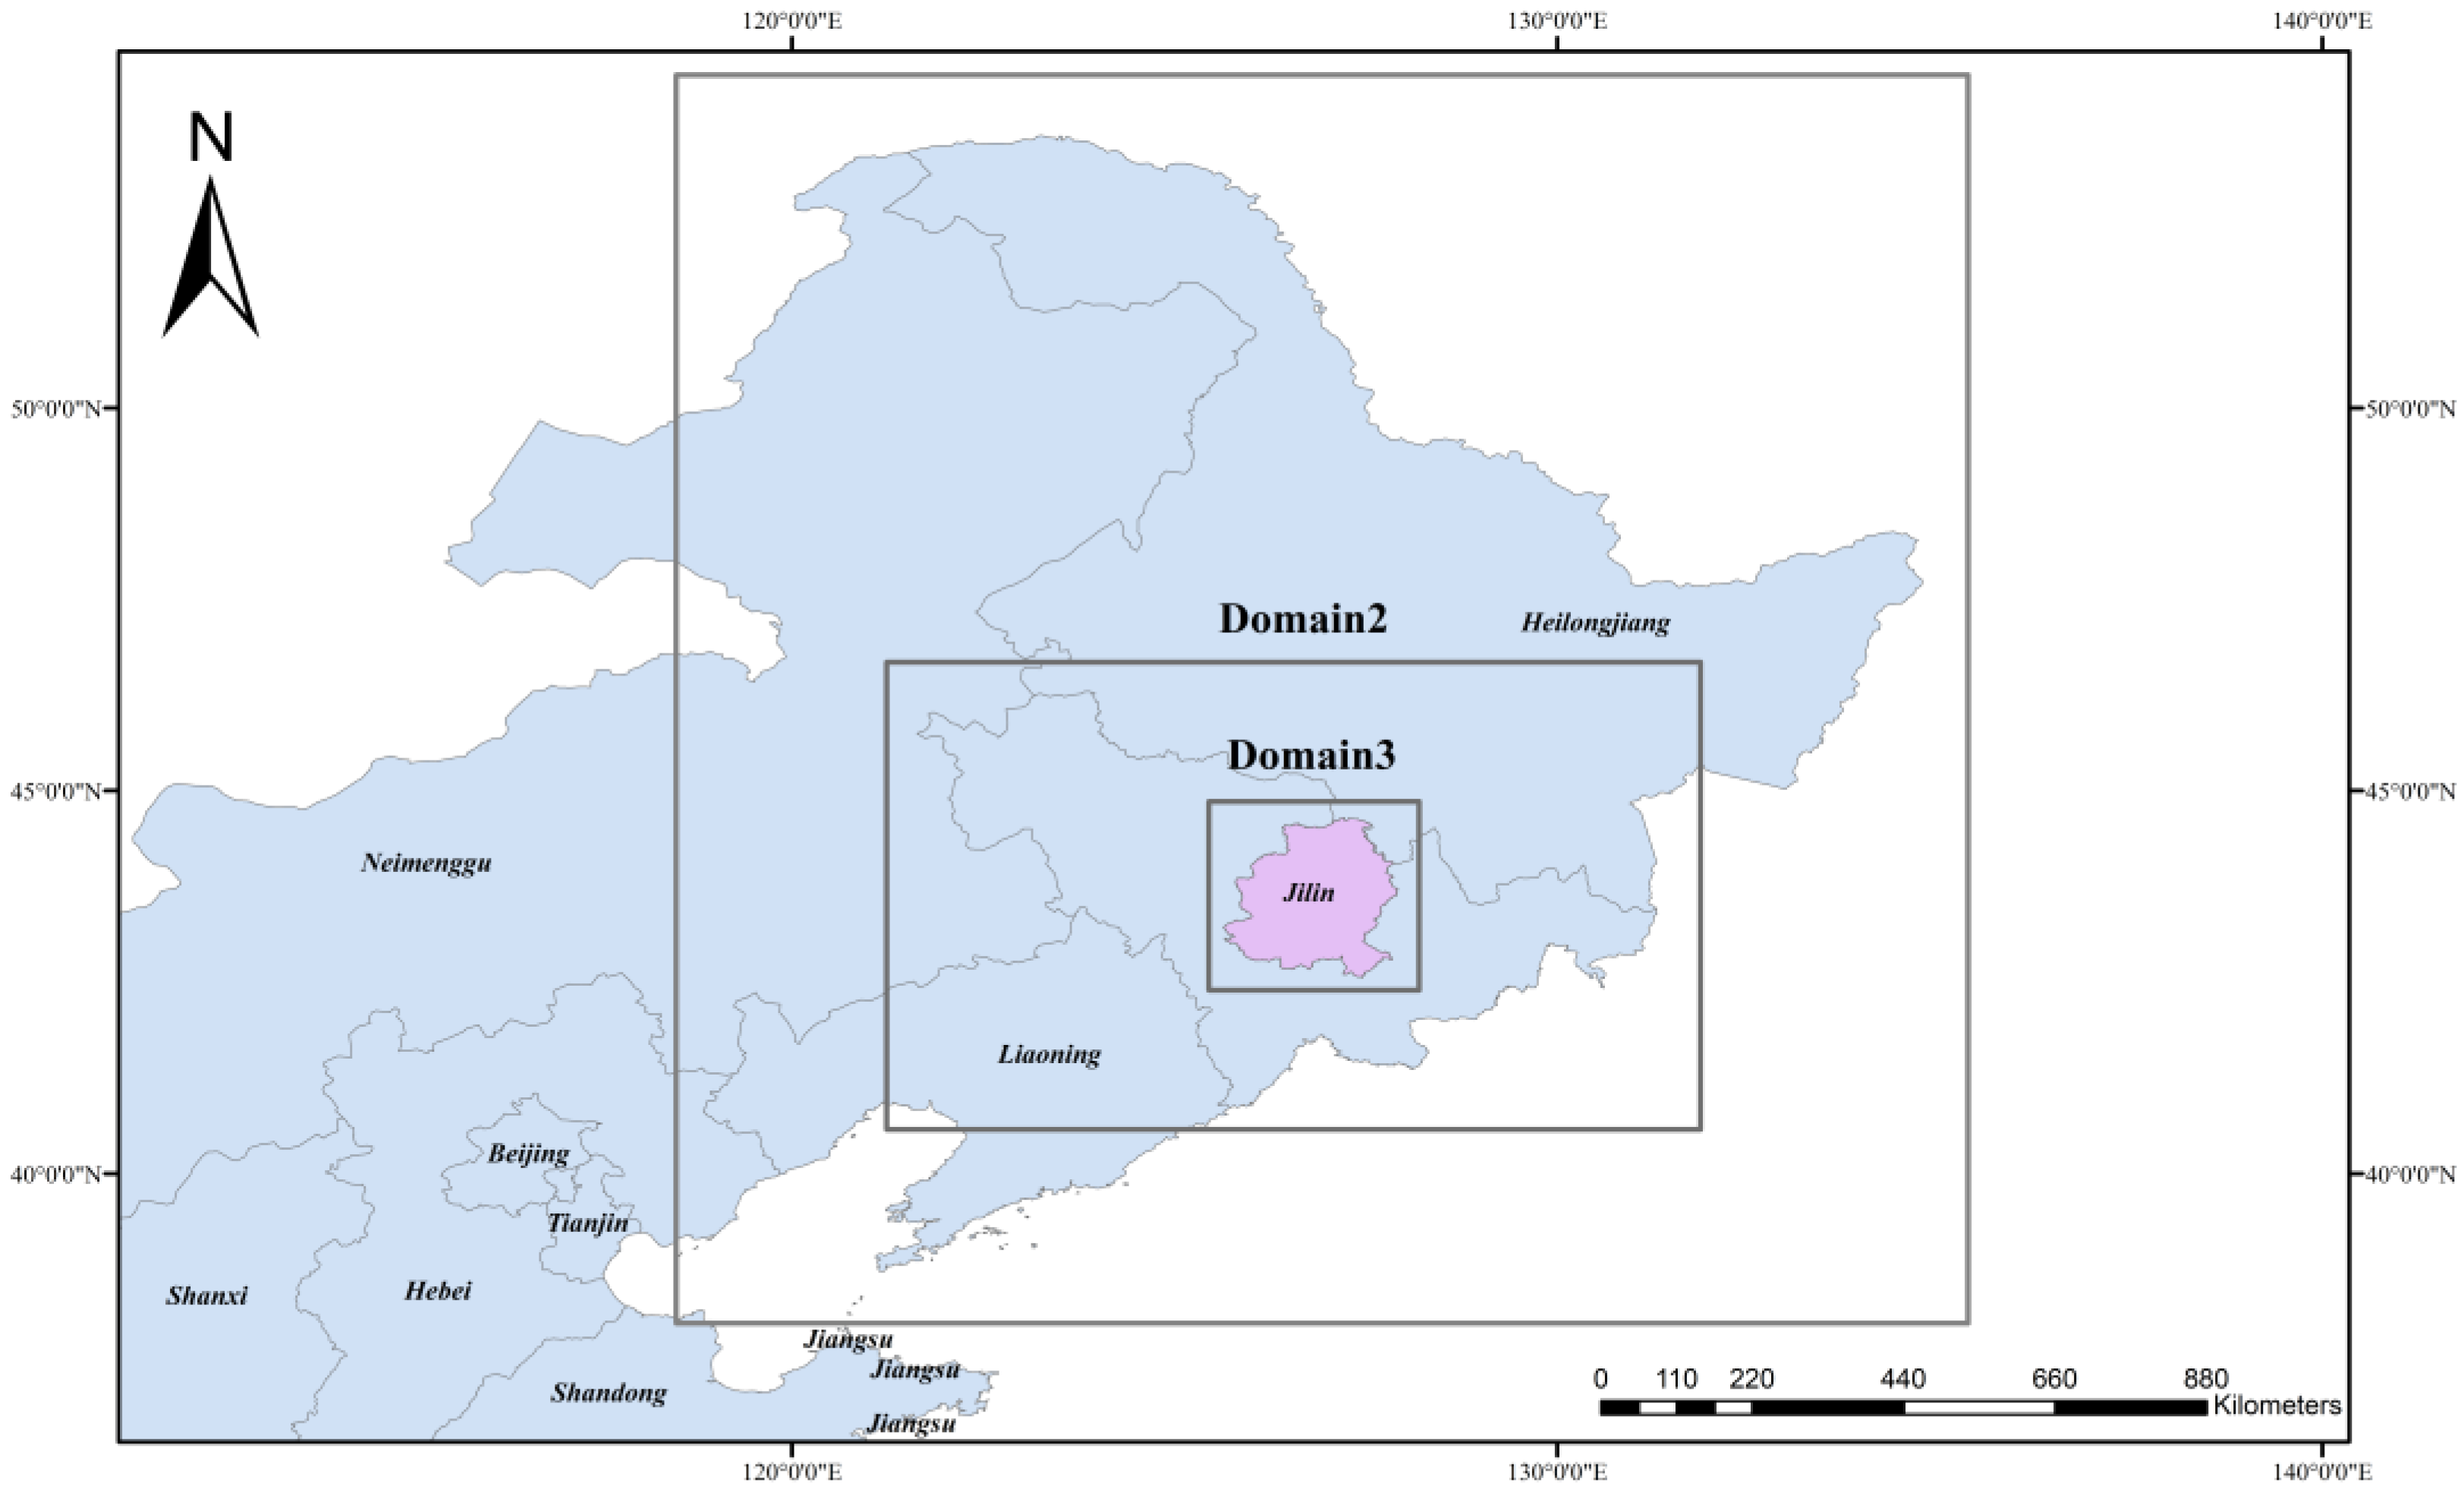
Figure 1. Simulation domain of the WRF model.
Atmosphere 14 00400 g001
Figure 2. Comparison of six pollutant concentrations in different years at the same period. (Grey, red, blue, green and purple boxes represent 2018, 2019, 2020, 2021 and 2022 respectively. The diamond represents the outlier, the rectangle represents 25–75% of the data, and the horizontal line in the rectangle represents the median.)
Atmosphere 14 00400 g002
Figure 3. Variation of daily average concentration of six pollutants. (Purple represents CO, unit: mg/m3; Blue represents SO2, unit: μg/m3; Green represents NO2, unit: μg/m3; Yellow represents PM2.5, unit: μg/m3; Red represents O3, unit: μg/m3; Pink represents PM10, unit: μg/m3.)
Atmosphere 14 00400 g003
Figure 4. Hourly changes of six pollutants in different control periods (CO unit: mg/m3, other five pollutants unit: μg/m3).
Atmosphere 14 00400 g004
Figure 5. Comparison between T2 analog value and monitoring value.
Atmosphere 14 00400 g005
Figure 6. Comparison between WS10 analog value and monitoring value.
Atmosphere 14 00400 g006
Figure 7. Comparison chart of PM2.5, PM10, NO2 simulation values, and observation values.
Atmosphere 14 00400 g007
Figure 8. Correlation between pollutants and meteorological elements.
Atmosphere 14 00400 g008
Table 1. Statistics of T2 and WS10 simulation results and meteorological station monitoring results.
YearElementRRcrucial (n-2, p)RMSE
2022T20.940.16 (250, 0.01)2.7 °C
WS100.670.18 (245, 0.01)3.3 m/s
2017T20.900.16 (250, 0.01)4.5 °C
WS100.640.18 (210, 0.01)1.9 m/s
Table 2. Statistical analysis of PM2.5, PM10, NO2 simulation results and observation data.
PM2.5PM10NO2
Simulation value (ug/m3)558032
Observation value (ug/m3)8111837
R0.260.290.14
Rcrucial (n-2, p)0.097 (620, 0.01)0.097 (609, 0.01)0.097 (617, 0.01)
MFB15%14%0.33%
MFE61%52%49%
Table 3. Comparison of meteorological parameters during WRF simulation in 2017 and 2022.
YearT2 (StDev)WS (StDev)PBLH (StDev)
20170.84°C (7.3 °C)3.7 m/s (2.3 m/s)538 m (660 m)
20222.7°C (6.7 °C)4.9 m/s (3.3 m/s)726 m (649 m)
Table 4. Results of t-test for meteorological factors.
ElementtnSignificance (p)
T2 (2017–2022)−5.1251<0.001
WS (2017–2022)−4.5210<0.001
PBLH (2017–2022)−4.9251<0.001
Table 5. Reduction ratio of pollutant concentration caused by meteorological field change in 2022 (mean ± variance).
StationsPM2.5PM10NO2SO2CO
HDW42% ± 17%32% ± 12%32% ± 10%42% ± 23%35% ± 17%
DJZ29% ± 33%21% ± 19%26% ± 11%27% ± 55%22% ± 30%
DLXY40% ± 15%28% ± 11%33% ± 27%26% ± 194%33% ± 12%
JNGY41% ± 16%31% ± 12%35% ± 8.5%45% ± 20%35% ± 16%
Disclaimer/Publisher’s Note: The statements, opinions and data contained in all publications are solely those of the individual author(s) and contributor(s) and not of MDPI and/or the editor(s). MDPI and/or the editor(s) disclaim responsibility for any injury to people or property resulting from any ideas, methods, instructions or products referred to in the content.