Abstract
Jet streams are atmospheric phenomena that operate on a synoptic scale and can intensify the descending/ascending conditions of the air at the lower levels of the atmosphere. This study aimed to identify the patterns and location of the jet stream in southwest Asia during the days of widespread rainfall in Iran based on two criteria: “highest frequency of stations involved” and “maximum cumulative amount on the day of peak rainfall”. For this purpose, the daily precipitation data for 42 synoptic stations in Iran during the period 2006–2019 from the Meteorological Organization of Iran, the daily data at 500 hPa Geopotential Height (HGT), and U and V wind components at 500 and 300 hPa from NCEP/NCAR were gathered. Synoptic patterns were obtained based on daily precipitation data, daily maps at HGT 500 hPa, and U and V wind components at 500 and 300 hPa. The analysis of patterns showed that the position of precipitation cores is associated with the position and extension of jet stream centers at 300 hPa in winter, spring, and autumn. The main position of jet stream cores during flood-causing rainfall at 300 hPa was over the northern part of Saudi Arabia, the Mesopotamia basin, and southern Iran. This position seems to have provided the conditions for the convergence of the earth’s surface and the divergence of the atmosphere for the easy passage of moisture from the Red Sea, Aden Sea, and the Persian Gulf, and in the second rank, the Mediterranean Sea and the Arabian Sea.
1. Introduction
The recognition of jet streams in the upper troposphere first occurred in 1944, during US air strikes on Japan during World War II. They were named by Rossby, who had previously studied streams in water bodies [1]. Jet streams are severe atmospheric currents with velocities of more than 60 knots [2,3]. The formation of these fast winds, thousands of kilometers wide and several kilometers thick [4] in the zone of maximum tropopause slope causes the establishment of westerly winds and the formation of subtropical and polar jets in the middle and upper latitudes [5]. The jet stream is a narrow, strong wind belt in the upper troposphere and lower stratosphere [6]. Jet streams, which cause rapid airflow at the tropopause level in a relatively narrow form, are currents with unique characteristics that are a permanent part of the general circulation of an atmosphere, and one of the most notable large-scale atmospheric phenomena [7,8] that affect the climate of each region by their behavior [9,10]. Jet streams play an important role in the formation and guidance of non-tropical cyclones and cause precipitation in the presence of hot and humid air by creating instability in their lower atmosphere that causes air to rise [4,11,12,13,14].
The mid-latitudes of the northern hemisphere are strongly influenced by the polar jet current, which determines the location of storm routes, and its influence also extends to creating climate patterns that lead to the ignition and growth of large fires [15,16]. While polar jet streams originate from ridge–trough structures [17], subtropical jet streams have an anticyclonic orbital curve pattern. Although the position of the subtropical jet stream is very important in regulating and exchanging atmospheric currents between tropical and non-tropical regions [18,19] and the formation of subtropical high pressure, the effect of its seasonal regression and the influence of polar jet streams has provided grounding for subtropical climatic phenomena, especially heavy rainfall [11,20,21].
So far, various studies related to jet streams have been conducted. For example, Kuang and Zhang studied the behavior of subtropical jets in East Asia and found that the average wind speed in the center of the jet reaches 70 m/s in winter, while in summer it is two times lower [22]. The axis of maximum jet speed at 200 hPa reaches its southernmost position in March and its northernmost in August. Schiemann et al. examined the annual and seasonal fluctuations of the west wind jet stream over the Tibetan plateau and stated that this jet stream is located over the south and north of this plateau during winter and summer, respectively [23]. During spring and autumn, jet stream movement is from south to north and vice versa, respectively, and the seasonal movement in spring has more severe annual fluctuations. Gong et al. analyzed the effect of ENSO on climate change in the southern hemisphere and found that the subtropical jet stream became weak in the La Niña years and strong in the El Niño years [24]. Fu and Lin used the temperature data of the lower part of the stratosphere and showed that in the northern hemisphere, the subtropical jet stream is relocated 0.6 degrees, and in the southern hemisphere 1 degree to the pole [25]. Eltantawy, while examining the role of the subtropical jet stream in the formation of high-level clouds in the region, concluded that there is a significant relationship between subtropical jet stream location and cloud formation in this geographical area [26]. Grover and Sousounis studied the autumn precipitation mechanisms in the Great Lakes area and found that precipitation is correlated with a strong subtropical jet stream from the high troposphere [27].
Xie et al. found out that the role of expansion and reversal of the orbit subtropical jet stream in atmospheric circulation precipitation changes in East Asia and the North Pacific is important [28]. Luo et al. analyzed the relationship between jet stream and winter monsoon changes in East Asia and found that the strengthening of the subtropical jet stream south of the Tibetan Plateau and the weakening of the polar jet stream occurs simultaneously with the strengthening of Siberian high pressure, change in southern Aleutian low pressure, and the establishment of the trough in East Asia and the wave-like anomaly pattern from the west of the Barents Sea to East Asia at 500 hPa [29]. Leroux and Hall examined the relationship between East African waves and the eastern jet stream by looking at how convective waves travel over East Africa under the influence of East African jet stream intra-seasonal diversity [30]. Their research shows that when the wave is strong, the jet stream extends south and west and its core has a maximum speed. Rodionov and Seager et al. have investigated the relationship between jet streams and climate fluctuations [31,32]. From a case study of the relationship between the polar front jet stream and subtropical jet stream in the cyclone generation in the eastern Mediterranean [33], it can be concluded that the process of cyclone generation intensifies whenever the polar front jet stream stretches to the south relative to the normal seasonal position and merges with the subtropical jet stream, which extends northward from its normal position. They examined the cyclones in the Cyprus area that occurred on 15 March 1998, and concluded that the proximity of the polar front jet stream and the subtropical jet stream is associated with an increase in hydrodynamic instability, which plays an important role in the area’s cyclone generation process. Masoodian and Mohammadi analyzed jet flows related to the occurrence of super heavy rainfalls in Iran [34]. The results of their study indicate that although jet streams have a significant frequency in the Persian Gulf and southwestern Iran, during the occurrence of super heavy rainfalls in Iran, the northern regions of Saudi Arabia have been the main location and concentration of jet streams. Wang et al. found out that during the El Niño (La Niña) years, as the Central–Eastern Tropical Ocean warmed (cooled), the meridional temperature slope in the Central Subtropical Pacific increased (decreased), leading to a direction change in the subtropical jet (STJ) to the east (west) [35]. Studies by Fu et al. and Du and Chen showed that strong low-level winds, especially low-level jets (LLJs), can have a large impact on the distribution and daily changes in rainfall, because of modulating large-scale mechanical force, moisture content, and atmospheric stability [36,37,38,39,40]. Park et al. have studied the occurrence of consecutive heavy rains (15 cases), which occurred in South Korea from mid-June to early September 2020 [41]. They concluded that the heavy rains that occurred between June 29 and July 27 were induced by subtropical cyclones and the heavy rains that occurred between July 28 and August 15 were due to the extension of the monsoon band. The role of remote linking patterns in the occurrence of heavy rainfall has also been considered important in their study. Studies by Horinouchi et al., Araki et al., Zhang et al., and Zhou et al. indicate that a large number of sudden and severe floods occurred between June and July (in China) and early July (in Japan) [42,43,44,45]. From the effect of merging subtropical jet flow and polar front jet flow on heavy rainfall in Southwest Asia [46], Saligheh concluded that the integration of the polar front jet stream and the subtropical jet stream creates conditions that accelerate atmospheric currents and achieve humidity. Rao et al. found that mountain convection in southern China generally occurs under the pattern of southwest monsoon winds [47]. Chen et al. stated that different synoptic patterns may lead to different interactions between large-scale and regional circulations and modify the characteristics of local rainfall, especially daily changes and their spatial distributions [48,49,50,51,52]. Tu et al. found that marine boundary layer jets over the North China Sea in June transferred moisture horizontally to Taiwan and spread it vertically in the front to generate rainfall [53]. In this study, the position of jet streams in relation to 168 precipitation events during a statistical period of fourteen years was investigated, the results of which can provide a good understanding of the behavior of jet streams and their role in the occurrence of heavy rainfall in Iran.
Every year, important and large parts of Iran are affected by the climatic risk of heavy rainfall, which results in severe damage. Therefore, one of the most important issues for the Iranian country is the prediction of heavy rain events, which can lead to floods. According to the usual methods of hydrologists, it is possible to study and predict floods after the onset of rainfall and storm, but there is usually not enough time to prepare and perform any actions. However, if the circulating patterns that generate heavy rainfall waves can be identified, it may result in a prediction of their occurrence at least one or two days before the beginning of the sequence of rain patterns that cause floods. Therefore, the main purpose of this study is to reveal the relationship between the position of jet streams and the highest amount of daily precipitation values recorded simultaneously in all selected stations in Iran.
2. Material and Methods
In this research, two types of data were used, the daily precipitation data of 42 synoptic stations in Iran recorded for 14 years (2006–2019) by the Meteorological Organization of Iran (IRIMO), and the upper atmosphere data, obtained from NCEP/NCAR datasets (https://psl.noaa.gov/data/gridded/data.ncep.reanalysis.html, accessed on 9 January 2023). The NCEP/NCAR datasets included HGT at 500 hPa and U and V wind component data at 500 and 300 hPa. The data were downloaded for the area spanning from 10 to 80° E and 10 to 60° N latitude (Figure 1).
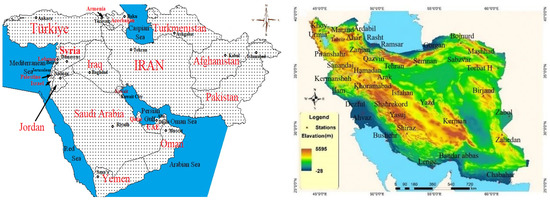
Figure 1.
The whole studied area (left) and the location of ground stations in Iran (right).
To calculate the frequency of rainy days, precipitation values higher than 0.1 mm were considered. Additionally, to determine the monthly and yearly precipitation index, the day when the highest frequency was checked for all stations, and a total of 168 precipitation events were obtained. To draw the precipitation maps, the day with the highest precipitation was designated the “annual index rainfall”. To determine the date of the monthly precipitation index, atmospheric circulation data, HGT maps at 500 hPa for selected days, and the axis of the western trough affecting precipitation in Iran were identified on daily maps. After that, the main patterns of Iran’s precipitation were drawn using the Surfer software environment The data of precipitation values of stations for all days were used to calculate the annual precipitation index, from which 14 patterns were finally identified as the main patterns of flood-prone rainfall in Iran.
3. Results and Discussion
The precipitation index in each of the years of the statistical period showed that in 2009–2010, most stations recorded the maximum amount of precipitation received during peak days. The peak of precipitation waves during the ten years under study showed that Rasht station with 1483, Yasuj station with 1261, and Ramsar with 1068 mm had the highest precipitation values. In turn, Chabahar station with 0.7, Yazd with 27, and Zabol with 30 mm of total rainfall had the lowest values during the statistical period. The period 2009–2010 with a total of 2418 mm and 2007–2008 with 1248 mm precipitation recorded were the highest and lowest sums of rainfall of the selected peak precipitation days in the whole of Iran, respectively. The highest prevalence, based on the highest frequency of stations with rainfall, occurred during the peak rainy days of each year from December to April. The maximum incidence was seen in February. The most pervasive days were 27 January 2008 and 1 February 2013, with 35 stations involved. The lowest prevalence was observed in July and August. In July, the maximum number of stations with rainfall was 10. According to Figure 2, the highest frequency of stations with rainfall was observed during the peak days in the cold months of the year. From October, the number of stations with rainfall gradually increased, while from the end of April, a decreasing trend could be observed, reaching a minimum in the warm months of the year. The incidence of rainy days was in line with the gradual increase in the arrival of the westerlies wave, and consequently, the jet stream current over Iran.
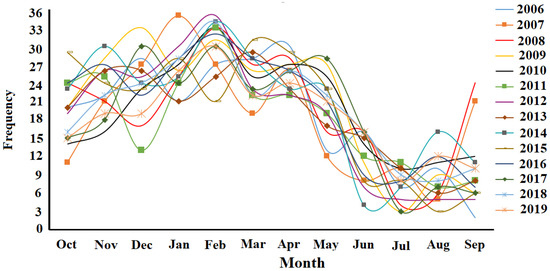
Figure 2.
Frequency of stations involved in 168 days of peak rainfall during 2006–2019.
3.1. Monthly Patterns of Jet Stream Positions at 300 hPa
Figure 3 shows the position of jet streams on peak rainfall days at a level of 300 hPa in different months. In all months, the jet streams extended from Northeast Africa, the Red Sea, and northern Saudi Arabia to Iran. With increasing intensity and duration in rainfall in the cold seasons of the year from November to March, the darker part, which is a sign of greater abundance or overlap of zones on observed rainy days, was closer to Iran and gradually surrounded Iran from the east side. These zones have gradually increased from the warm season to the cold season in the lands of eastern Iran, such as the Mesopotamia basin and the north and center of Saudi Arabia. Simultaneously with this increase, the change in the arrangement of velocity zones from orbital (west–east) to meridional (southwest–northeast) was observed. It seems that in such conditions, the hot and humid air can ascend to the study area by the divergence of high atmospheric levels. The location of jet stream cores with more than 30 m per second speed over the Red Sea, the Mediterranean Sea, and the Persian Gulf water zones on the one hand, and their placement in the eastern half of the troughs, on the other hand, caused severe energy depletion and unstable conditions. This discharge played an important role in the continuation, intensification, and extension of the rainfall over Iran and the strengthening of circulatory systems. Once again, from April onwards, the frequency and role of the jet stream in the occurrence of widespread rainfall in Iran gradually decreased, reaching its lowest level in July, in the middle of summer. Along with the decrease in the frequency of the jet stream and the dispersion of its cores in the warmer months of the year, the jet stream position had shifted to latitudes above 35° N. Such change in the quantity and quality of a jet stream can be considered an indicator of a change in the mechanism of systems causing the precipitation in the warm period of the year. In the warm months of the year, the spatial area affected by the jet stream is reduced simultaneously with its frequency and location, but in the cold and rainy months of the year, each of the jet stream cores covered a much larger geographical area, which led to the merging of the jet stream extending from the southern latitudes with the jet stream extending from the European side, as well as from the upper latitudes. In the patterns plotted in Figure 3, the core areas of the jet stream are semi-transparent; and when semi-transparent zones are darker, the presence of the jet stream core has a higher frequency. The position of the polar front jet, and the occurrence of widespread rainfall in Iran, indicate that the heaviest precipitation events occurred in winter. Such events were accompanied by higher frequency and widespread jet streams in the upper atmosphere. This integration lasted for five months, until April, and in May, the effects of grouping reappeared, with the difference that this time southwestern Iran was at the tip of the arrow (Figure 3).
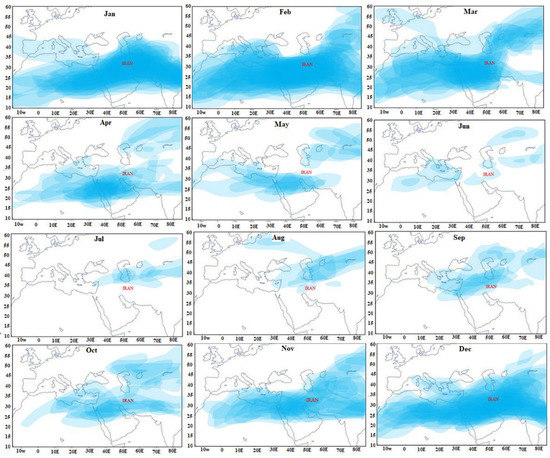
Figure 3.
Monthly spatial distribution of jet stream at 300 hPa for the days of peak rainfall during 2006–2019.
3.2. Seasonal Pattern of Jet Stream Positions at 300 hPa
Figure 4 shows the position of the jet stream at the time of peak rainfall days at 300 hPa during the four seasons. From the seasonal patterns, it can be seen that from autumn to winter, the abundance of jet stream cores increased and their length became more meridional. Such conditions can be the basis for conducting independent research on the location of jet stream zones over the Mediterranean, the Red Sea, and the Persian Gulf water bodies leading to the conditions of stronger convergence and discharge of moisture and extreme heat, and the pervasiveness and continuity of rainfall systems. In the spring, the integrity, order, and curvature of the jet stream meridian were no longer as visible as they were in the winter. The cores of jet streams were very scattered and with their orbital curvature located over the southern latitudes and Iran, and they had a different pattern from the one seen in summer. In this season, most of the northern direction transfer had occurred in the jet stream core and most of the cores were observed outside Iran, over the north of the Caspian Sea and Central Asia. Additionally, the lowest frequency was seen in jet stream areas during the peak of rainy days during the warm months of the year. Such conditions indicate the effect of lesser wind presence and, consequently, weaker rainfall events for this season.
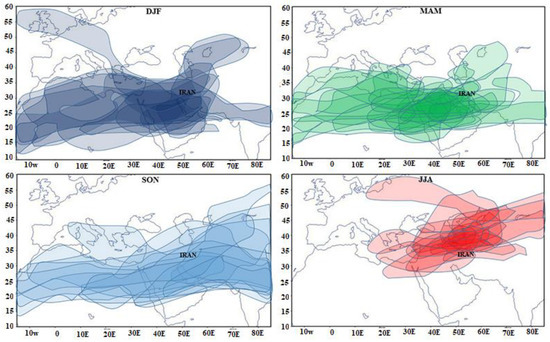
Figure 4.
Distribution of 300 hPa jet streams for the peak rainfall days of the 2006–2019 statistical period.
3.3. Jet Stream Position at 500 hPa
The location of the jet stream at 500 hPa on the scale of a year, month, and the season was examined and compared with the results at 300 hPa. Figure 5 shows the position of jet stream cores on peak rainfall days at 500 hPa during different months. At 500 hPa, opposite to 300 hPa, the jet stream and its core did not form on most days with peak rainfall. The number of jet stream cores had been gradually increasing since November, with the highest frequency occurring in February. From March, jet stream cores had a declining trend. In comparison to 300 hPa jet streams, they covered a much smaller geographical area. The wind speed in the jet stream core at 500 hPa was much lower than at the upper level. Consistent with the results of many previous studies, the upper levels, especially 300 hPa, were the best for checking the coordination of jet stream and precipitation cores over Iran.

Figure 5.
Distribution of jet streams at 500 hPa for peak rainfall days in each month of the statistical period 2006–2019.
Figure 6 shows the position of jet stream cores on peak rainfall days at 500 hPa during the four seasons. Winter had the highest frequency of jet streams. As stated in the research of Saeed Abadi et al., along with the increase in the frequency of jet streams in winter, the meridian curvature of jet streams had increased [54]. The area with the highest concentration of jet streams was the northern half of Saudi Arabia, from the northern Red Sea to the Persian Gulf. According to a study conducted by Masoudian and Mohammadi aiming to identify the frequency of jet streams in relation to heavy precipitation in Iran, the northern parts of the Saudi Arabia Peninsula were the main location of jet streams [34]. The trend of the gradual reduction in jet stream started in spring and reached a minimum in summer. This situation led to more moisture penetration into Iran [54]. Spring had the lowest frequency of jet stream. Additionally, no jet streams were seen in summer. At 500 hPa, on all rainy days, the discharging side of the jet streams was located in the east of Iran, and they led to divergence and air rise.
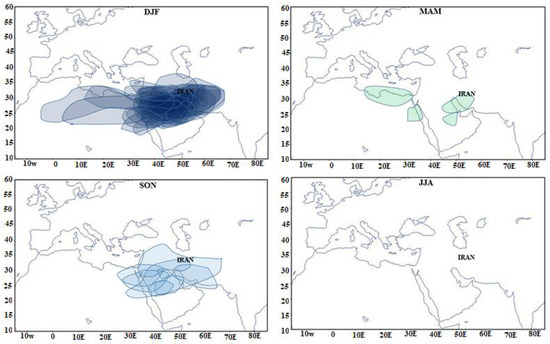
Figure 6.
Distribution of jet stream at 500 hPa for peak rainy days of the statistical period 2006–2019.
3.4. Jet Stream Location over Iran during the Most Pervasive Rainy Days
Figure 7 shows the patterns of jet stream cores at 300 and 500 hPa, and the map shows the precipitation for the same specific day (the peak day index) during the statistical period 2006–2019.
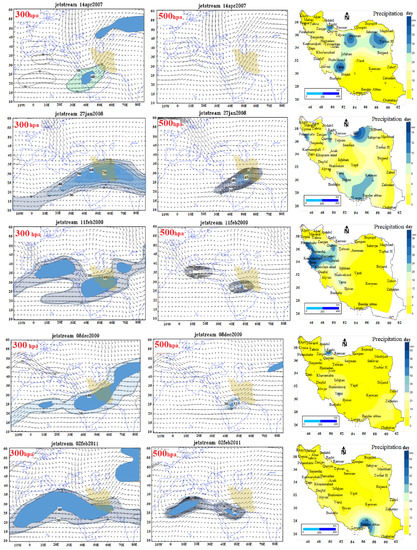
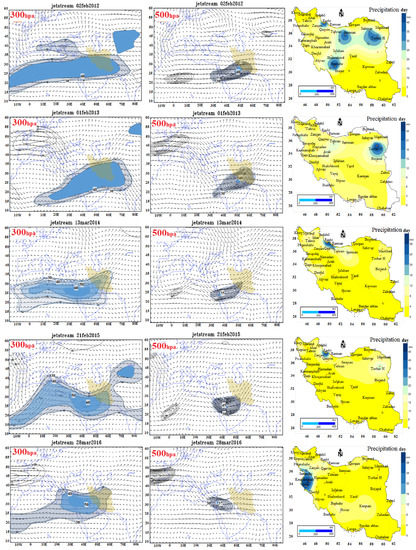
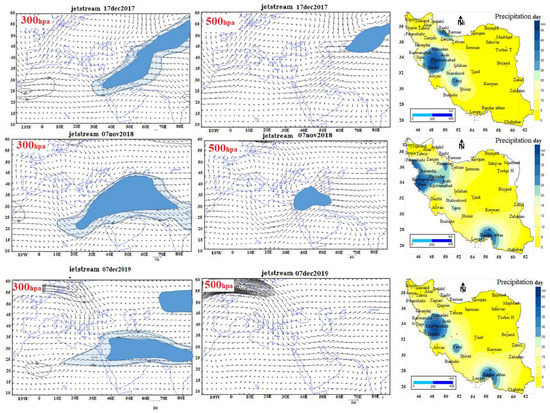
Figure 7.
Jet stream position at 300 hPa (left), 500 hPa (middle), and precipitation (right) for the most pervasive precipitation day in Iran in each of the statistical period 2006–2019.
The jet stream status and precipitation values for the peak day index for 14 April 2007 are shown in the first row. The jet stream was located in the middle of the Red Sea and Saudi Arabia at a level of 300 hPa with a speed of 40 m per second. The curvature of the meridional jet stream, extending southwest to northeast in line with cyclonic circulation, covered the southern half of the country. On 14 April 2007, more than 31 stations recorded 452 mm of precipitation, and precipitation cores were seen in the western half of the country.
In the second row, analyzed maps show the jet stream conditions and precipitation on the peak day index for 27 January 2008. This day had the most prevalence, with 35 stations recording 158 mm of precipitation. The subtropical jet stream was very wide and extended from southwest to northeast, passing through East Africa and Saudi Arabia, and covering all over Iran, which was in line with the increasing prevalence of precipitation. The increasing spatial extent of the jet stream towards Iran probably contributed to the more severe evacuation of hot and humid airflow and the formation of multiple cores of maximum precipitation in different parts of the country.
In the third row, the maps for 11 February 2009 are presented. At 300 hPa, multiple jet stream cores were located over the Mediterranean and the Persian Gulf. Due to the orbital nature of the jet stream and wind flow over the country and the location of the jet stream core in higher latitudes compared to other days under study, the increasing role of the Mediterranean Sea in supplying moisture to precipitation can be assumed. At 500 hPa, like the pattern of the peak day index in 2008, the jet stream was located over the Persian Gulf, which, after the Mediterranean, is another researchable source to provide moisture for precipitation. The core of maximum precipitation on this day was in the western half of Iran and the peak of precipitation (39 mm) was observed at Piranshahr station.
In the fourth row, the peak day index of the precipitation for 8 December 2009 is presented. The jet stream with a meridional curvature extended from East Africa to Saudi Arabia and Iran. The main jet stream core was over northern Saudi Arabia and the scattered precipitation cores were over the southern half of Iran. However, the more important precipitation core in Gilan was governed by a separate mechanism. On this day, Zahedan station recorded the third-highest precipitation after Rasht and Yasuj, with 19 mm of precipitation.
In the fifth row, the jet stream maps and the precipitation for 2 February 2011 are plotted. The jet stream with a structure similar to a ridge and altitude trough was formed from the Mediterranean Sea to the south of the country. On this day, the core of maximum precipitation was on the southern coast of the country and the fourth quarter of the jet stream or the left part of the jet stream outlet was on the east of the Persian Gulf. Wind current and jet stream curvature were almost orbital, contrary to other index days.
The sixth row shows the analyzed maps for the rainiest day of 2011–2012 (2 February 2012), with 458 mm of precipitation and precipitation occurring in 33 stations. On this day, the subtropical jet stream extended completely orbitally from the eastern Atlantic, passing through Iran to the Himalayas. The integration of this jet stream with the jet stream located in southern Europe increased the power and speed inside the jet stream, which resulted in cores with speeds of more than 50 m per second, covering all the nearby water resources and the country. The formation of maximum precipitation cores in the central and northern regions of the country was in line with the optimal jet stream position and the location of the maximum jet stream divergence in the fourth quarter. Additionally, Kaviani and Alijani stated that the left output area of the jet stream cores was the place of maximum divergence of the upper levels and convergence of the lower levels of the atmosphere. Such conditions provided air rising in this area [55].
The seventh row shows the status of the jet stream and precipitation for 1 February 2013. On this day, the highest range of precipitation was seen in the country, similar to the rainfall day index in 2008, and the precipitation occurred at 35 stations. The jet stream situation was very similar to the 2012 rainfall day pattern. Pattern coordination at 300 and 500 hPa was high on this rainy day. The jet stream output area and the core of maximum rainfall on this day were located in the northeast of the country. The difference was an increase in the curvature of the meridian jet stream, placing it in a better position over the Red Sea and Persian Gulf water resources, which caused divergence and ascending moisture over the country. Rainfall days index in 2014, 2015, and 2016 (8th, 9th, and 10th row, respectively) show that precipitation occurred at more than 30 stations, and the jet stream with a meridional curvature caused the divergence and evacuation of wet airflow and precipitation. A noteworthy point for these precipitation days indices is that most jet stream patterns expanded to the southern regions, but as soon as they were drawn over Iran, they had a meridional curvature, which can be due to the protrusion of the Iranian plateau forcing of these airflows to rise.
During the precipitation days in 2017 and 2018 (11th and 12th rows of Figure 7, respectively), at 300 hPa, a subtropical jet stream with a wide range and southwest to the northeast direction and passing via East Africa and Saudi Arabia, covered all of Iran’s territory. This expansion contributed to a more severe evacuation of hot and humid airflow and the formation of multiple cores of maximum precipitation over different parts of the country. At 500 hPa, the jet stream was located in the west of the country. The core of maximum precipitation on this day was in the western half of Iran.
The thirteenth row shows the maps for 7 December 2019. On this day, the subtropical jet stream was completely orbital and covered Iran from west to east. The formation of maximum precipitation cores in the central and northern regions of the country was in line with the jet stream position and the location of the maximum jet stream divergence.
4. Conclusions
Jet stream position was investigated at 300 and 500 hPa for 168 days of peak precipitation index from the beginning of autumn to the last day of summer, and the synoptic positioning patterns of effective jet stream cores were analyzed. By comparing these results, it turned out that the highest frequency of jet streams occurred in Iran and other countries in the region in winter. The trend of the gradual reduction in jet stream started in spring and reached a minimum in summer. Maps at 500 hPa and the positioning of troughs showed that an increase in the frequency of jet stream cores was in line with the deepening of troughs on the Red Sea. In our study, jet streams were located over the study area and, along with other factors leading to air rise, they caused days with heavy precipitation.
According to some studies, jet streams are more intense and integrated during the peak precipitation days at 300 hPa, especially in winter. Irregularity and lack of proper location of the jet stream were generally seen above 35 degrees latitude in summer. At 500 hPa during rainy days, the jet stream was observed much less frequently over the region or Iran’s territory. On other days, when a jet stream appeared, it had a core with a smaller velocity (less than 40 m per second) and an orbital curvature, and it covered a small area over Saudi Arabia and the Persian Gulf. Therefore, it can be said that the level 300 hPa had the highest impact on the overall precipitation in Iran. For most of the studied days, jet streams from the northern half of Africa, the northern Red Sea, and Saudi Arabia to Iraq were observed. The highest concentration of jet stream cores was recorded in northern Saudi Arabia and southern Iraq, which, due to the meridian curvature and elongation of the jet stream to low latitudes, was most likely related to the pattern of moisture evaporation from the Red Sea, Mediterranean, and Persian Gulf water bodies. In some cases, in which the jet stream and its core were located at higher latitudes and were integrated with the jet stream extending from Europe to the Mediterranean, it was also possible to study the contribution of the Mediterranean’s provision of the moisture on the precipitation. According to the obtained results, for 168 days of inclusive precipitation, the frequency and position of jet streams showed obvious correlations on a seasonal scale with the frequency and position of Iranian precipitation cores. This correlation was less obvious on a monthly scale and at 500 hPa.
Author Contributions
I.R., A.E.M. and P.A. proposed the topic. I.R., A.E.M., P.A. and A.N. carried out the data processing and analysis and wrote the manuscript. H.O., P.B. and J.K. enhanced the research design, helped with the analysis and interpretation of the results, and helped with writing the manuscript. All authors have read and agreed to the published version of the manuscript.
Funding
This work was supported by Vedurfelagid, Rannis, and Rannsoknastofa i vedurfraedi. J.K. and P.B. have been partly financed by the Polish National Centre for Research and Development within the framework of the MSINiN project (contract number: BIOSTRATEG3/343547/8/NCBR/2017).
Institutional Review Board Statement
Not applicable.
Informed Consent Statement
Not applicable.
Data Availability Statement
Contact Iman Rousta at irousta@yazd.ac.ir.
Acknowledgments
Iman Rousta is deeply grateful to his supervisor, Haraldur Olafsson (Professor of Atmospheric Sciences, Institute for Atmospheric Sciences—Weather and Climate, and Department of Physics, University of Iceland, and Icelandic Meteorological Office (IMO)), for his great support, kind guidance, and encouragement.
Conflicts of Interest
The authors declare no conflict of interest.
References
- Barry, R.; Perry, A. Synoptic climatology and its applications. Synop. Dyn. Climatol. 2001, 547, 603. [Google Scholar]
- Geer, I.W. Glossary of weather and climate. Bull. Am. Meteorol. Soc. 2013, 94, 1936–1937. [Google Scholar]
- Carr, M.; Carr, M.W. International Marine’s Weather Predicting Simplified: How to Read Weather Charts and Satellite Images; McGraw Hill Professional: New York, NY, USA, 1999. [Google Scholar]
- Archer, C.L.; Caldeira, K. Historical trends in the jet streams. Geophys. Res. Lett. 2008, 35, L08803. [Google Scholar] [CrossRef]
- Halabian, A.; Hossainali Purjezi, F. The Frequency of Heavy Precipitation and comprehensive analysis of jet streams in the West Bank Caspian. Geogr. Res. 2014, 112, 205–220. [Google Scholar]
- Sheng, C. An introduction to the Climate of China. Beijing Sci. Press 1986, 85, 89. [Google Scholar]
- Phillips, N. Jet stream revisited II. Bull. Am. Meteorol. Soc. 1999, 80, 2629–2630. [Google Scholar]
- Kington, J.W. Clement Ley: Nineteenth-Century cloud study and the European jet stream. Bull. Am. Meteorol. Soc. 1999, 80, 901–903. [Google Scholar]
- Liao, Q. Anomalies of the extratropical westerly jet in the north hemisphere and their impacts on east Asian summer climate anomalies. Chin. J. Geophys. 2004, 47, 11–18. [Google Scholar] [CrossRef]
- Yang, S.; Lau, K.; Kim, K. Variations of the East Asian jet stream and Asian–Pacific–American winter climate anomalies. J. Clim. 2002, 15, 306–325. [Google Scholar] [CrossRef]
- Rousta, I.; Doostkamian, M.; Haghighi, E.; Mirzakhani, B. Statistical-synoptic analysis of the atmosphere thickness pattern of iran’s pervasive frosts. Climate 2016, 4, 41. [Google Scholar] [CrossRef]
- Rousta, I.; Karampour, M.; Doostkamian, M.; Olafsson, H.; Zhang, H.; Mushore, T.D.; Karimvandi, A.S.; Vargas, E.R.M. Synoptic-dynamic analysis of extreme precipitation in Karoun River Basin, Iran. Arab. J. Geosci. 2020, 13, 1–16. [Google Scholar] [CrossRef]
- Zhu, X.; Xu, Z.; Liu, Z.; Liu, M.; Yin, Z.; Yin, L.; Zheng, W. Impact of dam construction on precipitation: A regional perspective. Mar. Freshw. Res. 2022, 16, 104043. [Google Scholar] [CrossRef]
- Yao, L.; Shen, J.; Zhang, F.; Gu, X.; Jiang, S. Influence of environmental values on the typhoon risk perceptions of high school students: A case study in Ningbo, China. Sustainability 2021, 13, 4145. [Google Scholar] [CrossRef]
- Olafsson, H.; Rousta, I. Influence of atmospheric patterns and North Atlantic Oscillation (NAO) on vegetation dynamics in Iceland using Remote Sensing. Eur. J. Remote Sens. 2021, 54, 351–363. [Google Scholar] [CrossRef]
- Jain, P.; Flannigan, M. The relationship between the polar jet stream and extreme wildfire events in North America. J. Clim. 2021, 34, 6247–6265. [Google Scholar] [CrossRef]
- Reiter, E.R.; Whitney, L.F. Interaction between subtropical and polar-front jet stream. Mon. Weather Rev. 1969, 97, 432–438. [Google Scholar] [CrossRef]
- Handlos, Z.J.; Martin, J.E. Composite analysis of large-scale environments conducive to western Pacific polar/subtropical jet superposition. J. Clim. 2016, 29, 7145–7165. [Google Scholar] [CrossRef]
- Rousta, I.; Nasserzadeh, M.H.; Jalali, M.; Haghighi, E.; Ólafsson, H.; Ashrafi, S.; Doostkamian, M.; Ghasemi, A. Decadal spatial-temporal variations in the spatial pattern of anomalies of extreme precipitation thresholds (Case Study: Northwest Iran). Atmosphere 2017, 8, 135. [Google Scholar] [CrossRef]
- Rousta, I.; Doostkamian, M.; Taherian, A.M.; Haghighi, E.; Ghafarian Malamiri, H.R.; Ólafsson, H. Investigation of the spatio-temporal variations in atmosphere thickness pattern of Iran and the Middle East with special focus on precipitation in Iran. Climate 2017, 5, 82. [Google Scholar] [CrossRef]
- Li, Q.; Song, D.; Yuan, C.; Nie, W. An image recognition method for the deformation area of open-pit rock slopes under variable rainfall. Measurement 2022, 188, 110544. [Google Scholar] [CrossRef]
- Kuang, X.; Zhang, Y. Seasonal variation of the East Asian subtropical westerly jet and its association with the heating field over East Asia. Adv. Atmos. Sci. 2005, 22, 831–840. [Google Scholar]
- Schiemann, R.; Lüthi, D.; Schär, C. Seasonality and interannual variability of the westerly jet in the Tibetan Plateau region. J. Clim. 2009, 22, 2940–2957. [Google Scholar] [CrossRef]
- Gong, T.; Feldstein, S.B.; Luo, D. The impact of ENSO on wave breaking and southern annular mode events. J. Atmos. Sci. 2010, 67, 2854–2870. [Google Scholar] [CrossRef]
- Fu, Q.; Lin, P. Poleward shift of subtropical jets inferred from satellite-observed lower-stratospheric temperatures. J. Clim. 2011, 24, 5597–5603. [Google Scholar] [CrossRef]
- Eltantawy, A. Jet stream clouds in the Middle East. Geofis. Appl. 1960, 46, 352–359. [Google Scholar] [CrossRef]
- Grover, E.K.; Sousounis, P.J. The influence of large-scale flow on fall precipitation systems in the Great Lakes Basin. J. Clim. 2002, 15, 1943–1956. [Google Scholar] [CrossRef]
- Xie, Z.; Du, Y.; Yang, S. Zonal extension and retraction of the subtropical westerly jet stream and evolution of precipitation over East Asia and the western Pacific. J. Clim. 2015, 28, 6783–6798. [Google Scholar] [CrossRef]
- Luo, X.; Zhang, Y. The linkage between upper-level jet streams over East Asia and East Asian winter monsoon variability. J. Clim. 2015, 28, 9013–9028. [Google Scholar] [CrossRef]
- Leroux, S.; Hall, N.M. On the relationship between African easterly waves and the African easterly jet. J. Atmos. Sci. 2009, 66, 2303–2316. [Google Scholar] [CrossRef]
- Seager, R.; Harnik, N.; Robinson, W.; Kushnir, Y.; Ting, M.; Huang, H.P.; Velez, J. Mechanisms of ENSO-forcing of hemispherically symmetric precipitation variability. Q. J. R. Meteorol. Soc. A J. Atmos. Sci. Appl. Meteorol. Phys. Oceanogr. 2005, 131, 1501–1527. [Google Scholar] [CrossRef]
- Rodionov, S.; Assel, R. A new look at the Pacific/North American index. Geophys. Res. Lett. 2001, 28, 1519–1522. [Google Scholar] [CrossRef]
- Prezerakos, N.; Flocas, H.; Brikas, D. The role of the interaction between polar and subtropical jet in a case of depression rejuvenation over the Eastern Mediterranean. Meteorol. Atmos. Phys. 2006, 92, 139–151. [Google Scholar] [CrossRef]
- Masoodian, S.; Mohammadi, B. Analysis of jet stream frequencies associated with super heavy rainfalls of Iran. Iran-Water Resour. Res. 2011, 7, 80–91. [Google Scholar]
- Wang, Y.; Hu, K.; Huang, G.; Tao, W. Asymmetric impacts of El Niño and La Niña on the Pacific–North American teleconnection pattern: The role of subtropical jet stream. Environ. Res. Lett. 2021, 16, 114040. [Google Scholar] [CrossRef]
- Du, Y.; Chen, G. Climatology of low-level jets and their impact on rainfall over southern China during the early-summer rainy season. J. Clim. 2019, 32, 8813–8833. [Google Scholar] [CrossRef]
- Fu, P.; Zhu, K.; Zhao, K.; Zhou, B.; Xue, M. Role of the nocturnal low-level jet in the formation of the morning precipitation peak over the Dabie Mountains. Adv. Atmos. Sci. 2019, 36, 15–28. [Google Scholar] [CrossRef]
- Liu, Y.; Zhang, K.; Li, Z.; Liu, Z.; Wang, J.; Huang, P. A hybrid runoff generation modelling framework based on spatial combination of three runoff generation schemes for semi-humid and semi-arid watersheds. J. Hydrol. 2020, 590, 125440. [Google Scholar] [CrossRef]
- Huang, Y.; Bárdossy, A.; Zhang, K. Sensitivity of hydrological models to temporal<? xmltex\break?> and spatial resolutions of rainfall data. Hydrol. Earth Syst. Sci. 2019, 23, 2647–2663. [Google Scholar]
- Wang, G.; Zhao, B.; Lan, R.; Liu, D.; Wu, B.; Li, Y.; Li, Q.; Zhou, H.; Liu, M.; Liu, W. Experimental study on failure model of tailing dam overtopping under heavy rainfall. Lithosphere 2022, 2022, 5922501. [Google Scholar] [CrossRef]
- Park, C.; Son, S.-W.; Kim, H.; Ham, Y.-G.; Kim, J.; Cha, D.-H.; Chang, E.-C.; Lee, G.; Kug, J.-S.; Lee, W.-S. Record-breaking summer rainfall in South Korea in 2020: Synoptic characteristics and the role of large-scale circulations. Mon. Weather Rev. 2021, 149, 3085–3100. [Google Scholar] [CrossRef]
- Araki, K.; Kato, T.; Hirockawa, Y.; Mashiko, W. Characteristics of atmospheric environments of quasi-stationary convective bands in Kyushu, Japan during the July 2020 heavy rainfall event. SOLA 2021, 17, 8–15. [Google Scholar] [CrossRef]
- Zhang, W.; Huang, Z.; Jiang, F.; Stuecker, M.F.; Chen, G.; Jin, F.F. Exceptionally persistent Madden-Julian Oscillation activity contributes to the extreme 2020 East Asian summer monsoon rainfall. Geophys. Res. Lett. 2021, 48, e2020GL091588. [Google Scholar] [CrossRef]
- Zhou, Z.-Q.; Xie, S.-P.; Zhang, R. Historic Yangtze flooding of 2020 tied to extreme Indian Ocean conditions. Proc. Natl. Acad. Sci. USA 2021, 118, e2022255118. [Google Scholar] [CrossRef] [PubMed]
- Horinouchi, T.; Kosaka, Y.; Nakamigawa, H.; Nakamura, H.; Fujikawa, N.; Takayabu, Y.N. Moisture supply, jet, and Silk-Road wave train associated with the prolonged heavy rainfall in Kyushu, Japan in early July 2020. Sola 2022, 2022, 5922501. [Google Scholar] [CrossRef]
- Saligheh, M. The Effect of Merging Subtropical Jet Stream and Polar Fronts Jet Stream on Heavy Rainfall in Southwest Asia (Version 1). Res. Sq. 2021. preprint. [Google Scholar] [CrossRef]
- Rao, X.; Zhao, K.; Chen, X.; Huang, A.; Xue, M.; Zhang, Q.; Wang, M. Influence of synoptic pattern and low-level wind speed on intensity and diurnal variations of orographic convection in summer over Pearl River Delta, South China. J. Geophys. Res. Atmos. 2019, 124, 6157–6179. [Google Scholar] [CrossRef]
- Chen, X.; Zhang, F.; Zhao, K. Influence of monsoonal wind speed and moisture content on intensity and diurnal variations of the mei-yu season coastal rainfall over south China. J. Atmos. Sci. 2017, 74, 2835–2856. [Google Scholar] [CrossRef]
- Zhang, K.; Ali, A.; Antonarakis, A.; Moghaddam, M.; Saatchi, S.; Tabatabaeenejad, A.; Chen, R.; Jaruwatanadilok, S.; Cuenca, R.; Crow, W.T. The sensitivity of North American terrestrial carbon fluxes to spatial and temporal variation in soil moisture: An analysis using radar-derived estimates of root-zone soil moisture. J. Geophys. Res. Biogeosci. 2019, 124, 3208–3231. [Google Scholar] [CrossRef]
- Yue, Z.; Zhou, W.; Li, T. Impact of the Indian Ocean dipole on evolution of the subsequent ENSO: Relative roles of dynamic and thermodynamic processes. J. Clim. 2021, 34, 3591–3607. [Google Scholar] [CrossRef]
- Quan, Q.; Liang, W.; Yan, D.; Lei, J. Influences of joint action of natural and social factors on atmospheric process of hydrological cycle in Inner Mongolia, China. Urban Clim. 2022, 41, 101043. [Google Scholar] [CrossRef]
- Huo, W.; Li, Z.; Wang, J.; Yao, C.; Zhang, K.; Huang, Y. Multiple hydrological models comparison and an improved Bayesian model averaging approach for ensemble prediction over semi-humid regions. Stoch. Environ. Res. Risk Assess. 2019, 33, 217–238. [Google Scholar] [CrossRef]
- Tu, C.-C.; Chen, Y.-L.; Lin, P.-L.; Du, Y. Characteristics of the marine boundary layer jet over the South China Sea during the early summer rainy season of Taiwan. Mon. Weather Rev. 2019, 147, 457–475. [Google Scholar] [CrossRef]
- SaeedAbadi, R.; Abkharabat, S.; Najafi, M.S. An Analysis of polar Jest Stream (PJS) location Associated with Low Level Moisture Flux and Heavy Rainfalls in West of Iran. J. Environ. Stud. 2016, 41, 783–798. [Google Scholar]
- Kaviani, M.R.; Alijani, B. Principles of Climatology; SAMT Press: Tehran, Iran, 2001; Volume 1, p. 592. [Google Scholar]
Disclaimer/Publisher’s Note: The statements, opinions and data contained in all publications are solely those of the individual author(s) and contributor(s) and not of MDPI and/or the editor(s). MDPI and/or the editor(s) disclaim responsibility for any injury to people or property resulting from any ideas, methods, instructions or products referred to in the content. |
© 2023 by the authors. Licensee MDPI, Basel, Switzerland. This article is an open access article distributed under the terms and conditions of the Creative Commons Attribution (CC BY) license (https://creativecommons.org/licenses/by/4.0/).