Article

Spatiotemporal Variations in PM2.5 Concentration in Different Areas of Bus Cabin: A Case Study in Shenzhen, China

1
School of Architecture and Urban Planning, Shenzhen University, Shenzhen 518060, China
2
Guangdong Key Laboratory of Urban Informatics, Research Institute for Smart Cities, Shenzhen University, 3688 Nanhai Avenue, Shenzhen 518060, China
*
Author to whom correspondence should be addressed.
Atmosphere 2023, 14(2), 326; https://doi.org/10.3390/atmos14020326
Submission received: 20 November 2022 / Revised: 27 January 2023 / Accepted: 3 February 2023 / Published: 6 February 2023

Abstract

:
Inhalable particulate pollution has adverse effects on human health. Many studies have been conducted to investigate levels and risks of exposure to particulate pollution in public transit, but scant attention has been paid to variations in the pollution levels among different positions inside the cabin. Differences can be observed among different positions inside transit vehicles, like passenger density and activities, which may lead to differentiated exposure risks between different positions. Therefore, this study investigates the level of PM2.5 concentrations and the spatiotemporal variations among three different positions (front, middle, and rear) inside the cabin during bus travel. The three positions represent the three areas inside the bus cabin, i.e., front area (FA), middle area (MA), and rear area (RA). We developed a portable monitoring system for in-cabin measurements, which consists of a mobile device with the designated app, a PM2.5 collecting device, and a temperature-relative humidity monitor. Surveys were carried out on buses of a route in Shenzhen, China, which include inbound and outbound trips during both morning and evening peaks of two working days. Based on spatial and temporal information embedded in data collection devices, PM2.5 concentration data were spatially and temporally referenced. Comparative and descriptive statistical analyses were employed to examine the differences and variations in PM2.5 concentration among the areas inside the bus cabin. There are three major findings. First, for all of the surveyed trips, FA showed the highest and RA showed the lowest PM2.5 concentration. Second, concerning the average pollution level of route segments along the routes, the PM2.5 concentrations in the three cabin areas were higher during inbound trips than during outbound trips. Third, within route segments, PM2.5 concentrations in FA and MA increased rapidly after the bus stopped at stops, and then gradually decreased, while in RA they were relatively stable. In general, a higher level of passenger density increased in-cabin PM2.5 concentration. The findings of our study could provide insight into improving the bus in-cabin microenvironment, such as the seating arrangement for vulnerable passengers.

1. Introduction

Expanding public transport is a sustainable development goal, which should be achieved by 2030 to make cities and human settlements inclusive, resilient, and sustainable [1]. Public buses are a crucial mode of commuting for most citizens in many countries and regions [2,3,4]. However, the duration of bus trips has increased with the expansion of urban built-up areas and the increase in car ownership [5,6]. Although more attention has been paid to optimizing the public bus system, the in-cabin travel environment, where commuters spend the most time, has not improved significantly [7]. This environment is easily affected by the particulate matter pollution of the one-road environment, ascribed to most buses running on busy roads with high traffic volumes. Such factors contribute to a concentrated emission of exhaust gas, indoor–outdoor air exchange caused by high passenger density, and frequent boarding and alighting activities [2,8,9,10].
Particulate matter with particle sizes less than 2.5 µm (PM2.5) are an important component of air pollutants and are the primary pollutant of road traffic in many Chinese cities [11]. Commuters on buses face a high risk of exposure to PM2.5 [12,13,14]. Along with passenger activities (e.g., boarding and alighting) and indoor–outdoor air exchange, PM2.5 can easily enter passenger cabins and be inhaled by passengers [8,15,16]. At the same time, passengers themselves (e.g., skin, hair, clothing, etc.) are important sources of pollutant emissions inside the cabin, and the emission rate is positively correlated with the intensity of human activity [17,18,19]. Inhaling PM2.5 could increase the risk of respiratory and cardiovascular diseases and lung cancer for daily commuters [20,21,22], particularly when the exposure levels exceed the ambient annual PM2.5 standard of 15 μg/m3 for a 24 h average concentration [23]. Accordingly, PM2.5 pollution inside bus cabins needs to be investigated.
Over the past decade, fine particulate pollution in transport microenvironments (TMEs) has been investigated widely. Previous research mainly comprised analyzing the composition and source of particulate matter in the fields of chemistry and environmental science disciplines [24,25,26,27]; identifying influencing factors (e.g., cabin temperature and humidity, passenger density, ventilation system, vehicle fuel, air quality) of particulate matter concentrations related to different travel modes [12,28,29,30,31]; assessing the pollution risk to the population based on the physiological characteristics of the human body [24,32,33]; and employing computational fluid dynamics theory and technology to dynamically simulate the diffusion and distribution of particulate matter for precise positioning and tracking [3,16,34]. Measurements are mostly conducted using a portable particulate matter monitor carried by the investigators [28,35,36,37].
Existing research mainly focuses on the average pollution level in transit and measures the particle concentration at one position (usually in the middle of the passenger cabin) to represent the concentration of the entire cabin [10,38]. However, in these studies, the spatiotemporal variations in the PM2.5 concentration inside a cabin during the trip were not considered. Scant attention was given to the variations in particle concentrations among different areas inside the cabin, although this factor is related closely to the accurate assessment of the exposure risk to PM2.5. Accordingly, considering this aspect could contribute to improving the in-cabin environment and interior design, particularly for vulnerable passengers [39].
Within this context, the objective of this study was to explore the spatiotemporal variations in PM2.5 concentration in different areas (i.e., front, middle, and rear) of bus cabins in transit. Three research questions will be answered: (1) What is the difference in the level of PM2.5 concentration among the front, middle, and rear areas in bus transit? (2) How does the level of PM2.5 concentration measured in each area vary spatially across route segments? (3) How does the level of PM2.5 concentration measured in each area vary temporally during the periods when the bus is running and stopping?
Our study was conducted on a public bus in Shenzhen, China. The study findings could provide insight for improvements to the in-cabin microenvironment of public buses.

2. Materials and Methods

2.1. Study Area and Route

Shenzhen is a megacity located in southern China, with a dense population and, therefore, experiences high demand for public transportation. As a showcase of ‘the National Transit Metropolis’, Shenzhen is committed to providing an advanced public transportation system and has provided 10 metro lines and more than 900 fixed-route bus lines. Currently, the public transport mode share of motorized trips in Shenzhen is 62.6% during rush hours, implying that public transportation plays a key role in the daily travel of residents.
The PM2.5 concentration in Shenzhen has a characteristic of seasonal variation, which is the highest in winter, followed by spring and autumn, and the lowest in summer. In terms of the influence of urban meteorology, rainfall, temperature, and relative humidity are negatively correlated with urban environmental concentration, while the northerly wind had a positive correlation.
This study was conducted on a bus line in the city. As shown in Figure 1a, Bus Line 101 runs through the city center from east to west, with a total length of 34.8 km and 40 stops. The route between the bus stop at Shenzhen University (SU) and the bus stop at Guangxia (GX) was selected for the in-cabin survey, considering that this route is through the central locations of the Nanshan and Futian districts and features a high ridership, particularly during rush hour. Both inbound and outbound trips were included in the cabin surveys. The stop identifications of the selected route section are numbered sequentially along the inbound direction, where stop SU is assigned S1 and stop GX is assigned S19, as shown in Figure 1b. In the outbound direction, the bus does not stop at stop S18, as it does not exist in that direction. Therefore, there are 18 route segments for inbound trips and 17 route segments for outbound trips, with the first 16 segments being the same in both directions.

2.2. Experimental Design

The field survey was conducted during the morning and evening rush hours (starting from 08:00 and 18:00 h local time). There is higher passenger density inside the cabin during rush hours than off-peak hours, which is meaningful for identifying the issues of the in-transit environment, especially in our case study city that shows crowds of passengers in rush hours and very low ridership in off-peak hours. A portable monitoring system was designed to collect PM2.5 concentrations and information on in-cabin travel environments during the trip. Each investigator carried a portable monitoring system and took a round trip (lasting approximately 100 min) between the SU and GX stops. Therefore, a survey day comprised four trips, namely the inbound trip in the morning (IT-M), the outbound trip in the morning (OT-M), the inbound trip in the evening (IT-E), and the outbound trip in the evening (OT-E).
To reflect the particulate matter concentration outside the passenger cabin, we collected the relevant data from two aspects, namely (1) urban background PM2.5 concentrations measured by a fixed urban Air Quality Monitoring Station (AQS) and we selected the data on PM2.5 concentrations measured by the Overseas Chinese Town (OCT) AQS, which is located close to the survey route (Figure 1b). Hourly concentration data of OCT AQS was obtained from the official website of local environment bureau [40]. Additionally, (2) Investigators measured the PM2.5 concentration while waiting for the bus at the bus platforms of stops SU and GX.
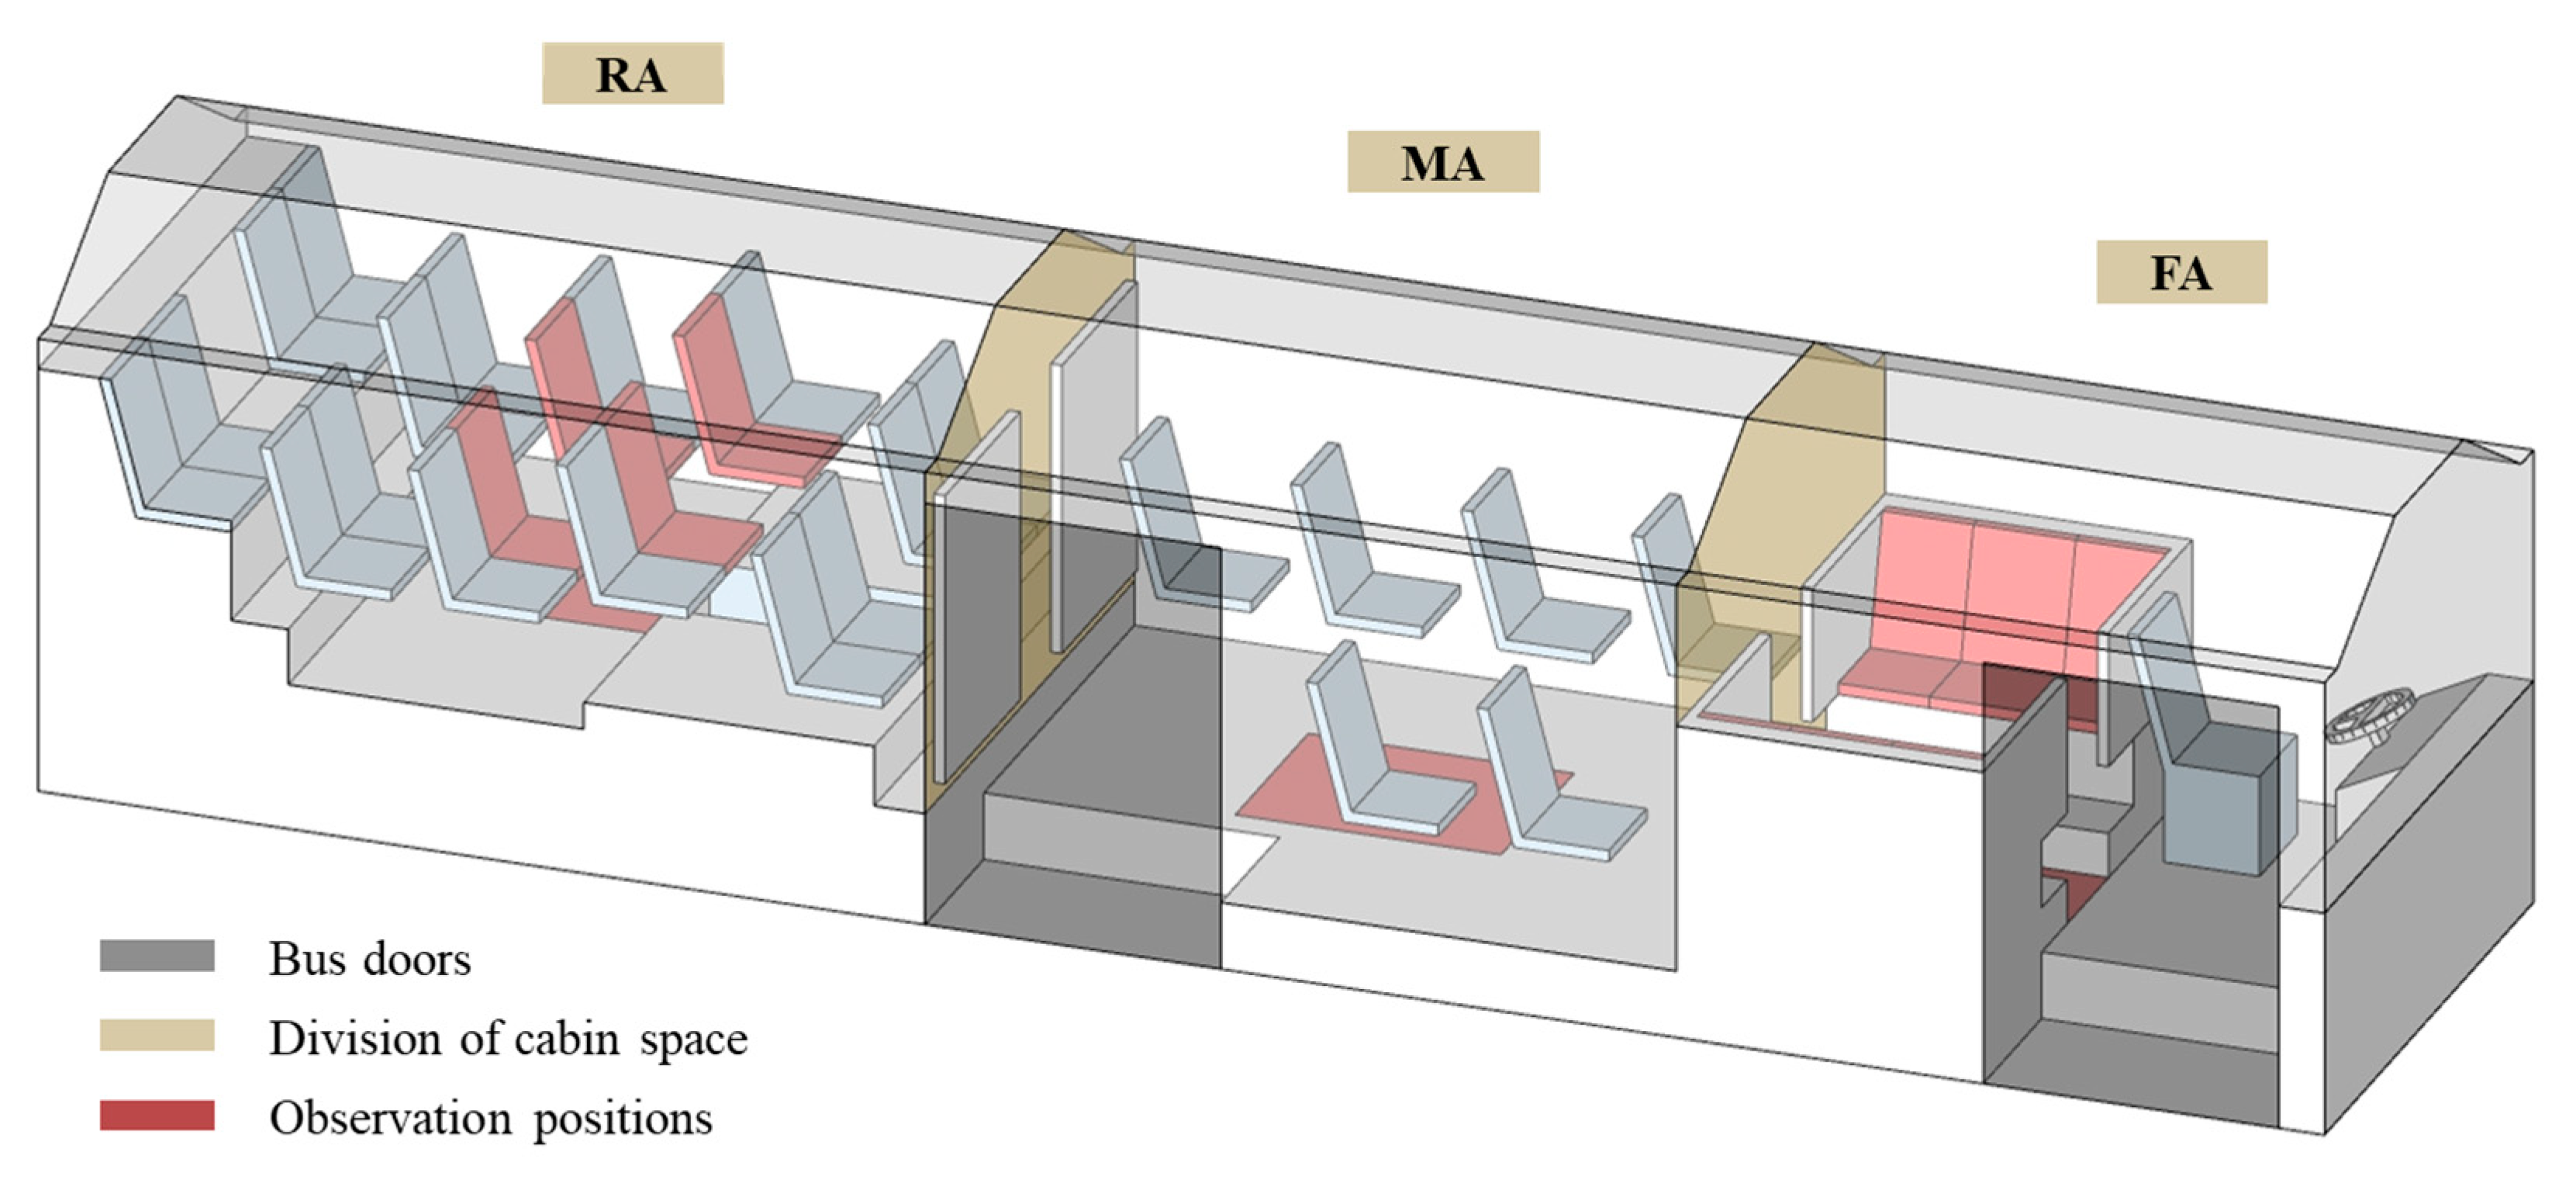
Figure 2 shows the structure of the bus cabin, and the bus model is based on BYDK8, which is the major bus type in Shenzhen. The bus has front and rear doors for passengers to alight and board. The entire cabin is divided into three areas, namely the front area (FA), middle area (MA), and rear area (RA). MA is more spacious and has fewer seats, implying that more passengers will stand there. Both FA and MA have a door, and passengers must pass through FA/MA when boarding or alighting. RA has 20 seats, and passengers could stand in the corridor during rush hours. The relative central position in each area was selected as the measurement position (shown in Figure 2). During data collection, three investigators were designated to stand or sit (depending on the availability of seats) at the respective measurement positions to simultaneously perform in-cabin measurements. In the following analysis, the PM2.5 concentration measured at each position represents the PM2.5 concentration in each respective area.

2.3. In-Cabin Measurements

A portable monitoring system was employed to conduct in-cabin measurements of the PM2.5 concentration and collect travel environment data. The system comprises a portable particulate matter monitor (DustTrak DRX8534, TSI Incorporated, Shoreview, MN, USA), a mobile phone (Android system), and a temperature–relative humidity monitor (Elitech RC-4HA). The portable particulate matter monitor was used to continuously measure PM2.5. The mobile phone was loaded with a specifically designed application to record the in-cabin environment. A temperature–relative humidity monitor was used to observe the temperature and relative humidity conditions and ensure that the aerosol monitor was working in a suitable environment.
The monitor, DustTrak DRX 8534, is used widely for particulate matter research in transport microenvironments. The PM2.5 concentration is measured and recorded automatically and continuously [41]. The sampling flow rate of the instrument was 3.0 L min−1, and the range was 0.001–150 mg m−3. The sampling interval was set to 5 s, i.e., the average concentration measured over the past 5 s, and the photometric calibration system was set to 0.38. Before each operation, the instrument was calibrated to zero to ensure the accuracy of the observed values.
Elitech RC-4HA is a high-precision temperature and humidity monitor, which is suitable for environments with temperatures between −30 °C~+60 °C and relative humidity between 0~99% RH. Its temperature measurement accuracy is ±0.5 °C and its relative humidity measurement accuracy is ±5%, which has been certified by the US FDA and GSP. During in-cabin measurements, the sampling interval of the monitor was set to 60 s.
The mobile application was specifically designed to acquire the in-cabin travel information around the observed positions. Information (Fields) to be logged is shown in Table 1. These fields were observed and logged by investigators, and the timestamp was generated and recorded by phone automatically.
As shown in Figure 1b, a bus route comprises bus stops and route segments; therefore, each route segment (e.g., a segment between stops Si and Si + 1, as shown in Figure 3) comprises two stages, namely running and stopping. As Figure 3 shows, the running stage refers to the period between timestamps Ti,C (i.e., when the doors are shut and the bus prepares to leave bus stop platform Si) and timestamps Ti + 1,O (i.e., when the bus arrives at the platform of bus stop Si + 1 and before the doors are opened). A stopping stage refers to the period during which the bus stops at the platform, the doors are opened, and passengers board or alight. The spatiotemporal data recorded by investigators employing the mobile phone application were used to divide the trips in terms of route segments and two stages.
Before each measurement, time calibration was carried out on the particulate matter monitors and the temperature–relative humidity monitors, to ensure temporal consistency with the mobile phones. The particulate matter monitor was fixed in a backpack, with the nozzle of the rubber suction tube of the instrument extending outside the bag to collect the particulate matter concentration in the air. The temperature–relative humidity monitor was hung outside the backpack to ensure that it was directly exposed to air. The investigators carried the backpacks on their chests during field surveys to ensure the stability of the instrument and check the working status. Posture stability was required during the whole measurement process.

2.4. Data Preprocessing

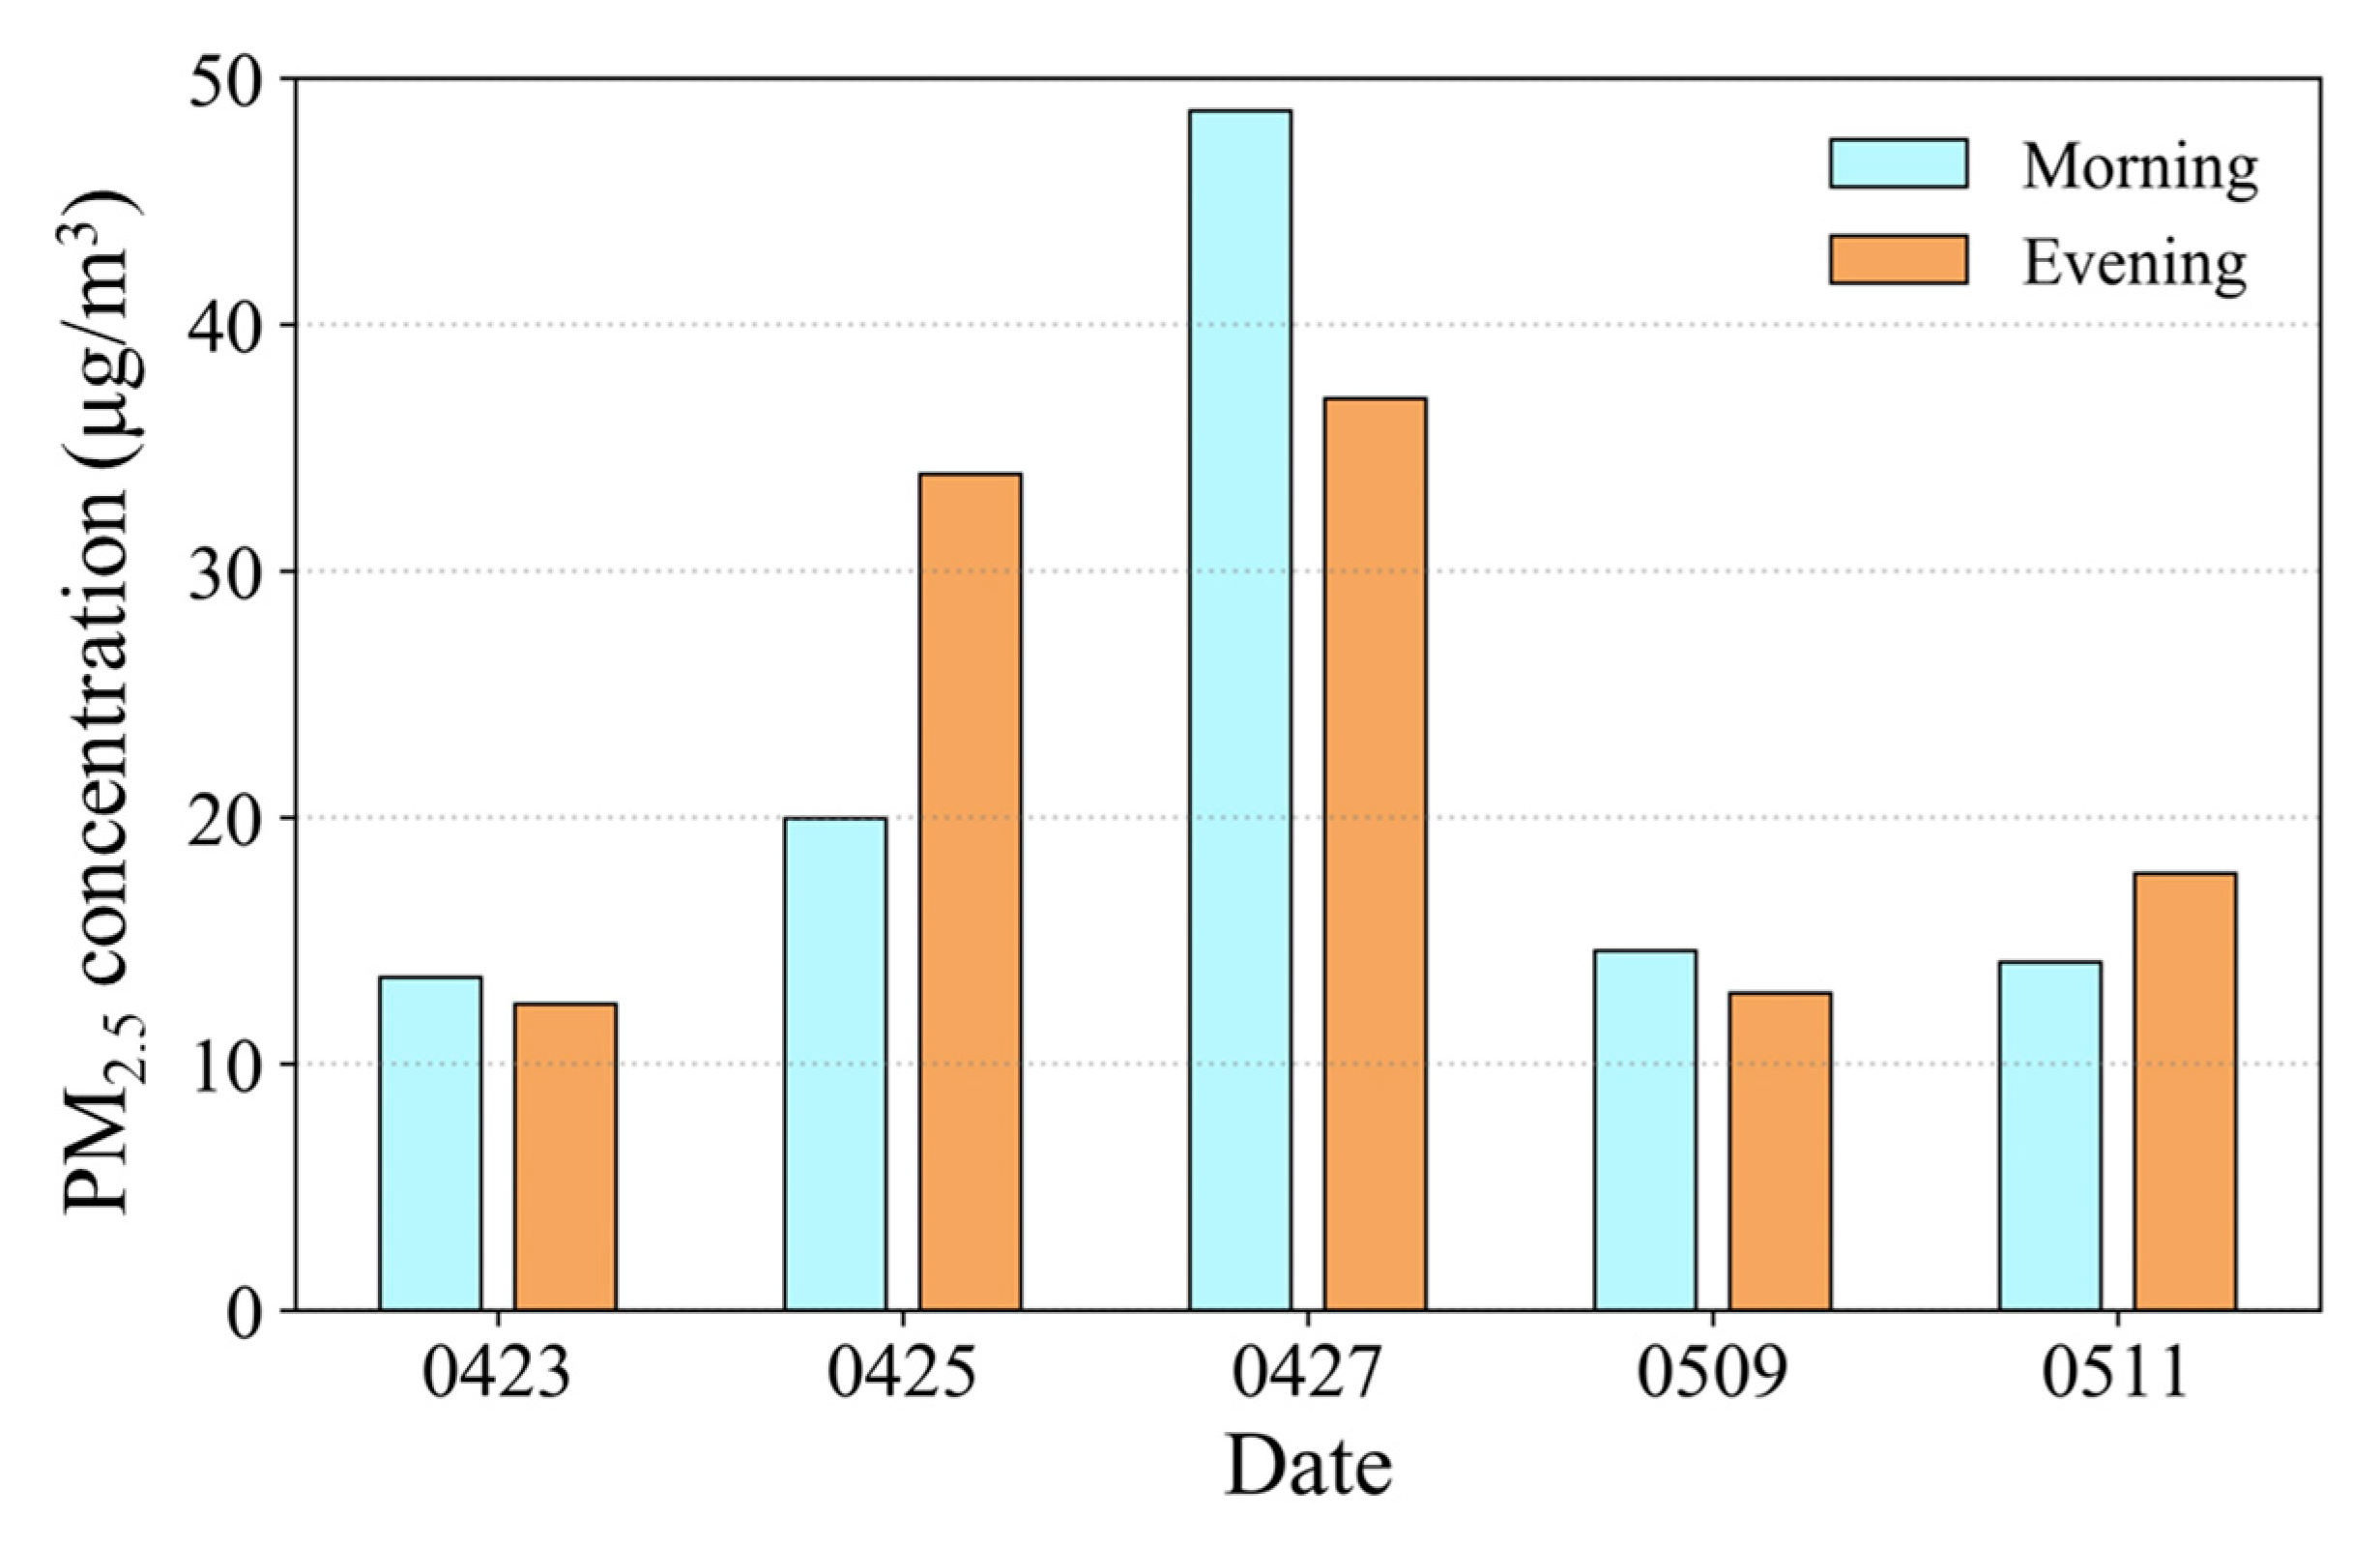
We had five days of observations, but three days of data did not match the requirements of the survey (i.e., investigators were not at designated observation positions) and research purpose. After examining the data obtained, eight sets of measurement data collected on two working days (i.e., 25 and 27 April 2018), were selected for analysis, with each data set corresponding to one trip. Compared with the other three days, the in-cabin PM2.5 concentrations on the 25th and 27th were higher and showed greater differences between the morning and the evening rush hours (Figure A1). Based on the spatiotemporal information embedded in the measurement data collected by the monitors and applications, we obtained integrated data of PM2.5 concentrations and respective travel conditions for each route segment, as well as each running and each stopping stage. For the division of the entire trip, we obtained 18 running stages and 17 stopping stages in the inbound direction and 17 running stages and 16 stopping stages in the outbound direction (refer to Figure 1 and Figure 3).
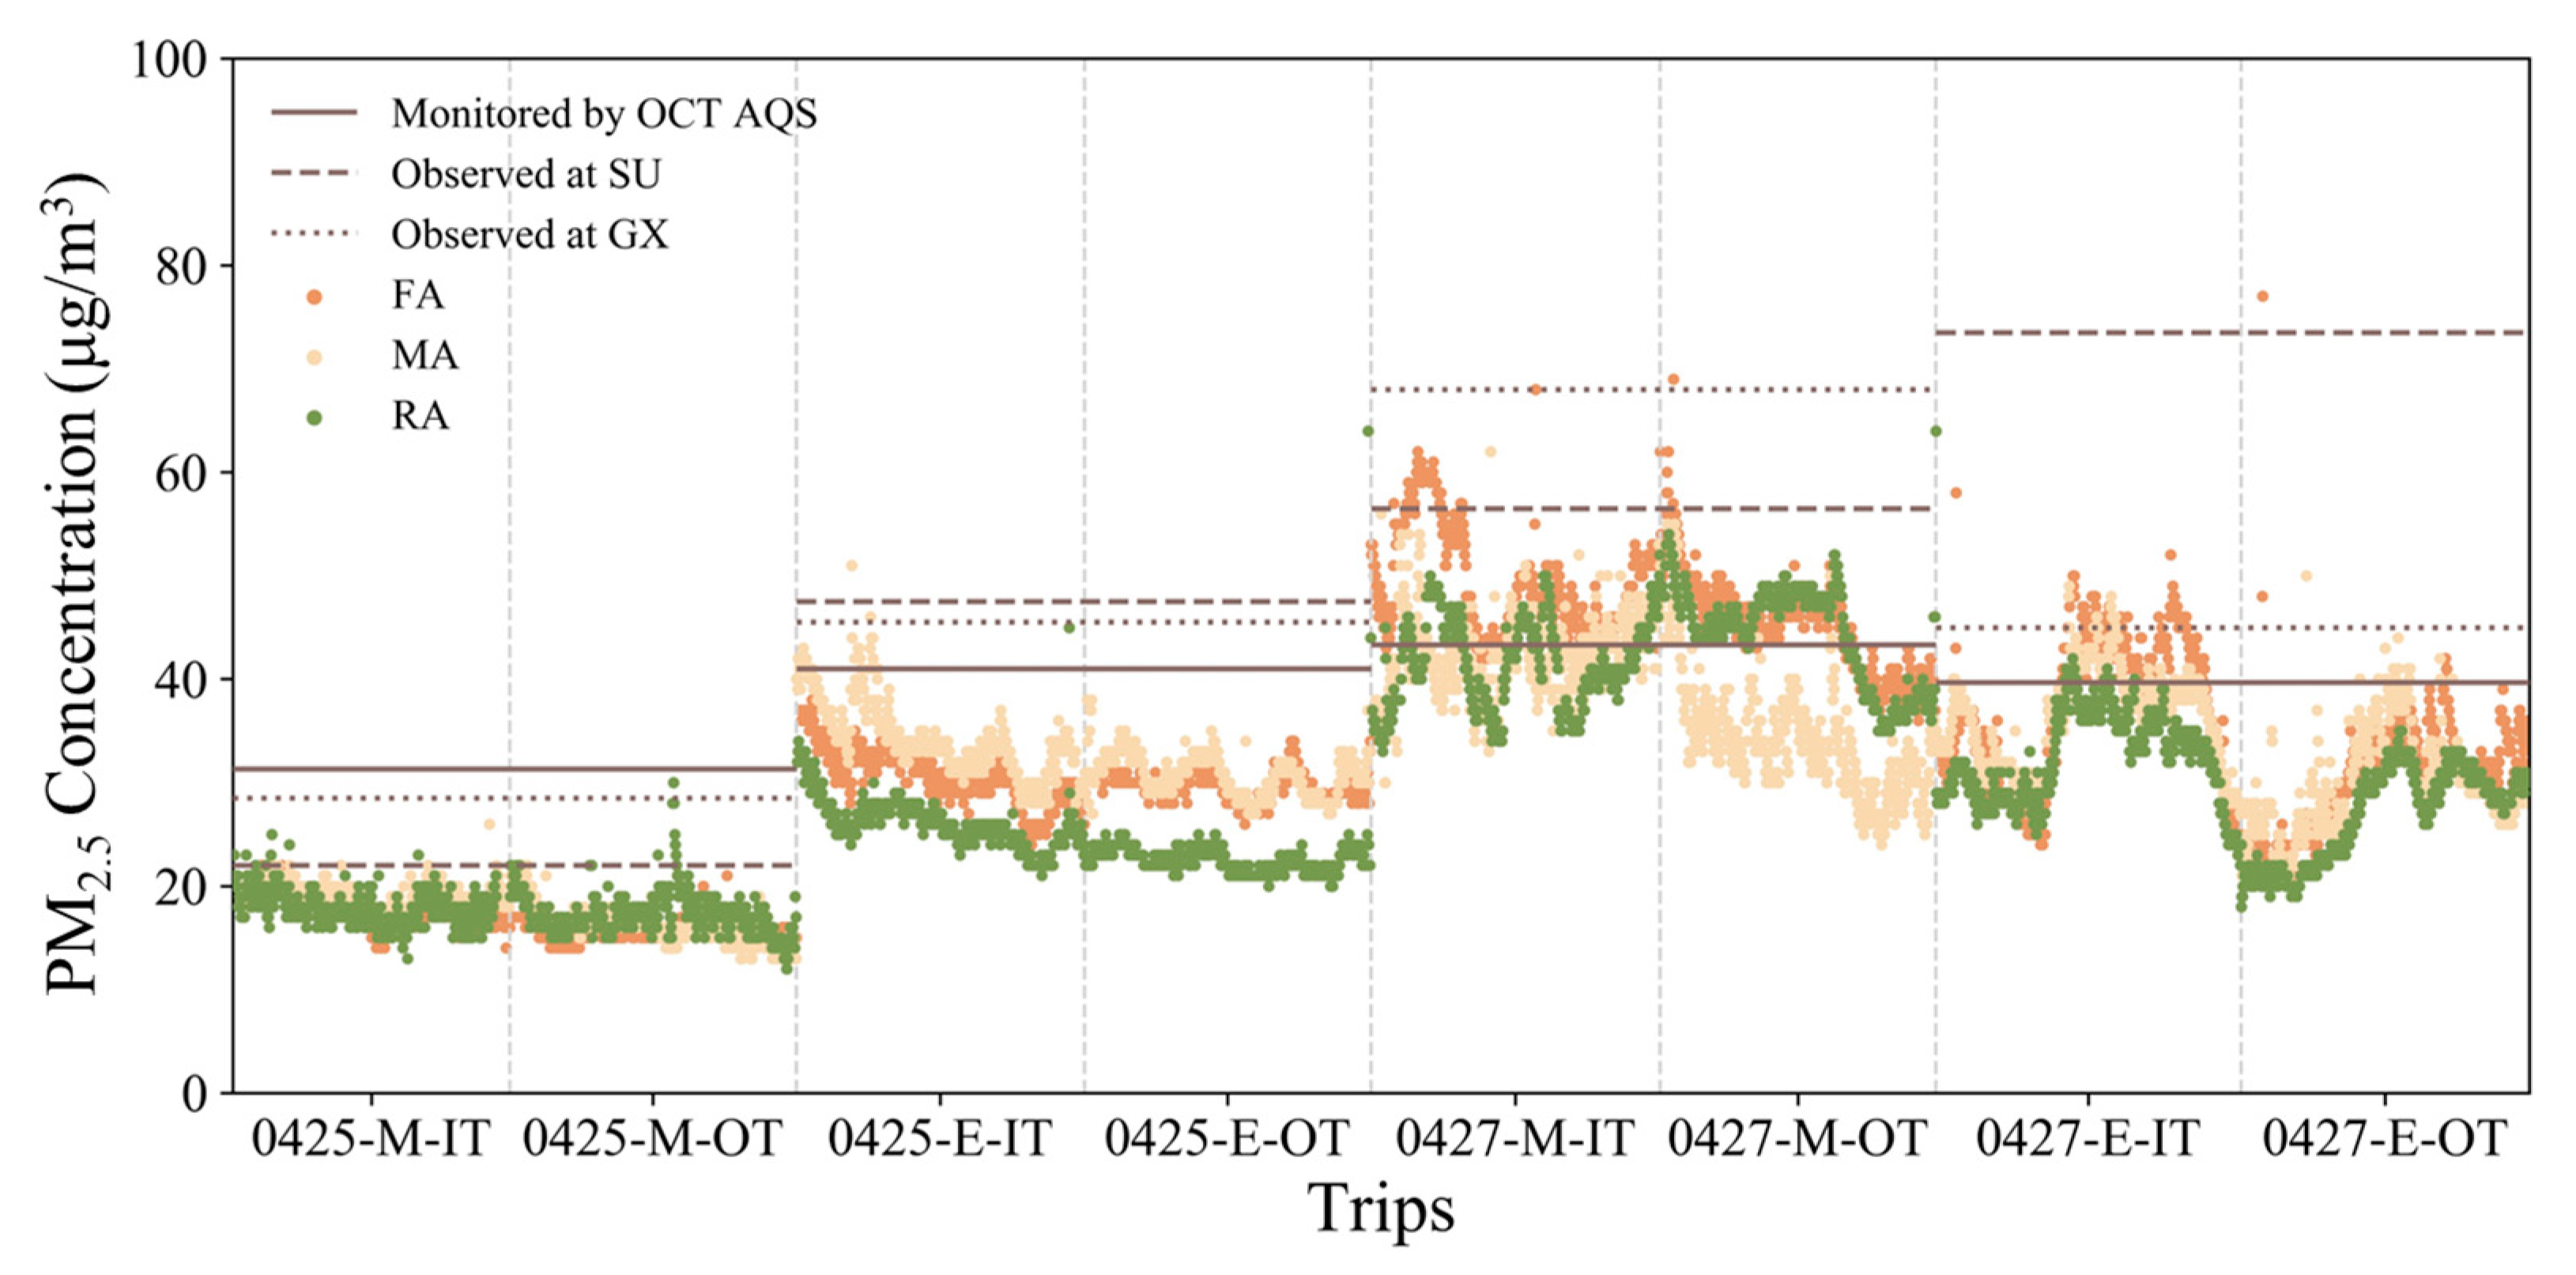
Figure 4 shows a comparison between the data of eight trips measured inside and outside the bus cabin. The data measured at bus platform SU represent the outdoor ambient environment, i.e., the average measured PM2.5 concentration before boarding the bus on the inbound trip and after alighting from the bus on the outbound trip. Similarly, the data measured at bus platform GX reflect the average PM2.5 concentration measured after alighting from the bus on the inbound trip and before boarding the bus on the outbound trip. Figure 4 indicates that the PM2.5 concentrations outside the cabin were higher than those inside. The variation in in-cabin PM2.5 concentration among the trips shows a similar trend to that of out-cabin PM2.5; the higher the out-cabin PM2.5, the higher the in-cabin PM2.5. In addition, the amplitude of in-cabin PM2.5 concentration was larger on the 27th.
Table 2 presents information on the in-cabin travel environment in FA, MA, and RA for each trip. For all trips, the average level of passenger density in three cabin areas was between level 2 and level 4. During the survey periods, the temperature ranged from 24℃ to 32 °C, and the humidity ranged from 63% to 76%. The temperature and humidity inside the cabin were comparable among the three areas, and the aerosol monitors functioned in a suitable environment. According to the app data logged by investigators, windows were closed, and air conditioning remained off during the trips.

2.5. Statistical Analyses

This study aimed to explore the spatiotemporal variations in PM2.5 concentration in the FA, MA, and RA of a bus cabin in transit. Our methodology comprised (1) exploring the differences in PM2.5 concentrations among FA, MA, and RA for entire trips; (2) exploring the spatial variations in PM2.5 concentrations measured at each area across route segments to determine how the PM2.5 concentrations measured in each area varied spatially along trip routes; and (3) exploring the temporal variations in PM2.5 concentrations measured in each area within route segments, to determine how the level of PM2.5 concentrations temporally varied during the stopping and running stages.
To compare the PM2.5 concentration among FA, MA, and RA for all trips, Wilcoxon signed-rank tests were employed to determine the statistically significant differences in the average PM2.5 concentration of the entire trip among the three cabin areas, given that the data did not follow a normal distribution. The statistical analysis was conducted using SPSS 22.0 software (IBM, Armonk, NY, USA).
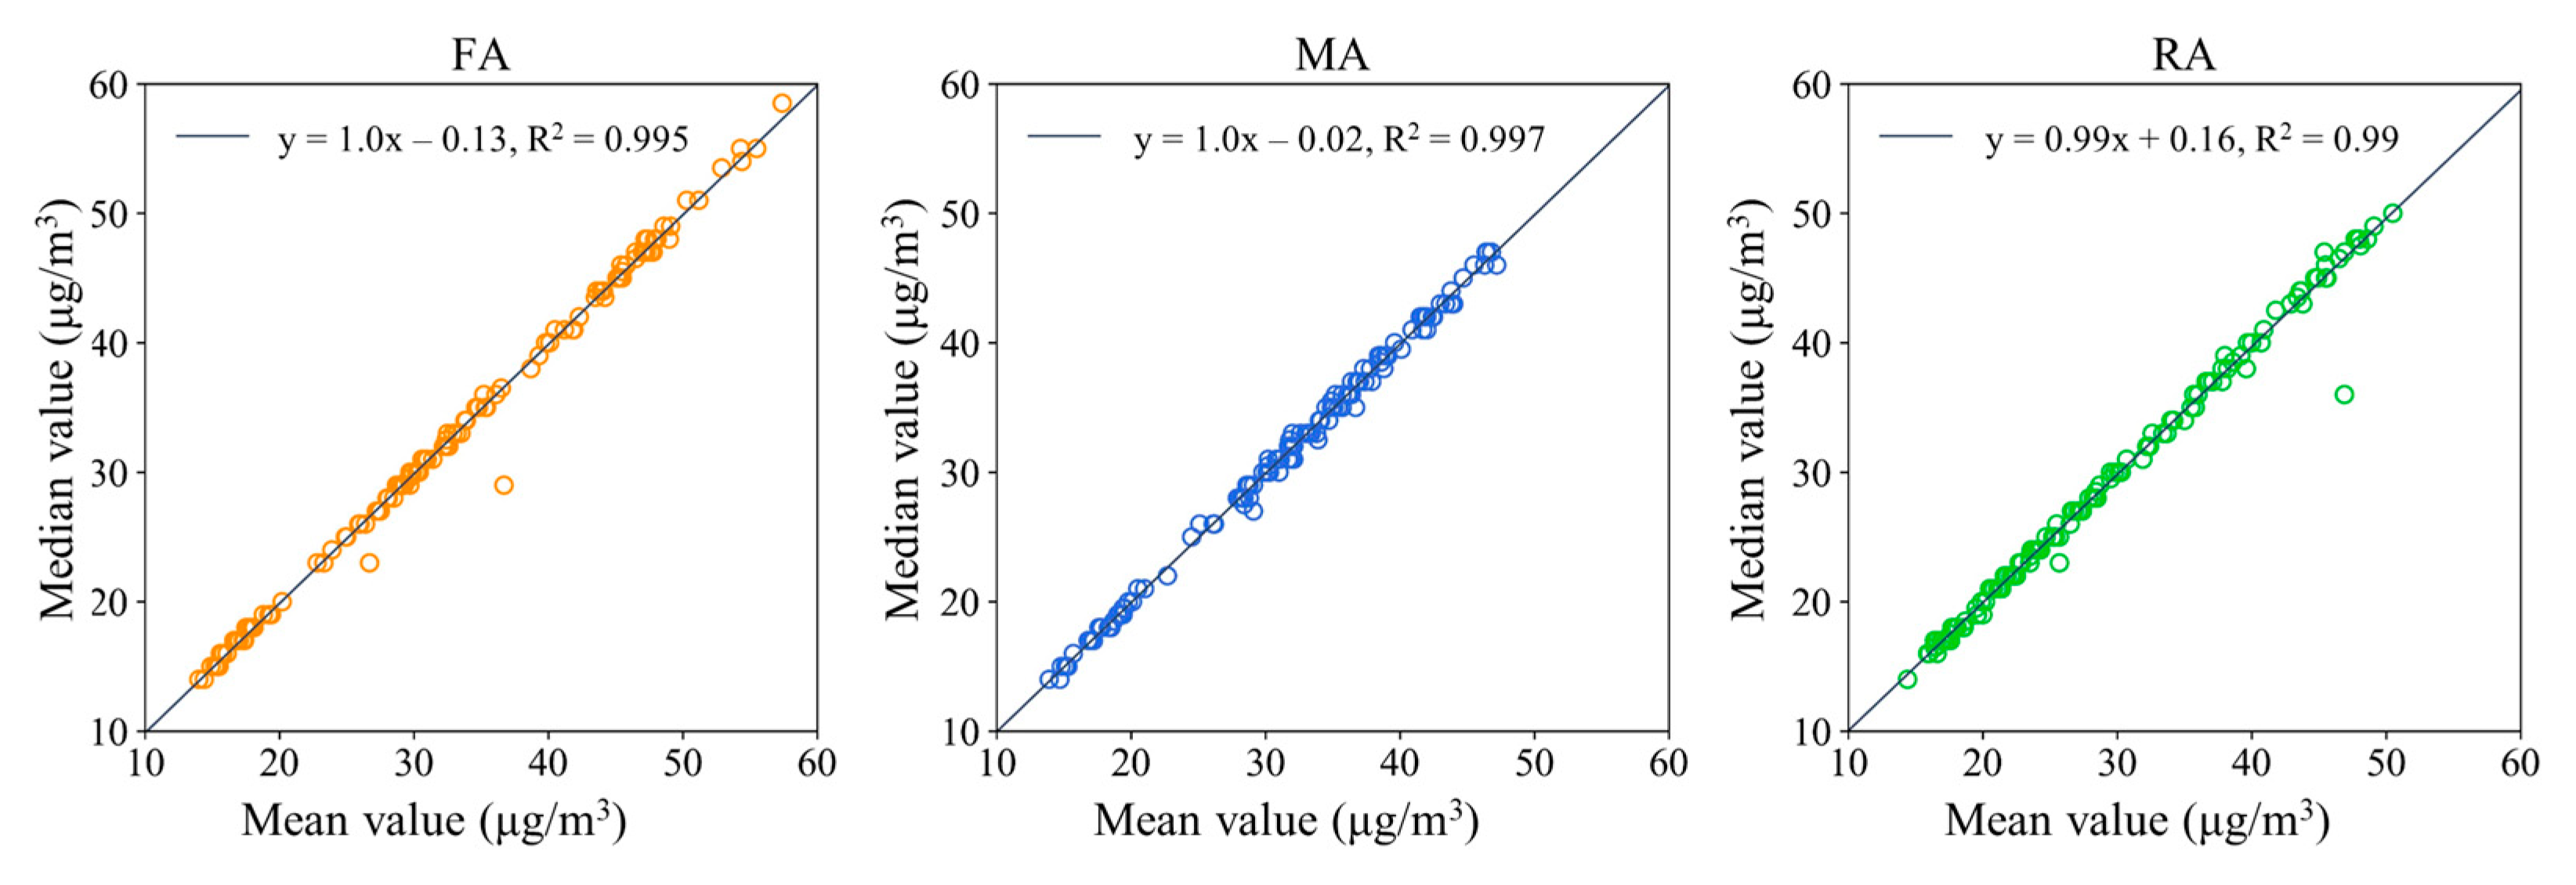
To examine the spatial variation in PM2.5 concentration across the route segments, we focused only on the running stage of each route segment because (1) FA and MA were more prone to be affected by the stopping stage than RA, and (2) the stopping stage was very short compared with the running stage. We computed and compared the median and arithmetic mean values of the PM2.5 concentrations measured at each running stage for each area (Figure A2) to identify the outliers. The results showed that the median and mean concentrations were comparable; therefore, the mean value was used for analysis. We separated the inbound trips from the outbound trips, considering that different numbers of route segments were generated for inbound and outbound trips (Figure 1), as explained in Section 2.1.
To investigate the temporal variation in PM2.5 concentration within route segments, we divided the running stage of each route segment into five periods to enable comparison of the route segments, as the period of running on each route segment could differ. As shown in Figure 5, for the running stage of each route segment, we first selected five timestamps, namely TC (the time after closing the doors, as explained in Figure 3), T1/4 (a quarter of the running stage), T1/2 (halfway through the running stage), T3/4 (three-quarters of the running stage), and TO (the time before opening the doors, as explained in Figure 3). Subsequently, the five periods were defined, i.e., period 1 (10 s after timestamp TC), period 2 (5 s before and after timestamp T1/4), period 3 (5 s before and after timestamp T1/2), period 4 (5 s before and after timestamp T3/4), and period 5 (10 s before timestamp TO). Finally, we computed the average PM2.5 concentration of the route segments for FA, MA, and RA for each period.

3. Results and Discussion

Three aspects were investigated to compare the differences in the PM2.5 concentration among FA, MA, and RA, and explore the spatiotemporal variations in PM2.5.

3.1. General Comparison of PM2.5 Concentrations among FA, MA, and RA

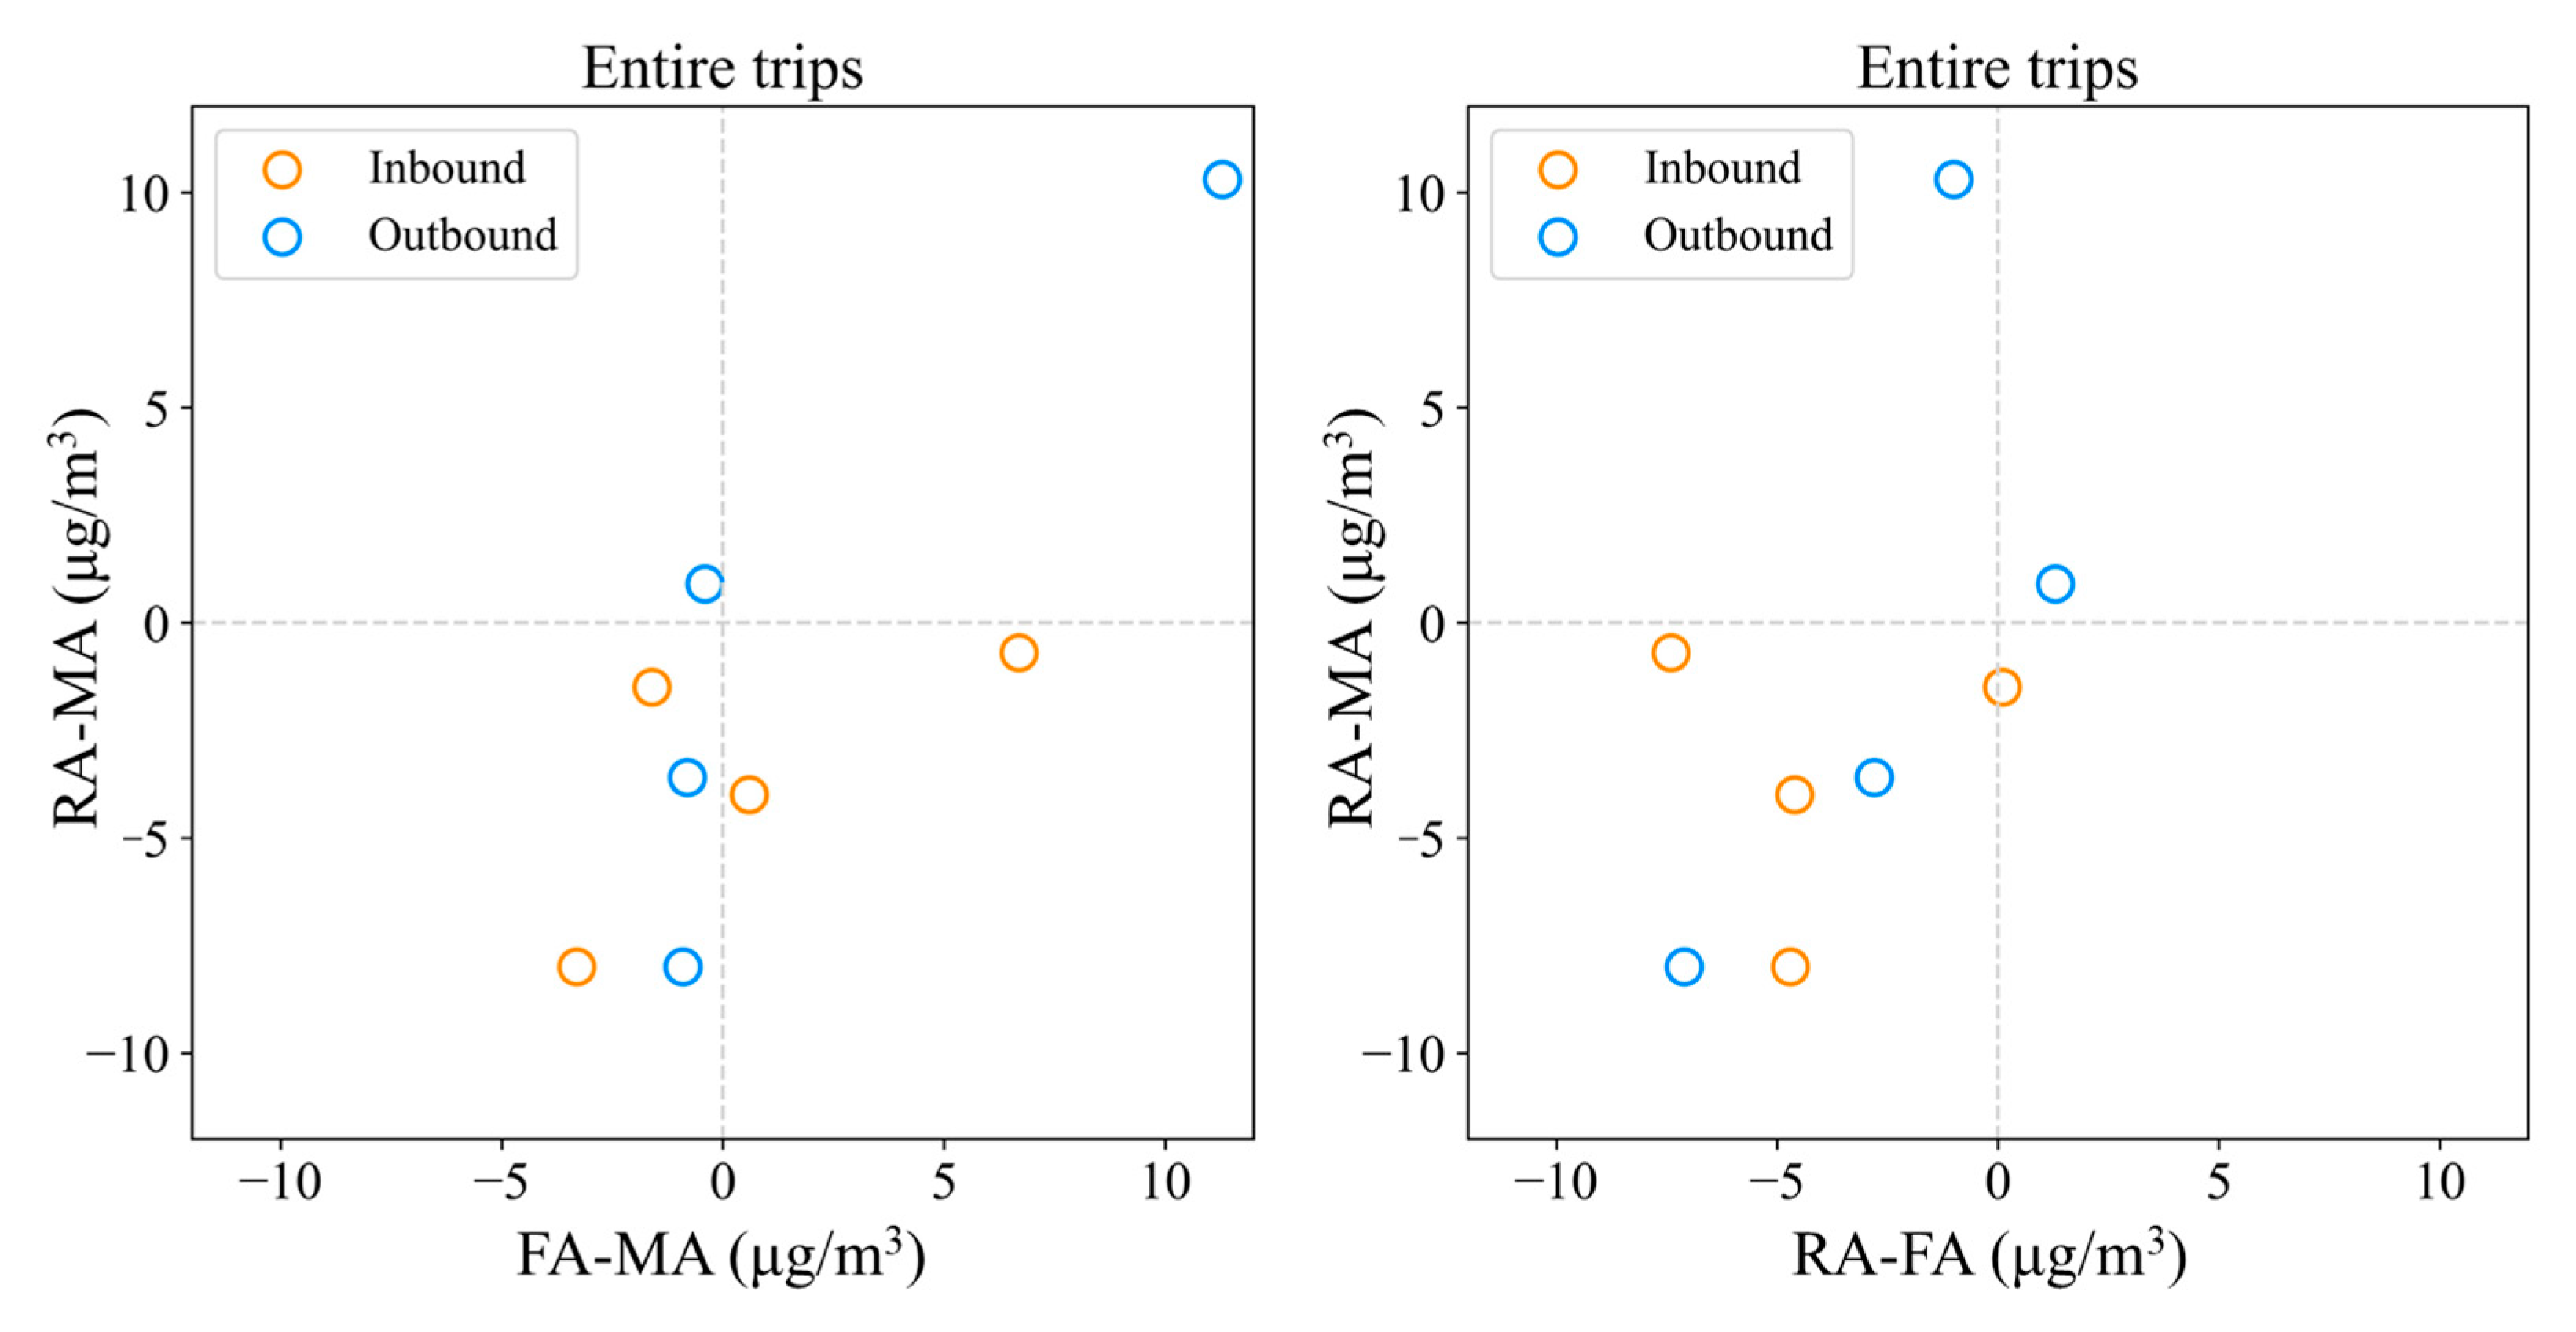
We compared the average PM2.5 concentrations measured during each trip in the FA, MA, and RA sections to determine any significant differences in the PM2.5 concentration levels among the three areas inside the cabin for all the trips. The descriptive statistics of PM2.5 concentrations in the three areas are presented in Table 3 and the statistical results of the comparison are presented in Table 4. The details of these differences in any two areas for each trip are shown in Figure 6.
As shown in Table 3, in terms of mean PM2.5 concentration in the three in-cabin areas, the highest values appeared in FA and MA for seven times out of the eight trips, while the lowest values appeared in RA for five times out of the eight trips. Therefore, in the eight trips, there was no fixed sequential order of concentration size for the three in-cabin areas. However, the absolute differences in mean PM2.5 concentration between the three cabin areas were small, except for the trip of 0427-M-OT. A Wilcoxon signed-rank test confirms this point (explained by Cohen’s d in Table 4). Based on the Z score, while the difference between FA and RA was statistically significant, the differences between MA and RA, as well as between MA and FA, were not significant. In general, FA had the highest PM2.5 concentration, followed by MA, then RA. The higher PM2.5 concentration in FA and MA might be attributed to the fact that front and rear doors are in FA and MA, which incurs the indoor-outdoor air exchange while doors were open, and more frequent passengers’ activities (e.g., passengers board and alight at every stop, and move inside the cabin) and higher passenger density.

3.2. Spatial Variations in PM2.5 Concentration along Trip Routes

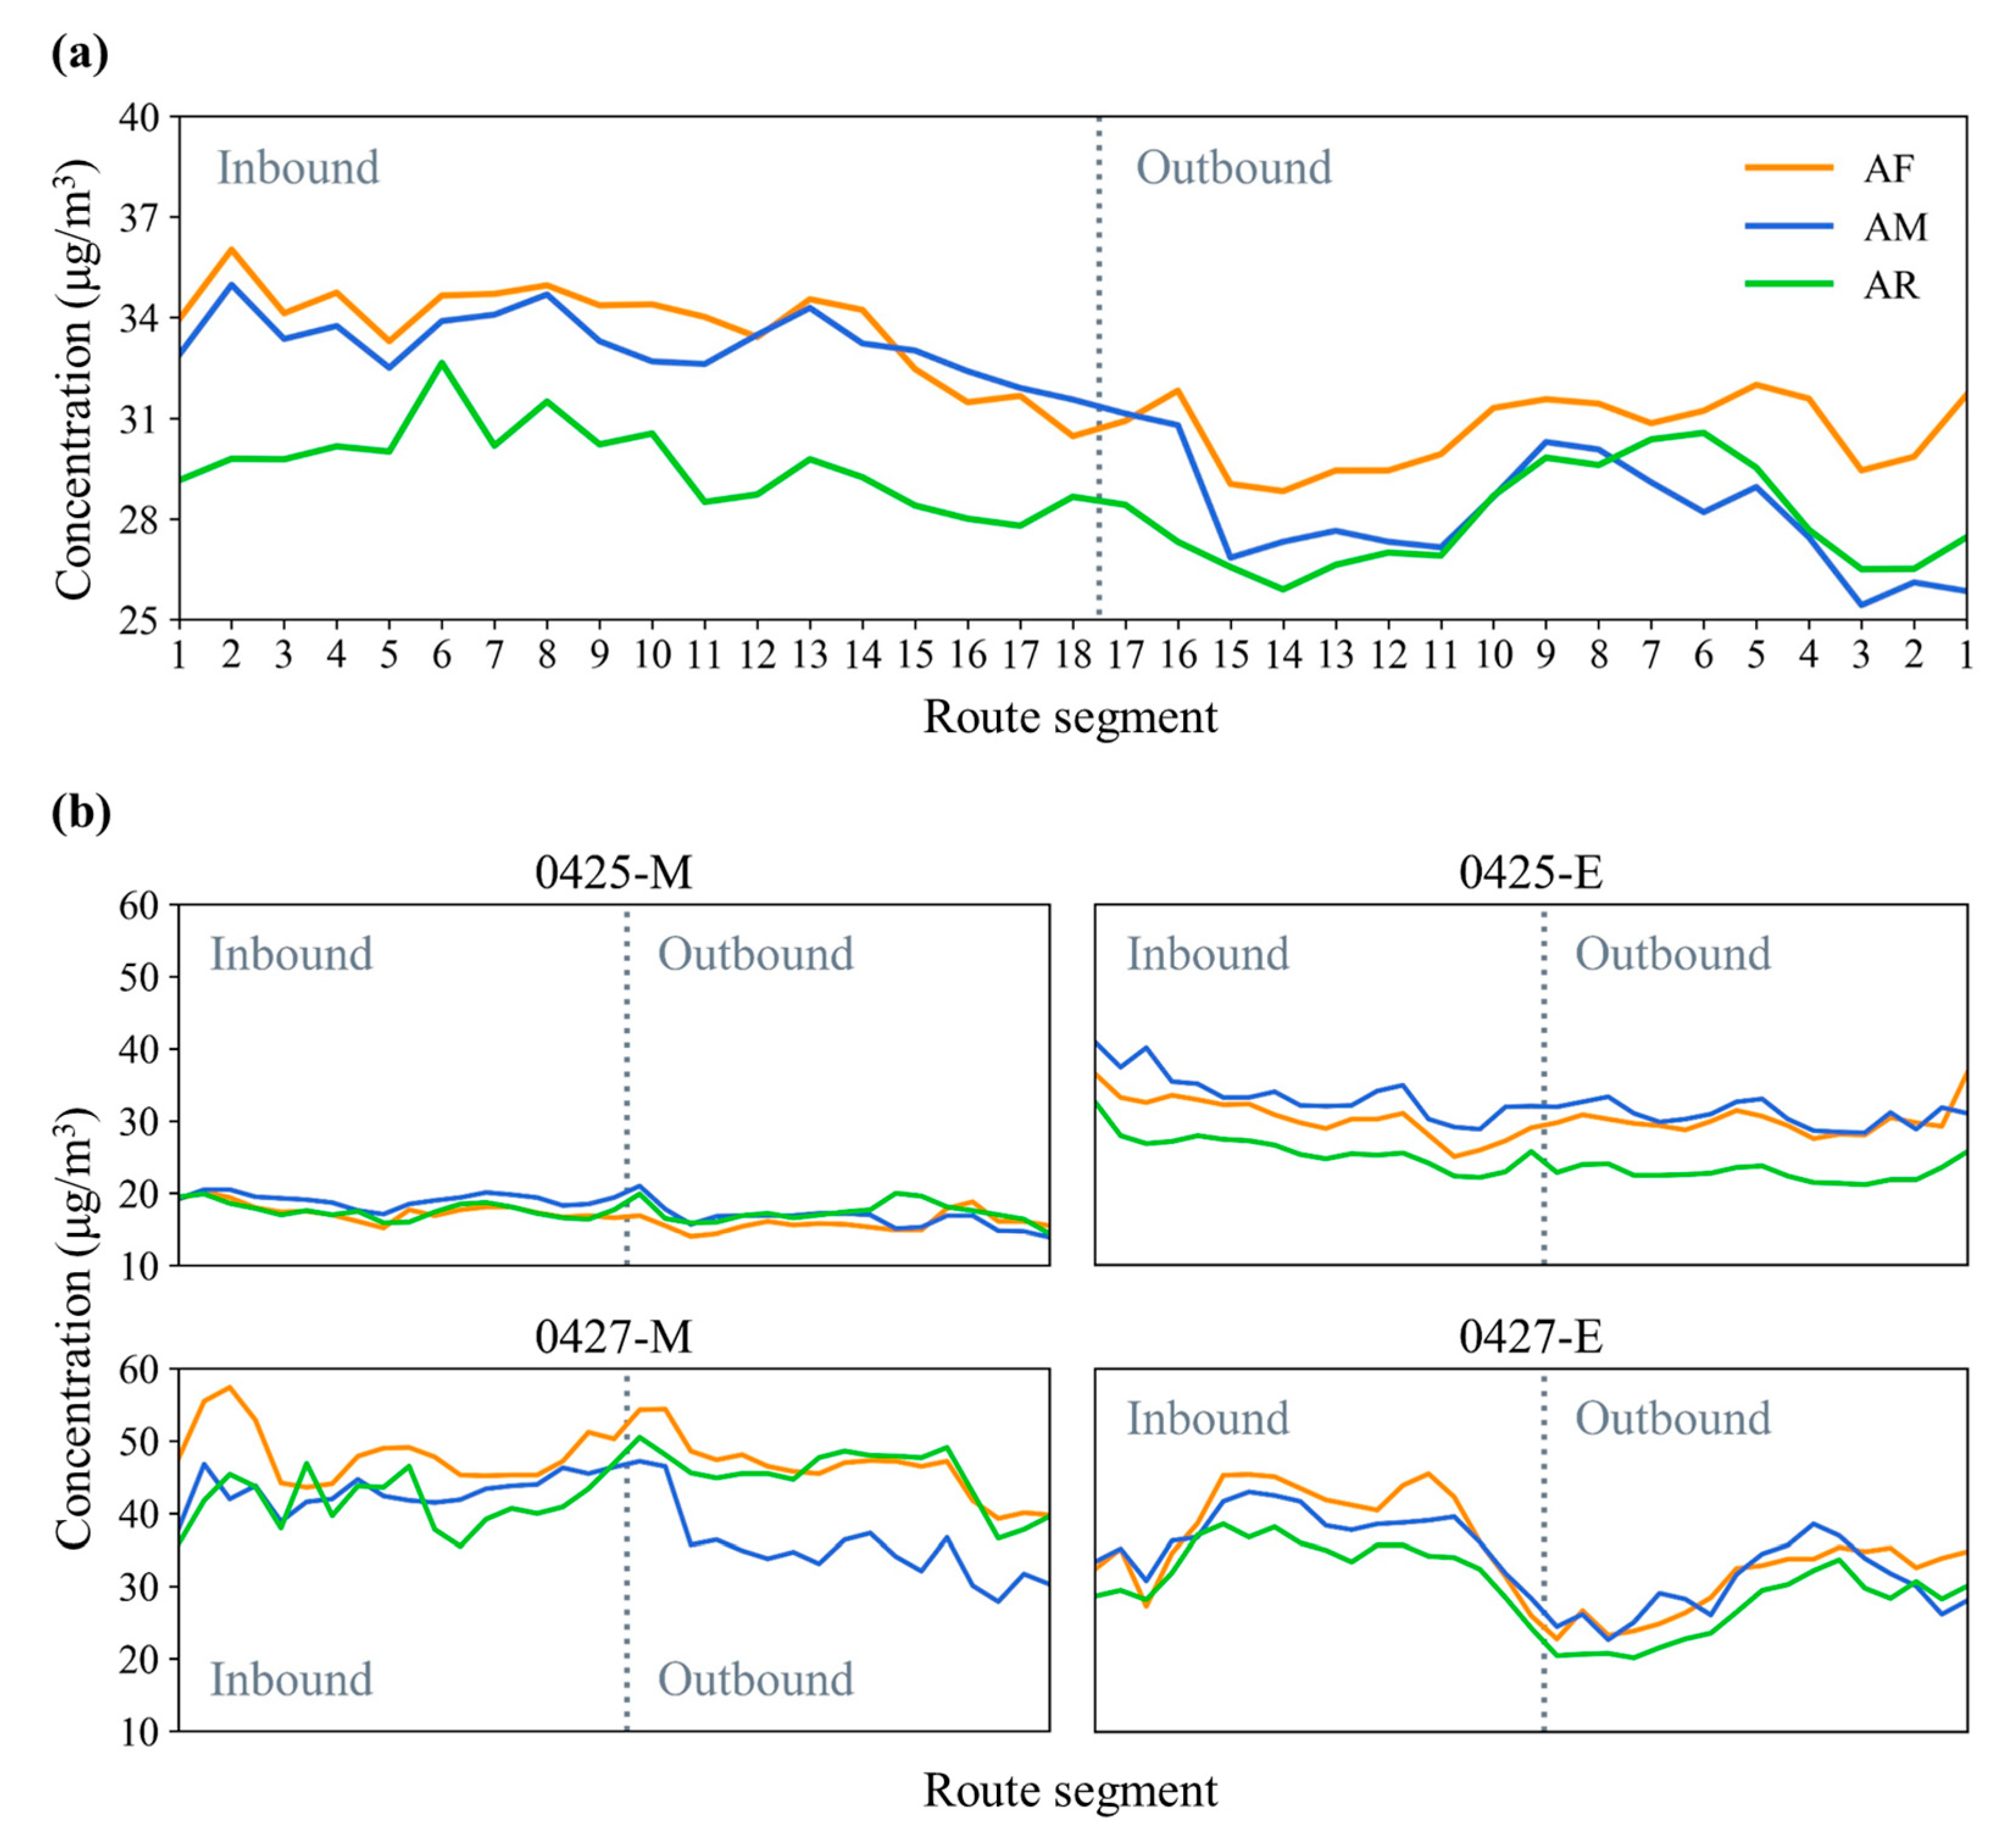
To investigate the spatial variations in PM2.5 concentrations along trip routes, we divided trip routes into route segments (as shown in Figure 1). Figure 7 shows the distribution of mean PM2.5 concentration in the three in-cabin areas during the running stages of route segments, sequentially arranged along the inbound and outbound trips. It indicates a similar trend in the variations of PM2.5 across the route segments. Generally, RA shows the lowest PM2.5 concentrations for most route segments of both inbound and outbound trips. The PM2.5 concentrations in FA and MA are similar for inbound trips, whereas, for outbound trips, the concentrations in MA are comparable with those in RA but lower than those in FA (Figure 7a).
However, some variations existed for the individual trips. As shown in Figure 7b, PM2.5 concentrations were relatively stable on 25 April, with higher concentrations in the evening trip. PM2.5 concentrations on 27 April fluctuated, and were relatively higher in the morning than in the evening. The inbound-outbound trips in the morning of 27 April (denoted as 0427-M) did not follow the general trend (as shown in Figure 7a). FA and RA remained high for the whole trip, while MA conspicuously dropped for the outbound trip. This might be the reason that MA-related concentration was not statistically significantly different from RA and FA (Table 4). In the evening rush hours, more route segments showed lower concentration in RA, especially for the outbound trips.
Passenger density tended to be an important factor related to the spatial variation of PM2.5 concentration in three cabin areas. There was a Pearson correlation coefficient of 0.352 (significant at the 0.05 level) between the level of passenger density and the in-cabin concentration, for all three areas in total. Therefore, in general, more passengers led to a higher PM2.5 concentration inside bus cabin. Although the statistics for the three individual in-cabin areas were not significant at 0.05 level, they were all positively related (Pearson correlation coefficient: FA 0.509/significant at 0.1 level, MA 0.109, and RA 0.320). In addition, more route segments with higher maximum levels of passenger density (levels 4 & 5) were found in those inbound trips compared with outbound trips on 27 April (Table 2), which may explain the fluctuation in concentration as well as the higher concentration for inbound trips compared with outbound trips. Similarly, more route segments with higher maximum levels of passenger density were found in FA and MA during the evening rush hours, which may lead to FA and MA being higher than RA for most route segments.

3.3. Temporal Variations in PM2.5 Concentrations within Route Segments

Regarding the temporal variations in PM2.5 concentrations within route segments, we focus on examining how the stopping stage influences the three in-cabin areas. This is fulfilled by comparing levels of PM2.5 concentration in the stopping stage with the five periods of route segments (as defined in Figure 5).
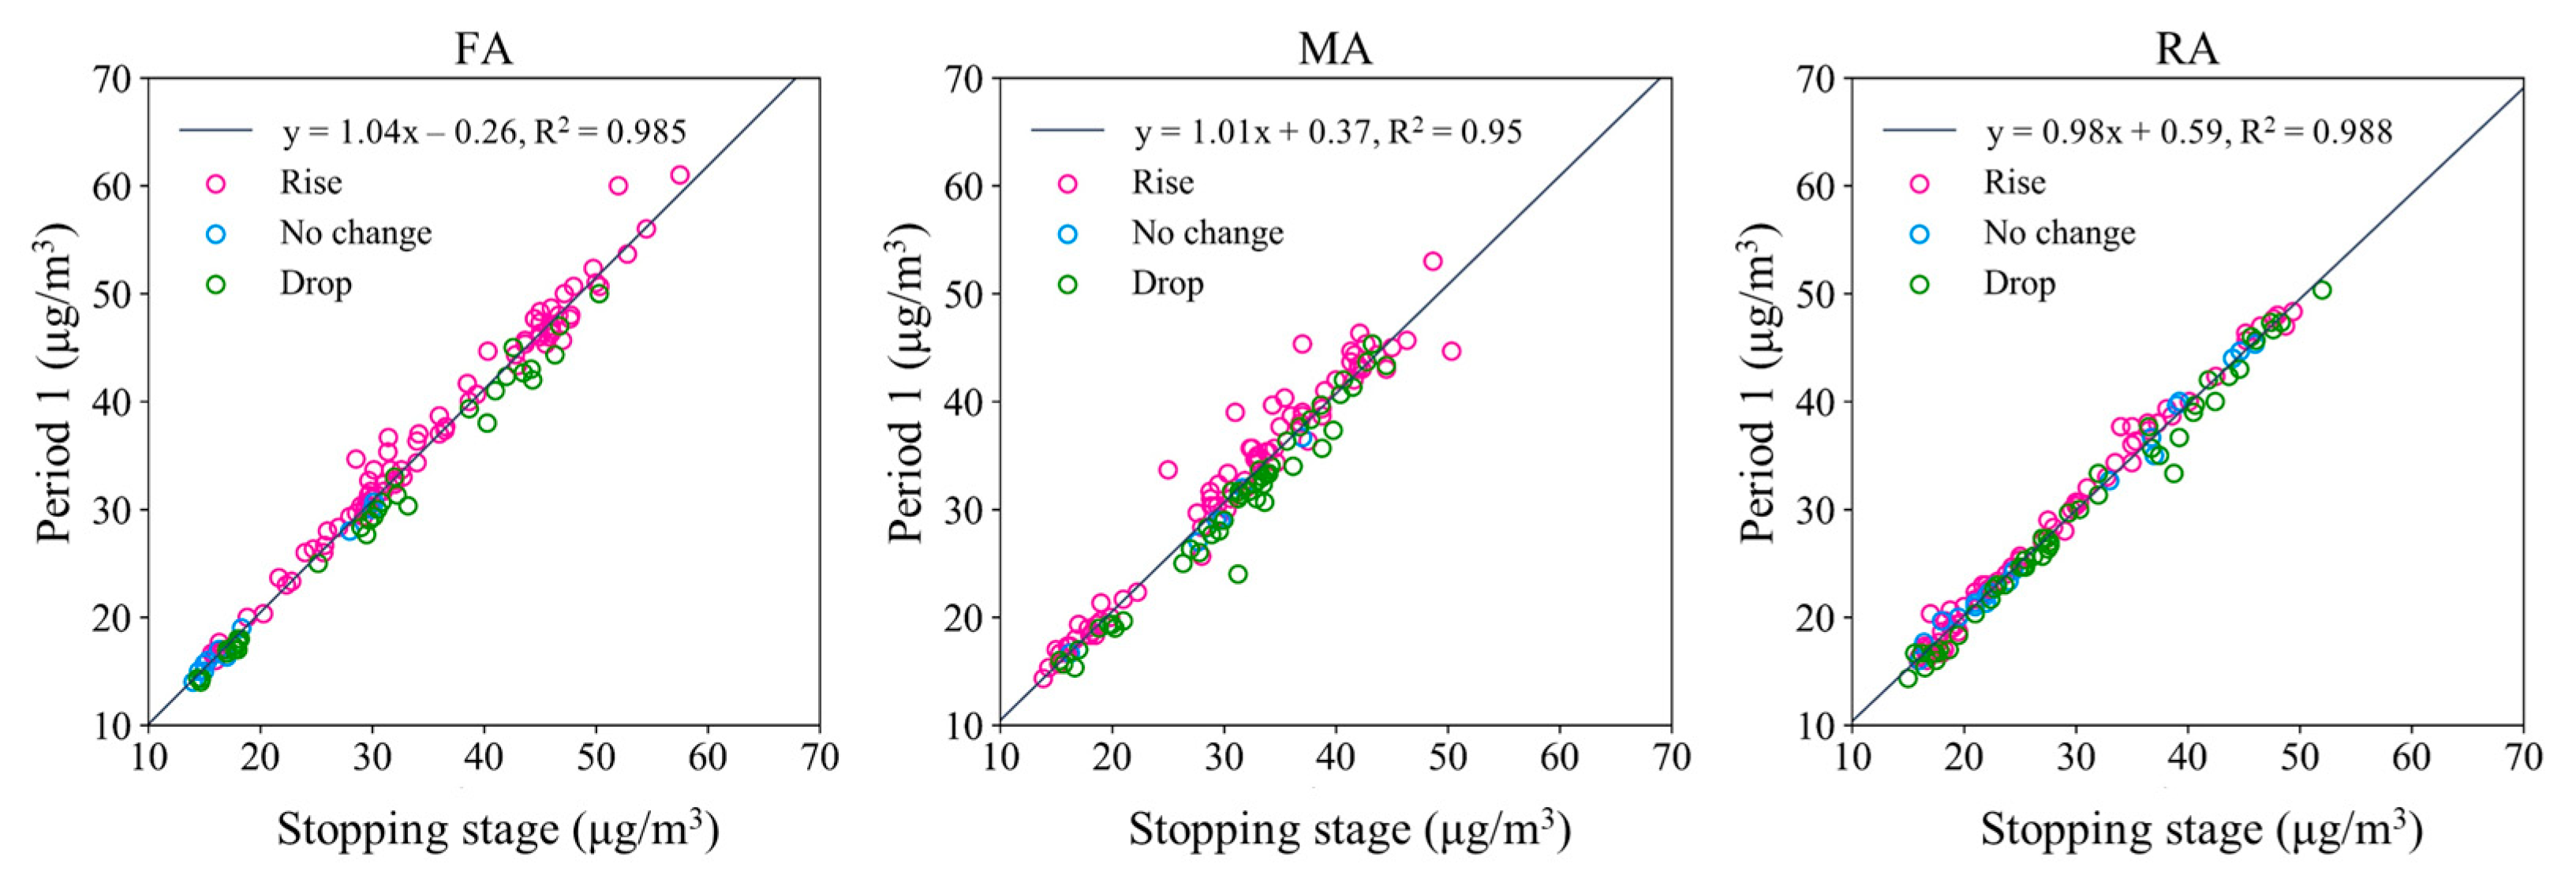
Figure 8 shows a comparison of PM2.5 concentrations between period 1 and the preceding stopping stage for each route segment. The level of PM2.5 concentrations measured during the running stage of route segments is associated statistically with the level of PM2.5 concentrations measured at the stopping stage of the preceding route segments. This factor implies that the higher the PM2.5 concentrations during the stopping stage of bus stop Si, the higher would be the PM2.5 concentrations during the running stage of the next route segment (i.e., route segment between bus stop Si and bus stop Si + 1).
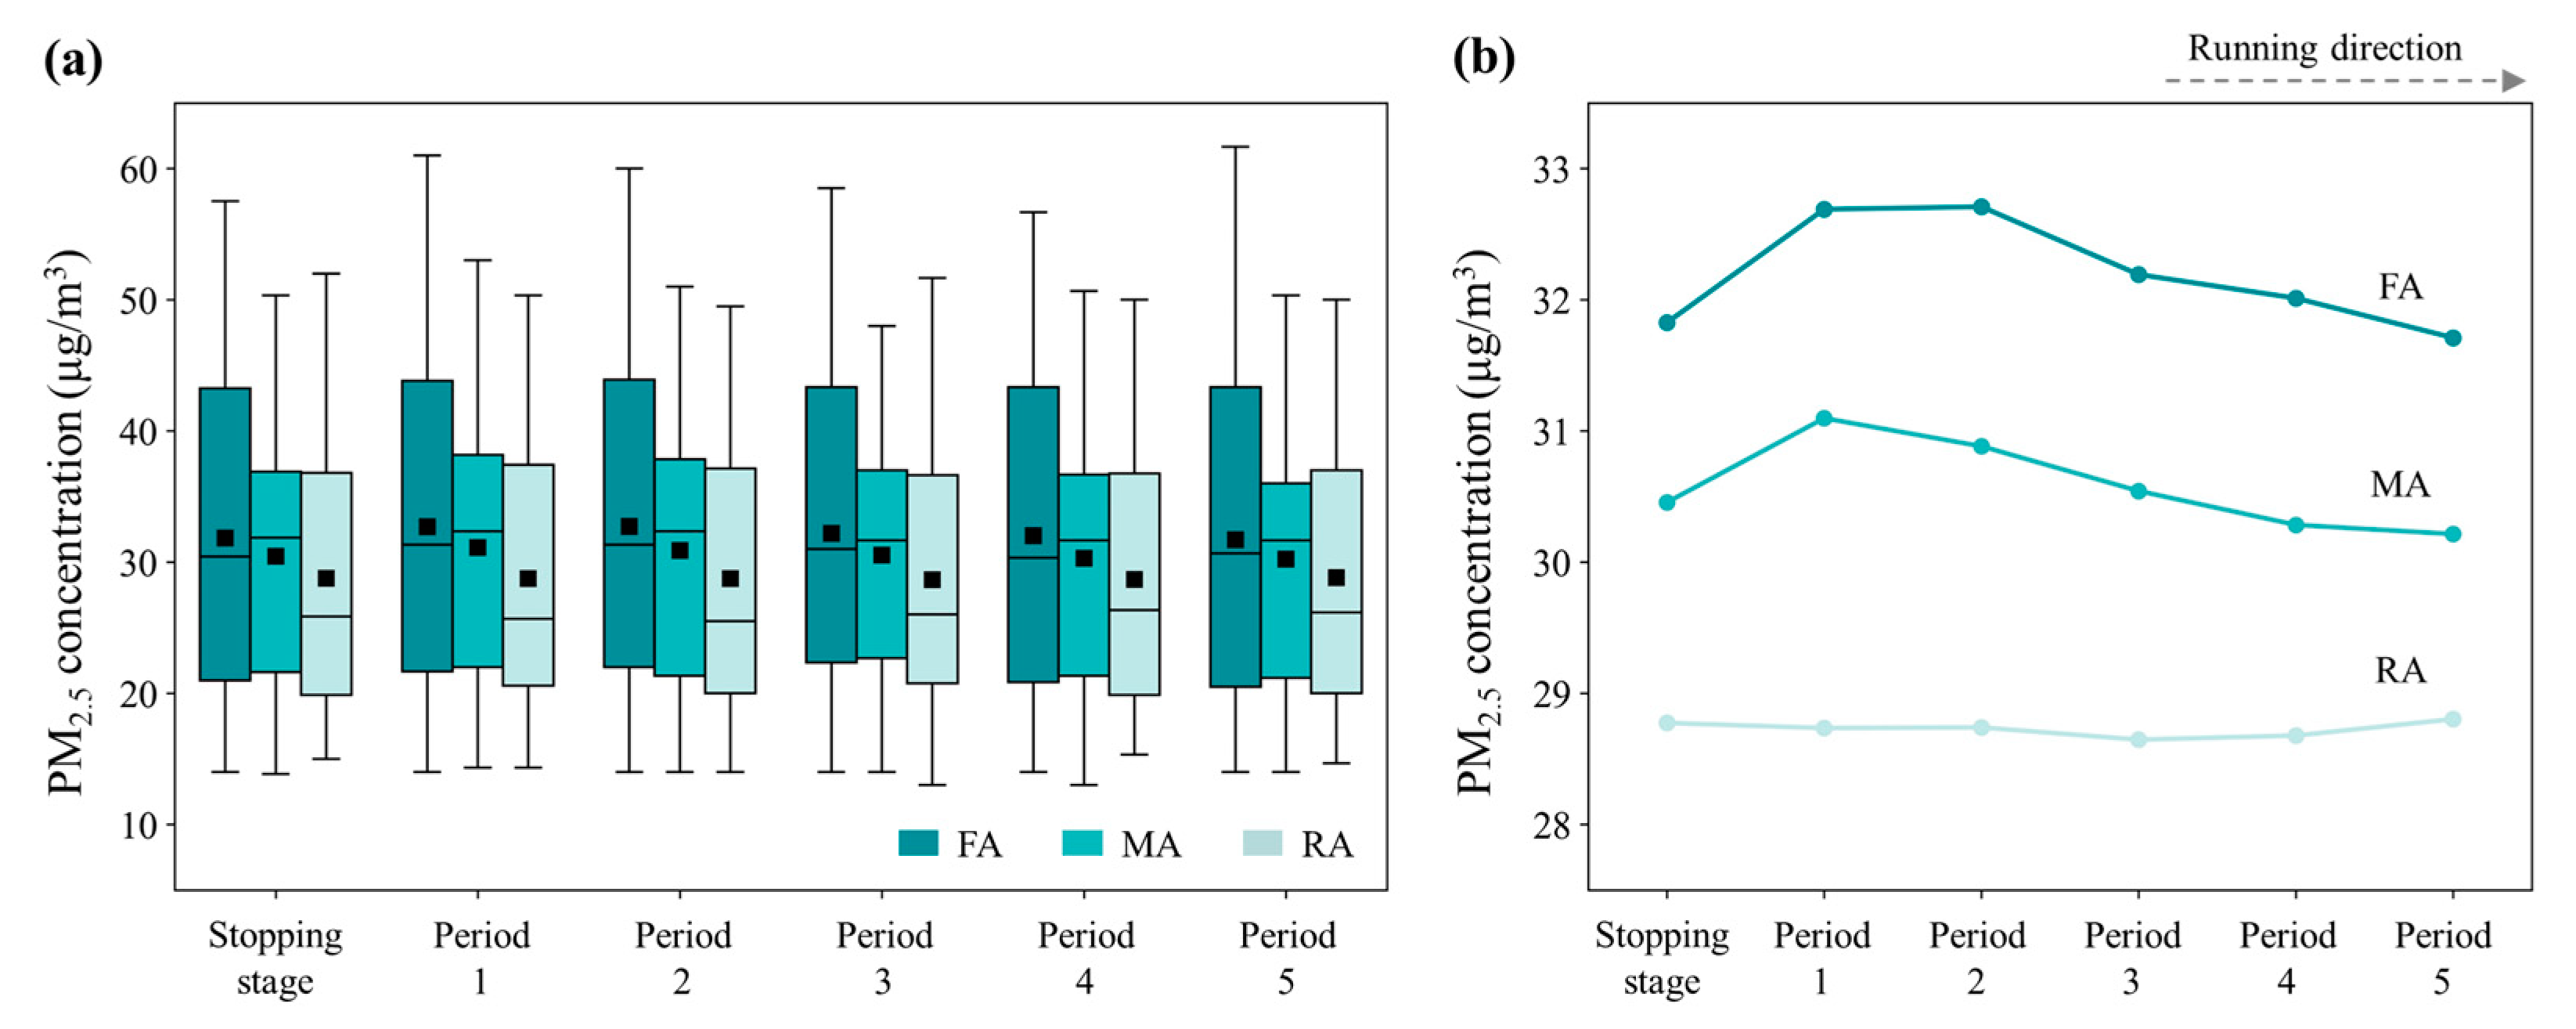
Figure 9 shows the temporal variations in PM2.5 concentration across period 5 of the preceding route segment, the stopping stage, and five periods of the next route segment in FA, MA, and RA. Consistent with previous findings, RA shows the lowest PM2.5 concentration during this period and FA, the highest. Compared with MA and RA, FA was more likely to show a very high PM2.5 concentration for each period, which indicates that FA had a greater fluctuation in concentration within route segments (Figure 9a). Figure 9b shows a similar trend in the variations in PM2.5 concentration during the period in FA and MA, namely, the concentration increases during the stopping stage compared with the preceding running stage, continues increasing at the start of the next route segment, and starts to decrease halfway through the route segment. However, during the same period in RA, a relatively stable trend is observed in the variation in PM2.5 concentration. This finding could be ascribed to the fact that RA is a relatively “quiet” space. Actually, RA does not contain a door and is mainly designed as a seating area, which leads to fewer passenger activities compared to FA and MA. Such susceptibility leads to an increase and higher PM2.5 concentration being measured in FA and MA at the stopping stage and the start of the running stage. When the bus runs smoothly, the airflow inside the cabin causes the exchange of PM2.5 in the FA, MA, and RA, leading to a decrease in concentrations in FA and a slight increase in RA.

4. Conclusions

We explored the spatiotemporal variations in PM2.5 concentration in the FA, MA, and RA sections of bus cabins in transit. We first investigated the differences in PM2.5 concentrations among FA, MA, and RA during all the trips and, subsequently, the spatiotemporal variations measured in each area during the trips.
Our findings indicated differences in the PM2.5 concentration among the three areas. In general, FA showed the highest PM2.5 concentration compared with MA and RA. With the lowest PM2.5 concentration, RA has a lower risk of pollutant exposure, which could be an option for seating vulnerable passengers. With regards to the spatial variation across route segments, the level of PM2.5 concentration in three cabin areas during the outbound trip was lower than that during the inbound trip. This finding could be related to passenger density decreasing during outbound trips, as passenger density was positively correlated with the in-cabin PM2.5 concentration.
Regarding the temporal variation in PM2.5 concentration within route segments, FA and MA showed a similar trend. The PM2.5 concentration increased at the stopping stage compared with the preceding running stage, continued increasing at the start of the next route segment, and started to decrease halfway through the route segment. The trend in RA was relatively stable, which had a slight increase during the middle and late running stages. This finding could be ascribed to FA and MA being more prone to being affected at the stopping stage as passengers are alighting, boarding, and moving inside the cabin. When the bus is running smoothly, airflow inside the cabin causes an exchange of PM2.5 in the FA, MA, and RA sections, leading to a decrease in PM2.5 concentration in FA and a slight increase in RA.
Although the data used for analysis in this study are limited, we believe that the implementation and findings of this study are meaningful, as the focus of this study is to identify the trend in relative differences in PM2.5 concentrations among different cabin areas. Further studies are necessary for disclosing the influences of other factors, including air conditioning inside the bus, ambient pollution at stop platforms, weather conditions, and seasonal change.

Author Contributions

Conceptualization, Z.H., Y.Z., and J.H.; methodology, J.H.; software, J.H.; validation, J.H. and Y.Z.; formal analysis, J.H.; resources, Z.H.; data curation, J.H.; writing—original draft preparation, J.H.; writing—review and editing, Y.Z. and Z.H.; visualization, J.H.; supervision, Z.H. and Y.Z.; project administration, Z.H. All authors have read and agreed to the published version of the manuscript.

Funding

This work was supported by the Key Program of the Shenzhen Scientific and Technological Research and Development Fund (Grant Number 20220809120650001); National Natural Science Foundation of China (Grant Number 41901389); Guangdong Science and Technology Strategic Innovation Fund (the Guangdong-Hong Kong-Macau Joint Laboratory Program) (Grant Number 2020B1212030009); and Shenzhen Key Laboratory of Digital Twin Technologies for Cities (Grant Number ZDSYS20210623101800001). The funders had no role in the study design, data collection, analysis, decision to publish, or preparation of the manuscript.

Institutional Review Board Statement

Not applicable.

Informed Consent Statement

Not applicable.

Data Availability Statement

Not applicable.

Acknowledgments

The authors are grateful to Bao Wu, Zhenhua Liu, Yansha Wei, Danfeng Zhang, and Zeping Lin for performing the observations.

Conflicts of Interest

The authors declare no conflict of interest.

Appendix A

Table A1. Description of the levels of passenger density in three cabin areas.
LevelDescription
1Few passengers.
2About half of the seats are taken by passengers.
3All seats are taken by passengers, with few standing passengers.
4Many standing passengers but can move at will.
5 Crowded with standing passengers and it is difficult to move.
Figure A1. Mean values of PM2.5 concentration inside bus cabin for five days.
Atmosphere 14 00326 g0a1
Figure A2. Comparison of the median and mean values of PM2.5 concentration for each running stage.
Atmosphere 14 00326 g0a2

References

  1. Sustainable Transport. Available online: https://sdgs.un.org/topics/sustainable-transport (accessed on 24 May 2022).
  2. Chan, A.T. Commuter exposure and indoor-outdoor relationships of carbon oxides in buses in Hong Kong. Atmos. Environ. 2003, 37, 3809–3815. [Google Scholar] [CrossRef]
  3. Zhu, X.; Lei, L.; Wang, X.; Zhang, Y. Air quality and passenger comfort in an air-conditioned bus micro-environment. Environ. Monit. Assess. 2018, 190, 276. [Google Scholar] [CrossRef]
  4. Keskin, S.S.; Dilmac, E. Indoor air particulate matter exposure of commuter bus passengers in Istanbul, Turkey. Indoor Built Environ. 2017, 26, 337–346. [Google Scholar] [CrossRef]
  5. Jiao, L.D.; Shen, L.Y.; Shuai, C.Y.; He, B. A novel approach for assessing the performance of sustainable urbanization based on structural equation modeling: A China case study. Sustainability 2016, 8, 910. [Google Scholar] [CrossRef]
  6. Xu, H.; Jiao, L.D.; Chen, S.L.; Deng, M.L.; Shen, N.X. An innovative approach to determining high-risk nodes in a complex urban rail transit station: A perspective of promoting urban sustainability. Sustainability 2018, 10, 2456. [Google Scholar] [CrossRef]
  7. Okokon, E.O.; Taimisto, P.; Turunen, A.W.; Amoda, O.A.; Fasasi, A.E.; Adeyemi, L.G.; Juutilainen, J.; Lanki, T. Particulate air pollution and noise: Assessing commuter exposure in Africa’s most populous city. J. Transp. Health 2018, 9, 150–160. [Google Scholar] [CrossRef]
  8. Chaney, R.A.; Sloan, C.D.; Cooper, V.C.; Robinson, D.R.; Hendrickson, N.R.; McCord, T.A.; Johnston, J.D. Personal exposure to fine particulate air pollution while commuting: An examination of six transport modes on an urban arterial roadway. PLoS ONE 2017, 12, e0188053. [Google Scholar] [CrossRef]
  9. Knibbs, L.D.; Cole-Hunter, T.; Morawska, L. A review of commuter exposure to ultrafine particles and its health effects. Atmos. Environ. 2011, 45, 2611–2622. [Google Scholar] [CrossRef]
  10. Velasco, E.; Segovia, E. Determining a commuters’ exposure to particle and noise pollution on double-decker buses. Aerosol Air Qual. Res. 2021, 21, 210165. [Google Scholar] [CrossRef]
  11. Wu, Y.; Zhang, S.J.; Hao, J.M.; Liu, H.; Wu, X.M.; Hu, J.N.; Walsh, M.P.; Wallington, T.J.; Zhang, K.M.; Stevanovic, S. On-road vehicle emissions and their control in China: A review and outlook. Sci. Total Environ. 2018, 574, 332–349. [Google Scholar] [CrossRef]
  12. Huang, J.; Deng, F.R.; Wu, S.W.; Guo, X.B. Comparisons of personal exposure to PM2.5 and CO by different commuting modes in Beijing, China. Sci. Total Environ. 2012, 425, 52–59. [Google Scholar] [CrossRef] [PubMed]
  13. Kolluru, S.S.R.; Patra, A.K. Personal exposures to PM during short distance highway travel in India. Transp. Res. D Transp. Environ. 2020, 81, 102315. [Google Scholar] [CrossRef]
  14. Yang, F.H.; Kaul, D.; Wong, K.C.; Westerdahl, D.; Sun, L.; Ho, K.F.; Tian, L.W.; Brimblecombe, P.; Ning, Z. Heterogeneity of passenger exposure to air pollutants in public transport microenvironments. Atmos. Environ. 2015, 109, 42–51. [Google Scholar] [CrossRef]
  15. Mahesh, S. Exposure to fine particulate matter (PM2.5) and noise at bus stops in Chennai, India. J. Transp. Health 2021, 22, 101105. [Google Scholar] [CrossRef]
  16. Zhu, S.W.; Demokritou, P.; Spengler, J. Experimental and numerical investigation of micro-environmental conditions in public transportation buses. Build. Environ. 2010, 45, 2077–2088. [Google Scholar] [CrossRef] [PubMed]
  17. Rai, A.C.; Lin, C.H.; Chen, Q.Y. Numerical modeling of volatile organic compound emissions from ozone reactions with human-worn clothing in an aircraft cabin. HVACR Res. 2014, 8, 922–931. [Google Scholar] [CrossRef]
  18. Wang, C.; Yang, X.D.; Guan, J.; Li, Z.; Gap, K. Source apportionment of volatile organic compounds (VOCs) in aircraft cabins. Build. Environ. 2014, 81, 1–6. [Google Scholar] [CrossRef]
  19. You, R.Y.; Cui, W.L.; Chen, C.; Zhao, B. Measuring the short-term emission rates of particles in the "Personal Cloud" with different clothes and activity intensities in a sealed chamber. Aerosol Air Qual. Res. 2013, 13, 911–921. [Google Scholar] [CrossRef]
  20. Cohen, A.J.; Brauer, M.; Burnett, R.; Anderson, H.R.; Frostad, J.; Estep, K.; Balakrishnan, K.; Brunekreef, B.; Dandona, L.; Dandona, R. Estimates and 25-year trends of the global burden of disease attributable to ambient air pollution: An analysis of data from the global burden of diseases study 2015. Lancet 2017, 389, 1907–1918. [Google Scholar] [CrossRef] [PubMed]
  21. Correia, A.W.; Pope, C.A.; Dockery, D.W.; Wang, Y.; Ezzati, M.; Dominici, F. Effect of air pollution control on life expectancy in the United States: An analysis of 545 US counties for the period from 2000 to 2007. Epidemiology 2013, 24, 23–31. [Google Scholar] [CrossRef]
  22. Yang, B.Y.; Fan, S.J.; Thiering, E.; Seissler, J.; Nowak, D.; Dong, G.H.; Heinrich, J. Ambient air pollution and diabetes: A systematic review and meta-analysis. Environ. Res. 2020, 180, 108817. [Google Scholar] [CrossRef]
  23. WHO. Global Air Quality Guidelines (AQG). Ambient (Outdoor) Air Pollution. Available online: https://www.who.int/news-room/fact-sheets/detail/ambient-(outdoor)-air-quality-and-health (accessed on 11 January 2023).
  24. Cepeda, M.; Schoufour, J.; Freak-Poli, R.; Koolhaas, C.M.; Dhana, K.; Bramer, W.M.; Franco, O.H. Levels of ambient air pollution according to mode of transport: A systematic review. Lancet Public Health 2017, 2, e23–e34. [Google Scholar] [CrossRef]
  25. Cha, Y.Y.; Hedberg, Y.; Mei, N.X.; Olofsson, U. Airborne wear particles generated from conductor rail and collector shoe contact: Influence of sliding velocity and particle size. Tribol. Lett. 2016, 64, 40. [Google Scholar] [CrossRef]
  26. Lu, F.; Xu, D.Q.; Cheng, Y.B.; Dong, S.X.; Guo, C.; Jiang, X.; Zheng, X.Y. Systematic review and meta-analysis of the adverse health effects of ambient PM2.5 and PM10 pollution in the Chinese population. Environ. Res. 2015, 136, 196–204. [Google Scholar] [CrossRef] [PubMed]
  27. Maroko, A.R. Using air dispersion modeling and proximity analysis to assess chronic exposure to fine particulate matter and environmental justice in New York City. Appl. Geograph. 2012, 34, 533–547. [Google Scholar] [CrossRef]
  28. de Nazelle, A.; Bode, O.; Orjuela, J.P. Comparison of air pollution exposures in active vs. passive travel modes in European cities: A quantitative review. Environ. Int. 2017, 99, 151–160. [Google Scholar] [CrossRef] [PubMed]
  29. Wu, D.L.; Lin, M.; Chan, C.Y.; Li, W.Z.; Tao, J.; Li, Y.P.; Sang, X.F.; Bu, C.W. Influences of Commuting Mode, Air Conditioning Mode and Meteorological Parameters on Fine Particle (PM2.5) Exposure Levels in Traffic Microenvironments. Aerosol Air Qual. Res. 2013, 13, 709–720. [Google Scholar] [CrossRef]
  30. Xu, B.; Hao, J. Air quality inside subway metro indoor environment worldwide: A review. Environ. Int. 2017, 107, 33–46. [Google Scholar] [CrossRef]
  31. Zhang, Y.; Huang, Z.; Wen, S. Spatiotemporal variations of in-cabin particle concentrations along public transit routes, a case study in Shenzhen, China. Build. Environ. 2020, 180, 107047. [Google Scholar] [CrossRef]
  32. Karanasiou, A.; Viana, M.; Querol, X.; Moreno, T.; de Leeuw, F. Assessment of personal exposure to particulate air pollution during commuting in European cities-recommendations and policy implications. Sci. Total Environ. 2014, 490, 785–797. [Google Scholar] [CrossRef]
  33. Sloan, C.D.; Philipp, T.J.; Bradshaw, R.K.; Chronister, S.; Barber, W.B.; Johnston, J.D. Applications of GPS-tracked personal and fixed-location PM2.5 continuous exposure monitoring. J. Air Waste Manag. Assoc. 2016, 66, 53–65. [Google Scholar] [CrossRef]
  34. Belalcazar-Ceron, L.C.; Davila, P.; Rojas, A.; Guevara-Luna, M.A.; Acevedo, H.; Rojas, N. Effects of fuel change to electricity on PM2.5 local levels in the Bus Rapid Transit System of Bogota. Environ. Sci. Pollut. Res. 2021, 28, 68642–68656. [Google Scholar] [CrossRef]
  35. Apparicio, P.; Gelb, J.; Carrier, M.; Mathieu, M.E.; Kingham, S. Exposure to noise and air pollution by mode of transportation during rush hours in Montreal. J. Transp. Geogr. 2018, 70, 182–192. [Google Scholar] [CrossRef]
  36. Kumar, P.; Patton, A.P.; Durant, J.L.; Frey, H.C. A review of factors impacting exposure to PM2.5, ultrafine particles and black carbon in Asian transport microenvironments. Atmos. Environ. 2018, 187, 301–316. [Google Scholar] [CrossRef]
  37. Shen, J.L.; Gao, Z. Commuter exposure to particulate matters in four common transportation modes in Nanjing. Build. Environ. 2019, 156, 156–170. [Google Scholar] [CrossRef]
  38. Wong, L.T.; Mui, K.W.; Cheung, C.T.; Chan, W.Y.; Lee, Y.H.; Cheung, C.L. In-cabin exposure levels of carbon monoxide, carbon dioxide and airborne particulate matter in air-conditioned buses of Hong Kong. Indoor Built Environ. 2011, 20, 464–470. [Google Scholar] [CrossRef]
  39. Madl, P.; Majid, H.; Kwasny, F.; Hofmann, W. In-vehicle exposure to ultrafine particles while driving through a tunnel system and associated lung deposition calculations. Aerosol Air Qual. Res. 2015, 15, 295–305. [Google Scholar] [CrossRef]
  40. Ecological Environment Bureau of Shenzhen Municipality. Shenzhen Air Quality. Available online: http://meeb.sz.gov.cn/ztfw/ztzl/hjbhxxgkzl/kqhjxx/kqzlzl/ (accessed on 5 February 2023).
  41. DustTrak™ DRX Aerosol Monitor 8534. Accurate, Reliable and Quality Instrumentation. Available online: https://tsi.com/products/aerosol-and-dust-monitors/dust-monitors/dusttrak-drx-aerosol-monitor-8534/ (accessed on 24 May 2022).
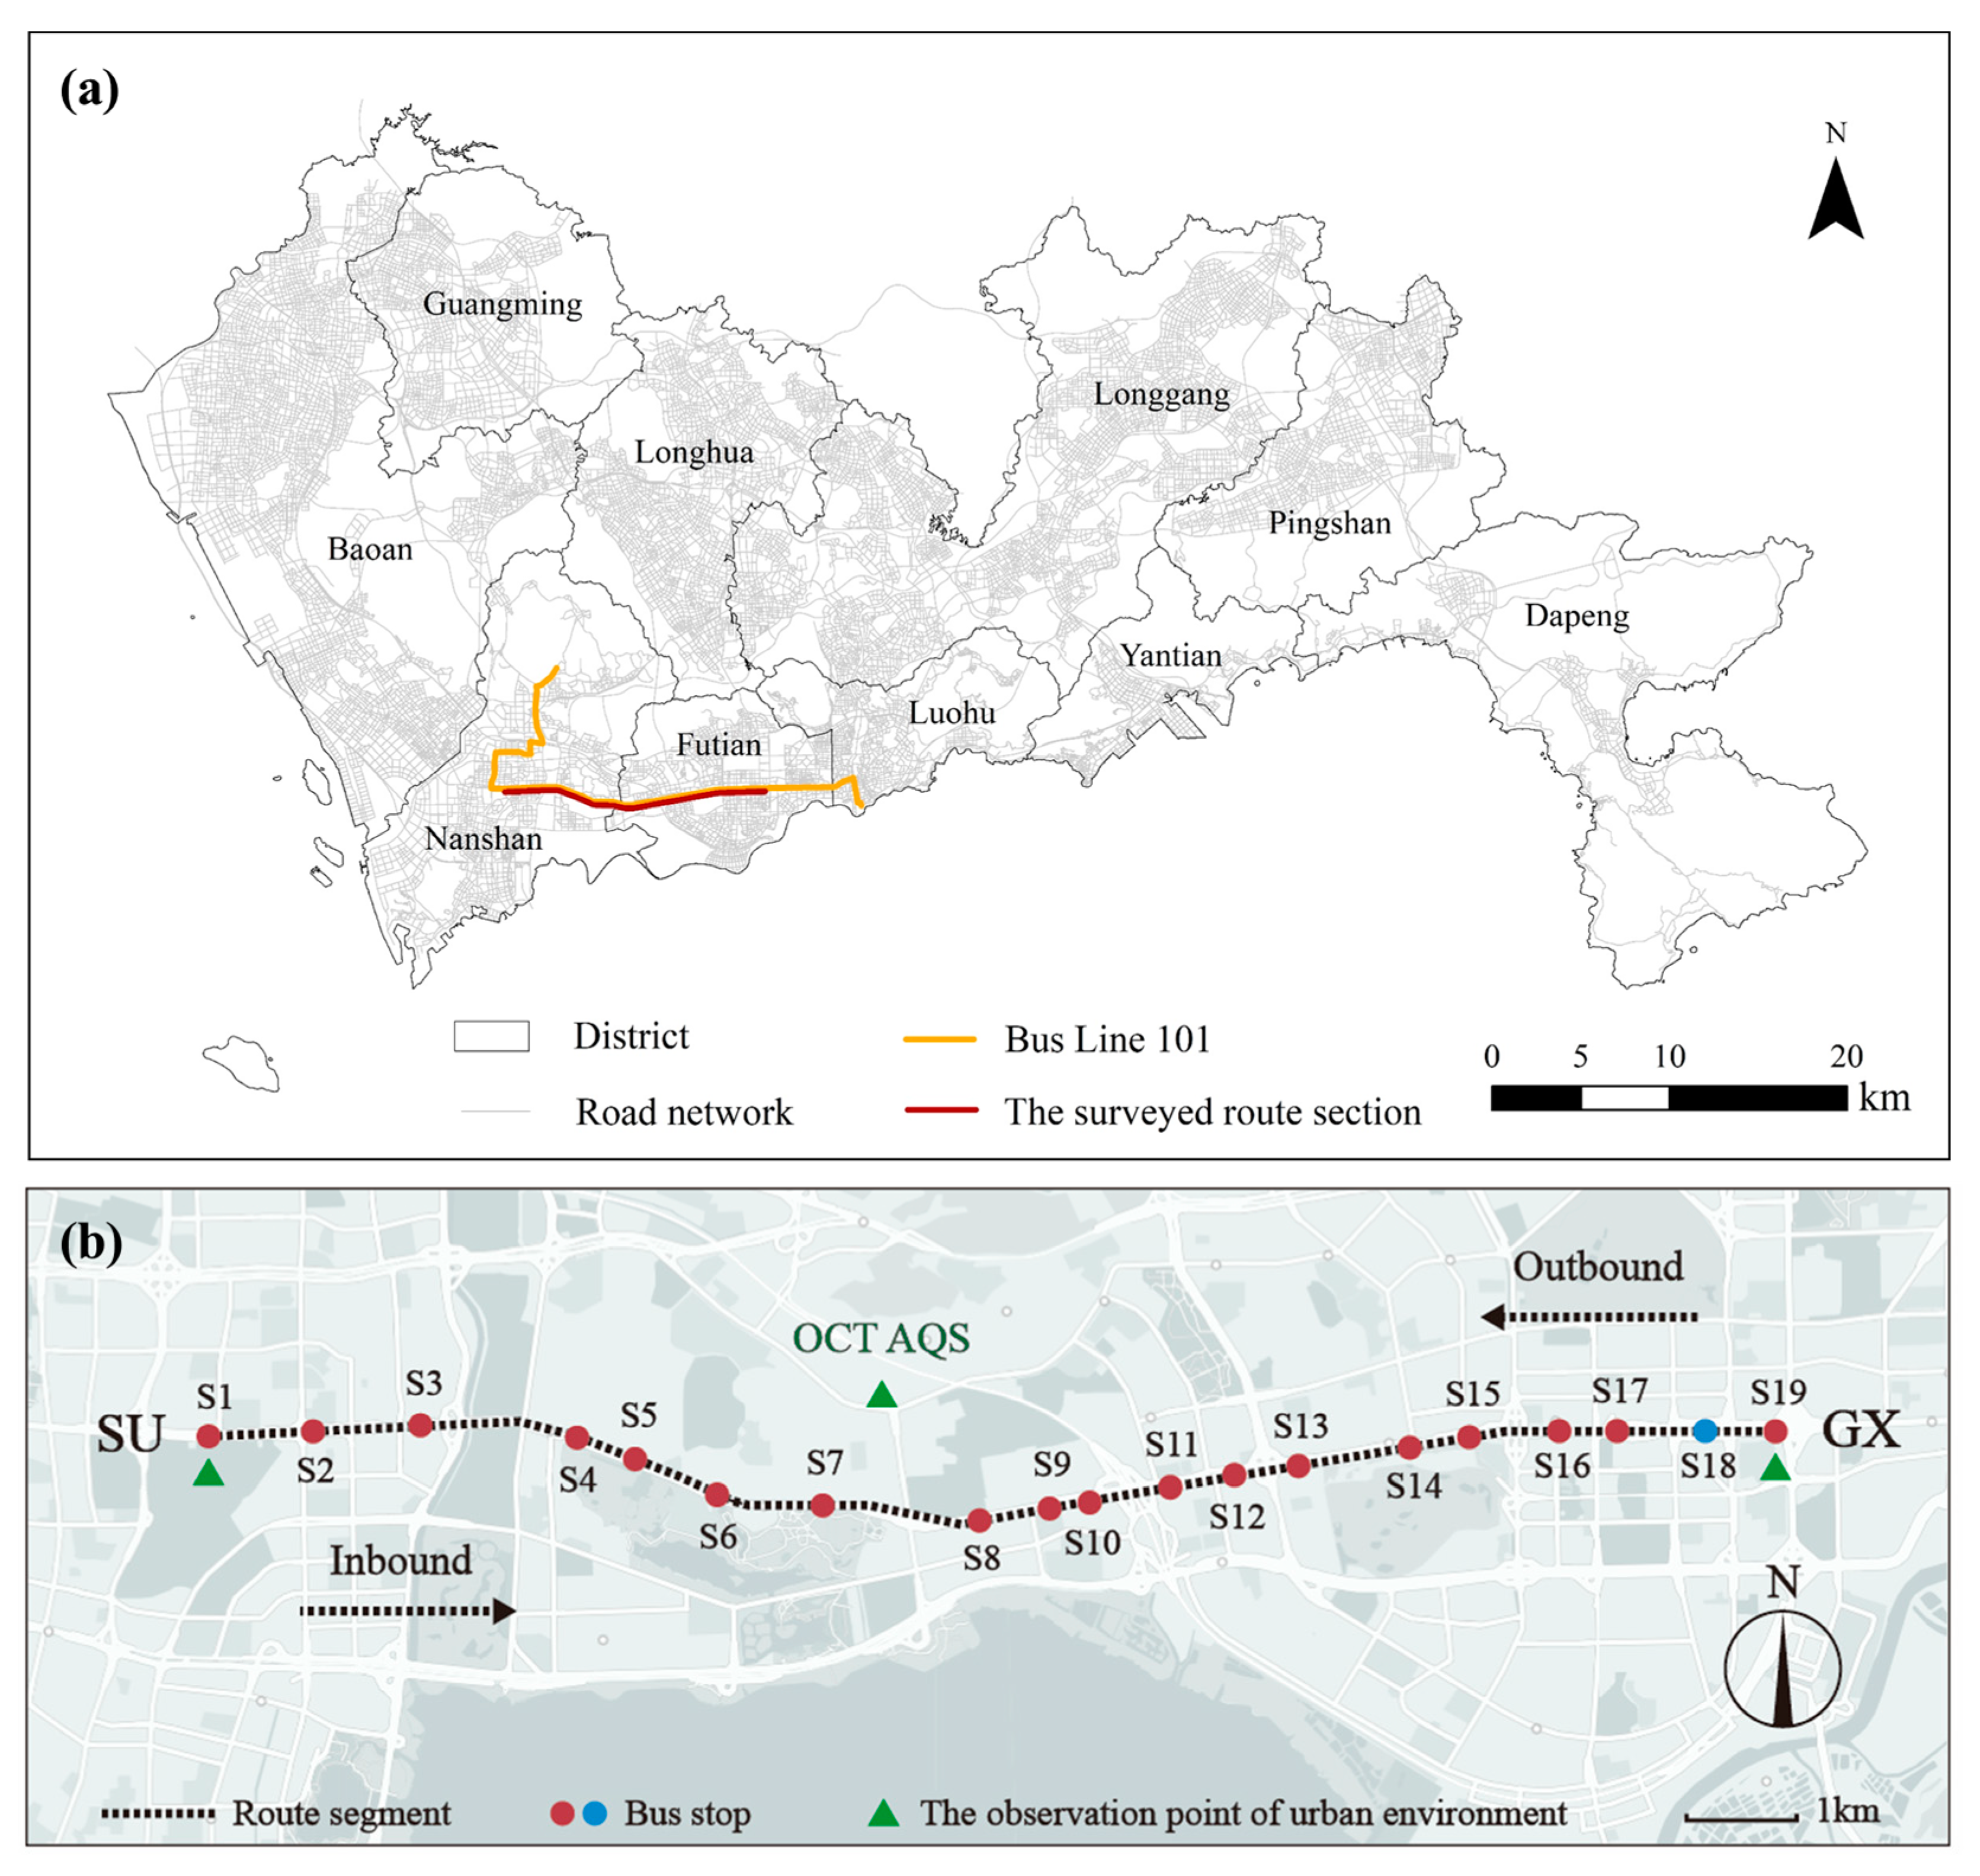
Figure 1. Study area and route selection, (a) bus line 101, (b) stop identifications.
Atmosphere 14 00326 g001
Figure 2. Division of bus cabin and the positions of observers.
Atmosphere 14 00326 g002
Figure 3. Division of a survey trip.
Atmosphere 14 00326 g003
Figure 4. Comparisons of PM2.5 concentrations inside and outside bus cabin over the survey periods.
Atmosphere 14 00326 g004
Figure 5. Definition of timestamps and periods for the running stage of each route segment.
Atmosphere 14 00326 g005
Figure 6. Comparison of PM2.5 concentration among FA, MA, and RA for each trip.
Atmosphere 14 00326 g006
Figure 7. PM2.5 concentration in three cabin areas relevant to the running stage.
Atmosphere 14 00326 g007
Figure 8. Comparison of PM2.5 concentrations between period 1 and its preceding stopping stage for each route segment.
Atmosphere 14 00326 g008
Figure 9. Temporal variations in PM2.5 concentration within route segments in FA, MA, and RA. (a) Boxplot; (b) Trend of average levels.
Atmosphere 14 00326 g009
Table 1. Fields of in-cabin travel information included in the mobile application.
FieldDescription
Stop nameThe starting bus stop of a route segment.
Measurement positionPosition of the observer inside the bus cabin (FA/MA/RA).
Passenger densityLevel of passenger density in the observed area (level 1 to level 5 refer to the passenger density from low to high, details explained in Table A1).
Wind strengthThere is no wind, weak wind, or strong wind felt by investigators at the observation position.
Window statusWindows in the observation area are open or closed.
Bus location on the route segmentThere are two options: (1) the start of the route segment; and (2) the end of the route segment.
TimestampThe time is automatically generated when the record is logged.
Table 2. Description of the in-cabin travel environment for each trip.
TripTravel Time (s)AreaAverage Level of Passenger DensityMinimum Level of Passenger DensityMaximum Level of Passenger DensityTemperature (°C)Relative Humidity (%)
0425-M-IT2170FA2.82327.169.6
MA3.13426.469.8
RA2.12326.571.3
0425-M-OT2246FA2.02226.165.1
MA3.03325.167.8
RA2.42327.565.2
0425-E-IT2268FA2.22328.370.7
MA2.42327.571.0
RA2.62328.269.0
0425-E-OT2255FA2.92527.467.0
MA3.13525.168.5
RA3.23426.068.9
0427-M-IT2283FA2.92426.670.2
MA3.42426.272.7
RA2.82425.275.2
0427-M-OT2173FA3.03326.770.9
MA2.72426.670.0
RA2.71325.075.4
0427-E-IT2405FA3.42525.471.3
MA3.33524.673.1
RA2.42326.870.2
0427-E-OT2274FA3.23526.673.9
MA3.03327.072.8
RA2.72331.463.3
Table 3. Descriptive statistics of PM2.5 concentrations in FA, MA, and RA for each trip.
TripAreaMin
(μg/m3)
Max
(μg/m3)
Mean
(μg/m3)
Median
(μg/m3)
Std
(μg/m3)
0425-M-ITFA142217.65171.51
MA162619.23191.26
RA132517.81181.7
0425-M-OTFA142115.92161.2
MA132216.30161.8
RA123017.18172.13
0425-E-ITFA253830.82312.66
MA284634.19343.71
RA214526.23262.53
0425-E-OTFA273430.07306.55
MA273830.57312.07
RA202522.64222.65
0427-M-ITFA426849.55485.13
MA305642.66433.97
RA335242.00426.87
0427-M-OTFA376945.28464.75
MA245534.03335.64
RA356444.22464.99
0427-E-ITFA245836.68367.46
MA274736.05374.62
RA224232.10324.3
0427-E-OTFA214830.55325.59
MA215029.50294.76
RA183526.79284.51
Table 4. Wilcoxon signed-rank test results of comparing PM2.5 concentrations among FA, MA, and RA for each trip.
MA vs. FARA vs. FARA vs. MA
Z score−0.560−1.960 **−1.122
Sig. (2-tailed)0.5750.0500.262
Cohen’s d0.1680.3120.179
Z score is based on positive ranks. ** Correlation is significant at the 0.05 level.
Disclaimer/Publisher’s Note: The statements, opinions and data contained in all publications are solely those of the individual author(s) and contributor(s) and not of MDPI and/or the editor(s). MDPI and/or the editor(s) disclaim responsibility for any injury to people or property resulting from any ideas, methods, instructions or products referred to in the content.