Article

Genesis of New Particle Formation Events in a Semi-Urban Location in Eastern Himalayan Foothills

1
Department of Physics, Dibrugarh University, Dibrugarh 786004, India
2
Center for Atmospheric Studies, Dibrugarh University, Dibrugarh 786004, India
3
Department of Chemical and Biochemical Engineering, University of Iowa, Iowa City, IA 52242, USA
4
Brookhaven National Laboratory, Environmental and Climate Science Department, New York, NY 11973, USA
*
Author to whom correspondence should be addressed.
Atmosphere 2023, 14(5), 795; https://doi.org/10.3390/atmos14050795
Submission received: 22 February 2023 / Revised: 16 April 2023 / Accepted: 20 April 2023 / Published: 27 April 2023

Abstract

:
New particle formation (NPF) events identified using scanning mobility particle sizer (SMPS) measurements, their subsequent growth and other characteristics over Dibrugarh, a semi-urban location in the eastern Himalayan foothills (EHF), during November–December 2016 are presented. The mean total number concentration of ultrafine aerosols was found to be high during morning and evening rush hours. The NPF occurrence frequency was found to be 14%. The temporal evolution of the hourly average aerosol number size distribution revealed that the nucleation burst occurred at a lower size spectrum, supporting the existence of NPF burst events. It continued to grow through coagulation loss and condensation sink with an average growth rate of 17.16 ± 12.29 nm/hr. The satellite-based observations showed a high concentration of the NPF precursors NO2, SO2, and HCHO during the NPF days. The backward air mass trajectories confirmed that the sources of emissions were confined within an area of radius ~100 km surrounding the observation site. These locally generated precursors and their associated photochemistry could be a probable reason for NPF occurrence at the study site.

Graphical Abstract

1. Introduction

In the past few decades, the focus on aerosol research has shifted to the characterisation of ultrafine particles as they enhance the total global aerosol burden [1,2]. About 10–60% of aerosols in the atmosphere are constituted by newly formed particles, depending on the observation site [3,4,5,6,7,8,9]. Global modelling simulations revealed that 50% of newly formed particles activate as cloud condensation nuclei (CCN) in the troposphere [10,11,12,13]. The new particle formation (NPF) events are crucial to understanding the atmospheric burden of secondary aerosols, which are produced from gaseous vapour through gas-to-particle (GTP) conversion processes. Based on the thermodynamically stable cluster (diameter < 3 nm) from a multi-component system (e.g., nucleation of sulphuric acid (H2SO4) assisted by organic compounds), NPF starts growing to a detectable size [14]. NPF frequently occurs within the continental boundary layer with a spatial scale of a few hundred kilometres and a temporal scale of 1–2 days [15]. These freshly formed particles first grow to nucleation mode followed by Aitken mode [16]. These then participate in cloud formation through condensational growth and coagulation scavenging. High condensation growth leads to the large increment of a fraction of nucleation-mode particles accumulated over the initially formed stable clusters and pre-existing aerosols [17,18,19]. Coagulation is mainly attributed to the size enhancement by the collision and coalescence of aerosols present in the atmosphere. Further, they have direct effects by scattering light once they grow to a size above 100 nm [20]. Several physicochemical mechanisms, such as the heterogeneous nucleation of insoluble organic vapours and chemical reactions, may initiate the growth of the nucleated particles. For example, H2SO4 is a primary vapour responsible for NPF and the formation of a stable cluster, while ammonia (NH3) [21] and amines [22] also play an important role in the NPF growth process. The type and amount of precursor vapours, the concentration of already-existing particles, meteorological factors, and the current atmospheric conditions can simultaneously affect the NPF dynamics [23]. Moreover, charged ions clusters, organic acids, and low-volatility compounds can initiate NPF [24]. The discovery of secondary organic aerosol (SOA) formation by the oxidation of isoprene (C5H8) revealed that following sufficient oxidation, even small organic molecules can become organic aerosol precursors [25] whereby formaldehyde (HCHO) is mostly produced from C5H8 and CH4 by OH radicals [26] and later may contribute to NPF chemistry. According to Kanawade et al. (2020b), enhancing hydrocarbon-like organic aerosols and nitrogen-containing organic compounds might play an important role in NPF events [27]. Furthermore, the oxidation products of anthropogenic gaseous emissions such as SO2, NOx, and VOCs play an important role in NPF events, particularly in polluted marine environments [28,29]. The distribution and fraction of secondary aerosols in the total aerosol mass are highly uncertain; hence, understanding these aerosols’ effects on climate and health becomes more complex.
Several studies have been conducted on short- and long-term time scales to investigate NPF events and their subsequent growth across the Indian region [27,30,31,32,33,34,35,36,37,38,39,40,41]. Moreover, several field campaigns such as INDOEX [42], ISRO-GBP [43,44], and ICARB [35,45,46] have been carried out to measure the sub-micron particle number size distribution. However, according to Sebastian et al. (2022), no uniform pattern exists in the occurrence of NPF events among six different sites considered in their study, but NPF events exhibit seasonality and are responsible for the modulation of CCN concentrations in India [41]. However, the participation of numerous processes, such as primary emission and secondary generation, as well as boundary layer dynamics and feedback, complicates the study of NPF.
Northeast India in the eastern Himalayan foothills (EHF), within northeastern South Asia, has been extensively explored for atmospheric gases and aerosols in the last two decades [47,48,49,50,51,52,53,54]. These studies included ground-based observations, field campaigns, satellite data processing, and efficient model simulations. These studies revealed that the region hosts natural pollutants, especially volatile organic compounds (VOCs) from large vegetation, anthropogenic pollutants from biomass burning associated with Jhum (shifting) and other cultivation practices, and fossil fuel generated from anthropogenic activities. Further, the region serves as a sink to remote aerosols such as dust advected from the Indian deserts through westerlies, anthropogenic pollutants from the Indo-Gangetic plains (IGP), and marine pollutants from the Bay of Bengal [54]. Moreover, WRF-Chem model simulations revealed that NEI shows a highly elevated VOC level next to the western coast and IGP due to its high vegetation index that plays a dominant role in forming VOCs such as formaldehyde and glyoxal in winter [55]. Earlier studies of Dibrugarh revealed the abundance of fine-mode aerosols [50], especially contributed from the local small-scale burnings taking place during November–March along with other anthropogenic sources and fine dust particles from the nearby river Brahmaputra [47]. The surface concentrations of NOx, CO, and BC were found to be high during winter [53], with a dominance of the urban/industrial and biomass-burning aerosols [49], and the region falls under NOx-saturated (VOC-sensitive) regime in terms of O3 chemistry [51]. Dibrugarh experiences a high SO2 mixing ratio during dry winter [48,53] due to a lower temperature, wind speed, and the shallow boundary layer, which is favourable for atmospheric SO2 oxidation, producing H2SO4. However, the occurrence of NPF events has not been explored in this region. Therefore, observations carried out during the dry months of November and December were chosen to study NPF events for the first time in the semi-urban location of Dibrugarh using a combination of ground- and space-based observations. Here, the results are presented in Section 3 starting from the average diurnal variation of the number concentration and geometric mean diameter (Section 3.1), the identification of NPF (Section 3.2), the characterisation of one of the NPF events (Section 3.3) and NPF precursor dynamics (Section 3.4). The main conclusions are presented in Section 4.

2. Methodology

2.1. Observation Site

Particle size measurement was carried out at Dibrugarh University (27.26° N, 94.53° E, and 111 m AMSL), Dibrugarh (Figure 1a), and a semi-urban location in the EHF from 15 November 2016 to 30 December 2016. The site is located close to the northeastern boundary of India and is trapped by the Himalayan range and Tibetan plateau to the north, Garo-Khasi and Naga Hills to the south, Yanan Mountains to the east, and open to the west. The sampling location, Dibrugarh University, situated on the southern bank of river Brahmaputra, is very close to the urban city centre, but is mostly vegetated in nature surrounded by brick kilns, and tea and other industries are also in its vicinity. Coal and oil fields are scattered within a 100 km diameter from Dibrugarh University. Moreover, national highway 37 (NH-37) passes through the university campus with the usual heavier long-distance vehicular traffic in the early morning and evening hours. Apart from that, residential apartments are very close to the study location. Thus, the site has mixed sources of these local anthropogenic emissions and local natural emissions from large vegetation and transported aerosols from remote locations [52,56].
Winter receives the minimum rainfall across the region while the maximum occurs during monsoon season. The region experiences a tropical monsoon climate influenced by the interaction between large-scale circulation and local topography. The year is divided into four distinct seasons: winter (December–February), pre-monsoon (March–May), monsoon (June–September) and post-monsoon (October and November). Winter and post-monsoon are dry, and calm local winds prevail. The pre-monsoon season experiences significant rain with a hot and humid climate. Monsoon is hot and humid, and the synoptic wind carries a large amount of moisture from the Bay of Bengal (BoB) resulting in cloudiness and heavy precipitation. The time series of prevailing meteorological parameters was obtained from the automatic weather station (AWS) installed at the study location (Figure 1b). The minimum temperature value was ~8.1 °C during the late night and early morning hours, accompanied by a high-humidity condition of around 98%. The temperature increased as the day progressed and reached its maximum value at around 14:00 hrs (local time), when the RH values showed minimum values around 31%. The wind speed was a minimum around 0.5 to 4 m/s, with slight fluctuations throughout the day (±0.5 m/s).

2.2. Instrumentation and Data

The particle number size distribution (PNSD) in the size range of 10.2 nm to 333.8 nm in 97 size channels/bins was measured with a scanning mobility particle sizer (SMPS) placed in a laboratory at a height of ~6 m from the ground. The SMPS consisted of an electrostatic classifier (TSI model 3082), kr-85 neutraliser along with a differential mobility analyser (DMA, TSI model 3081), and condensation particle counter (CPC, TSI model 3788). It was operated at a sample flow rate of 0.8 L/min and a sheath flow rate of 8 L/min. Particles are typically classified based on the particle diameter (Dp) as nucleation mode (Nnuc, Dp < 25 nm), Aitken mode (Nait, 25 ≤ Dp < 100 nm), which are together referred to as ultrafine particles (Dp ≤ 100 nm), and accumulation mode (Nacc, Dp ≥ 100 nm), which is also termed as fine-mode particles [30,35], and the sum of all the modes gives the total aerosol number concentration (Ntotal). A 0.7432 cm impactor was used with a tube length and diameter of 25.4 cm and 0.48 cm, respectively. The scanning cycle of the SMPS was 360 s.

2.3. Satellite Data

NASA Earth Orbiting System (EOS) remote sensors Ozone Monitoring Instrument (OMI) and Moderate Resolution Imaging Spectroradiometer (MODIS) were used to study the dynamics of NPF precursors and active fire counts, respectively. The daily variation of NPF precursors, such as tropospheric NO2, total column SO2, and total column HCHO at 1° × 1° along with the spatial distribution of tropospheric NO2 from the OMI data, were utilised. Moreover, active fire counts from MODIS (1 km × 1 km resolution) and air mass trajectories (NOAA HYSPLIT trajectory model) were also performed to understand the possible sources of the air mass transported to the study site.

2.4. Estimation of Coagulation Loss (Fcoag), Condensation Sink (CondS), and Particle Growth Rate (GR)

The characterisation of NPF events was based on evaluating several controlling processes. In this study, NPF events were identified by following the criteria set by Dal Maso and Kulmala [57], where a distinct new mode appears in the nucleation range and it prevails for hours with a sign-of-growth event. This method of NPF event identification has been used extensively around the world [32,33,34,35,36].
The log-normal size distribution for the observation of PNSD is of the following form [25,31]:
d N d   l n   D p = i = 1 n N i 2 π l n σ m , i exp ln   D p ln   D m , p , i 2 2 ln   σ m , i
where Dp is the particle diameter, n is the total number of modes where D m , p , i is the mode diameter in the ith mode, σ m , i is the geometric standard deviation of the modes, and Ni is the number concentration of particles in the ith mode. The geometric mean diameter (GMD) for different particle modes can be evaluated by using [58]
G M D = e x p   ( 1 N n i × l n   D i )
where Di is the diameter of the ith size bin.
The coagulation loss in the size range of 10–25 nm can be understood by using the formula
F c o a g = N 10 25   C o a g S 10 25
where C o a g S 10 25 = k i j N j is the coagulation sink, which describes how rapidly the aerosols are being removed in the nucleation mode size range; k i j is the coagulation coefficient between sizes i and j and can be expressed by the following equation [25,59]:
K i j = 2 π d i + d j ( D i + D j ) β F i j
where d is the diffusion constant and D is the diameter of the particles of i and j sizes, and β F i j is the Fuchs correction factor of the particles. The diffusion constant can be evaluated by [58]
d = k T C c 3 π η D p
where k =1.38 × 10⁻²³ is the Boltzmann constant, T stands for temperature (25 °C), η = 1.81 × 10 5 , D p is the particle diameter, and Cc is the Cunnigham slip factor, given by
C c = 1 + λ D [ 2.34 + 1.05 e ( 0.39 D λ ) ]
where λ is the mean free path.
CondS shows how rapidly vapour molecules condense on pre-existing particles, which depends on molecular diffusivity (d), the diameter of the particles D, and size distribution functions β m , j , and was calculated as follows [60]:
C o n d S = 2 π d j β m , j D j N j
where the size-dependent transition correction factor β m j can be expressed as [61]
β m j = 1 + k n j 1 + 0.337 k n j + 4 k n j 3 α + 4 k n j 2 3 α
where d is the diffusion coefficient for H2SO4 (0.1014 cm2/s), α is the mass accumulation coefficient (taken as unity), and λ v is the mean free path of H2SO4 molecules ( 6.7 × 10 6 cm) at 1 atm, 298 K and K n j , which is given by k n j = 2 λ / D p . The Knudsen number is the ratio of the two length scales between the effective mean path (λ) and the diameter ( D p ) characterising the particle.
The GR in the nucleation mode range (Dp ~10–25 nm) can be calculated by the first-order polynomial fit over the GMD during the event period as follows [62]:
G R 10 25 = d ( G M D ) d t
Similarly, the GR of different mode regimes, such as Aitken (25 ≤ Dp < 100 nm) and accumulation (Dp ≥ 100 nm), can also be estimated. However, the total GR can be calculated by taking into account the entire size bin during the sampling measurement.

3. Results and Discussion

3.1. Average Diurnal Variation of Number Concentration and Geometric Mean Diameter (GMD)

The particle number concentration in the ultrafine range provides useful information about aerosol sources, transformation, and removal mechanisms. We investigated the aerosol concentrations over three mode regimes: nucleation (Nnuc), Aitken (Nait) and accumulation (Nacc) as well as for composite (Ntotal) during November–December 2016.
The temporal evolution of the total number concentration, Ntotal, of aerosols in the size range 10.2 nm to 333.8 nm and the corresponding GMD values during the study period was examined (Figure 2). In general, the Ntotal of ultrafine and fine particles possessed dual diurnal peaks between 07:00–08:30 hrs (IST) and 18:30–22:30 hrs, corresponding to morning rush hour and the shrinking of the boundary layer in the evening, thereby trapping the species near the surface and undergoing aggregation (Figure 2a). The concentration was lowest during the daytime due to the dilution of aerosols via mixing, with the uplifting of the boundary layer. A similar diurnal variation in the near-surface concentrations of black carbon (BC) aerosols and trace gases such as carbon monoxide (CO) and NOx has previously been reported from the same study location [47,50,51]. Ntotal varied between 1.84 × 10⁴ to 5.03 × 10⁴ particles/cm3 (Figure 2a) and the GMD ranged from 30 to 118 nm. These Ntotal values are high in comparison with other semi-urban, semi-rural, and coastal locations such as Sholapur [36], Trivandrum [31,41], and Gadanki [32]. The present study site was influenced by diverse sources of emissions from anthropogenic activities, including the traffic on nearby NH-37, residential and biomass-burning emissions, and natural VOCs from surrounding vegetation. NPF events have been observed in low-aerosol-loading environments [18] and in highly polluted areas with high aerosol loading [63]. As such, being semi-urban in nature, the present study location was expected to be favourable for NPF occurrences. The GMD of the particles (Figure 2b) was also evaluated to confirm ultrafine particle bursts. The GMD exhibited a prominent dip during the burst because it is inversely related to particle number. The peak in the GMD values was synchronous with the duration of the lower boundary layer dynamics (Figure 2b).

3.2. Identification of NPF Events

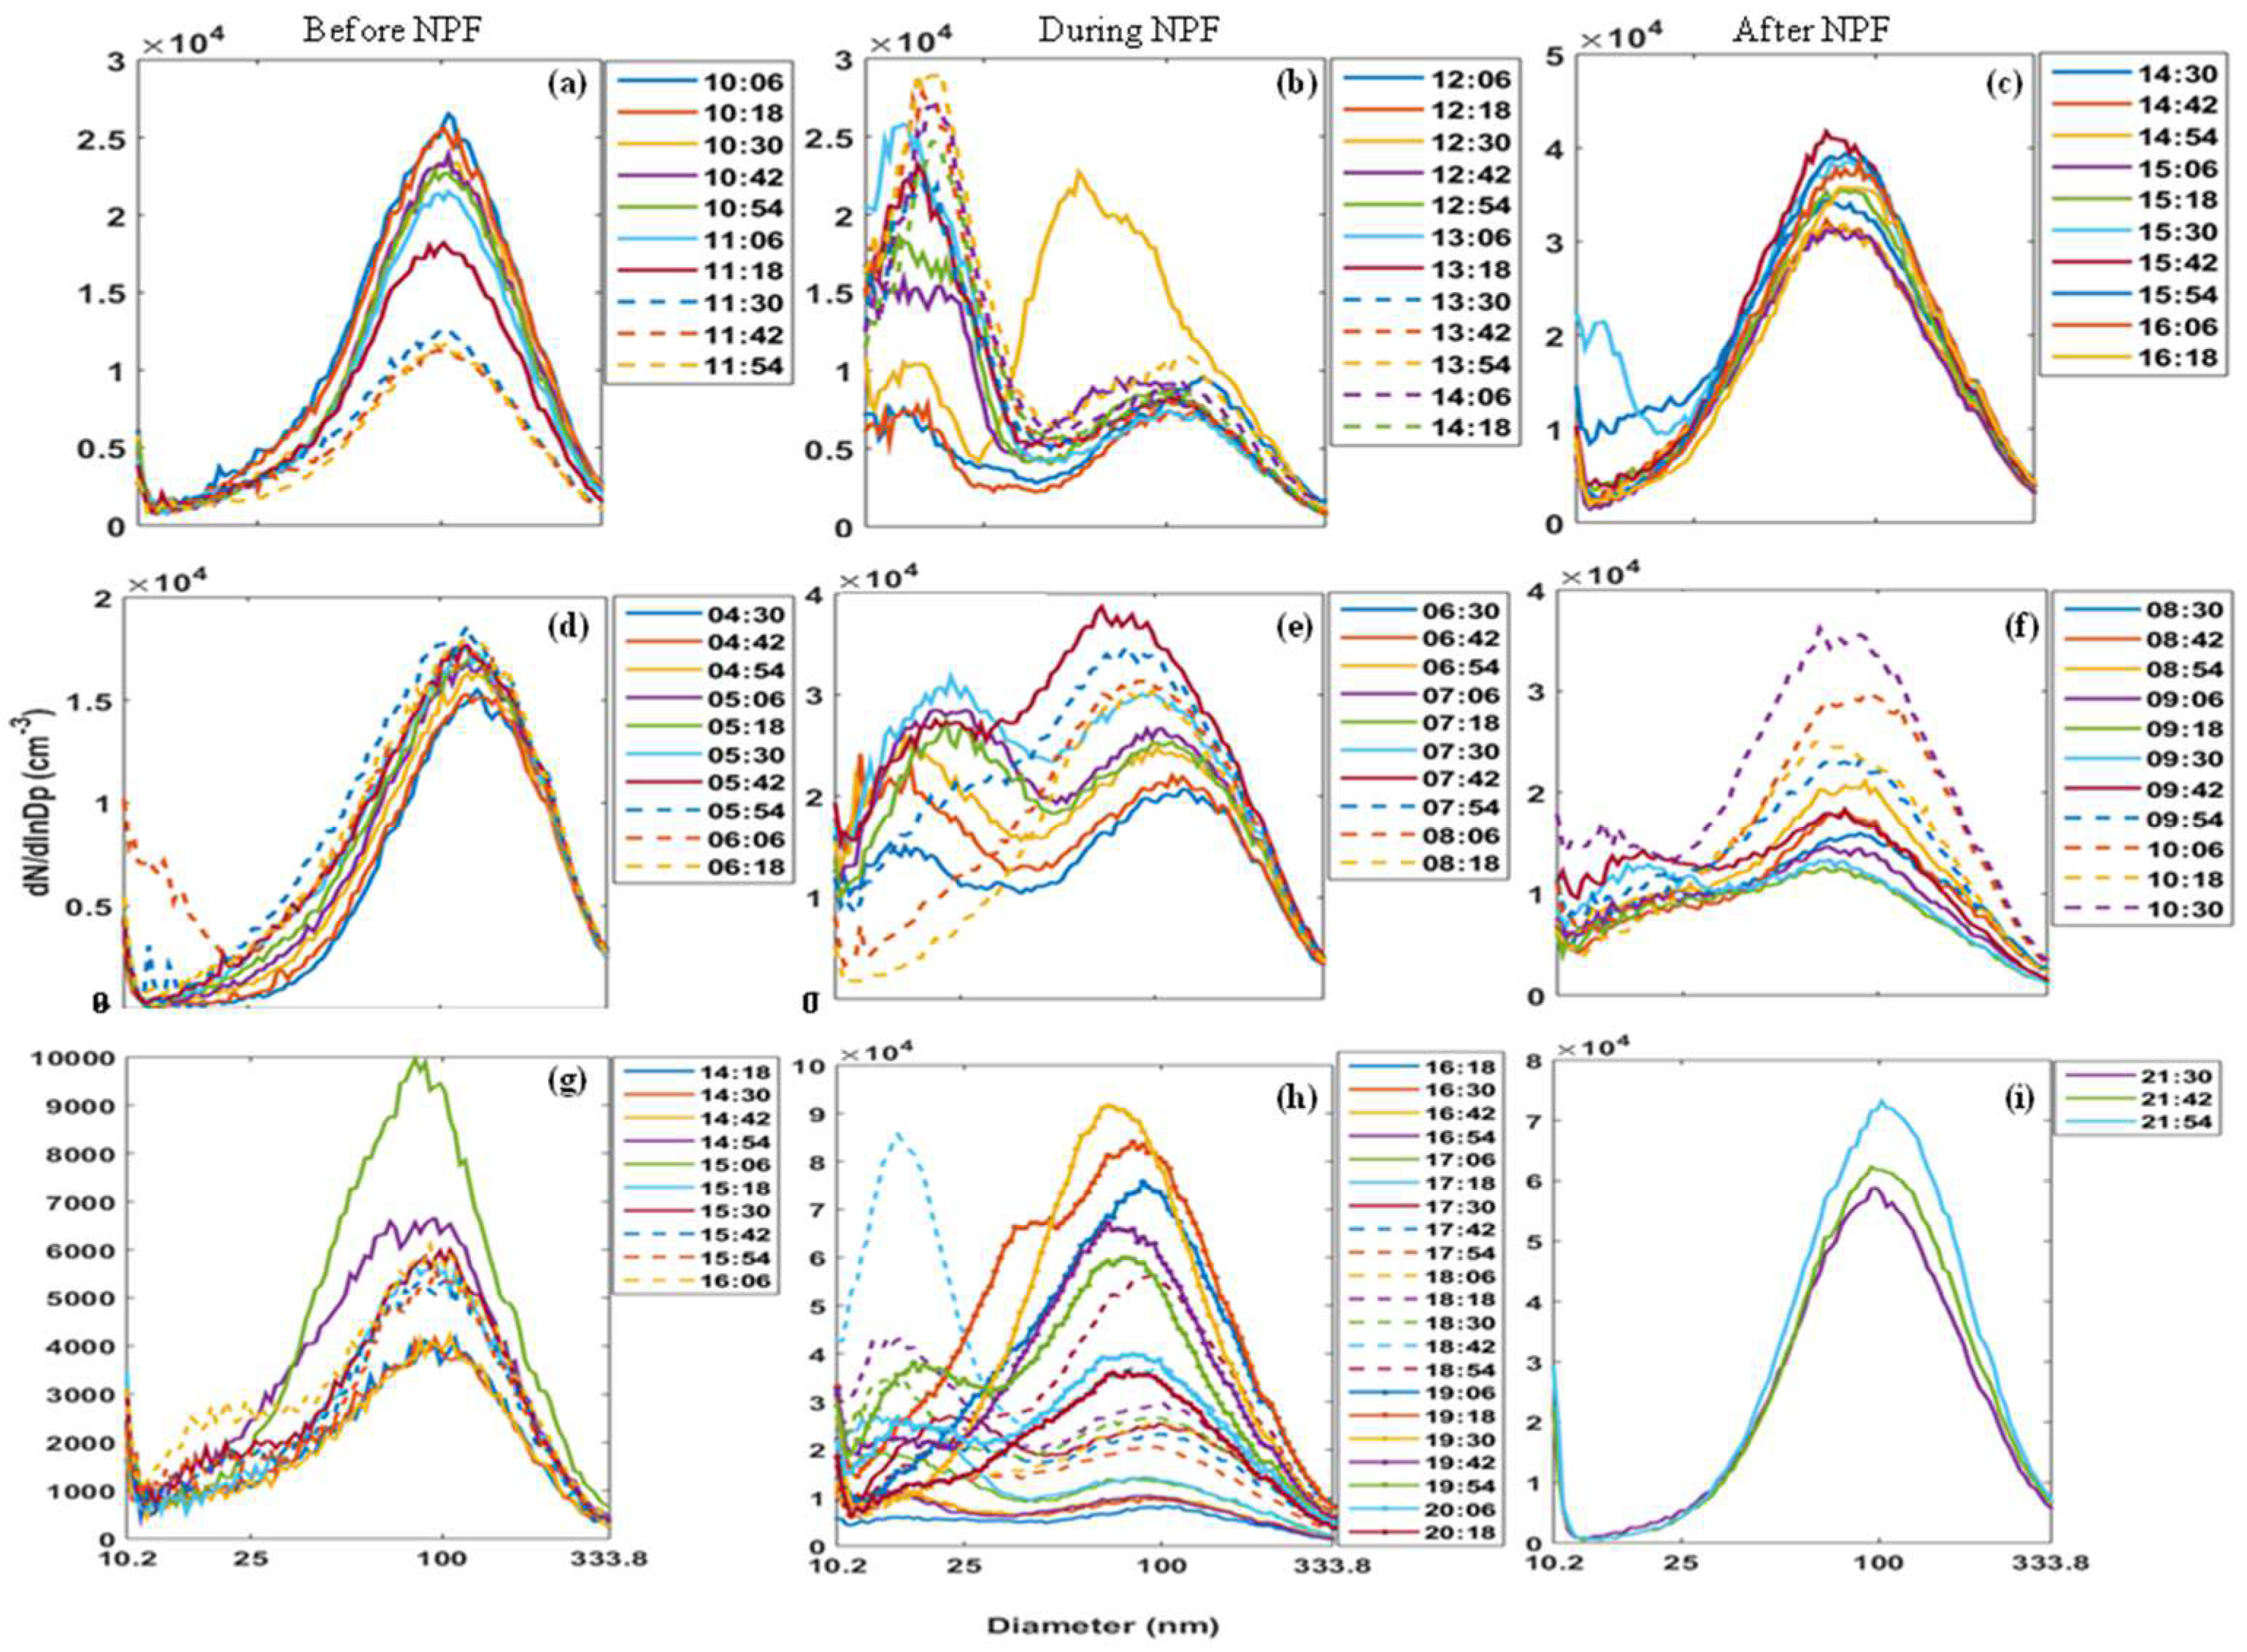
We identified three NPF events during our study period based on aerosol PNSD (dN/dlnDp; Figure 3). The nucleation mode was used to identify the particle burst event where a distinct new mode appears at the lower size ranges. There were distinct temporal variations of dN/dlnDp before NPF (Figure 3a,d,g), after NPF (Figure 3c,f,i), and during the NPF period (Figure 3b,e,h). Usually, the number–size spectrum exhibits peaks in the larger size regime, but during the NPF events, an “open mode” began to appear at the lower end of the size ranges (nucleation mode), which later disappeared and/or shifted to a higher size range through coagulation loss or condensation sink, designated as subsequent growth. Only those instances when the size of the ultrafine aerosols continues to grow at a rate of a few nanometres per hour for a few hours at a time are classified as NPF events [57,64], as discussed in a successive section.

3.3. Characterisation of One of the NPF Events

3.3.1. Variation of Number Concentration (Ntotal) with a Geometric Mean Diameter (GMD)

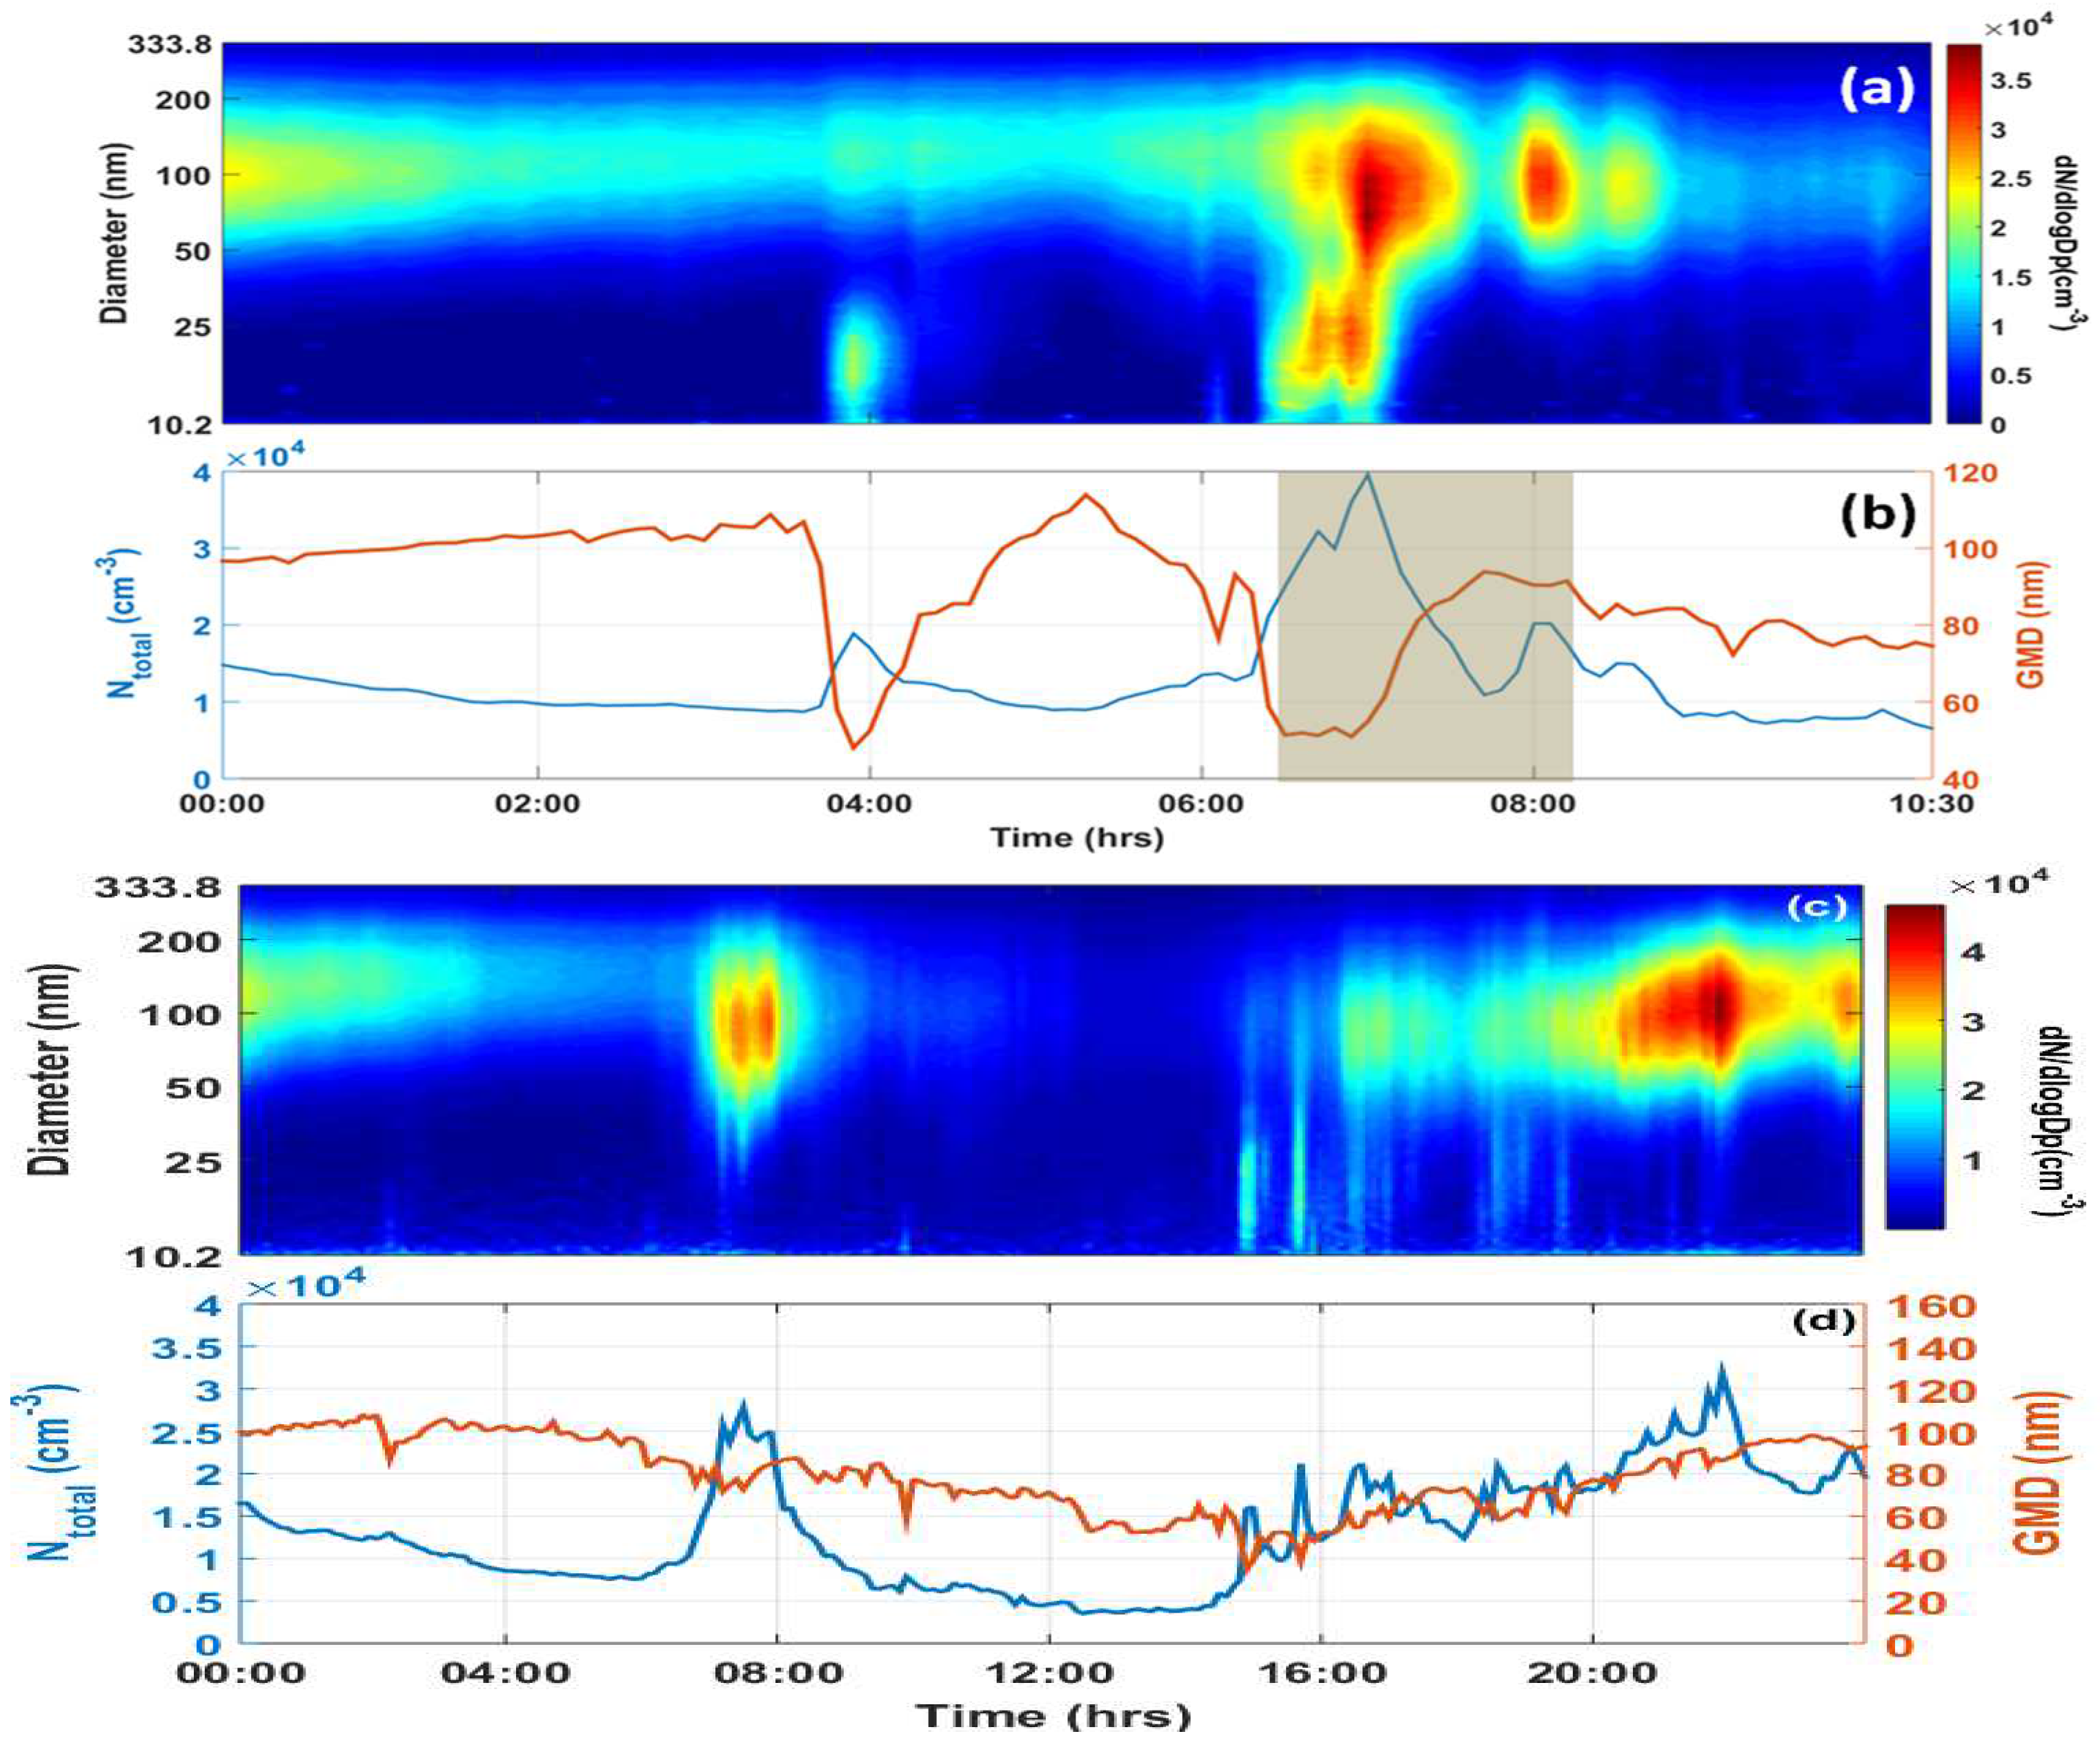
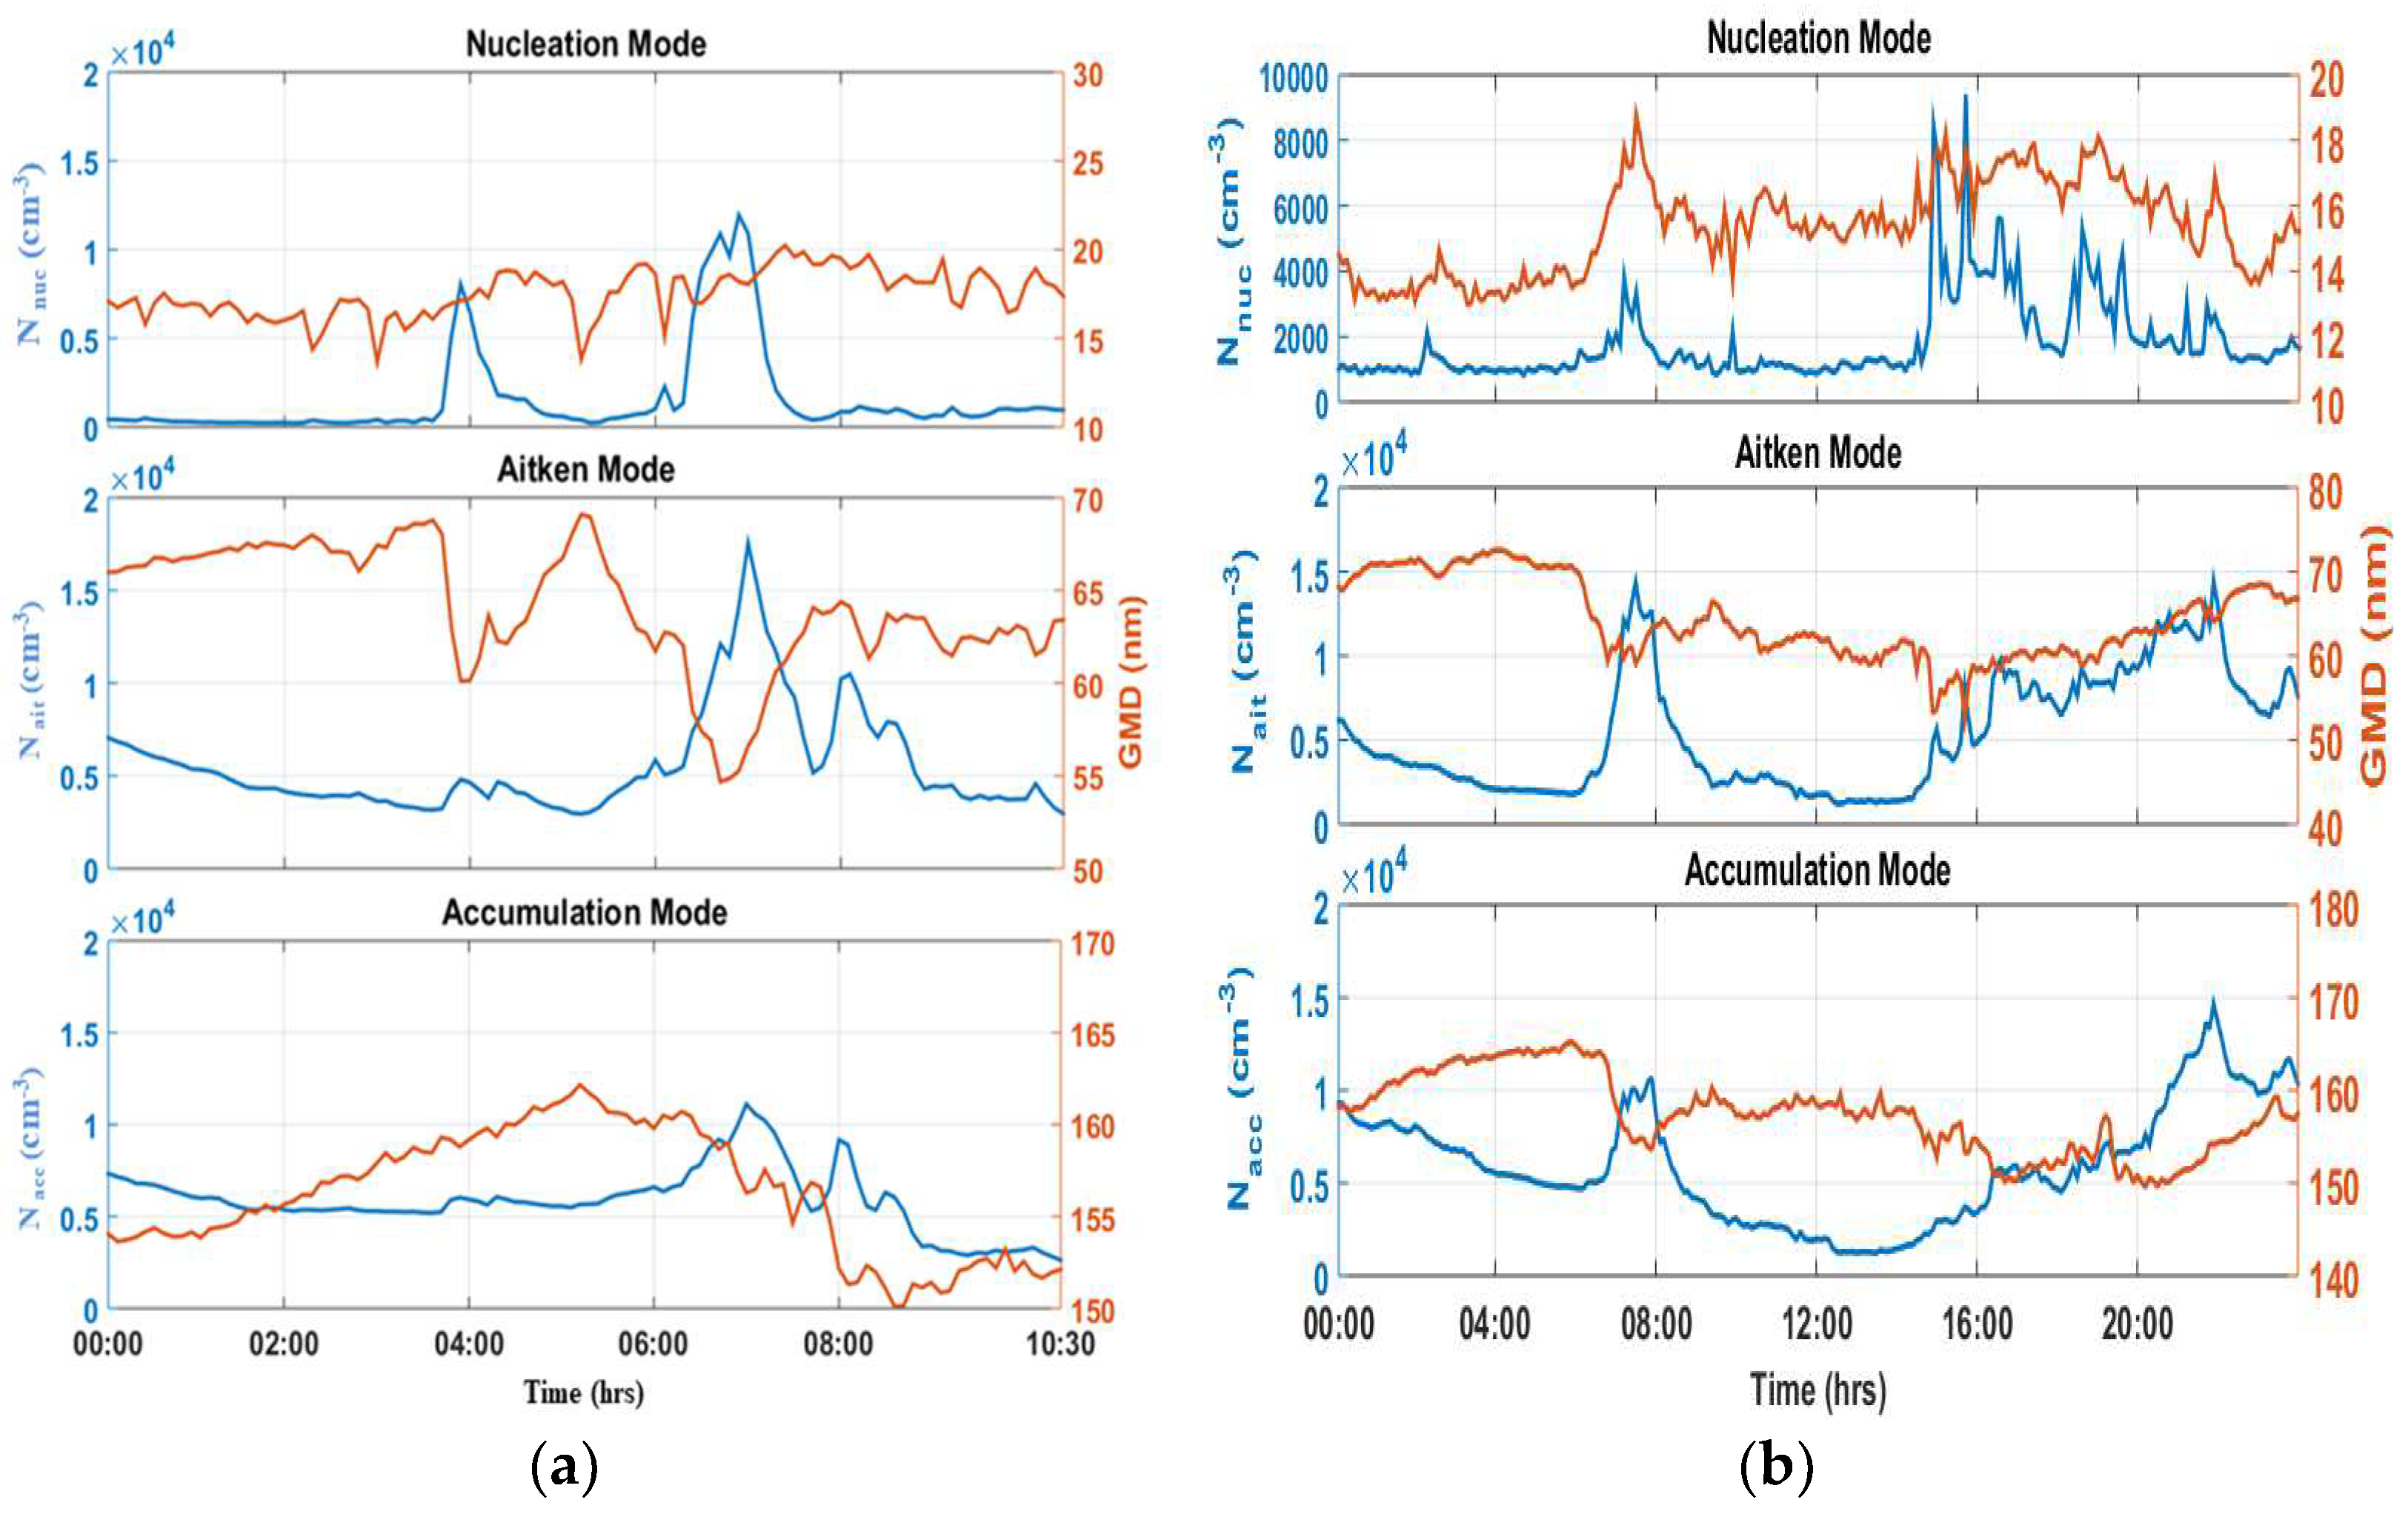
The day of 3 December 2016 was considered representative of NPF occurrence when the nucleation burst was observed at 06:30 hrs, with a rapid increase in Ntotal (highest, 3.96 × 104 cm−3; Figure 4a) and a simultaneous dip in the GMD (lowest, ~48.05 nm; Figure 4b). Later, the GMD value continued to increase with decreasing number concentration. It may be noted that another NPF event was triggered earlier around 04:00 hrs but did not develop into a full-grown event. Further, the temporal evolution of the GMD under different mode regimes on same NPF and on non-NPF days is presented in Figure 5. During an NPF event, the peaks occurred in all regimes, but the initial burst was seen in the nucleation mode, which later grew from nucleation to Aitken and then to accumulation mode. A large GMD dip occurred in Aitken mode simultaneously with the nucleation burst in nucleation mode (Figure 5a), which further supported the NPF burst. Moreover, during the NPF period, the contribution of Nnuc to Ntotal was significantly high (~40–45%; Figure S9), whereas the contribution during a non-NPF day was only 5–10%. For reference and more clarity, we also included the details of the other NPF events in the supplementary files (Figures S1–S4, 2 December 2016, and Figures S5–S8, 16 December 2016). However, no simultaneous nucleation burst and GMD growth with a prominent peak and dip, respectively, was observed on non-NPF days (e.g., 23 December 2016, Figure 4d and Figure 5b).

3.3.2. Variation of Coagulation Loss (Fcoag), Condensation Sink (CondS) in Different Mode Regimes and Growth Rate (GR)

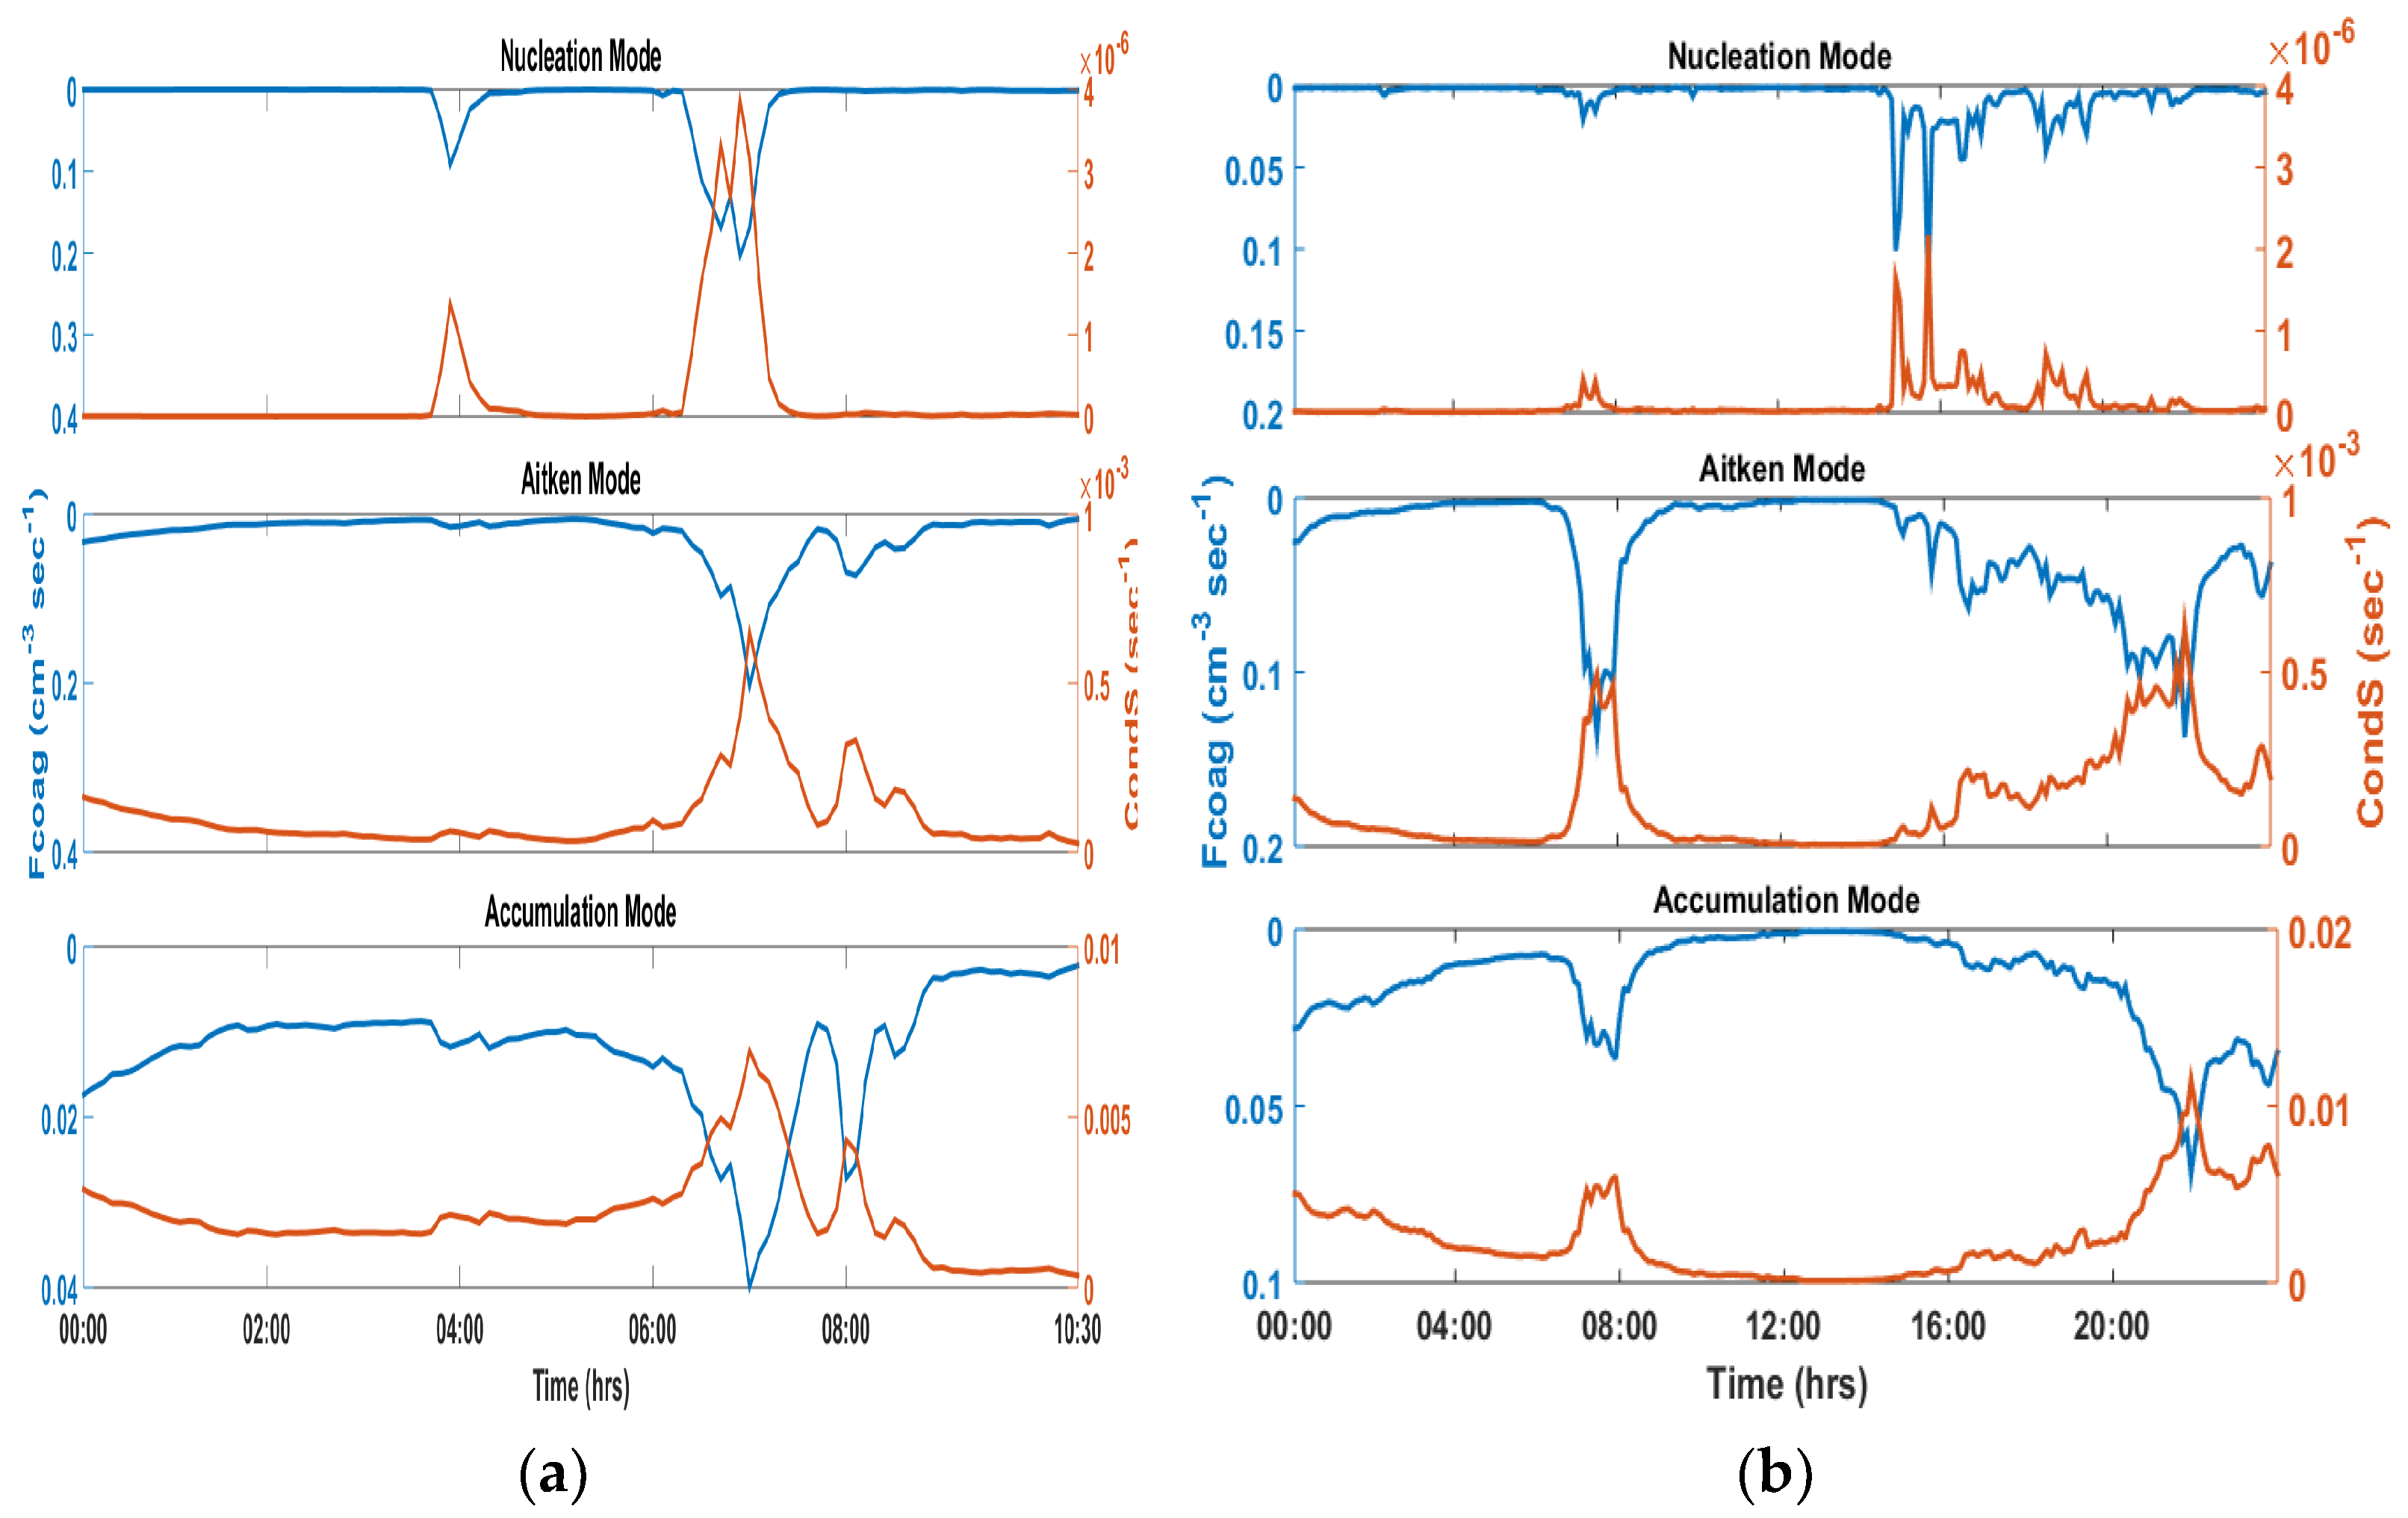
During the coagulation process, the small particles kept colliding with each other due to their relative motion; the diameter increased, and as a result, Nnuc decreased after the NPF burst [58]. Fcoag and CondS were calculated for the nucleation, Aitken, and accumulation modes. During the NPF events (Figure 6a), the average Fcoag in the nucleation, Aitken and accumulation modes was 0.023 ± 0.038 cm−3 s−1, 0.024 ± 0.031 cm−3 s−1, and 0.012 ± 0.007 cm−3 s−1, respectively, meaning that ~ 0.023 ± 0.038, ~ 0.024 ± 0.031, and ~ 0.012 ± 0.007 particles were lost per second per unit volume in nucleation, Aitken, and accumulation modes, respectively (Figure 6). The average CondS in the nucleation, Aitken, and accumulation modes was around (2.27 ± 3.73) × 10−6 cm−3, 0.008 ± 0.007 cm−3, and 0.002 ± 0.0013 cm−3, respectively. Thus, Fcoag being dominant in the nucleation and Aitken modes during the NPF period suggests the presence of pre-existing ultrafine particles and high relative particle motion. However, in accumulation mode, CondS was quite high, suggesting that large particles were lost through condensation only. However, on the non-NPF day, Fcoag and CondS were sufficiently weak because of the availability of lesser nucleated particles in the atmosphere (Figure 6b).
After the burst in nucleation mode, as discussed earlier, if the ultrafine aerosols keep on growing at a rate of a few nanometres per hour for more than an hour, then and only then is the event classified as an NPF event [57]. Thus, we calculated the growth rate (GR) of the newly formed particles from the slope of the first-order polynomial fit of the geometric mean diameter (GMD) over time for the event days as well for a non-event day (Figure 7a,b). The average GR on 3 December 2016 was 31 nm/hr during the event period. Before the event, there was a large fluctuation in the GMD, which became weaker after the event period (Figure 7a). However, on the non-NPF day, no such variation was observed (Figure 7b). The GR on the other two event days, 2 December 2016 and 16 December 2016, were found to be 13 nm/hr and 7.5 nm/hr, respectively (Table 1). A GR in the range 0.1–30 nm/hr has been reported over diverse environments across the globe using different types of instruments in recent decades (Table 2). Over India, an average GR of 0.3 to 30 nm/hr has been reported [27,30,31,32,33,34], and event-wise, a GR of 30 nm/hr has been observed over New Delhi, a polluted location [65], which is comparable to the value reported on 3 December 2016. The higher GR values over this location may be associated with high levels of existing precursors, which are in line with the observation that the study region is the second highest in aerosol loading over South Asia next to the Indo-Gangetic Plains [53]. Although the region is semi-urban, its topography serves as a sink for several remote aerosols, as noted earlier. The CondS varied from 5.4–170 × 10−3 s−1 (Table 2).

3.3.3. Statistical Interpretation of NPF Parameters

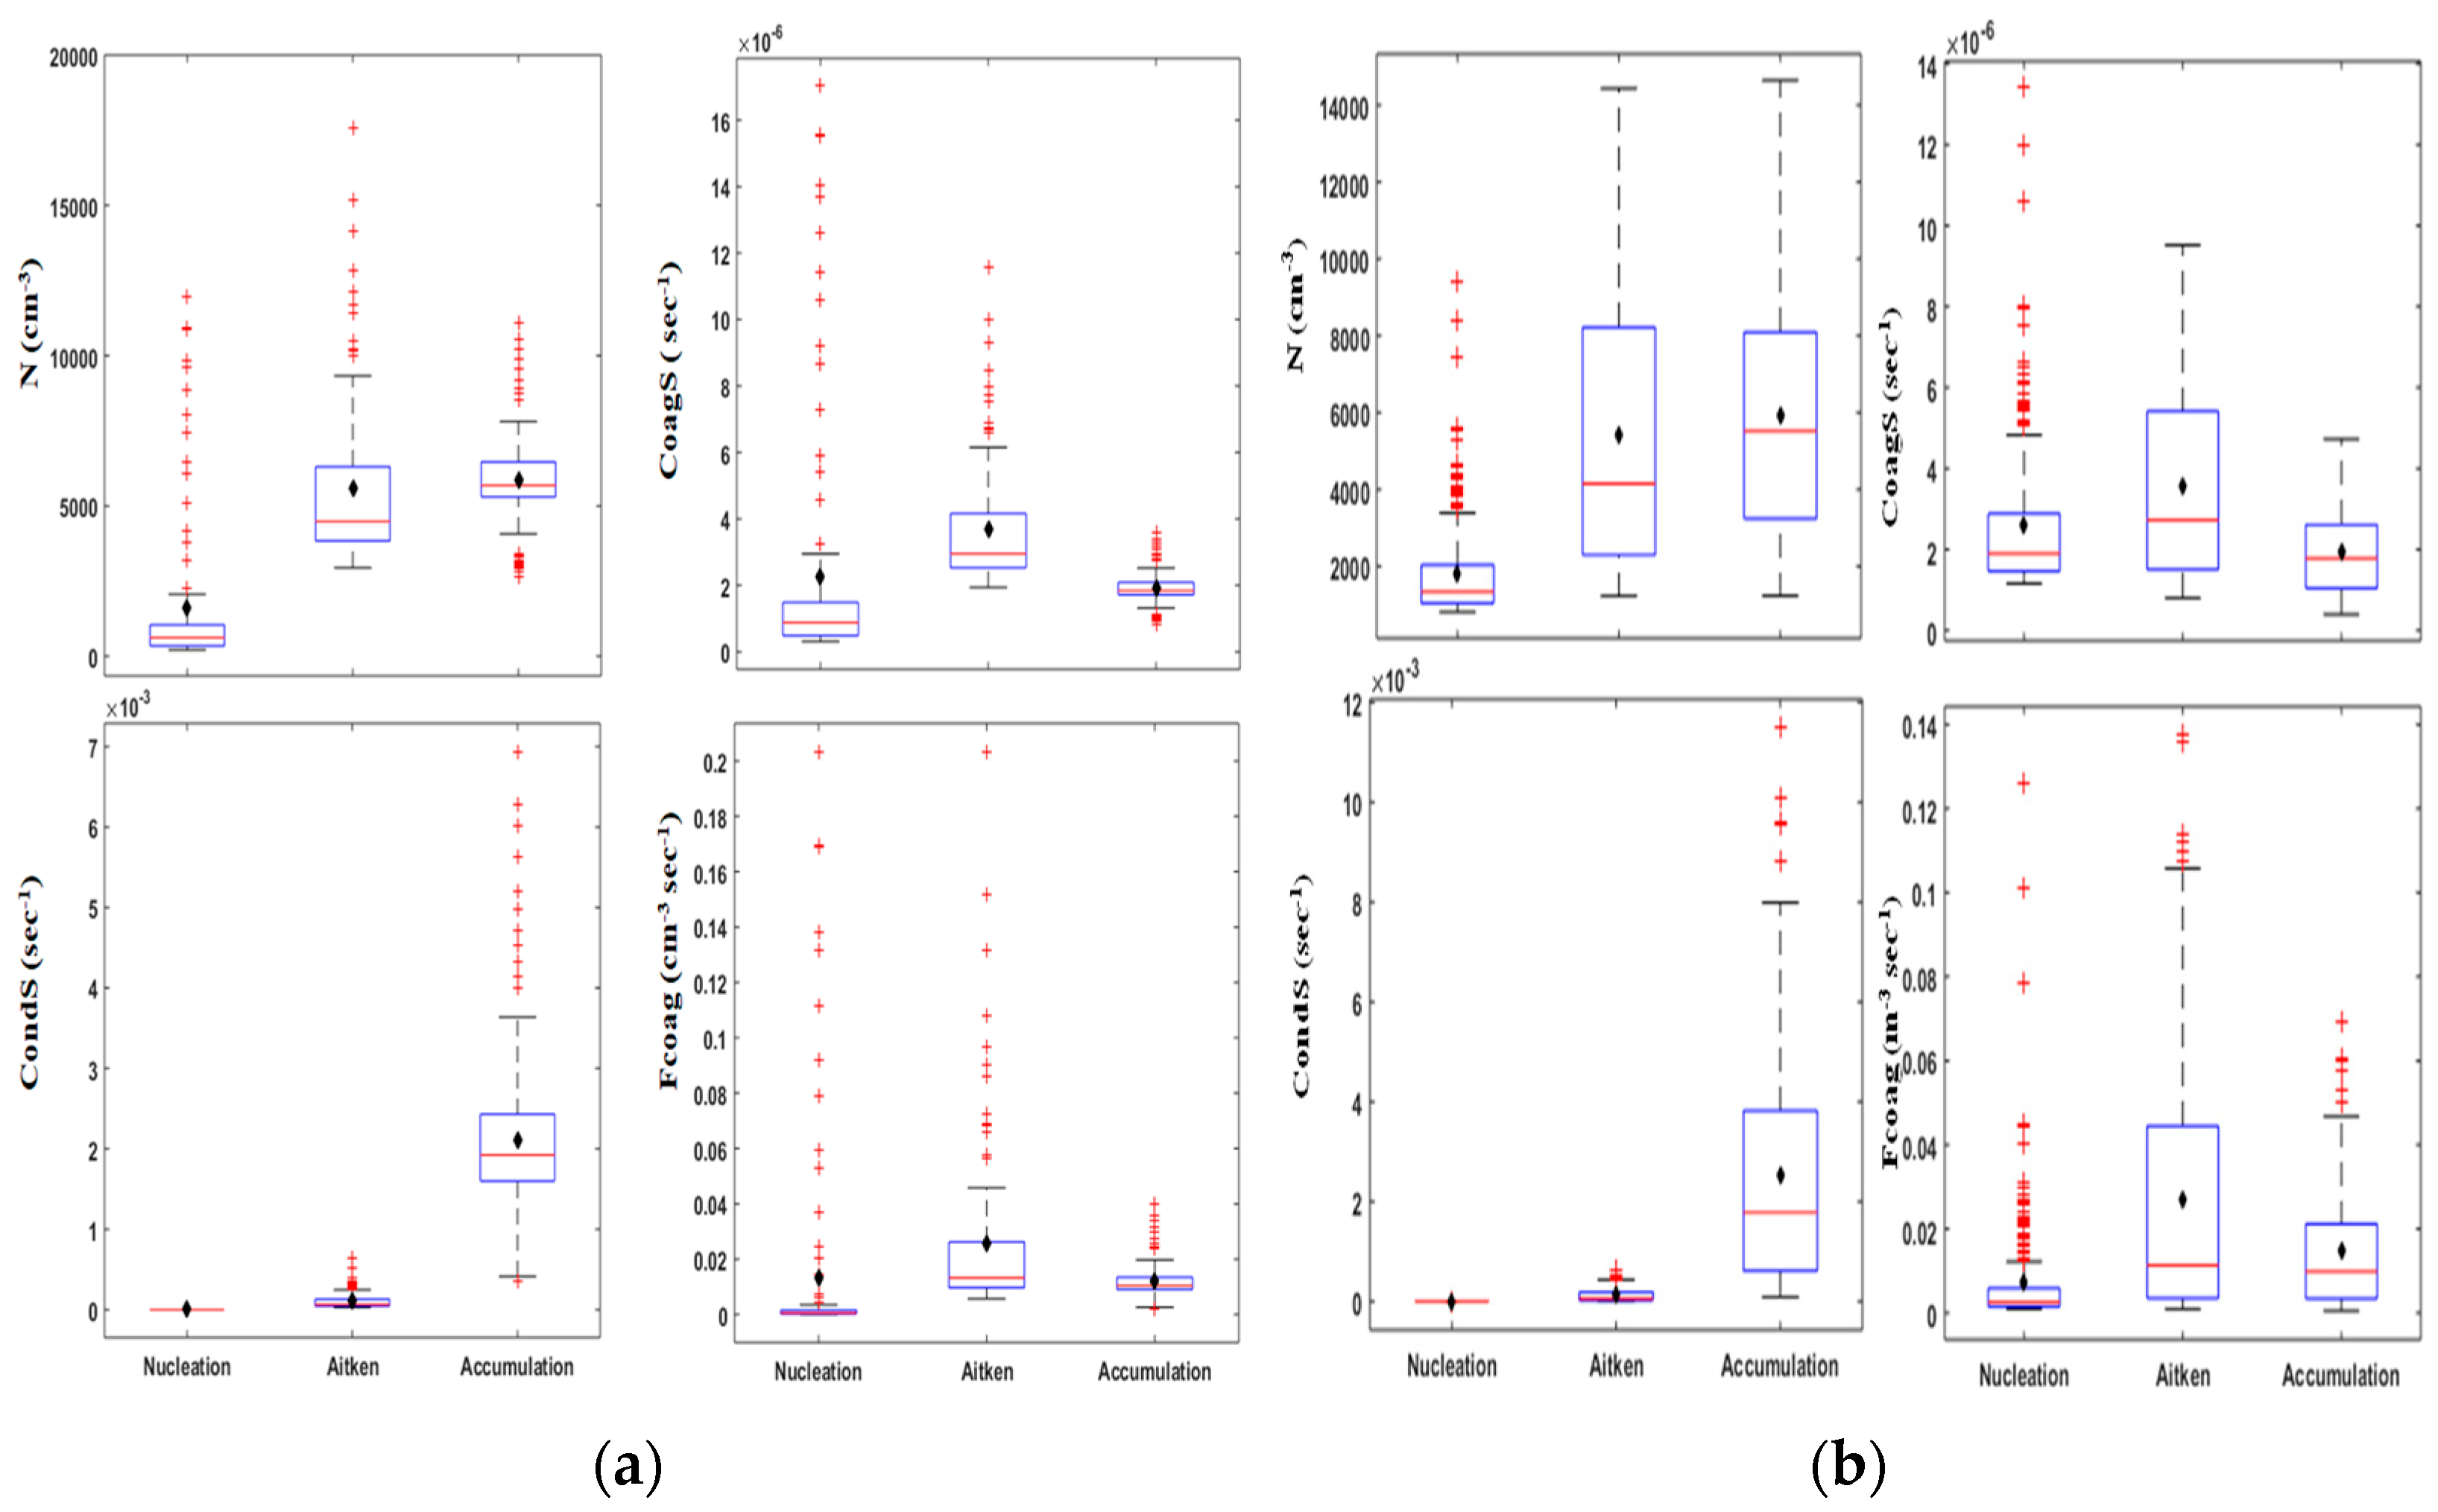
Figure 8a shows the box–whisker plot of the number concentration (N), CondS, CoagS, and Fcoag at different size modes. The positive standard deviation (SD) of N from its average value was significantly high in the nucleation and Aitken modes, which depicts the ultrafine particle burst (rapid fluctuation) in a lower size regime. Similarly, the SDs of CoagS and Fcoag in the lower size regime were significantly higher, implying that the particle loss was more rapid than in the lower size regime (nucleation, Aitken). However, contrasting behaviour was observed in CondS, where the SD was more significant in a higher size regime (accumulation), implying that particles were lost via condensation in a higher mode. Moreover, it was observed that the mean value was greater than the median value (Table S1). Thus, the particles grew to higher size ranges through coagulation and condensation, giving rise to a longer tail after the mode known as a positive skew or a right-skewed distribution. This right-skewed distribution in number concentration in all the modes revealed some significantly higher values associated with the nucleation burst and subsequent growth to the Aitken and accumulation modes. On the non-NPF day, the N, CondS, CoagS, and Fcoag values were comparatively low with less fluctuation than on the NPF day. However, the positive skewness was weaker in the nucleation mode and was absent in the Aitken and accumulation modes, as particle-burst-related growth through Fcoag and CondS was absent on that day (Figure 8b).
Table 2. Summary of calculated parameters of NPF events in different global locations.
Location Location TypeMeasurement
Period
InstrumentSize Range (nm)CondS
(10−3 s−1)
GR
(nm/hr)
Ref
Lanzhou, ChinaSuburbanJune–July 2006DMA10–5009.0–24.01.4–16.9[66]
Vavihill, SwedenRuralFebruary–May 2001–2004DMPS3–9005.42.5[67]
Egbert, CanadaRuralJune–July 2007FMPS + SMPS14–100007 ± 0.55.1[62]
Hyytiala, FinlandForest ruralOctober 2010–September 2011DMPS + PSM + CPCB + NAIS + AIS + BSMA 0.9–1000,ND1.4[15]
Shanghai, ChinaUrbanNovember 2013–January 2014nCNC + SMPS1.34–3, 14–615 27.02.3[68]
India (Delhi, New delhi Pune, Hyerabad)UrbanNovember–December 2011, 1–7 November 2016
March–May 2012,
April–June 2019
SMPS,
DMPS,
NAIS + SMPS, nCNC + SMPS
9–245, 10–800,
3.85–47.8,
1–514
60.0,
60–170
6.6 ± 1.5,
17 ± 16.5
3.9,
1.6–30
7.4 ± 1.4,
2.2 ± 1.7
[36],
[65],
[69],
[39]
India (Solapur, Gadanki)Semi-urban/
Semi-rural
August 2018–January 2019, May–July 2012SMPS,
WRAS
15–700,
5–32
16.4 ± 6,
7.1 ± 4.6
1.2–13.8, 4.1 ±2.0[36],
[32]
India (Mahabaleshwar, Mukteshwar, Ranichauri, Hanle)MountainOctober–November 2014,
November 2005–January 2010, December 2016–September 2018, August 2010
WRAS,
DMPS,
DMPS,
SMPS
5–32,
10–800,
10–800,
16–1364
15.4 ± 2.6,
7.4 ± 4.3,
8.6 ± 5.8,
-
1.4 ± 0.4,
2.4,
6.7 ± 3.8, 0.1 ±20.0
[70],
[71],
[72],
[31]
India (ICARB-2018)CruiseJanuary–February 2018SMPS10–414 19.8 ± 55.014.4 ± 13.1 [35]
India (Dibrugarh)Semi-urbanNovember–December 2016SMPS10.2–333.8 7.2 ± 3.617.16± 12.29present Study
Here, DMPS—differential mobility particle sizer; FMPS—fast mobility particle sizer; SMPS—scanning mobility particle sizer; BSMA—balanced scanning mobility analyser; IGMA—inclined grid mobility analyser; AIS—air ion spectrometer; nCNC—nano-condensation nucleus counter; NAIS—neutral air–ion spectrometer, WRAS—wide-range aerosol spectrometer; ND—not defined.

3.4. NPF Precursor Dynamics

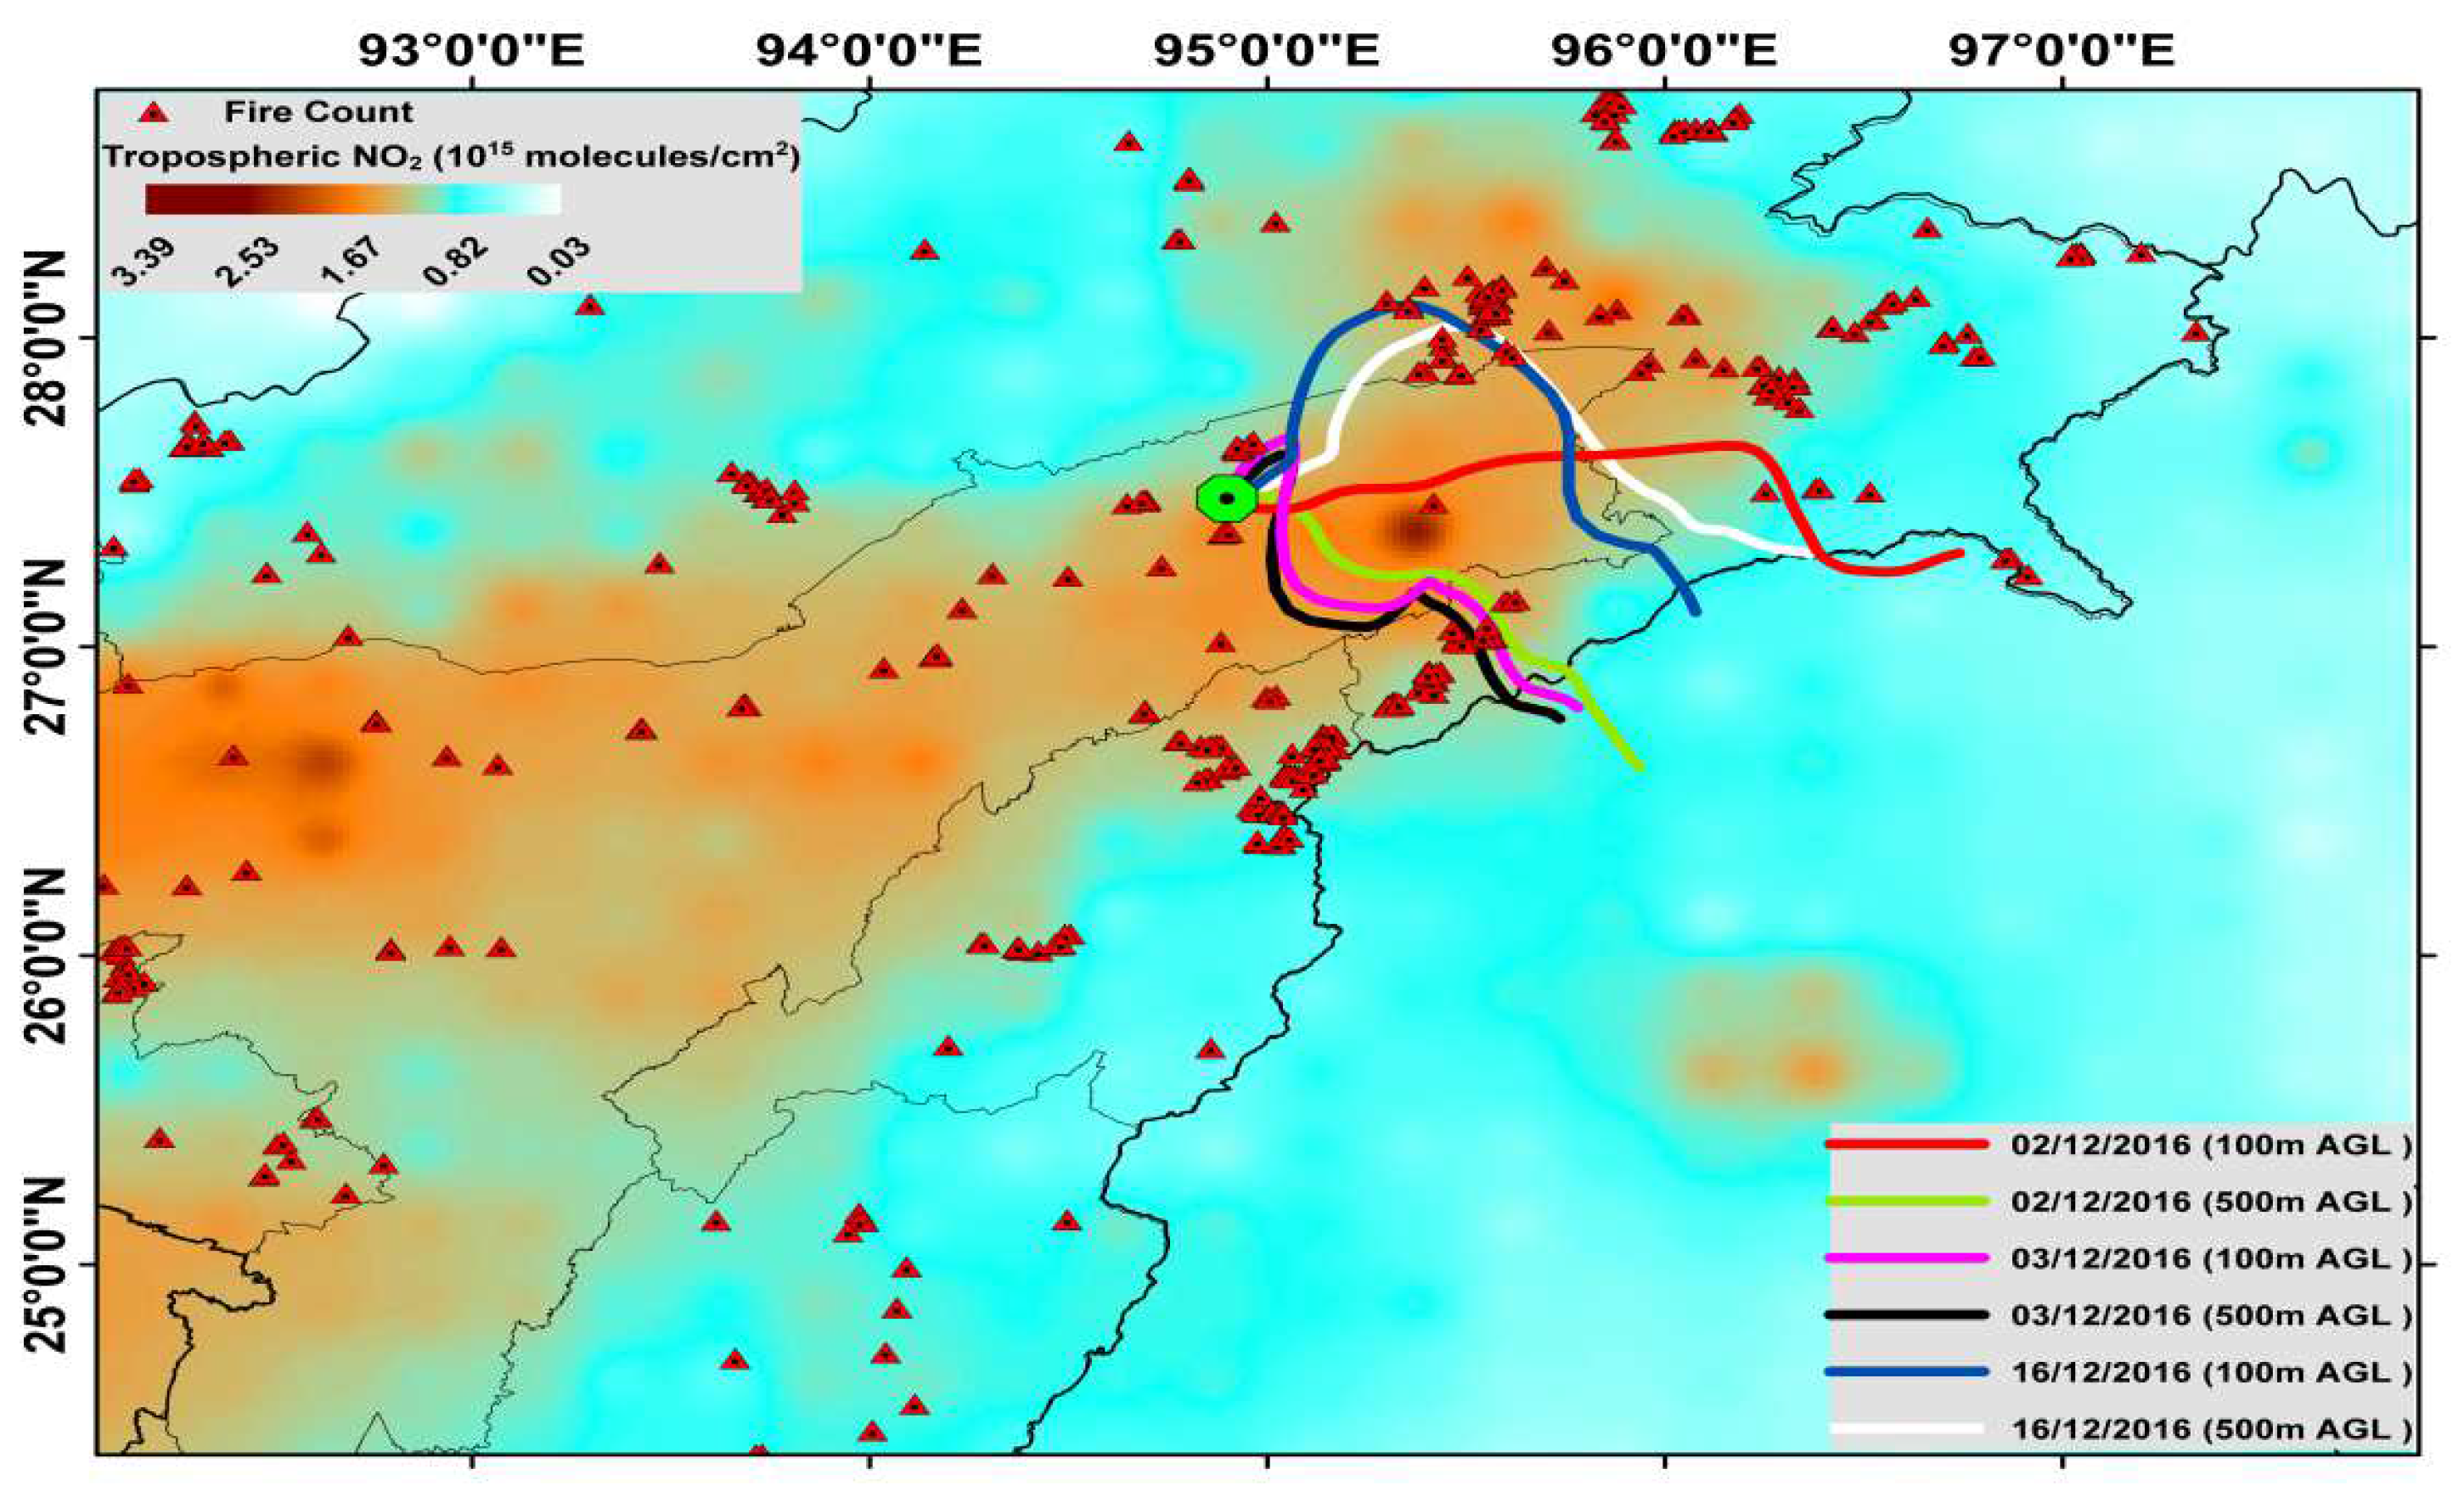
To understand the behaviour of the NPF precursors over the measurement site, the variation of tropospheric NO2, SO2, and HCHO using level-three gridded OMI satellite data, as well as fire counts detected by MODIS during 15 November–16 December 2016, were examined. We observed that the concentration of tropospheric NO2 and fire counts in adjoining areas of the study location were significantly high (Figure 9). Moreover, to understand the possible flow path and source of the transportation of air mass to the site, 48-hour backward trajectories (100 m, 500 m AGL) during the NPF period were performed. This revealed the confinement of the plumes within an area of radius ~100 km and reaching the observation site from the east and southeast directions, where maximum local fire events were also detected.
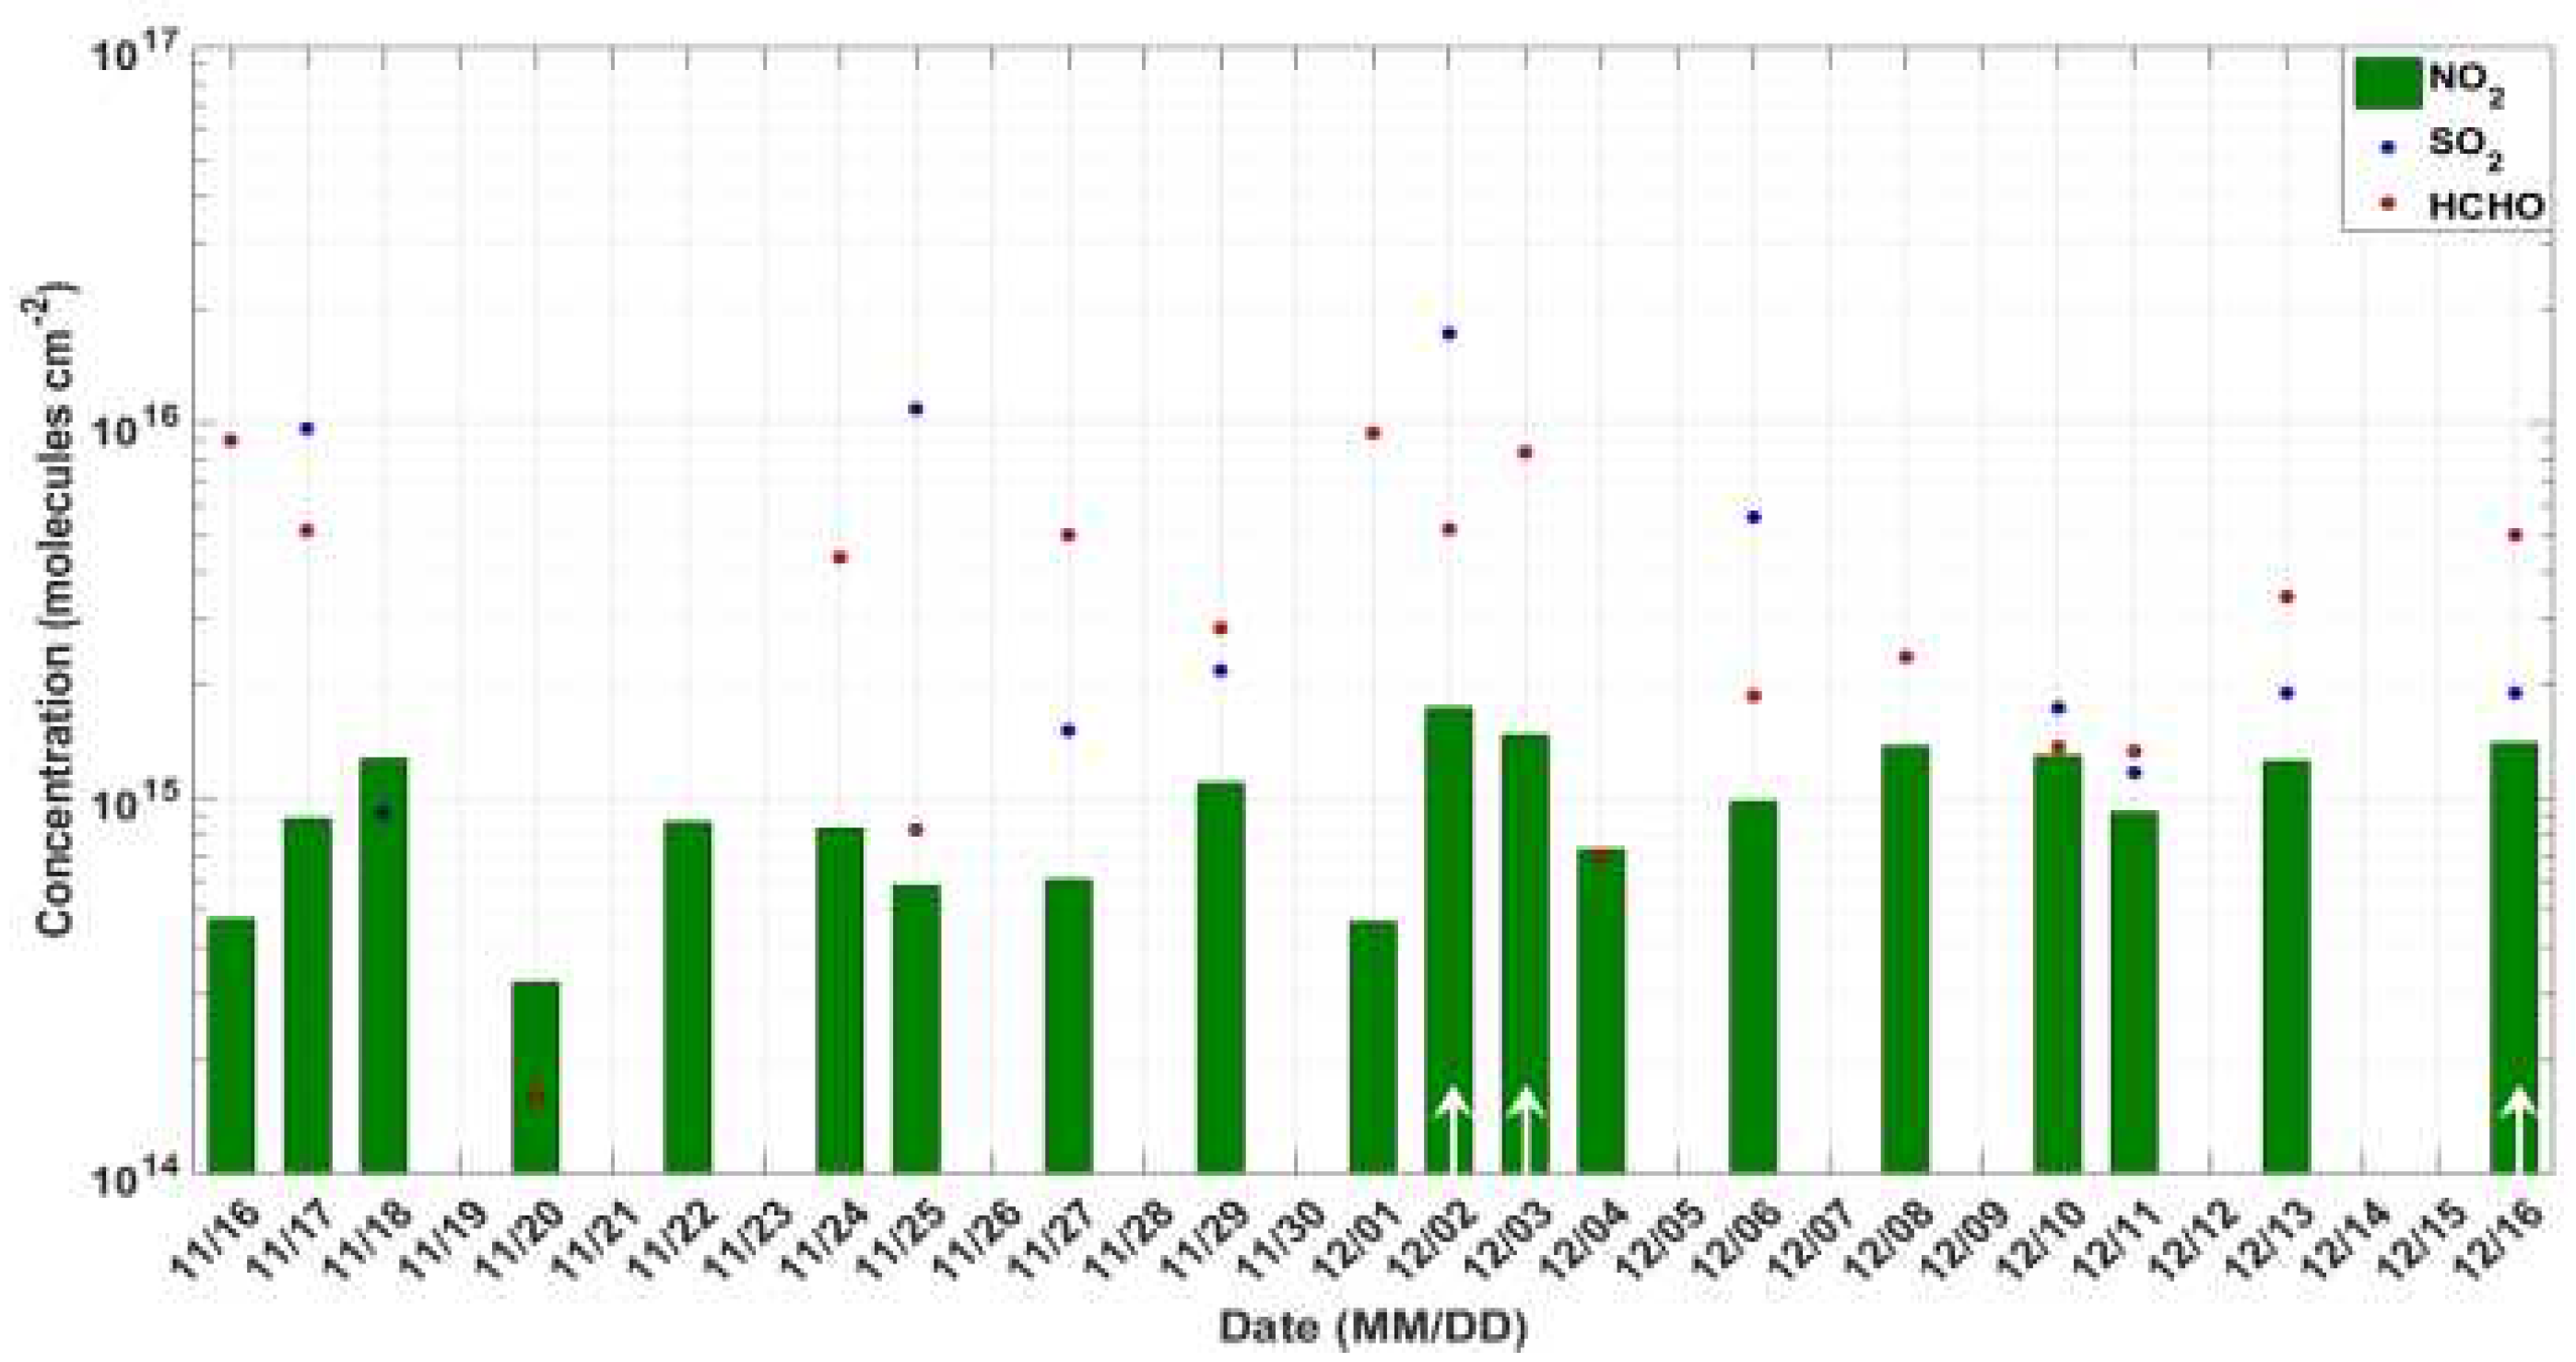
The average concentrations of NO2, SO2, and HCHO during the study period were (9.76 ± 3.93) × 1015, (4.97 ± 5.35) × 1015, and (3.90 ± 2.91) × 1015 molecules cm−2, respectively. During the NPF event days, the precursor concentration level was higher than that of non-NPF days (Figure 10). However, the in situ observation of these precursors will give a more accurate behaviour of these NPF precursors’ dynamics and chemistry. The concentration of various species such as BC, CO, PM, etc. over the present study location is higher than in many other locations of India and has been well documented [47,50,51]. Additionally, this location has recently experienced an increase in anthropogenic aerosols such as sulphates and organics due to growth in population and industrialisation [73]. NO2, SO2, and HCHO, when advected from distant places to the study site, can participate in photochemical reactions to form new particles through the GTP mechanism during the daytime. Further, the transported nanocluster particles may contribute to NPF bursts at the study site. However, a more critical and in-depth study is required to confirm the same.

4. Conclusions

The diurnal variation of ultrafine and fine particles along with various parameters was studied to investigate NPF events at a semi-urban location in Dibrugarh in the EHF. Out of 22 days of measurements from November–December 2016, the NPF occurrence frequency was found to be ~14%. The NPF events were identified from the hourly mean distribution of the number–size spectrum, where an “open mode” began to appear at the lower size spectrum (nucleation and Aitken modes), which sustained for at least an hour followed by an indication of growth. A peak in the number concentration with a simultaneous abrupt drop in the GMD further supported an NPF burst with an abundance of ultrafine particles. The contribution of Nnuc to the Ntotal during the NPF period was up to 40–45%, but was only 5–10% on non-NPF days. Fcoag dominated in the lower size spectrum, i.e., nucleation and Aitken modes, whereas condensation was predominant in the higher size spectrum, i.e., accumulation mode. We found the average growth rate to be 17.16 ± 12.29 nm/hr in the present study, consistent with the reported values from the Indian region. The concentration of the NPF precursors NO2, SO2, and HCHO was comparatively higher on NPF days. Moreover, 48 h backward air mass trajectories at different AGLs revealed that the plumes were locally confined, which might have influenced the NPF bursts through photochemistry during daytime and the air mass contribution of nanocluster aerosols both during day and night times. The long-term systematic observation of ultrafine aerosols and precursor gases is required to understand the detailed NPF chemistry, seasonality, and its contribution to total aerosol loading concerning fog, haze, and cloud formation.

Supplementary Materials

The following supporting information can be downloaded at: https://www.mdpi.com/article/10.3390/atmos14050795/s1, Figure S1: Representative observation of NPF event on 2 December 2016 (a) Contour plot of number concentration showing the formation and growth of new particles between 12:42–14:12 hrs and, (b) Variation of Ntotal, and GMD from 10:30 hrs to 21:00 hrs, where the shaded portion is the event period; Figure S2: Variation of number concentration and GMD of nucleation-(top), Aitken-(middle) and accumulation-mode (bottom) particles on 2 December 2016 from 10:30 hrs to 21:00 hrs; Figure S3: Variation of Fcoag and CondS for nucleation-(top), Aitken-(middle) and accumulation-mode (bottom) particles on 2 December 2016; Figure S4: Scatter plot between the GMD versus local time. The solid line is the regression fit through GMD data points during the NPF growth period on 2 December 2016; Figure S5: Representative observation of NPF event on 16 December 2016 (a) Contour plot of number concentration showing the formation and growth of new particles between 16:00–21:48 hrs and, (b) Variation of Ntotal, and GMD from midnight hrs to 22:00 hrs, where the shaded portion is the event period; Figure S6: Variation of number concentration and GMD of nucleation (top), Aitken (middle) and accumulation-mode (bottom) particles on 16 December 2016 from midnight to 22:00 hrs; Figure S7: Variation of Fcoag and CondS for nucleation-(top), Aitken-(middle) and accumulation-mode(bottom) particles on 16 December 2016; Figure S8: Scatter plot between the GMD versus local time. The solid line is the regression fit through GMD data points during the NPF growth period on 16 December 2016; Figure S9: Contribution of Nnuc and Nait to the Ntotal on 3 December 2016; Table S1: Summary statistics of calculated parameters in different size regime on 3 December 2016.

Author Contributions

B.D. was responsible for writing the original draft, formal analysis and software; T.S. and L.C., were responsible for data curation; B.P. and P.K.B. were responsible for conceptualisation, methodology, investigation, reviewing, editing, supervision, project administration, and funding acquisition. All authors have read and agreed to the published version of the manuscript.

Funding

This work is supported by UGC under SAP DRS II and ISRO under GBP ARFI projects.

Institutional Review Board Statement

Not applicable.

Informed Consent Statement

Not applicable.

Data Availability Statement

The particle number size distribution (PNSD) was collected with the Scanning Mobility Particle Sizer (SMPS) which consists of an electrostatic classifier (TSI model 3082), kr-85 neutraliser along with a differential mobility analyser (DMA, TSI model 3081), and a butanol condensation particle counter (CPC, TSI model 3788). Data will be available on request. Giovanni portal (https://giovanni.gsfc.nasa.gov/giovanni/) was used to download the database from MODIS and OMI accessed on 10 January 2023. The primary tools to analyze the data are MATLAB (www.mathworks.com/products/).

Acknowledgments

This work falls under the project objectives of SAP DRS II sponsored by the University Grants Commission, Govt. of India under the supervision of PKB. TS and LC are respectively indebted to the Indian Space Research Organization and Department under ARFINET of Science and Technology under its HICAB initiative for providing fellowships during data curation, reported in this study. BD is grateful to the Department of Science and Technology, Government of India for providing him with a fellowship under SERB WEA Project: WEA/2021/000013. The authors are also thankful to OMI and the MODIS science team for the data used in this analysis.

Conflicts of Interest

The authors declare no conflict of interest.

References

  1. Kulmala, M.; Vehkamäki, H.; Petäjä, T.; Dal Maso, M.; Lauri, A.; Kerminen, V.-M.; Birmili, W.; McMurry, P.H. Formation and Growth Rates of Ultrafine Atmospheric Particles: A Review of Observations. J. Aerosol Sci. 2004, 35, 143–176. [Google Scholar] [CrossRef]
  2. Spracklen, D.V.; Carslaw, K.S.; Kulmala, M.; Kerminen, V.-M.; Mann, G.W.; Sihto, S.-L. The Contribution of Boundary Layer Nucleation Events to Total Particle Concentrations on Regional and Global Scales. Atmos. Chem. Phys. 2006, 6, 5631–5648. [Google Scholar] [CrossRef]
  3. Kuang, C.; McMurry, P.H.; McCormick, A.V. Determination of Cloud Condensation Nuclei Production from Measured New Particle Formation Events. Geophys. Res. Lett. 2009, 36, L09822. [Google Scholar] [CrossRef]
  4. Asmi, E.; Kivekäs, N.; Kerminen, V.-M.; Komppula, M.; Hyvärinen, A.-P.; Hatakka, J.; Viisanen, Y.; Lihavainen, H. Secondary New Particle Formation in Northern Finland Pallas Site between the Years 2000 and 2010. Atmos. Chem. Phys. 2011, 11, 12959–12972. [Google Scholar] [CrossRef]
  5. Yue, D.L.; Hu, M.; Zhang, R.Y.; Wu, Z.J.; Su, H.; Wang, Z.B.; Peng, J.F.; He, L.Y.; Huang, X.F.; Gong, Y.G.; et al. Potential Contribution of New Particle Formation to Cloud Condensation Nuclei in Beijing. Atmos. Environ. 2011, 45, 6070–6077. [Google Scholar] [CrossRef]
  6. Laakso, L.; Merikanto, J.; Vakkari, V.; Laakso, H.; Kulmala, M.; Molefe, M.; Kgabi, N.; Mabaso, D.; Carslaw, K.S.; Spracklen, D.V.; et al. Boundary Layer Nucleation as a Source of New CCN in Savannah Environment. Atmos. Chem. Phys. 2013, 13, 1957–1972. [Google Scholar] [CrossRef]
  7. Yu, H.; Ortega, J.; Smith, J.N.; Guenther, A.B.; Kanawade, V.P.; You, Y.; Liu, Y.; Hosman, K.; Karl, T.; Seco, R.; et al. New Particle Formation and Growth in an Isoprene-Dominated Ozark Forest: From Sub-5 Nm to CCN-Active Sizes. Aerosol Sci. Technol. 2014, 48, 1285–1298. [Google Scholar] [CrossRef]
  8. Rose, C.; Sellegri, K.; Moreno, I.; Velarde, F.; Ramonet, M.; Weinhold, K.; Krejci, R.; Andrade, M.; Wiedensohler, A.; Ginot, P.; et al. CCN Production by New Particle Formation in the Free Troposphere. Atmos. Chem. Phys. 2017, 17, 1529–1541. [Google Scholar] [CrossRef]
  9. Kerminen, V.-M.; Chen, X.; Vakkari, V.; Petäjä, T.; Kulmala, M.; Bianchi, F. Atmospheric New Particle Formation and Growth: Review of Field Observations. Environ. Res. Lett. 2018, 13, 103003. [Google Scholar] [CrossRef]
  10. Spracklen, D.V.; Carslaw, K.S.; Kulmala, M.; Kerminen, V.-M.; Sihto, S.-L.; Riipinen, I.; Merikanto, J.; Mann, G.W.; Chipperfield, M.P.; Wiedensohler, A.; et al. Contribution of Particle Formation to Global Cloud Condensation Nuclei Concentrations. Geophys. Res. Lett. 2008, 35, L06808. [Google Scholar] [CrossRef]
  11. Merikanto, J.; Spracklen, D.V.; Mann, G.W.; Pickering, S.J.; Carslaw, K.S. Impact of Nucleation on Global CCN. Atmos. Chem. Phys. 2009, 9, 8601–8616. [Google Scholar] [CrossRef]
  12. Westervelt, D.M.; Pierce, J.R.; Adams, P.J. Analysis of Feedbacks between Nucleation Rate, Survival Probability and Cloud Condensation Nuclei Formation. Atmos. Chem. Phys. 2014, 14, 5577–5597. [Google Scholar] [CrossRef]
  13. Gordon, H.; Kirkby, J.; Baltensperger, U.; Bianchi, F.; Breitenlechner, M.; Curtius, J.; Dias, A.; Dommen, J.; Donahue, N.M.; Dunne, E.M.; et al. Causes and Importance of New Particle Formation in the Present-Day and Preindustrial Atmospheres: Causes and Role of New Particle Formation. J. Geophys. Res. Atmos. 2017, 122, 8739–8760. [Google Scholar] [CrossRef]
  14. Kulmala, M.; Pirjola, L.; Mäkelä, J.M. Stable Sulphate Clusters as a Source of New Atmospheric Particles. Nature 2000, 404, 66–69. [Google Scholar] [CrossRef] [PubMed]
  15. Kulmala, M.; Petäjä, T.; Nieminen, T.; Sipilä, M.; Manninen, H.E.; Lehtipalo, K.; Dal Maso, M.; Aalto, P.P.; Junninen, H.; Paasonen, P.; et al. Measurement of the Nucleation of Atmospheric Aerosol Particles. Nat. Protoc. 2012, 7, 1651–1667. [Google Scholar] [CrossRef]
  16. Kerminen, V.-M.; Lehtinen, K.E.J.; Anttila, T.; Kulmala, M. Dynamics of Atmospheric Nucleation Mode Particles: A Timescale Analysis. Tellus B Chem. Phys. Meteorol. 2004, 56, 135. [Google Scholar] [CrossRef]
  17. McMurry, P.H.; Friedlander, S.K. New Particle Formation in the Presence of an Aerosol. Atmos. Environ. 1979, 13, 1635–1651. [Google Scholar] [CrossRef]
  18. Kulmala, M.; Lehtinen, K.E.J.; Laaksonen, A. Cluster Activation Theory as an Explanation of the Linear Dependence between Formation Rate of 3nm Particles and Sulphuric Acid Concentration. Atmos. Chem. Phys. 2006, 6, 787–793. [Google Scholar] [CrossRef]
  19. McMurry, P.H.; Fink, M.; Sakurai, H.; Stolzenburg, M.R.; Mauldin, R.L.; Smith, J.; Eisele, F.; Moore, K.; Sjostedt, S.; Tanner, D.; et al. A Criterion for New Particle Formation in the Sulfur-Rich Atlanta Atmosphere. J. Geophys. Res. 2005, 110, D22S02. [Google Scholar] [CrossRef]
  20. Coakley, J. Reflections on Aerosol Cooling. Nature 2005, 438, 1091–1092. [Google Scholar] [CrossRef]
  21. Ball, S.M.; Hanson, D.R.; Eisele, F.L.; McMurry, P.H. Laboratory Studies of Particle Nucleation: Initial Results for H 2 SO 4, H 2 O, and NH 3 Vapors. J. Geophys. Res. Atmos. 1999, 104, 23709–23718. [Google Scholar] [CrossRef]
  22. Almeida, J.; Schobesberger, S.; Kürten, A.; Ortega, I.K.; Kupiainen-Määttä, O.; Praplan, A.P.; Adamov, A.; Amorim, A.; Bianchi, F.; Breitenlechner, M.; et al. Molecular Understanding of Sulphuric Acid–Amine Particle Nucleation in the Atmosphere. Nature 2013, 502, 359–363. [Google Scholar] [CrossRef] [PubMed]
  23. Raes, F. Entrainment of Free Tropospheric Aerosols as a Regulating Mechanism for Cloud Condensation Nuclei in the Remote Marine Boundary Layer. J. Geophys. Res. 1995, 100, 2893. [Google Scholar] [CrossRef]
  24. Kirkby, J.; Curtius, J.; Almeida, J.; Dunne, E.; Duplissy, J.; Ehrhart, S.; Franchin, A.; Gagné, S.; Ickes, L.; Kürten, A.; et al. Role of Sulphuric Acid, Ammonia and Galactic Cosmic Rays in Atmospheric Aerosol Nucleation. Nature 2011, 476, 429–433. [Google Scholar] [CrossRef] [PubMed]
  25. Seinfeld, J.H.; Pandis, S.N. Atmospheric Chemistry and Physics: From Air Pollution to Climate Change, 2nd ed.; John Wiley & Sons: New York, NY, USA, 2006. [Google Scholar]
  26. Arlander, D.W. The Tropospheric Distribution of Formaldehyde During TROPOZ II. J. Atmos. Chem. 1995, 22, 251–268. [Google Scholar] [CrossRef]
  27. Kanawade, V.P.; Tripathi, S.N.; Chakraborty, A.; Yu, H. Chemical Characterization of Sub-Micron Aerosols during New Particle Formation in an Urban Atmosphere. Aerosol Air Qual. Res. 2020, 20, 1294–1305. [Google Scholar] [CrossRef]
  28. Bates, E.D.; Mayton, R.D.; Ntai, I.; Davis, J.H. CO2 Capture by a Task-Specific Ionic Liquid. J. Am. Chem. Soc. 2002, 124, 926–927. [Google Scholar] [CrossRef]
  29. O’Dowd, C.D.; Hoffmann, T. Coastal New Particle Formation: A Review of the Current State-Of-The-Art. Environ. Chem. 2005, 2, 245. [Google Scholar] [CrossRef]
  30. Kanawade, V.P.; Tripathi, S.N.; Bhattu, D.; Shamjad, P.M. Sub-Micron Particle Number Size Distributions Characteristics at an Urban Location, Kanpur, in the Indo-Gangetic Plain. Atmos. Res. 2014, 147–148, 121–132. [Google Scholar] [CrossRef]
  31. Kompalli, S.K.; Suresh Babu, S.; Krishna Moorthy, K.; Gogoi, M.M.; Nair, V.S.; Chaubey, J.P. The Formation and Growth of Ultrafine Particles in Two Contrasting Environments: A Case Study. Ann. Geophys. 2014, 32, 817–830. [Google Scholar] [CrossRef]
  32. Kanawade, V.P.; Shika, S.; Pöhlker, C.; Rose, D.; Suman, M.N.S.; Gadhavi, H.; Kumar, A.; Nagendra, S.M.S.; Ravikrishna, R.; Yu, H.; et al. Infrequent Occurrence of New Particle Formation at a Semi-Rural Location, Gadanki, in Tropical Southern India. Atmos. Environ. 2014, 94, 264–273. [Google Scholar] [CrossRef]
  33. Sarangi, B.; Aggarwal, S.G.; Gupta, P.K. A Simplified Approach to Calculate Particle Growth Rate Due to Self-Coagulation, Scavenging and Condensation Using SMPS Measurements during a Particle Growth Event in New Delhi. Aerosol Air Qual. Res. 2015, 15, 166–179. [Google Scholar] [CrossRef]
  34. Kompalli, S.K.; Babu, S.S.; Udayasoorian, C.; Jayabalakrishnan, R.M. Role of Anthropogenic Emissions and Meteorology on Ultrafine Particle Bursts over a High Altitude Site in Western Ghats during Pre-Monsoon. J. Atmos. Sol.-Terr. Phys. 2018, 179, 378–388. [Google Scholar] [CrossRef]
  35. Kompalli, S.K.; Nair, V.S.; Jayachandran, V.; Gogoi, M.M.; Babu, S.S. Particle Number Size Distributions and New Particle Formation Events over the Northern Indian Ocean during Continental Outflow. Atmos. Environ. 2020, 238, 117719. [Google Scholar] [CrossRef]
  36. Varghese, M.; Leena, P.P.; Murugavel, P.; Bankar, S.; Todekar, K.; Chowdhuri, S.; Safai, P.D.; Malap, N.; Konwar, M.; Dixit, S.; et al. New Particle Formation Observed from a Rain Shadow Region of the Western Ghats, India. Toxicol. Environ. Chem. 2020, 102, 305–333. [Google Scholar] [CrossRef]
  37. Laj, P.; Bigi, A.; Rose, C.; Andrews, E.; Lund Myhre, C.; Collaud Coen, M.; Lin, Y.; Wiedensohler, A.; Schulz, M.; Ogren, J.A.; et al. A Global Analysis of Climate-Relevant Aerosol Properties Retrieved from the Network of Global Atmosphere Watch (GAW) near-Surface Observatories. Atmos. Meas. Tech. 2020, 13, 4353–4392. [Google Scholar] [CrossRef]
  38. Shika, S.; Gadhavi, H.; Suman, M.N.S.; Ravikrishna, R.; Gunthe, S.S. Atmospheric Aerosol Properties at a Semi-Rural Location in Southern India: Particle Size Distributions and Implications for Cloud Droplet Formation. SN Appl. Sci. 2020, 2, 1007. [Google Scholar] [CrossRef]
  39. Sebastian, M.; Kanawade, V.P.; Pierce, J.R. Observation of Sub-3nm Particles and New Particle Formation at an Urban Location in India. Atmos. Environ. 2021, 256, 118460. [Google Scholar] [CrossRef]
  40. Kanawade, V.P.; Sebastian, M.; Hooda, R.K.; Hyvärinen, A.-P. Atmospheric New Particle Formation in India: Current Understanding and Knowledge Gaps. Atmos. Environ. 2022, 270, 118894. [Google Scholar] [CrossRef]
  41. Sebastian, M.; Kompalli, S.K.; Kumar, V.A.; Jose, S.; Babu, S.S.; Pandithurai, G.; Singh, S.; Hooda, R.K.; Soni, V.K.; Pierce, J.R.; et al. Observations of Particle Number Size Distributions and New Particle Formation in Six Indian Locations. Atmos. Chem. Phys. 2022, 22, 4491–4508. [Google Scholar] [CrossRef]
  42. Ramanathan, V.; Crutzen, P.J.; Lelieveld, J.; Mitra, A.P.; Althausen, D.; Anderson, J.; Andreae, M.O.; Cantrell, W.; Cass, G.R.; Chung, C.E.; et al. Indian Ocean Experiment: An Integrated Analysis of the Climate Forcing and Effects of the Great Indo-Asian Haze. J. Geophys. Res. Atmos. 2001, 106, 28371–28398. [Google Scholar] [CrossRef]
  43. Tripathi, S.N.; Tare, V.; Chinnam, N.; Srivastava, A.K.; Dey, S.; Agarwal, A.; Kishore, S.; Lal, R.B.; Manar, M.; Kanawade, V.P.; et al. Measurements of Atmospheric Parameters during Indian Space Research Organization Geosphere Biosphere Programme Land Campaign II at a Typical Location in the Ganga Basin: 1. Physical and Optical Properties: Atmospheric Parameters in ig Basin. J. Geophys. Res. Atmos. 2006, 111, D23209. [Google Scholar] [CrossRef]
  44. Tare, V.; Tripathi, S.N.; Chinnam, N.; Srivastava, A.K.; Dey, S.; Manar, M.; Kanawade, V.P.; Agarwal, A.; Kishore, S.; Lal, R.B.; et al. Measurements of Atmospheric Parameters during Indian Space Research Organization Geosphere Biosphere Program Land Campaign II at a Typical Location in the Ganga Basin: 2. Chemical Properties: Aerosol Chemistry in ig Basin. J. Geophys. Res. Atmos. 2006, 111, D23210. [Google Scholar] [CrossRef]
  45. Moorthy, K.K.; Satheesh, S.K.; Babu, S.S.; Dutt, C.B.S. Integrated Campaign for Aerosols, Gases and Radiation Budget (ICARB): An Overview. J. Earth Syst. Sci. 2008, 117 (Suppl. 1), 243–262. [Google Scholar] [CrossRef]
  46. Nair, V.S.; Jayachandran, V.N.; Kompalli, S.K.; Gogoi, M.M.; Babu, S.S. Cloud Condensation Nuclei Properties of South Asian Outflow over the Northern Indian Ocean during Winter. Atmos. Chem. Phys. 2020, 20, 3135–3149. [Google Scholar] [CrossRef]
  47. Pathak, B.; Kalita, G.; Bhuyan, K.; Bhuyan, P.K.; Moorthy, K.K. Aerosol Temporal Characteristics and Its Impact on Shortwave Radiative Forcing at a Location in the Northeast of India. J. Geophys. Res. 2010, 115, D19204. [Google Scholar] [CrossRef]
  48. Bharali, C.; Pathak, B.; Kalita, G.; Bhuyan, P.K. Temporal Characteristics of Particulates, Black Carbon and Trace Gases over Dibrugarh, North-East India; IASTA: Mumbai, India, 2012. [Google Scholar]
  49. Pathak, B.; Bhuyan, P.K.; Gogoi, M.; Bhuyan, K. Seasonal Heterogeneity in Aerosol Types over Dibrugarh-North-Eastern India. Atmos. Environ. 2012, 47, 307–315. [Google Scholar] [CrossRef]
  50. Pathak, B.; Bhuyan, P.K.; Biswas, J.; Takemura, T. Long Term Climatology of Particulate Matter and Associated Microphysical and Optical Properties over Dibrugarh, North-East India and Inter-Comparison with SPRINTARS Simulations. Atmos. Environ. 2013, 69, 334–344. [Google Scholar] [CrossRef]
  51. Bhuyan, P.K.; Bharali, C.; Pathak, B.; Kalita, G. The Role of Precursor Gases and Meteorology on Temporal Evolution of O3 at a Tropical Location in Northeast India. Environ. Sci. Pollut. Res. 2014, 21, 6696–6713. [Google Scholar] [CrossRef]
  52. Pathak, B.; Chutia, L.; Bharali, C.; Bhuyan, P.K. Continental Export Efficiencies and Delineation of Sources for Trace Gases and Black Carbon in North-East India: Seasonal Variability. Atmos. Environ. 2016, 125, 474–485. [Google Scholar] [CrossRef]
  53. Pathak, B.; Subba, T.; Dahutia, P.; Bhuyan, P.K.; Moorthy, K.K.; Gogoi, M.M.; Babu, S.S.; Chutia, L.; Ajay, P.; Biswas, J.; et al. Aerosol Characteristics in North-East India Using ARFINET Spectral Optical Depth Measurements. Atmos. Environ. 2016, 125, 461–473. [Google Scholar] [CrossRef]
  54. Pathak, B.; Bhuyan, P.K. Characteristics of Atmospheric Pollutants over the Northeastern Region of India. In Asian Atmospheric Pollution; Elsevier: Amsterdam, The Netherlands, 2022; pp. 367–392. [Google Scholar] [CrossRef]
  55. Chutia, L.; Ojha, N.; Girach, I.A.; Sahu, L.K.; Alvarado, L.M.A.; Burrows, J.P.; Pathak, B.; Bhuyan, P.K. Distribution of Volatile Organic Compounds over Indian Subcontinent during Winter: WRF-Chem Simulation versus Observations. Environ. Pollut. 2019, 252, 256–269. [Google Scholar] [CrossRef] [PubMed]
  56. Gogoi, M.M.; Bhuyan, P.K.; Moorthy, K.K. An Investigation of Aerosol Size Distribution Properties at Dibrugarh: North-Eastern India. Terr. Atmos. Ocean. Sci. 2009, 20, 521. [Google Scholar] [CrossRef] [PubMed]
  57. Dal Maso, M.; Kulmala, M.; Riipinen, I.; Wagner, R.; Hussein, T.; Aalto, P.P.; Lehtinen, K.E.J. Formation and Growth of Fresh Atmospheric Aerosols: Eight Years of Aerosol Size Distribution Data from SMEAR II, Hyytiälä, Finland. Boreal Environ. Res. 2005, 10, 323–336. [Google Scholar]
  58. Hinds, W.C. Aerosol Technology: Properties, Behavior, and Measurements of Airborne Particles; John Wiley & Sons, Inc.: New York, NY, USA, 1998. [Google Scholar]
  59. Kanawade, V.P.; Tripathi, S.N.; Singh, D.; Gautam, A.S.; Srivastava, A.K.; Kamra, A.K.; Soni, V.K.; Sethi, V. Observations of New Particle Formation at Two Distinct Indian Subcontinental Urban Locations. Atmos. Environ. 2014, 96, 370–379. [Google Scholar] [CrossRef]
  60. Kulmala, M.; Maso, M.D.; Mäkela, J.M.; Pirjola, L.; Väkevä, M.; Aalto, P.; Miikkulainen, P.; Hämeri, K.; O’dowd, C.D. On the Formation, Growth and Composition of Nucleation Mode Particles. Tellus B Chem. Phys. Meteorol. 2001, 53, 479. [Google Scholar] [CrossRef]
  61. Fuchs, N.A.; Sutugin, A.G. High-Dispersed Aerosols. In Topics in Current Aerosol Research; Elsevier: Amsterdam, The Netherlands, 1971; p. 1. [Google Scholar] [CrossRef]
  62. Jeong, C.-H.; Evans, G.J.; McGuire, M.L.; Chang, R.Y.-W.; Abbatt, J.P.D.; Zeromskiene, K.; Mozurkewich, M.; Li, S.-M.; Leaitch, W.R. Particle Formation and Growth at Five Rural and Urban Sites. Atmos. Chem. Phys. 2010, 10, 7979–7995. [Google Scholar] [CrossRef]
  63. Chu, B.; Kerminen, V.-M.; Bianchi, F.; Yan, C.; Petäjä, T.; Kulmala, M. Atmospheric New Particle Formation in China. Atmos. Chem. Phys. 2019, 19, 115–138. [Google Scholar] [CrossRef]
  64. Mäkelä, J.M.; Dal Maso, M.; Pirjola, L. Characteristics of the Atmospheric Particle Formation Events Observed at A Boreal Forest Site in Southern Finland. Boreal Environ. Res. Hels. 2000, 5, 299–313. [Google Scholar]
  65. Kanawade, V.P.; Srivastava, A.K.; Ram, K.; Asmi, E.; Vakkari, V.; Soni, V.K.; Varaprasad, V.; Sarangi, C. What caused severe air pollution episode of November 2016 in New Delhi? Atmos. Environ. 2019, 222, 117–125. [Google Scholar] [CrossRef]
  66. Gao, J.; Chai, F.; Wang, T.; Wang, W. Particle Number Size Distribution and New Particle Formation (NPF) in Lanzhou, Western China. Particuology 2011, 9, 611–618. [Google Scholar] [CrossRef]
  67. Kristensson, A.; Maso, M.D.; Swietlicki, E.; Hussein, T.; Zhou, J.; Kerminen, V.-M.; Kulmala, M. Characterization of New Particle Formation Events at a Background Site in Southern Sweden: Relation to Air Mass History. Tellus B Chem. Phys. Meteorol. 2008, 60, 330. [Google Scholar] [CrossRef]
  68. Xiao, S.; Wang, M.Y.; Yao, L.; Kulmala, M.; Zhou, B.; Yang, X.; Chen, J.M.; Wang, D.F.; Fu, Q.Y.; Worsnop, D.R.; et al. Strong Atmospheric New Particle Formation in Winter in Urban Shanghai, China. Atmos. Chem. Phys. 2015, 15, 1769–1781. [Google Scholar] [CrossRef]
  69. Kamra, A.K.; Siingh, D.; Gautam, A.S.; Kanawade, V.P.; Tripathi, S.N.; Srivastava, A.K. Atmospheric Ions and New Particle Formation Events at a Tropical Location, Pune, India. Q. J. R. Meteorol. Soc. 2015, 141, 3140–3156. [Google Scholar] [CrossRef]
  70. Leena, P.P.; Anil Kumar, V.; Dani, K.K.; Sombawne, S.M.; Murugavel, P.; Pandithurai, G. Evidence of New Particle Formation during Post Monsoon Season over a High-Altitude Site of the Western Ghats, India. Toxicol. Environ. Chem. 2017, 99, 652–664. [Google Scholar] [CrossRef]
  71. Neitola, K.; Asmi, E.; Komppula, M.; Hyvärinen, A.-P.; Raatikainen, T.; Panwar, T.S.; Sharma, V.P.; Lihavainen, H. New Particle Formation Infrequently Observed in Himalayan Foothills—Why? Atmos. Chem. Phys. 2011, 11, 8447–8458. [Google Scholar] [CrossRef]
  72. Sebastian, M.; Kanawade, V.P.; Soni, V.K.; Asmi, E.; Westervelt, D.M.; Vakkari, V.; Hyvärinen, A.; Pierce, J.R.; Hooda, R.K. New Particle Formation and Growth to Climate-Relevant Aerosols at a Background Remote Site in the Western Himalaya. J. Geophys. Res. Atmos. 2021, 126, e2020JD03326. [Google Scholar] [CrossRef]
  73. Subba, T.; Pathak, B.; Gogoi, M.M.; Ajay, P.; Dahutia, P.; Chakraborty, A.; Bhuyan, P.K. Observations on the decadal variability of aerosol in eastern Himalayan foothills: Evidence of an anthropologically induced positive shift. Atmos. Environ. 2023, 299, 119638. [Google Scholar] [CrossRef]
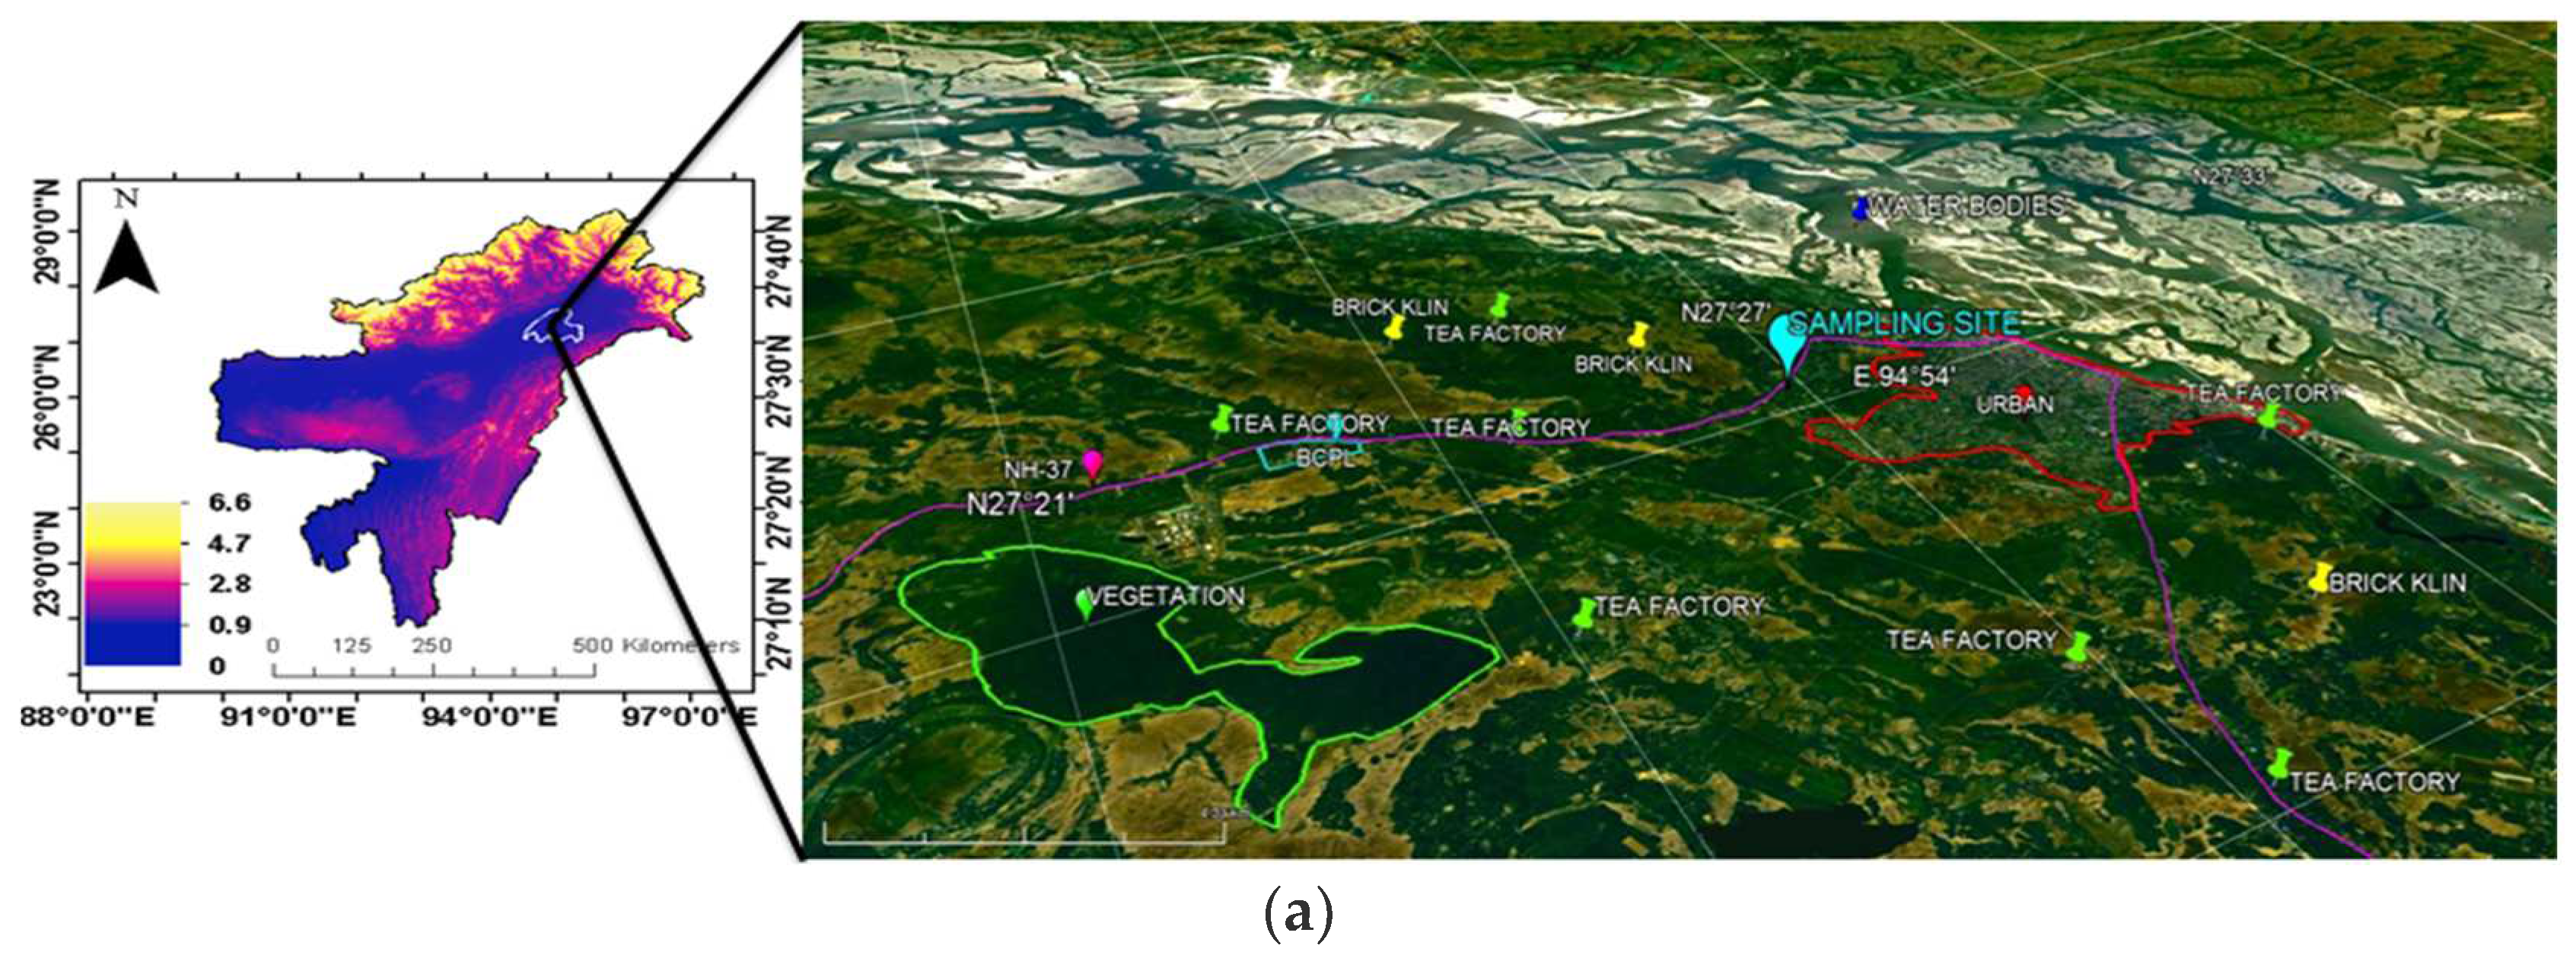
Figure 1. (a) Elevation map of northeast India (colour scale) and the detailed map of land use near the sampling site, Dibrugarh University (cyan symbol). The blue symbol indicates the river Brahmaputra, green symbols designate the tea factories surrounded by tea gardens, and yellow symbols are the nearby brick kilns. The pink line is the national highway 37, passing very close to the sampling site, the red line encloses the urban centre, and the green line area encompasses a rainforest. (b) Time series of meteorological parameters: temperature (T in °C), relative humidity (RH in %) and wind speed (WS in m/s) during the study period.
Atmosphere 14 00795 g001aAtmosphere 14 00795 g001b
Figure 2. (a) Average diurnal variation of total particle number concentration (Ntotal), and (b) the geometric mean diameter (GMD) during November−December 2016. The vertical lines represent the standard deviation from the mean.
Atmosphere 14 00795 g002
Figure 3. Temporal evolution of PNSD with a diameter ranging from 10.2 nm to 333.8 nm, on NPF days ((ac) 2 December 2016, (df) 3 December 2016, (gi) 16 December 2016). Here, (a,d,g) are the variations of PNSD before the NPF, (b,e,h) are the variations of PNSD during the NPF, and (c,e,i) are the variations of PNSD after the NPF period.
Atmosphere 14 00795 g003
Figure 4. Evolution of PNSD (a,c), Ntotal and GMD (b,d) on an NPF event day (3 December 2016 (a,b)) and a non−NPF day (23 December 2016 (c,d)).
Atmosphere 14 00795 g004
Figure 5. Variation of number concentration and GMD of nucleation (top), Aitken (middle) and accumulation mode (bottom) particles on an NPF Day (3 December 2016, (a)) and a non−NPF day (23 December 2016, (b)).
Atmosphere 14 00795 g005
Figure 6. Figure 6. Temporal variation of Fcoag and CondS for nucleation (top), Aitken (middle) and accumulation mode (bottom) particles on the NPF day (3 December 2016, (a)) and on the non−NPF day (23 December 2016, (b)).
Atmosphere 14 00795 g006
Figure 7. Scatter plot of the GMD versus local time. (a) The solid line is the regression fit through GMD values during the NPF growth period on 3 December 2016, and (b) the non−NPF day on 23 December 2016.
Atmosphere 14 00795 g007
Figure 8. Box−whisker plot of absolute increase in number concentration (N), condensation sink (CondS), coagulation sink (CoagS), and coagulation rate (Fcoag) for different size regimes on the NPF day (3 December 2016, (a)) and the non−NPF day (23 December 2016, (b)). The solid diamond indicates the mean, the red horizontal line indicates the median, the top and bottom boxes indicate the 25th and 75th percentile values, and the top and bottom whiskers indicate the 10th and 90th percentile values.
Atmosphere 14 00795 g008
Figure 9. Map showing the distribution of tropospheric NO2, and red triangles indicate the location of fires from 15 November–16 December 2016. Also shown are the 48 hrs backward air mass trajectories (solid colour lines) during the event days.
Atmosphere 14 00795 g009
Figure 10. Daily variations of tropospheric NO2, total column SO2, and HCHO during the study period.
Atmosphere 14 00795 g010
Table 1. Summary of various calculated parameters during the NPF events in December 2016.
Date
(2016)
Ntotal
(104 cm−3)
GMD
(nm)
CoagStotal
(10−4 s−1)
CondStotal
(10−3 s−1)
Fcoagtotal
(cm−3 s−1)
GR (nm/hr)
2 December2.09 ± 1.2960.72 ± 18.592.28 ± 1.408.20 ± 1.186.58 ± 7.5513
3 December1.30 ± 0.6388.56 ± 16.321.42 ± 0.693.20 ± 2.122.29 ± 2.8531
16 December1.88 ± 1.6081.20 ± 23.712.06 ± 1.7510.2 ± 13.16.69 ± 9.897.5
Disclaimer/Publisher’s Note: The statements, opinions and data contained in all publications are solely those of the individual author(s) and contributor(s) and not of MDPI and/or the editor(s). MDPI and/or the editor(s) disclaim responsibility for any injury to people or property resulting from any ideas, methods, instructions or products referred to in the content.