Article

Using Low-Cost Sensors for Measuring and Monitoring Particulate Matter with a Focus on Fine and Ultrafine Particles

1
Department of Theoretical and Industrial Electrical Engineering, Faculty of Electrical Engineering and Informatics, Technical University of Košice, 042 00 Kosice, Slovakia
2
Department of Computers and Informatics, Faculty of Electrical Engineering and Informatics, Technical University of Košice, 042 00 Kosice, Slovakia
*
Authors to whom correspondence should be addressed.
Atmosphere 2023, 14(2), 324; https://doi.org/10.3390/atmos14020324
Submission received: 31 December 2022 / Revised: 2 February 2023 / Accepted: 3 February 2023 / Published: 6 February 2023

Abstract

:
The paper deals with the measurement of individual size components of particulate matter focusing on typical particle size, mass, and number concentrations primarily in the city of Košice (Slovak republic) and the surrounding countryside. The deployment of the sensor IPS-7100 in the 2nd half of December 2022 allowed us to measure the particles smaller than the detection limit of other low-cost optical sensors—namely SPS30 and SEN54. The results show that although the mass concentration of ultrafine particles is negligible in comparison to fine and coarse particles, in terms of number concentration ultrafine particles make up the dominant component of particulate matter, which stands as a warning from the health point of view.

1. Introduction

Particulate matter (PM) is a mixture of solid or liquid particles suspended in the air of varying size and composition, containing a variety of components including dust, dirt, soot, pollen, or small pieces of metal and plastic, smoke and liquid droplets, some of which may be toxic [1]. PM is classified as an air pollutant [2,3]. These particles are PM10 (i.e., particles with a diameter up to 10 µm), coarse particles or PM2.5–10 (particles with a diameter between the sizes of 2.5 and 10 µm), PM2.5 or fine particles (particles with a diameter up to 2.5 µm) or PM0.1 or ultrafine particles (particles with diameter up to 0.1 µm) [1]. However, some sources [4] define ultrafine particles as particles smaller than 0.5 µm (or PM0.5). The negative impacts of particulate matter are well-researched and documented in studies [5,6,7,8,9,10,11,12,13,14,15]. Long-term exposure to PM can lead to health complications such as breathing problems [5,7,8], asthma [8], heart disease [5,6,7,8,9,10], lung cancer [6,7,8], other respiratory illnesses [5,7,8,11], and even premature death [8,12,15]. Especially vulnerable are pregnant women, children, and elderly people [13,14,15]. In fact, the negative impacts of PM on human health increase as the size of PM decreases, since smaller particles can penetrate deeper into the human body. Coarse particles deposit in the upper respiratory system. They are usually trapped in the nose and throat and expelled by coughing and sneezing. Fine particles can reach lung alveoli, where they tend to stay longer in the lungs. Ultrafine particles can even enter the bloodstream and create dangerous toxins in our bodies, which makes them one of the most dangerous classes of air pollutants [16,17,18,19,20]. Fine and ultrafine particles can increase the risk of cardiovascular and respiratory disease as well as stroke. Furthermore, it was found that elevated PM concentrations correlate with decreased life expectancy [19,20].
Particulate matter is measured to understand the contributing factors and find a way to reduce the concentration of PM. According to the current global guidelines of WHO [3], the recommended daily exposure (short-term, 24 h mean) to PM2.5 is up to 15 µg/m3 and PM10 is up to 45 µg/m3. In the Slovak republic, the limit values for 24 h mean are 20 µg/m3 for PM2.5 and 50 µg/m3 for PM10 [21]. PM sources (including fine and ultrafine particles) can be anthropogenic and natural. Anthropogenic sources include traffic and emissions from motor vehicles, mining, construction activities, industrial processes of industries located either directly in or near cities (these factors are dominant in urban areas) as well as seasonal wood combustion for domestic heating or large-scale fieldwork (which is the primary source of PM in rural areas). In addition to anthropogenic sources, there are also natural sources that need to be considered, such as windblown dust, sea salt aerosols, wildfires, and volcanic eruptions [22,23,24,25]. As for the sources of PM by the size of particles, PM2.5 are mainly produced in the combustion of gasoline, oil, fuel, or wood are fine particles (of course, PM2.5 also makes up a portion of PM10). On the other hand, construction, wildfires, waste burning (often characterized by inefficient combustion), fossil fuel combustion (such as coal or gas), industry emissions, as well as windblown dust and pollen, are the main contributors to PM10 particles [26,27]. Ultrafine particles can be directly emitted into the air from anthropogenic sources (e.g., combustion, traffic, etc.) or, more commonly, formed from chemical reactions and dynamic processes such as nucleation, condensation, and coagulation [28,29].
On a local scale, wireless sensor networks (WSN) with high spatial resolution could help in identifying patterns and sources of PM in the neighborhood like in the study [30] which could then be used for regulation and decrease of PM concentrations (for coarse, fine and ultrafine particles alike). On a wider scale, low-cost sensors of PM could find their use in machine learning and prediction models. Using a sufficiently dense WSN in a relatively large area, with enough nodes and measured data it would be possible to apply artificial intelligence and machine learning and create a prediction model for the development of PM concentrations in time, similar to the works [31,32]. However, it is important to determine if the performance of low-cost sensors in such a network is satisfactory, which was the subject of [33], where the precision of the sensors used in the mobile monitoring systems was acceptable, but the accuracy of low-cost sensors was not sufficient. However, the system was used to map and monitor the relative changes in PM mass concentrations and identify the anomalies in the mass concentration of PM. The coverage of the area as well as the resolution of measuring points allowed the authors to identify the patterns and sources of PM.
Due to the nature of PM sources, the concentrations of PM can be influenced not only by directly producing the particles near the measuring place but also by meteorological factors beyond our control. Studies [34,35,36,37,38,39,40,41,42,43,44,45] found a correlation between PM and meteorological factors such as temperature, humidity, pressure, and wind speed, although whether the correlations were positive or negative differed study-to-study. It has been suggested that there could be a seasonal and geographical impact on correlations [45], however, more research needs to be done in this area to improve our understanding of how meteorological factors influence the concentrations of PM. This is something the authors of this paper mentioned in their previous papers [46,47]. Both papers were focused on determining short-term Pearson correlations between PM and temperature, humidity, and pressure (the measurements took place over several days). Paper [46] only focused on calculating correlations from 12-h intervals, while [47] considered 12-h, 6-h, and 3-h intervals as well as the comparison of correlations between two measuring sites which were relatively close by (35 m). Further examination of the correlation between PM and meteorological factors from a long-term perspective with consideration of different places of measurement or seasonal factors and non-linear correlations will be a subject of future research.
The subject of this paper will be to answer the following questions: “What is the composition of PM in terms of typical particle size?” and “What amount of ultrafine particles can be found in the air around us?” After all, most low-cost sensors focus on measuring PM10 and PM2.5 (some can even measure other categories such as PM4 and PM1 [48,49]). The detection threshold for such sensors is typically ~0.3 µm. However, some sensors can measure particles even as small as PM0.1 [50].
The authors of this paper deal with the measurements of the mass and number concentration of PM in the city of Košice (Slovak Republic) and the surrounding countryside. The paper will also focus on the typical particle size and how it varies with different places of measurement.

2. Materials and Methods

2.1. Particulate Matter Sensors

The sensors used for measuring PM were SPS30, SEN54, and IPS7100. All of the used sensors are OPCs (Optical Particle Counters). The sensing of the sensor is based on the principle of light scattering. PMs are hit by a laser beam at a certain angle, which causes shielding and scattering of the light. The device senses the light intensity after the PM has been hit by the laser beam, which allows the individual particles to be counted and measured. A particle passing through the illumination zone produces a photoelectric pulse whose height depends on the particle size [51,52,53]. The change or the addition of the new sensor type SEN54 was done to expand the measuring locations due to the limited availability of the sensors during the current crisis. IPS7100 was added later to measure even smaller particles (as the particle size threshold for both SPS30 and SEN54 is 0.3 μm, while IPS7100 can measure particles even smaller than 0.1 µm).
The SPS30 sensor is capable of sensing the mass concentration of PM1, PM2.5, PM4, and PM10 particles, as well as the number concentration of PM0.5, PM1, PM2.5, PM4, and PM10 particles, and also the typical particle size. While PM1 and PM2.5 are measured directly, PM4 and PM10 are measured indirectly by calculations based on the distribution profile of all measured particles. The minimum size of a PM that the sensor can detect is 0.3 µm. The accuracy of the sensor guaranteed by the manufacturer for measuring PM by the SPS30 sensor is given in Table 1 [48].
Similarly to SPS30, the SEN54 sensor is capable of sensing the mass concentration of PM1, PM2.5, PM4, and PM10, number concentration of PM0.5, PM1, PM2.5, PM4, and PM10, typical particle size but unlike SPS30 it can also measure other physical quantities, such as temperature, humidity, and VOC index. Like SPS30, the SEN54 sensor is OPC so it can measure PM1 and PM2.5 directly, while PM4 and PM10 are measured indirectly by calculations based on the distribution profile of all measured particles. Table 2 shows the manufacturer-guaranteed accuracy for measuring PM by the SEN54 sensor [49].
Two SPS30 and four SEN54 sensors were used for the comparison measurements. The difference between the measured values by the sensors was maintained in the vicinity of zero, as shown in [47]. There were a few exceptions when the difference was higher than 0, but overall, the comparison measurement still corresponded to the manufacturer’s specified accuracy for both sensors.
Sensor IPS-7100 can measure mass and number concentrations of PM0.1, PM0.3, PM0.5, PM1, PM2.5, PM5, and PM10 (PM0.3 to PM10 concentrations are measured directly, while PM0.1 concentrations are estimated from the other PM categories (this is like SPS30/SEN54 measurements of PM4/PM10). All concentrations are measured with an accuracy of ±10% [50].
Since only one IPS-7100 sensor was available, the comparison measurement was conducted between one IPS-7100 sensor and one SEN54 sensor, the results of which are shown in Figure 1. The measured mass concentration traces are both close together and overlapping. The difference plotted in a line and scatter plots shows that IPS-7100 and SEN54 only differ by ±10 µg/m3 at most, even though it also includes particles smaller than 0.3 µm (which are under the detection limit of SEN54).
All three types of sensors were chosen based on several criteria:
  • Budget (≤100€ per sensor),
  • Availability on the market in Slovakia,
  • Accuracy guaranteed by the manufacturer in the datasheet,
  • The possibility to interface with a microcontroller board such as ESP8266, ESP32, or Arduino (I2C interface preferred),
  • It was preferable that the sensors would be able to measure multiple sizes of PM mass and number concentrations and smaller (fine or ultrafine) particles,
  • In the case of SPS30 and SEN54, sensors which can measure PM1/2.5/4/10 mass concentration and PM0.5/1/2.5/4/10 number concentration were preferred over sensors which can only measure PM2.5/10 mass concentration,
  • In the case of IPS7100, the ability to measure PM0.1 and PM0.3 mass and number concentration were considered.
Slovak Hydrometeorological Institute (SHMI) is a specialized organization that focuses on meteorological, and hydrological measurements and prediction as well as the monitoring of air quality. SHMI does not provide raw data from their air pollutant measurements, only the daily average in their monthly reports [54]. In [55] it is specified that PM2.5 and PM10 pollutants are measured every 15 min using TEOM 1405F. The closest SHMI station measuring PM is the one located at Štefánikova st. (1.1 km from the Department of Theoretical and Industrial Electrical Engineering—DTIEE or Košice #1—where one of our measuring sites is located, as described in Section 2.3). There is a 2nd SHMI station in Košice at Amurská st., but this station is more distant from our measuring sites (5.4 km from DTIEE), so we will only compare the daily averages of PM2.5 and PM10 mass concentration measured at DTIEE with SHMI’s data from the Štefánikova station [56,57,58].
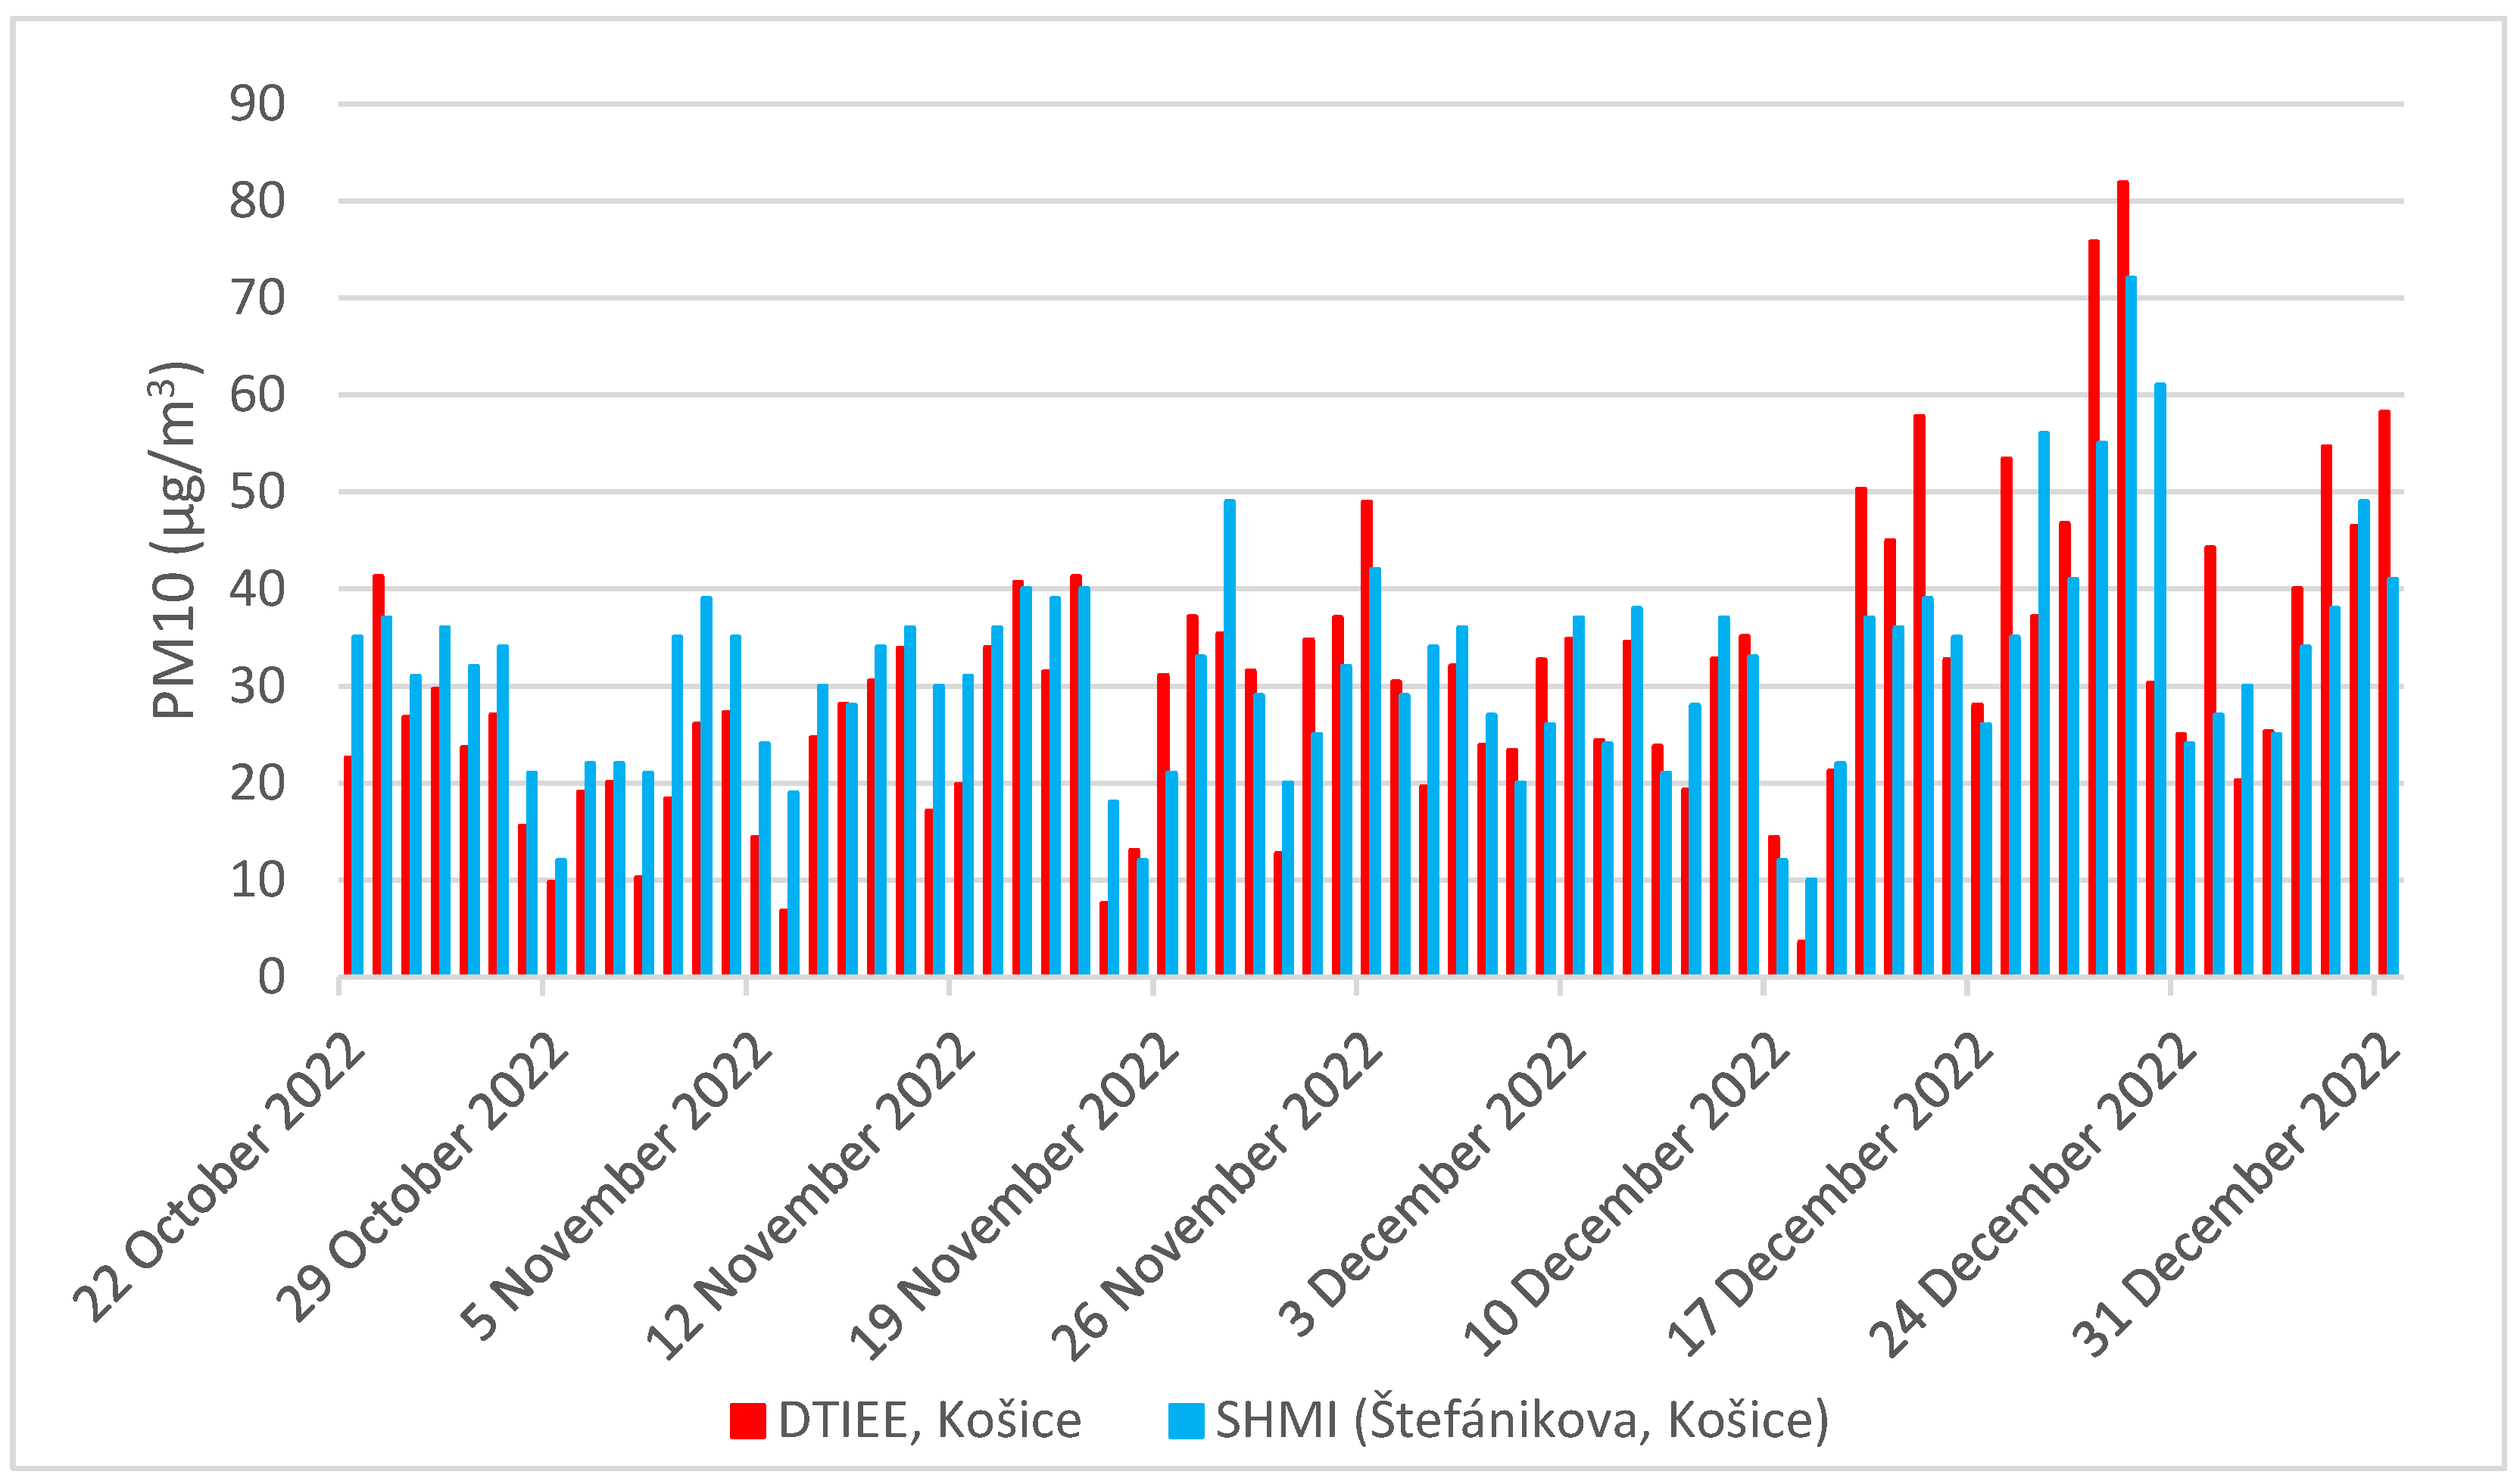
Figure 2 shows the comparison of PM10 mass concentration daily averages at DTIEE (red bars) and Štefánikova st. (blue bars) measured from 22 October 2022 to 31 December 2022. Out of 71 values for each measuring site, some pairs of values were very close. The difference between 31 of them was less than 5 µg/m3. Of the values which differed by 5 µg/m3 or more, 21 were higher at Štefánikova st. (mostly in October and the first half of November 2022) and the remaining 16 were higher at DTIEE, mostly in December. This could be caused by increased relative humidity (RH) in December, as the increased humidity may introduce bias in measurement when using low-cost sensors [33]. The weather in Košice was characterized by frequent snowing in the evening and nighttime hours and the subsequent thaw during the daytime hours in the 2nd half of December.
Figure 3 compares the daily averages of PM2.5 between the measuring sites at DTIEE (red) and Štefániková st. (blue). The missing values of the Štefánikova station in November are due to an incorrect table for the daily averages of PM2.5 being included in the report [57] (the table included in the record is from February 2022 [59]), thus we can only compare the data from October and December. Out of 41 values, most of them differ by more than 5 µg/m3 (predominantly in December), 21 of which are higher for DTIEE and only 3 are higher for Štefánikova A total of 17 values are within the 5 µg/m3 difference.
Now it is important to note that these measurements are affected by different locations and the distance of 1.1 km between them. Even if they are located in the same city, this distance is not negligible and thus it is not possible to determine the error of the measurements carried out at DTIEE using a low-cost sensor in reference to SHMI’s measurements at Štefánikova. However, the fact that PM2.5 concentrations are almost consistently higher at DTIEE when it is not the case for PM10 (which has a skewed but still more even distribution of positive and negative differences) suggests that the low-cost sensor SEN54 may overestimate PM2.5 mass concentration.

2.2. Measurement Systems

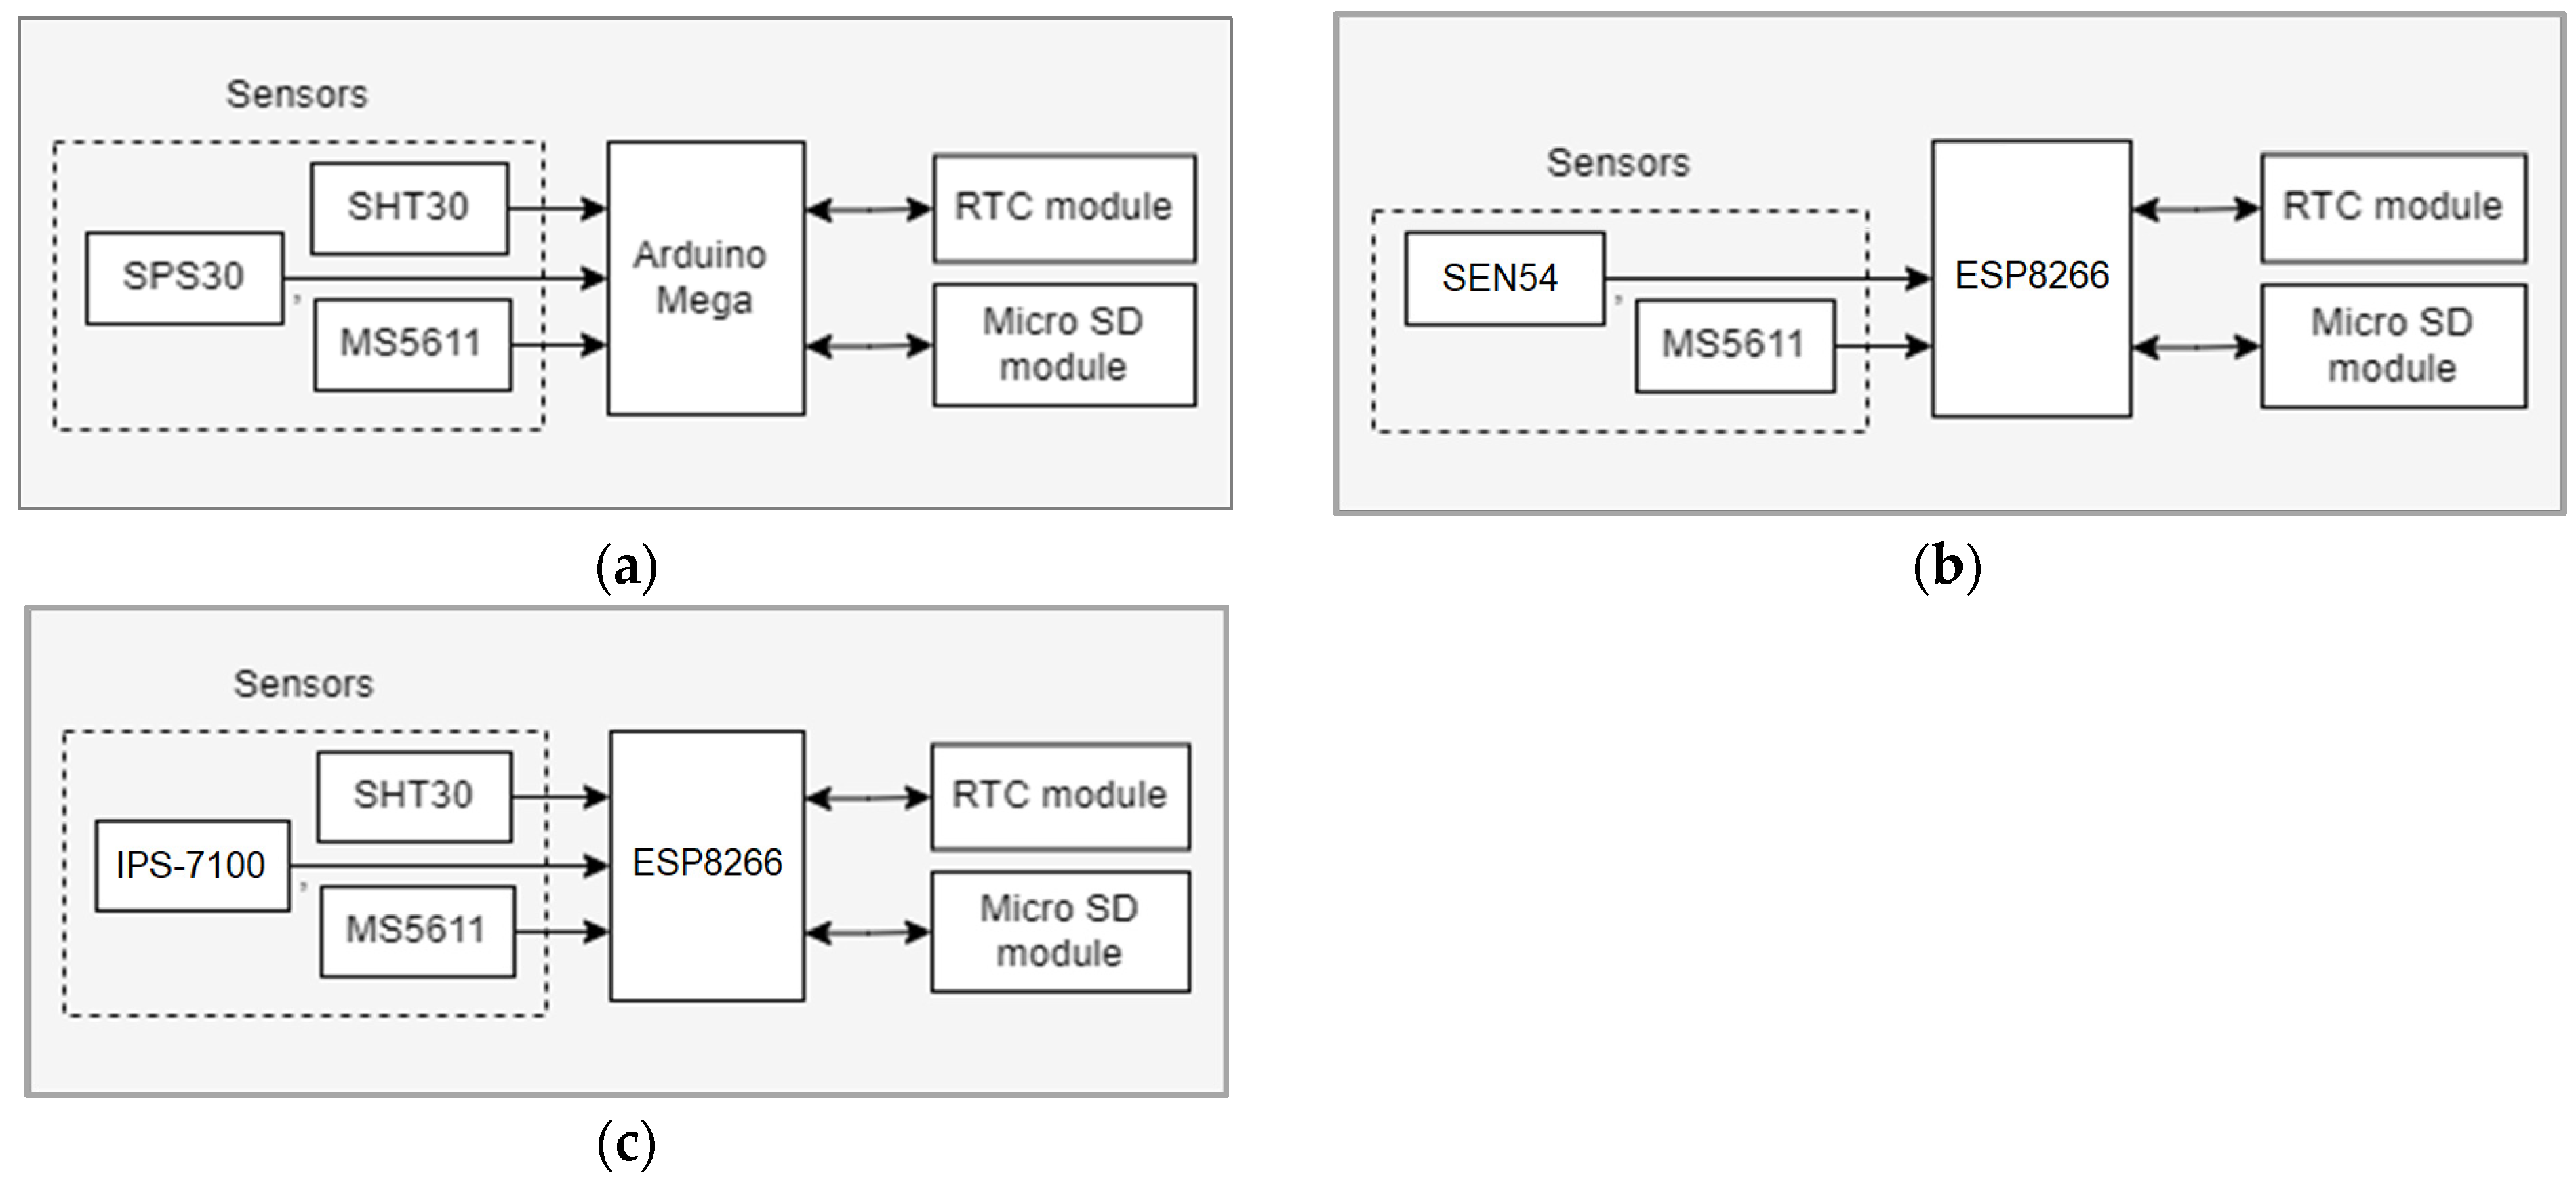
The measurement systems were based on ESP8266. They consisted of a microSD module for logging the measurements in a *.csv file every 5 s, an RTC module for timestamping the measurements as well as the sensory part, which differed from system to system:
  • Measurement system (#1) (Figure 4a) where SPS30 sensor was used for measuring PM, along with SHT30 for measuring temperature and humidity, MS5611 for measuring temperature and atmospheric pressure,
  • Measurement system (#2) (Figure 4b) where the SEN54 sensor was used for measuring PM, VOC index, temperature, and humidity along with MS5611 for measuring temperature and atmospheric pressure,
  • And measurement system (#3) (Figure 4c) where the IPS-7100 sensor was used for measuring PM, along with SHT30 for measuring temperature and humidity, and MS5611 for measuring temperature and atmospheric pressure.
Although the measured data was logged every 5 s to an SD card, ESP8266 also sent measured data to InfluxDB which were then visualized in Grafana once per minute to allow monitoring of measurements in real-time. All components that make up the measurement systems are placed in a case.

2.3. Places of Measurement

The measurements of PM were carried out at the places marked in Figure 5. All places of measurement are located in Slovakia except for one, which is located in Hungary. The focus of urban and rural measurements was on PM concentrations in the places of residence. Therefore, most of both urban and rural measurement sites were chosen near human dwellings such as family houses or apartment blocks (except for Košice #1—DTIEE) because of the negative health effects of long-term exposure to PM on human health and the fact that workplace (Košice #1—DTIEE) and home (all other measuring sites) are places where people spend most of their time.
Urban measurements were carried out in the following cities:
  • Košice #1—2nd largest city in Slovakia, the measurements were carried out outside the window on the 1st floor of the Department of Theoretical and Industrial Engineering (DTIEE), which is located at a university campus near the park. The nearest 4-lane road is located behind the park, 200 m from DTIEE.
  • Košice #2—2nd measurement location in Košice is situated 2.4 km to the east of DTIEE and 13.8 km to the northeast of US Steel. The measurements were carried out on the balcony of an apartment on the 11th floor, which is situated 200 m from a 4-lane road.
  • Košice #3—3rd measurement location in Košice is situated 2.7 km to the south of DTIEE. The measurements were carried out on the balcony of an apartment on the 5th floor, the balcony is facing towards the nearby park and away from the main road.
  • Prešov—a family house located in the suburbs, the city is 30 km to the north of Košice. The family house is situated 30 m from the main road.
  • Snina—apartment on the 3rd floor, the city is 72.6 km to the northeast of Košice. The apartment complex is situated 20 m from the main road.
Rural measurements were carried out in the following villages:
  • Habura—a Slovak village situated 80 km to the northeast of Košice, the measurements took place outside the window on the 1st floor of a family house, which is located on the side street that is not frequented by motor vehicles very often.
  • Füzérkomlós—a Hungarian village situated 7 km away from the border with Slovakia and 28 km to the south-east of Košice. The measurements took place on the balcony on the 1st floor of a family house. There is a side street situated 15 m from the house.
  • Valaliky—a Slovak village situated 11 km to the south of Košice; the measurements took place outside of a family house. The distance from the nearest road is 40 m.
  • Zdoba—a Slovak village situated 11 km to the east of Košice; the measurements took place outside of a family house. The property of the house where the measurements took place is situated 50 m from the driveway.
The main contributing factor to PM concentrations in rural areas is household heating with wood combustion, which is used in the family houses at the measurement sites as well as the neighboring houses in their near vicinity.

2.4. Data Analysis

Data were analyzed using MATLAB script for all calculations and computations, particularly for calculating the hourly averages of PM mass and number concentrations, as well as the number concentration ratios between the different categories of PM (e.g., for SPS30/SEN54 measurements, PM1/PM0.5, PM2.5/PM0.5, PM4/PM0.5, and PM10/PM0.5 ratios are calculated, while for IPS-7100 measurements we consider the PM0.3/PM0.1, PM0.5/PM0.1, PM1/PM0.1, PM2.5/PM0.1, PM4/PM0.1 and PM10/PM0.1).
Data visualization including graphs showing the measured values and hourly averages is done using MATLAB script as well as cloud services—InfluxDB and Grafana.

3. Results and Discussion

The results and discussion section is going to be divided into the following two parts: 1st part—measuring PM in urban and rural areas using SPS30 and SEN54 sensors, in which we look at the composition of PM in terms of the size of the particles, mass and number concentrations, as well as typical particle size. The 2nd part will focus on PM measurements using the IPS-7100 sensor, which is capable of measuring even ultrafine particles under the detection limit of SPS30 and SEN54.

3.1. Measuring PM in Urban and Rural Areas Using SPS30 and SEN54

The Sensirion SPS30 and SEN54 sensors we use in our measurements allow us to measure not only the mass concentration of PM1, PM2.5, PM4, and PM10, but also the number concentration of PM0.5, PM1, PM2.5, PM4, and PM10. The sensors also measure typical particle size, which is defined as “an indication of the average particle diameter in the sample aerosol. Such output correlates with the weighted average of the number of concentration bins” [48].
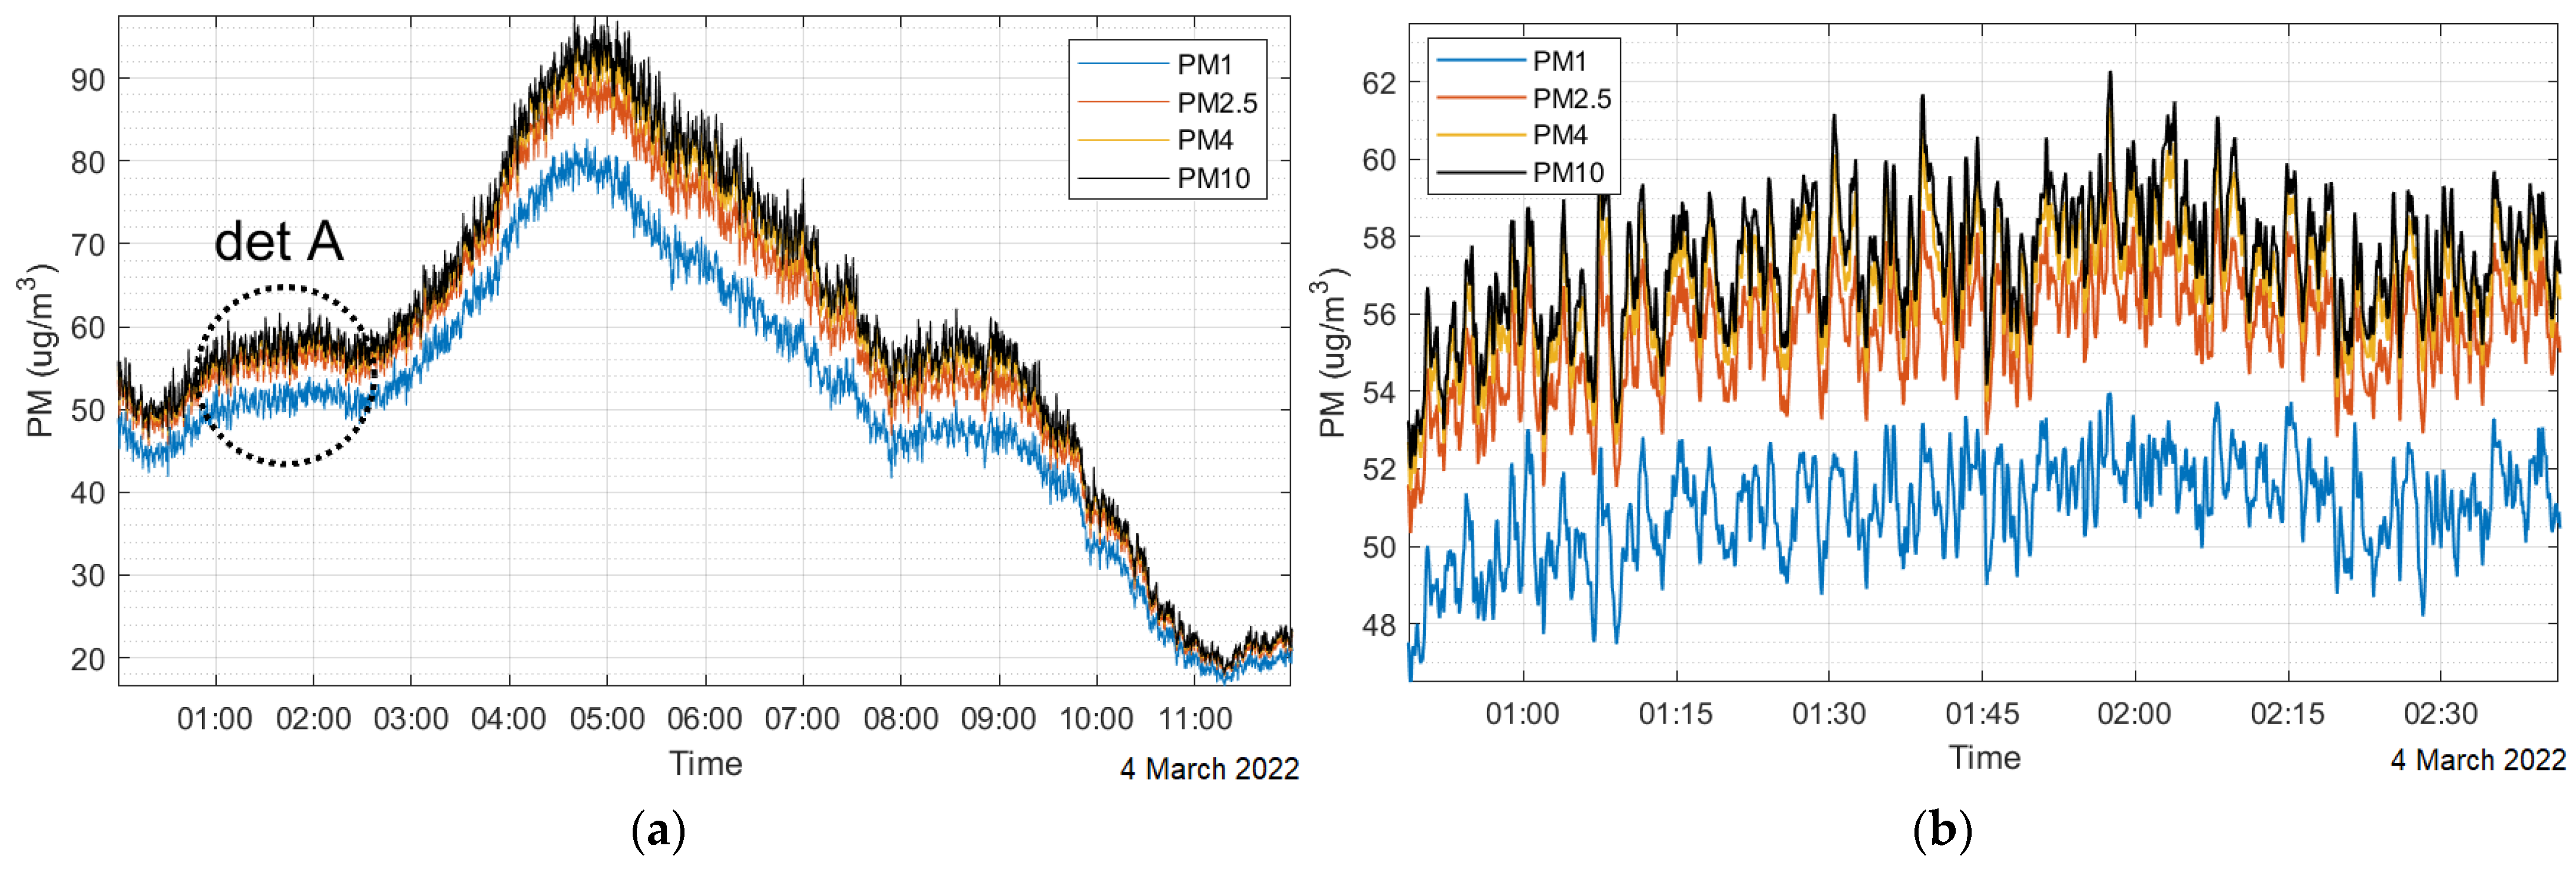
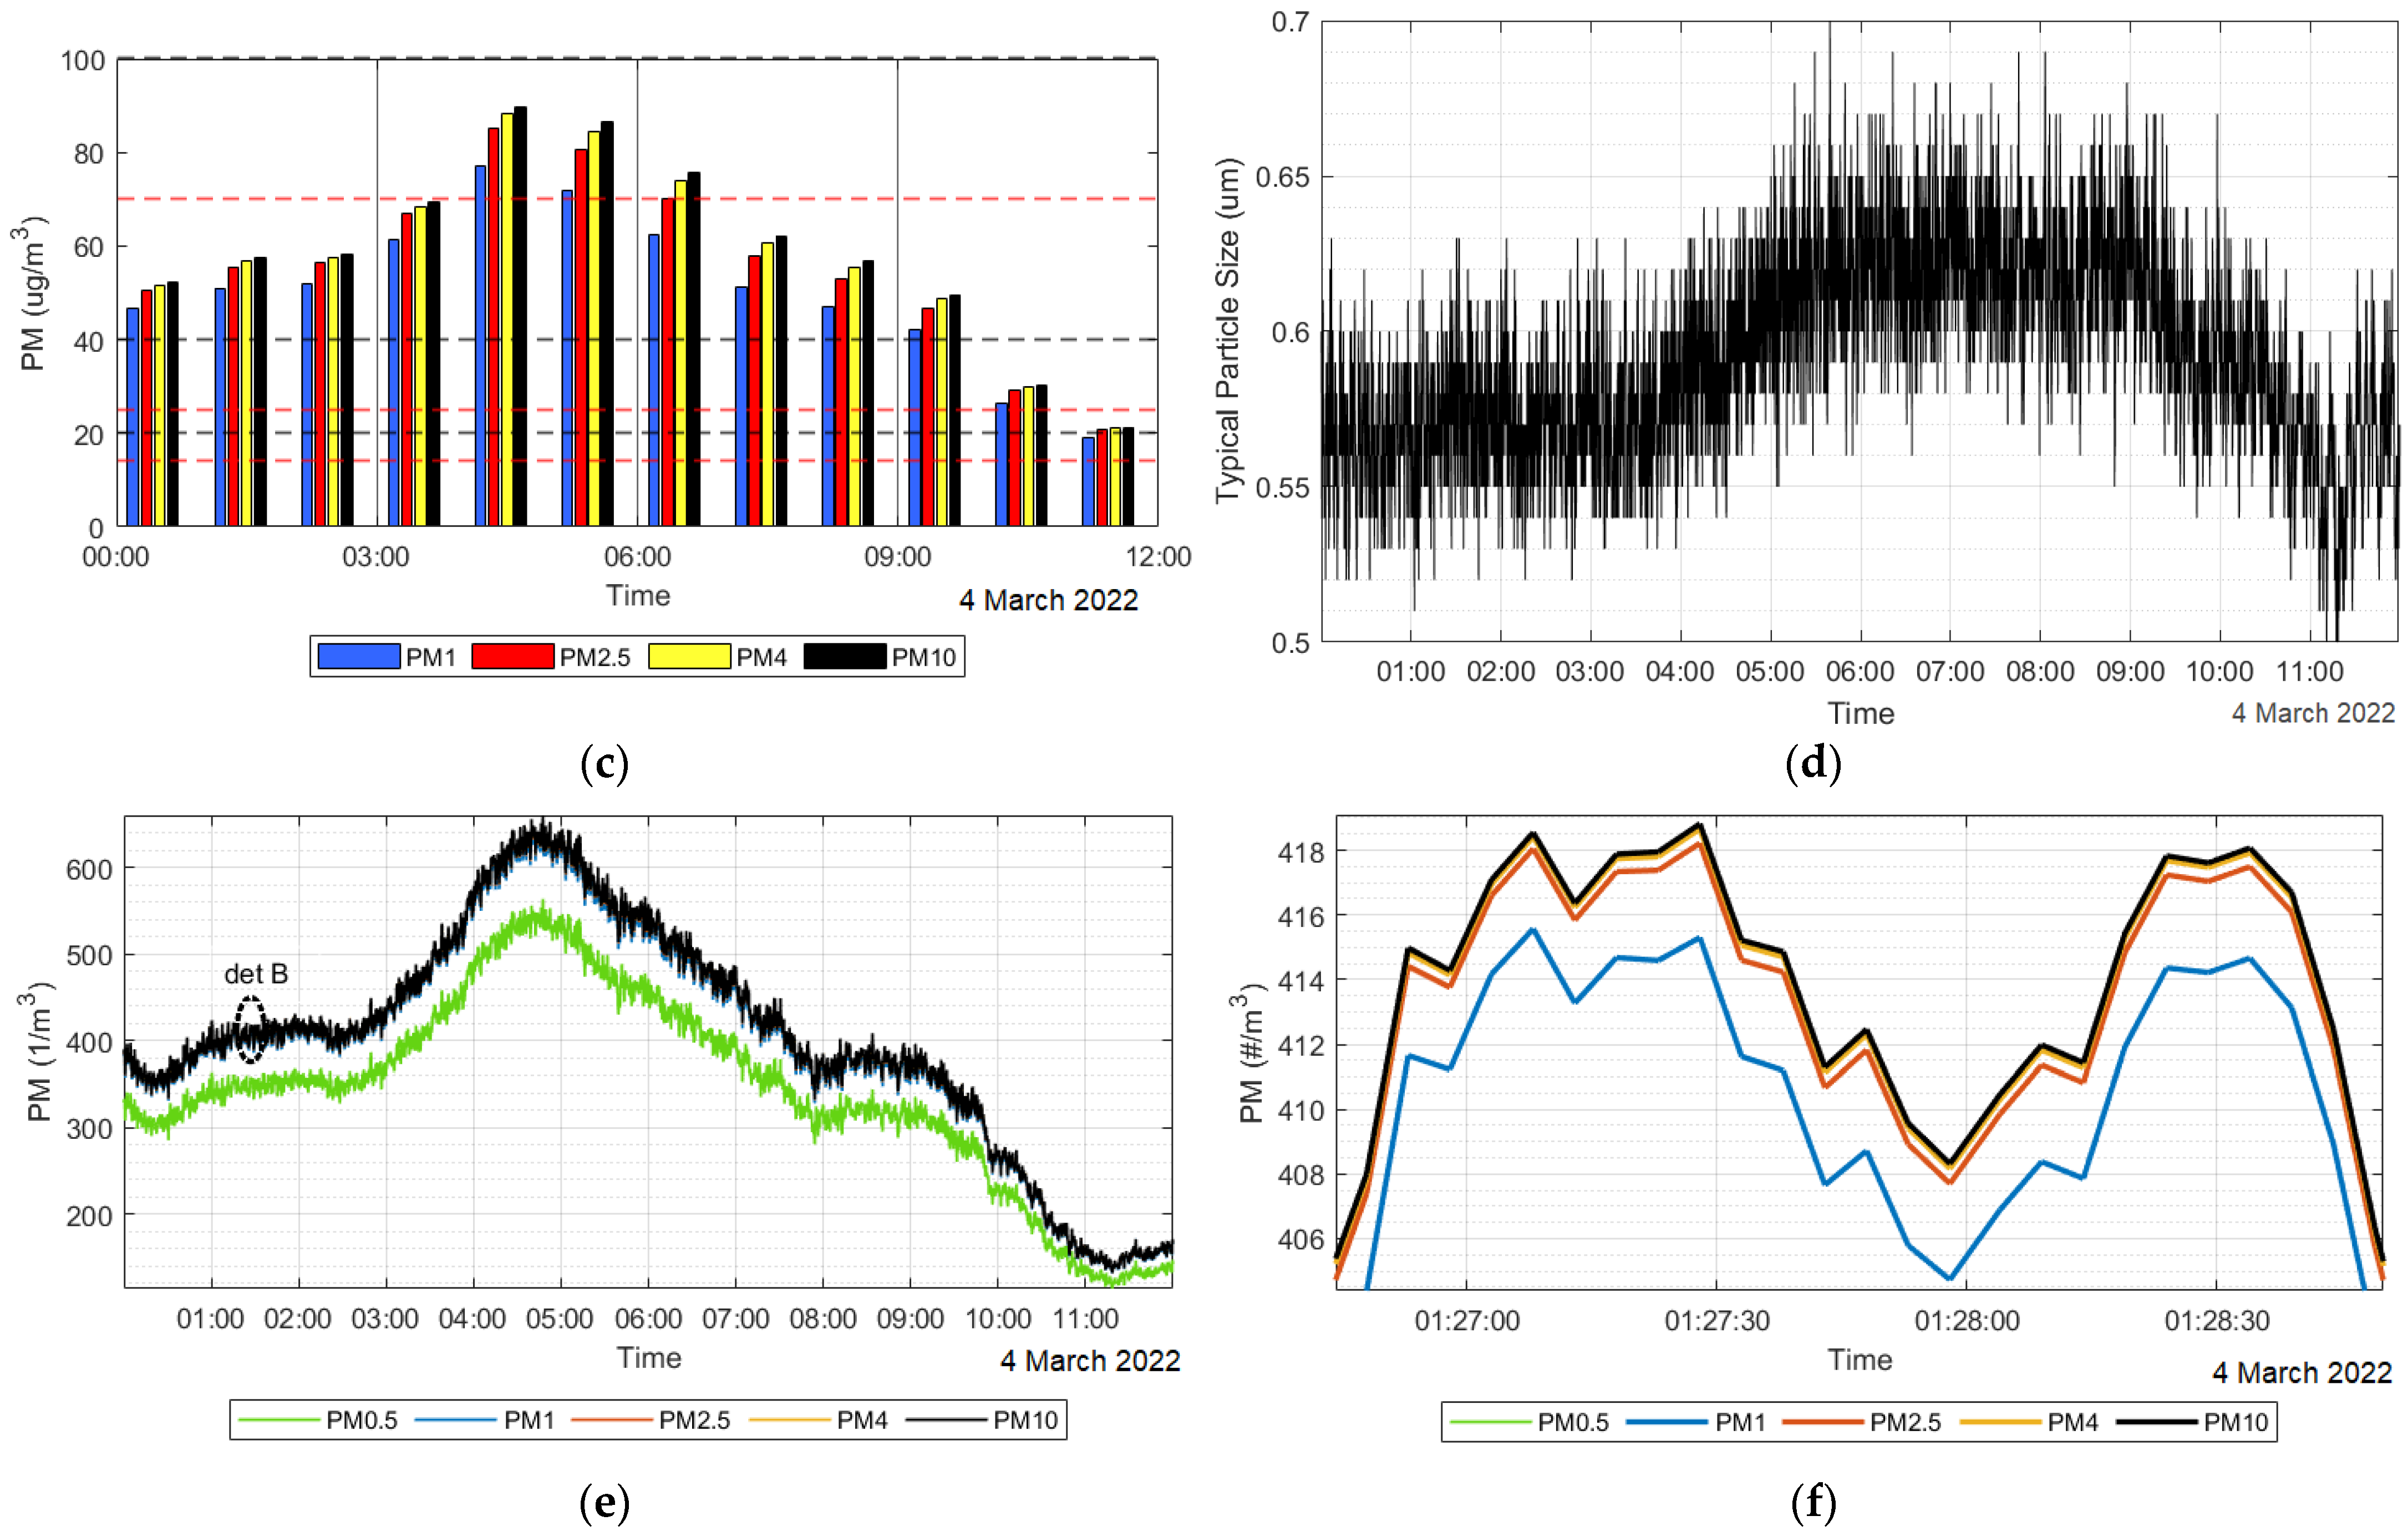
Figure 6a illustrates a 12-h measurement of the mass concentration of PM1, PM2.5, PM4, and PM10. It is clear that PM1 (blue color) is the dominant PM component within PM10 (black). The difference between other components—PM2.5/PM4 (red/yellow) and PM10 (black)—are relatively small, noting that there is more difference between PM2.5 and PM10 than between PM4 and PM10. Figure 6b showcases the selected region (det A) from Figure 6a in close-up detail. The bar graph in Figure 6c illustrates the hourly averages of PM1, PM2.5, PM4, and PM10 mass concentrations. They are largest between 4:00 a.m.–6:00 a.m. and smallest at 11:00 a.m. (all categories of PM have about 20 µg/m3, which only confirms the dominance of PM1). The advantage of the SPS30 and SEN54 sensors is that in addition to mass and number concentrations, they can also measure typical particle size (µm), shown in Figure 6d. It is important to note that the SPS30 and SEN54 sensors are only capable of measuring particles larger than 0.3 µm. In most cases, the typical particle size measured by those sensors ranges from 0.5 to 0.7 µm. The fact is that in Figure 6d, PM10 contains particles with an average size of about 0.6 µm, which are almost 17× smaller than its upper limit of 10 µm. Particles smaller than 0.3 µm could be measured with a different sensor, which will be discussed in Section 3.2.
As for number concentration, SPS30 and SEN54 can measure PM0.5, PM1, PM2.5, PM4 and PM10 number concentrations. Surprisingly, when plotting the number concentration for all 5 types of PM, only 2 lines are shown in Figure 6e—green and black, which correspond to the number concentration of PM0.5 and PM10, respectively. PM1, PM2.5, and PM4 number concentrations are very close to PM10, which is shown in the zoomed-in detail in Figure 6f. A clear increase in PM10 mass concentration relative to PM1 mass concentration in Figure 6c is because larger particles are heavier, therefore the fewer larger particles (e.g., larger than 4 µm) will have a visible impact on the mass concentration of PM10 than the same number of particles, e.g., smaller than 1 µm, on mass concentration of PM10 or PM1. Thus, Figure 6e,f shows that, although PM2.5 or PM10 are commonly evaluated for air quality index findings, much of those categories of particles consist of smaller particles such as PM0.5. To conclude this section, we note that the visualized data in Figure 6 were measured on 4 March 2022 every 5 s in the city of Košice (Slovak republic) at DTIEE.
With the results from Figure 6, we are interested in finding out the ratio of the increase in number concentration between PM1, PM2.5, PM4, and PM10 vs. PM0.5 and the difference of typical particle size in urban and rural locations.
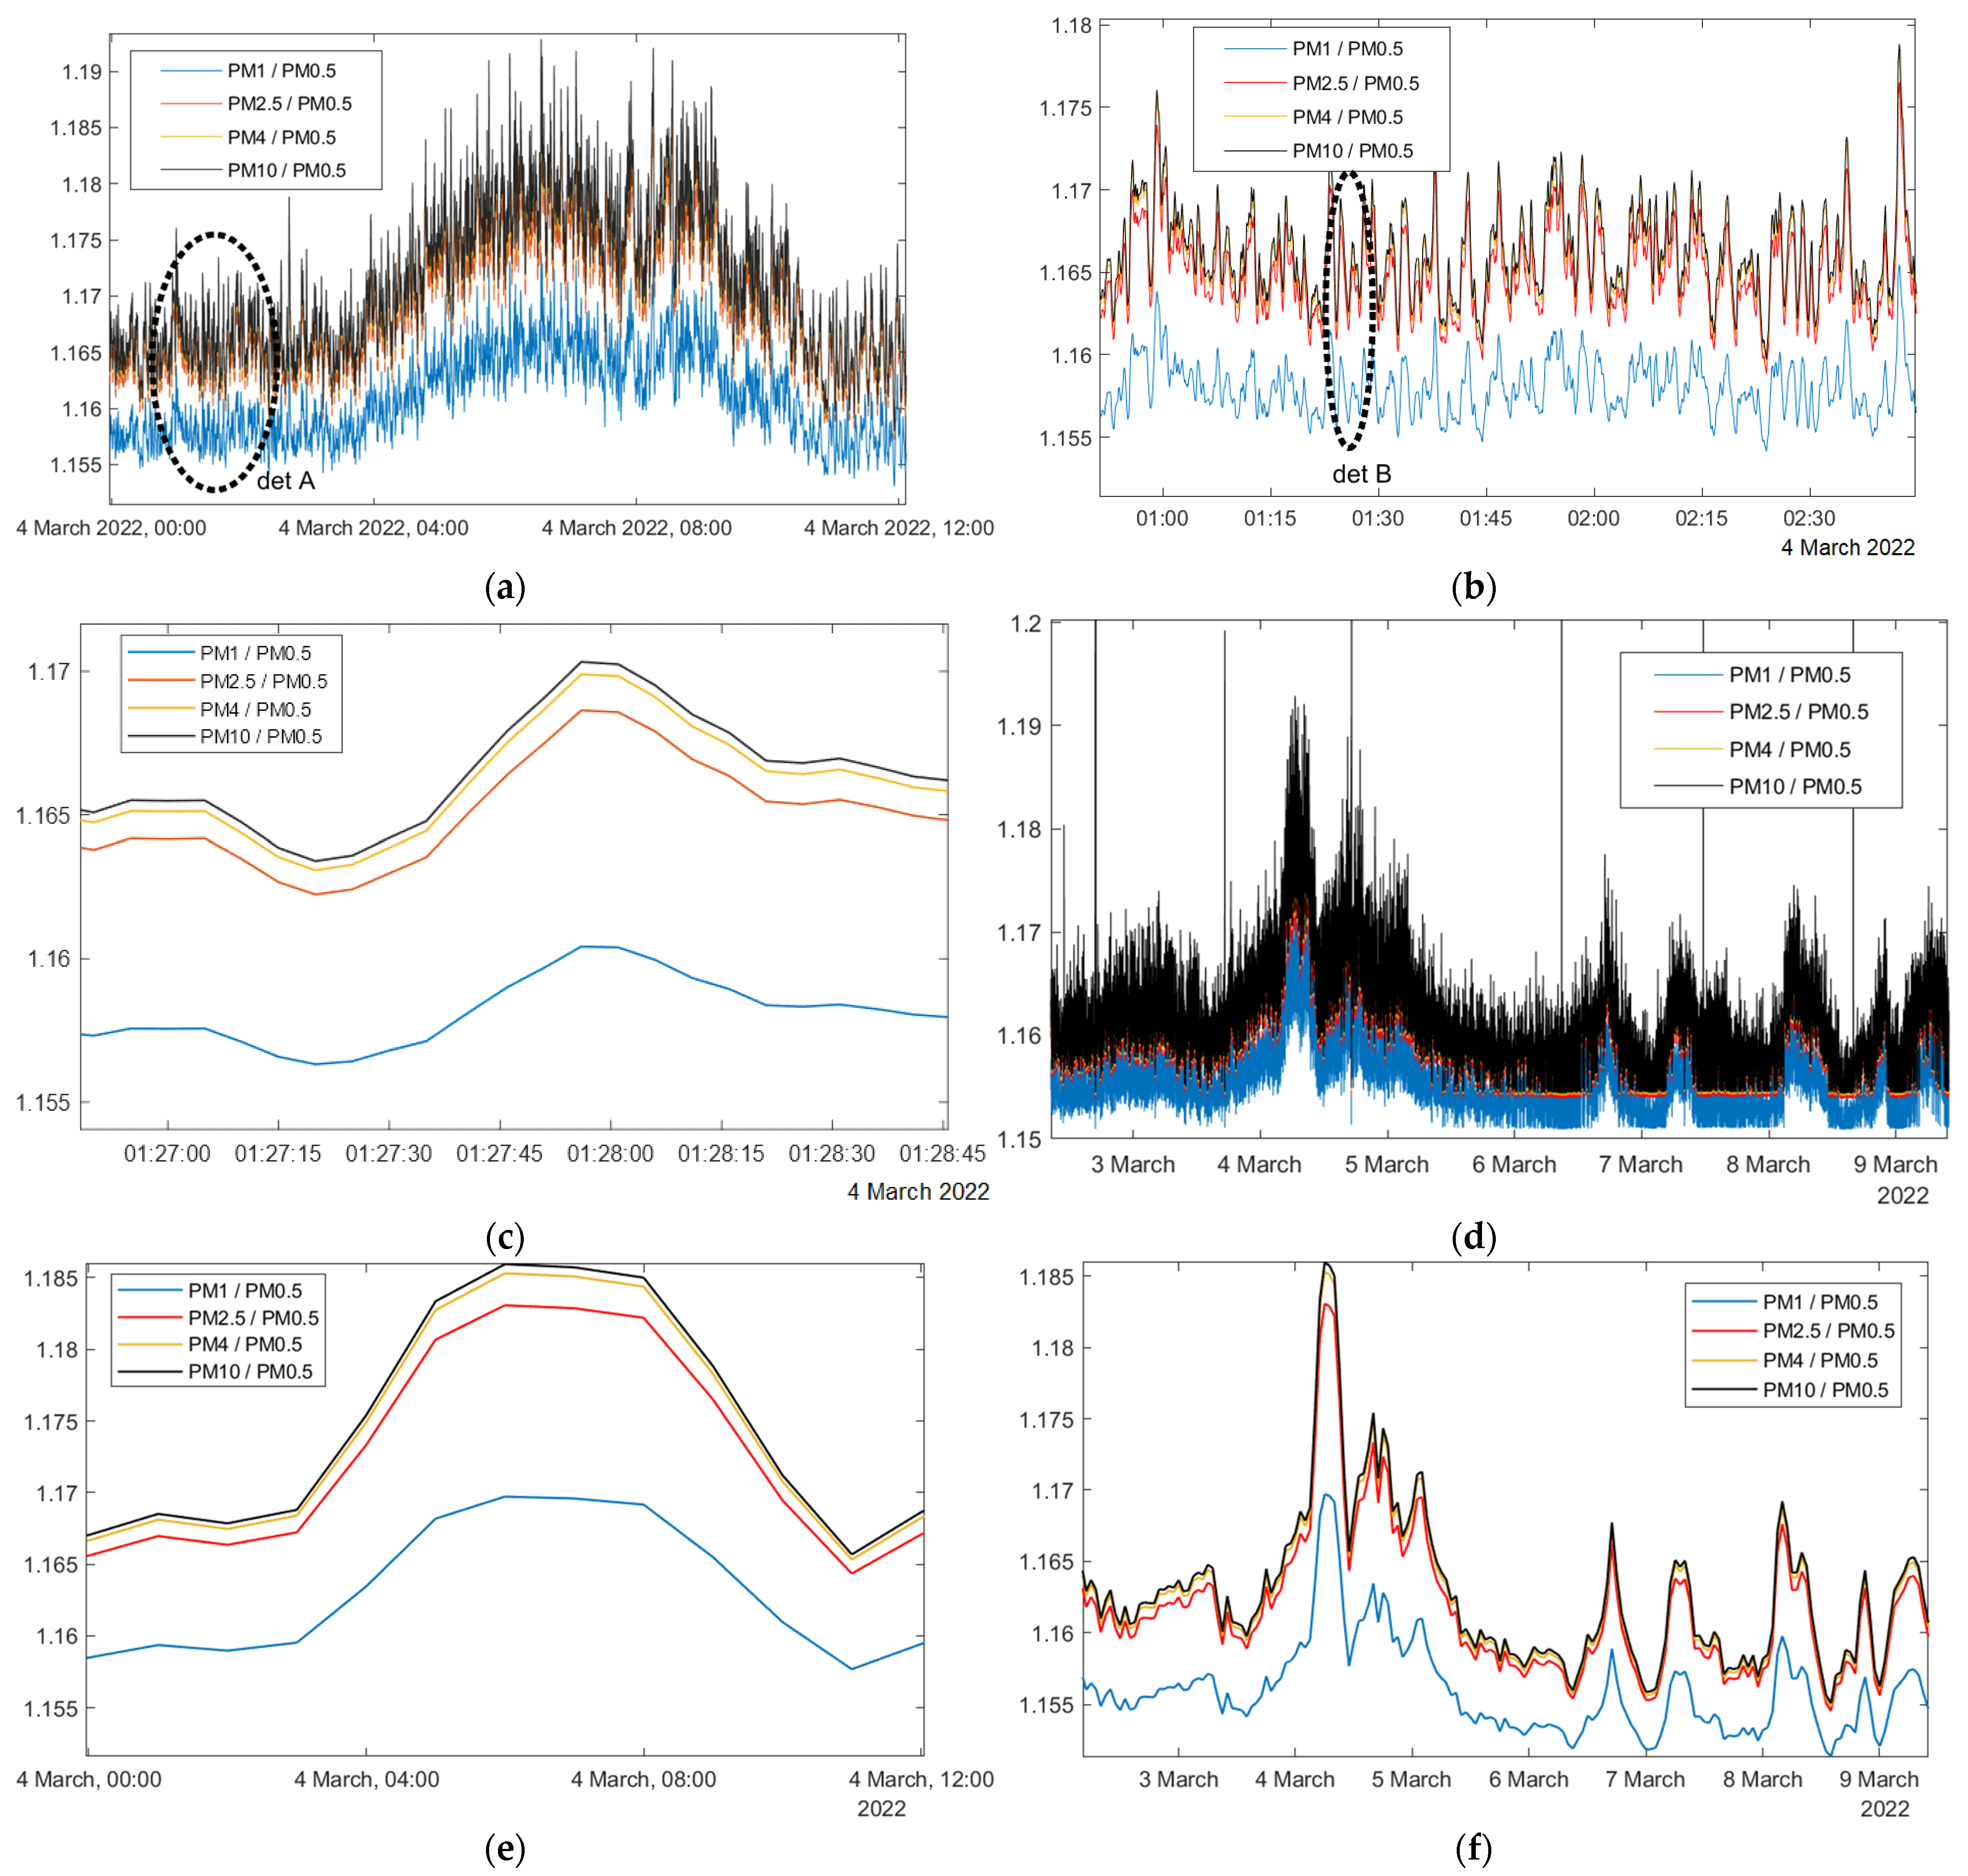
From Figure 6e, the maximum number concentration for PM0.5 or PM10 occurs before 5:00 a.m. (564 or 661 #/cm3). Thus, the difference is 103 #/m3. On the other hand, after 11:00 a.m., the graphs for PM0.5 to PM10 number concentration converge. PM0.5 or PM10 number concentration is 114 or 131 #/cm3, i.e., difference of 17 #/cm3. To get an idea of the change in individual PM versus PM0.5, the ratios of PM0.5 to PM1, PM2.5, PM4, and PM10 number concentration were calculated. Figure 7a shows the ratios between PM1, PM2.5, PM4, and PM10 vs. PM0.5 number concentrations during the entire twelve-hour measurement interval. To better illustrate the dynamics of change over shorter time periods, Figure 7b,c zooms into the plot for det A or det B details. Especially from Figure 7c, it can be seen that the ratio of PM1 to PM0.5 and PM10 to PM0.5 number concentration were approximately 16% and 17%, respectively. This confirms that the majority of particulate matter is made up of small (ultrafine) particles in terms of their numbers, which presents us with a large health problem since the negative health effects of PM are stronger with decreasing size of particles (PM0.1 are so small that they can get into the blood) [16,17,18,19,20]. Figure 7d illustrates the change in the ratios from 2–9 March 2022. The high thin lines exceeding the y-axis threshold of 1.2 are even higher, ranging from 1.4 to 2.3. However, these are only isolated peaks during the eight days of measurement. To make Figure 7a,d easier to interpret, the ratios were calculated from hourly averages of number concentration. Thus, Figure 7e,f shows the hourly changes in ratios during the 12 h or eight days of PM number concentration measurements. From the figures, it can be seen above that the baseline component with the largest number of PMs is PM0.5, then with an increase of at least 15% (PM1 vs. PM0.5 number concentration > 1.15) are PM1. The other PM categories (PM2.5, PM4, PM10 vs. PM0.5) are bigger by only tenths of a percent compared to the PM1 vs. PM0.5.
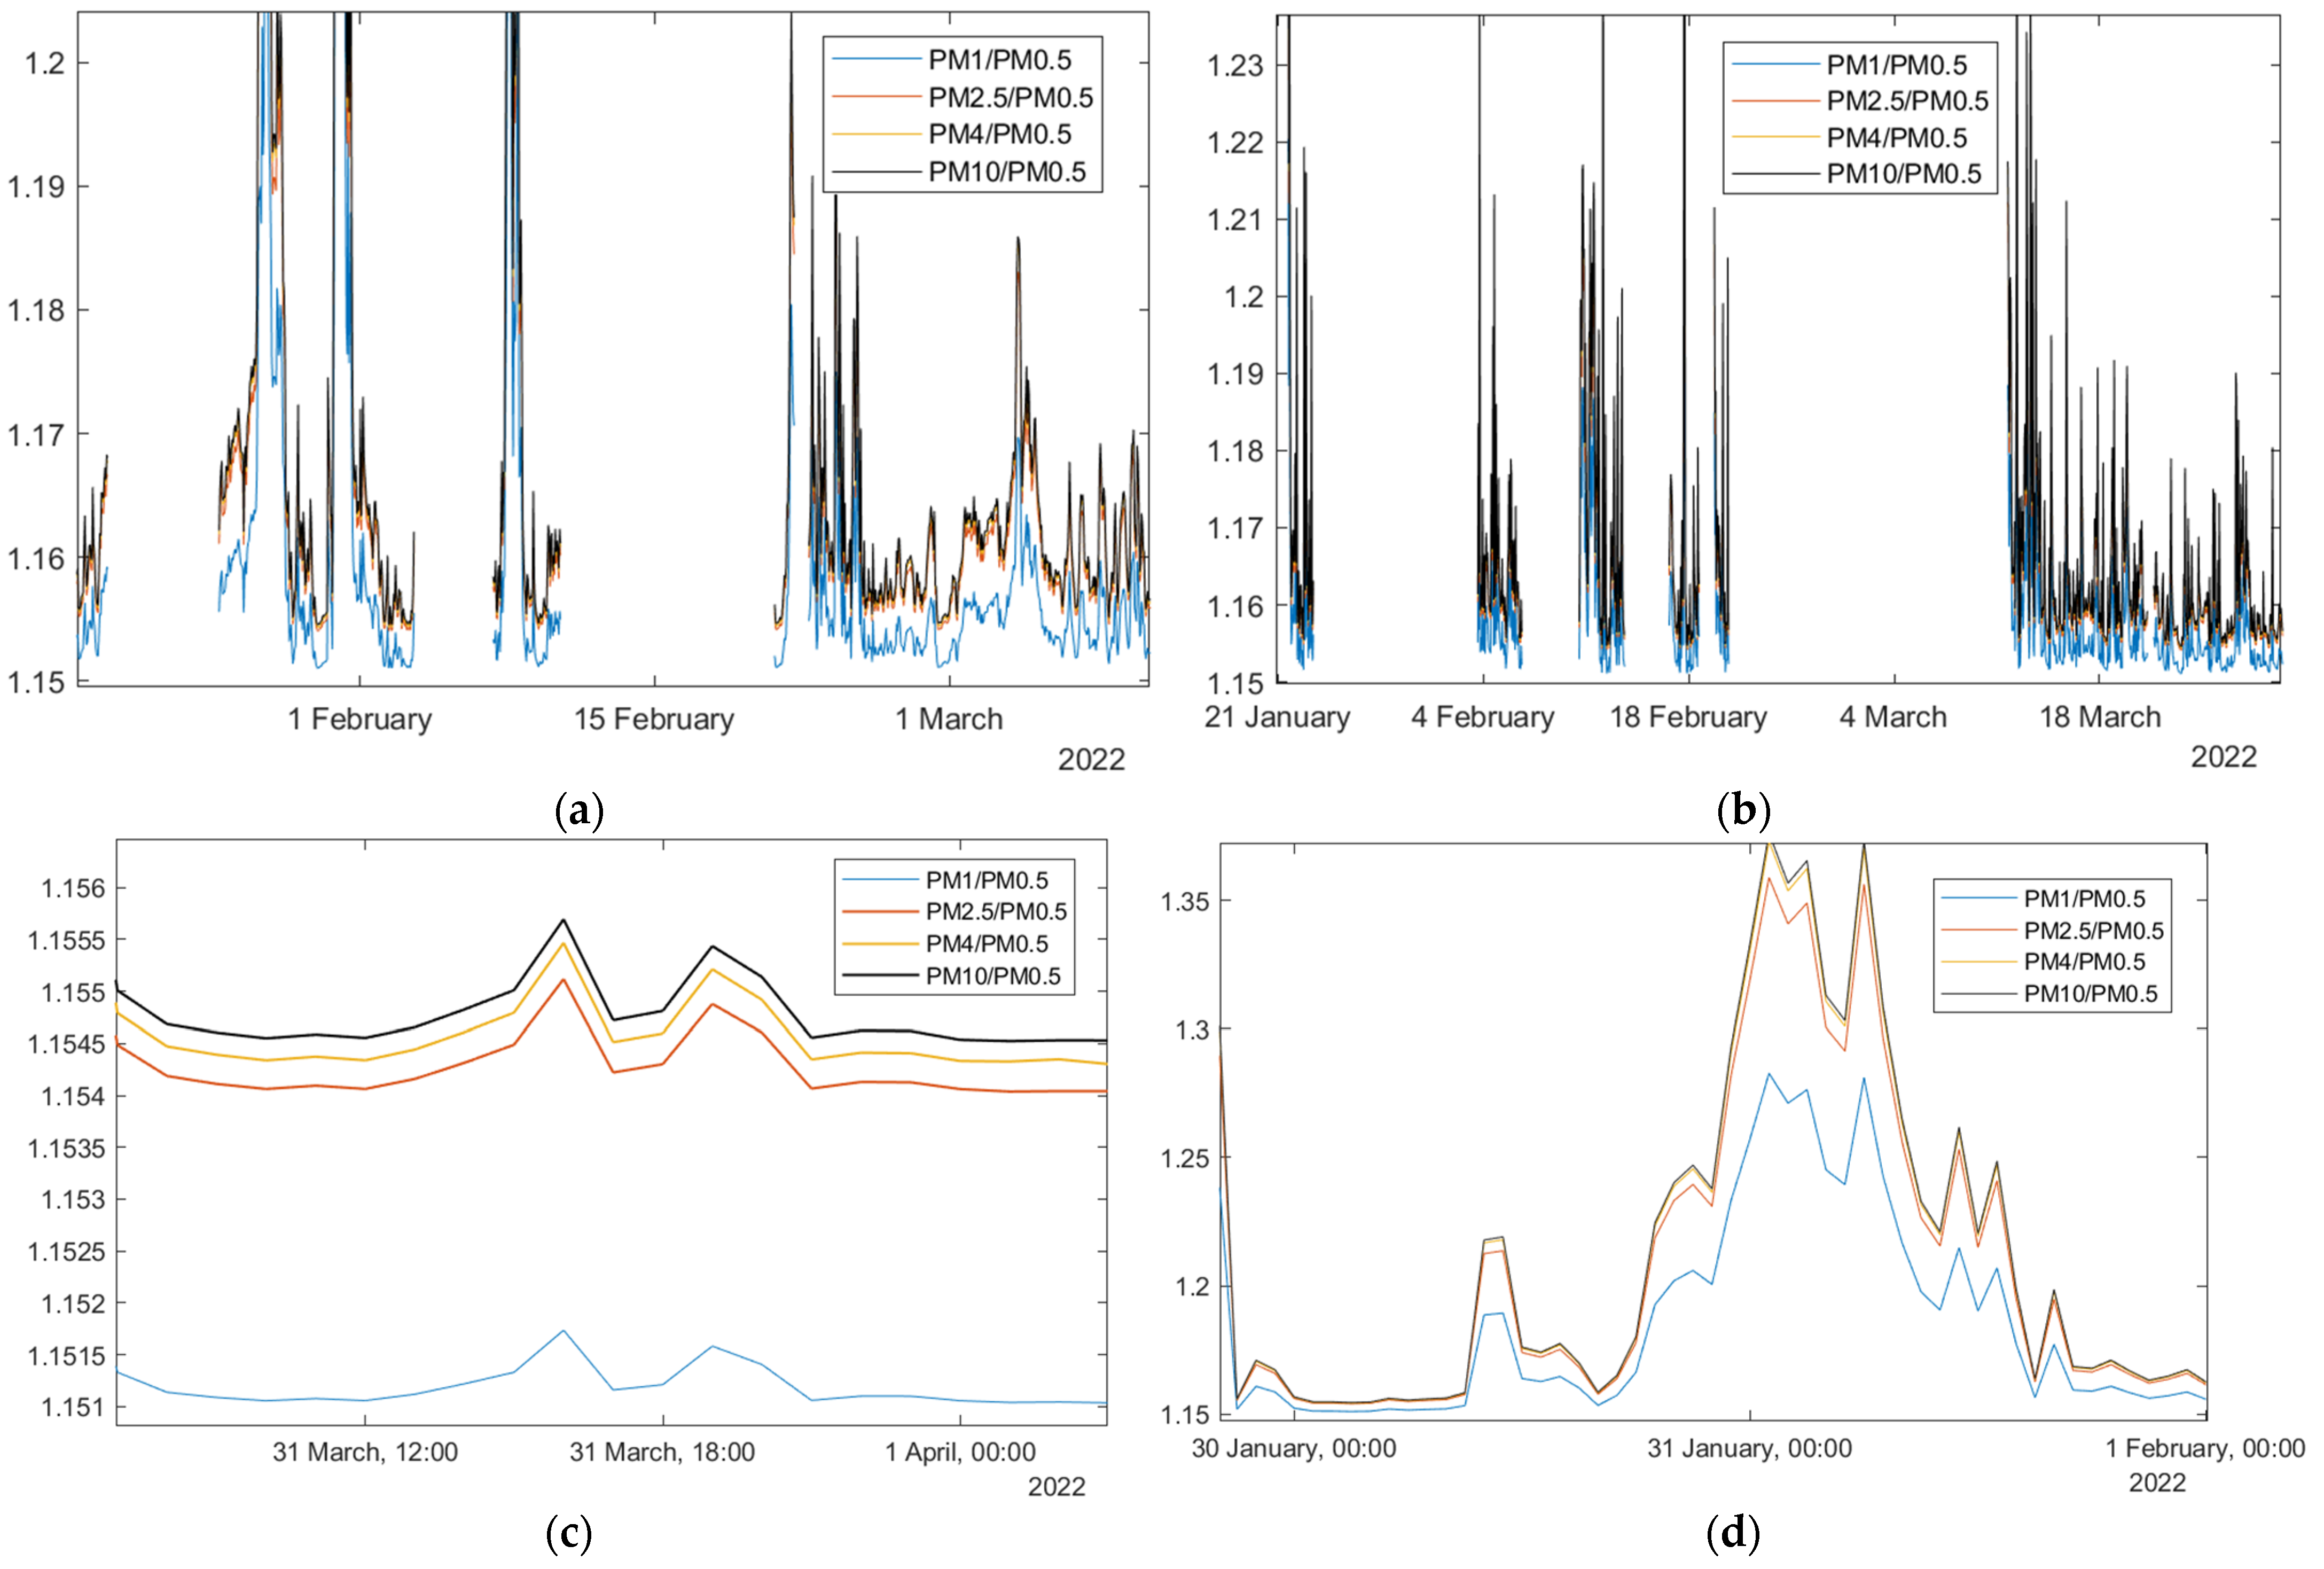
Figure 8 shows the ratios of number concentrations over different time periods of measurement. The changes in the number concentration of PM1/PM0.5 when measured at DTIEE from 18 January 2022 to 9 March 2022 are plotted in Figure 8a. Another longer-term measurement was taken at Füzérkomlós village from 22 January 2022 to 30 March 2022—Figure 8b. The discontinuities in the measurements were due to the lack of sensors at the time of measurement. If there was an opportunity to measure at least for a short time at a different location, the measuring equipment was moved, e.g., to the town of Snina—Figure 8c, to the village of Habura—Figure 8d, or to the Košice #2 measurement site—Figure 8e. In Figure 8, the blue trace indicates the ratio of PM1/PM0.5 number concentration and it is clear that the increase of number concentration for PM1 over PM0.5 is always at least 1.15-fold (i.e., an increase of 15%). Of course, as the PM number concentration increases, the PM1/PM0.5 ratio also increases up to 1.2 (sporadically up to 1.375). The black peaks in Figure 8a,b representing the PM10/PM0.5 ratio have occasional short-term peaks from 1.35 to 1.53.
Figure 8f—measurement at DTIEE and Figure 8d—measurement at Habura (80 km from DTIEE) are similar. What is interesting about them is that the time period for the ratio PM1/PM0.5 > 1.2 fraction lasts more than 12 h in both cases from 30 January 2022 18:00 to 31 January 2022 13:00. Considering the distance between the two measurement sites (80 km), the increase in the PM1/PM0.5 fraction was caused by a large particle cloud that brought the above changes gradually to both measuring sites. Although it might seem a disadvantage that the distance between the two measurement sites is up to 80 km, this distance allows us to get an idea of the size of the particle cloud and the direction of its movement, which is undoubtedly related to the wind direction. This is also an advantage of using low-cost sensors, which, although they measure with a relatively large error (10–25% see Table 1 and Table 2), can be much more densely spaced than the more accurate but expensive PM measurement devices.
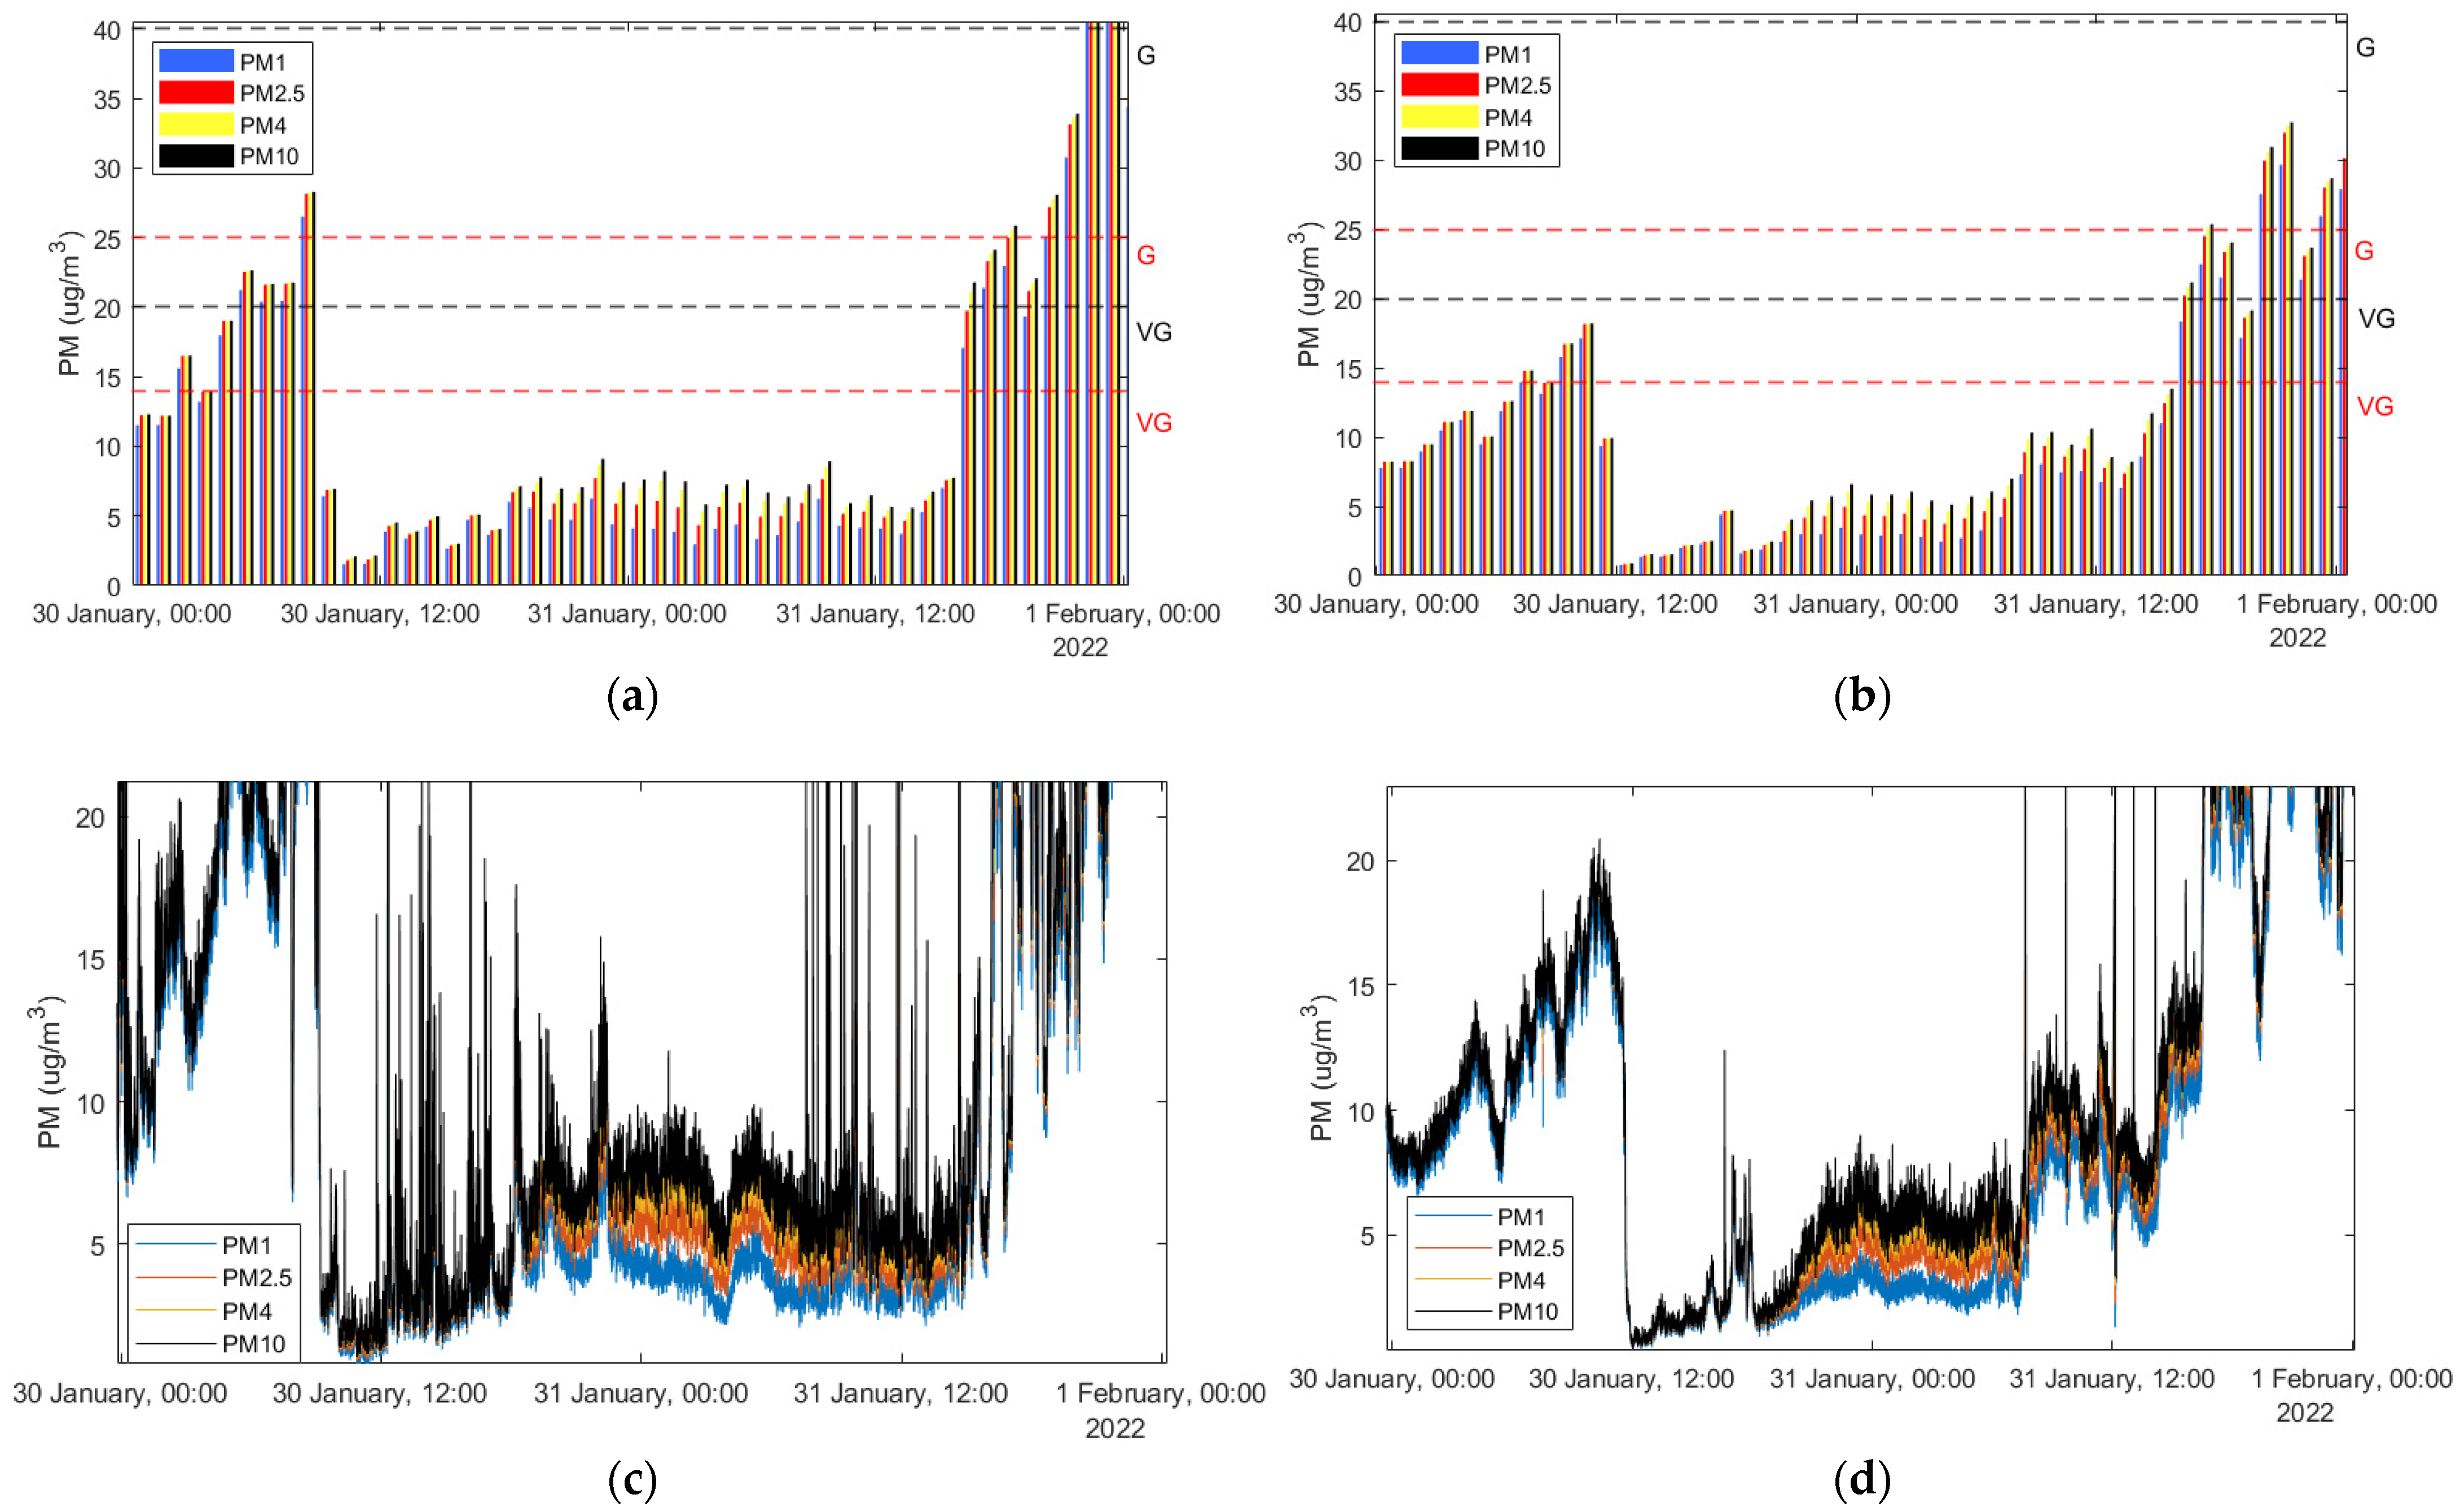
Looking at Figure 9a,b, it is clear from the bar graphs, that as of 30 January 2022 at 0:00 a.m. there are no major differences between PM1 (blue bar) and PM10 (black bar) and the bars are mostly about the same. On 30 January 2022 (after approximately 7:00 PM) the differences between the PM1, PM2.5, PM4, and PM10 columns begin to increase. The ratio PM1/PM0.5 > 1.2 fraction lasts at DTIEE until 31 January 2022 at 8:00 a.m. (ends later in Habura), but the color differences corresponding to the fractions are visible in Figure 9c,d until 2:00 PM (31 January 2022). After that, the PM1/PM0.5 ratio drops again to the 1.15 threshold.
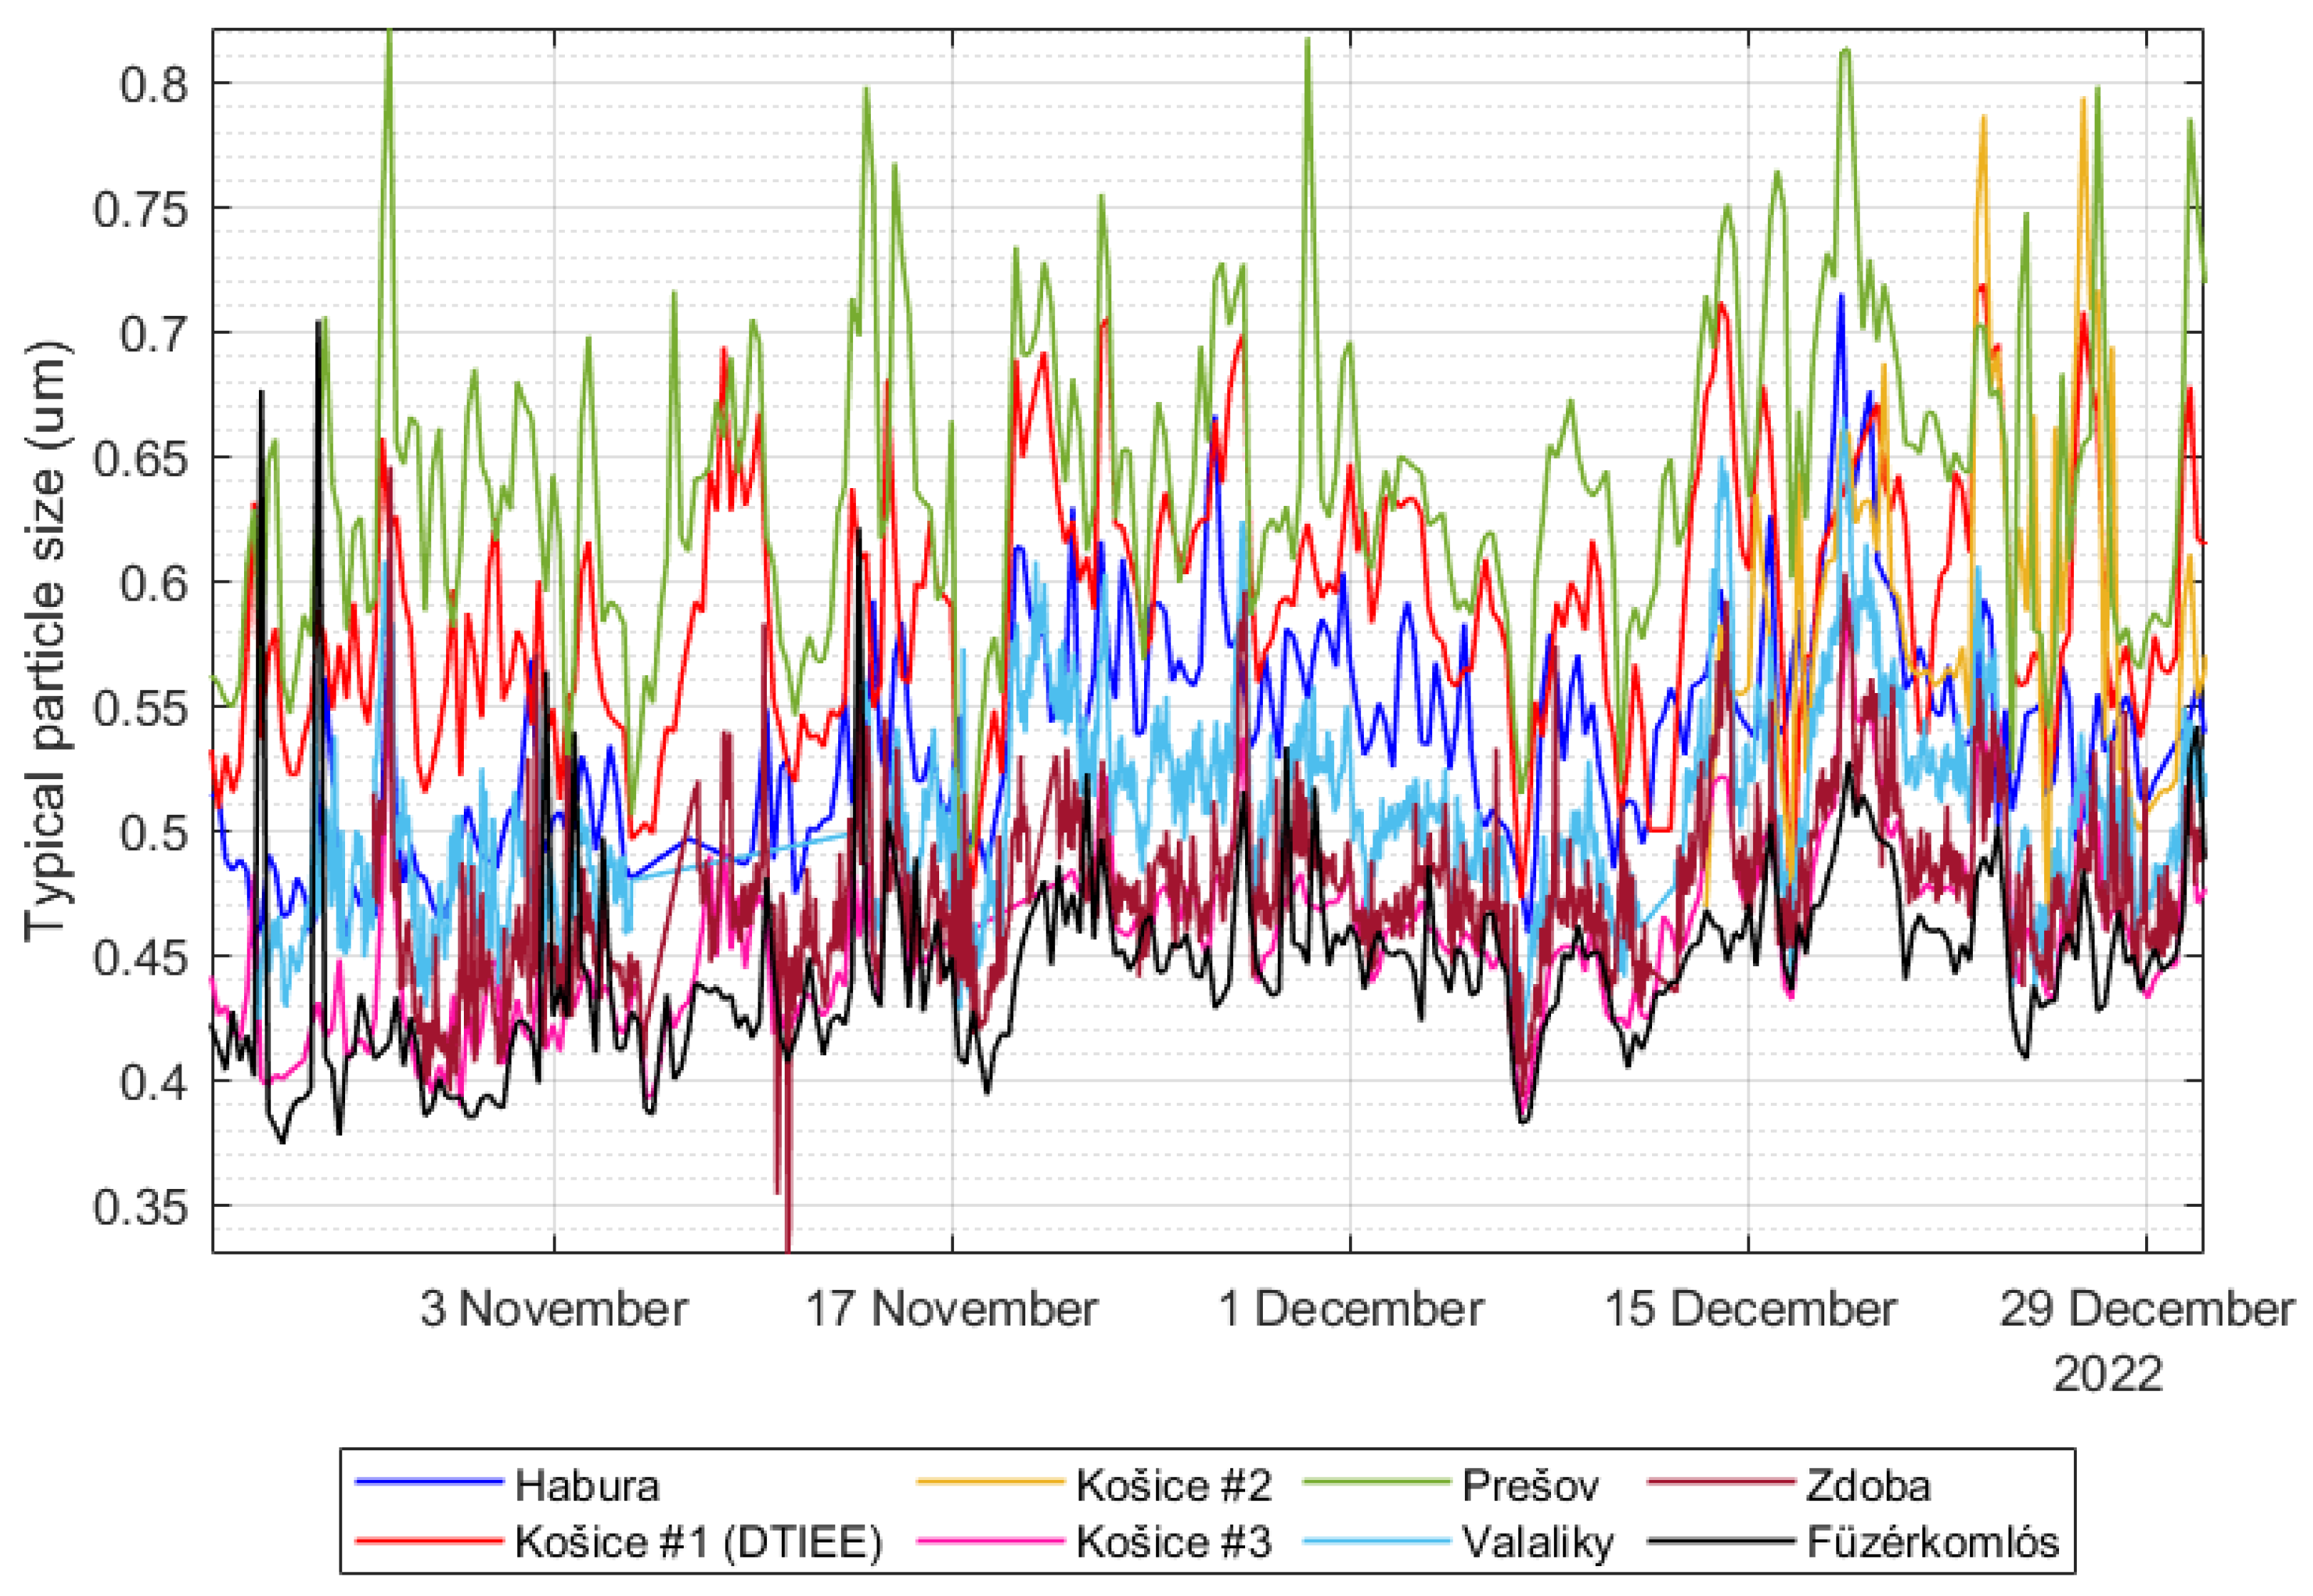
Based on the number concentration measurements and the calculations of ratios between PM0.5 and other PM categories, it can be seen that PM0.5 is the dominant particle type in all other PM categories (for number concentration). Other PM constituents are at least only 15% (PM1) greater than PM0.5 (the increases of other PM, e.g., PM2.5 to PM1, are small, mostly up to 1%). Thus, the amount of PM0.5 particles present in the air is not negligible. Since the SPS30 and SEN54 sensors also allow measuring the typical particle size, it will be interesting to see what it is in different locations and whether its value depends on the measurement location. Figure 10 shows the change in typical particle size at Habura, three Košice measuring sites (including DTIEE), Prešov, Valaliky, Zdoba, and Füzérkomlós. The figure shows measurements from 22 October 2022 till 31 December 2022 except Košice #2 measurement site which started on 13 December 2022. In some measuring sites, there were breaks in measurement that were caused either by bad weather (Habura, Valaliky, Zdoba) or unexpected power outages (Košice #3). For Habura the break in measurement was between 5–11 November 2022, for Zdoba the break in measurement was between 5–8 November 2022, for Valaliky the break in measurement was between 5–13 November 2022, and for Košice #3 the break in measurement was between 16–21 November 2022.
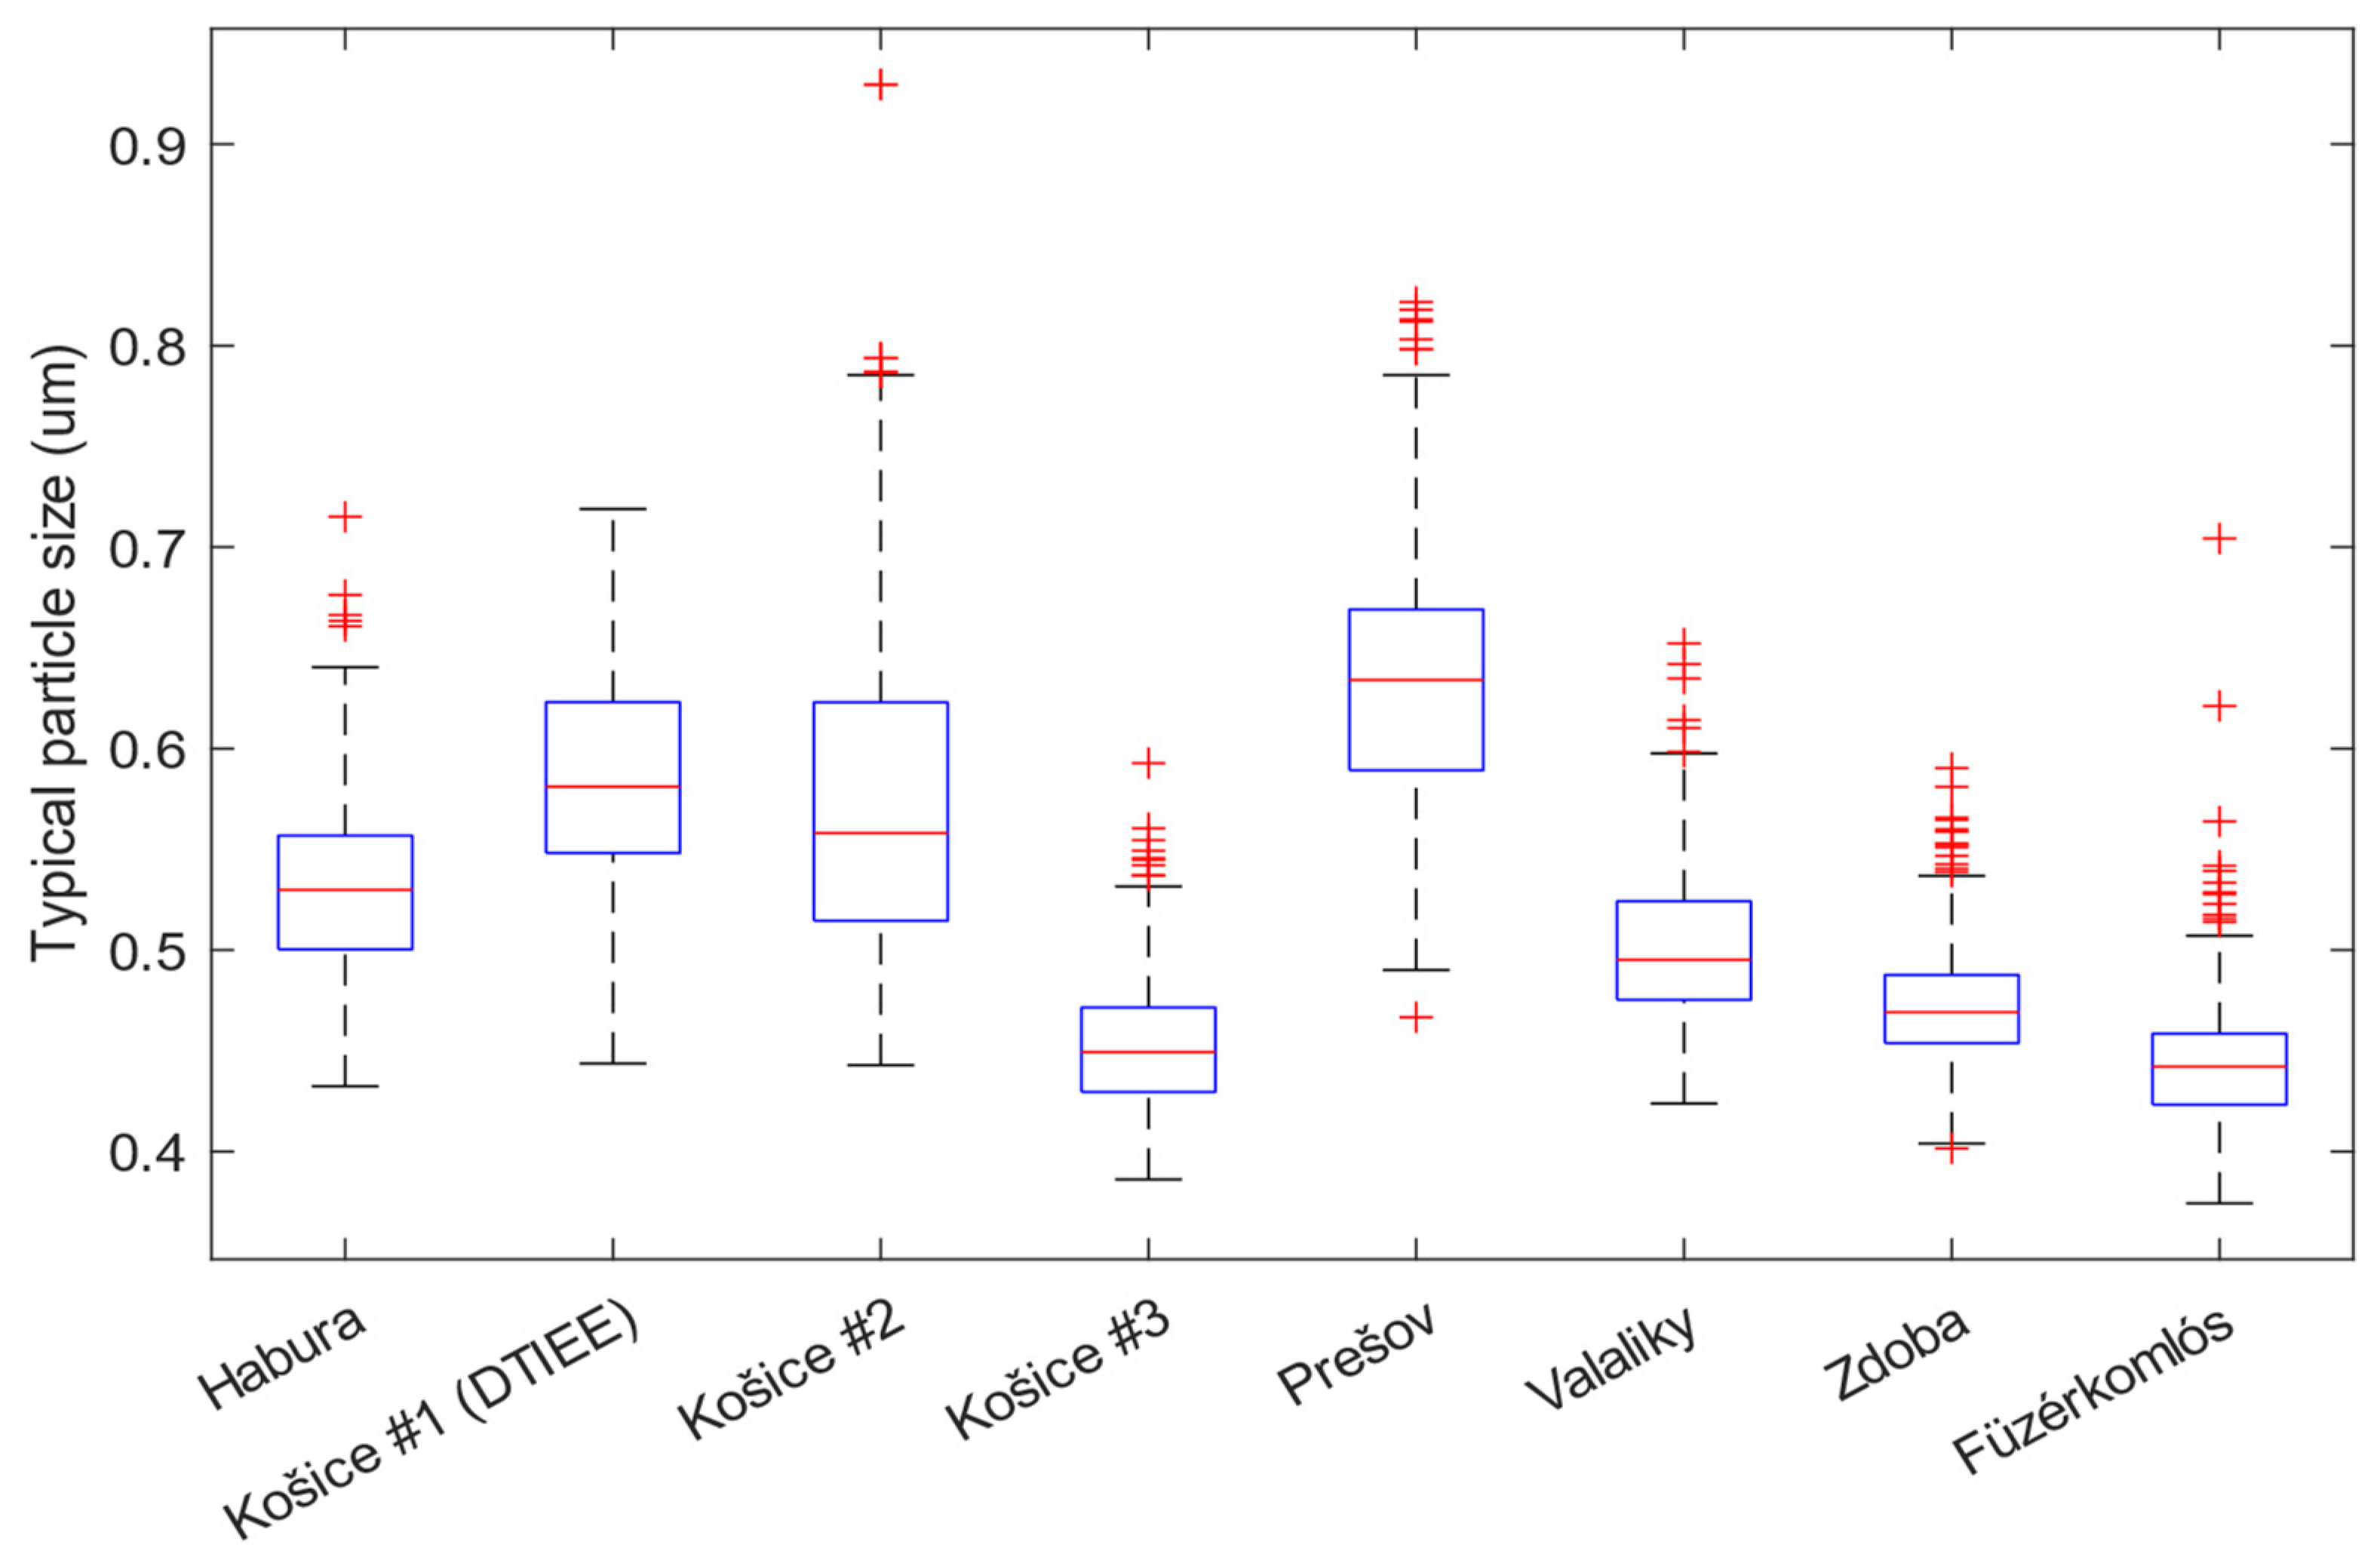
More detailed information (including the interquartile range, minimum, maximum, median, and outliers in data points) about the measuring sites is presented in Figure 11 using the box plot. The values of the interquartile range, minimum, maximum, and median are summarized in Table 3.
Table 3 summarizes the findings from Figure 10 and Figure 11. It is clear that the typical particle size is less than or approximately equal to 0.5 µm with a median ranging from 0.44 µm to 0.63 µm. In Košice #1 and #2 and Prešov, the typical particle size is greater than 0.5 µm with a mean ranging from 0.56 µm to 0.63 µm. The values at site Košice #3 are interesting, with a median equal to that at Füzérkomlós village (0.44 µm). Except for Košice #3, measuring sites located in the city have larger typical particle sizes than the measuring sites located in rural areas. Since the main source of pollution in the countryside is wood combustion (which is even more prominent now due to the current geopolitical situation and its resulting energy crisis), this results in an increased concentration of fine particles. An abundance of smaller particles causes the smaller typical particle size. This is caused by the location characteristics. Although this measurement site is located in the city of Košice, the measuring site is fairly isolated from the immediate sources of PM. The measurement station is placed on the balcony on the 5th floor of a U-shaped apartment block facing inward towards a park and away from any roads. This creates similar conditions to the countryside. The urban locations of Košice #1 (DTIEE), Košice #2, and Prešov, on the other hand, have a predominant PM occurrence with both larger PM size and larger interquartile range (Figure 11), where in addition to traffic emissions, road surface abrasion, and industrial activity is also a contributing factor.

3.2. Measuring PM Using IPS-7100

By allowing the IPS-7100 to also measure the number concentration of PM0.1 and PM0.3, it is possible to get even below the detection limit of the SEN54 and SPS30 sensors.
Another thing to consider is the fact that number concentration is defined differently than it is defined for SPS30 or SEN54 sensors. For example, the mass concentration of PMx is in all sensors (SPS30, SEN54, and IPS-7100) defined as the mass concentration of particles that are smaller than x µm. In reality, the detection threshold for SPS30 and SEN54 sensors is 0.3 µm [48,49], therefore PM1 would be measured mass concentration of particles which are between sizes of 0.3 to 1 µm, similarly, PM2.5 particles would range from 0.3 to 2.5 µm, and so on. Such is the case for both mass and number concentration measured by sensors SPS30 and SEN54.
On the other hand, the detection limit for IPS-7100 is 0.1 µm—however, the sensor is capable of calculating the mass and number concentration of particles smaller than 0.1 µm (PM0.1, or ultrafine particles) from the existing concentrations of other categories and the size distribution of the particles, and so we can say that PM0.1 is still being measured, even if is measured indirectly. Therefore, for mass concentration, the categories are defined similarly to SPS30 and SEN54 sensors—PM0.1 as particles smaller than 0.1 µm, PM0.3 as particles smaller than 0.3 µm, and so on.
The difference is in how IPS7100 measures the number of concentrations of PM. While SPS30 and SEN54 measures number concentrations of PM smaller than 0.5 µm (PM0.5), 1 µm (PM1), etc. (cumulative number concentrations), IPS7100 measures PM number concentrations that are not cumulative—smaller than 0.1 µm (PM1), bigger than 0.1 µm and smaller than 0.3 µm (PM0.1–0.3), bigger than 0.3 µm and smaller than 0.5 µm (PM0.3–0.5), etc.
This non-cumulative representation of number concentrations better illustrates which category of PM is a dominant component in terms of number concentration, which will be shown in the next part of this paper.
Another thing to take into consideration is the different lower detection limits between SPS30/SEN54 and IPS-7100. While the detection of SPS30 and SEN54 is 0.3 µm, IPS-7100 for all practical uses does not have a lower detection limit (as the particles under its detection limit are measured indirectly by calculation). We can expect this fact to impact the measured number of concentrations.
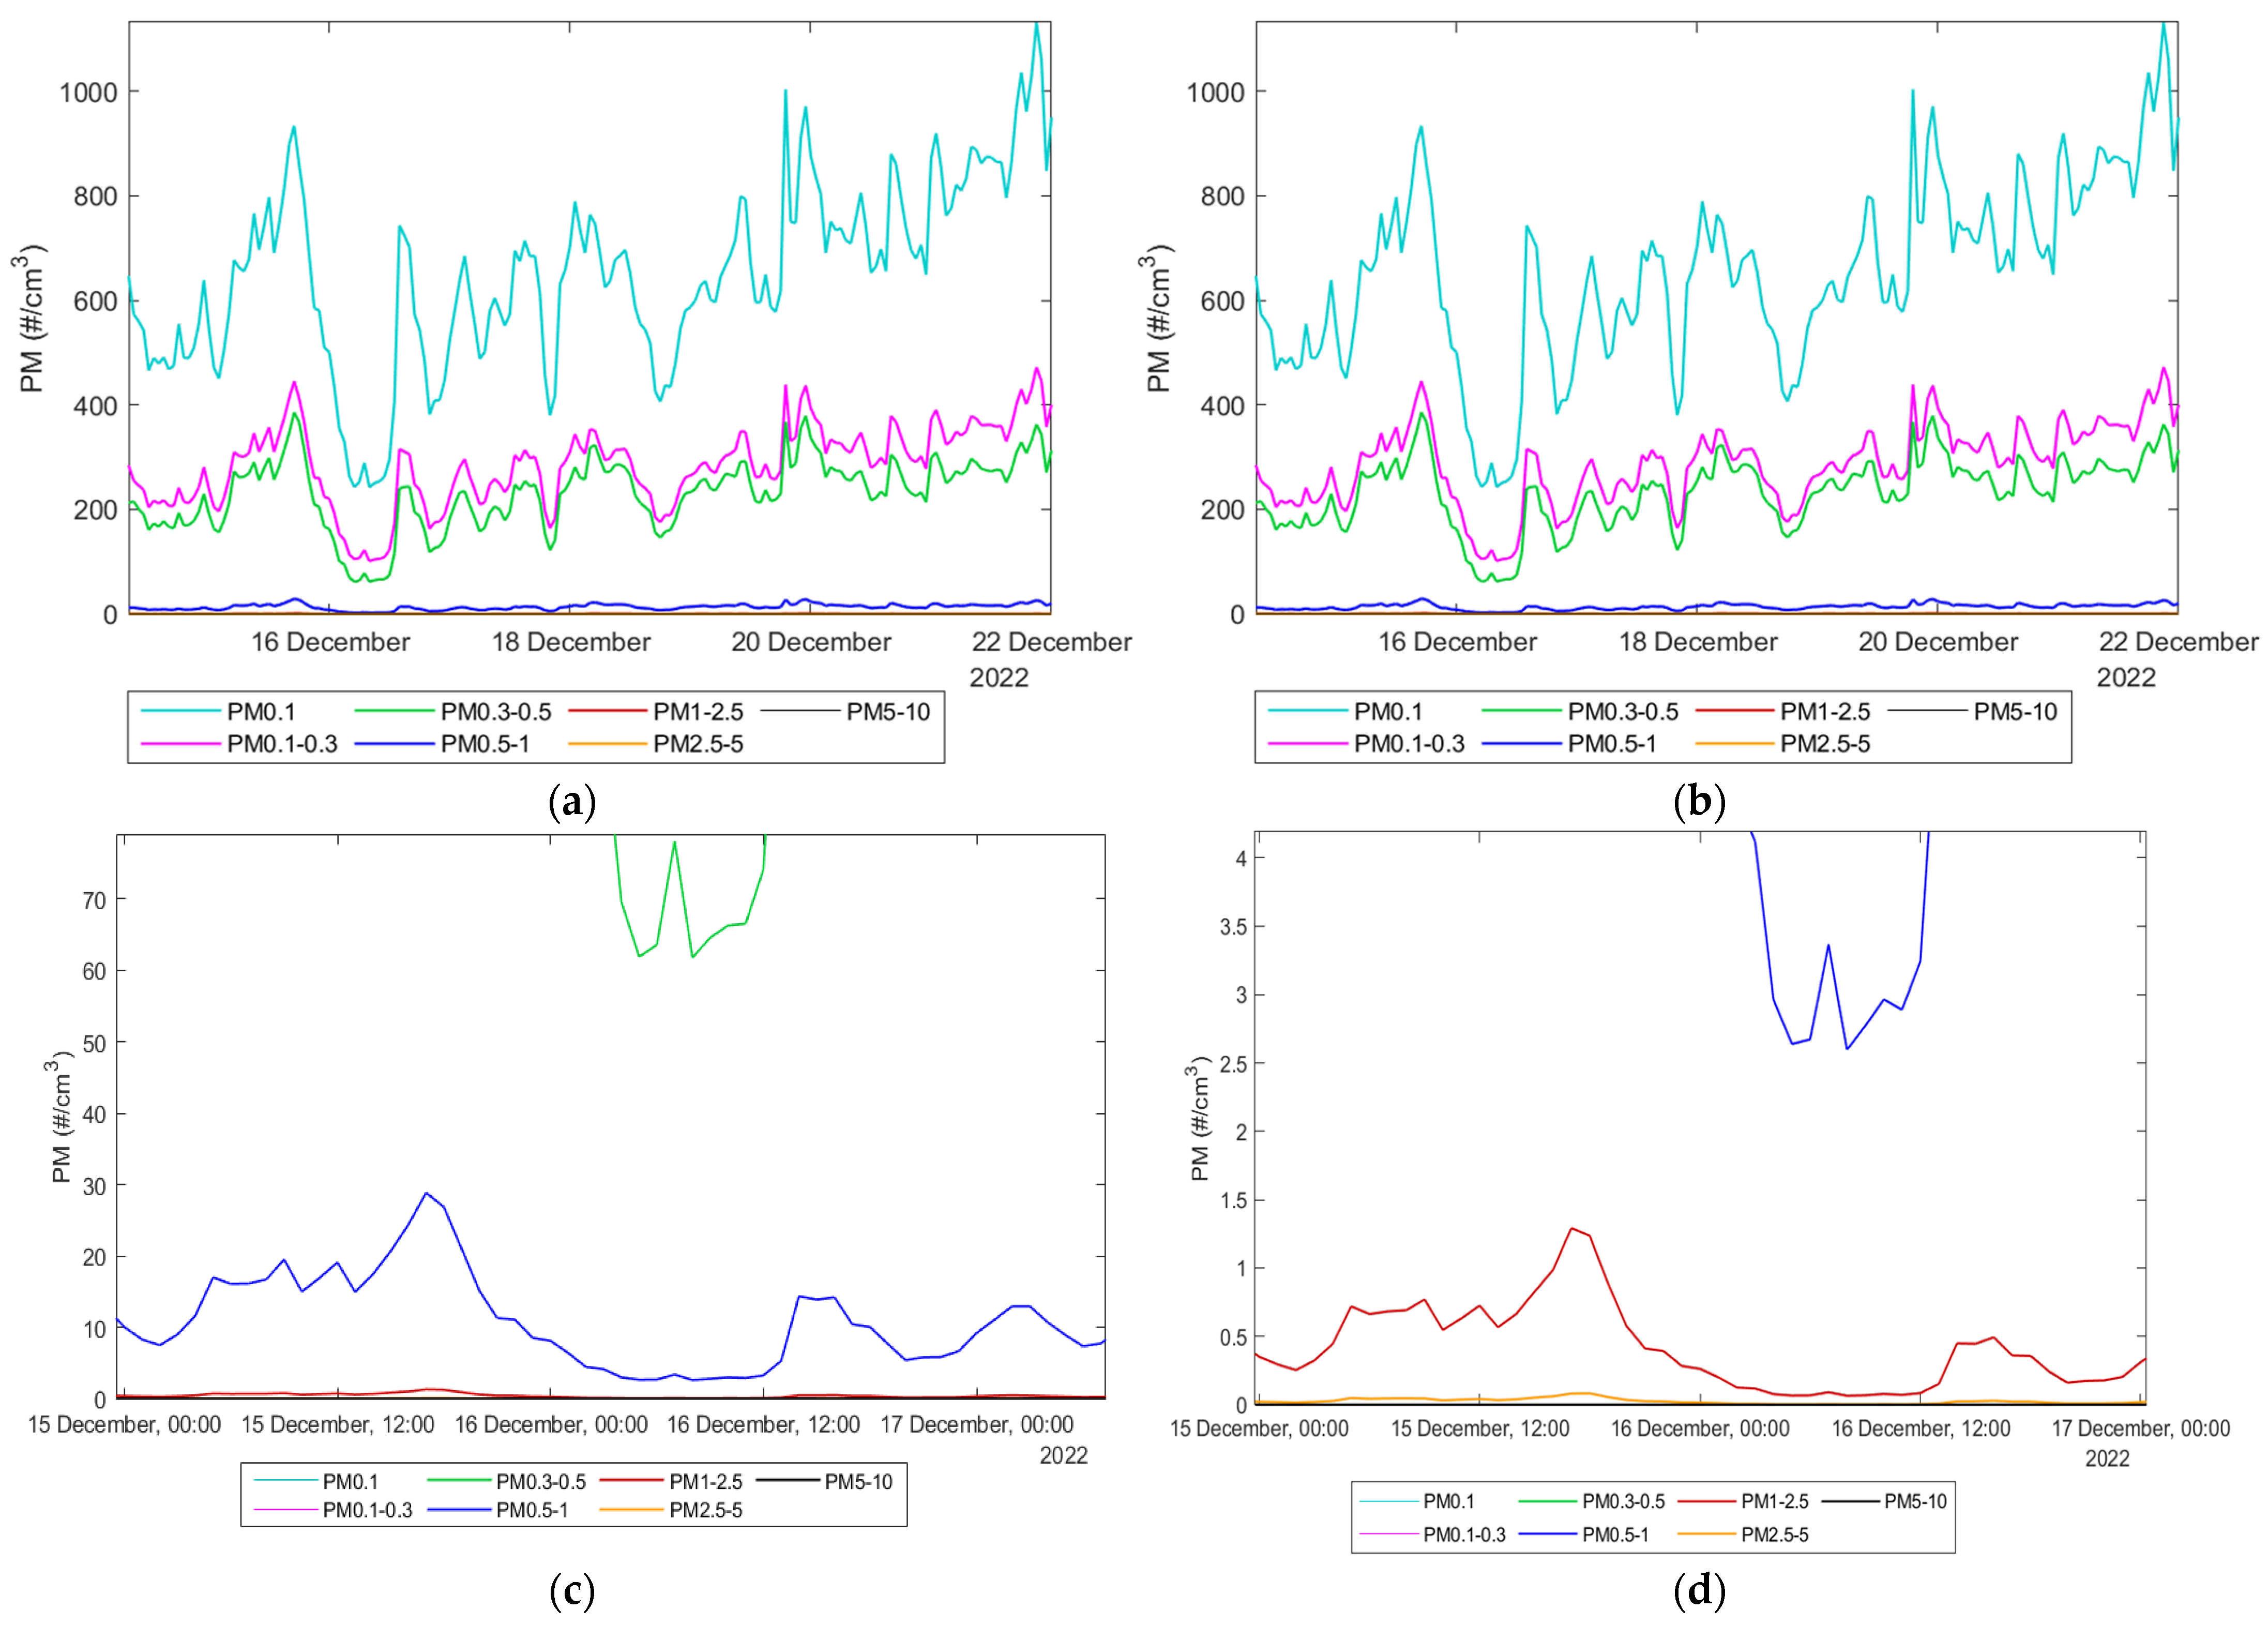
Figure 12a shows the entire measurement record from 14–22 December 2022. The dominant component in terms of the number concentration of PM is PM0.1 (cyan), about half as much of the number concentration of PM is PM0.1–0.3 (magenta), and right behind it is PM0.3–0.5 (green). At the bottom of the plot is a dark blue curve for the number concentration of PM0.5–1. Thus, from Figure 12a it is clear that essentially the major constituents making up PM are PM0.1, PM0.1–0.3, and PM0.3–0.5. The fact that the largest number concentration of PM is PM0.1 is a major warning for human health.
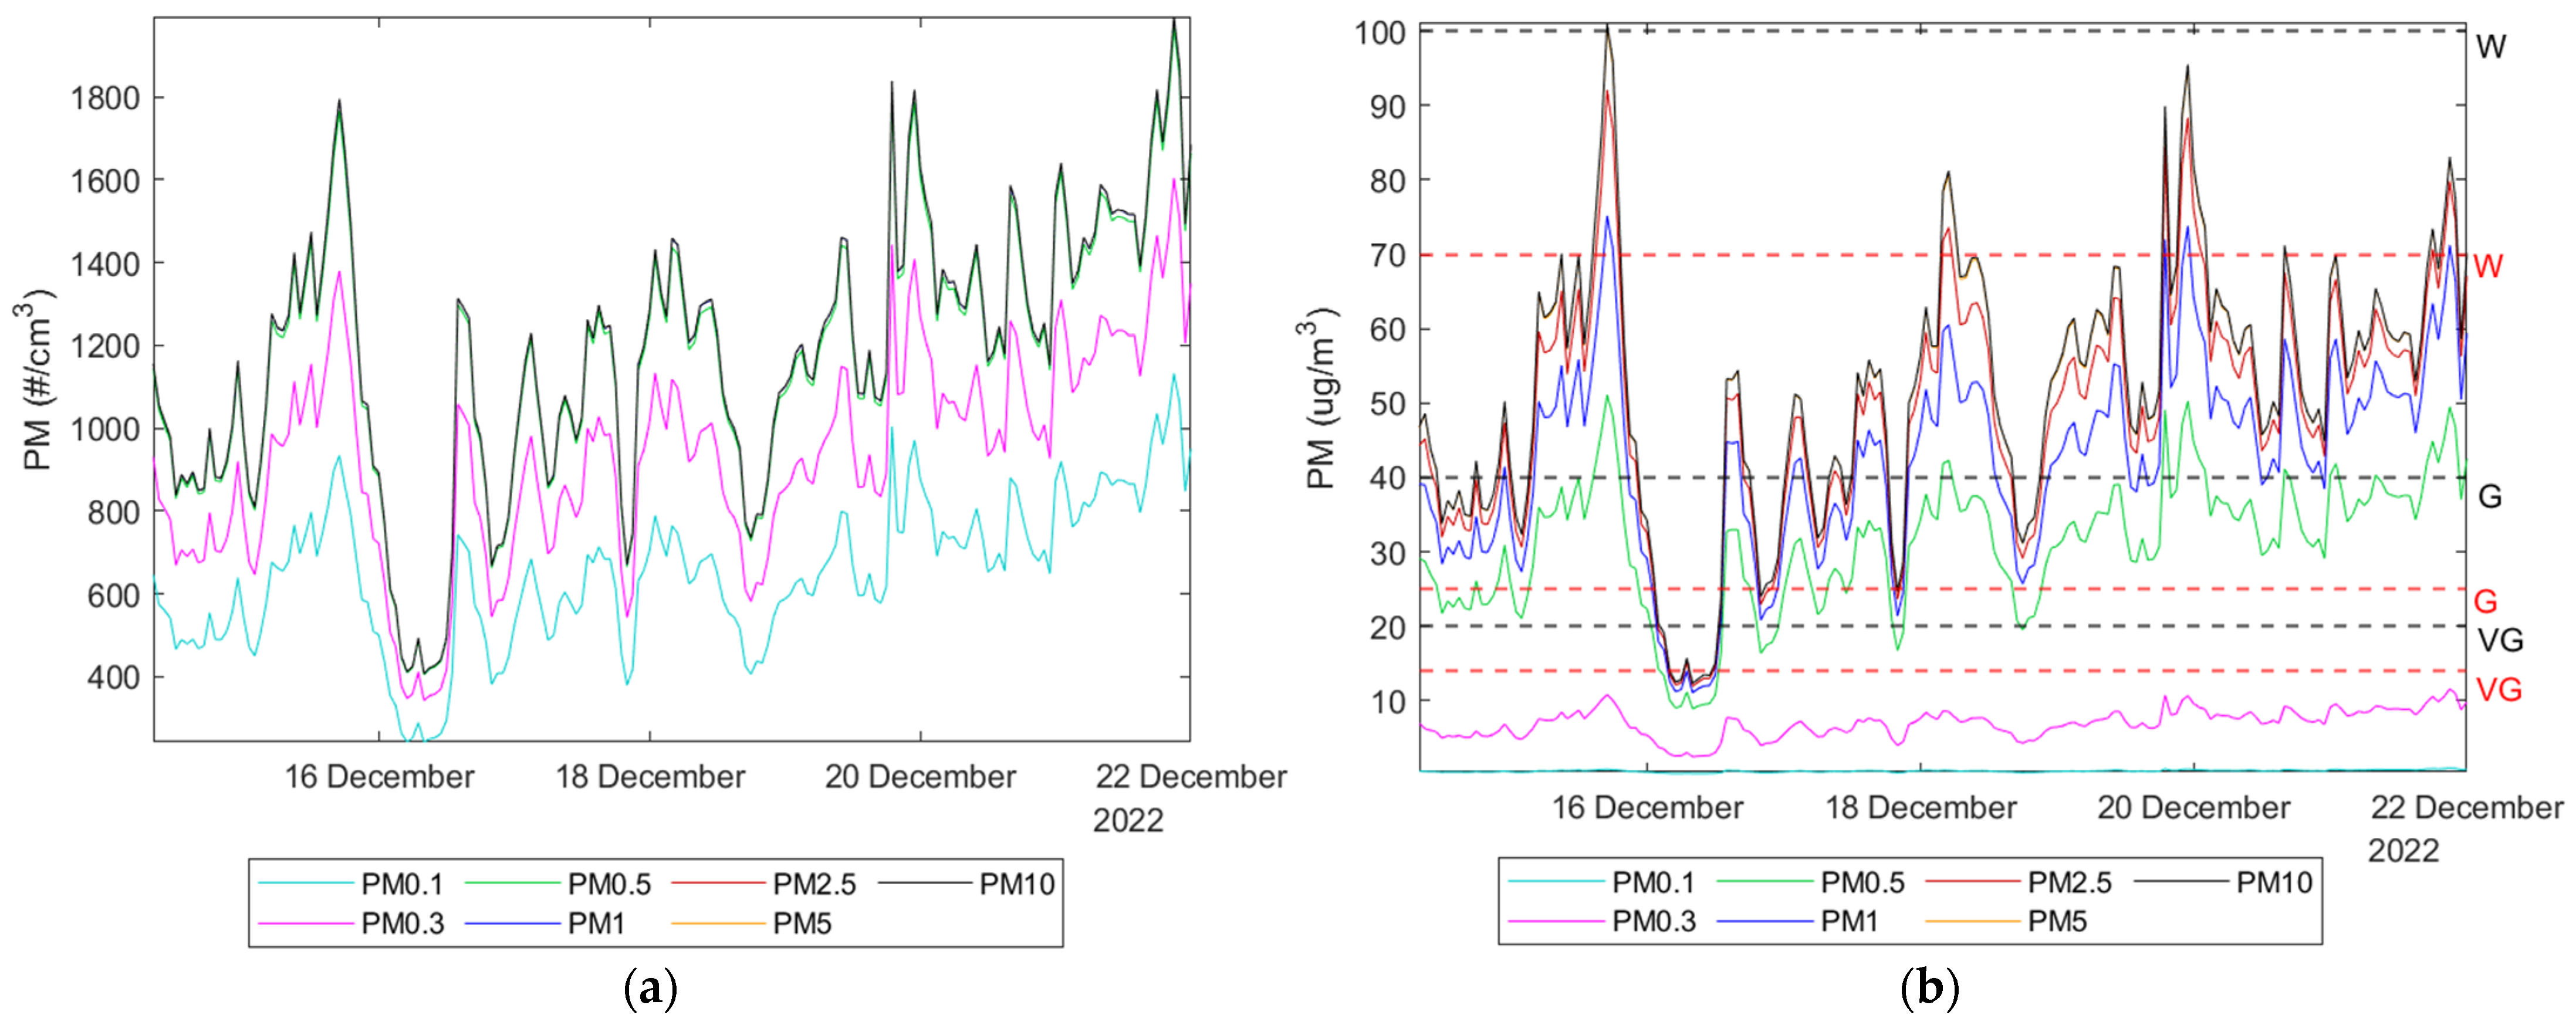
Figure 12 also provided a different view of the number concentrations and size spectrum of PM than the previous sensors SEN54 and SPS30. It shows that compared to the categories of smaller particles, there is not a significant number of particles larger than 0.5 µm in the air. To compare the results with the SPS30 and SEN54 pairs, respectively, cumulative number concentrations were calculated and plotted in Figure 13a, similar to Figure 6e.
Figure 13b shows the mass concentrations for the same period. It can be seen that while PM0.1 makes up the majority of the number concentration in Figure 13a, it is the opposite case for mass concentration. The cyan trace corresponding to the mass concentration of PM0.1 is almost impossible to see, but PM0.3 (magenta) is already distinct. What follows are green (PM0.5), blue (PM1), red (PM2.5), yellow (PM5), or black (PM10) traces in the bar graph. It is noteworthy that these are the traces with small differences from each other, as shown in Figure 14. While the PM0.3/PM0.1 ratio is distinguishable from the others (magenta), as well as green for the PM0.5/PM0.1 ratio. However, all the remaining PM1, PM2.5, PM4, and PM10/PM0.1 ratios seemingly merge in the black trace.
The fact that in terms of the mass concentration of PM, the PM0.1 in Figure 13b is very low does not mean that PM0.1 does not need to be considered. On the contrary. Measuring number concentration proves that although its mass is not significant, there is still an abundance of ultrafine particles in terms of number concentration. Considering the huge disproportion of PM0.1 or PM0.3 to other, larger—coarse particles, the measurement and research of ultrafine PM is a highly topical issue of the present time.

4. Conclusions

PM mass and number concentrations were monitored at several locations in Košice and nearby cities, towns, and villages. Most of the measurements were carried out by SPM30 and SEN54 sensors, which can only detect particles bigger than 0.3 µm. This means that these sensors are more suitable for monitoring fine particles (PM2.5) or coarse particles (PM2.5–10) rather than ultrafine particles (PM0.1). Still, because these sensors are capable of measuring PM0.5 number concentration and typical particle size, we can come to some conclusions about the smallest particles it is capable of measuring while considering their detection limit. For example, the typical particle size in the villages was smaller than in the urban areas. In cities, the typical particle size was larger. The difference was likely caused by the differing main contributors to PM in either type of environment, although exceptions can occur based on the location characteristics (such as the measuring site Košice #3).
In terms of number concentration, particles smaller than 0.5 µm (PM0.5) make up most of the particulate matter. The ratio calculated from other PM categories (e.g., PM1/PM0.5) shows that the increase in PM1 starts from 15% (Figure 6) but depending on the levels of number concentration this increase can range well into 30%. PM2.5 shows an additional increase of 0.4 to 5% (Figure 6c,d). The other PM categories (PM4 and PM10) only show a minimal additional increase. However, a large volume of larger particles (e.g., coarse particles) still significantly impacts the mass concentration of PM even at a lower level of number concentration. Still, the fact that PM0.5 were the most numerous type of particle, as well as the negative effects on human health being stronger with decreasing size of particles is a reason why there should be more focus on measuring the number concentration of particles smaller than 0.5 µm.
Similar findings result from measurements with the IPS-7100 sensor, which unlike SPS30 and SEN54 is capable of measuring PM0.3 and PM0.1 mass and number concentrations. Another advantage of this sensor is the measurement of non-cumulative number concentrations (although, it would also not be difficult to calculate non-cumulative number concentrations measured by SPS30/SEN54 after the extraction of data and during the data analysis stage). In terms of number concentration, PM0.1 is a dominating constituent of PM, along with smaller levels of number concentration of PM0.1–0.3 and PM0.3–0.5. This is a worrying fact since these particles can penetrate the bloodstream, which has strong negative health effects on human health. In terms of mass concentration, PM0.1 is an extremely small constituent in comparison to other particles of a larger size (e.g., from Figure 10a: 650 particles of PM0.1, 281 particles of PM0.3, 210 particles of PM0.5 or 12 particles of PM1 contained in the volume of 1 cm3). Therefore, we conclude that number concentration is a more suitable metric for measuring ultrafine particles, while fine particles and coarse particles are better described by their mass concentration.
Considering the PM measurements, including the ultrafine particles (UFP) component, it was found that within the number concentration, UFP makes up the main part of PM2.5 and PM10. Both PM2.5 and PM10 have established guidelines (by agencies such as WHO) and limit values for mass concentrations (in a given country). It is also possible to calculate Air Quality Index (AQI) from air pollutant mass concentrations which include PM2.5 and PM10. AQI better characterizes air pollutant mass concentrations from a public health perspective. However, such guidelines or limit values are not established for ultrafine particles, nor is there a formula for conversion from number concentration PM0.1 to its AQI sub-index. Given that the smaller the particles, the more dangerous their impact on human health, we consider it important to add PM0.1 and/or PM0.5 to the evaluation of air quality in addition to PM10, and PM2.5. Long-term monitoring of ultrafine particles and establishing guidelines for UFP would be the first step towards lowering their concentrations, which could help not only sensitive groups but also public health in general. Another thing to consider is the sources of particulate matter, namely the residential wood combustion, which is often used as an attractive alternative for household heating—now more than ever due to the current energy crisis, increasing inflation, and rising gas prices. Therefore, we find it highly relevant to focus on the research of ultrafine particles as well as the research of particulate matter in general in the future.

Author Contributions

Conceptualization, M.G.; methodology, M.G. and S.K.; software, S.K. and B.S.; validation, M.G. and S.K.; formal analysis, M.G. and S.K.; investigation, M.G. and S.K.; resources, S.K.; data curation, M.G. and S.K.; writing—original draft preparation, M.G. and S.K.; writing—review and editing, M.G., S.K. and B.S.; visualization, S.K.; supervision, M.G. and B.S. All authors have read and agreed to the published version of the manuscript.

Funding

This research received no external funding.

Institutional Review Board Statement

Not applicable.

Informed Consent Statement

Not applicable.

Data Availability Statement

The data presented in this study are available on request from the corresponding author. The data are not publicly available due to the fact that the study continues and the data is still being worked on.

Acknowledgments

The authors would like to express their gratitude to the graduate students at the Technical University of Košice, D. Bakši, and R. Bača, for their help with the visualization of measured data in Grafana.

Conflicts of Interest

The authors declare no conflict of interest.

References

  1. World Health Organization. Ambient and Outdoor Air Pollution. Key Facts. Available online: https://www.who.int/news-room/fact-sheets/detail/ambient-(outdoor)-air-quality-and-health (accessed on 30 May 2022).
  2. Kremler, M. Report on Air Quality in Slovak Republic in 2020. Available online: https://www.shmu.sk/File/oko/rocenky/2020_Air_Pollution_in_the_SR_v1.pdf (accessed on 27 December 2022).
  3. World Health Organization. WHO Global Air Quality Guidelines; World Health Organization: Geneva, Switzerland, 2021; Available online: https://apps.who.int/iris/bitstream/handle/10665/345329/9789240034228-eng.pdf (accessed on 27 December 2022).
  4. Hester, R.E. Airborne Particulate Matter: Sources, Atmospheric Processes and Health; Royal Society of Chemistry: Cambridge, UK, 2016; ISBN 978-1-78262-491-2. [Google Scholar]
  5. Bell, M.L.; HEI Health Review Committee. Assessment of the Health Impacts of Particulate Matter Characteristics. Res. Rep. Health. Eff. Inst. 2012, 161, 5–38. Available online: https://www.healtheffects.org/system/files/Bell-161.pdf (accessed on 30 May 2022).
  6. Lippmann, M. Toxicological and Epidemiological Studies of Cardiovascular Effects of Ambient Air Fine Particulate Matter (PM2.5) and Its Chemical Components: Coherence and Public Health Implications. Crit. Rev. Toxicol. 2014, 44, 299–347. [Google Scholar] [CrossRef]
  7. Adams, K.; Greenbaum, D.S.; Shaikh, R.; van Erp, A.M.; Russell, A.G. Particulate Matter Components, Sources, and Health: Systematic Approaches to Testing Effects. J. Air Waste Manag. Assoc. 2015, 65, 544–558. [Google Scholar] [CrossRef] [PubMed]
  8. Kampa, M.; Castanas, E. Human Health Effects of Air Pollution. Environ. Pollut. 2008, 151, 362–367. [Google Scholar] [CrossRef] [PubMed]
  9. Brook, R.D. Cardiovascular Effects of Air Pollution. Clin. Sci. 2008, 115, 175–187. [Google Scholar] [CrossRef]
  10. Bourdrel, T.; Bind, M.A.; Béjot, Y.; Morel, O.; Argacha, J.F. Cardiovascular Effects of Air Pollution. Arch. Cardiovasc. Dis. 2017, 110, 634–642. [Google Scholar] [CrossRef] [PubMed]
  11. Jo, E.J.; Lee, W.S.; Jo, H.Y.; Kim, C.H.; Eom, J.S.; Mok, J.H.; Kim, M.H.; Lee, K.; Kim, K.U.; Lee, M.K.; et al. Effects of Particulate Matter on Respiratory Disease and the Impact of Meteorological Factors in Busan, Korea. Respir. Med. 2017, 124, 79–87. [Google Scholar] [CrossRef]
  12. Pope, C.A.; Ezzati, M.; Dockery, D.W. Fine-Particulate Air Pollution and Life Expectancy in the United States. N. Engl. J. Med. 2009, 360, 376–386. [Google Scholar] [CrossRef]
  13. Gehring, U.; Gruzieva, O.; Agius, R.M.; Beelen, R.; Custovic, A.; Cyrys, J.; Eeftens, M.; Flexeder, C.; Fuertes, E.; Heinrich, J.; et al. Air Pollution Exposure and Lung Function in Children: The ESCAPE Project. Environ. Health Perspect. 2013, 121, 1357–1364. [Google Scholar] [CrossRef]
  14. Zhang, Y.; He, M.; Wu, S.; Zhu, Y.; Wang, S.; Shima, M.; Tamura, K.; Ma, L. Short-Term Effects of Fine Particulate Matter and Temperature on Lung Function among Healthy College Students in Wuhan, China. Int. J. Environ. Res. Public Health 2015, 12, 7777–7793. [Google Scholar] [CrossRef]
  15. Omori, T.; Fujimoto, G.; Yoshimura, I.; Nitta, H.; Ono, M. Effects of Particulate Matter on Daily Mortality in 13 Japanese Cities. J. Epidemiol. 2003, 13, 314–322. [Google Scholar] [CrossRef] [PubMed] [Green Version]
  16. Mühlfeld, C.; Rothen-Rutishauser, B.; Blank, F.; Vanhecke, D.; Ochs, M.; Gehr, P. Interactions of Nanoparticles with Pulmonary Structures and Cellular Responses. Am. J. Physiol.-Lung Cell. Mol. Physiol. 2008, 294, L817–L829. [Google Scholar] [CrossRef] [PubMed]
  17. Schraufnagel, D.E. The Health Effects of Ultrafine Particles. Exp. Mol. Med. 2020, 52, 311–317. [Google Scholar] [CrossRef]
  18. Kwoon, H.; Ryu, M.; Carlsten, C. Ultrafine particles: Unique physiochemical properties relevant to health and disease. Exp. Mol. Med. 2020, 52, 318–328. [Google Scholar] [CrossRef]
  19. Götschi, T.; Heinrich, J.; Sunyer, J.; Künzli, N. Long-Term Effects of Ambient Air Pollution on Lung Function: A Review. Epidemiology 2008, 19, 690–701. [Google Scholar] [CrossRef]
  20. Kyung, S.Y.; Jeong, S.H. Particulate-Matter Related Respiratory Diseases. Tuberc. Respir. Dis. 2020, 83, 116–121. [Google Scholar] [CrossRef]
  21. Slovak Hydrometeorologic Institute. Limit Values Eval. Air Qual. Available online: https://www.shmu.sk/sk/?page=1&id=oko_kriteria (accessed on 23 January 2023).
  22. Kim, M.J. Changes in the Relationship between Particulate Matter and Surface Temperature in Seoul from 2002–2017. Atmosphere 2019, 10, 238. [Google Scholar] [CrossRef]
  23. New Zealand Government. Natural Sources of Particulate Matter. Available online: https://www.stats.govt.nz/indicators/natural-sources-of-particulate-matter/ (accessed on 18 October 2022).
  24. Suleiman, A.; Tight, M.R.; Quinn, A.D. Assessment and Prediction of the Impact of Road Transport on Ambient Concentrations of Particulate Matter PM10. Transp. Res. Part D Transp. Environ. 2016, 49, 301–312. [Google Scholar] [CrossRef]
  25. Chafe, Z.; Brauer, M.; Héroux, M.E.; Klimont, Z.; Lanki, T.; Salonen, R.O.; Smith, K.R. Residential Heating with Wood and Coal: Health Impacts and Policy Options in Europe and North America; World Health Organization: Geneva, Switzerland, 2015; Available online: https://apps.who.int/iris/handle/10665/153671 (accessed on 18 January 2023).
  26. California Air Resources Board. Inhalable Particulate Matter and Health (PM2.5 and PM10). Available online: https://ww2.arb.ca.gov/resources/inhalable-particulate-matter-and-health (accessed on 31 January 2023).
  27. Ministry of Agriculture, Hungary. PM10 Reduction Programme-Resources and Factions. Available online: https://pm10.kormany.hu/forrasok (accessed on 31 January 2023).
  28. Air Quality Expert Group. Ultrafine Particles (UFP) in the UK, 2018. Available online: https://uk-air.defra.gov.uk/assets/documents/reports/cat09/1807261113_180703_UFP_Report_FINAL_for_publication.pdf (accessed on 31 January 2023).
  29. Moreno-Ríos, A.L.; Tejeda-Benítez, L.P.; Bustillo-Lecompte, C.F. Sources, Characteristics, Toxicity, and Control of Ultrafine Particles: An Overview. Geosci. Front. 2022, 13, 101147. [Google Scholar] [CrossRef]
  30. Shah, R.U.; Padilla, L.E.; Peters, D.R.; Dupuy-Todd, M.; Fonseca, E.R.; Ma, G.Q.; Popoola, O.A.; Jones, R.L.; Mills, J.; Martin, N.A.; et al. Identifying Patterns and Sources of Fine and Ultrafine Particulate Matter in London Using Mobile Measurements of Lung-Deposited Surface Area. Environ. Sci. Technol. 2023, 57, 96–108. [Google Scholar] [CrossRef]
  31. Arano-Martinez, J.A.; Martínez-González, C.L.; Salazar, M.I.; Torres-Torres, C. A Framework for Biosensors Assisted by Multiphoton Effects and Machine Learning. Biosensors 2022, 12, 710. [Google Scholar] [CrossRef]
  32. Tongprasert, P.; Ongsomwang, S. A Suitable Model for Spatiotemporal Particulate Matter Concentration Prediction in Rural and Urban Landscapes, Thailand. Atmosphere 2022, 13, 904. [Google Scholar] [CrossRef]
  33. Diviacco, P.; Iurcev, M.; Carbajales, R.J.; Potleca, N. First Results of the Application of a Citizen Science-Based Mobile Monitoring System to the Study of Household Heating Emissions. Atmosphere 2022, 13, 1689. [Google Scholar] [CrossRef]
  34. Kliengchuay, W.; Meeyai, A.C.; Worakhunpiset, S.; Tantrakarnapa, K. Relationships between Meteorological Parameters and Particulate Matter in Mae Hong Son Province, Thailand. Int. J. Environ. Res. Public Health 2018, 15, 2801. [Google Scholar] [CrossRef] [PubMed]
  35. Aldegunde, J.A.Á.; Sánchez, A.F.; Saba, M.; Bolaños, E.Q.; Palenque, J.Ú. Analysis of PM2.5 and Meteorological Variables Using Enhanced Geospatial Techniques in Developing Countries: A Case Study of Cartagena de Indias City (Colombia). Atmosphere 2022, 13, 506. [Google Scholar] [CrossRef]
  36. Li, C.; Huang, Y.; Guo, H.; Wu, G.; Wang, Y.; Li, W.; Cui, L. The Concentrations and Removal Effects of PM10 and PM2.5 on a Wetland in Beijing. Sustainability 2019, 11, 1312. [Google Scholar] [CrossRef]
  37. Wang, J.; Ogawa, S. Effects of Meteorological Conditions on PM2.5 Concentrations in Nagasaki, Japan. Int. J. Environ. Res. Public Health 2015, 12, 9089–9101. [Google Scholar] [CrossRef]
  38. Sirithian, D.; Thanatrakolsri, P. Relationships between Meteorological and Particulate Matter Concentrations (PM2.5 and PM10) during the Haze Period in Urban and Rural Areas, Northern Thailand. Air Soil Water Res. 2022, 15, 11786221221117264. [Google Scholar] [CrossRef]
  39. Luo, H.; Zhou, W.; Jiskani, I.M.; Wang, Z. Analyzing Characteristics of Particulate Matter Pollution in Open-Pit Coal Mines: Implications for Green Mining. Energies 2021, 14, 2680. [Google Scholar] [CrossRef]
  40. Tai, A.P.K.; Mickley, L.J.; Jacob, D.J. Correlations between Fine Particulate Matter (PM2.5) and Meteorological Variables in the United States: Implications for the Sensitivity of PM2.5 to Climate Change. Atmos. Environ. 2010, 44, 3976–3984. [Google Scholar] [CrossRef]
  41. Yang, H.; Peng, Q.; Zhou, J.; Song, G.; Gong, X. The Unidirectional Causality Influence of Factors on PM2.5 in Shenyang City of China. Sci. Rep. 2020, 10, 8403. [Google Scholar] [CrossRef]
  42. Hernandez, G.; Berry, T.-A.; Wallis, S.L.; Poyner, D. Temperature and Humidity Effects on Particulate Matter Concentrations in a Sub-Tropical Climate During Winte. Int. Proc. Chem. Biol. Environ. Eng. 2017, 32, 57–64. [Google Scholar] [CrossRef]
  43. Jiang, B.; Sun, C.; Mu, S.; Zhao, Z.; Chen, Y.; Lin, Y.; Qiu, L.; Gao, T. Differences in Airborne Particulate Matter Concentration in Urban Green Spaces with Different Spatial Structures in Xi’an, China. Forests 2022, 13, 14. [Google Scholar] [CrossRef]
  44. Liu, Y.; Zhou, Y.; Lu, J. Exploring the Relationship between Air Pollution and Meteorological Conditions in China under Environmental Governance. Sci. Rep. 2020, 10, 14518. [Google Scholar] [CrossRef] [PubMed]
  45. Štrbová, K.; Raclavská, H.; Bílek, J. Impact of Fugitive Sources and Meteorological Parameters on Vertical Distribution of Particulate Matter over the Industrial Agglomeration. J. Environ. Manag. 2017, 203, 1190–1198. [Google Scholar] [CrossRef] [PubMed]
  46. Kirešová, S.; Guzan, M.; Galajda, P. Measuring Particulate Matter (PM) Using SPS30. In 32nd International Conference Radioelektronika; IEEE: Košice, Slovakia, 2022; pp. 160–165. [Google Scholar] [CrossRef]
  47. Kirešová, S.; Guzan, M. Determining the Correlation between Particulate Matter PM10 and Meteorological Factors. Eng 2022, 3, 343–363. [Google Scholar] [CrossRef]
  48. Sensirion. Particulate Matter Sensor for Air Quality Monitoring and Control. Datasheet SPS30. Available online: https://cdn.sos.sk/productdata/98/89/92718144/sps30-2.pdf (accessed on 30 May 2022).
  49. Sensirion. Environmental Sensor Node for HVAC and Air Quality Applications, SEN5x Datasheet. Available online: https://cdn.sparkfun.com/assets/5/b/f/2/8/Sensirion_Datasheet_SEN5x.pdf (accessed on 30 May 2022).
  50. Piera Systems. IPS Series Sensor 305/3100/525/5100/7100: Photon Counting Intelligent Particle Sensor for Accurate Air Quality Monitoring. Available online: https://www.farnell.com/datasheets/3749927.pdf (accessed on 22 December 2022).
  51. Amaral, S.S.; de Carvalho, J.A.; Costa, M.A.M.; Pinheiro, C. An Overview of Particulate Matter Measurement Instruments. Atmosphere 2015, 6, 1327–1345. [Google Scholar] [CrossRef]
  52. Lowther, S.D.; Jones, K.C.; Wang, X.; Whyatt, J.D.; Wild, O.; Booker, D. Particulate Matter Measurement Indoors: A Review of Metrics, Sensors, Needs, and Applications. Environ. Sci. Technol. 2019, 53, 11644–11656. [Google Scholar] [CrossRef] [PubMed]
  53. Kirešová, S.; Guzan, M. Measurement of Particulate Matter: Principles and Options of Measurement at Present. Acta Electrotech. Et Inform. 2022, 22, 8–18. [Google Scholar] [CrossRef]
  54. Slovak Hydrometeorological Institute. Monthly Reports. Available online: https://www.shmu.sk/sk/?page=1&id=oko_mes_s (accessed on 1 February 2023).
  55. Slovak Hydrometeorological Institute. Report on Air Quality in Slovak Republic in 2021: Appendix A-Measuring Stations of Air Quality Monitoring Networks–2021. Available online: https://www.shmu.sk/File/oko/rocenky/2021_Priloha_A.pdf (accessed on 1 February 2023).
  56. Slovak Hydrometeorological Institute. Average Daily Concentrations of Pollutants in October 2022. Available online: https://www.shmu.sk/File/oko/mesacne_spravy/10_2022_mesacne_hlasenie_v1.pdf (accessed on 1 February 2023).
  57. Slovak Hydrometeorological Institute. Average Daily Concentrations of Pollutants in November 2022. Available online: https://www.shmu.sk/File/oko/mesacne_spravy/11_2022_mesacne_hlasenie.pdf (accessed on 1 February 2023).
  58. Slovak Hydrometeorological Institute. Average Daily Concentrations of Pollutants in December 2022. Available online: https://www.shmu.sk/File/oko/mesacne_spravy/12_2022_mesacne_hlasenie.pdf (accessed on 1 February 2023).
  59. Slovak Hydrometeorological Institute. Average Daily Concentrations of Pollutants in February 2022. Available online: https://www.shmu.sk/File/oko/mesacne_spravy/02_2022_mesacne_hlasenie.pdf (accessed on 1 February 2023).
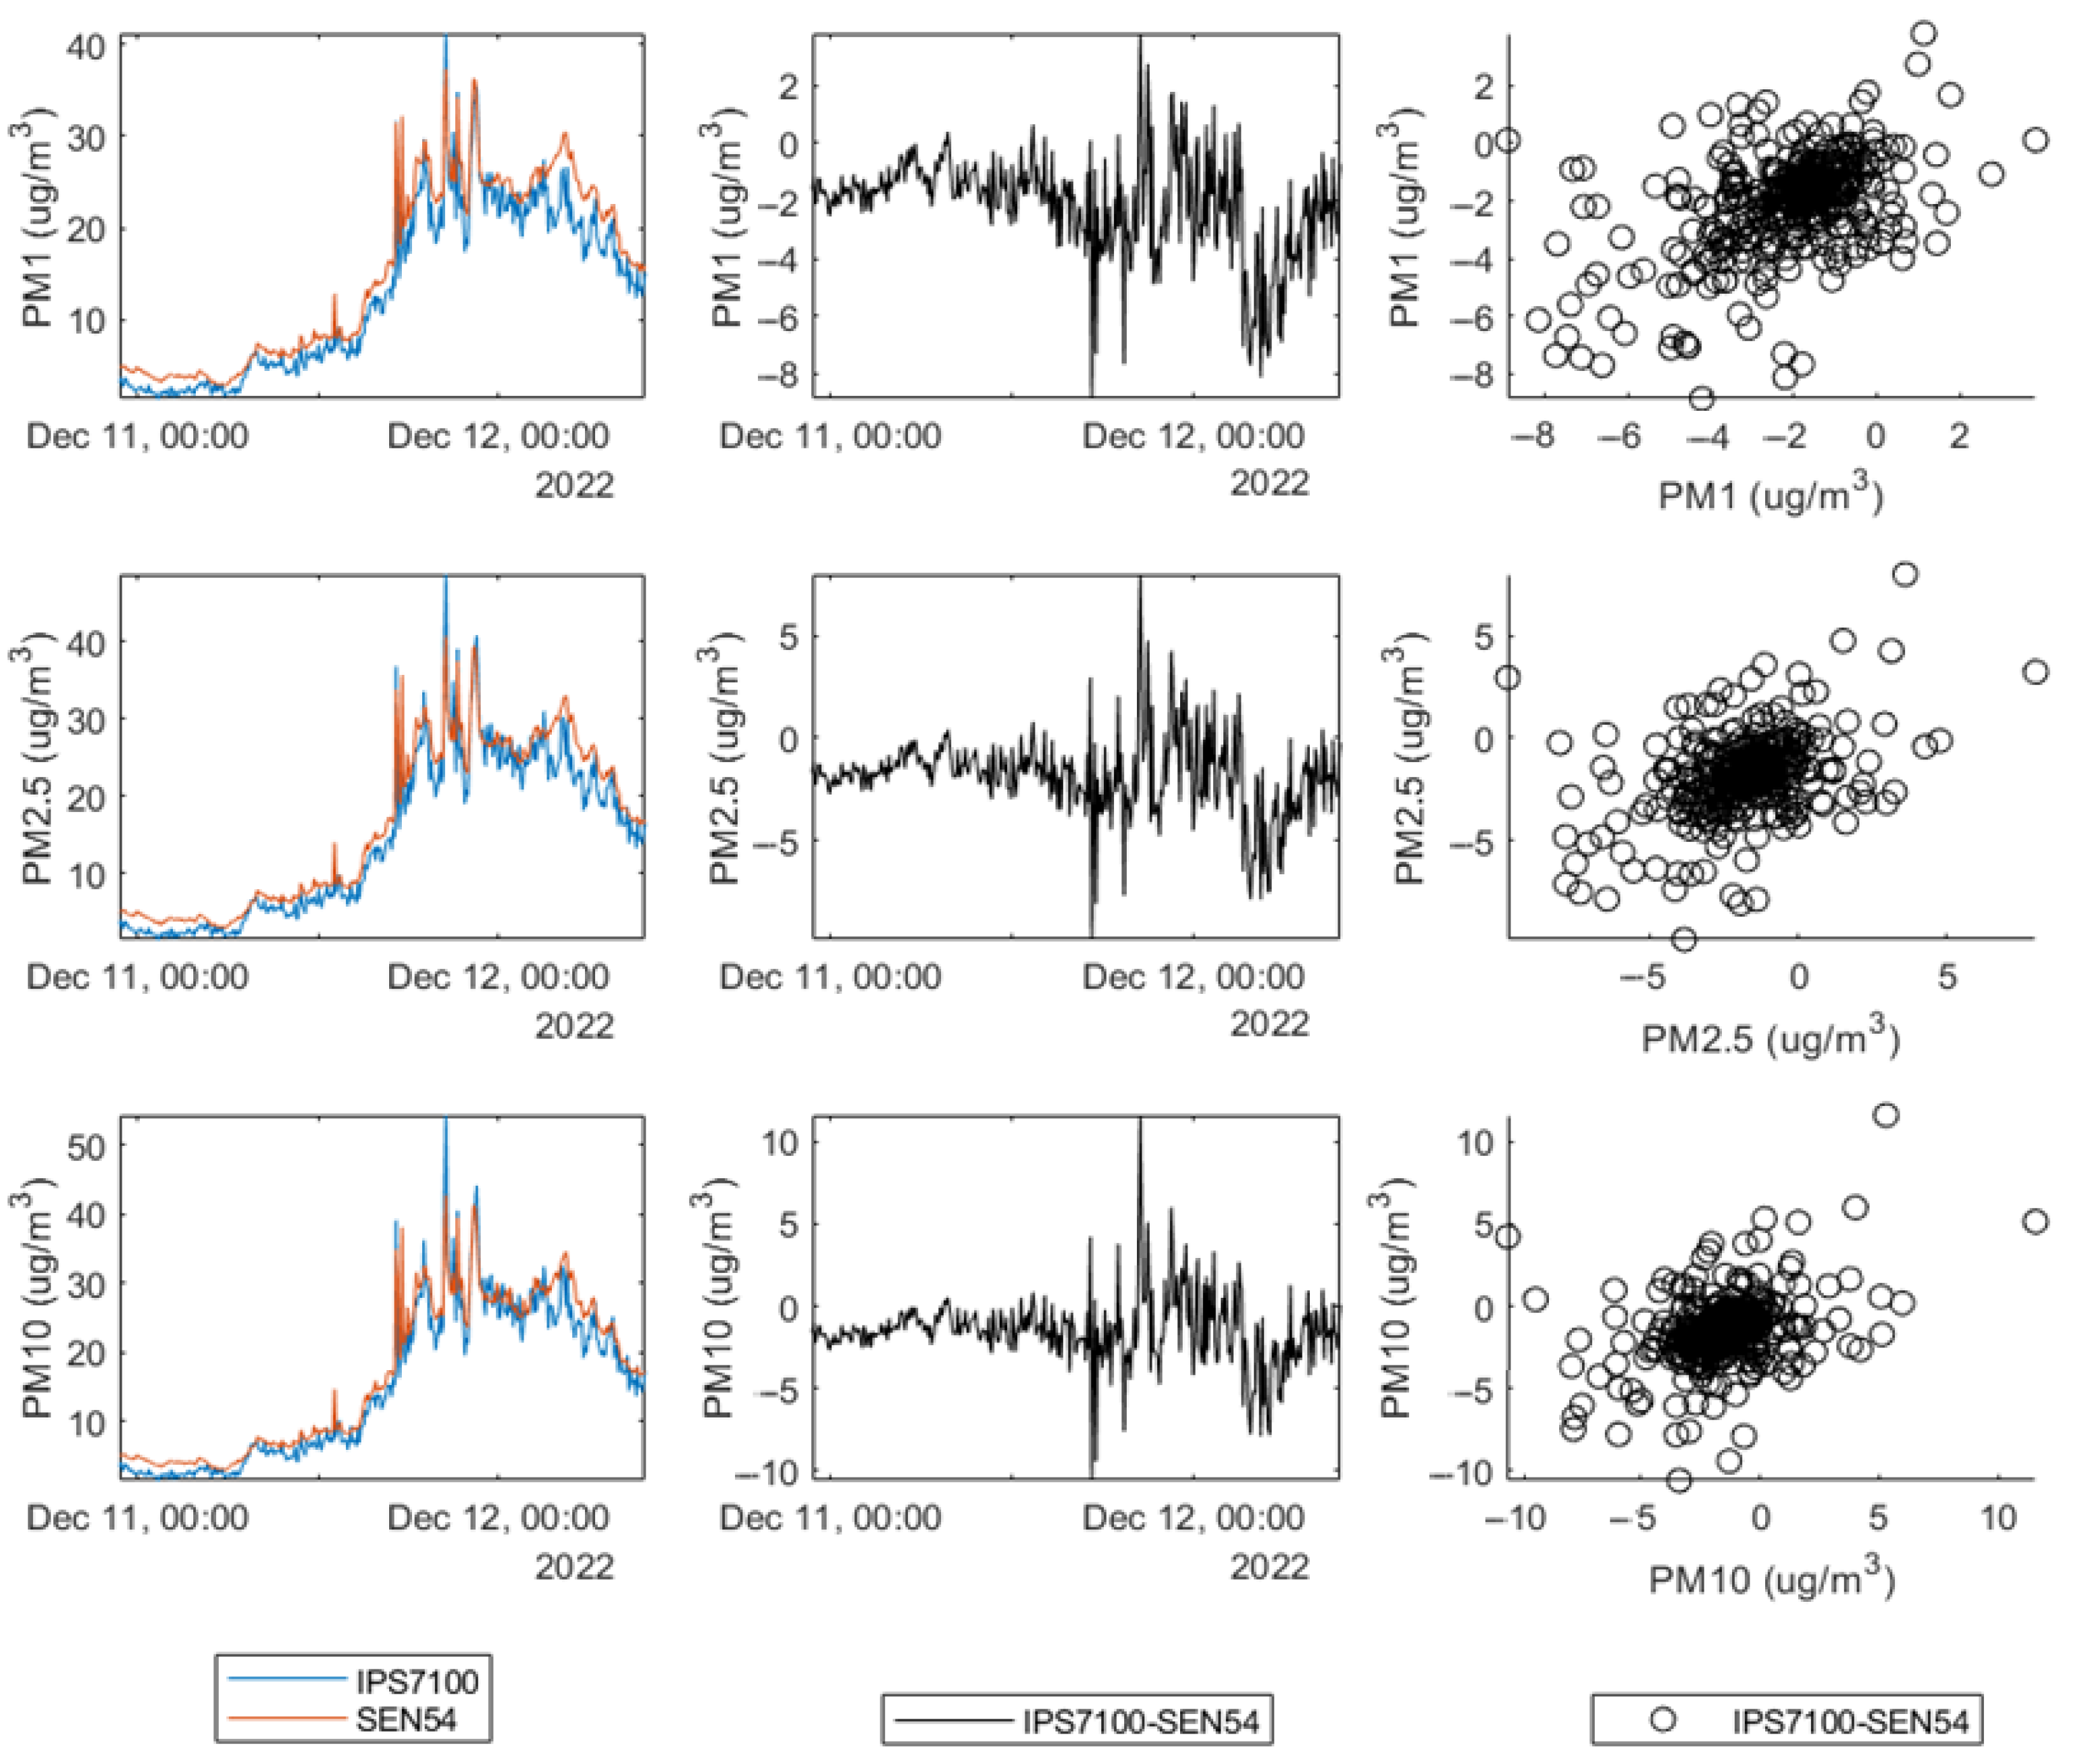
Figure 1. Comparison measurements for SEN54 sensors: mass concentration (first column) of PM1 (first row), PM2.5 (second row), and PM10 (third row) measured by IPS-7100 (blue) and SEN54 (red), the difference between the measurements (second column) and the scatter plot (third column), where the measurements are plotted on both x and y axes, while the y axis is shifted by one row relative to the x-axis.
Atmosphere 14 00324 g001
Figure 2. Daily averages of PM10 mass concentration at DTIEE (red bars) and Štefánikova, Košice (blue bars) measured from 22 October 2022 to 31 December 2022.
Atmosphere 14 00324 g002
Figure 3. Daily averages of PM2.5 mass concentration at DTIEE (red bars) and Štefánikova, Košice (blue bars) measured from 22 October 2022 to 31 December 2022.
Atmosphere 14 00324 g003
Figure 4. Block diagram of the PM measurement systems used for (ac) urban and rural measurements.
Atmosphere 14 00324 g004
Figure 5. Urban and rural measurement places marked on a map of: (a) Slovakia; (b) eastern Slovakia (close-up).
Atmosphere 14 00324 g005
Figure 6. Sample of measured PM at DTIEE 4 March 2022 from 0:00 to 12:00 a.m.: (a) mass concentration of PM1 (blue), PM2.5 (red), PM4 (yellow), and PM10 (black), (b) detail from Figure 6a, (c) hourly averages of PM mass concentrations, where dashed lines correspond to the upper limits of very good (VG), good (G) or worsened (W) air quality for hourly mass concentrations of PM2.5 (red dashed line) and PM10 (black dashed line), where PM1, PM2.5 and PM4 are very close to PM10, (d) typical particle size, (e) number concentration of PM0.5 (green), PM1 (blue), PM2.5 (red), PM4 (yellow) and PM10 (black), (f) detail (det B) from (e), where PM0.5 (green) is not included in the figure due to the close up.
Atmosphere 14 00324 g006aAtmosphere 14 00324 g006b
Figure 7. Illustration of the changes in the ratios of PM1, PM2.5, PM4, and PM10 vs. NC PM0.5 of the measured PM number concentrations at DTIEE 4 March 2022 from 0:00 to 12:00 h for: (a) 5 s intervals, (b) close-up detail (det A) from subfigure (a), (c) close-up detail (det B) from subfigure (b), (d) 5 s intervals from 2–9 March 2022, and hourly averages (e) over the 12 h of measurement, (f) over several days of measurement (from 2–9 March 2022).
Atmosphere 14 00324 g007
Figure 8. Examples of changes in the ratios of PM1, PM2.5, PM4, PM10 vs. PM0.5 number concentrations measured at: (a) DTIEE (Košice), (b) Füzérkomlós village, (c) Snina town, (d) Habura village, (e) Košice town (measurement site #2) (f) DTIEE—time slice selected for the same interval as Habura in (d).
Atmosphere 14 00324 g008aAtmosphere 14 00324 g008b
Figure 9. Changes in the mass concentration of PM over two days from 30 January 2022 (00:00 a.m.) to 31 January 2022 (11:59 p.m.)—bar graphs of hourly averages of PM1, PM2.5, PM4, and PM10 at (a) Habura and (b) DTIEE, where dashed lines correspond to the upper limits of very good (VG) or good (G) air quality for hourly mass concentrations of PM2.5 (red dashed line) and PM10 (black dashed line); measured values of PM1, PM2.5, PM4, and PM10 at (c) Habura and (d) DTIEE.
Atmosphere 14 00324 g009
Figure 10. Changes in typical particle size in different locations: Habura, Košice #1 (DTIEE), Košice #2, Košice #3, Prešov, Valaliky, Zdoba, Füzérkomlós from 2 October 2022 to 31 December 2022.
Atmosphere 14 00324 g010
Figure 11. Box plot showing typical particle size in different locations: Habura, Košice #1 (DTIEE), Košice #2, Košice #3, Prešov, Valaliky, Zdoba, Füzérkomlós. The blue boxes contain values within the 25th to 75th percentile, the median is marked with a red horizontal line across the box, the dashed black vertical lines contain all data points not considered outliers, and the outliers are marked with a red plus sign (+).
Atmosphere 14 00324 g011
Figure 12. Non-cumulative number concentrations of PM measured by IPS-7100: (a) hourly averages of PM0.1 (cyan), PM0.1–0.3 (magenta), PM0.3–0.5 (green), PM0.5–1 (blue), PM1–2.5 (red), PM2.5–5 (yellow), PM5–10 (black) and the (bd) close-ups for better illustrations of all categories.
Atmosphere 14 00324 g012
Figure 13. Hourly averages of (a) cumulative number concentrations of PM0.1 (cyan), PM0.3 (magenta), PM0.5 (green), PM1 (blue), PM2.5 (red), PM5 (yellow), PM10 (black) and (b) mass concentrations of PM, where dashed lines correspond to the upper limits of very good (VG), good (G), or worsened (W) air quality for hourly mass concentrations of PM2.5 (red dashed line) and PM10 (black dashed line).
Atmosphere 14 00324 g013
Figure 14. The ratios of PM number concentration averages—PM0.3 to PM10/PM0.1. PM1/PM0.1 (blue), PM2.5/PM0.1 (red) and PM5/PM10 (yellow) ratios are so close to PM10/PM0.1 (black) that the lines appear identical.
Atmosphere 14 00324 g014
Table 1. Accuracy of SPS30 sensor.
Mass ConcentrationConditionsAccuracy
PM1, PM2.50–100 µg/m3±10 µg/m3
100–1000 µg/m3±10%
PM4, PM100–100 µg/m3±25 µg/m3
100–1000 µg/m3±25%
Table 2. Accuracy of SEN54 sensor.
Mass ConcentrationConditionsAccuracy
PM1, PM2.50–100 µg/m3±(5 µg/m3 + 5%)
100–1000 µg/m3±10%
PM4, PM100–100 µg/m3±25 µg/m3
100–1000 µg/m3±25%
Table 3. Typical particle size by measuring site: interquartile range, median, minimum, and maximum.
Measuring SiteInterquartile Range (µm)Median (µm)Min. (µm)Max. (µm)
Habura0.50–0.550.530.430.72
Košice #1 DTIEE0.55–0.620.580.440.72
Košice #20.51–0.620.560.440.92
Košice #30.43–0.470.440.390.59
Prešov0.59–0.670.630.470.82
Valaliky0.48–0.520.500.420.65
Zdoba0.45–0.490.470.400.59
Füzérkomlós0.42–0.460.440.370.70
Disclaimer/Publisher’s Note: The statements, opinions and data contained in all publications are solely those of the individual author(s) and contributor(s) and not of MDPI and/or the editor(s). MDPI and/or the editor(s) disclaim responsibility for any injury to people or property resulting from any ideas, methods, instructions or products referred to in the content.