Article

Features of Multiannual Air Temperature Variability in Poland (1951–2021)

Institute of Meteorology and Water Management–National Research Institute, Podleśna 61, 01-673 Warszawa, Poland
*
Author to whom correspondence should be addressed.
Atmosphere 2023, 14(2), 282; https://doi.org/10.3390/atmos14020282
Submission received: 20 December 2022 / Revised: 23 January 2023 / Accepted: 27 January 2023 / Published: 31 January 2023
(This article belongs to the Special Issue Problems of Meteorological Measurements and Studies)

Abstract

:
Over the last 71 years, the air temperature in Poland has increased on average by 0.28 °C per decade—which gives a total change in this period exceeding 2 °C. The subject of this study was an analysis of the long-term variability of the Polish climate in terms of thermal characteristics. The aim of the research was to verify the hypothesis on the lack of homogeneity of this change and to identify points of significant acceleration of the observed tendencies. The analysis utilized the average monthly air temperature at selected synoptic stations in Poland over the period 1951–2021. The values were then processed into a reference series using Alexandersson’s method, which provided synthetic information on the variability in thermal conditions in the country. The analyses were carried out on an annual and seasonal basis. The values of the trend coefficients (and their statistical significance) were also calculated in shorter periods (minimum 30 years), which enabled determination of the stability of the observed changes’ tendencies. In addition to the analysis of the basic characteristics, non-parametric tests (Wilcoxon, Kruskal–Wallis) were used to verify shifts between decades. The annual and seasonal analyses showed the existence of sub-periods with different directions and scales of the observed tendencies. Additionally, statistically significant changes in decadal characteristics were noted, e.g., in the decades 2001–2010 and 2011–2020 in the case of annual temperature, and 1961–1970 and 1971–1980 in the case of the winter season.

1. Introduction

The variability in thermal conditions is a dominant manifestation of observed climate change on a global scale. On a regional scale, the pace of these changes tends to be much faster than on the general scale. The situation in the Arctic may serve as a particular case here, as well as in Europe. Temperatures in Europe have increased at more than twice the global average pace over the past 30 years—the highest of any continent in the world [1]. Poland has also observed increasing tendencies in average annual and seasonal air temperature. Ustrnul et al. [2] indicated that this trend is highly statistically significant and has been observed throughout the country, in all seasons, with spring showing the highest temperature rise (highest values exceeding 0.3 °C/10 years). These trends were observed irrespective of the length of the period considered, although it is the result of a significant increase in air temperature in the last three decades. Additionally, KLIMAT project’s results [3,4] show good concordance of the thermal characteristic variability in Poland with the global variability; the annual average temperature change for Poland exceeded 0.20 °C per decade and it is even higher in winter and spring (over 0.35 °C per decade for period 1951–2008). In a smaller spatial scale, BACC Author Team studied and identified a significant increase in surface air temperature in the Baltic Sea region during 1871–2004 [5,6]. Rather than showing a steady increase, however, temperature showed large multi-decadal variations dividing the twentieth century into three main phases: warming until the 1930s, followed by cooling until the 1960s, and then another distinct period of warming during the final decades of the analyzed period. The signal of climate change strongly varies seasonally, with the highest increase in air temperature observed in wintertime [7]. It results in decreasing tendency of annual amplitude [8] which makes the climate of Poland more maritime, in accordance with the growing intensity of the NAO index [9]. Additionally, an increasing trend in heatwave frequency and their intensity has been observed in Poland. The development of strong heatwaves in Poland is related to large-scale atmospheric circulation features of regional origin [10]. Moreover, the spatial and temporal variability of large inter-diurnal temperature changes in Poland indicates the local conditions as well as the atmospheric circulation impact [11]. Ustrnul [12] confirmed a significantly larger influence of atmospheric circulation on the occurrence of extreme temperatures than other local factors.
This study analyzed the long-term variability of thermal conditions in Poland (based on annual and seasonal values of the area average air temperature), with particular attention paid to the analysis of variability in shorter time scales. A decadal approach was used, and in the case of trend analysis, the values of the directional coefficients were calculated for all data series (at least 30 years long, up to a maximum of 71 years, covering the whole multiannual period 1951–2021). Such a detailed approach may serve as an insight into shorter temporal features of temperature variability, enabling the identification of periods that provide the most impetus into the long-term temperature changes observed. Additionally, the analysis provided insight into the stability of observed changes. Trends were verified for statistical significance using the non-parametric Mann–Kendall test.

2. Materials and Methods

2.1. Study Area and Data Source

This study used data from 58 synoptic (including representative) stations of the Institute of Meteorology and Water Management, National Research Institute (IMGW-PIB) (Figure 1), evenly distributed over the territory of Poland. There were minor variations in the number of stations over the analysis period. Those cases have been accounted for in Alexandersson’s equation weights. The data originated from the IMGW-PIB public database (https://danepubliczne.imgw.pl/, accessed on 15 June 2022).
Monthly average air temperature series were verified for homogeneity for every year, season (winter: DJF, spring: MAM, summer: JJA, autumn: SON), and month of analyzed period (1951–2021). They were obtained from the IMGW-PIB historical database.

2.2. Methods

Time series of air temperature variability were subsequently used to calculate area average air temperature in Poland with the application of Alexandersson’s method [13,14]. This approach is used by IMGW-PIB in climate change monitoring. The results are published in monthly Bulletins of Climate of Poland Monitoring [15]. Subsequently, the variability in air temperature was analyzed for the whole 71-year period via trend coefficient calculations for annual and seasonal series, providing an insight into the overall recorded variability. Additionally, it was amended with basic statistical characteristics: averages, maximum and minimum values, in addition to quantiles (5%, 95%) to refer to overall variability and extremes.
Statistical characteristics were subsequently accompanied by the trend analysis in shorter periods, providing all possible combinations of series start (from 1951) and lengths (no less than 30 years). This resulted in a calculation of over 900 trend coefficients which were then tested for significance with Mann–Kendall tests. The analysis concluded with the application of nonparametric tests, enabling the recognition of statistically significant differences, both overall and between decades. R software served as a platform for all performed calculations [16].
Area-averaged air temperature [Ti] was computed as a weighted value, calculated on the basis of the distance of selected stations in relation to the central point located in Poland. This utilized the Alexandersson formula [13], enabling the calculation of index temperature series using following equation:
T i a r e a = j = 1 k w j T i j j = 1 k w j
where Tij is the annual/seasonal/monthly average air temperature on station j in time i, k is the number of stations in a region, and wj is the weight coefficient for station j, defined by Alexandersson [13] as:
w j = e x p d L j
where Lj is the distance (in km) of station j from the geometrical center of a region, d = 0.001 km−1.
The above approach allowed the calculation of the area-averaged temperature series for Poland for the period 1951–2021, which was subsequently analyzed. The set of calculated characteristics of average monthly air temperature variability comprised averages, quantiles (5% and 95%) and maximum values. This was accompanied by a comparative analysis of characteristics in the annual cycle using a decadal approach.
Calculation of the linear trend coefficients [17] was aided with the trend significance analysis. Mann–Kendall nonparametric tests were used to verify the null hypothesis on trend nonexistence. The purpose of the Mann–Kendall (MK) test [18,19,20] is to statistically assess whether there is a monotonic upward or downward trend in the variable without the assumption that the trend is linear or the residuals are normally distributed, Hirsch et al. [21] indicate that the MK test is best viewed as an exploratory analysis and is most appropriately used to identify stations where changes are significant or of large magnitude.
The overall differences between thermal conditions in the decadal scope were investigated with the application of Kruskal–Wallis and Wilcoxon tests. The Kruskal–Wallis [22] rank test, which is a non-parametric alternative to the one-way ANOVA test, extends the two-samples Wilcoxon test and enables analysis in a situation where there are more than two groups (decades in this case). The null hypothesis was that the CDF in the compared populations was the same. The input data comprised an n-elements sample divided into k-divisive groups. It was assumed that each group was sampled from different populations. The Wilcoxon test [17] is a nonparametric alternative to the Student’s t-test for equal sample sizes. In the case of this study, it was applied to identify the changes between decadal thermal characteristics.

3. Results

3.1. Overall Characteristics

The average air temperature in Poland over the last 71 years (1951–2021) was 8.1 °C (Table 1) (same value for 1951–2020) and 8.7 °C for the last normal period, 1991–2020. The recorded variability of Poland’s average annual air temperature ranged from 6.1 °C in 1956 to 10.2 °C in 2019 (amplitude exceeded 4 °C).
In seasonal scope, the winter season range of recorded values (10.6 °C) exceeded twice the range of annual variability. In comparison with winter, the range values were much lower in spring (5.3 °C), summer (4.6 °C), and autumn (4.6 °C). The lowest temperature of the winter period (−7.5 °C) occurred in 1963, whereas the highest (3.1 °C) occurred in 2020. The result is a range of air temperature exceeding 10 °C.
From spring to autumn, the range of values is close to 5 °C. A slightly higher value appears in spring (5.3 °C), with the lowest temperature of 4.8 °C (1955) and the highest 10.0 °C (2007). In summer and autumn, the range value is 4.6 °C.
The average seasonal (1951–2021) spring temperature is 7.6 °C. In summer, it is 17.3 °C, and in autumn, it is 8.6 °C. For the latest normal period (1991–2020), average temperatures for winter, spring, summer, and autumn are −0.4 °C, 8.4 °C, 18.0 °C and 8.9 °C, respectively. The ranking of years of average annual air temperature indicates that 9 years from the first two decades of the 21st century (2001–2021) are in the top ten of the warmest years recorded since 1951. In the case of the winter season, it is 5 years; spring, 6 years, and 9 years; and for autumn, 6 years.

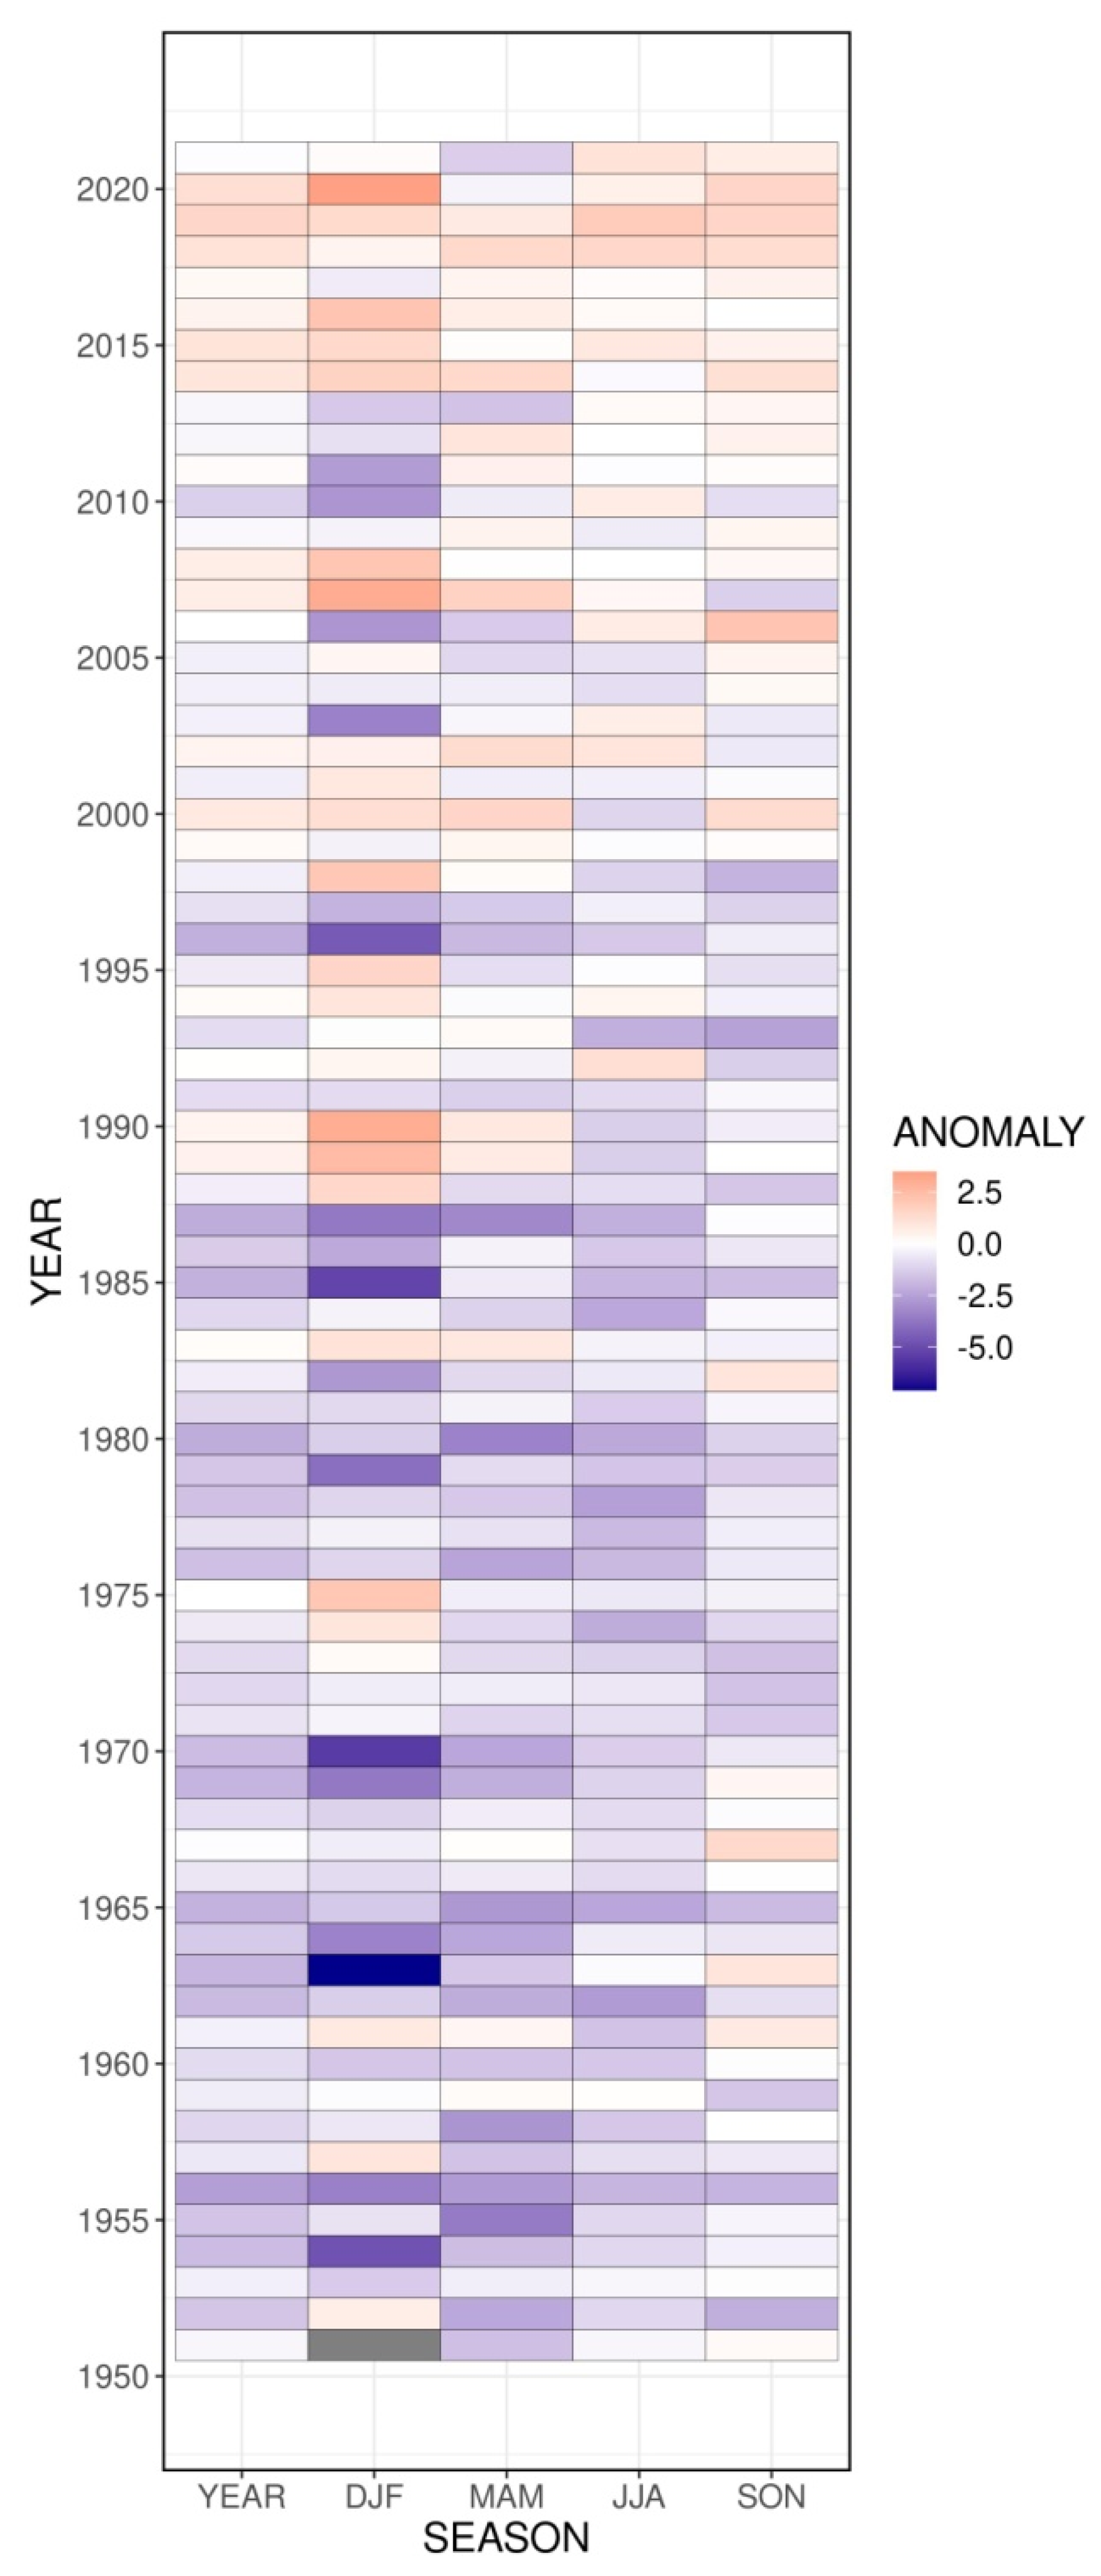
3.2. Annual and Seasonal Anomalies

A significant change in thermal characteristics was confirmed by the analysis of the course of annual and seasonal anomalies of the average area air temperature in Poland with reference to the 1991–2020 normal values (Figure 2).
A characteristic feature is the occurrence of increasingly higher anomalies values in the last 21 analyzed years (2001–2021), especially when compared with the period before 2001. There is significant year-to-year variability in the winter season, especially striking when the years with high negative anomalies, such as 2006 (−2.9 °C), are adjacent to the +3.0 °C anomaly (2007). Other examples would be 1997 and 1998, with anomalies of −2.0 °C and +2.0 °C, respectively. Such year-to-year changes in winter thermal conditions are usually the result of atmospheric circulation variability [9]. It should be emphasized that the significant variability of the air temperature in winter is not limited to the last 20 years, but occurred throughout the analyzed period. The last two decades show a much more frequent occurrence of high positive anomalies approaching or exceeding +2.0 °C (2019, 2016, 2007, and 2008). Additionally, significant positive anomalies (+3.0 °C in 1990) are characteristic for the end of the 1980s and the early 1990s when, from 1988 to 1994 (excluding 1991), repetitive positive air temperature anomalies were recorded. Twelve out of twenty-one winter seasons since 2001 were characterized by temperature values above the long-term average. The highest negative anomaly (−7.1 °C) was recorded in 1963, and the highest positive was +3.5 °C in 2019.
Other seasons are not characterized by such a significant variance in air temperature anomalies. In spring, the anomalies range from −3.6 °C (1955) to +1.7 °C (2007), with only a slightly lower value (+1.4 °C) recorded in 2019 and 2014. Additionally, in this season, positive anomalies are much more frequent in the 21st century (12 out of 21 cases), while in the 50-year period (1951–2000), only 10 such cases occurred. In the summer season, the anomaly values range from −2.7 °C (1962) to 1.9 °C (2019). In the case of this season, from 2001, as many as 15 of 21 summer seasons were characterized by positive anomalies. The lowest temperature in the autumn season (anomaly −2.5 °C) was recorded in 1993, and the highest (+2.1 °C) in 2006. As was the case with the summer season, 15 of 21 autumn seasons in the 21st century were characterized by temperature values higher than the long-term average (1991–2020). It should be noted that also in the 1960s, anomaly values approaching or exceeding +1.0 °C were recorded (1967, 1963, and 1961 with anomalies of +1.4 °C, +1.0 °C, and +0.8 °C, respectively). The results clearly show the positive change in the thermal conditions and the increase in its intensity in the 21st century, which is in concordance with other aforementioned research outcomes.
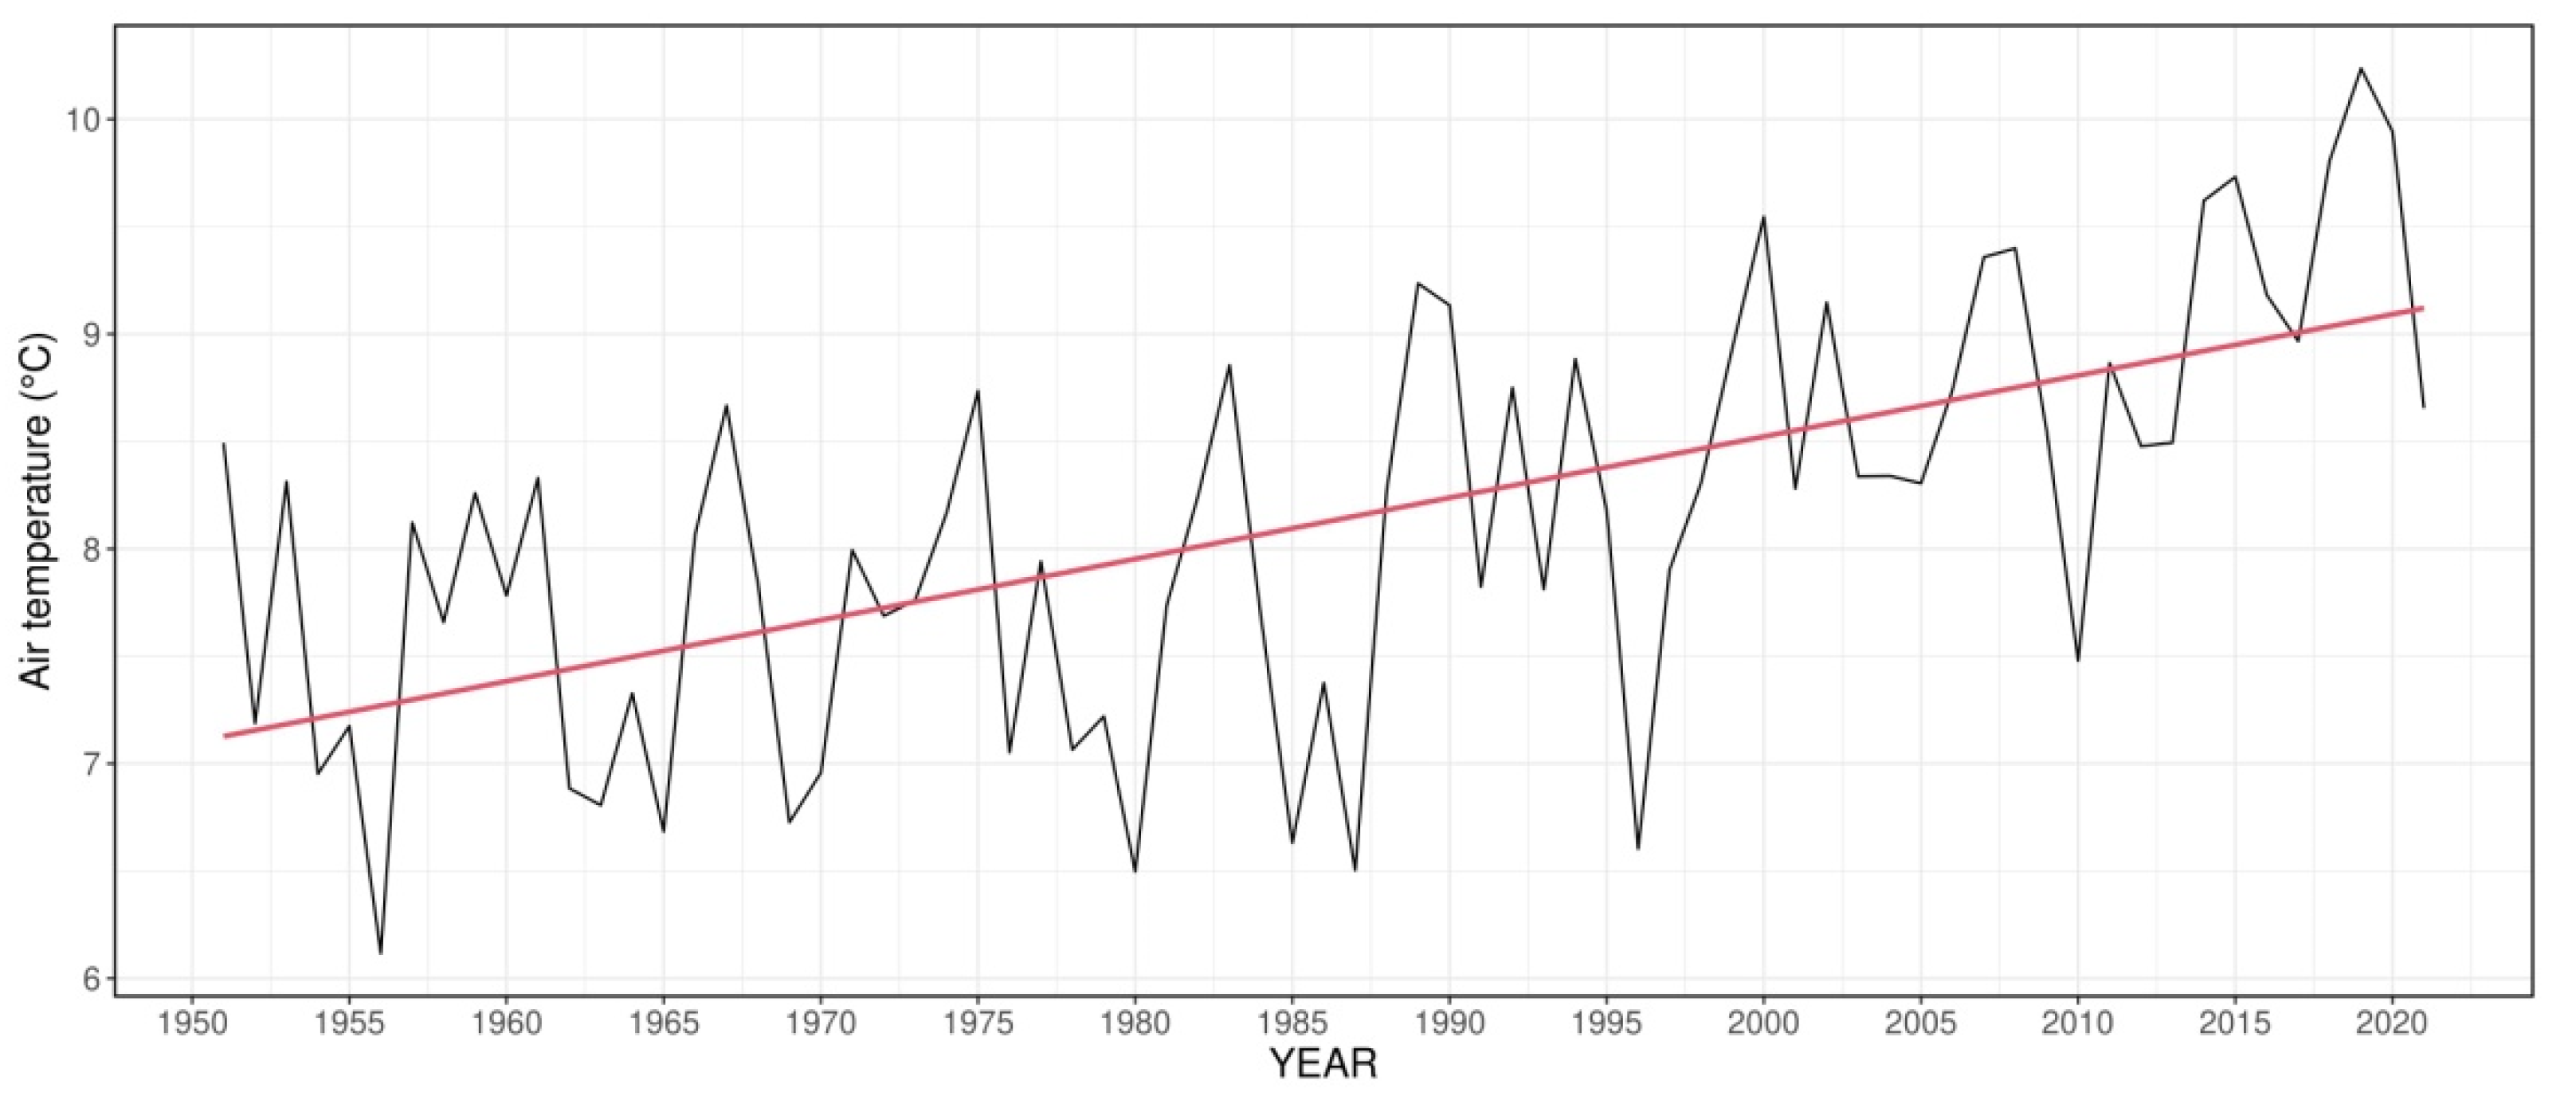
3.3. Trend Analysis

The rate of changes in air temperature in Poland over the last 71 years was 0.28 °C per decade, and in the course of the average area air temperature, years with values exceeding 9.5 °C (Figure 3) clearly stand out (2019, 2020, 2018, 2015, and 2014).
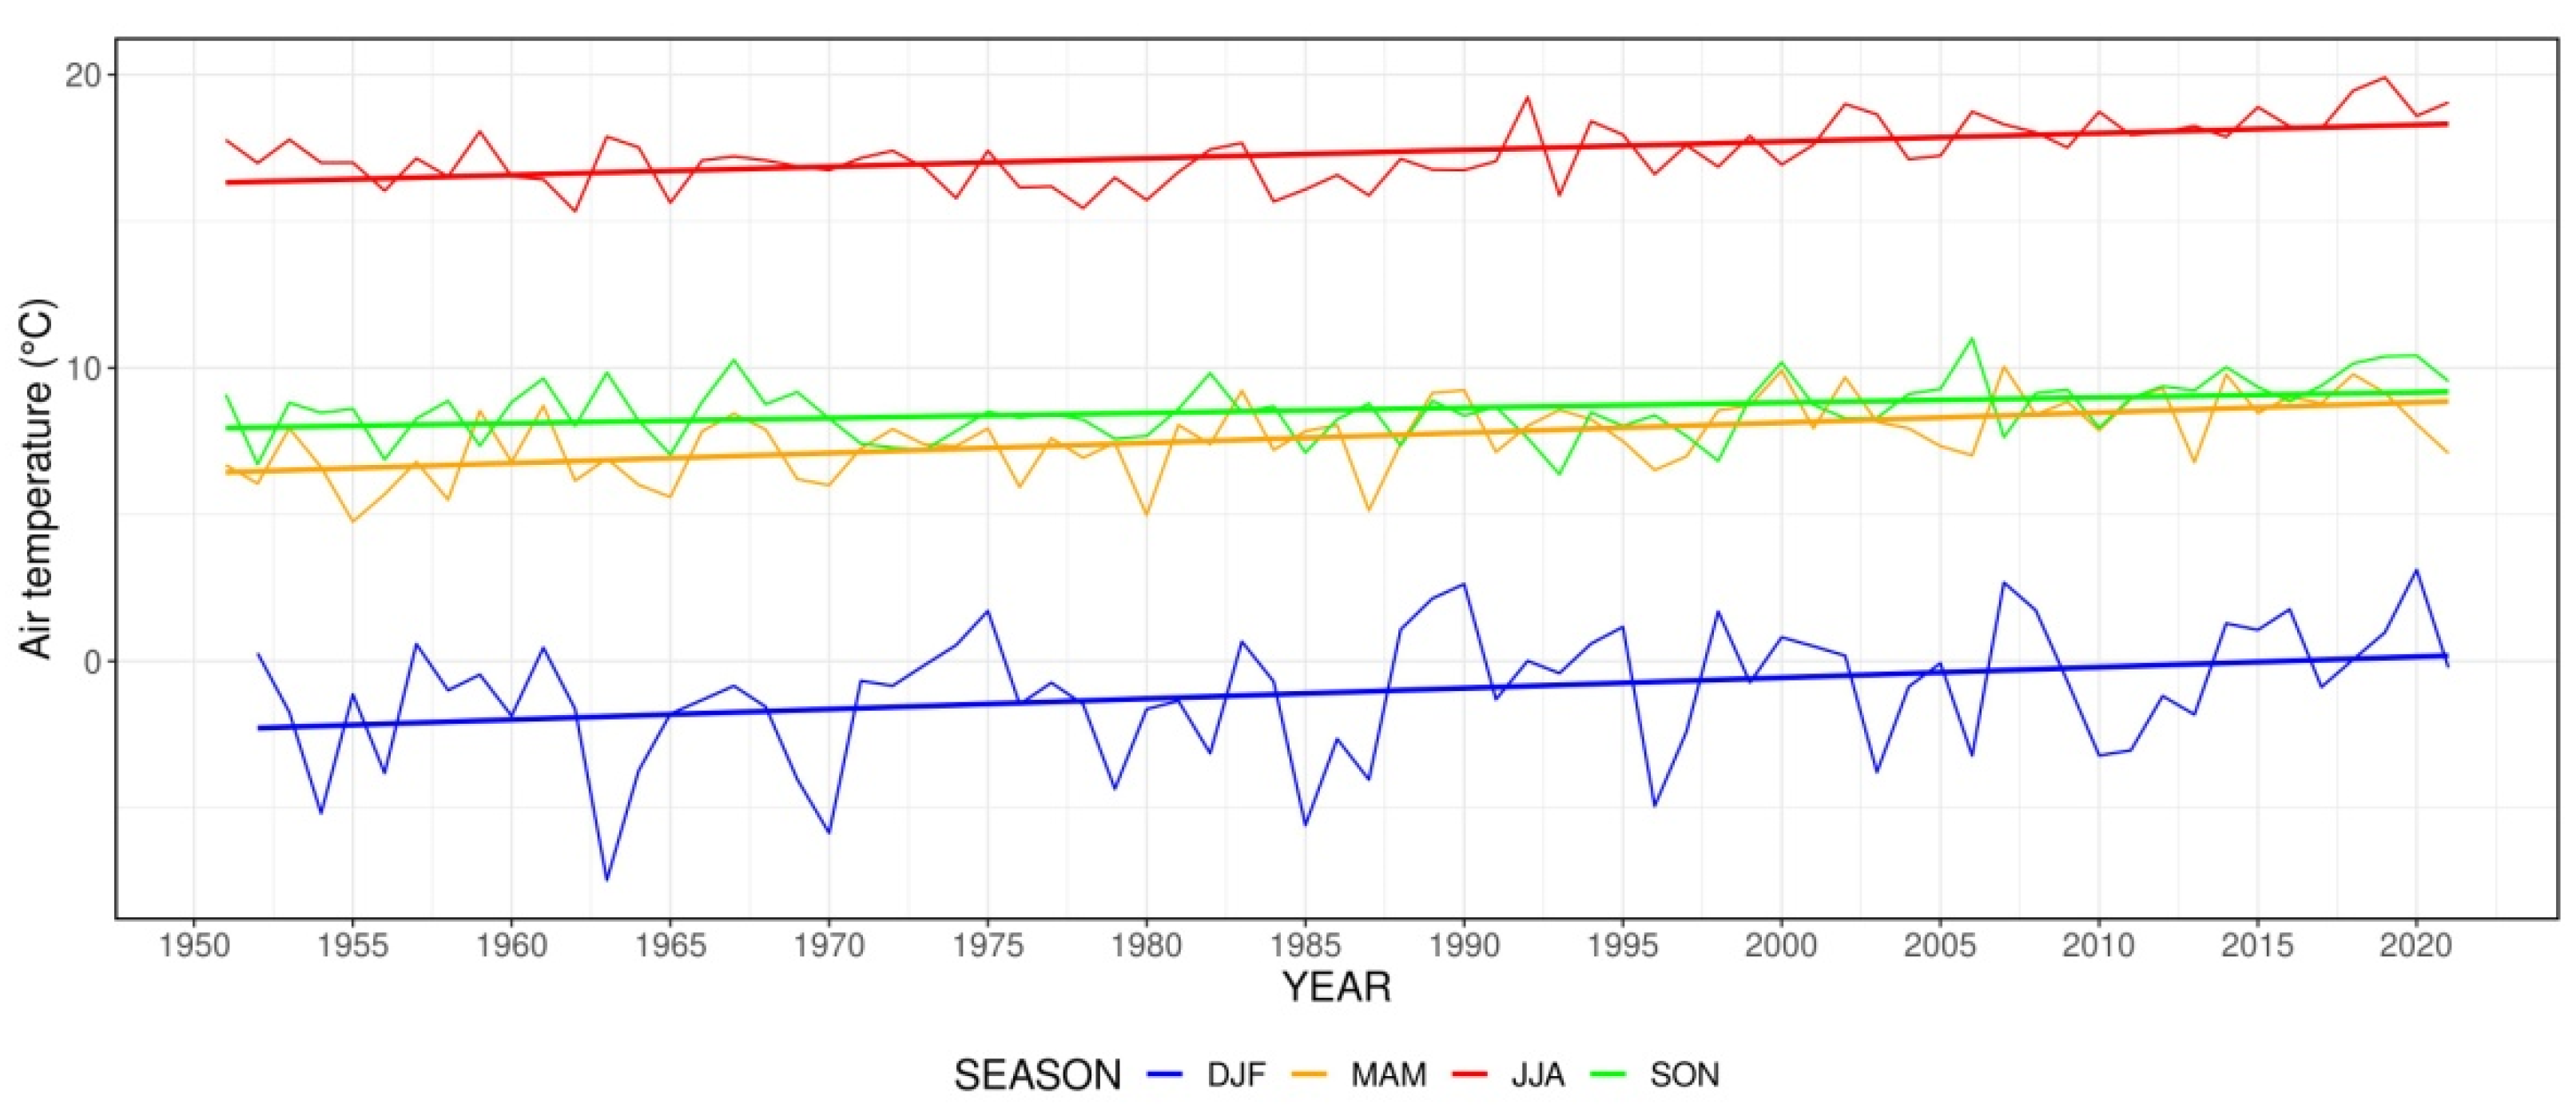
It is also notable that since the beginning of the 21st century (except for 2010), the average annual air temperature has not fallen below 8 °C. For the last decade (2011–2020), it was 9.3 °C, which was the warmest decade from 1951. The recorded trend (1951–2021) is statistically significant, indicating the permanent (in long-term perspective) nature of observed variability. Positive, statistically significant trends also occur in seasonal scope (Figure 4).
For 1951–2021, the highest rate of change was recorded in winter (0.36 °C per decade). Slightly lower rates (0.35 °C/decade) occurred in spring, whereas in summer, it was close to the variability for the average annual temperature (0.29 °C/decade). Autumn is characterized by the lowest value of the trend coefficient, 0.18 °C/decade. It should be noted that temperature variability is relatively low in the case of spring, summer, and autumn compared with the winter season. The above rate of change is consistent with the results of analyzes by Ustrnul et al. [2] based on daily homogeneous series of maximum, minimum, and average temperature data for the period 1951–2018 originating from 58 meteorological stations in Poland.
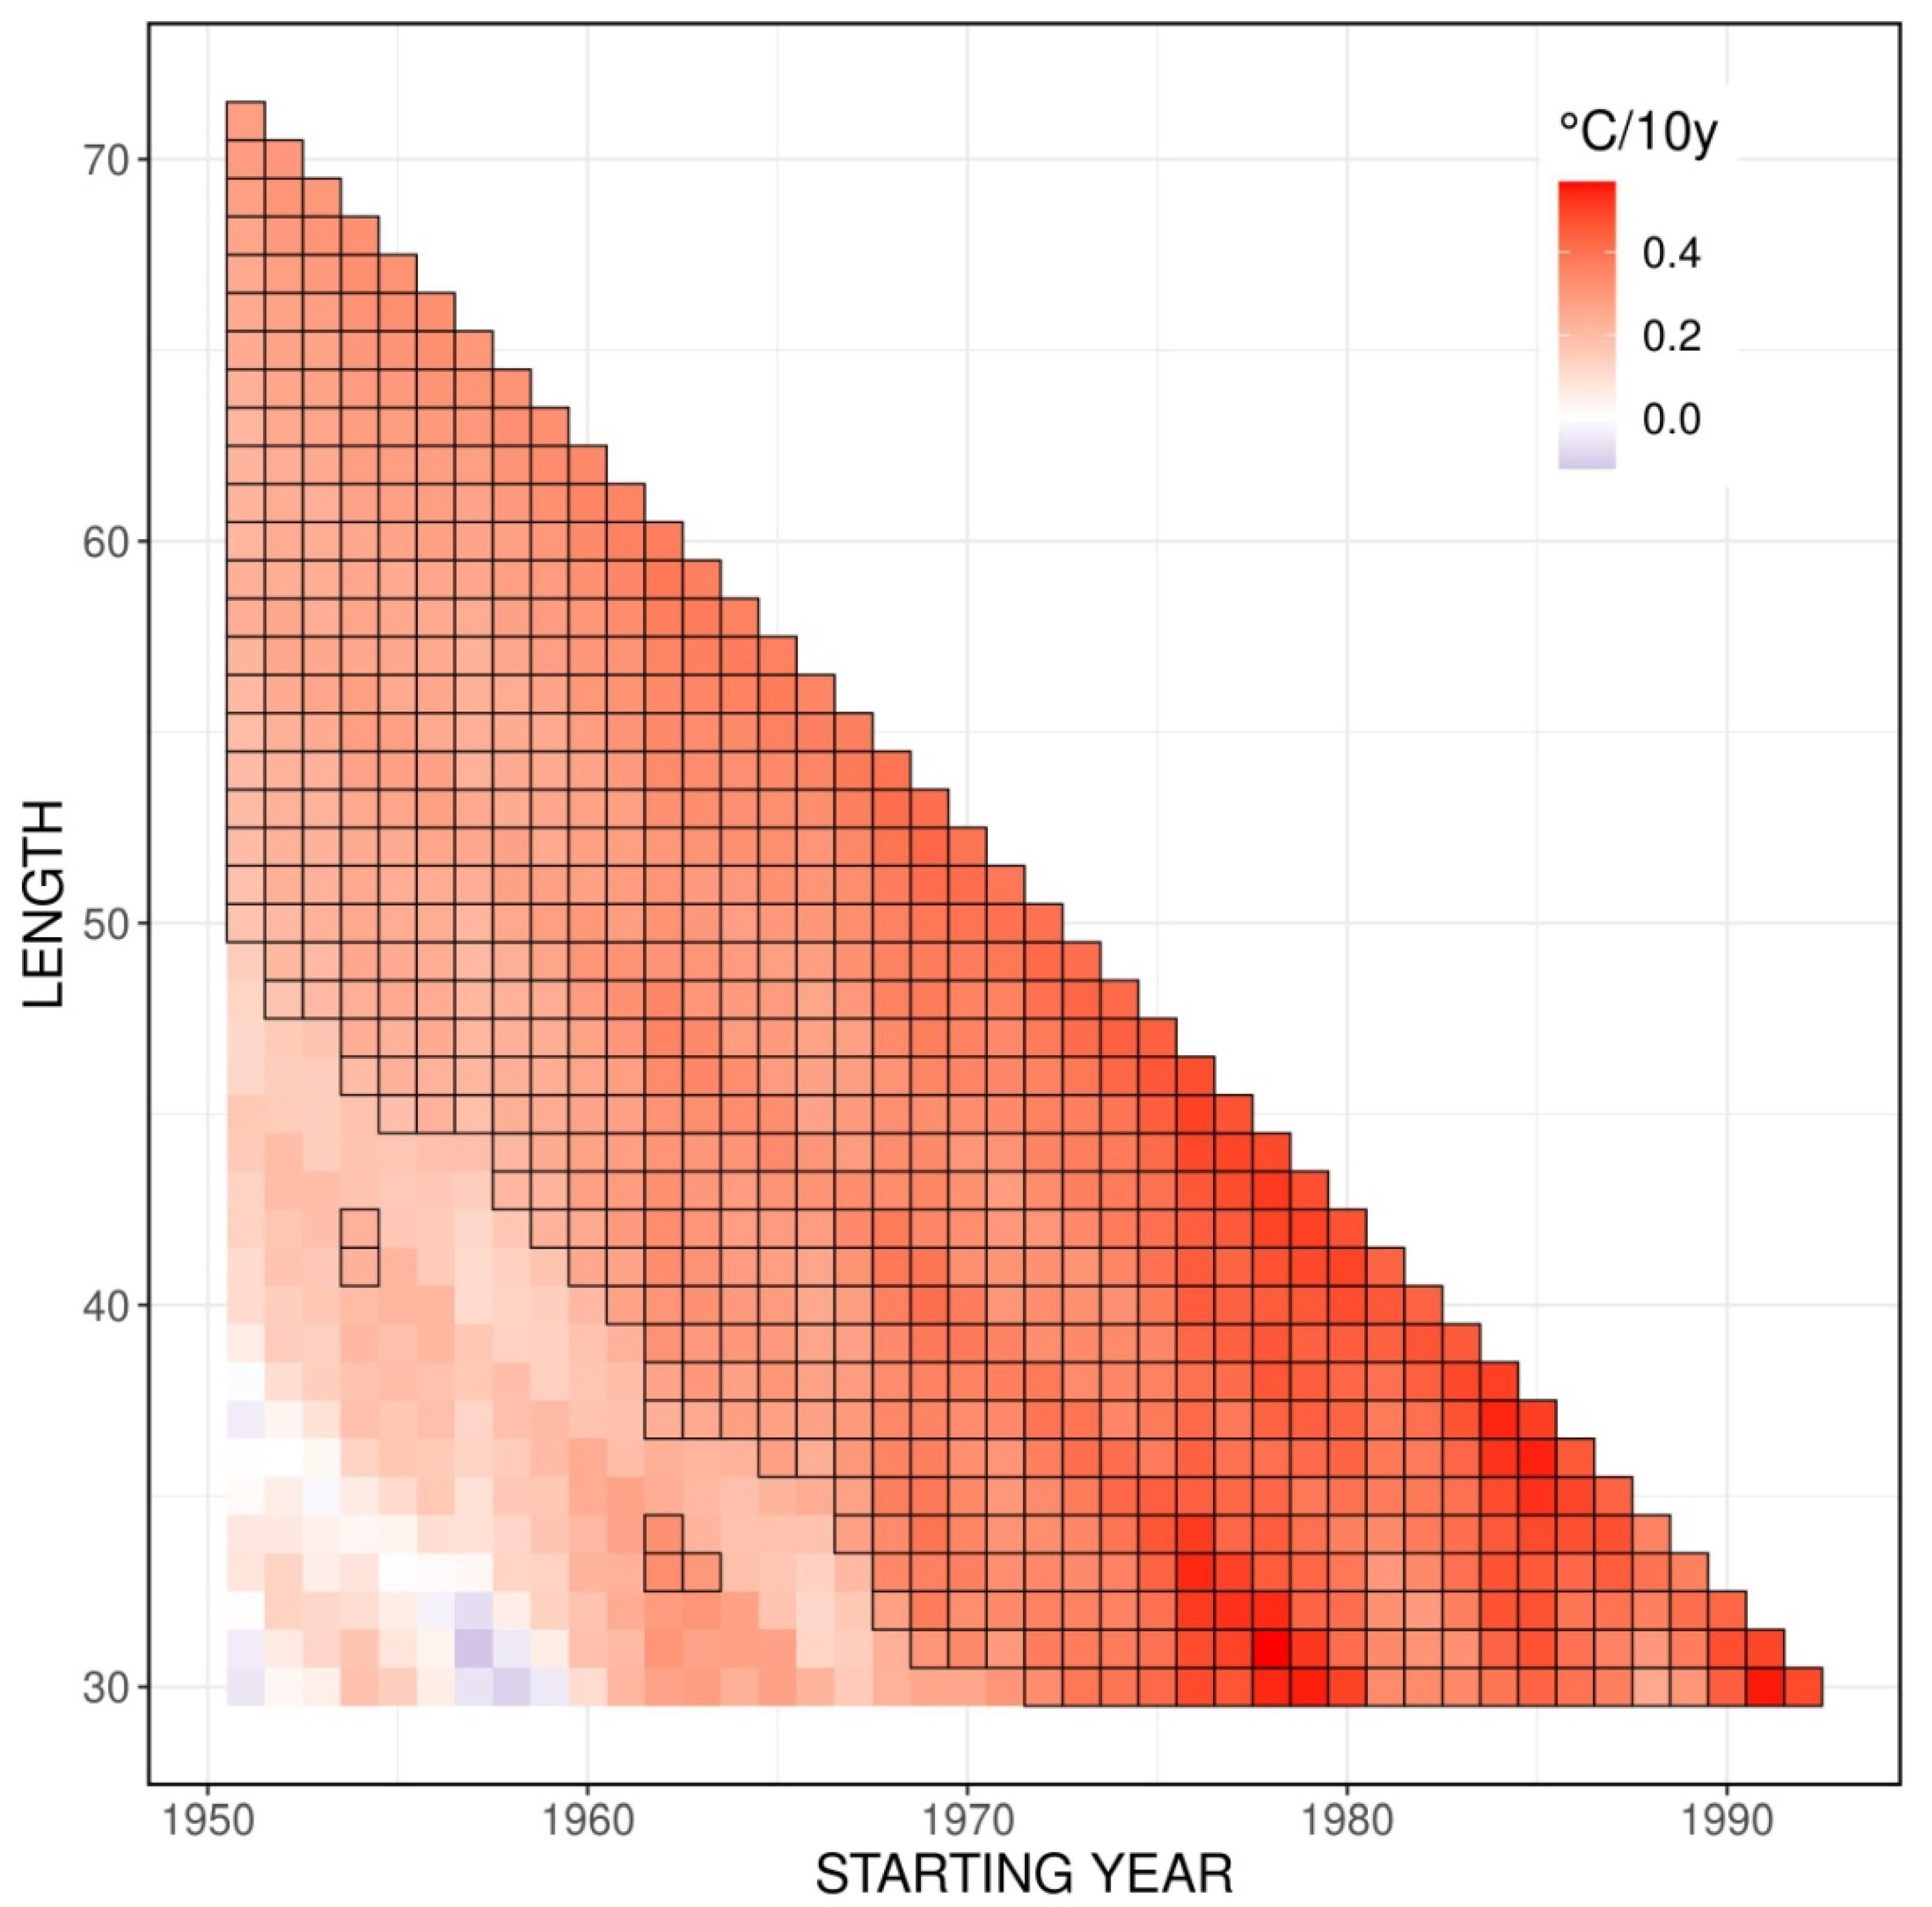
The above variability analysis clearly confirmed the general changes recorded over the decades. The analysis of variability and trends in a long time scale (1951–2021—the maximum data series length available from the data) does not necessarily enable reference to the direction of change in the shorter periods of time, e.g., the last 30 years. For this purpose, an analysis of the trend coefficients was carried out for all possible series of air temperature data in Poland (not shorter than 30 years). Calculations were carried out both for annual temperature averages as well as seasonal values. The coefficients of the trend equation were calculated, and the statistical significance was verified using a non-parametric Mann–Kendall test.
The results are presented as matrices of trend slope values, with additional statistical significance markings (Figure 5 and Figure 6). Analysis of the set of trend coefficients for annual average temperatures shows a relatively uniform pattern with positive and statistically significant trends (Figure 5), especially for long time series starting from the 1970s. However, the beginning of the analysis period does not show statistically significant trends even for time series up to 49 years (e.g., 1951–1999). In some cases, at the beginning of the analysis period, 30-year coefficients exhibit negative tendencies (e.g., 1958–1987) although it must be emphasized that those coefficients are not statistically significant. As mentioned earlier, the overall 71-year annual temperature trend coefficient equals 0.28 °C/decade, but its variability in starting year/length combinations is significant. In the following analysis, only statistically significant coefficients will be considered. The lowest values (0.18 °C/decade) were recorded at the beginning of the analysis period and for series lengths of around 45 years. The highest reaching 0.57 °C/decade was recorded for 30 years trends, starting in 1975–1980. Values of trend coefficients exceeding 0.5 °C/decade appear for short time spans beginning in the early 1990s, with the highest value of 0.56 °C/decade for the 1991–2020 period, which indicates the recent rapid increase in the annual air temperature increase. Overall, annual values exhibit a robust upward trend without any interruptions, at least from the 1970s.
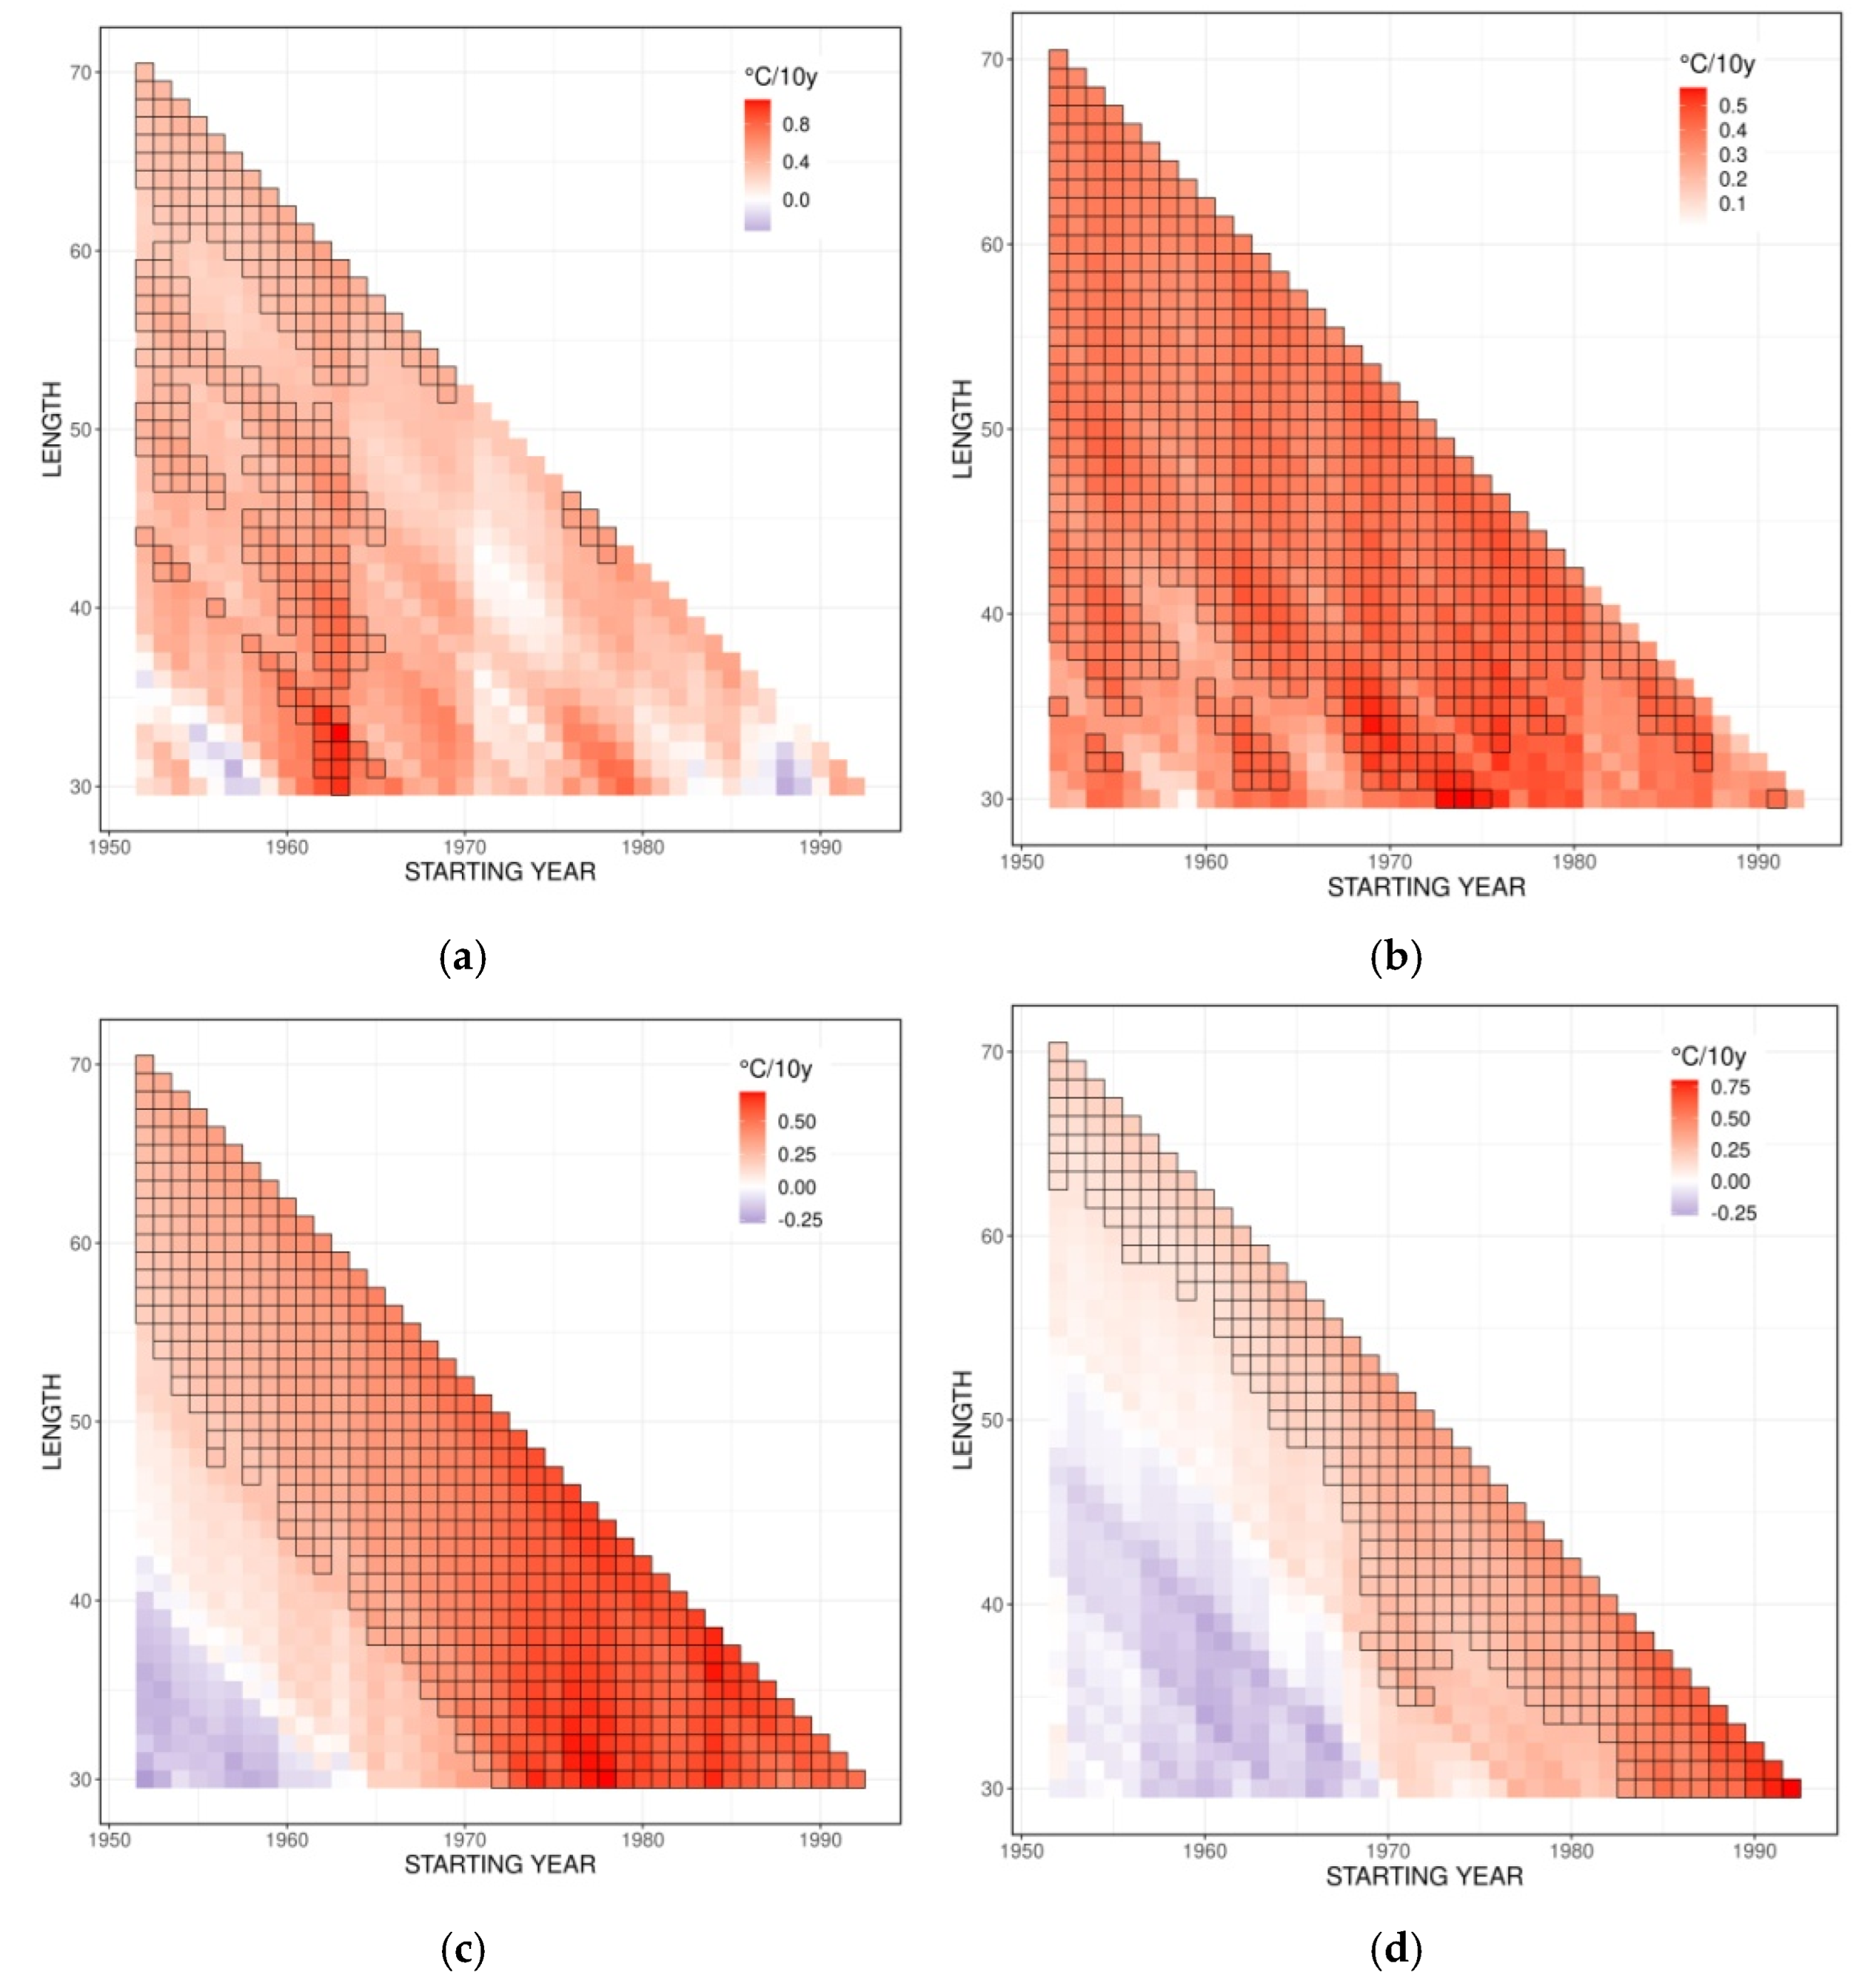
In seasonal scope (Figure 6) in winter, the variability of the trend coefficients is even more pronounced with minimal values (non-significant) below −0.3 °C/decade (1988–2017, 1957–1987). However, those occurrences are restricted to periods starting in the late 1950s and late 1980s with a length between 30 and 35 years. The highest recorded positive trend coefficients in some cases exceeding 1.0 °C/decade occurred for the time series beginning in the early 1960s for a length between 30 and 40 years. Those were statistically significant. What strikes is the pattern that begins in the early 1960s when there are multiple significant trends for lengths from 30 to 60 years, indicating robust tendencies. Those may be associated with the atmospheric circulation patterns such as NAO, which governs the thermal characteristics of the winter season in Poland. For subsequent years (from around 1965), the trends are positive but not significant (with the exception of the longest periods), and for the series beginning in the early 1970s with a length of around 40 years, the values of the coefficients only slightly exceed 0 °C/decade. The 1952–2021 trend coefficient equals 0.36 °C/decade. The latest normal period (1991–2020) trend equals 0.48 °C/decade (not significant, which suggests high year-to-year variability in the drivers of the winter thermal characteristics, e.g., significant variability of NAO in the second decade of the 21st century.
In spring, there is a robust and uniform pattern of positive values of trend coefficients (no negative values). A minimum (0.02 °C/decade) occurs for the 1959–1988 period. Maximum values exceeding 0.5 °C/decade occurred for periods beginning in the mid-1970s for relatively short period lengths (up to 40 years). The latest 30–35 year-long trends ending in 2021 are mostly statistically insignificant. The trend for the 1991–2020 period equals 0.42 °C/decade. The 2021 spring was very cold and dragged down the trend coefficient to 0.25 °C/decade (not significant).
Summer, a season when there was a significant shift from negative trends’ coefficients for periods beginning in the 1950s, and lasting up to 40 years to highly pronounced positive trends with the values of coefficients exceeding 0.7 °C/decade for periods starting in the late 1970s with lengths up to 40 years. What is apparent is the fact that for longer time series starting in the 1950s, only those of approximately 60 years in length tend to be statistically significant. In contrast, since the mid-1970s, air temperature variability exhibited a positive statistically significant trend for all possible time series lengths. The last 30-year normal period trend coefficient (1991–2020) is 0.52 °C/decade, nearly twice as high as the 71-year trend (1951–2021) at a level of 0.29 °C/decade.
As stated above, the 1951–2021 Autumn trend coefficient is the lowest (season-wise) and equals 0.18 °C/decade. Autumn is also a season when a substantial part of the trend coefficient spectrum shows negative tendencies (non-significant, though). This is characteristic for periods from the 1950s until the late-1960s. For trends starting in the early fifties, negative coefficients occur for a series as long as 50 years (e.g., 1951–2000). Since the 1970s, positive trends have appeared, and there is a robust pattern of positive trends (statistically significant). The latest 30-year trend reaches (1991–2020) 0.77 °C/decade, which is over four times higher than the 71-year trend coefficient. This also means that Autumn is the quickest warming season in the 1991–2020 period. The above analysis confirms, on the one hand, the overall positive tendencies recorded in the air temperature variability. On the other shows the nonuniformities of those. In general, there is a persistent positive trend in the annual temperature which increased its pace in the last 30 years. Seasonal characteristics show some deviances from this pattern. This is mostly visible in winter when the trends are the least stable, exhibiting changes in pace and direction of change. What is worth mentioning is that the latest 30 year series does not exhibit a significant trend in this season. The trend coefficient patterns in spring, summer, and autumn are more stable with the most uniform positive values recorded in spring.

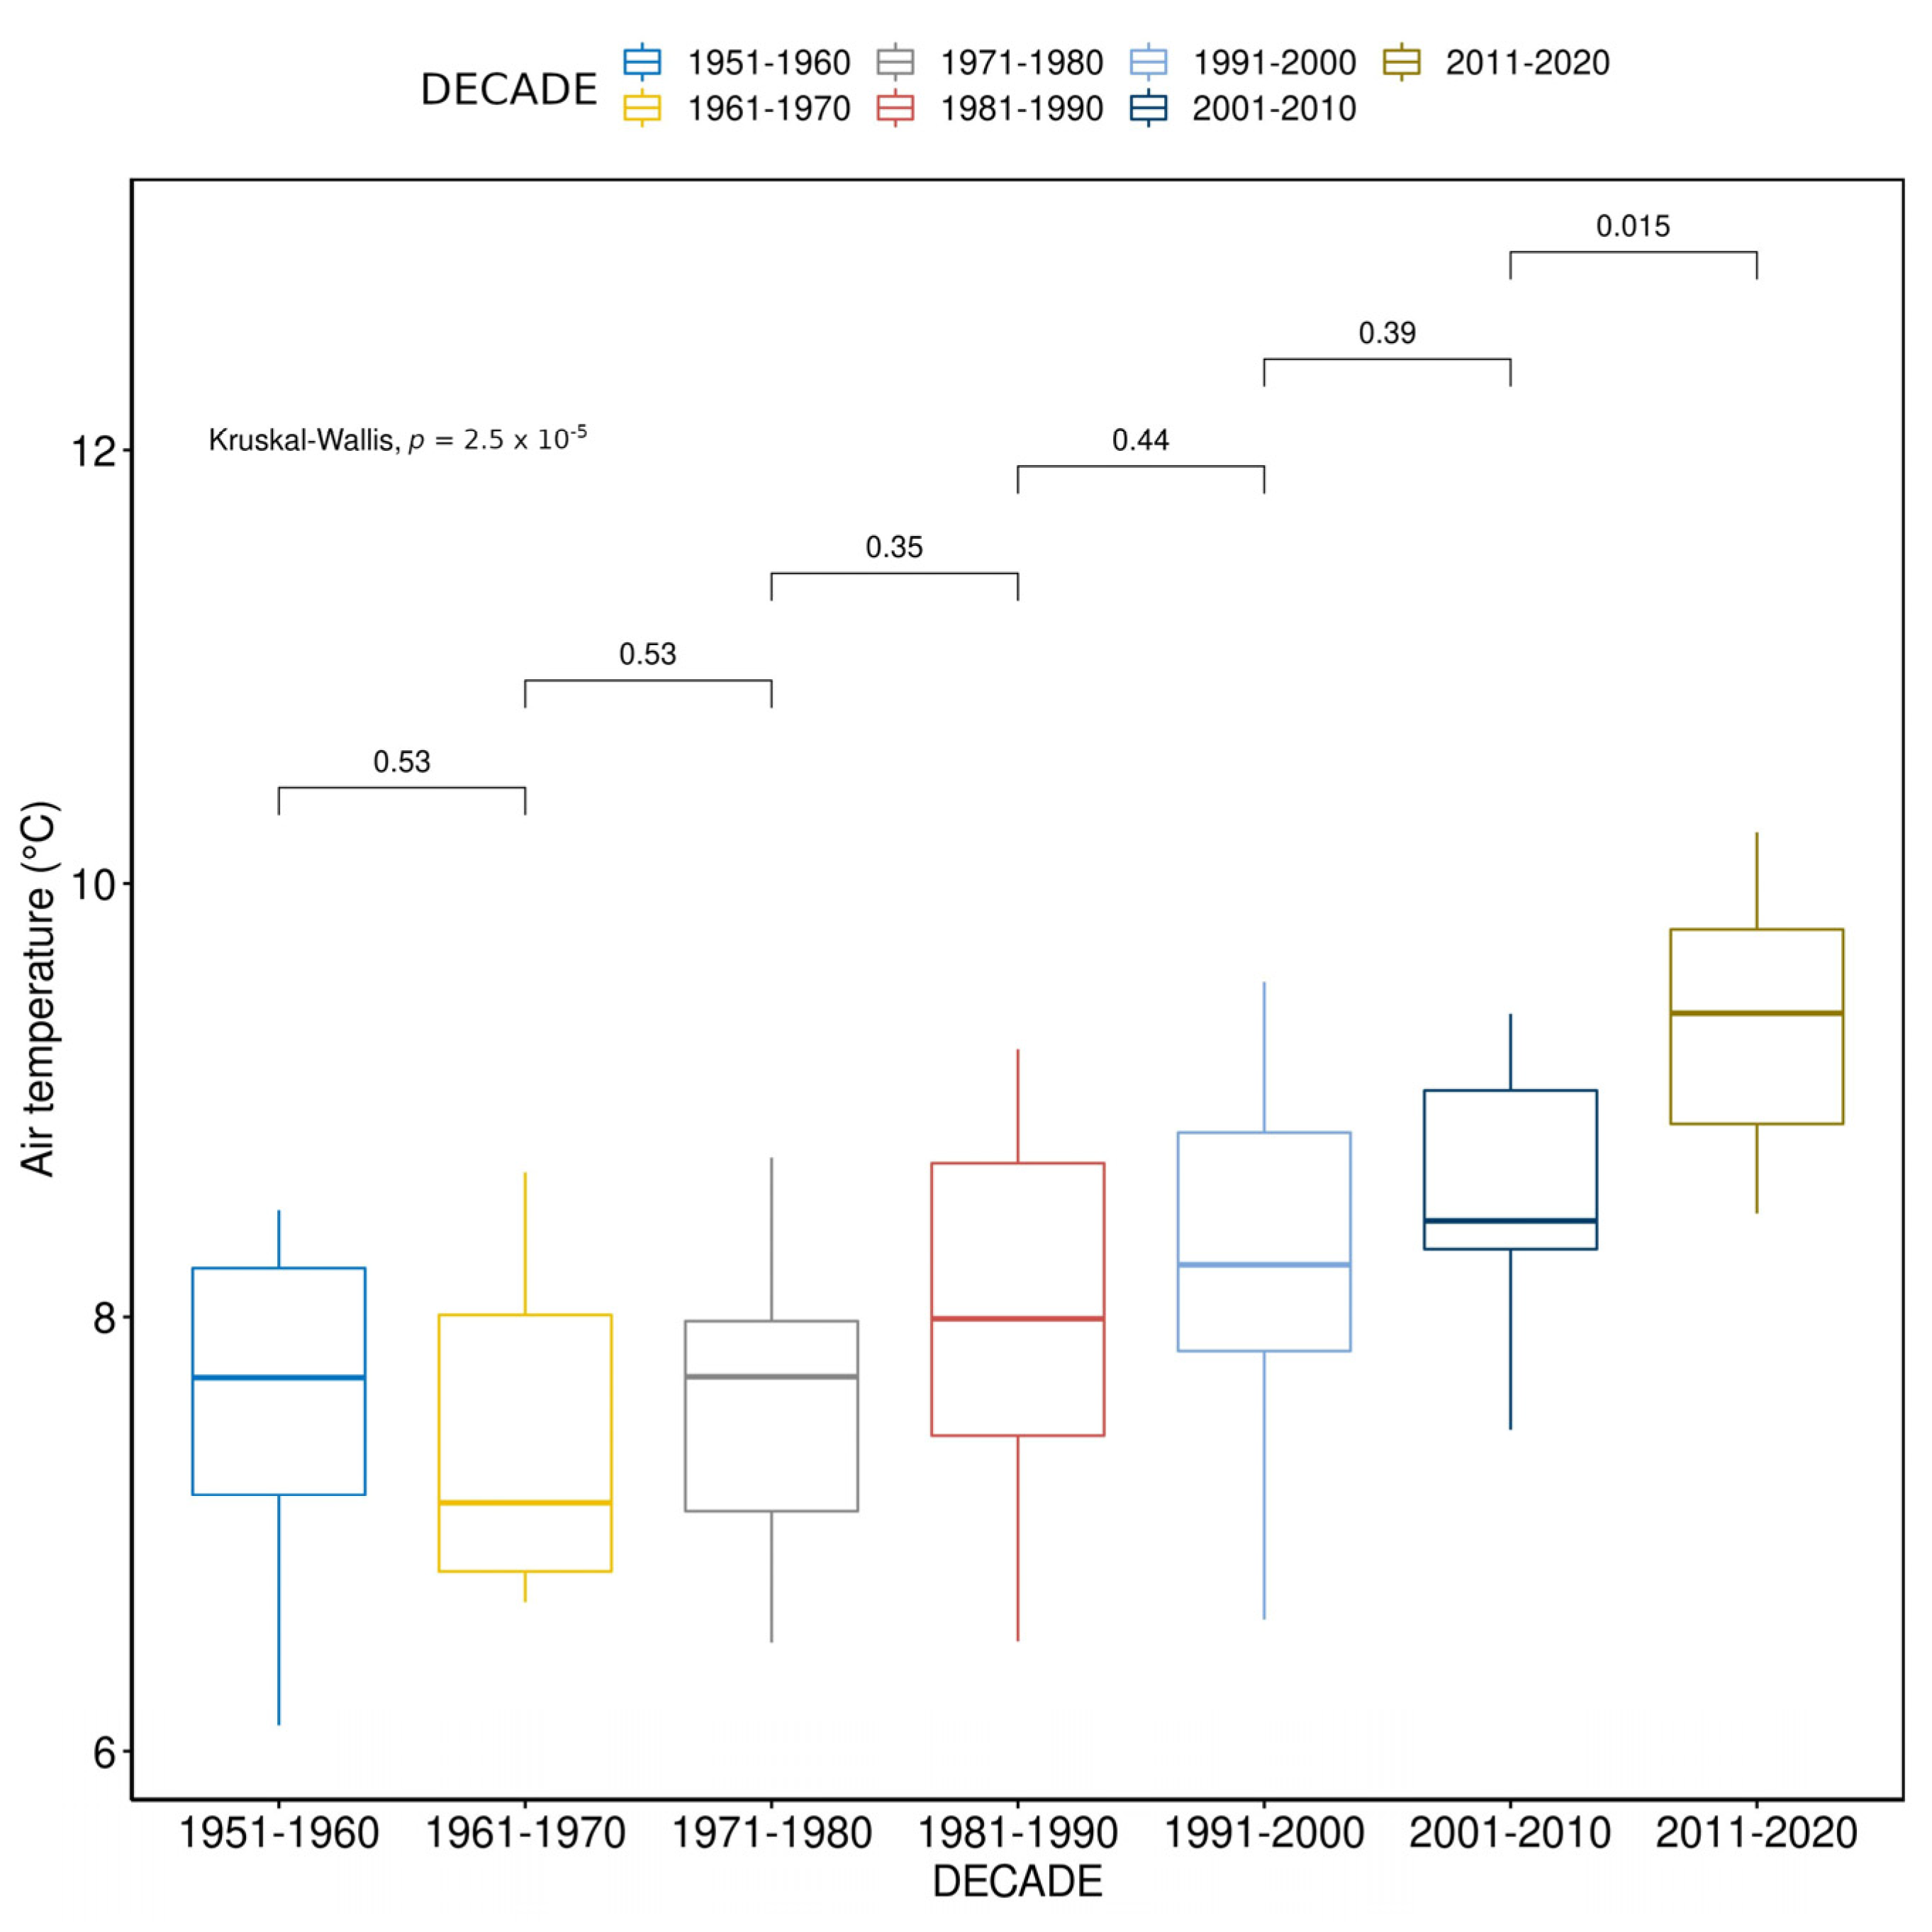
3.4. Decadal Comparison

Table 2 shows the decadal variability in the thermal characteristics of Poland and is subsequently accompanied by the result of non-parametric Kruskal–Wallis and Wilcoxon tests (Figure 7 and Figure 8). Results (p values) of the overall Kruskal–Wallis test and Wilcoxon test for inter-decadal differences are provided.
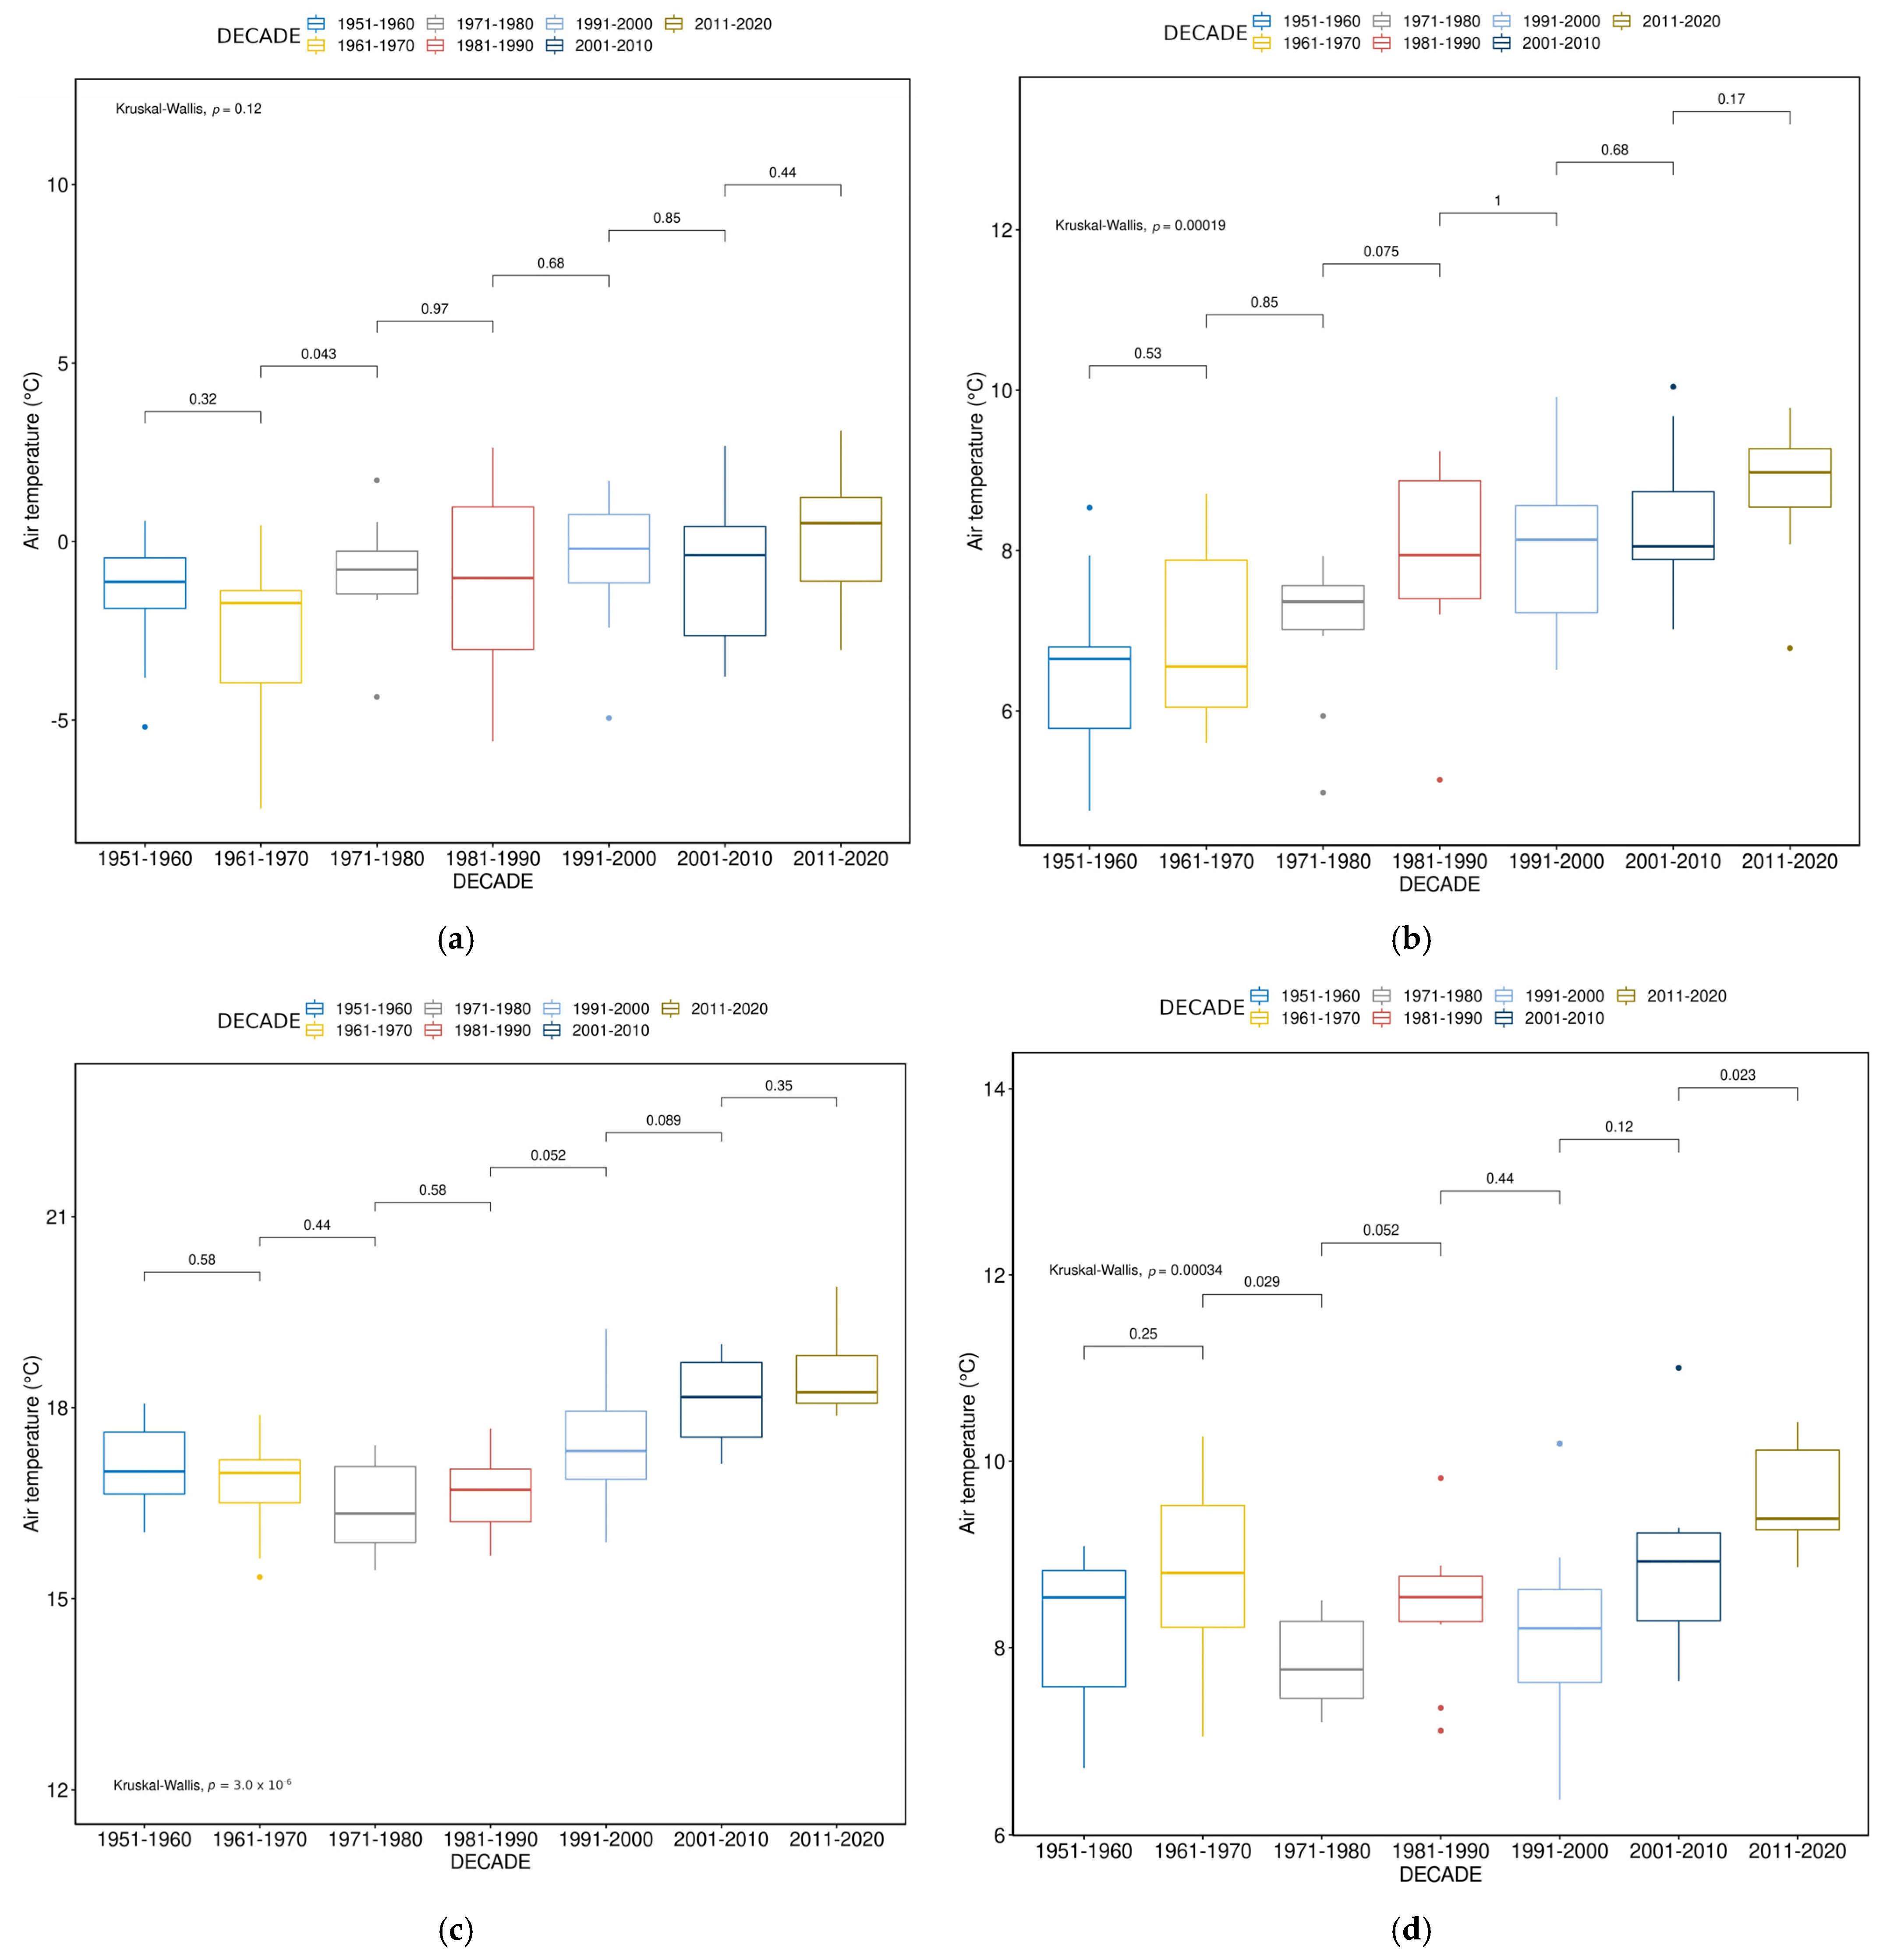
The overall pattern of temperature variability shows a substantial change in air temperature. Comparing annual decadal averages, one sees that the difference between the 2011–2020 and the 1951–1960 periods is 1.7 °C (from 7.6 °C to 9.3 °C). This change was similar in the case of other statistical characteristics (5%, 95% quantiles and median). Only for the 5% quantile did it reach 2 °C. Relatively identical patterns with increasing values occur in other seasons. The highest change in averages (2.3 °C) was recorded in spring, whereas the lowest (1.4 °C) was recorded in autumn and summer. In winter, the difference equals 1.7 °C. In the case of 95% quantile marking the extreme values, the change in annual values is 1.7 °C, whereas in seasonal scope, it ranges from 1.4 °C in autumn to 2.0 °C in winter. The investigation of the significance of overall and decade-to-decade changes suggests that the overall air temperature change has been relatively gradual until the last decade. In the case of both annual and seasonal analyses, the Kruskal–Wallis tests results are mostly unequivocal. They indicate that the overall change in thermal characteristics between decades is statistically significant. The exception is winter, when the change is not statistically significant. This is in concordance with the trend coefficient analysis, which shows that the variability of thermal conditions in winter is the most unstable.
As for the inter-decadal changes in the case of annual temperatures, only the shift from 2001–2010 to 2011–2020 is statistically significant. Over the seasons, such shifts occur in winter (1961–1970 to 1971–1980) and autumn (1961–1970 to 1971–1980, and 2001–2010 to 2011–2020).

4. Conclusions and Discussion

The application of Alexandersson’s approach allowed for the calculation of synthetic series (that can be regarded as area average) of monthly air temperatures in Poland. This, in turn, allowed for the generalized analysis of the thermal variability in Poland in multiannual period 1951–2021. The range of variability in average annual values is 4.1 °C, whereas the greatest diversification of thermal conditions is recorded in winter (range of values—10.6 °C); the lowest occurred in summer and autumn with an amplitude of 4.6 °C. Most of the years (both in terms of annual and seasonal values) with the highest values of positive air temperature anomalies occurred in the last twenty years (2001–2021). This is different for winter season, which is characterized by a significant (compared with other seasons and annual values) variance in thermal conditions in the whole analyzed period. This correlates with the variability of known drivers of winter temperatures in Central Europe—atmospheric circulation variability.
In all seasons and for annual values (1951–2021), statistically significant positive trends are noted (year—0.28 °C/decade), with the highest value achieved in the winter season—0.36 °C/decade. A slightly lower value is recorded in spring (0.35 °C/decade). Significantly lower values of trend coefficient are observed in autumn (0.18 °C/10 years). On the global scale, each of the last four decades has been successively warmer than any preceding decade since 1850. Global surface temperature in the first two decades of the 21st century (2001–2020) was 0.99 °C higher than 1850–1900. The global surface temperature was 1.1 °C higher in 2011–2020 than 1850–1900 [23].
The variability in thermal conditions in Poland is in line with the trends observed in recent decades in Europe [1] and elsewhere in the world [2]. In the temperate zone, air temperature is very much determined by circulation factors, and therefore mainly depends on the advection direction and thermal characteristics of dominant incoming air masses [12].
The trend analysis in shorter periods reveals larger variability with coefficients for some starting year/length combinations reaching 1 °C/decade. The analysis of the trend coefficients in the sub-periods confirmed the general trends, but also indicated (especially for shorter time series) different directions of the observed tendencies which, for summer and autumn, were consistent in the early part of the analyzed period. One of the aims of this study was to investigate the possibility of rapid shifts in thermal conditions accompanying the overall positive long-term (1951–2021) trend. The analysis of variability of thermal conditions in Poland over decades, apart from a few exceptions, does not confirm the occurrence of rapid changes, in the case of all seasons except winter. There is, however, a statistically significant difference between decades taken as a whole. In a closer look of decadal shifts in the case of annual averages, there is a statistically significant difference between the decades 2001–2010 and 2011–2020, whereas in seasonal scope, only in autumn, there is a sudden change in the values of characteristics between the decades 1961–1970/1971–1980 and 2001–2010/2011–2020. Notably, the robust increase in temperature change pace occurs in the latest 30-year period in all seasons except winter

Author Contributions

M.M. (Michał Marosz)—conceptualization, methodology, formal analysis, writing, editing; M.M. (Mirosław Miętus)—conceptualization, methodology, supervision, writing—review; D.B.—methodology, data curation, writing. All authors have read and agreed to the published version of the manuscript.

Funding

This study was funded by IMGW-PIB. Grant FBW10/2022.

Institutional Review Board Statement

Not applicable.

Informed Consent Statement

Not applicable.

Data Availability Statement

Not applicable.

Conflicts of Interest

The authors declare no conflict of interest.

References

  1. WMO. State of the Climate in Europe 2021 (WMO-No. 1304); WMO: Geneva, Switzerland, 2022. [Google Scholar]
  2. Ustrnul, Z.; Wypych, A.; Czekierda, D. Air Temperature Change. In Climate Change in Poland; Falarz, M., Ed.; Springer: Berlin/Heidelberg, Germany, 2021; pp. 275–330. [Google Scholar]
  3. Marosz, M.; Wójcik, R.; Biernacik, D.; Jakusik, E.; Pilarski, M.; Owczarek, M.; Miętus, M. Zmienność Klimatu Polski od Połowy XX Wieku. Rezultaty Projektu KLIMAT. Pr. Studia Geogr. 2011, 47, 51–66. [Google Scholar]
  4. Biernacik, D.; Filipiak, J.; Miętus, M.; Wójcik, R. Zmienność warunków termicznych w Polsce po roku 1951. Rezultaty projektu KLIMAT. In Klimat Polski na tle Klimatu Europy. Zmiany i ich Konsekwencje; Bednorz, E., Kolendowicz, L., Eds.; Seria: Studia i Prace z Geografii i Geologii; Bogucki Wydawnictwo Naukowe: Poznań, Poland, 2010; Volume 16, pp. 9–21. [Google Scholar]
  5. BACC Author Team. Assessment of Climate Change for the Baltic Sea Basin. Regional Climate Studies; Springer: Berlin/Heidelberg, Germany, 2008. [Google Scholar]
  6. BACC II Author Team. Second Assessment of Climate Change for the Baltic Sea Basin; Springer: Cham, Switzerland, 2015. [Google Scholar]
  7. Degirmendžić, J.; Kożuchowski, K.; Żmudzka, E. Changes of air temperature and precipitation in Poland in the period 1951–2000 and their relationship to atmospheric circulation. Int. J. Climatol. 2004, 24, 291–310. [Google Scholar] [CrossRef]
  8. Wibig, J.; Głowicki, B. Trends of minimum and maximum temperature in Poland. Clim. Res. 2002, 20, 123–133. [Google Scholar] [CrossRef]
  9. Czernecki, B.; Miętus, M. The thermal seasons variability in Poland, 1951–2010. Theor. Appl. Climatol. 2017, 127, 481–493. [Google Scholar] [CrossRef] [Green Version]
  10. Wibig, J. Heat waves in Poland in the period 1951–2015: Trends, patterns and driving factors. Meteorol. Hydrol. Water Manag. 2018, 6, 37–45. [Google Scholar] [CrossRef]
  11. Szyga-Pluta, K. Large Day-to-Day Variability of Extreme Air Temperatures in Poland and Its Dependency on Atmospheric Circulation. Atmosphere 2021, 12, 80. [Google Scholar] [CrossRef]
  12. Ustrnul, Z. Synoptic-climatic structure of the extreme air thermal phenomena in Poland. Geogr. Pol. 2000, 73, 99–109. [Google Scholar]
  13. Alexandersson, H. A homogeneity test applied to precipitation data. J. Clim. 1986, 6, 661–675. [Google Scholar] [CrossRef]
  14. Wójcik, R.; Miętus, M. Niektóre cechy wieloletniej zmienności temperatury powietrza w Polsce (1951–2010). Przegląd Geogr. 2014, 86, 339–364. [Google Scholar] [CrossRef] [Green Version]
  15. Klimat Polski. Serwis IMGW-PIB. Available online: https://www.klimat.imgw.pl (accessed on 15 June 2022).
  16. R Core Team. R: A Language and Environment for Statistical Computing; R Foundation for Statistical Computing: Vienna, Austria, 2020; Available online: https://www.R-project.org/ (accessed on 15 June 2022).
  17. Wilks, D. Statistical Methods in the Atmospheric Sciences, 3rd ed.; Academic Press: Cambridge, MA, USA, 2011; p. 676. [Google Scholar]
  18. Mann, H.B. Non-parametric tests against trend. Econometrica 1945, 13, 163–171. [Google Scholar] [CrossRef]
  19. Kendall, M.G. Rank Correlation Methods, 4th ed.; Charles Griffin: London, UK, 1975. [Google Scholar]
  20. Gilbert, R.O. Statistical Methods for Environmental Pollution Monitoring; Wiley: New York, NY, USA, 1987. [Google Scholar]
  21. Hirsch, R.M.; Slack, J.; Smith, R. Techniques of Trend Analysis for Monthly Water Quality Data. Water Resour. Res. 1982, 18, 107–121. [Google Scholar] [CrossRef]
  22. Hollander, M.; Wolfe, D.A. Nonparametric Statistical Methods; John Wiley & Sons: New York, NY, USA, 1973. [Google Scholar]
  23. IPCC. Climate Change 2021, The Physical Science Basis. Contribution of Working Group I to the Sixth Assessment Report of the Intergovernmental Panel on Climate Change; IPCC: Geneva, Switzerland, 2021.
Figure 1. Location of synoptic and synoptic representative stations in Poland.
Atmosphere 14 00282 g001
Figure 2. Air temperature anomalies (°C, with reference to the 19912020 normal period) in Poland 19512021.
Atmosphere 14 00282 g002
Figure 3. Course of area average annual air temperature in Poland (1951–2021).
Atmosphere 14 00282 g003
Figure 4. Course of area average seasonal air temperature in Poland (1951–2021).
Atmosphere 14 00282 g004
Figure 5. Trend coefficients (significant at the 0.05 level; MK tests are outlined) of the average annual air temperature in Poland for a given start year, and length of the analyzed period.
Atmosphere 14 00282 g005
Figure 6. Trend coefficients (those significant at the 0.05 level tested with MK test are outlined) of average seasonal air temperature in Poland for a given start year and length of the analyzed period (a) DJF, (b) MAM, (c) JJA, and (d) SON.
Atmosphere 14 00282 g006
Figure 7. Box-and-whisker plots of annual average air temperature in Poland over the decades.
Atmosphere 14 00282 g007
Figure 8. Box-and-whisker plots of seasonal average air temperature in Poland over the decades. The results of overall Kruskal–Wallis test and Wilcoxon test for inter-decadal differences are provided. (a) DJF; (b) MAM; (c) JJA; (d) SON.
Atmosphere 14 00282 g008
Table 1. General characteristics of air temperature variability in Poland 1951–2021. MEAN, average; MIN, minimum recorded value, with year of occurrence in parentheses; Q05, 5% quantile; Q50, median; Q95, 95% quantile; MAX, maximum recorded value, with year of occurrence in parentheses; MAX–MIN, range.
SEASONMEANMINQ05Q50Q95MAXMAX–MIN
YEAR8.16.1
(1956)
6.68.29.710.2
(2019)
4.1
DJF−1.0−7.5
(1963)
−5.1−0.82.03.1
(2020)
10.6
MAM7.64.8
(1955)
5.67.89.710.0
(2007)
5.3
JJA17.315.3
(1962)
15.717.219.019.9
(2017)
4.6
SON8.66.4
(1993)
7.08.610.211.0
(2006)
4.6
Table 2. Decadal characteristics of annual air temperature in Poland 1951–2020. Q05, 5% quantile; Q50, median; Q95, 95% quantile.
SEASONDECADEMEANQ05Q50Q95
YEAR1951–19607.66.57.78.4
1961–19707.46.77.18.5
1971–19807.66.77.78.5
1981–19908.06.68.09.2
1991–20008.37.18.29.3
2001–20108.67.88.49.4
2011–20209.38.59.410.1
DJF1951–1960−1.6−4.6−1.10.5
1961–1970−2.8−6.7−1.7−0.1
1971–1980−0.9−3.1−0.81.2
1981–1990−1.1−4.9−1.02.4
1991–2000−0.6−3.8−0.21.5
2001–2010−0.7−3.5−0.42.3
2011–20200.1−2.50.52.5
MAM1951–19606.55.16.78.3
1961–19707.05.86.68.6
1971–19807.15.47.47.9
1981–19907.96.17.99.2
1991–20008.06.78.19.4
2001–20108.37.28.09.9
2011–20208.87.49.09.8
JJA1951–196017.116.317.017.9
1961–197016.815.517.017.7
1971–198016.515.616.317.4
1981–199016.715.816.717.6
1991–200017.416.217.318.9
2001–201018.117.218.218.9
2011–202018.517.918.219.7
SON1951–19608.26.88.59.0
1961–19708.87.58.810.1
1971–19807.87.27.88.5
1981–19908.47.28.59.4
1991–20008.16.68.29.6
2001–20108.97.88.910.2
2011–20209.68.99.410.4
Disclaimer/Publisher’s Note: The statements, opinions and data contained in all publications are solely those of the individual author(s) and contributor(s) and not of MDPI and/or the editor(s). MDPI and/or the editor(s) disclaim responsibility for any injury to people or property resulting from any ideas, methods, instructions or products referred to in the content.

