Abstract
Near-real-time satellite precipitation estimation is indispensable in areas where ground-based measurements are not available. In this study, an evaluation of two near-real-time products from the Center for Hydrometeorology and Remote Sensing at the University of California, Irvine—PERSIANN-CCS (Precipitation Estimation from Remotely Sensed Information using Artificial Neural Networks—Cloud Classification System) and PDIR-Now (PERSIANN-Dynamic Infrared Rain Rate near-real-time)—were compared to each other and evaluated against IMERG Final (Integrated Multi-satellite Retrievals for Global Precipitation Measurement—Final Run) from 2015 to 2020 over the Mekong River Basin and Delta (MRB) using a spatial resolution of 0.1 by 0.1 and at a daily scale. PERSIANN-CDR (PERSIANN-Climate Data Record) was also included in the evaluation but was not compared against the real-time products. In this evaluation, PDIR-Now exhibited a superior performance to that of PERSIANN-CCS, and the performance of PERSIANN-CDR was deemed satisfactory. The second part of the study entailed performing a Mann–Kendall trend test of extreme precipitation indices using 38 years of PERSIANN-CDR data over the MRB. This annual trend analysis showed that extreme precipitation over the 95th and 99th percentiles has decreased over the Upper Mekong River Basin, and the consecutive number of wet days has increased over the Lower Mekong River Basin.
1. Introduction
Accurately estimating precipitation is extremely important, as it is a key element of the hydrological cycle. These estimates are especially useful for understanding water availability, making predictions, monitoring extreme events, and making water management decisions. There are several instruments for measuring precipitation, out of which rainfall gauges are the most commonly used [1,2]. One of the disadvantages of rainfall gauges is that they are point measurements, which means that they cannot provide a representation of the spatial distribution of precipitation [3]. Another disadvantage is that they tend to be sparse in inhabited areas, mountains, and oceans [2]. Another common instrument is radars [4]. The precipitation estimates from radars have high spatial and temporal resolutions, but they suffer from beam blockages due to changes in terrain, which affects their accuracy and extent [5]. Moreover, remotely sensed data from satellites are also used to estimate precipitation. An advantage is that these satellite precipitation products provide measurements with high spatial and temporal resolutions, so they can be used to estimate precipitation. Another advantage of these products is that not only do they provide the spatial distribution of precipitation, but they are also available over areas where other measurements are scarce or nonexistent [6].
Although this is true, the accuracy of a precipitation product varies with the climatology of the region of study, the topological features, and biases within algorithms. Thus, the evaluation of satellite precipitation products is crucial for understanding their suitability over a study area. For example, the authors of [7] evaluated daily rainfall as estimated by NASA’s Integrated Multi-satellite Retrievals for Global Precipitation (IMERG) and Version 7 Tropical Rainfall Measuring Mission (TRMM) Multi-satellite Precipitation Analysis (TMPA) over the Mekong River Basin (MRB). These two datasets were evaluated against rain gauge data from the China Meteorological Data Sharing Service System (CMDSSS) and the National Oceanic and Atmospheric Administration (NOAA) Global Hourly/Sub-Hourly Observation Data [7]. In this paper, it was concluded that both IMERG and TRMM are suitable for hydrological studies over the MRB. Ref. [8] evaluated the TMPA and GPM IMERG over China, specifically analyzing their performance when quantifying extreme indices. This study found that IMERG performed better than the TMPA. Ref. [9] concluded that IMERG is a great satellite precipitation product over Northern Vietnam compared to the TMPA, and they evaluated it against rainfall gauge data. Finally, Ang et al. (2022) concluded that IMERG Final is the best product for capturing precipitation over Southeast Asia when compared to Asian Precipitation—Highly Resolved Observational Data Integration Towards Evaluation (APHRODITE), ERA5, and TMPA [10].
Given the importance of having accurate near-real-time precipitation estimates, the objective of this study is to determine which near-real-time satellite precipitation product by the CHRS—specifically, PDIR-Now (Precipitation Estimation from Remotely Sensed Information using Artificial Neural Networks—Dynamic Infrared Rain Rate in near-real-time) or PERSIANN-CCS (PERSIANN—Cloud Classification System)—is more accurate over the MRB. This comparison was made to assess the improvement from the older dataset (PERSIANN-CCS) to the newer one (PDIR-Now). PERSIANN-CDR (PERSIANN-Climate Data Record) was also included in this evaluation to evaluate its performance, but it was not compared to PERSIANN-CCS and PDIR-Now, considering that climate data records serve a different purpose from that of near-real-time datasets. These precipitation products were evaluated against IMERG Final because gauge data were not available to the research team. Furthermore, IMERG Final is the official NASA product, and it has been widely evaluated over this study area, exhibiting great performance; thus, it was deemed as an acceptable product for the evaluation. Something important to note is that PDIR-Now and PERSIANN-CCS are both near-real-time products, which means that they are available with a very short latency. On the other hand, IMERG Final is available about 3.5 months after gathering the data necessary for the algorithm, which means that it is not a near-real-time product [11].
Accurate precipitation estimates are also essential for the analysis of extreme precipitation events, which can have a significant impact on food security and availability, as is the case for the MRB. Because of this reason, a trend analysis of extreme precipitation indices was performed to assess if extreme events increased or decreased over the last few decades. Past studies, such as [12,13], performed trend analyses of precipitation from 1951 to 2015 using the gridded rainfall gauge dataset from APHRODITE over the MRB. Ref. [12] found that extreme precipitation over the Upper Mekong River Basin (UMRB) was decreasing, and the consecutive number of wet days was increasing over the Lower Mekong River Basin (LMRB) [12,13]. Ref. [13] identified decreasing trends in precipitation above the 95th percentile and increasing trends in the length of wet spells over the UMRB. They also found an increase in the length of wet spells over the LMRB. Another study by [14] found that annual precipitation significantly decreased over the UMRB from 2000 to 2013, with an alpha of 0.05 [14]. Ref. [15] found a decrease in the length of wet and dry spells from 1960 to 2012 over the Yunnan Province in China, which is close to the UMRB. Ref. [16] used 12 gauge stations around the delta to check for trends in extreme indices. They identified downward trends in days with precipitation over 20 and 100 mm of rainfall.
Thus, the objectives of this study were the following:
- (a)
- to perform a daily evaluation of the PERSIANN family of products—specifically, PDIR-Now, PERSIANN-CCS, and PERSIANN-CDR—at a 0.1 by 0.1 spatial resolution;
- (b)
- to perform a trend analysis of extreme precipitation indices separately over the UMRB and LMRB to exemplify the appropriate use of climate record data.
2. Materials and Methods
2.1. Study Area
The study site for this project was the Mekong River Basin and Delta, a politically important transboundary basin covering six different countries: China, Myanmar, Laos, Thailand, Cambodia, and Vietnam. Furthermore, the Mekong River is the longest river in Southeast Asia, measuring 2700 miles. The UMRB, also known as Lancang River Basin, is located in China, whereas the LMRB covers the rest of the countries listed above (Figure 1). The LMRB receives more yearly precipitation than the UMRB (Figure 2), and it is characterized by a wet monsoon from mid-May to mid-October [17,18]. Given the difference in yearly precipitation amounts, the UMRB and LMRB were separated when performing the trend analysis of extreme precipitation indices. This river basin is essential because the river supports the economy of the countries through which it flows, especially the countries along the LMRB [18,19]. This basin supports agriculture, aquaculture, and construction in the area, as explained in a WWF report [19]. Agriculture in the area benefits from the flooding of the basin, which has been affected in the last few years by low flows during the dry season caused by the over-extraction of water [20]. Another key problem in this basin is the poor water quality caused by a lack of proper wastewater treatment [19]. Finally, the delta is suffering from land subsidence caused by upstream dams in the basin [19,21]. This specifically affects crop production in the area, threatening food security in the basin [21]. Because of these reasons, having accurate estimates of precipitation can aid in more effective water management decisions in the basin.
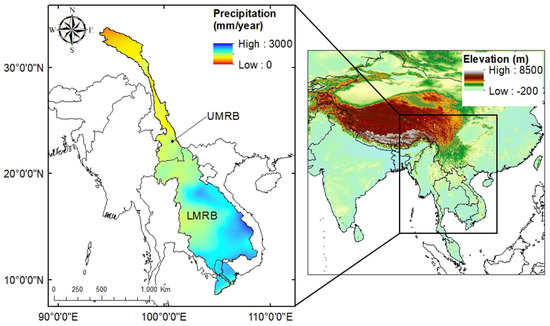
Figure 1.
Location of the Mekong River Basin and the mean yearly precipitation from 1983 to 2020 as estimated with PERSIANN-CDR. UMRB refers to the Upper Mekong River Basin, and LMRB refers to the Lower Mekong River Basin and Delta. The study area was divided into these two sub-basins to analyze the trends in extreme precipitation indices.
2.2. Data Sources
The precipitation products developed by the CHRS used in this evaluation were the PERSIANN products—specifically, two near-real-time products, PDIR-Now and PERSIANN-CCS, as well as the climate data record, PERSIANN-CDR [22,23,24]. PDIR-Now has an hourly temporal resolution, has a spatial resolution of 0.04× 0.04, and is available from 1 March 2000 to the present [22]. PERSIANN-CCS has the same spatial and temporal resolution as that of PDIR-Now and is available from January 2003 to the present [23]. PERSIANN-CDR has a spatial resolution of 0.25× 0.25 and a daily temporal resolution [24]. The period that this dataset is available for is from 1983 to the present [24]. PERSIANN-CDR was also used to study trends in extreme indices. The PERSIANN datasets are available for download through the CHRS data portal [25].
Rainfall gauge data were not available for use during the period of this evaluation; thus, IMERG Final was used as the reference dataset due to the promising performance it has shown in other studies near and in the study area [7,8,9,21,26,27,28,29]. IMERG Final is an operational satellite product from NASA that has a spatial resolution of 0.1× 0.1 and a 30-min temporal resolution [30]. The temporal coverage of this dataset is from June 2000 to September 2021 [30]. These data are available for download in the Earthdata portal.
2.3. Methods
To evaluate the PERSIANN products, three statistical and three categorical indices were calculated pixel by pixel over the MRB. These indices were calculated using daily rainfall estimates from January 2015 to December 2020. The statistical metrics used were the correlation coefficient (CC, Equation (1)), the root mean square error (RMSE, Equation (2)), and the bias (Equation (3)). These indices are useful for determining the ability of the products to estimate rainfall intensity [31]. Specifically, the CC measures linear relationships between two variables [32]. It is used to assess the strength and direction of the relationship between two variables; thus, the range for this coefficient is −1 to 1, representing a strong negative linear relationship and a strong positive linear relationship respectively. The RMSE exhibits the difference between a dataset and the reference dataset, and the optimal value is 0. The bias—in this case, the relative bias—is a measure of the systematic error in a dataset with respect to the observation dataset [33]. The optimal value for this metric is 0. The formulas used to calculate these indices can be found below:
where n is the total number of samples, PP is the amount of precipitation at pixel i as estimated with the PERSIANN datasets, and Ref is the precipitation at pixel i as estimated with IMERG Final.
The three categorical indices that were used to evaluate these products were the probability of detection (POD, Equation (4)), the false alarm ratio (FAR, Equation (5)), and the critical success index (CSI, Equation (6)). These indices were used to test the ability of the products to detect rain or no-rain pixels [31]. The POD was used to quantify the precipitation events that were correctly detected by the precipitation product [34]. Additionally, the FAR depicted the fraction of events detected by the precipitation product but not by the reference dataset [34]. Finally, the CSI combined the POD and FAR to assess the skill of the precipitation product [34]. The formulas for these indices can be found below:
where TP represents true positives or the number of instances in which the PERSIANN dataset captured rain over the same pixel as IMERG Final did. FP represents the number of instances in which the PERSIANN dataset being evaluated detected rain in a specific pixel where the reference dataset did not (or false positives). TN represents true negatives or the instances in which no precipitation was detected by IMERG Final or the PERSIANN dataset. Finally, FN reflects the number of instances in which the PERSIANN dataset did not detect rain but IMERG Final did (or false negatives).
The last part of the evaluation included the quantification of mean yearly precipitation for the entire study period to check which dataset captured the patterns of precipitation more closely to IMERG Final.
The second part of this study entailed studying trends in extreme precipitation indices. This work is crucial for understanding what impact these extreme events could have on the basin and delta. Climate data records are useful for this type of study, as they provide a long and stable record of precipitation estimates for the area of interest. PERSIANN-CDR, the climate data record developed by the CHRS, was used to perform a trend analysis of extreme precipitation indices from 1983 to 2020. Given the difference in precipitation amounts between the northern and southern parts of the basin, the MRB was divided into the UMRB and the LMRB for this part of the study. The eight different extreme indices that were calculated were the simple daily intensity index (SDII), R10mm, R10mmTOT, consecutive dry days (CDDs), consecutive wet days (CWDs), R95pTOT, R99pTOT, and PRCPTOT. The definitions of these indices can be found in Table 1.

Table 1.
Definitions of the extreme indices analyzed in this study. Eight extreme precipitation indices were chosen—specifically, SDII, R10mm, R10mmTOT, CDDs, CWDs, R95pTOT, R99pTOT, and PRCPTOT.
After calculating these annual extreme indices, a Mann–Kendall (MK) test was performed at a 0.05 significance level. The Mann–Kendall test is a non-parametric test to check for monotonic trends in data [35,36]. The null hypothesis of this test is that there is no significant monotonic trend present, and the alternative hypothesis is that there is a significant monotonic trend [35,36].
3. Results
3.1. Evaluation
The findings from the comparison between the two near-real-time products showed that PDIR-Now performed more similarly to IMERG Final than PERSIANN-CCS did. Specifically, PDIR-Now performed the best for four out of the six statistical and categorical indices. PDIR-Now had a higher CC than that of PERSIANN-CCS 0.62 and 0.58, respectively. This means that the spatial distribution of precipitation and the amount of precipitation of PDIR-Now corresponded better to those of IMERG Final than those of PERSIANN-CCS did. Furthermore, PDIR-Now had a lower RMSE (8.96 mm) than that of PERSIANN-CCS (9.72 mm). The only statistical index for which PERSIANN-CCS exhibited a better performance than that of PDIR-Now was the bias (0.10 and −0.19, respectively).
Three categorical indices were also computed to analyze the ability of the precipitation products to detect rain or no-rain pixels. In this case, PDIR-Now also performed better than PERSIANN-CCS when evaluated against IMERG Final. Specifically, PDIR-Now had a higher POD than that of PERSIANN-CCS (0.89 and 0.79) and a higher CSI (0.74 and 0.70, respectively). However, PERSIANN-CCS had a lower FAR (0.12) than that of PDIR-Now (0.18). These results are also shown in Table 2.

Table 2.
Statistical and categorical indices of both near-real-time satellite precipitation products (PDIR-Now and PERSIANN-CCS) when evaluated against IMERG Final from 2015 to 2020.
Even though PERSIANN-CDR could not be compared to the near-real-time products, PDIR-Now and PERSIANN-CCS, due to their differences in purpose, the statistical and categorical indices were also computed to assess if the product’s performance was satisfactory over the study area. PERSIANN-CDR’s performance was deemed satisfactory with a CC of 0.66, which was higher than 0.5. When evaluated against IMERG Final, the RMSE and bias of this product were 7.85 mm and 0.12, respectively. Furthermore, PERSIANN-CDR had an FAR of 0.22, which was lower than 0.5, a POD of 0.91, and a CSI of 0.72, which were both higher than 0.5. These results are also shown in Table 2.
The CC of PDIR-Now was high over the entire MRB, whereas the CC of PERSIANN-CCS was lower over the UMRB, as shown in Figure 2a,b. The RMSE of PDIR-Now was higher in the eastern part of the LMRB, whereas PERSIANN-CCS had a lower RMSE in that area. However, PDIR-Now showed a lower RMSE over the UMRB than that of PERSIANN-CCS (Figure 2d,e). Finally, PDIR-Now had a low bias across all of the UMRB, and PERSIANN-CCS showed some higher bias values in the northern area of the UMRB (Figure 2g,h).
PERSIANN-CDR had a high CC over the MRB, with higher values toward the eastern side of the LMRB and slightly lower values in the northern part of the UMRB, as shown in Figure 2c. Additionally, the RMSE was higher in the eastern part of the LMRB and lower in the UMRB and western area of the LMRB (Figure 2f). Finally, the bias was low throughout the MRB, with lower values in the LMRB and higher values in the UMRB, as shown in Figure 2i.
The POD of PDIR-Now was high across the basin, with slightly lower values over the delta, whereas in the case of PERSIANN-CCS, the POD had lower values than those of PDIR-Now, especially in the southern part of the UMRB and over the delta, as shown in Figure 3a,b. In the case of the FAR, PDIR-Now exhibited slightly higher values than those of PERSIANN-CCS, and both showed a similar spatial distribution, with higher values over the UMRB (Figure 3d,e). The CSI of PDIR-Now displayed higher values in the LMRB, just as the PERSIANN-CCS did (Figure 3g,h). The main difference in the CSI results between these two datasets occurred in the southern area of the UMRB and over the delta, where PERSIANN-CCS exhibited lower values than those of PDIR-Now. On the other hand, the POD of PERSIANN-CDR portrayed high values across the study area, as shown in Figure 3c. Its FAR values were low over the LMRB and the southern area of the UMRB, but they were higher in the northern part of the UMRB (Figure 3f). Finally, the CSI exhibited high values across the study area, with lower values toward the northern part of the UMRB, as displayed in Figure 3i.
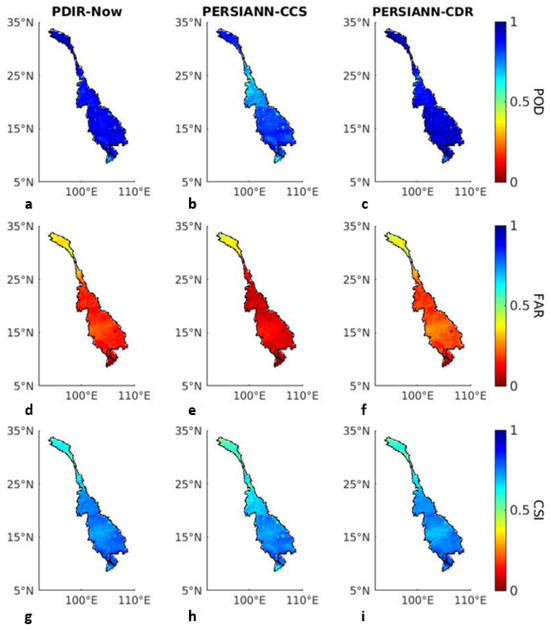
Figure 3.
Results for the categorical indices of PDIR-Now, PERSIANN CCS, and PERSIANN-CDR. The results of PDIR-Now for the POD, FAR, and CSI are shown in panels (a,d,g). The results of PERSIANN-CCS for the POD, FAR, and CSI are shown in panels (b,e,h). Finally, the results of PERSIANN-CDR for the POD, FAR, and CSI are shown in panels (c,f,i).
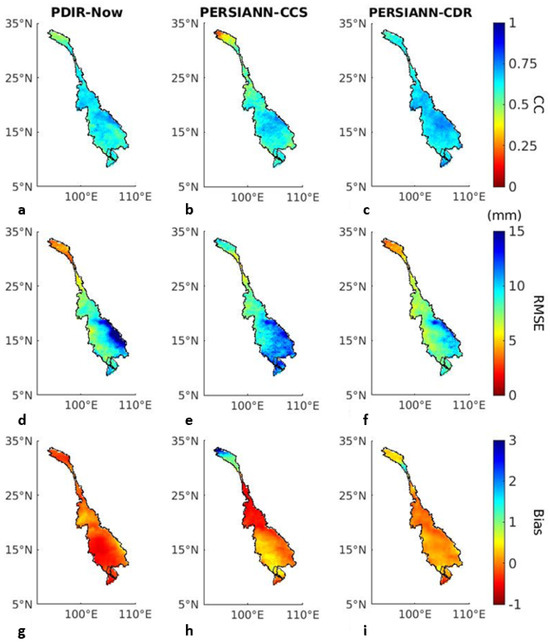
Figure 2.
Results for statistical indices from PDIR-Now, PERSIANN CCS, and PERSIANN-CDR. The results from PDIR-Now for CC, RMSE, and bias are shown in panels (a,d,g). The results from PERSIANN-CCS for CC, RMSE, and bias are shown in panels (b,e,h). Finally, the results from PERSIANN-CDR for CC, RMSE, and bias are shown in panels (c,f,i).
Additionally, the mean yearly precipitation estimate of PERSIANN-CCS (1577 mm) was the closest to that of IMERG Final (1580 mm). PDIR-Now underestimated the mean yearly precipitation with an estimate of 1263 mm. However, PDIR-Now captured the precipitation patterns in the area more closely to IMERG Final than PERSIANN-CCS did, as shown in Figure 4. PERSIANN-CCS heavily underestimated the precipitation in the southern region of the UMRB, and it heavily overestimated it in the northern part of the UMRB, as well as over the LMRB and delta, leading to a similar mean yearly precipitation estimate. On the other hand, PDIR-Now closely matched the precipitation pattern depicted by IMERG Final, which led to the conclusion that PDIR-Now was the better near-real-time product of the two for this study area. Furthermore, the performance of PERSIANN-CDR was deemed satisfactory given that the CC was greater than 0.5 and the bias was close to 0. The performance of PERSIANN-CDR in the categorical indices was also satisfactory, as the POD was greater than 0.9, the FAR was lower than 0.5, and the CSI was greater than 0.5. Moreover, as shown in Figure 4, the precipitation pattern was captured well by PERSIANN-CDR even though it overestimated the precipitation with an estimate of 1708 mm.
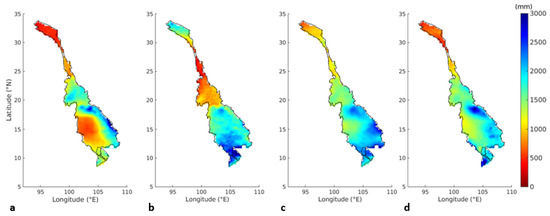
Figure 4.
Mean yearly precipitation as estimated by (a) PDIR-Now, (b) PERSIANN-CCS, (c) PERSIANN-CDR, and (d) IMERG Final from 2015 to 2020.
3.2. Trends in Extreme Precipitation Indices
In the analysis of trends in extreme indices, the significance level was 0.05, meaning that if the p-value obtained for a specific index was lower than the significance level, the trend was statistically significant, and if it was not, then there was no significant trend. In the case of the extreme indices over the UMRB, there were significant negative trends in the precipitation above the 95th and 99th percentiles, with p-values of 0.021 and 0.017, respectively. This meant that these two indices monotonically decreased yearly throughout the study period from 1983 to 2020. On the other hand, the only index that exhibited a significant trend was the consecutive number of wet days (CWD) or the length of wet spells over the LMRB, with a p-value of 0.017. The trend analysis results for all of the extreme indices can be found in Table 3 with their respective p-values.

Table 3.
Trend results over the UMRB and the LMRB. “T” shows if the indices exhibited a trend. A result of 1 means that there was a significant positive trend, 0 means that no significant trend was present, and −1 means that there was a significant negative trend. The indices that exhibited significant trends are shown in bold in the table. The p-values are also specified.
Moreover, the pixel-by-pixel results of the trend analysis of precipitation over the 95th percentile (Figure 5a) showed negative trends over the southern part of the UMRB. Even though these areas of significant negative trends were not the majority, there was been a negative trend in the mean of this index, as shown in Figure 5b. In the case of the precipitation over the 99th percentile, the pixel-by-pixel trend analysis showed some significant negative trends in the northern part of the UMRB and an area with a significant negative trend in the southern part of the UMRB (Figure 6a). Figure 6b shows a significant negative trend in the yearly mean for the entire UMRB. On the other hand, the pixel-by-pixel trend analysis results of the consecutive number of wet days (CWD) showed a positive trend in many areas in the northern part of the LMRB, as shown in Figure 7a. Finally, the positive trend in the mean of the CWD can also be seen in Figure 7b.
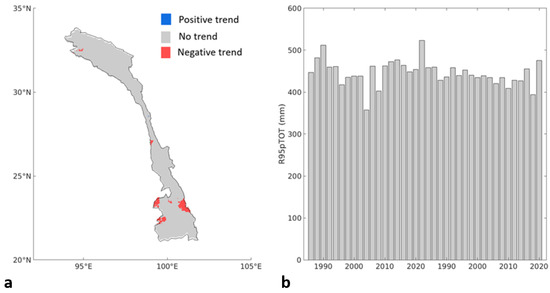
Figure 5.
(a) Spatial trend analysis results of extreme precipitation above the 95th percentile (R95pTOT) over the UMRB. (b) Trend analysis of the yearly mean extreme precipitation above the 95th percentile over the UMRB.
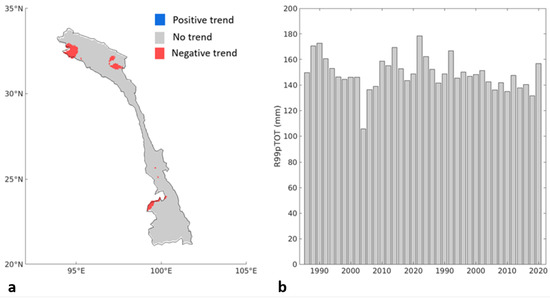
Figure 6.
(a) Spatial trend analysis results of extreme precipitation above the 99th percentile (R99pTOT) over the UMRB. (b) Trend analysis of the yearly mean extreme precipitation above the 99th percentile over the UMRB.
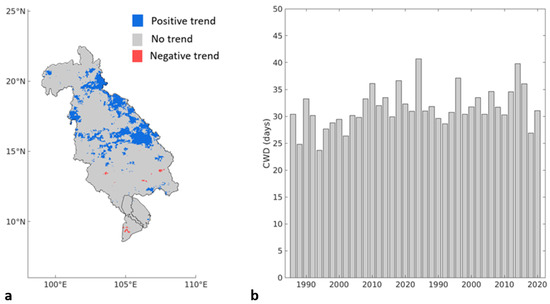
Figure 7.
(a) Spatial trend analysis results of the length of wet spells (CWD) over the LMRB. (b) Trend analysis of the yearly mean length of wet spells (CWD) over the LMRB.
On the other hand, the rest of the extreme indices did not show trends in the mean, as shown in Table 3. However, some significant trends were found in the spatial trend analysis. The trends found in the spatial analysis of the SDII included a decreasing trend in the north of the UMRB and an increasing trend in the southern part of the LMRB (Figure 8a,d). The R10mm and R10mmTOT indices increased in several areas of the LMRB (Figure 8e,f). Additionally, there were a few areas in the UMRB where the length of dry spells increased and others where the length of wet spells increased (Figure 8b,c).
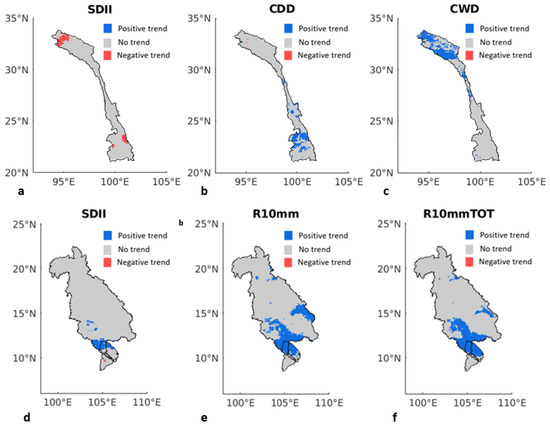
Figure 8.
Results of the spatial trend analysis of extreme indices over the UMRB: (a) SDII, (b) CDD, and (c) CWD. Results of the spatial trend analysis of extreme indices over the LMRB: (d) SDII, (e) R10mm, and (f) R10mmTOT. Only the indices for which spatial trends were found are shown.
Even though there were no significant trends found in the mean yearly precipitation over the UMRB or the LMRB, Figure 9a,b shows that there was a significant increasing trend in the northern part of the UMRB, as well as in some areas of the LMRB. Even though these trends existed, they were not captured in the mean of the yearly precipitation over the basins.
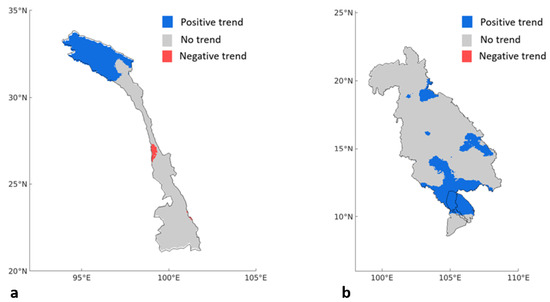
Figure 9.
(a) Spatial trend analysis of the mean annual precipitation from 1983 to 2020 over the UMRB. (b) Spatial trend analysis of the mean annual precipitation from 1983 to 2020 over the LMRB.
4. Discussion and Conclusions
The first goal of this study was to assess which CHRS near-real-time satellite precipitation product performed best over the MRB when evaluated against IMERG Final. We met this goal by using daily data from PERSIANN-CCS, PDIR-Now, and IMERG Final from 2015 to 2020 to calculate the CC, RMSE, bias, POD, FAR, and CSI, as well as by analyzing the mean yearly precipitation patterns and amounts. From the first part of the study, we concluded that PDIR-Now performed better than PERSIANN-CCS, as it outperformed PERSIANN-CCS in four out of the six indices and captured the patterns of precipitation more accurately. Furthermore, PDIR-Now and PERSIANN-CCS have also been evaluated by researchers from the CHRS over the Russian River Basin in California, USA [34]. In this study, PDIR-Now also outperformed PERSIANN-CCS [37]. This showed that PDIR-Now is an improvement by the CHRS from the older near-real-time precipitation product PERSIANN-CCS. PERSIANN-CDR was included in the evaluation to assess its performance, and it showed satisfactory results by meeting the set thresholds and closely capturing the mean yearly precipitation patterns over the study area.
The second goal of the study was to separately analyze trends in extreme indices over the LMRB and UMRB. This trend analysis was performed using the CHRS climate data records (PERSIANN-CDR) from 1983 to 2020 to perform a Mann–Kendall test with a significance level of 0.05. The extreme indices selected were SDII, R10mm, R10mmTOT, CDD, CWD, R95pTOT, R99pTOT, and PRCPTOT. The findings from this trend analysis included the following:
- -
- Decreasing trends over the UMRB in the mean of the precipitation above the 95th and 99th percentiles (R95pTOT and R99pTOT).
- -
- A decreasing trend in R95pTOT over the southern part of the UMRB.
- -
- A decrease in R99pTOT over the northern part of the UMRB during the study period.
- -
- An increasing trend in the mean of the length of wet spells (CWD) over the LMRB, as well as in several areas of the UMRB, during the study period.
- -
- An increasing trend in yearly precipitation in areas of the UMRB and LMRB but not in the yearly mean.
- -
- An increasing trend in the intensity of rainfall (SDII) over the southern part of the LMRB and a decreasing trend over the north of the UMRB.
- -
- Positive trends in the number of days with precipitation greater than or equal to 10 mm, as well as the amount of precipitation on these days (R10mm and R10mmTOT) in areas of the LMRB.
- -
- An increasing length of dry spells (CDD) over the southern part of the UMRB and increasing length of wet spells (CWD) over the northern part of the UMRB.
The results of the trend analysis of the extreme precipitation indices matched those of [12], where a decreasing trend in extreme precipitation over the 95th and 99th percentiles over the UMRB was found. Ref. [13] found decreasing trends in extreme precipitation over the 95th percentile and in the CWD over the UMRB. They also found an increasing trend in the CWD over the LMRB, as our study did [13]. The main explanation for the disparity in some results could be the difference in the datasets used. The two studies mentioned above used APHRODITE, a gridded gauge measurement dataset, whereas this study used a satellite precipitation dataset. The differences in the nature of these datasets could have caused the trends found to differ. Furthermore, the time periods of the two studies mentioned were different from that in this study. Specifically, the authors of [12,13] studied trends in extremes from 1952 to 2015, which was the period that APHRODITE spanned, whereas the study period of this work was from 1983 to 2020. Ref. [14] found that the annual precipitation significantly decreased over the UMRB from 2000 to 2013, with a significance level of 0.05 [14]. Ref. [15] found that the CDD decreased from 1960 to 2012 in the Yunnan Province in China, which is close to the UMRB. They also found a decreasing trend in the CWD [15]. These results were obtained using gauge data and during a different time period, which can explain the differences in the findings. Ref. [16] used 12 gauge stations around the delta to check for trends in extreme indices. Even though none of these indices matched those in this study, they found downward trends in days with precipitation of over 20 and 100 mm of rainfall [16]. Moreover, no trends were found over the delta in this study when using PERSIANN-CDR. Overall, the results of this study agree with those of past studies and can be used to understand how trends have changed since the earlier findings provided by past studies.
Finally, this study found PDIR-Now to be the best-suited near-real-time PERSIANN precipitation product for the MRB. This product performed the best in the study area when evaluated against IMERG Final for four out of the six extreme indices. Furthermore, PDIR-Now captured the yearly precipitation patterns in the study area more accurately than PERSIANN-CCS did. The long-term dataset, PERSIANN-CDR, also performed well in the study area and was deemed suitable for studies such as trend analyses. Moreover, the results of the trend analysis exhibited a decreasing trend in the 95th and 99th percentiles over the UMRB and an increasing trend in the length of wet spells over the LMRB. Accurate precipitation estimates in this area are crucial due to the significant impact that changes in precipitation can have.
Author Contributions
Conceptualization, P.N.; methodology, C.J.A.; software, C.J.A.; validation, C.J.A.; formal analysis, C.J.A. and P.N.; investigation, C.J.A.; resources, P.N.; data curation, C.J.A.; writing—original draft preparation, C.J.A.; writing—review and editing, V.D., V.A.G. and R.S.A.; visualization, C.J.A.; supervision, P.N.; project administration, P.N.; funding acquisition, P.N. All authors have read and agreed to the published version of the manuscript.
Funding
This research was funded by the UK Research and Innovation Global Challenges Research Fund (GCRF) (grant number: NES0089261) for the Living Deltas Hub, as well as the NASA Shared Services Center (NSSC) (grant number 80NSSC21K1668). The work was also funded by the Civil and Environmental Engineering (CEE) department at the University of California, Irvine through the CEE Graduate Fellowship in Areas of National Need (CEE GAANN) fellowship. This research was also funded by Future Investigators in NASA and Space Science and Technology (NNH19ZDA001N-FINESST), Center for Western Weather and Water Extremes (CW3E) at the Scripps Institution of Oceanography via the AR Program Phase II Grant 4600013361 sponsored by the California Department of Water Resources. This research was funded by NASA Grant 80NSSC19K0726, National Oceanic and Atmospheric Administration (ST133017CQ0058) with Riverside Technology, Inc., and NVIDIA Academic Hardware Grant Program. Finally, this research was also funded by Researchers Supporting Project number (RSP2023R310), King Saud University, Riyadh, Saudi Arabia.
Institutional Review Board Statement
Not applicable.
Informed Consent Statement
Not applicable.
Data Availability Statement
The data are available in a publicly accessible repository that does not issue DOIs. Publicly available datasets were analyzed in this study. These data can be found here: https://chrsdata.eng.uci.edu/ accessed on 10 January 2022.
Conflicts of Interest
The authors declare that they have no conflict of interest.
Abbreviations
The following abbreviations are used in this manuscript:
| APHRODITE | Asian Precipitation—Highly Resolved Observational Data Integration |
| Towards Evaluation | |
| CC | Correlation coefficient |
| CDD | Consecutive dry days |
| CHRS | Center for Hydrometeorology and Remote Sensing |
| CMDSSS | China Meteorological Data Sharing Service System |
| CSI | Critical success index |
| CWD | Consecutive wet days |
| ERA5 | European Centre for Medium-Range Weather Forecast Reanalysis 5 |
| FAR | False alarm ratio |
| IMERG | Integrated Multi-satellitE Retrievals for Global Precipitation Measurement |
| LMRB | Lower Mekong Basin and Delta |
| MRB | Mekong River Basin and Delta |
| NOAA | National Oceanic and Atmospheric Administration |
| PERSIANN | Precipitation Estimation from Remotely Sensed Information using Artificial |
| Neural Networks | |
| PDIR-Now | PERSIANN Dynamic Infrared in near-real-time |
| PERSIANN-CCS | PERSIANN—Cloud Classification System |
| POD | Probability of detection |
| RMSE | Root-mean-squared error |
| SDII | Simple daily intensity index |
| TMPA | Tropical Rainfall Measuring Mission Multi-Satellite Precipitation Analysis |
| UMRB | Upper Mekong Basin |
References
- AghaKouchak, A.; Nakhjiri, N. A near Real-Time Satellite-Based Global Drought Climate Data Record. Environ. Res. Lett. 2012, 7, 044037. [Google Scholar] [CrossRef]
- Sarojini, B.B.; Stott, P.A.; Black, E. Detection and Attribution of Human Influence on Regional Precipitation. Nat. Clim. Chang. 2016, 6, 669–675. [Google Scholar] [CrossRef]
- Sun, Q.; Miao, C.; Duan, Q.; Ashouri, H.; Sorooshian, S.; Hsu, K. A Review of Global Precipitation Data Sets: Data Sources, Estimation, and Intercomparisons. Rev. Geophys. 2018, 56, 79–107. [Google Scholar] [CrossRef]
- Zhang, J.; Howard, K.; Langston, C.; Kaney, B.; Qi, Y.; Tang, L.; Grams, H.; Wang, Y.; Cocks, S.; Martinaitis, S.; et al. Multi-Radar Multi-Sensor (MRMS) Quantitative Precipitation Estimation: Initial Operating Capabilities. Bull. Am. Meteorol. Soc. 2016, 97, 621–638. [Google Scholar] [CrossRef]
- McRoberts, D.B.; Nielsen-Gammon, J.W. Detecting Beam Blockage in Radar-Based Precipitation Estimates. J. Atmos. Ocean. Technol. 2017, 34, 1407–1422. [Google Scholar] [CrossRef]
- Faridzad, M.; Yang, T.; Hsu, K.; Sorooshian, S.; Xiao, C. Rainfall Frequency Analysis for Ungauged Regions Using Remotely Sensed Precipitation Information. J. Hydrol. 2018, 563, 123–142. [Google Scholar] [CrossRef]
- Wang, W.; Lu, H.; Zhao, T.; Jiang, L.; Shi, J. Evaluation and Comparison of Daily Rainfall From Latest GPM and TRMM Products Over the Mekong River Basin. IEEE J. Sel. Top. Appl. Earth Obs. Remote Sens. 2017, 10, 2540–2549. [Google Scholar] [CrossRef]
- Fang, J.; Yang, W.; Luan, Y.; Du, J.; Lin, A.; Zhao, L. Evaluation of the TRMM 3B42 and GPM IMERG Products for Extreme Precipitation Analysis over China. Atmos. Res. 2019, 223, 24–38. [Google Scholar] [CrossRef]
- Nguyen, L.B.; Quang Do, V. Accuracy of Integrated Multi-SatelliE Retrievalsfor GPM Satellite Rainfall Productover North Vietnam. Pol. J. Environ. Stud. 2021, 30, 5657–5667. [Google Scholar] [CrossRef]
- Ang, R.; Kinouchi, T.; Zhao, W. Evaluation of Daily Gridded Meteorological Datasets for Hydrological Modeling in Data-Sparse Basins of the Largest Lake in Southeast Asia. J. Hydrol. Reg. Stud. 2022, 42, 101135. [Google Scholar] [CrossRef]
- Yu, L.; Leng, G.; Python, A.; Peng, J. A Comprehensive Evaluation of Latest GPM IMERG V06 Early, Late and Final Precipitation Products across China. Remote Sens. 2021, 13, 1208. [Google Scholar] [CrossRef]
- Liu, L.; Bai, P.; Liu, C.; Tian, W.; Liang, K. Changes in Extreme Precipitation in the Mekong Basin. Adv. Meteorol. 2020, 2020, 8874869. [Google Scholar] [CrossRef]
- Irannezhad, M.; Liu, J.; Chen, D. Extreme precipitation variability across the Lancang-Mekong River Basin during 1952–2015 in relation to teleconnections and summer monsoons. Int. J. Climatol. 2021, 42, 2614–2638. [Google Scholar] [CrossRef]
- Wu, F.; Wang, X.; Cai, Y.; Li, C. Spatiotemporal Analysis of Precipitation Trends under Climate Change in the Upper Reach of Mekong River Basin. Quat. Int. 2016, 392, 137–146. [Google Scholar] [CrossRef]
- Li, Y.-G.; He, D.; Hu, J.-M.; Cao, J. Variability of Extreme Precipitation over Yunnan Province, China 1960–2012: Variability of Extreme Precipitation over Yunnan Province. Int. J. Climatol. 2015, 35, 245–258. [Google Scholar] [CrossRef]
- Lee, S.K.; Dang, T.A. Extreme Rainfall Trends over the Mekong Delta under the Impacts of Climate Change. IJCCSM 2020, 12, 639–652. [Google Scholar] [CrossRef]
- Economy of the Mekong River. Available online: https://www.britannica.com/place/Mekong-River/Economy (accessed on 10 December 2022).
- Climate. Available online: http://www.mrcmekong.org/about/mekong-basin/climate/ (accessed on 10 December 2022).
- The Role of the Mekong River in the Economy. Available online: https://d2ouvy59p0dg6k.cloudfront.net/downloads/key_findings_mekong_river_in_the_economy.pdf (accessed on 16 August 2022).
- Mekong River in the Economy. Available online: https://greatermekong.panda.org/our_solutions/mekongintheeconomy/ (accessed on 10 December 2022).
- Chinvanno, S.; Souvannalath, S.; Kerdsuk, V.; Thuan, N.T.H. Climate Risks and Rice Farming in the Lower Mekong River Countries. AIACC Work. Pap. 2006, 42, 1–40. [Google Scholar]
- Nguyen, P.; Ombadi, M.; Gorooh, V.A.; Shearer, E.J.; Sadeghi, M.; Sorooshian, S.; Hsu, K.; Bolvin, D.; Ralph, M.F. PERSIANN Dynamic Infrared–Rain Rate (PDIR-Now): A Near-Real-Time, Quasi-Global Satellite Precipitation Dataset. J. Hydrometeorol. 2020, 21, 2893–2906. [Google Scholar] [CrossRef]
- Hong, Y.; Gochis, D.; Cheng, J.; Hsu, K.; Sorooshian, S. Evaluation of PERSIANN-CCS Rainfall Measurement Using the NAME Event Rain Gauge Network. J. Hydrometeorol. 2007, 8, 469–482. [Google Scholar] [CrossRef]
- Ashouri, H.; Hsu, K.-L.; Sorooshian, S.; Braithwaite, D.K.; Knapp, K.R.; Cecil, L.D.; Nelson, B.R.; Prat, O.P. PERSIANN-CDR: Daily Precipitation Climate Data Record from Multisatellite Observations for Hydrological and Climate Studies. Bull. Am. Meteorol. Soc. 2015, 96, 69–83. [Google Scholar] [CrossRef]
- Nguyen, P.; Shearer, E.J.; Tran, H.; Ombadi, M.; Hayatbini, N.; Palacios, T.; Huynh, P.; Braithwaite, D.; Updegraff, G.; Hsu, K.; et al. The CHRS Data Portal, an Easily Accessible Public Repository for PERSIANN Global Satellite Precipitation Data. Sci. Data 2019, 6, 180296. [Google Scholar] [CrossRef] [PubMed]
- Chen, C.; Chen, Q.; Duan, Z.; Zhang, J.; Mo, K.; Li, Z.; Tang, G. Multiscale Comparative Evaluation of the GPM IMERG v5 and TRMM 3B42 v7 Precipitation Products from 2015 to 2017 over a Climate Transition Area of China. Remote Sens. 2018, 10, 944. [Google Scholar] [CrossRef]
- Xu, F.; Guo, B.; Ye, B.; Ye, Q.; Chen, H.; Ju, X.; Guo, J.; Wang, Z. Systematical Evaluation of GPM IMERG and TRMM 3B42V7 Precipitation Products in the Huang-Huai-Hai Plain, China. Remote Sens. 2019, 11, 697. [Google Scholar] [CrossRef]
- Yuan, F.; Wang, B.; Shi, C.; Cui, W.; Zhao, C.; Liu, Y.; Ren, L.; Zhang, L.; Zhu, Y.; Chen, T.; et al. Evaluation of Hydrological Utility of IMERG Final Run V05 and TMPA 3B42V7 Satellite Precipitation Products in the Yellow River Source Region, China. J. Hydrol. 2018, 567, 696–711. [Google Scholar] [CrossRef]
- Zhang, S.; Wang, D.; Qin, Z.; Zheng, Y.; Guo, J. Assessment of the GPM and TRMM Precipitation Products Using the Rain Gauge Network over the Tibetan Plateau. J. Meteorol. Res. 2018, 32, 324–336. [Google Scholar] [CrossRef]
- Huffman, G.J.; Bolvin, D.T.; Braithwaite, D.; Hsu, K.-L.; Joyce, R.J.; Kidd, C.; Nelkin, E.J.; Sorooshian, S.; Stocker, E.F.; Tan, J.; et al. Integrated multi-satellite retrievals for the Global Precipitation Measurement (GPM) mission (IMERG). Adv. Glob. Chang. Res. 2020, 1, 343–353. [Google Scholar] [CrossRef]
- Sadeghi, M.; Asanjan, A.A.; Faridzad, M.; Nguyen, P.; Hsu, K.; Sorooshian, S.; Braithwaite, D. PERSIANN-CNN: Precipitation Estimation from Remotely Sensed Information Using Artificial Neural Networks–Convolutional Neural Networks. J. Hydrometeorol. 2019, 20, 2273–2289. [Google Scholar] [CrossRef]
- Benesty, J.; Chen, J.; Huang, Y.; Cohen, I. Pearson Correlation Coefficient. In Noise Reduction in Speech Processing, Proceedings of Springer Topics in Signal Processing; Springer: Berlin/Heidelberg, Germany, 2009; Volume 2, pp. 1–4. [Google Scholar] [CrossRef]
- Seastrom, M.; Kaufman, S.; Lee, R. Appendix B: Evaluating the Impact of Imputations for Item Nonresponse; National Center for Education Statistics: Washington, DC, USA, 2002. Available online: https://nces.ed.gov/statprog/2002/appendixb.asp (accessed on 7 December 2023).
- AghaKouchak, A.; Mehran, A. Extended contingency table: Performance metrics for satellite observations and climate model simulations. Water Resour. Res. 2013, 49, 7144–7149. [Google Scholar] [CrossRef]
- Mann, H.B. Nonparametric Tests Against Trend. Econometrica 1945, 13, 245. [Google Scholar] [CrossRef]
- Mann-Kendall Test for Monotonic Trend. Available online: https://vsp.pnnl.gov/help/vsample/design_trend_mann_kendall.htm (accessed on 12 August 2022).
- Gorooh, V.A.; Shearer, E.J.; Nguyen, P.; Hsu, K.; Sorooshian, S.; Cannon, F.; Ralph, M. Performance of New Near-Real-Time PERSIANN Product (PDIR-Now) for Atmospheric River Events over the Russian River Basin, California. J. Hydrometeorol. 2022, 23, 1899–1911. [Google Scholar] [CrossRef]
Disclaimer/Publisher’s Note: The statements, opinions and data contained in all publications are solely those of the individual author(s) and contributor(s) and not of MDPI and/or the editor(s). MDPI and/or the editor(s) disclaim responsibility for any injury to people or property resulting from any ideas, methods, instructions or products referred to in the content. |
© 2023 by the authors. Licensee MDPI, Basel, Switzerland. This article is an open access article distributed under the terms and conditions of the Creative Commons Attribution (CC BY) license (https://creativecommons.org/licenses/by/4.0/).