Article

The Correspondence between Large Pressure Fluctuations and Runway Wind Shear: The Event on 12 December 2019 at Songshan Airport, Taipei

1
Chinese Meteorological and Environmental Research and Development Center, Taipei 110202, Taiwan
2
Department of Earth Sciences, National Taiwan Normal University, Taipei 11677, Taiwan
*
Author to whom correspondence should be addressed.
Atmosphere 2023, 14(12), 1773; https://doi.org/10.3390/atmos14121773
Submission received: 25 September 2023 / Revised: 24 November 2023 / Accepted: 24 November 2023 / Published: 30 November 2023
(This article belongs to the Section Meteorology)

Abstract

:
In this study, the association of large pressure fluctuations (LPFs) ≥ 0.2 hPa and runway wind shear (RWS) ≥ 12 kt at the Songshan Airport in Taipei, Taiwan, during the event on 12 December 2019 with strong northeasterly winds are analyzed. The goal of the study is to demonstrate that the two phenomena exhibited close correspondence, and the former (LPFs) measured using a single barometer can be useful to detect the latter (RWS), which relies on the low-level wind-shear alert system (LLWAS) at the present time. Concentrated before 1200 UTC and especially during 0100-0800 UTC, both LPFs (52 times) and RWS (62 times) over the runway exhibited close association, and one rarely occurred more than 15–20 min apart in time from the other. Using the 2 × 2 contingency table and categorical scores, our results for LPFs and RWS to both occur at least once or five times within the same hour also suggest high accuracy rates of ≥80% and low miss rate and false alarm ratio of both < 10%, respectively. The two variables are also tested to be statistically dependent on each other to a high confidence level of 95–97.5%. Thus, using LPFs as an auxiliary or additional method to detect RWS at airports appears to be reasonable and feasible. At small and remote airports where the LLWAS is not yet available, this method also provides a good and less expensive alternative and can be helpful to the overall improvement of air traffic safety around the world.

1. Introduction

In meteorology, wind shear (WS) refers to the change in wind speed or direction, or both, across any distance (in the horizontal, vertical, or both). Thus, it can be expressed as ΔVS, where ΔV and ΔS are the differences in wind vector and location vector, respectively. Wind shear may occur at any level in the atmosphere and create turbulence between the two air currents with different speeds and/or directions. At and near airports, low-level WS near the surface (below 500 m) across short distances along the runway is of major concern, as it can pose a serious threat to flight safety, especially during takeoff, landing, and final approach when the speed and height of aircraft are close to critical safety values. Over the runway, WS can cause headwinds or tailwinds to suddenly strengthen or weaken and even intense downdraft and severe WS has caused aircraft accidents and loss of lives in the past, e.g., [1,2]. However, local WS at airports is a small-scale, complex meteorological phenomenon that is not explicitly predicted but only parameterized in operational models, e.g., [3,4,5], and thus is difficult to predict precisely in advance. At present, there is no mature scientific method to forecast low-level WS accurately, so its occurrence at airports must be monitored constantly in real time. This mainly relies on the Low-Level Wind-shear Alert System (LLWAS), which measures surface winds at different parts of airports (mainly along runways) by a network of anemometers. Once WS is detected, warnings are issued to alert the pilots to pay special attention, and the runway may even be closed in severe conditions to ensure flight safety.
For takeoff and landing, airplane pilots usually choose a runway with headwind conditions (against the wind) and switch to the opposite runway direction if tailwinds exceed 12 kt. However, when local winds are affected by terrain or weather systems, an airplane may experience a headwind or a tailwind WS even when a steady headwind is anticipated. The headwind WS means an increase in headwind speed (or a decrease in tailwind speed) and, thus, an increase in airspeed and lift, causing the altitude to increase above the ideal rate of descent (or climb). Conversely, the tailwind WS does the opposite and causes a reduction (or even loss) in lift, which obviously can be hazardous. Thus, severe WS must be treated with caution or avoided, particularly during landing, as it can result in a missed approach, pull-up, and retry, or even an early landing crash [1,2].
In meteorology, it is well known that the greater the pressure gradient between two locations (at the same height), the stronger the wind under balanced conditions. At large and synoptic scales, however, quasi-balanced conditions also mean that the acceleration and, thus, changes in winds are small and gradual with time and distance. Thus, local winds change mainly in response to the changes in pressure gradient at meso- and micro-scales over shorter time periods. Strong WS over short distances (with respect to runways) is often caused by intense weather systems, such as microbursts, downbursts, and gust fronts associated with severe thunderstorms, squall lines, and bow echoes, etc., e.g., [1,6]. These systems produce not only WS but also other accompanying phenomena, such as sudden jumps in pressure, e.g., [7]. When a gust front passes by, pressure fluctuations, temperature drops, sudden increases in wind speed, and changes in wind direction all occur, and low-level WS further appears [8]. In its documents on low-level WS, the International Civil Aviation Organization (ICAO) also recognizes that pressure jumps can detect passages of gust fronts [9]. Inside the planetary boundary layer (PBL), in addition, small-scale and pulse-like pressure fluctuations play an important role in the interaction between the land surface and the atmosphere [10] and are considered to be one of the characteristics of the PBL [11]. Local winds near the surface also change in response to these fluctuations over time and contribute considerably to the turbulent kinetic energy [12]. Thus, many past studies have shown that pressure fluctuations are important features that accompany WS occurrences, e.g., [13]. However, such a close association of air pressure to surface winds has yet to be applied to the detection and warning of low-level WS at airports, and this relationship and possibility are the focal points of the present work. That is, we aim to show a close correspondence between the occurrences of rapid pressure changes and local low-level wind shear at the Songshan Airport of Taipei, Taiwan, in a selected event. Such a topic is obviously highly relevant to flight safety.
In Taiwan, several studies in the past have also discussed the occurrences of low-level WS and its relationship with pressure changes. For example, [14] found that low-level WS at the Songshan Airport of Taipei are caused by gusts from thunderstorms and gale winds associated with typhoons [15,16], frontal passages [17], and northeasterly monsoon flow surges [18]. In these case studies and [19] that analyzed records over multiple years at the Songshan Airport, low-level WS is found to correlate to temporal fluctuations in surface pressure. At the Nangan Airport located on the island of Matsu, at a short distance just off the coast of southeastern China, a similar relationship between WS and larger pressure fluctuation has also been observed [20,21]. To our knowledge, however, the two phenomena of surface local pressure fluctuations and low-level WS at airports have not been properly demonstrated to be closely linked in the international literature, so the present work also serves to fill this apparent gap.
Following the above results, we further examine the correspondence and relationship between large pressure fluctuations and runway WS at the Songshan Airport in Taipei during the event of strong northeasterly winds on 12 December 2019. In the remainder of this paper, our data and methodology are described in Section 2, and the results and analyses are presented in Section 3 and discussed further in Section 4 with statistical tests. Finally, in Section 5, the conclusions are given, and future works are offered.

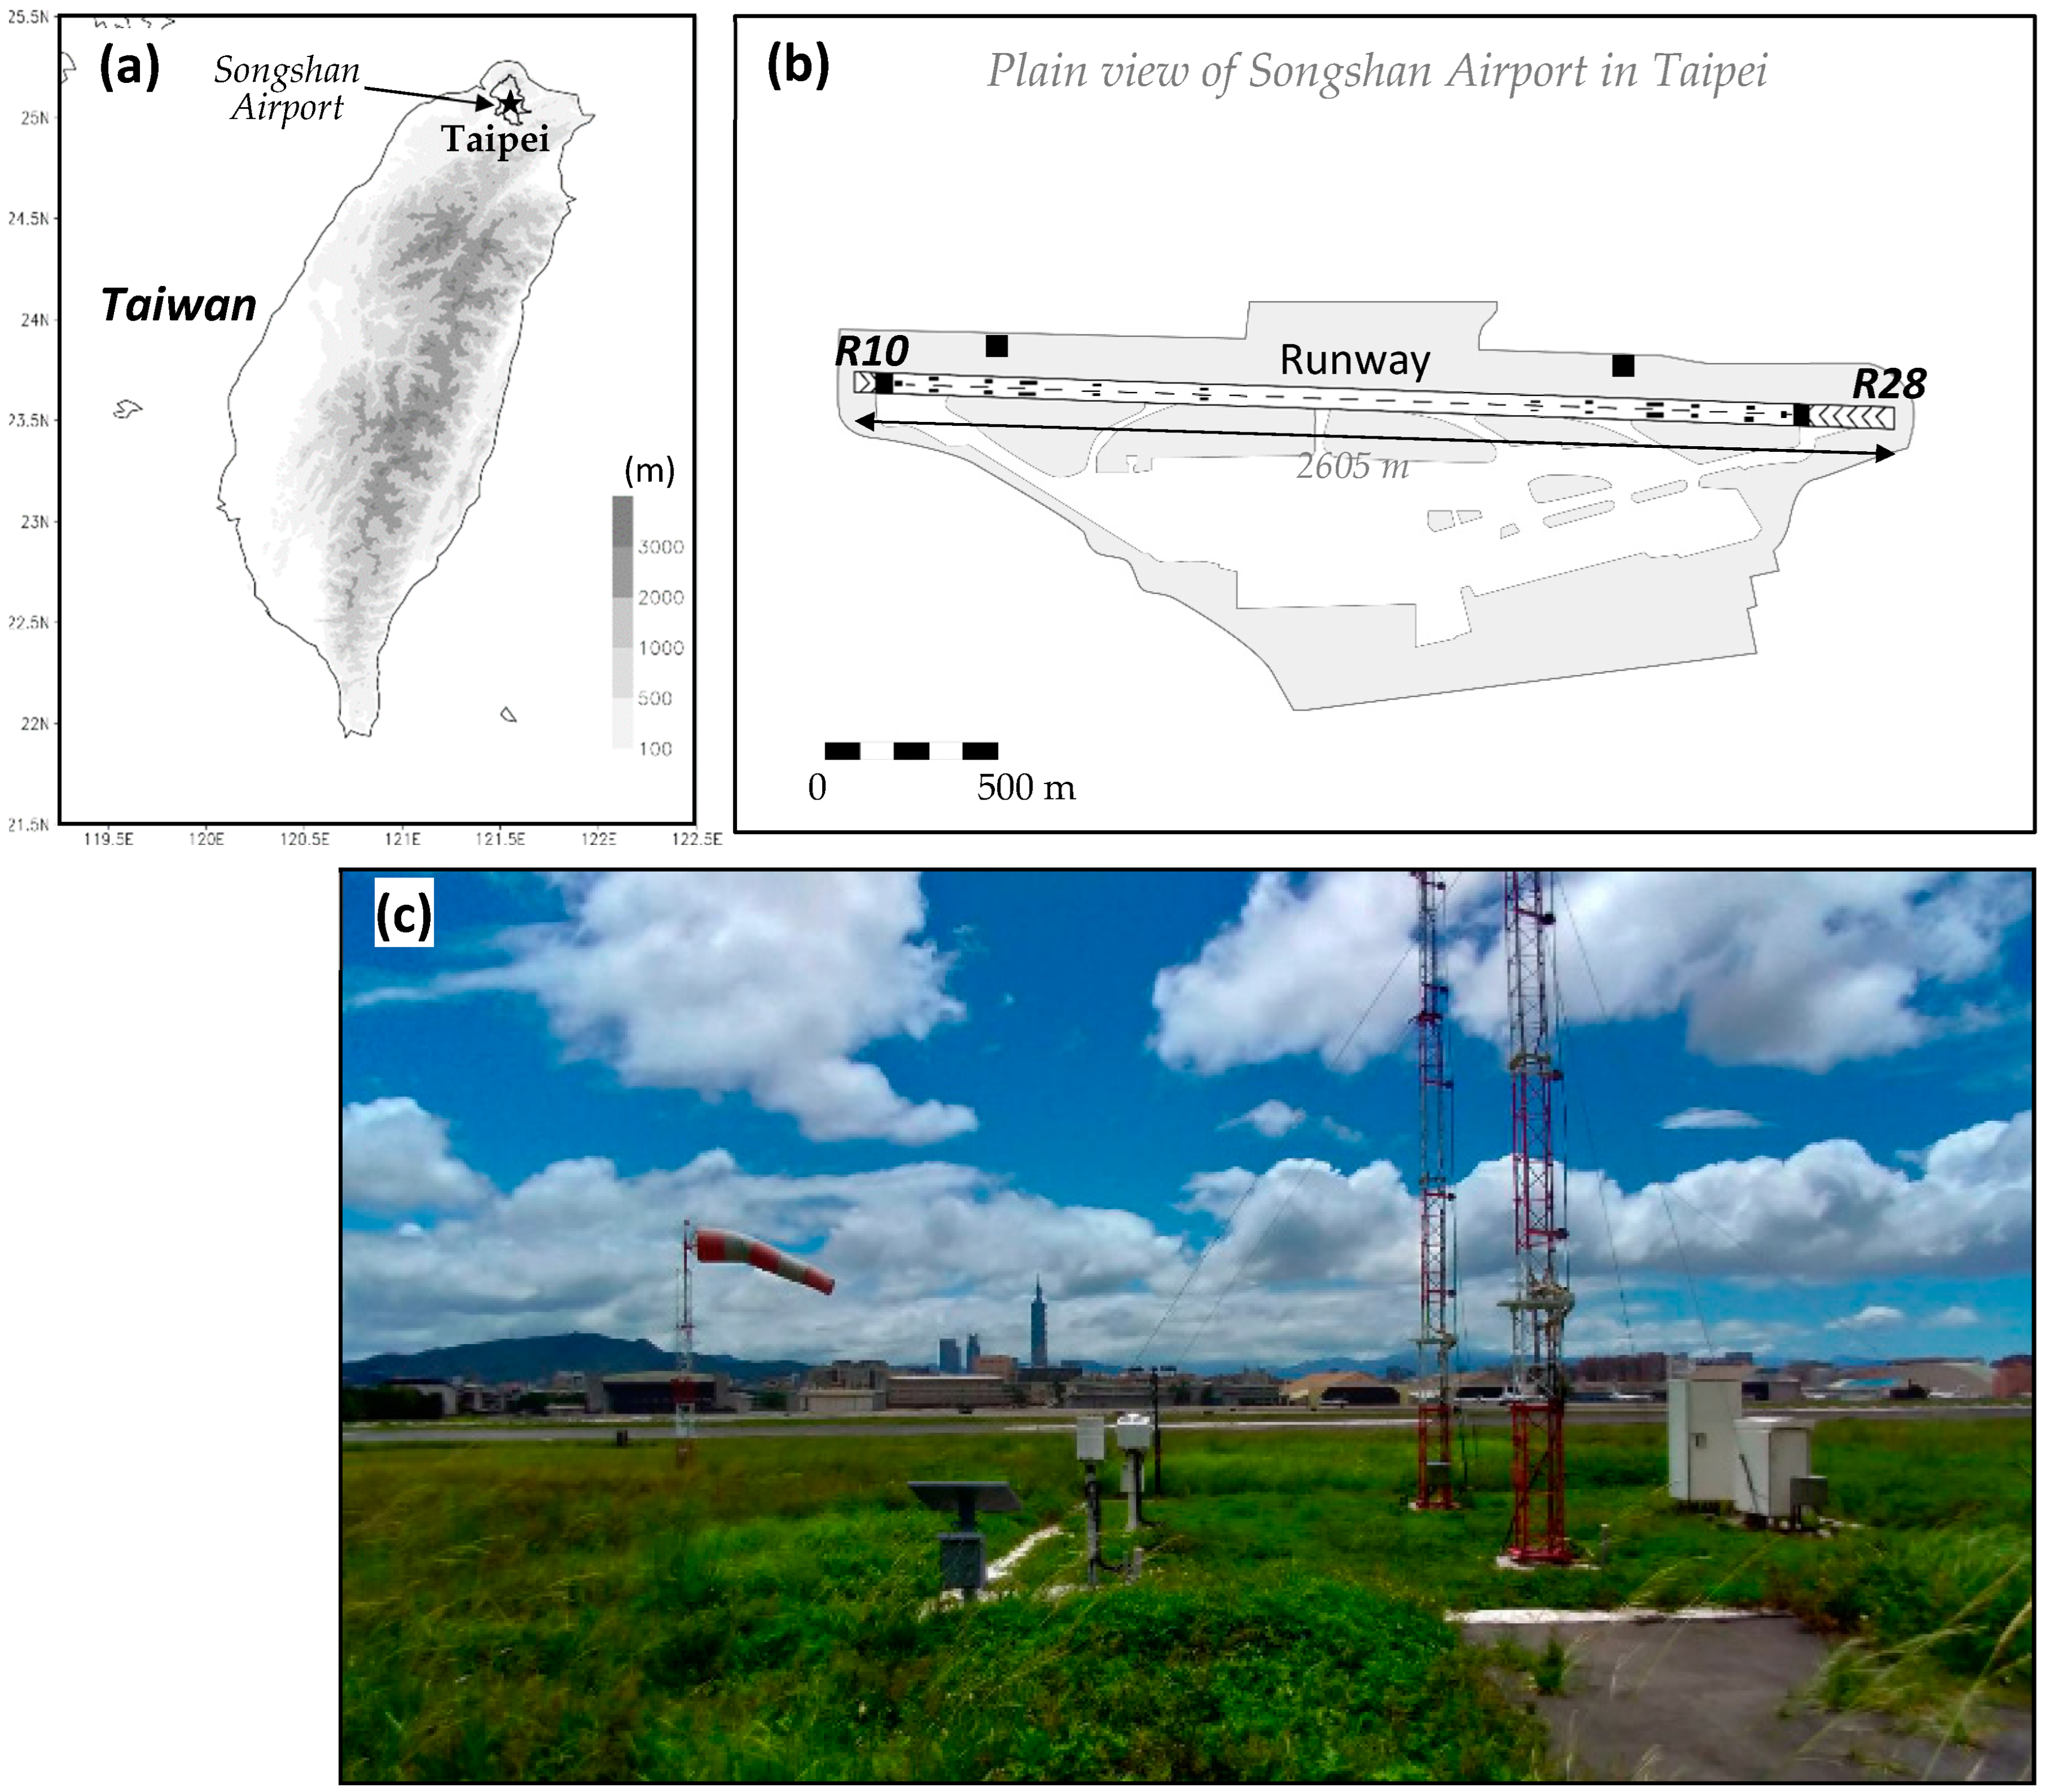
2. Data and Methodology

The primary data used in this study are the pressure and wind measurements every 10 s from the Automatic Weather Observation System (AWOS) at the Songshan Airport (Figure 1a) on 12 December, from 0000 to 1200 UTC, to cover the event from start to finish. The Songshan Airport is the secondary airport that serves the Taipei metropolitan area after the Taoyuan International Airport and is mainly for domestic services. Its runway is orientated in the direction of 100–280° with a length of 2605 m (Figure 1b). Installed and maintained by the Air Navigation and Weather Services (ANWS) of the Civil Aviation Administration (CAA) in Taiwan, the AWOS includes a wind anemometer and barometer at both ends of the runway, designated as R10 (west runway head, i.e., the headwind would be from 100°) and R28 (east runway head), respectively (Figure 1b,c). These observations are routinely used by the airport authorities to issue weather reports. The difference between wind vectors at these two sites is the wind shear vector. In practice, the wind vectors at both ends are projected onto the runway direction (opposite to each other), so the absolute value of their sum, called the Runway Vector WS (RVWS), is the WS actually faced by an aircraft during takeoff and landing along its flight path. The ICAO has recommended that WS warnings be issued when the RVWS exceeds 15 kt (approximately 7.5 m s−1) within a distance of fewer than 4 km along the runway. As both the runway length and the distance between the two measuring sites are considerably shorter than 4 km, the runway wind shear (RWS) is defined and used here when the RVWS exceeds 12 kt, as in earlier studies [14,15,16,17,18,19].
In terms of sensitivity, the AWOS provides data rounded down to 0.1 hPa for pressure, 0.1 kt for wind speed, and 1° for wind direction, respectively. For pressure, successive records 10 s apart are used to compute pressure fluctuations in time. For our purpose, only absolute values of non-zero pressure changes are considered. As the pressure values are recorded to one place below decimal, the large pressure fluctuation (LPF) is defined when the fluctuation reaches 0.2 hPa, which is close to the standard deviation of the (non-zero) data obtained by [19] using data over 5 years (2010–2014).
As reviewed above, when pressure changes with time, the wind also changes in response. Thus, pressure fluctuations at a single site can reflect changes in pressure and pressure gradient produced by systems of local and small scales with time. Using data from just one barometer, its accuracy and calibration are less of a potential problem. Next, in Section 3, the correspondence between the occurrences of LPF and RWS at the Songshan Airport during the event on 12 December 2019 is analyzed.

3. Results and Analysis

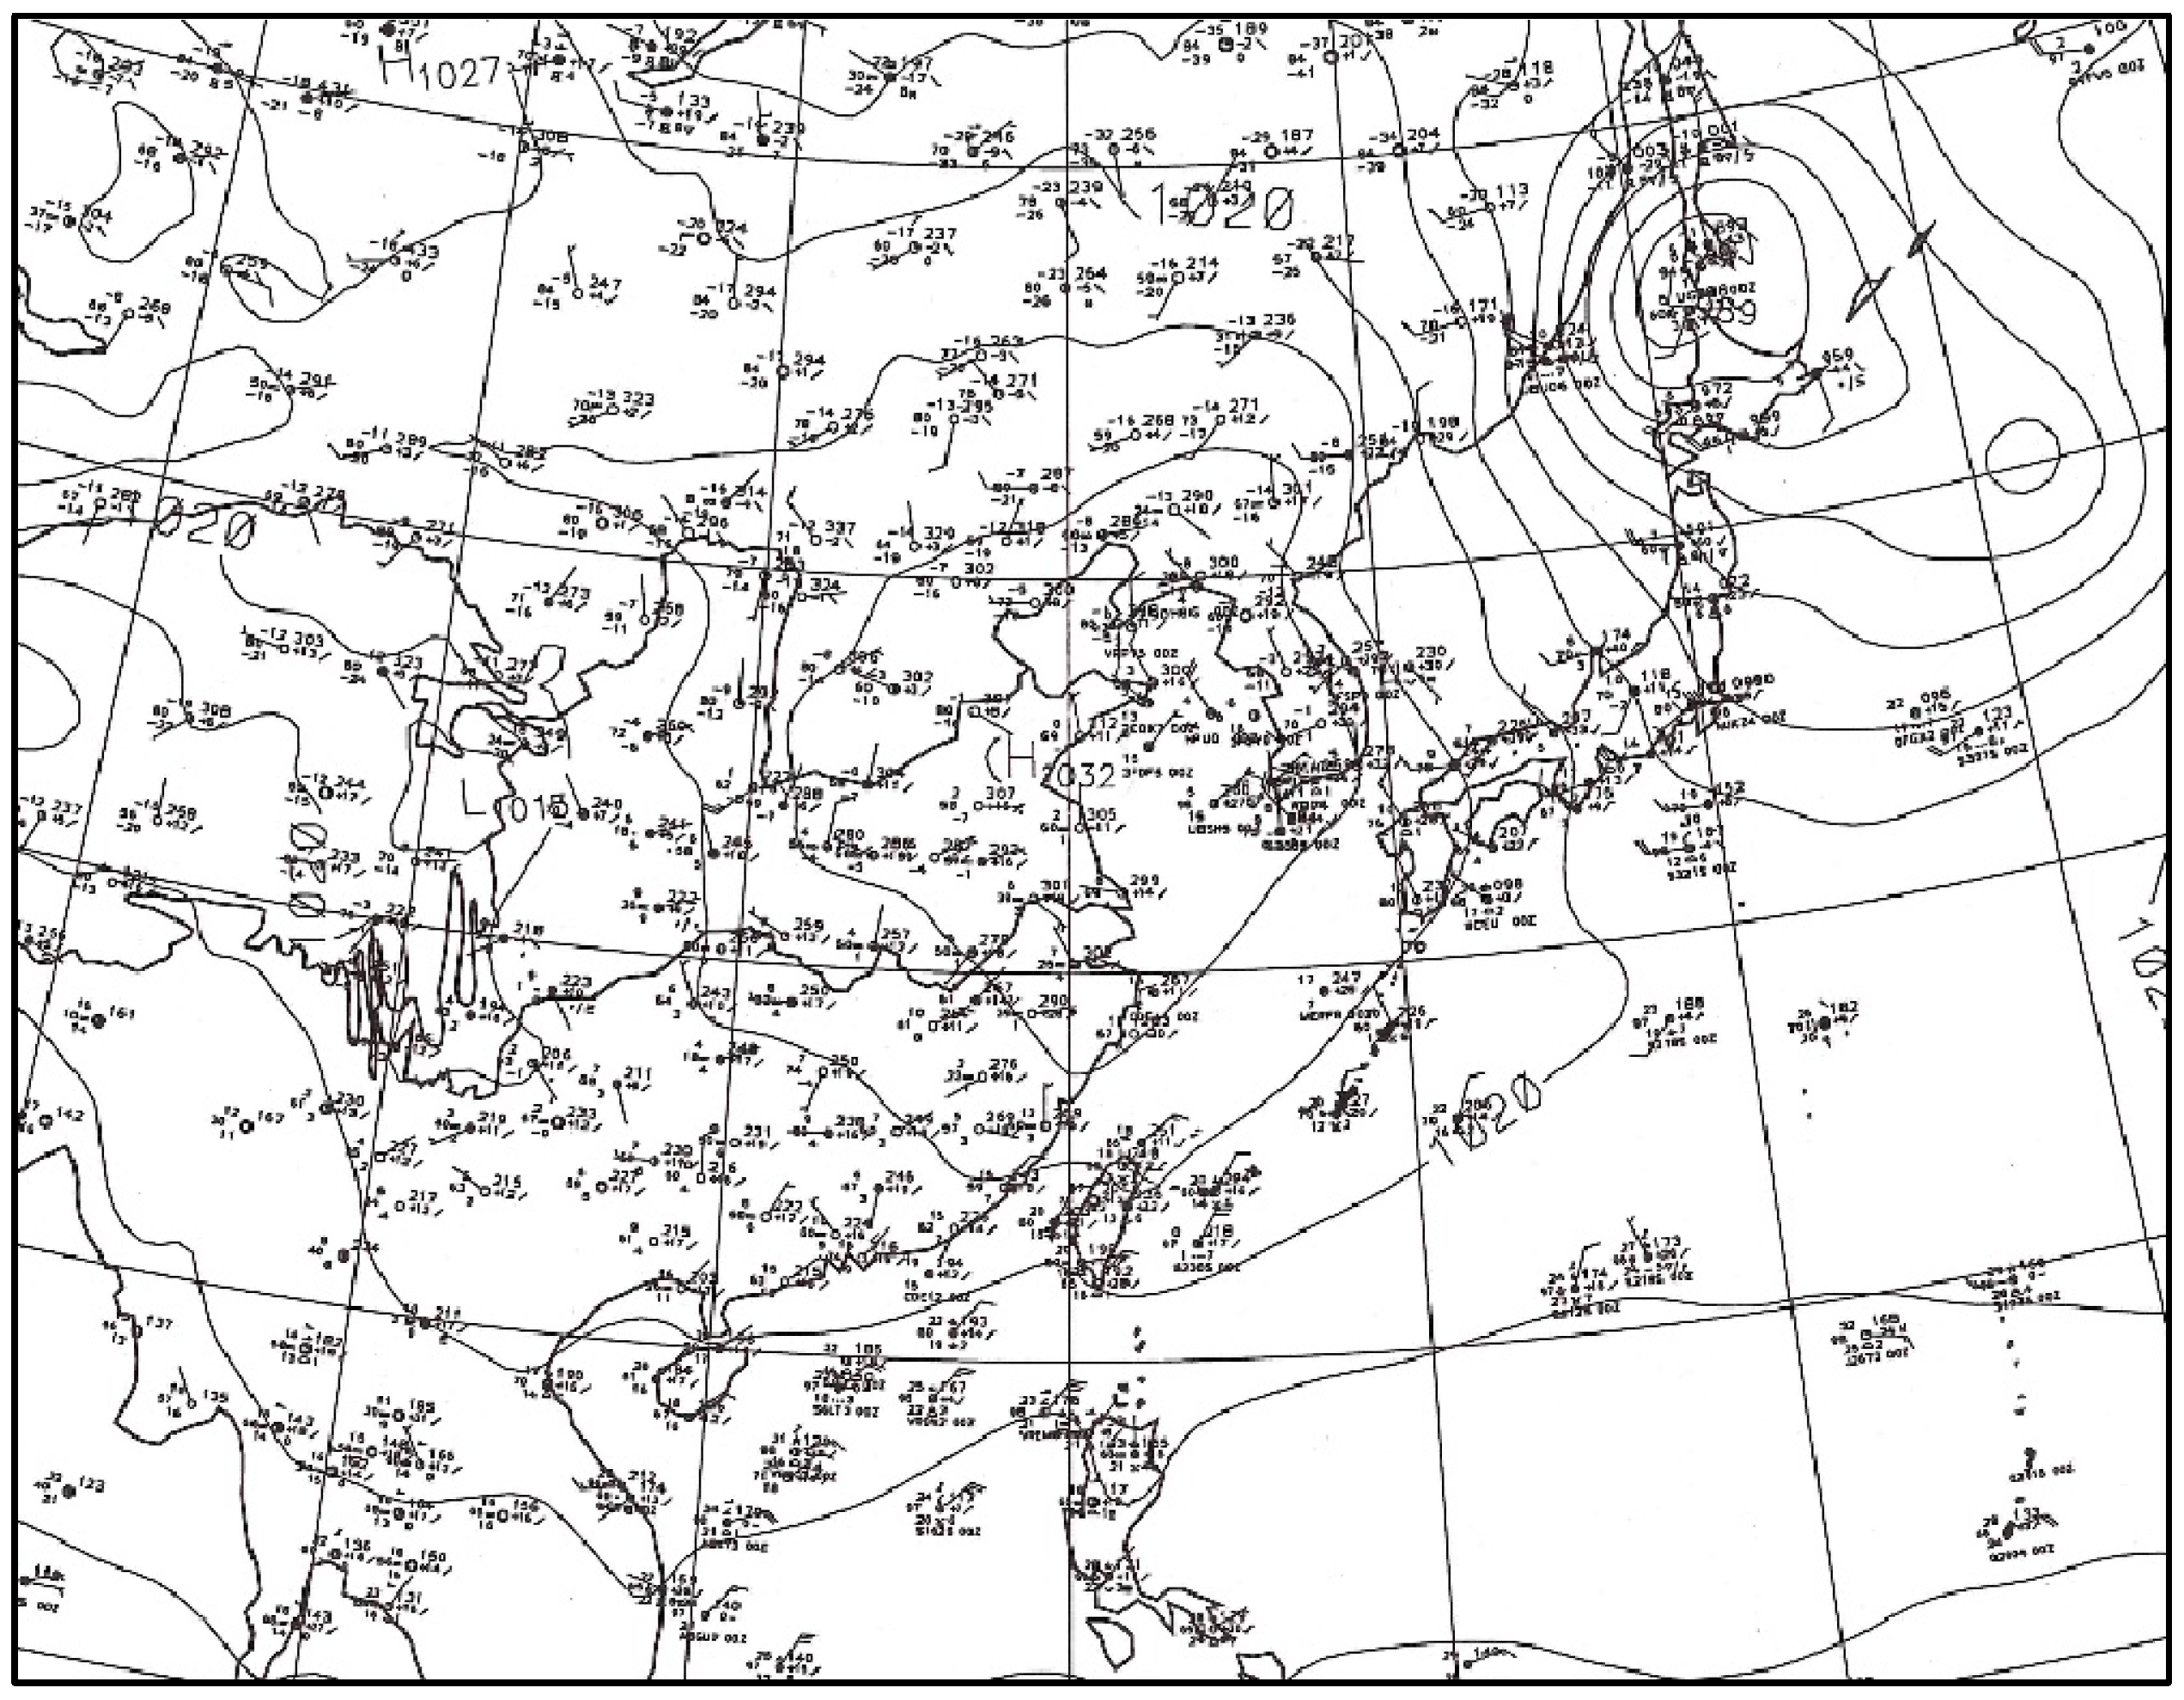
3.1. Synoptic Environment

The surface weather map at 0000 UTC (i.e., 0800 LST) on 12 December 2019 (Figure 2) shows that a continental high-pressure system dominated the regions of East China and southeastern China. Located near 36° N and 118° E, the center of this high pressure (1032 hPa) was moving toward the southeast at 10 kts. With the 1020-hPa isobar in the mean sea-level pressure (MSLP) passing through southern Taiwan, northeasterly winds prevailed over Taiwan and nearby oceans. Due to the strong winds, a gale warning (designated as GW) was issued for Taiwan and the adjacent areas. As in the present event, strong northeasterly winds at the surface (often after the passage of a cold front) are the most common conditions to cause RWS and affect the Songshan Airport in Taipei, e.g., [18,19].

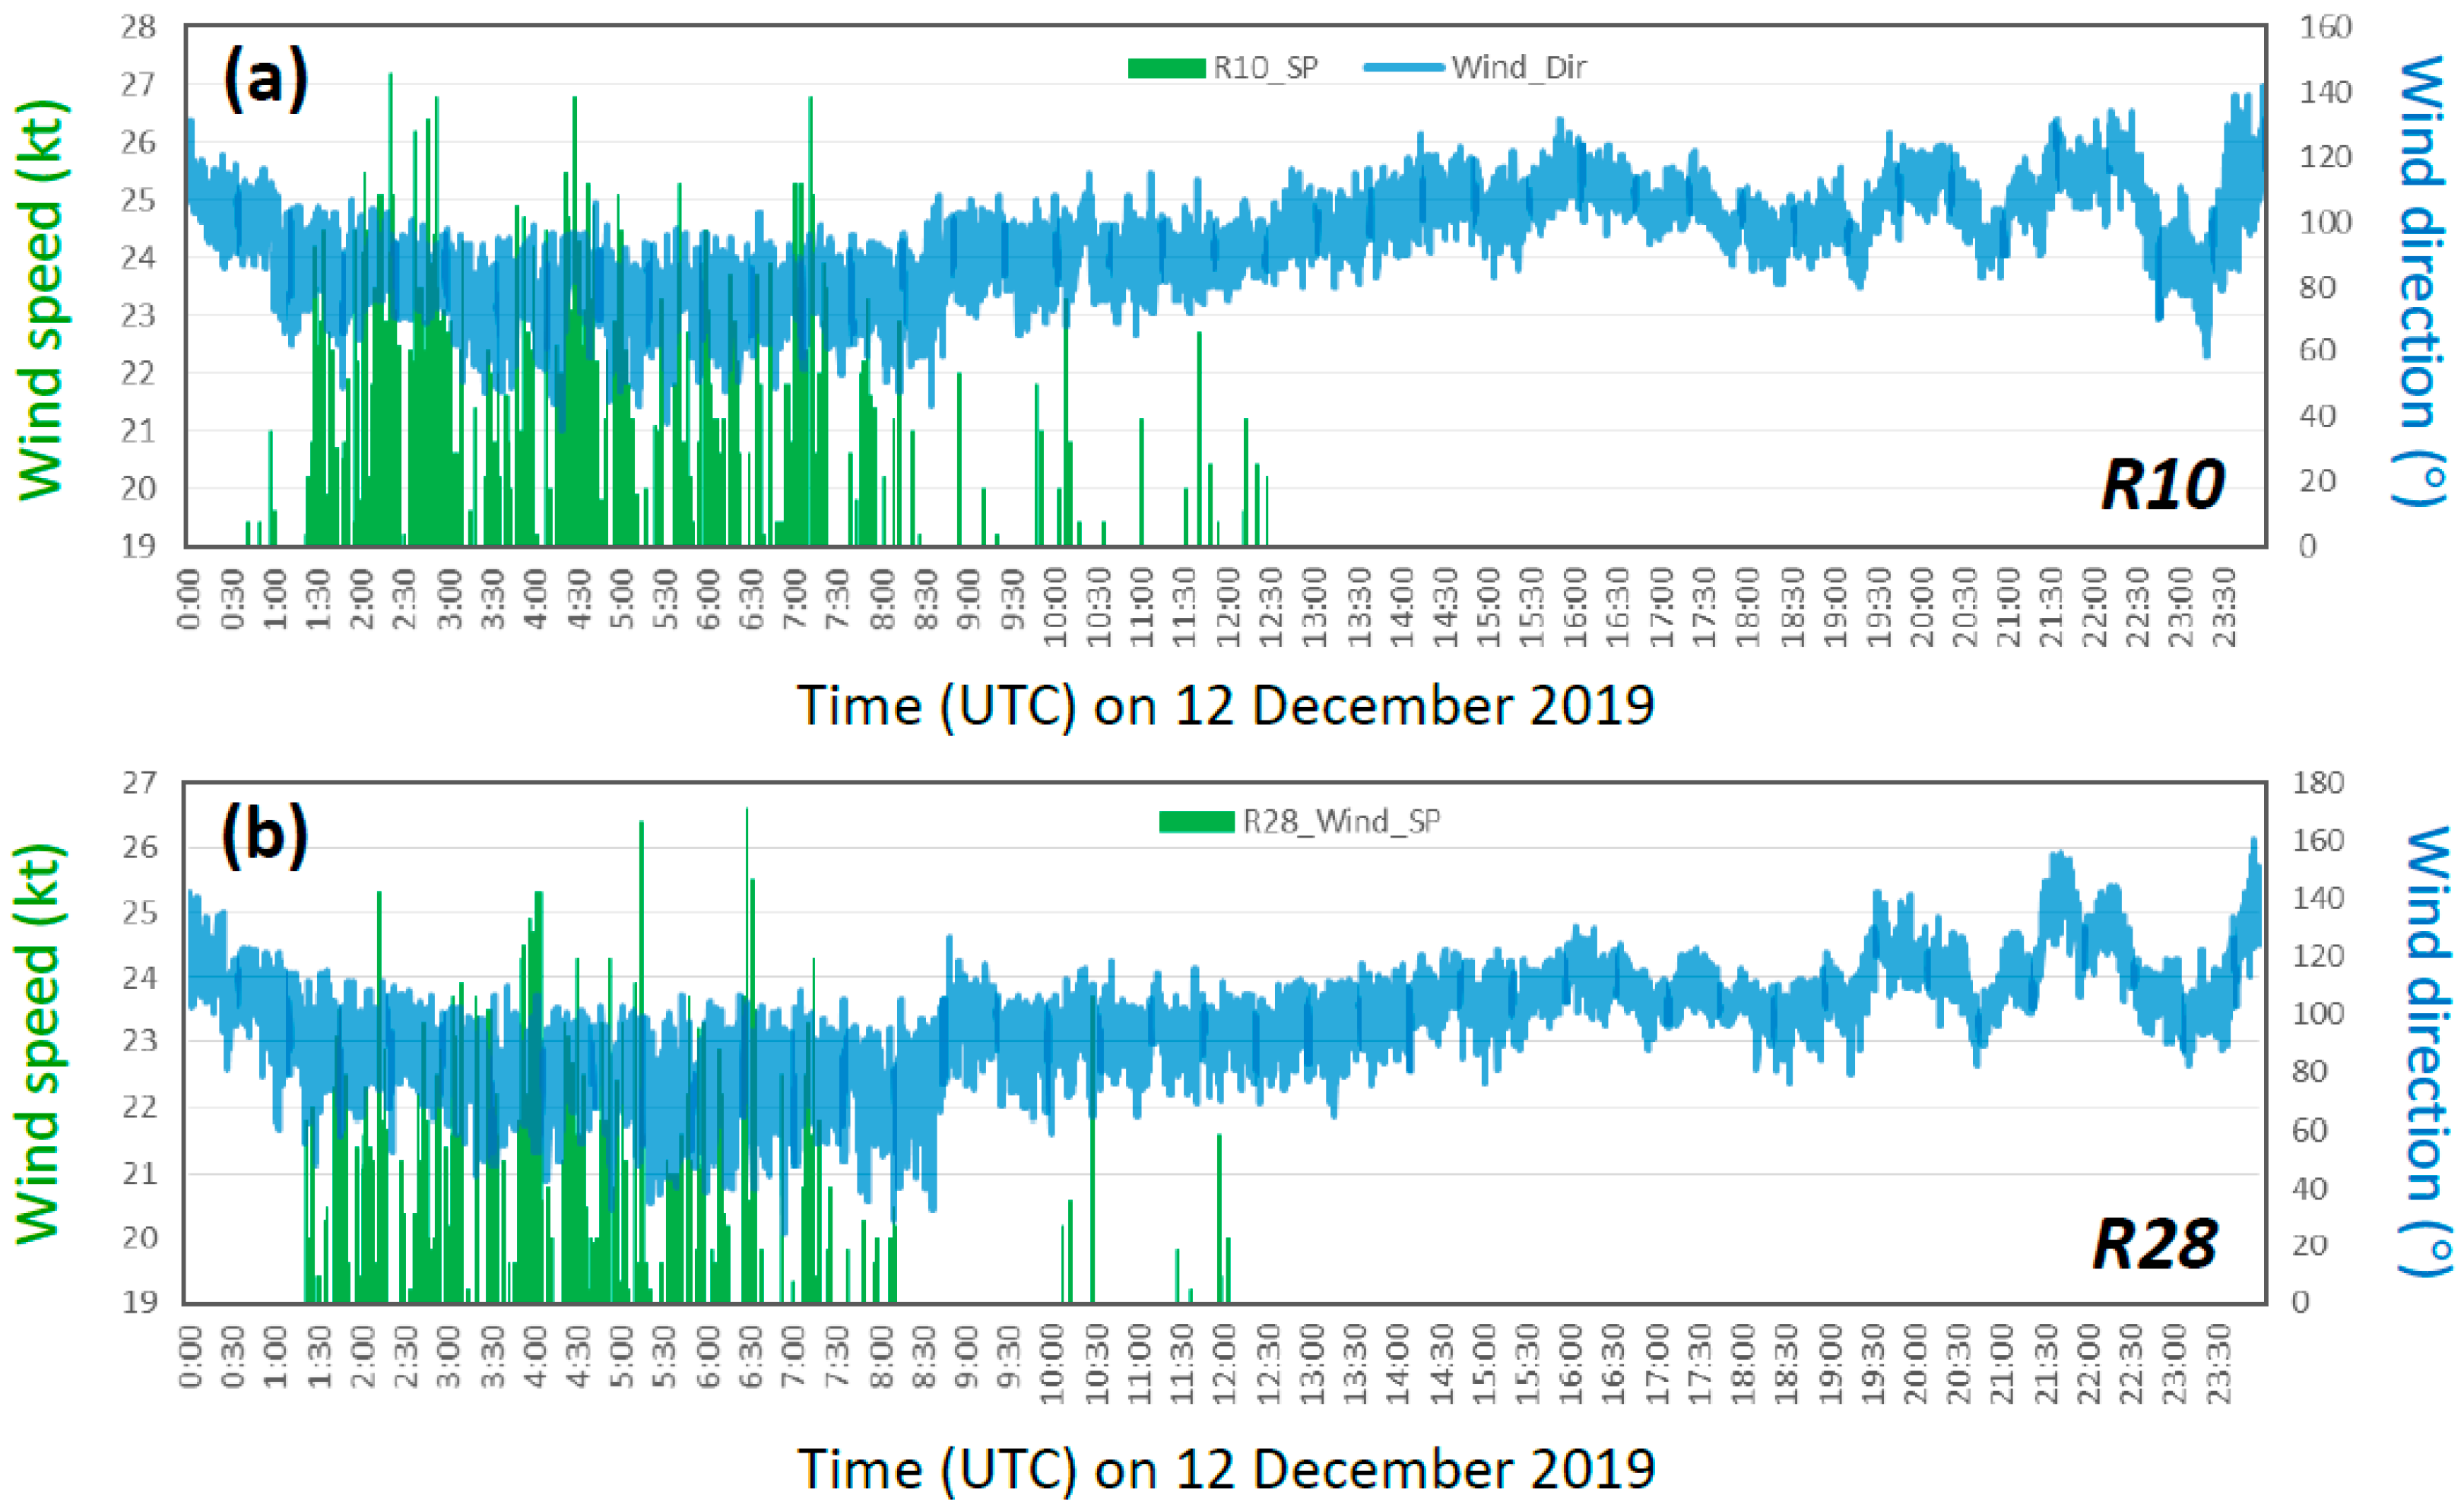
3.2. Surface Wind at Songshan Airport

Locally at the Songshan Airport, strong easterly to northeasterly winds of ≥20 kt appeared frequently at R10 (west runway head) since about 0100 UTC and until almost 1230 UTC on 12 December 2019, and thus lasted for roughly 11.5 h (Figure 3a). With a wind direction between 50° and 105°, such occurrences on that day were the most frequent prior to 0800 UTC (43–147 times per hour, accounting for 8.9–30.6% of all 481 instances, Table 1). In continuous records, the strongest wind occurred at 0220 UTC, with a direction of 90° and a speed reaching 27 kt (Figure 3a). At R28 (east runway head), wind conditions were similar, with strong winds occurring frequently between 0120 and 1210 UTC (Figure 3b), although the total times of wind speed ≥ 20 kt were fewer to some extent (254 times) compared to those at R10 (Table 1). Between 0200 and 0600 UTC, strong winds at R28 were the most frequent, with at least 33 times per hour (or ≥12.9% of total occurrences).

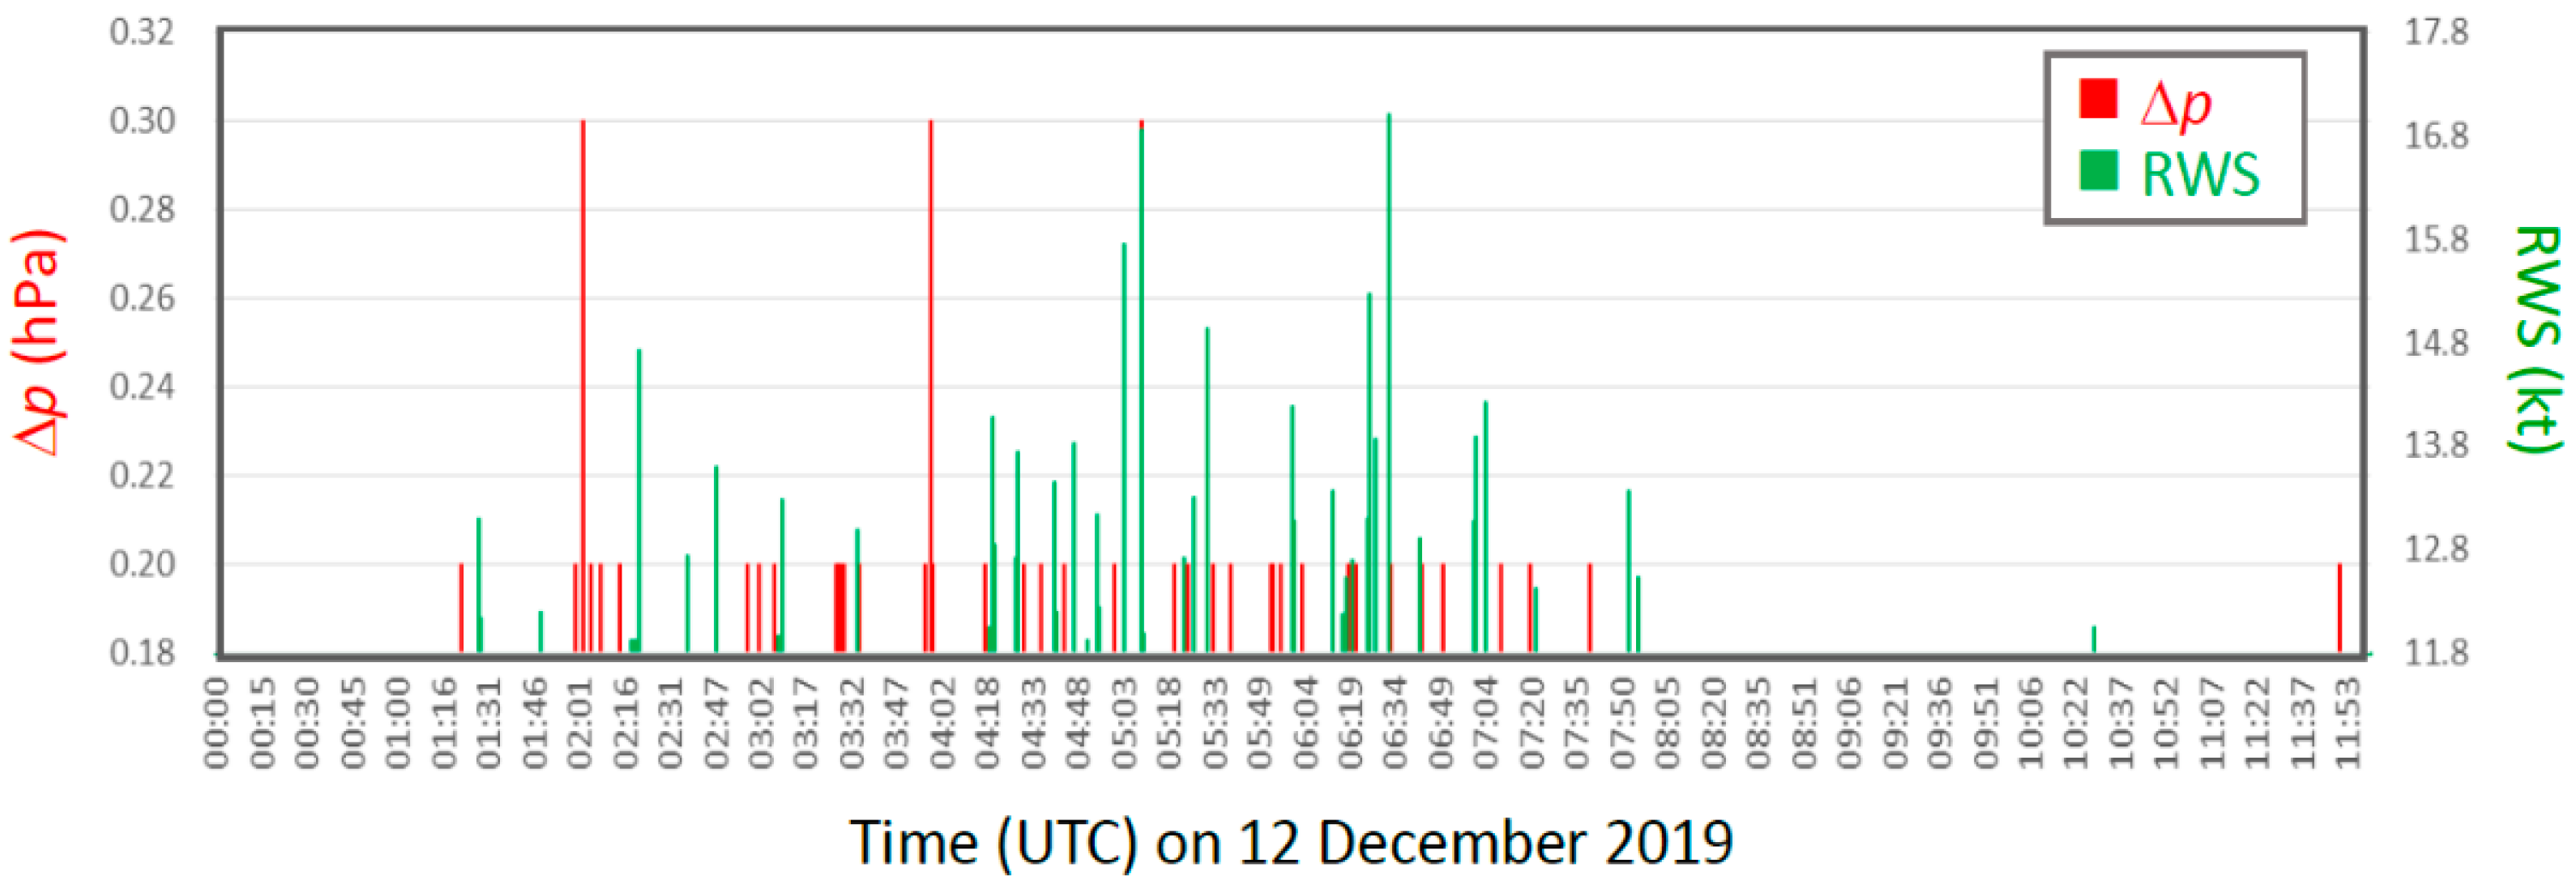
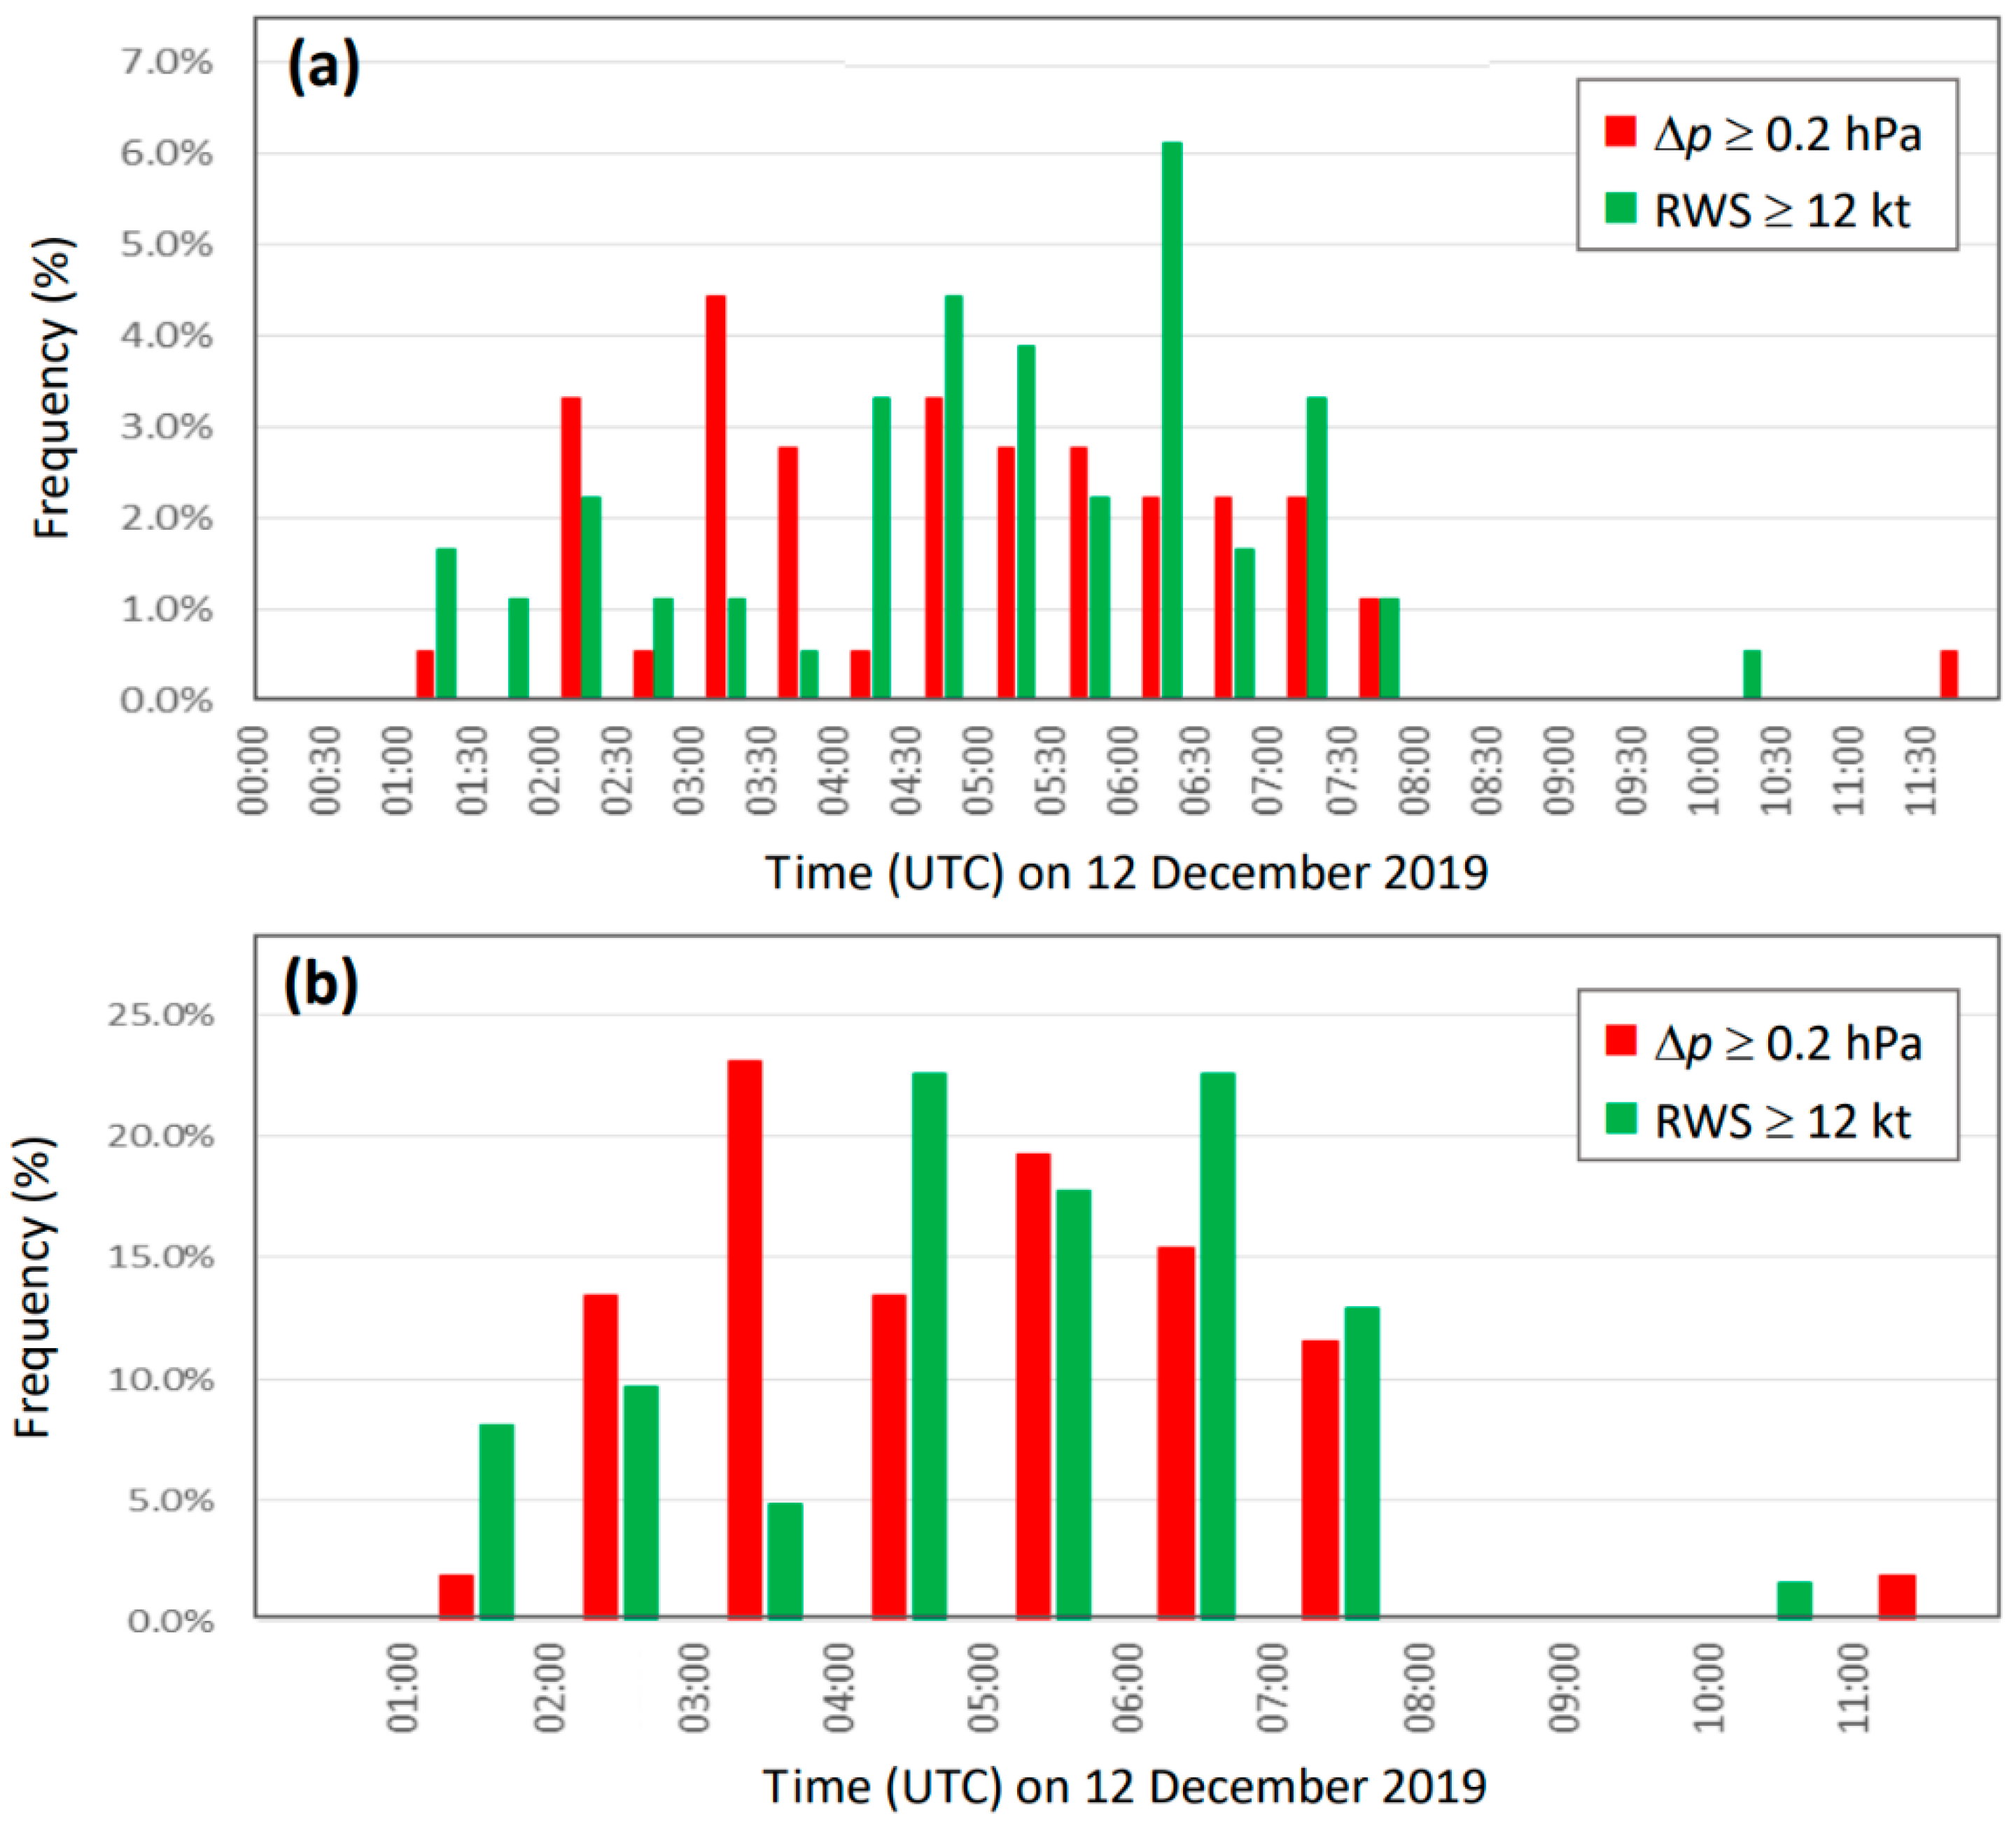
3.3. Large Pressure Fluctuations and Runway Wind Shear

Although Figure 3 shows the surface wind conditions in continuous records at R10 and R28 of the Songshan Airport on 12 December 2019, it is the strong RWS that posed more of a threat to flight safety and not necessarily the total wind speed or RVWS, as mentioned earlier. Thus, in Figure 4, the magnitudes and temporal distributions of both LPFs (Δp ≥ 0.2 hPa) and RWS (≥12 kt) are plotted for a comparison in their correspondence and association, while their times of occurrence and proportion frequencies in each 1-h intervals are given in Table 2, both from 0000 to 1200 UTC to cover the entire event. Note that the vertical axes in Figure 4 start at values (0.18 hPa and 11.8 kt) slightly below the criteria so that all instances of LPFs and RWS can be visualized. As pressure values were recorded to one place below decimal, the LPFs had values of either 0.2 or 0.3 hPa and occurred roughly between 0115 and 0745 UTC (red spikes, Figure 4). The instances of RWS, on the other hand, ranged between 12 and 16.8 kt and appeared during the period from 0125 to 0800 UTC (green spikes). Thus, LPFs and RWS occurred during similar time periods on 12 December 2019. Between 0000 and 1200 UTC, the total times of occurrence were 52 for LPFs and 62 for RWS (Table 2), which are comparable in numbers, although the former were about 20% fewer. The comparable numbers also suggest that 0.2 hPa (per 10 s) is a suitable criterion to identify LPFs in association with RWS of ≥12 kt, as choosing 0.1 or 0.3 hPa would yield too many or too few (only two) occurrences, respectively. Before 1200 UTC, LPFs occurred more frequently over 0200–0800 UTC, at least 6 times per hour and accounting for ≥11.5% of total occurrences, and were the most frequent during 0300–0400 (12 times) and 0500–0600 UTC (10 times, Table 2). By comparison, the occurrences of RWS were more frequent during 0100–0300 and 0400–0800 UTC (at least 5 times or 8.1%), especially during 0400–0500 and 0600–0700 UTC (14 times or 22.6% each). Thus, the periods of the highest frequencies in RWS tended to occur later than those of the highest LPFs. Also, while most of the LPFs and RWS did not occur simultaneously in Figure 4, they were rarely separated by more than 15–20 min or so. In other words, LPFs and RWS tended to occur in close proximity in time near the runway at the Songshan Airport during the event. This phenomenon can also be confirmed in Figure 5, where the occurrence frequencies of LPFs and RWS are compared during successive time intervals every 30 min (Figure 5a) or 1 h (Figure 5b). In airport operation, warnings of WS are issued once the LLWAS detects RWS and canceled when RWS is not detected in 30 min. Thus, the close correspondence and time proximity of LPFs and RWS in Figure 4 and Figure 5 suggest that the LPFs may be utilized as an additional or auxiliary method to detect RWS.

4. Discussion

In this section, some statistical analysis is first performed on the association of LPFs and RWS obtained in our case and presented above. The Pearson product-moment correlation coefficient (R) between the two time series of LPF and RWS occurrences, as given in Table 2 (and Figure 5b), is 0.681, and that between the occurrence times every 30 min (see Figure 5a) is 0.599, both suggesting a reasonably close relationship. The t test on the difference of means between the two series, which are two different samples with unknown and unequal variances (e.g., [22], Section 9.1), gives t values of 0.410 and 0.522 for data with intervals of 1 h and 30 min, respectively, and thus indicates no significant difference in the means of the two series at any reasonable level of confidence.
Next, the 2 × 2 contingency table and categorical scores for dichotomous (yes/no) events, e.g., [23,24], are used to show the correspondence between RWS and LPFs for occurrences in each of at least once, 5 times, and 10 times per hour (defined as an event) during 0000–1200 UTC on 12 December 2019, as shown in Table 3. Here, events in both RWS and LPF, no events in both, events in RWS but no events in LPF, and events in LPF but no events in RWS are defined as hits (H), correct negatives (CN), misses (M), and false alarms (FA), respectively. As shown, for occurrences of LPFs or RWS at least once and 5 times per hour, the rate for accuracy (defined as H + CN) is 83.3% (10 times), with hits and correct negatives roughly comparable in numbers, while misses and false alarms are once each (8.3%). For LPFs or RWS reaching 10 times per hour, they were much rarer (only 3 times in RWS and twice in LPFs), but the accuracy remains at 75.0% (9 out of 12 times). Thus, Table 3 also indicates that it is quite reliable to use Δp in time as an alternative method to detect RWS at the Songshan Airport in our case.
Statistically, the results in Table 3 can also be tested for their “goodness of fit,” i.e., the dependence between the occurrences in LPFs and RWS, following the procedure described in Section 10.4 of [22] (pp. 348–354). Here, the appropriate test is for χ2 distribution, with a null hypothesis that the two time series are random and independent to each other. Since the data are dichotomous with only two possibilities (yes or no), the degree of freedom is only one, and the test result of X2 needs to reach 2.71, 3.84, 5.02, 6.63, and 7.88 to reject the null hypothesis (i.e., accept that the data are dependent) at the confidence level of 90%, 95%, 97.5%, 99%, and 99.5% (right-tail test), respectively. For the series of ≥1 time per hour, the test result is X2 = 4.688, so the two variables are statistically dependent up to a confidence level of 95%. For the series of ≥5 times per hour, X2 = 5.333, and the dependence is found up to the 97.5% confidence level. For frequencies of ≥10 times per hour, X2 is only 0.8 and does not pass the test for dependence since these are rare occurrences, and most entries are correct negatives, as mentioned earlier. Overall, occurrences of LPFs and RWS show a strong dependence on each other in our case.
In [18], the authors analyzed the occurrences of LPFs and RWS at the Songshan Airport during another event under strong northeasterly flow on 24 February 2013, where the beginning and ending times of LPFs and RWS were also close to each other with good correspondence. In the current study, their occurrences during 0000–1200 UTC on 12 December 2019 are further analyzed, and good correlation and correspondence between them are demonstrated. Using the 2 × 2 contingency table and categorical scores, it is also shown that using LPFs reaching 0.2 hPa (in 10 s) for the detection of RWS (≥12 kt) gives a fairly high accuracy (about 75–83%), low miss rate (around 15% or below), and low false alarm ratio (below 10%), respectively. The two variables are also tested to be dependent on each other in their occurrences (≥1 and ≥5 times per hour) at reasonably high confidence levels (95–97.5%). Thus, it is recommended to practice caution with RWS at airports whenever pressure fluctuations of ≥0.2 hPa are detected. Although our study here is still preliminary, and more studies are needed to refine the relationship between pressure fluctuations and RWS, LPFs can be helpful and used to alert pilots to the potential risks of WS during take-off and landing. Here, we also note that the statistical analysis and results presented in this study were also not performed in earlier works on the topic reviewed in Section 1 [14,18,19,20,21].
Although the monitoring RWS at airports is vital to ensure the safety of air traffic, the close association between RWS and the occurrences of LPFs has not yet been applied to assist such monitoring. At present, warnings of RWS at airports rely on the LLWAS and on reports from pilots who encounter strong WS during landing or takeoff. In the present study, we have shown that the LPFs can be used to assist in monitoring RWS. As the LPFs can be detected using a single barometer, their detection provides an auxiliary method to help monitor RWS at airports and a much cheaper alternative for small airports (local ones or on islands) that are not yet equipped with the LLWAS. In either case, the combined use of LLWAS and the detection of LPFs can enhance aviation safety and promote aviation efficiency.

5. Conclusions and Future Works

In this study, time series data (every 10 s) from the AWOS installed at the Songshan Airport in Taipei, Taiwan, on 12 December 2019 are used to analyze the association and correspondence between large pressure fluctuations (LPFs, ≥0.2 hPa in 10 s) and runway wind shear (RWS, ≥12 kt), with the latter computed from horizontal wind observations at the two ends of the runway (R10 and R28). Mainly using data from 0000–1200 UTC for this event with strong northeasterly monsoonal flow in northern Taiwan, the main findings can be summarized as follows. First, both LPFs and RWS occurred frequently over the runway between 0100 and 0800 UTC in the present event, with total numbers of 52 and 62, respectively. Hence, the two parameters exhibited close association and correspondence to each other, with one occurring within 15–20 min of each other in the majority of samples. The correlation coefficient between the two time series of LPF and RWS occurrences (every 30 min or 1 h) is around 0.6–0.7, and their means are also tested to show no apparent differences. Second, when LPFs are used as a proxy for the occurrences of RWS within the same hour, the analysis using the 2 × 2 contingency table and categorical scores indicates high accuracy rates (≥75%), low miss rate (≤~15%), and low false alarm ratio (<10%), respectively. The test for goodness of fit between the two variables suggests that their occurrences (≥1 and ≥5 times per hour) are statistically dependent on each other at a reasonably high confidence level of 95–97.5%. Therefore, it is concluded that LPFs can be used as an auxiliary or alternative method to detect RWS at airports and thus can contribute positively to the improvement of aviation safety around the world.
As for the future direction of research on the current topic, two suggestions are offered here. First, based on our results (as well as previous works), more precise measurements can be installed at a selected airport (or airports) to further confirm the association of LPFs and RWS, preferably using barometers with higher precision and sensitivity. Second, since turbulence and small-scale WS inside the PBL are currently only parameterized in operational models if deemed necessary or helpful, airports should be equipped with regional, high-resolution NWP models that are capable of explicitly resolving turbulent motions inside the PBL, including those driven by WS, and simulate large eddies, at a grid size well finer than the km scale, e.g., [25,26,27,28,29]. This suggestion is obviously also important and could be very helpful in forecasting turbulent weather around and near airports, thereby providing a useful warning in advance and improving overall aviation safety.

Author Contributions

Conceptualization, C.-P.P.; Formal analysis, C.-P.P. and C.-C.W.; Funding acquisition, C.-P.P. and C.-C.W.; Investigation, C.-P.P. and C.-C.W.; Methodology, C.-P.P.; Project administration, C.-P.P. and C.-C.W.; Supervision, C.-P.P.; Visualization, C.-P.P. and C.-C.W.; Writing—original draft, C.-P.P. and C.-C.W.; Writing—review and editing, C.-C.W. All authors have read and agreed to the published version of the manuscript.

Funding

The funding for C.-P.P. came from the Chinese Meteorological and Environmental Research and Development Center (CMERDC), Taiwan. The second author, C.-C.W., was supported by the National Science and Technology Council (NSTC) of Taiwan, jointly under grants NSTC 112-2111-M-003-005, MOST 111-2625-M-003-001, and NSTC 112-2625-M-003-001.

Institutional Review Board Statement

Not applicable.

Informed Consent Statement

Not applicable.

Data Availability Statement

The ANWS data at the Songshan Airport of Taipei and the weather map used in Figure 2 were provided by the Civil Aviation Administration (CAA) of Taiwan, available upon request at http://www.anws.gov.tw/English, or from the first author with the permission of the CAA.

Acknowledgments

Valuable and construct comments from the anonymous reviewers helped improve an earlier draft of the manuscript and are highly appreciated. The authors would like to thank the ANWS of the CAA for providing the AWOS data at the Songshan Airport of Taipei, as well as the help from Yu-Han Chen (Dept. of Atmos. Sci., National Taiwan Univ.) in performing some of the statistical tests and Shin-Yi Huang (Dept. of Earth Sci., National Taiwan Normal Univ.) in plotting Figure 1a,b. The first author, CPP, thanks Guo-Ying Shi-Tsai and Yan-Liang Chen for sponsoring research and development at his affiliation.

Conflicts of Interest

The authors declare no conflict of interest.

References

  1. Fujita, T.T. The Downburst, Microburst and Macroburst. University of Chicago, SMRP Research Paper 210. 1985. 122p. Available online: https://pi.lib.uchicago.edu/1001/cat/bib/684175 (accessed on 27 November 2021).
  2. McCarthy, J.; Serafin, R.; Wilson, J.; Evans, J.; Kessinger, C.; Mahoney, W.P., III. Addressing the microburst threat to aviation. Research-to-operation success story. Bull. Am. Meteorol. Soc. 2022, 103, E2845–E2861. [Google Scholar] [CrossRef]
  3. Skamarock, W.C.; Klemp, J.B.; Dudhia, J.; Gill, D.O.; Barker, D.M.; Wang, W.; Powers, J.G. A Description of the Advanced Research WRF Version 2; NCAR Tech. Note NCAR/TN-4681STR; University Corporation for Atmospheric Research: Boulder, CO, USA, 2005; 88p. [Google Scholar] [CrossRef]
  4. Japan Meteorological Agency. Numerical Weather Prediction Models. Outline of the Operational Numerical Weather Prediction at the Japan Meteorological Agency, JMA, Japan; 2022; pp. 51–148. Available online: https://www.jma.go.jp/jma/jma-eng/jma-center/nwp/outline2022-nwp/index.htm (accessed on 1 November 2022).
  5. European Centre for Medium-Range Weather Forecasts. IFS Documentation CY48R1–Part IV: Physical Processes. ECMWF/IFS Documentation CY48R1. 2023. 266p. Available online: https://www.ecmwf.int/en/publications/ifs-documentation (accessed on 19 September 2023).
  6. Wilson, J.W.; Wakimoto, R.M. The discovery of the downburst: T. T. Fujita’s contribution. Bull. Am. Meteorol. Soc. 2001, 82, 49–62. [Google Scholar] [CrossRef]
  7. Shreffler, J.H.; Binkowski, F.S. Observations of pressure jump lines in the Midwest, 10–12 August 1976. Mon. Weather Rev. 1981, 109, 1713–1725. [Google Scholar] [CrossRef]
  8. Wakimoto, R.M. The life cycle of thunderstorm gust fronts as viewed with Doppler radar and rawinsonde data. Mon. Weather Rev. 1982, 110, 1060–1082. [Google Scholar] [CrossRef]
  9. ICAO. Manual on Low-Level Wind-Shear. Doc. 9817-AN/449, 3 May 2014—First Edition—2005. 2014, pp. 5–8. Available online: https://skybrary.aero/bookshelf/doc-9817-manual-low-level-wind-shear. (accessed on 13 December 2021).
  10. Katul, G.G.; Albertson, J.D.; Parlange, M.B.; Hsieh, C.I.; Conklin, P.S.; Sigmon, J.T.; Knoerr, K.R. The “inactive” eddy motion and the large-scale turbulent pressure fluctuations in the dynamic sublayer. J. Atmos. Sci. 1996, 53, 2512–2524. [Google Scholar] [CrossRef]
  11. Vianai, S.; Yaguei, C.; Maqueda, G.; Morales, G. Study of the surface pressure fluctuations generated by waves and turbulence in the nocturnal boundary layer during SABLES 2006 field campaign. Física Tierra 2007, 19, 55–71. [Google Scholar]
  12. Wei, Z.; Zhang, H.; Ren, Y.; Li, Q.; Cai, X.; Song, Y.; Kang, L. Study on the characteristics of the pressure fluctuations and their contribution to turbulence kinetic energy. Atmos. Res. 2021, 258, 105634. [Google Scholar] [CrossRef]
  13. Johnson, R.H.; Mapes, B.E. Mesoscale processes and severe convective weather. In Severe Convective Storms; American Meteorological Society: Boston, MA, USA, 2001; pp. 71–122. [Google Scholar] [CrossRef]
  14. Pu, C.-P. The low-level wind shear system and the diagnosis of low-level wind shear at Songshan Airport in Taiwan. Atmos. Sci. 2003, 31, 181–198, (In Chinese with English Abstract). [Google Scholar]
  15. Pu, C.-P.; Hsu, M.-L.; Yu, F. A study of “Soulik” Typhoon and low-level wind shear statistics at Sung-Shan Airport during 12–13 July 2013. Atmos. Sci. 2015, 43, 27–46, (In Chinese with English Abstract). [Google Scholar]
  16. Pu, C.-P.; Hsu, M.-L. A case study of the low-level wind shear at Songshan Airport influenced by Typhoon Fitow. Avia. Wea. 2016, 25, 30–50. (In Chinese) [Google Scholar]
  17. Pu, C.-P.; Hsu, M.-L.; Yu, F.; Liu, L. A case study of the closed low, cold front, thunderstorm and low-level wind shear at Sung-Shan Airport. J. Avia. Saf. Manag. 2014, 1, 227–243. (In Chinese) [Google Scholar]
  18. Pu, C.-P.; Lin, C.-J. A study of the runway wind shear and large pressure fluctuation of strong northeast monsoon at Songshan Airport. Avia. Wea. 2021, 36, 19–30. (In Chinese) [Google Scholar]
  19. Pu, C.-P.; Lin, C.-J. A study on the diurnal variation of the low-level wind shear and runway pressure fluctuation in Songshan Airport from 2010 to 2014. Atmos. Sci. 2017, 45, 261–280, (In Chinese with English Abstract). [Google Scholar]
  20. Pu, C.-P.; Lin, C.-J. An analysis with the relation to missing approach cases and pressure fluctuation at Matsu Nangan Airport. J. Avia. Saf. Manag. 2017, 4, 65–78. (In Chinese) [Google Scholar]
  21. Pu, C.-P.; Lin, C.-J. A study on the correlation between runway wind shear and pressure fluctuation occur in Matsu Nangan Airport from 2014 to 2016. J. Avia. Saf. Manag. 2018, 5, 42–55. (In Chinese) [Google Scholar]
  22. Barber, G.M. Elementary Statistics for Geographers; The Guilford Press: New York, NY, USA, 1988; 513p, ISBN 0-89862-777-X. [Google Scholar]
  23. Schaefer, J.T. The critical success index as an indicator of warning skill. Weather Forecast. 1990, 5, 570–575. [Google Scholar] [CrossRef]
  24. Wilks, D.S. Statistical Methods in the Atmospheric Sciences, 3rd ed.; Academic Press: Cambridge, MA, USA, 2011; 704p, ISBN 9780123850225. [Google Scholar]
  25. Stevens, B.; Lenschow, D.H. Observations, experiments, and large eddy simulation. Bull. Am. Meteorol. Soc. 2001, 82, 283–294. [Google Scholar] [CrossRef]
  26. Moeng, C.-H.; Sullivan, P.P. Large eddy simulation. In Encyclopedia of Atmospheric Sciences; Holton, J.R., Curry, J.A., Pyle, J.A., Eds.; Academic Press: Cambridge, MA, USA, 2003; pp. 1140–1150. [Google Scholar]
  27. De Roode, S.R.; Duynkerke, P.G.; Jonker, H.J.J. Large-eddy simulation: How large is large enough? J. Atmos. Sci. 2004, 61, 403–421. [Google Scholar] [CrossRef]
  28. Mirocha, J.D.; Lundquist, K.A. Assessment of vertical mesh refinement in concurrently nested large-eddy simulations using the Weather Research and Forecasting Model. Mon. Weather Rev. 2017, 145, 3025–3048. [Google Scholar] [CrossRef]
  29. Rozoff, C.M.; Nolan, D.S.; Bryan, G.H.; Hendricks, E.A.; Knievel, J. Large-eddy simulations of the tropical cyclone boundary layer at landfall in an idealized urban environment. J. Appl. Meteorol. Climatol. 2023, 62, 1457–1478. [Google Scholar] [CrossRef]
Figure 1. (a) The topography of Taiwan (m, shading) and the location of Songshan Airport in Taipei, (b) The layout of the runway and the locations of the two observation sites (solid square), and (c) a photo of the AWOS near R10 (photo provided by Chin-Piao Pu).
Atmosphere 14 01773 g001
Figure 2. The CWB surface weather chart at 0000 UTC 12 December 2019, obtained from the weather service network of the ANWS of the CAA of Taiwan (https://aoaws.anws.gov.tw, accessed on 12 December 2019). The mean sea-level pressure (MSLP, hPa) is analyzed every 4 hPa.
Atmosphere 14 01773 g002
Figure 3. Time series of wind direction (°, blue and right axis) and occurrences of higher surface wind speed (kt, green bars, and left axis) at (a) R10 (west runway head) and (b) R28 (east runway head) of the Songshan Airport from 0000 to 1200 UTC (0800 to 2000 LST) on 12 December 2019.
Atmosphere 14 01773 g003
Figure 4. Time series for the occurrences and magnitudes of large pressure fluctuations (LPFs, Δp ≥ 0.2 hPa, red) and runway wind shear (RWS ≥ 12 kt, green) at the Songshan Airport from 0000 to 1200 UTC on 12 December 2019.
Atmosphere 14 01773 g004
Figure 5. Occurrence frequency (%) of LPFs (hPa, Δp ≥ 0.2 hPa, red) and runway wind shear (RWS ≥ 12 kt, green) at the Songshan Airport at intervals of (a) every 30 min and (b) every 1 h from 0000 to 1200 UTC, with respect to all occurrences during that period on 12 December 2019.
Atmosphere 14 01773 g005
Table 1. The number of times and proportion frequency (%) of occurrences of strong winds of ≥20 kt in 1-h intervals at R10 (west runway head) and R28 (east runway head) of the Songshan Airport from 0000 to 1200 UTC on 12 December 2019.
Time IntervalR10R28
(UTC)TimesProportion (%)TimesProportion (%)
0000–010010.2%00.0%
0100–0200438.9%239.0%
0200–030014730.6%5622.0%
0300–0400438.9%3915.3%
0400–05008217.0%5320.8%
0500–06005311.0%3312.9%
0600–0700449.1%228.6%
0700–08004810.0%218.2%
0800–090051.0%31.2%
0900–100040.8%00.0%
1000–110051.0%31.2%
1100–120061.2%10.4%
Total481100%254100%
Table 2. The number of times and proportion frequency (%) of LPFs (Δp ≥ 0.2 hPa) and RWS (≥12 kt) in 1-h intervals at the Songshan Airport from 0000 to 1200 UTC on 12 December 2019.
Time IntervalLPFRWS
(UTC)TimesProportion (%)TimesProportion (%)
0000–010000.0%00.0%
0100–020011.9%58.1%
0200–0300713.5%69.7%
0300–04001223.1%34.8%
0400–0500713.5%1422.6%
0500–06001019.2%1117.7%
0600–0700815.4%1422.6%
0700–0800611.5%812.9%
0800–090000.0%00.0%
0900–100000.0%00.0%
1000–110000.0%11.6%
1100–120011.9%00.0%
Total52100.0%62100.0%
Table 3. Verification results using the 2 × 2 contingency table for the occurrences of LPFs (Δp ≥ 0.2 hPa) and RWS (≥12 kt) per hour, stratified into three groups of at least once, five times, and ten times per hour in both of them at the Songshan Airport from 0000 to 1200 UTC on 12 December 2019. For each category, the number of hours (Hr) and its fraction (%) are both given.
TimesTotalAccuracyHCNMFA
HrHrFract.HrFract.HrFract.HrFract.HrFract.
≥1121083.3%758.3%325.0%18.3%18.3%
≥5121083.3%541.7%541.7%18.3%18.3%
≥1012975.0%18.3%866.7%216.7%18.3%
Disclaimer/Publisher’s Note: The statements, opinions and data contained in all publications are solely those of the individual author(s) and contributor(s) and not of MDPI and/or the editor(s). MDPI and/or the editor(s) disclaim responsibility for any injury to people or property resulting from any ideas, methods, instructions or products referred to in the content.

