Temporal and Spatial Variability of Dust in the Urmia Basin, 1990–2019


Abstract
:1. Introduction
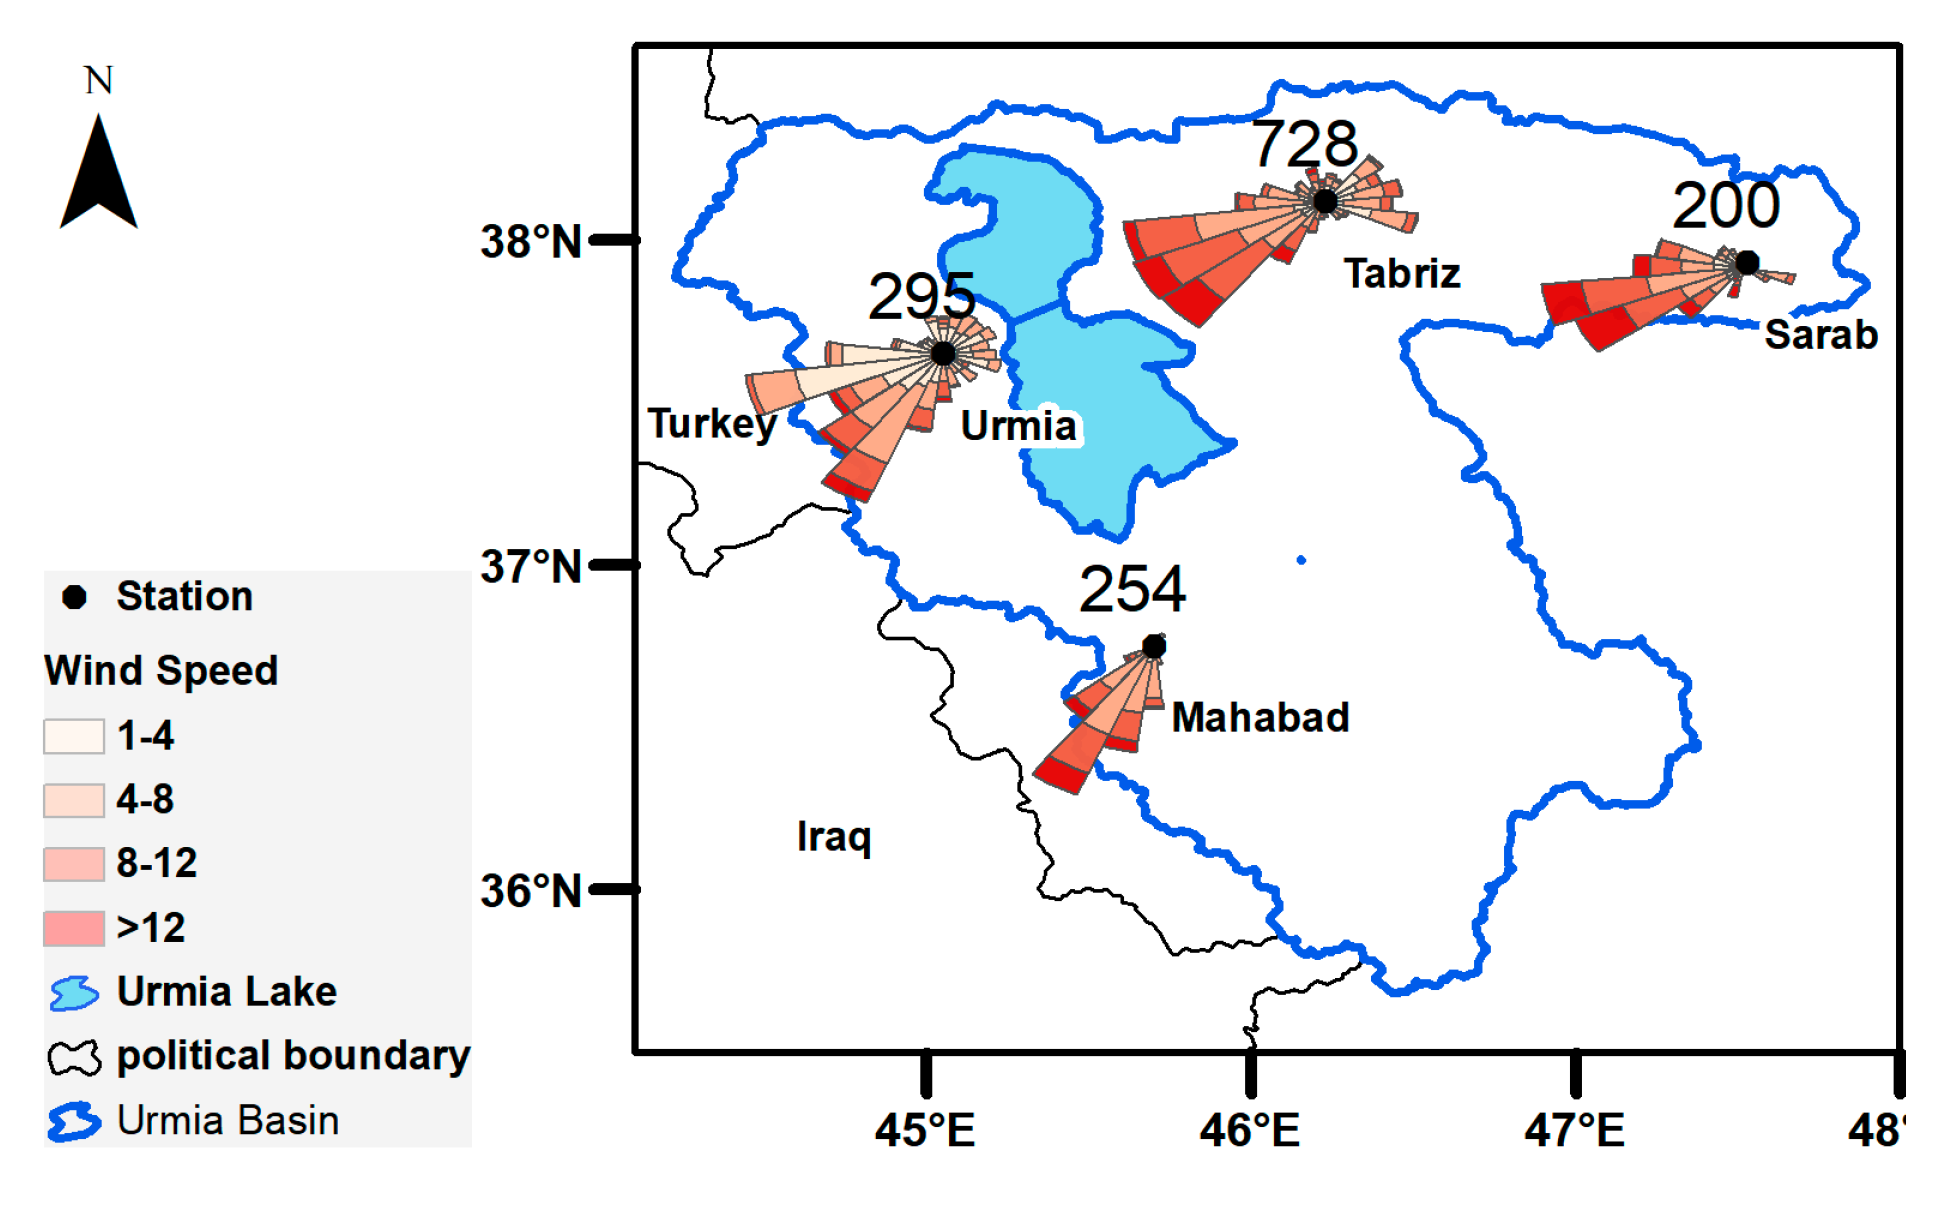
2. Study Area
3. Data and Method
3.1. Meteorology Data
3.2. MEERA-2 Data
3.3. Method
4. Results
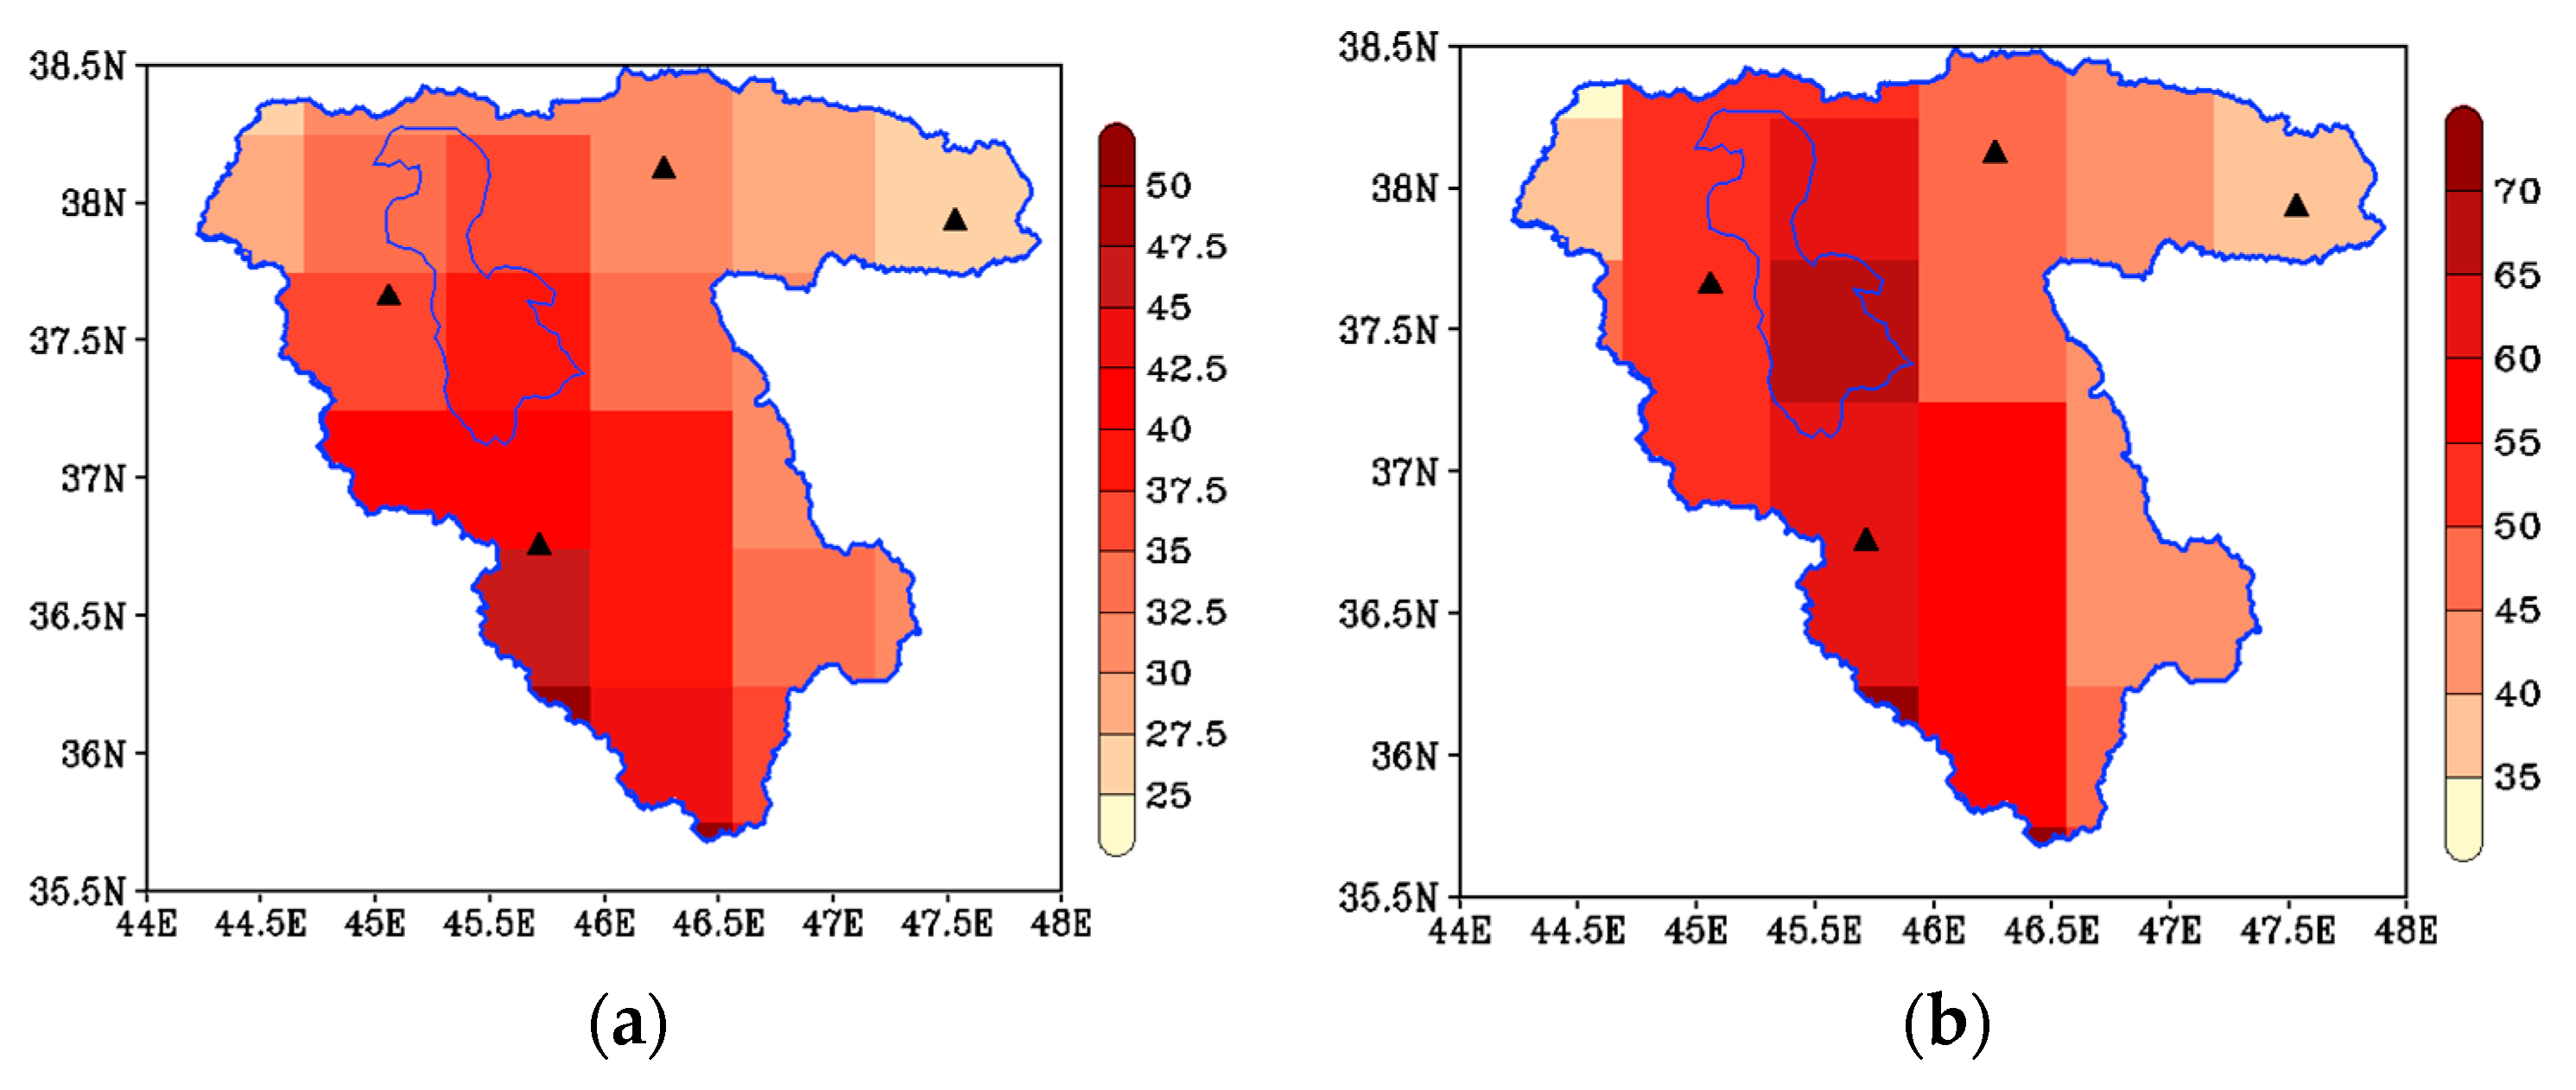
4.1. Spatial Distribution of Dust
4.2. Temporal Distribution of Dust-Related Meteorological Conditions
4.3. Temporal Distribution of Dust Characteristics Using the MERRA-2 Data
5. Conclusions
Author Contributions
Funding
Informed Consent Statement
Data Availability Statement
Acknowledgments
Conflicts of Interest
References
- Prospero, J.M.; Ginoux, P.; Torres, O.; Nicholson, S.E.; Gill, T.E. Environmental characterization of global sources of atmospheric soil dust identified with the Nimbus 7 Total Ozone Mapping Spectrometer (TOMS) absorbing aerosol product. Rev. Geophys. 2002, 40, 2-1–2-31. [Google Scholar] [CrossRef]
- Goudie, A.S.; Middleton, N.J. Desert Dust in the Global System; Springer Science & Business Media: Berlin/Heidelberg, Germany, 2006. [Google Scholar]
- Ginoux, P.; Prospero, J.M.; Gill, T.E.; Hsu, N.C.; Zhao, M. Global-scale attribution of anthropogenic and natural dust sources and their emission rates based on MODIS Deep Blue aerosol products. Rev. Geophys. 2012, 50, RG3005. [Google Scholar] [CrossRef]
- D’Odorico, P.; Bhattachan, A.; Davis, K.F.; Ravi, S.; Runyan, C.W. Global desertification: Drivers and feedbacks. Adv. Water Resour. 2013, 51, 326–344. [Google Scholar] [CrossRef]
- Mahowald, N.M.; Muhs, D.R.; Levis, S.; Rasch, P.J.; Yoshioka, M.; Zender, C.S.; Luo, C. Change in atmospheric mineral aerosols in response to climate: Last glacial period, preindustrial, modern, and doubled carbon dioxide climates. J. Geophys. Res. Atmos. 2006, 111. [Google Scholar] [CrossRef]
- Goudie, A.S. Dust storms: Recent developments. J. Environ. Manag. 2009, 90, 89–94. [Google Scholar] [CrossRef] [PubMed]
- Powell, J.T.; Chatziefthimiou, A.D.; Banack, S.A.; Cox, P.A.; Metcalf, J.S. Desert crust microorganisms, their environment, and human health. J. Arid. Environ. 2015, 112, 127–133. [Google Scholar] [CrossRef]
- Yang, Y.; Russell, L.M.; Lou, S.; Liao, H.; Guo, J.; Liu, Y.; Singh, B.; Ghan, S.J. Dust-wind interactions can intensify aerosol pollution over eastern China. Nat. Commun. 2017, 8, 15333. [Google Scholar] [CrossRef]
- Washington, R.; Todd, M.C.; Engelstaedter, S.; Mbainayel, S.; Mitchell, F. Dust and the low-level circulation over the Bodélé Depression, Chad: Observations from BoDEx 2005. J. Geophys. Res. Atmos. 2006, 111. [Google Scholar] [CrossRef]
- Kaskaoutis, D.; Rashki, A.; Francois, P.; Dumka, U.; Houssos, E.; Legrand, M. Meteorological regimes modulating dust outbreaks in southwest Asia: The role of pressure anomaly and Inter-Tropical Convergence Zone on the 1–3 July 2014 case. Aeolian Res. 2015, 18, 83–97. [Google Scholar] [CrossRef]
- Kaskaoutis, D.G.; Houssos, E.; Rashki, A.; Francois, P.; Legrand, M.; Goto, D.; Bartzokas, A.; Kambezidis, H.; Takemura, T. The Caspian Sea–Hindu Kush Index (CasHKI): A regulatory factor for dust activity over southwest Asia. Glob. Planet. Change 2016, 137, 10–23. [Google Scholar] [CrossRef]
- Zhang, X.Y.; Arimoto, R.; An, Z.S. Dust emission from Chinese desert sources linked to variations in atmospheric circulation. J. Geophys. Res. Atmos. 1997, 102, 28041–28047. [Google Scholar] [CrossRef]
- Zhang, X.; Shi, P.; Liu, L.; Tang, Y.; Cao, H.; Zhang, X.; Hu, X.; Guo, L.; Lue, Y.; Qu, Z. Ambient TSP concentration and dustfall in major cities of China: Spatial distribution and temporal variability. Atmos. Environ. 2010, 44, 1641–1648. [Google Scholar] [CrossRef]
- Buseck, P.R.; Jacob, D.J.; Pósfai, M.; Li, J.; Anderson, J. Minerals in the air: An environmental perspective. Int. Geol. Rev. 2000, 42, 577–593. [Google Scholar] [CrossRef]
- Awad, A.; Mashat, A.-W. The synoptic patterns associated with spring widespread dusty days in central and eastern Saudi Arabia. Atmosphere 2014, 5, 889–913. [Google Scholar] [CrossRef]
- Bou Karam Francis, D.; Flamant, C.; Chaboureau, J.-P.; Banks, J.; Cuesta, J.; Brindley, H.; Oolman, L. Dust emission and transport over Iraq associated with the summer Shamal winds. Aeolian Res. 2017, 24, 15–31. [Google Scholar] [CrossRef]
- Jin, Q.; Wei, J.; Pu, B.; Yang, Z.L.; Parajuli, S.P. High summertime aerosol loadings over the Arabian Sea and their transport pathways. J. Geophys. Res. Atmos. 2018, 123, 10568–10590. [Google Scholar] [CrossRef]
- Li, F.-R.; Zhao, L.-Y.; Zhang, H.; Zhang, T.-H.; Shirato, Y. Wind erosion and airborne dust deposition in farmland during spring in the Horqin Sandy Land of eastern Inner Mongolia, China. Soil Tillage Res. 2004, 75, 121–130. [Google Scholar] [CrossRef]
- Goudie, A.S. Desert dust and human health disorders. Environ. Int. 2014, 63, 101–113. [Google Scholar] [CrossRef]
- Kubilay, N.; Nickovic, S.; Moulin, C.; Dulac, F. An illustration of the transport and deposition of mineral dust onto the eastern Mediterranean. Atmos. Environ. 2000, 34, 1293–1303. [Google Scholar] [CrossRef]
- Vincent, J.; Laurent, B.; Losno, R.; Bon Nguyen, E.; Roullet, P.; Sauvage, S.; Chevaillier, S.; Coddeville, P.; Ouboulmane, N.; di Sarra, A.G. Variability of mineral dust deposition in the western Mediterranean basin and south-east of France. Atmos. Chem. Phys. 2016, 16, 8749–8766. [Google Scholar] [CrossRef]
- Rashki, A.; Middleton, N.J.; Goudie, A.S. Dust storms in Iran–Distribution, causes, frequencies and impacts. Aeolian Res. 2021, 48, 100655. [Google Scholar] [CrossRef]
- Mohammadpour, K.; Sciortino, M.; Kaskaoutis, D.G. Classification of weather clusters over the Middle East associated with high atmospheric dust-AODs in West Iran. Atmos. Res. 2021, 259, 105682. [Google Scholar] [CrossRef]
- Shahkooeei, E.; Rahmani, T. Dust Risk Assessment in Northwest of Iran. Spat. Plan. 2019, 9, 57–80. [Google Scholar] [CrossRef]
- Mardi, A.H.; Khaghani, A.; MacDonald, A.B.; Nguyen, P.; Karimi, N.; Heidary, P.; Karimi, N.; Saemian, P.; Sehatkashani, S.; Tajrishy, M. The Lake Urmia environmental disaster in Iran: A look at aerosol pollution. Sci. Total Environ. 2018, 633, 42–49. [Google Scholar] [CrossRef] [PubMed]
- Ghomashi, F.; Khalesifard, H.R. Investigation and characterization of atmospheric aerosols over the Urmia Lake using the satellite data and synoptic recordings. Atmos. Pollut. Res. 2020, 11, 2076–2086. [Google Scholar] [CrossRef]
- Isazade, V.; Qasimi, A.B.; Kaplan, G. Investigation of the Effects of Salt Dust Caused by Drying of Urmia Lake on the Sustainability of Urban Environments. J. Clean WAS 2021, 5, 78–84. [Google Scholar] [CrossRef]
- Ghale, Y.A.G.; Tayanc, M.; Unal, A. Dried bottom of Urmia Lake as a new source of dust in the northwestern Iran: Understanding the impacts on local and regional air quality. Atmos. Environ. 2021, 262, 118635. [Google Scholar] [CrossRef]
- Rahimi-Garachepeg, Z.; Zarandi-Miandoab, L.; Chaparzadeh, N. Effect of salt dust caused by drying of Lake Urmia on three strategic crops of Azerbaijan. J. Nat. Environ. Hazards 2022, 11, 65–84. [Google Scholar]
- Sotoudeheian, S.; Salim, R.; Arhami, M. Impact of Middle Eastern dust sources on PM10 in Iran: Highlighting the impact of Tigris-Euphrates basin sources and Lake Urmia desiccation. J. Geophys. Res. Atmos. 2016, 121, 14018–14034. [Google Scholar] [CrossRef]
- Delju, A.H.; Ceylan, A.; Piguet, E.; Rebetez, M. Observed climate variability and change in Urmia Lake Basin, Iran. Theor. Appl. Climatol. 2013, 111, 285–296. [Google Scholar] [CrossRef]
- Nikbakht, J.; Tabari, H.; Talaee, P.H. Streamflow drought severity analysis by percent of normal index (PNI) in northwest Iran. Theor. Appl. Climatol. 2013, 112, 565–573. [Google Scholar] [CrossRef]
- Gholampour, A.; Nabizadeh, R.; Hassanvand, M.S.; Nazmara, S.; Mahvi, A.H. Elemental composition of particulate matters around Urmia Lake, Iran. Toxicol. Environ. Chem. 2017, 99, 17–31. [Google Scholar] [CrossRef]
- Arkian, F.; Nicholson, S.E.; Ziaie, B. Meteorological factors affecting the sudden decline in Lake Urmia’s water level. Theor. Appl. Climatol. 2018, 131, 641–651. [Google Scholar] [CrossRef]
- Yao, W.; Che, H.; Gui, K.; Wang, Y.; Zhang, X. Can MERRA-2 reanalysis data reproduce the three-dimensional evolution characteristics of a typical dust process in East Asia? A case study of the dust event in May 2017. Remote Sens. 2020, 12, 902. [Google Scholar] [CrossRef]
- Carmona, J.M.; Gupta, P.; Lozano-García, D.F.; Vanoye, A.Y.; Yépez, F.D.; Mendoza, A. Spatial and temporal distribution of PM2.5 pollution over northeastern Mexico: Application of MERRA-2 reanalysis datasets. Remote Sens. 2020, 12, 2286. [Google Scholar] [CrossRef]
- Ukhov, A.; Mostamandi, S.; Da Silva, A.; Flemming, J.; Alshehri, Y.; Shevchenko, I.; Stenchikov, G. Assessment of natural and anthropogenic aerosol air pollution in the Middle East using MERRA-2, CAMS data assimilation products, and high-resolution WRF-Chem model simulations. Atmos. Chem. Phys. 2020, 20, 9281–9310. [Google Scholar] [CrossRef]
- Tuygun, G.T.; Gündoğdu, S.; Elbir, T. Estimation of ground-level particulate matter concentrations based on synergistic use of MODIS, MERRA-2 and AERONET AODs over a coastal site in the Eastern Mediterranean. Atmos. Environ. 2021, 261, 118562. [Google Scholar] [CrossRef]
- Liu, C.; Yin, Z.; He, Y.; Wang, L. Climatology of Dust Aerosols over the Jianghan Plain Revealed with Space-Borne Instruments and MERRA-2 Reanalysis Data during 2006–2021. Remote Sens. 2022, 14, 4414. [Google Scholar] [CrossRef]
- Ou, Y.; Li, Z.; Chen, C.; Zhang, Y.; Li, K.; Shi, Z.; Dong, J.; Xu, H.; Peng, Z.; Xie, Y. Evaluation of MERRA-2 Aerosol Optical and Component Properties over China Using SONET and PARASOL/GRASP Data. Remote Sens. 2022, 14, 821. [Google Scholar] [CrossRef]
- Shikwambana, L.; Kganyago, M. Meteorological Influence of Mineral Dust Distribution Over South-Western Africa Deserts Using Reanalysis and Satellite Data. Front. Environ. Sci. 2022, 10, 856438. [Google Scholar] [CrossRef]
- Nazish Khan, M.; Sajid Akhter, M. Spatial variability and trend analysis of dust aerosols loading over Indian sub-continent using MERRA 2 & CALIPSO data. Geol. Ecol. Landsc. 2022, 2022, 1–9. [Google Scholar]
- Dehestani Ardakani, M.R. Dust time series analysis using long-term monthly images of MERRA2 satellites and Sentinel5 images in Google Earth Engine. J. Nat. Spat. Sci. 2021, 1, 16–26. [Google Scholar]
- Dadashi-Roudbari, A.; Ahmadi, M.; Shakiba, A. Seasonal Study of dust deposition and fine particles (PM 2.5) in Iran Using MERRA-2 data. Iran. J. Geophys. 2020, 13, 43–59. [Google Scholar]
- Mobarak hassan, E.; Saadatabadi, A.; Fattahi, E. Dust Investigation by MERRA-2 Model in Iran: (during 2007–2017). Iran. J. Soil Water Res. 2020, 51, 2203–2219. [Google Scholar]
- Mobarak Hassan, E.; Noori, F.; Abdoli, M. Investigating the distribution of chlorophyll in Lake Urmia using remote sensing (2003–2020). In Proceedings of the 5th International Conference on the Persian Gulf Oceanpgraphy, Tehran, Iran, 25 January 2022. [Google Scholar]
- Zarghami, M. Effective watershed management; case study of Urmia Lake, Iran. Lake Reserv. Manag. 2011, 27, 87–94. [Google Scholar] [CrossRef]
- Boroughani, M.; Hashemi, H.; Hosseini, S.H.; Pourhashemi, S.; Berndtsson, R. Desiccating Lake Urmia: A new dust source of regional importance. IEEE Geosci. Remote Sens. Lett. 2019, 17, 1483–1487. [Google Scholar] [CrossRef]
- Saeidabadi, R. Investigation of impact of land-cover change on climate factors on surrounding areas of Urmia Lake. J. Arid. Reg. Geogr. Stud. 2016, 6, 34–49. [Google Scholar]
- Hamzehpour, N.; Eghbal, M.; Bogaert, P.; Toomanian, N. Top soil salinity prediction in South-Western part of Urmia Lake with ground water data. Int. J. Agric. Res. Innov. Technol. 2014, 4, 57–63. [Google Scholar] [CrossRef]
- Emdadi, A.; Gikas, P.; Farazaki, M.; Emami, Y. Salinity gradient energy potential at the hyper saline Urmia Lake–ZarrinehRud River system in Iran. Renew. Energy 2016, 86, 154–162. [Google Scholar] [CrossRef]
- Habibi, M.; Babaeian, I.; Schöner, W. Changing Causes of Drought in the Urmia Lake Basin—Increasing Influence of Evaporation and Disappearing Snow Cover. Water 2021, 13, 3273. [Google Scholar] [CrossRef]
- Rasouli, A.A.; Abbasian, S.; Jahanbakhash, S. Monitoring of Armia lake water surface fluxtuations of mult-sensors and multi-temporal imageries. Modares Hum. Sci. 2008, 12, 54–71. [Google Scholar]
- Feizizadeh, B.; Garajeh, M.K.; Lakes, T.; Blaschke, T. A deep learning convolutional neural network algorithm for detecting saline flow sources and mapping the environmental impacts of the Urmia Lake drought in Iran. Catena 2021, 207, 105585. [Google Scholar] [CrossRef]
- Garajeh, M.K.; Malakyar, F.; Weng, Q.; Feizizadeh, B.; Blaschke, T.; Lakes, T. An automated deep learning convolutional neural network algorithm applied for soil salinity distribution mapping in Lake Urmia, Iran. Sci. Total Environ. 2021, 778, 146253. [Google Scholar] [CrossRef] [PubMed]
- Dehghanipour, A.H.; Moshir Panahi, D.; Mousavi, H.; Kalantari, Z.; Tajrishy, M. Effects of Water Level Decline in Lake Urmia, Iran, on Local Climate Conditions. Water 2020, 12, 2153. [Google Scholar] [CrossRef]
- Garousi, V.; Najafi, A.; Samadi, A.; Rasouli, K.; Khanaliloo, B. Environmental crisis in Lake Urmia, Iran: A systematic review of causes, negative consequences and possible solutions. In Proceedings of the 6th International Perspective on Water Resources & the Environment (IPWE), Izmir, Turkey, 7–9 January 2013. [Google Scholar]
- Asghari-Kaljahi, E.; Hoseinpour, S.; Nadiri, A.O. Evaluation of salt dust occurrence potential in the North east Zone of Urmia Lake. Environ. Eros. Res. J. 2018, 8, 42–61. [Google Scholar]
- Nadersefat, M.H. The geomorphologic characteristics on the Armia lake and that effect in this region ecosystem. Daneshnameh 2011, 82, 23–32. [Google Scholar]
- Ahmady-Birgani, H.; Ravan, P.; Schlosser, J.S.; Cuevas-Robles, A.; AzadiAghdam, M.; Sorooshian, A. On the chemical nature of wet deposition over a major desiccated lake: Case study for Lake Urmia basin. Atmos. Res. 2020, 234, 104762. [Google Scholar] [CrossRef]
- Cuevas Agulló, E. Establishing a WMO Sand and Dust Storm Warning Advisory and Assessment System Regional Node for West Asia: Current Capabilities and Needs: Technical Report; World Meteorological Organization: Geneva, Switzerland, 2013. [Google Scholar]
- Zhang, X.X.; Sharratt, B.; Chen, X.; Wang, Z.F.; Liu, L.Y.; Guo, Y.H.; Li, J.; Chen, H.S.; Yang, W.Y. Dust deposition and ambient PM10 concentration in northwest China: Spatial and temporal variability. Atmos. Chem. Phys. 2017, 17, 1699–1711. [Google Scholar] [CrossRef]
- Fiedler, S.; Schepanski, K.; Heinold, B.; Knippertz, P.; Tegen, I. Climatology of nocturnal low-level jets over North Africa and implications for modeling mineral dust emission. J. Geophys. Res. Atmos. 2013, 118, 6100–6121. [Google Scholar] [CrossRef]
- Schepanski, K.; Tegen, I.; Todd, M.C.; Heinold, B.; Bönisch, G.; Laurent, B.; Macke, A. Meteorological processes forcing Saharan dust emission inferred from MSG-SEVIRI observations of subdaily dust source activation and numerical models. J. Geophys. Res. Atmos. 2009, 114. [Google Scholar] [CrossRef]
- Milton, S.; Greed, G.; Brooks, M.; Haywood, J.; Johnson, B.; Allan, R.; Slingo, A.; Grey, W. Modeled and observed atmospheric radiation balance during the West African dry season: Role of mineral dust, biomass burning aerosol, and surface albedo. J. Geophys. Res. Atmos. 2008, 113, D00C02. [Google Scholar] [CrossRef]
- Washington, R.; Todd, M.C. Atmospheric controls on mineral dust emission from the Bodélé Depression, Chad: The role of the low level jet. Geophys. Res. Lett. 2005, 32, L17701. [Google Scholar] [CrossRef]
- Marticorena, B.; Bergametti, G.; Aumont, B.; Callot, Y.; N’Doumé, C.; Legrand, M. Modeling the atmospheric dust cycle: 2. Simulation of Saharan dust sources. J. Geophys. Res. Atmos. 1997, 102, 4387–4404. [Google Scholar] [CrossRef]
- Molod, A.; Takacs, L.; Suarez, M.; Bacmeister, J. Development of the GEOS-5 atmospheric general circulation model: Evolution from MERRA to MERRA2. Geosci. Model Dev. 2015, 8, 1339–1356. [Google Scholar] [CrossRef]
- Mobarak Hassan, E.; Karimkhani, M.; Alizadeh, O. Synoptic analysis and simulation of a widespread dust event in the Urmia Basin. Nat. Hazards 2023, 2023, 1–26. [Google Scholar] [CrossRef]
- Draxler, R.; Stunder, B.; Rolph, G.; Stein, A.; Taylor, A. HYSPLIT4 User’s Guide, Air Resources Laboratory, National Oceanic and Atmospheric Administration (NOAA); NOAA: Silver Spring, MD, USA, 2020.
- Guieu, C.; Loÿe-Pilot, M.D.; Ridame, C.; Thomas, C. Chemical characterization of the Saharan dust end-member: Some biogeochemical implications for the western Mediterranean Sea. J. Geophys. Res. Atmos. 2002, 107, ACH 5-1–ACH 5-11. [Google Scholar] [CrossRef]
- Mahowald, N.M.; Baker, A.R.; Bergametti, G.; Brooks, N.; Duce, R.A.; Jickells, T.D.; Kubilay, N.; Prospero, J.M.; Tegen, I. Atmospheric global dust cycle and iron inputs to the ocean. Glob. Biogeochem. Cycles 2005, 19, GB4025. [Google Scholar] [CrossRef]
- Santos, A.M.J. Influence of Saharan Aerosols on Phytoplankton Biomass in the Tropical North Atlantic Ocean; University of Puerto Rico, Mayagüez Campus: Mayagüez, Puerto Rico, 2010. [Google Scholar]
- Fatahi, E.; Araghizadeh, M.; MobarakHassan, E.; Khansalari, S.; Hossein Hamzeh, N. Study of the mechanism and source of dust in Khorasan Razavi province by RegCM4 and HYSPLIT model: A case study (July 1, 2014). J. Clim. Res. 2022, 13, 27–44. [Google Scholar]
- Hoseine Sadr, A.; Mohammadi, G.H.; Hoseine Sadr, M. Trend analysis of dust Tabriz. Nivar 2014, 38, 3–10. [Google Scholar]
- Khosh Akhlagh, F.; Pazhoh, F.; Jafari, F.; Kohi, S. Synoptic analysis of Iran’s northwest dust storms. J. Meteorol. Atmos. Sci. 2020, 2, 272–286. [Google Scholar]


| Stations | Altitude above Sea Level (m) | Longitude °E | Latitude °N |
|---|---|---|---|
| Mahabad | 1351.8 | 45.72 | 36.75 |
| Urmia | 1328 | 45.05 | 37.66 |
| Sarab | 1682 | 47.53 | 37.93 |
| Tabriz | 1361 | 46.24 | 38.12 |
| Code | Description |
|---|---|
| 6 | Widespread dust in suspension in the air, not raised by wind at or near the station at the time of observation |
| 7 | Dust or sand raised by wind at or near the station at the time of observation, but no well-developed dust whirl(s) or sand whirl(s), and no dust storm or sandstorm seen |
| 30 | Slight or moderate dust storm or sandstorm—has decrease during the preceding hour |
| 31 | Slight or moderate dust storm or sandstorm—no appreciable change during the preceding hour |
| 32 | Slight or moderate dust storm or sandstorm—has begun or has increased during the preceding hour |
| 33 | Severe dust storm or sandstorm—has decreased during the preceding hour |
| 34 | Severe dust storm or sandstorm—no appreciable change during the preceding hour |
| 35 | Severe dust storm or sandstorm—has begun or has increased during the preceding hour |
| 98 | Thunderstorm combined with dust storm or sandstorm at time of observation—thunderstorm at the time of observation |
| Type of Data | Variable | Abbreviated | Unit | Time Interval |
|---|---|---|---|---|
| MERRA-2 | Dust Surface Mass Concentration | Dust surface concentration | Monthly | |
| Dust Column Mass Density | Dust column density | Monthly | ||
| Dust Dry Deposition Bin-all | Dust dry deposition | Monthly | ||
| Dust Wet Deposition Bin-all | Dust wet deposition | Monthly | ||
| Dust Extinction AOT 550 nm | AOTD | - | Monthly | |
| Total Aerosol Extinction AOT 550 nm | AOTA | - | Monthly | |
| Total Surface Precipitation | Precipitation | Monthly | ||
| Eastward and Northward Wind Component at 850 and 700 hPa | Monthly | |||
| Observation | Horizontal Visibility | VV | m | 3 hourly |
| Present Weather | ww | - | 3 hourly | |
| 10 m Wind Speed and Firection | 3 hourly |
| Decade | 1990–1999 | 2000–2009 | 2010–2019 |
|---|---|---|---|
| Tabriz | 110 | 287 | 331 |
| Urmia | 12 | 94 | 189 |
| Mahabad | 6 | 33 | 215 |
| Sarab | 15 | 55 | 130 |
| Decade | 1990–2000 | 2000–2009 | 2010–2019 | |||
|---|---|---|---|---|---|---|
| Station | Maximum of Dusty Day | Minimum Visibility (m) | Maximum of Dusty Day | Minimum Visibility (m) | Maximum of Dusty Day | Minimum Visibility (m) |
| Tabriz | 110 | 800 | 287 | 300 | 331 | 200 |
| Urmia | 12 | 1000 | 94 | 400 | 189 | 800 |
| Mahabad | 6 | 600 | 33 | 900 | 215 | 400 |
| Sarab | 15 | 1500 | 55 | 100 | 130 | 800 |
| Parameter | Dust Surface Concentration | Dust Column Density | Dust Dry Deposition | Dust Wet Deposition | Precipitation | AOTA | AOTD |
|---|---|---|---|---|---|---|---|
| 1990–1999 | 2534 | 6354 | 2.44 | 9.8 | 699 | 0.186 | 0.078 |
| 2000–2009 | 3043 | 7866 | 2.91 | 11.8 | 674 | 0.183 | 0.098 |
| 2010–2019 | 2964 | 7214 | 2.92 | 12.4 | 776 | 0.177 | 0.090 |
| Surface Dust Concentration | Dust Column Density | Dust Dry Deposition | Dust Wet Deposition | Precipitation | AOTA | AOTD | |
|---|---|---|---|---|---|---|---|
| Mahabad | 0.55 | 0.39 | 0.53 | 0.29 | 0.22 | 0.18 | 0.37 |
| Urmia | 0.66 | 0.57 | 0.65 | 0.30 | 0.10 | 0.22 | 0.56 |
| Sarab | 0.55 | 0.47 | 0.60 | 0.36 | 0.07 | 0.14 | 0.46 |
| Tabriz | 0.74 | 0.69 | 0.71 | 0.42 | 0.06 | 0.32 | 0.68 |
Disclaimer/Publisher’s Note: The statements, opinions and data contained in all publications are solely those of the individual author(s) and contributor(s) and not of MDPI and/or the editor(s). MDPI and/or the editor(s) disclaim responsibility for any injury to people or property resulting from any ideas, methods, instructions or products referred to in the content. |
© 2023 by the authors. Licensee MDPI, Basel, Switzerland. This article is an open access article distributed under the terms and conditions of the Creative Commons Attribution (CC BY) license (https://creativecommons.org/licenses/by/4.0/).
Share and Cite
Mobarak Hassan, E.; Fattahi, E.; Habibi, M. Temporal and Spatial Variability of Dust in the Urmia Basin, 1990–2019. Atmosphere 2023, 14, 1761. https://doi.org/10.3390/atmos14121761
Mobarak Hassan E, Fattahi E, Habibi M. Temporal and Spatial Variability of Dust in the Urmia Basin, 1990–2019. Atmosphere. 2023; 14(12):1761. https://doi.org/10.3390/atmos14121761
Chicago/Turabian StyleMobarak Hassan, Elham, Ebrahim Fattahi, and Maral Habibi. 2023. "Temporal and Spatial Variability of Dust in the Urmia Basin, 1990–2019" Atmosphere 14, no. 12: 1761. https://doi.org/10.3390/atmos14121761
APA StyleMobarak Hassan, E., Fattahi, E., & Habibi, M. (2023). Temporal and Spatial Variability of Dust in the Urmia Basin, 1990–2019. Atmosphere, 14(12), 1761. https://doi.org/10.3390/atmos14121761